East Lexington, VA Map & Demographics
East Lexington Map
East Lexington Overview
$27,716
PER CAPITA INCOME
$76,411
AVG FAMILY INCOME
$75,470
AVG HOUSEHOLD INCOME
28.0%
WAGE / INCOME GAP [ % ]
72.0¢/ $1
WAGE / INCOME GAP [ $ ]
0.38
INEQUALITY / GINI INDEX
2,034
TOTAL POPULATION
1,145
MALE POPULATION
889
FEMALE POPULATION
128.80
MALES / 100 FEMALES
77.64
FEMALES / 100 MALES
39.6
MEDIAN AGE
3.0
AVG FAMILY SIZE
3.1
AVG HOUSEHOLD SIZE
844
LABOR FORCE [ PEOPLE ]
52.5%
PERCENT IN LABOR FORCE
Income in East Lexington
Income Overview in East Lexington
Per Capita Income in East Lexington is $27,716, while median incomes of families and households are $76,411 and $75,470 respectively.
| Characteristic | Number | Measure |
| Per Capita Income | 2,034 | $27,716 |
| Median Family Income | 549 | $76,411 |
| Mean Family Income | 549 | $83,031 |
| Median Household Income | 631 | $75,470 |
| Mean Household Income | 631 | $75,406 |
| Income Deficit | 549 | $0 |
| Wage / Income Gap (%) | 2,034 | 27.99% |
| Wage / Income Gap ($) | 2,034 | 72.01¢ per $1 |
| Gini / Inequality Index | 2,034 | 0.38 |
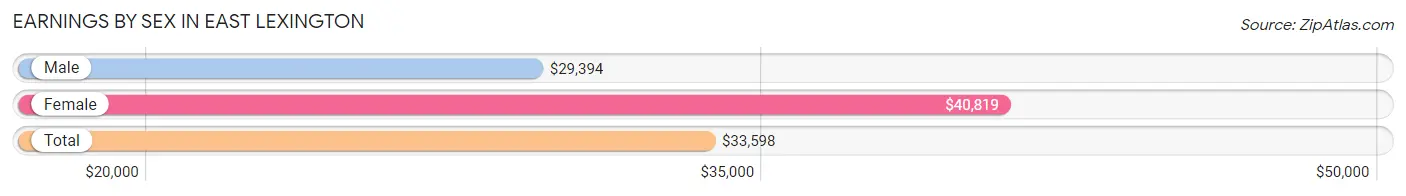
Earnings by Sex in East Lexington
Average Earnings in East Lexington are $33,598, $29,394 for men and $40,819 for women, a difference of 28.0%.
| Sex | Number | Average Earnings |
| Male | 765 (68.3%) | $29,394 |
| Female | 355 (31.7%) | $40,819 |
| Total | 1,120 (100.0%) | $33,598 |
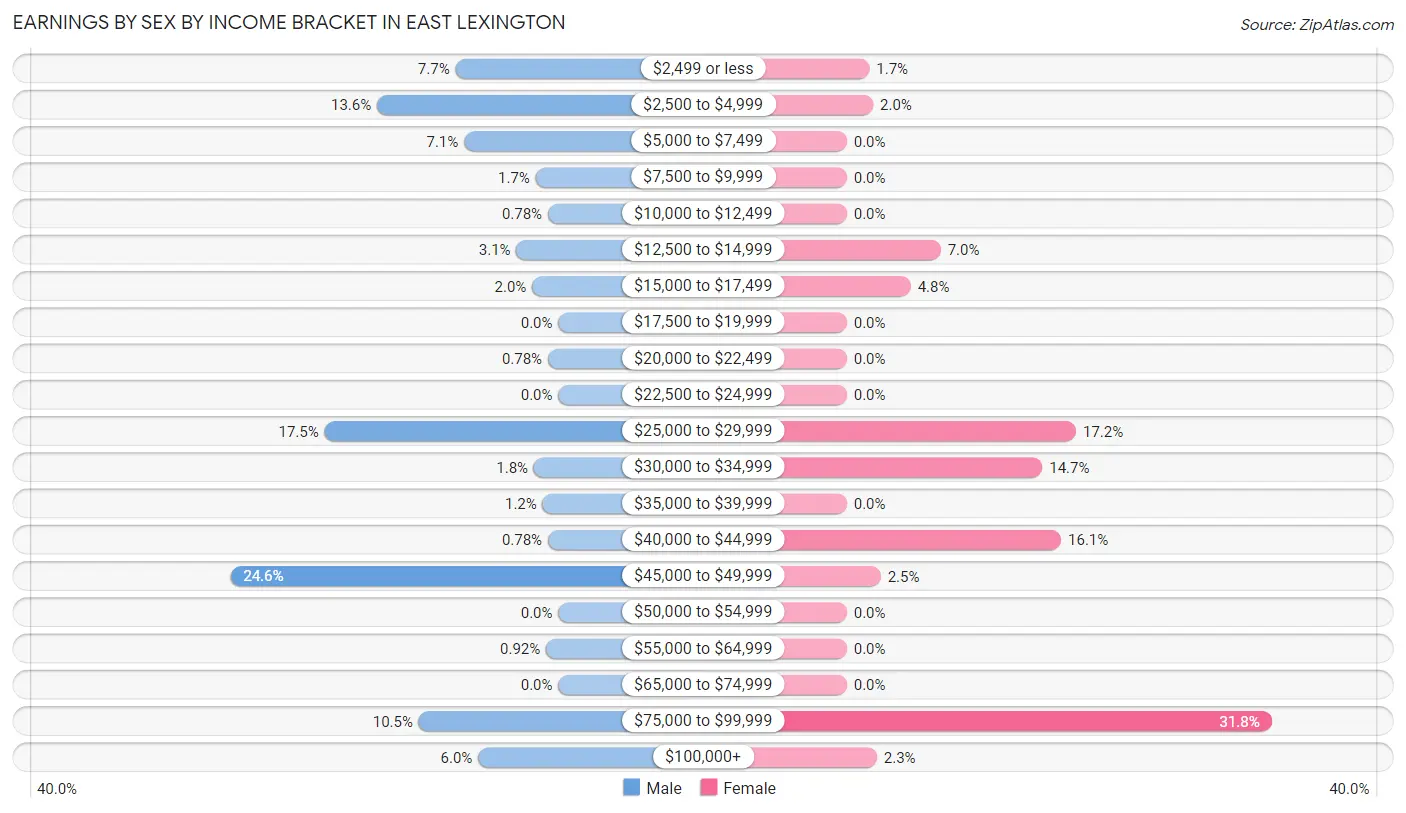
Earnings by Sex by Income Bracket in East Lexington
The most common earnings brackets in East Lexington are $45,000 to $49,999 for men (188 | 24.6%) and $75,000 to $99,999 for women (113 | 31.8%).
| Income | Male | Female |
| $2,499 or less | 59 (7.7%) | 6 (1.7%) |
| $2,500 to $4,999 | 104 (13.6%) | 7 (2.0%) |
| $5,000 to $7,499 | 54 (7.1%) | 0 (0.0%) |
| $7,500 to $9,999 | 13 (1.7%) | 0 (0.0%) |
| $10,000 to $12,499 | 6 (0.8%) | 0 (0.0%) |
| $12,500 to $14,999 | 24 (3.1%) | 25 (7.0%) |
| $15,000 to $17,499 | 15 (2.0%) | 17 (4.8%) |
| $17,500 to $19,999 | 0 (0.0%) | 0 (0.0%) |
| $20,000 to $22,499 | 6 (0.8%) | 0 (0.0%) |
| $22,500 to $24,999 | 0 (0.0%) | 0 (0.0%) |
| $25,000 to $29,999 | 134 (17.5%) | 61 (17.2%) |
| $30,000 to $34,999 | 14 (1.8%) | 52 (14.6%) |
| $35,000 to $39,999 | 9 (1.2%) | 0 (0.0%) |
| $40,000 to $44,999 | 6 (0.8%) | 57 (16.1%) |
| $45,000 to $49,999 | 188 (24.6%) | 9 (2.5%) |
| $50,000 to $54,999 | 0 (0.0%) | 0 (0.0%) |
| $55,000 to $64,999 | 7 (0.9%) | 0 (0.0%) |
| $65,000 to $74,999 | 0 (0.0%) | 0 (0.0%) |
| $75,000 to $99,999 | 80 (10.5%) | 113 (31.8%) |
| $100,000+ | 46 (6.0%) | 8 (2.2%) |
| Total | 765 (100.0%) | 355 (100.0%) |
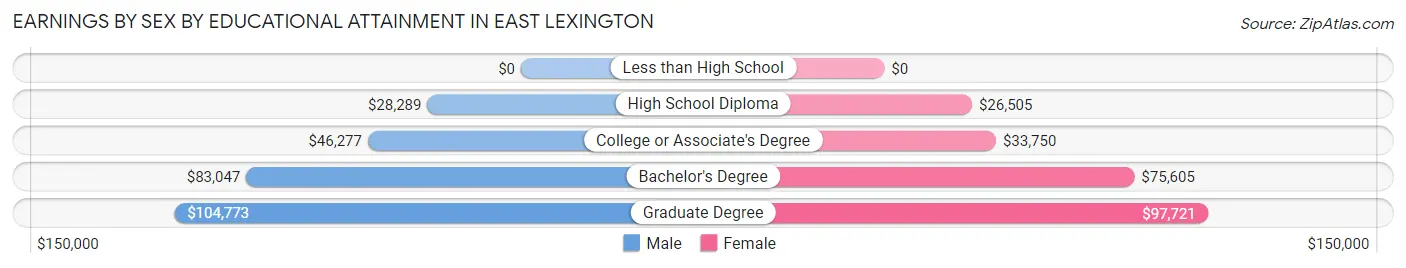
Earnings by Sex by Educational Attainment in East Lexington
Average earnings in East Lexington are $45,445 for men and $42,768 for women, a difference of 5.9%. Men with an educational attainment of graduate degree enjoy the highest average annual earnings of $104,773, while those with high school diploma education earn the least with $28,289. Women with an educational attainment of graduate degree earn the most with the average annual earnings of $97,721, while those with high school diploma education have the smallest earnings of $26,505.
| Educational Attainment | Male Income | Female Income |
| Less than High School | - | - |
| High School Diploma | $28,289 | $26,505 |
| College or Associate's Degree | $46,277 | $33,750 |
| Bachelor's Degree | $83,047 | $75,605 |
| Graduate Degree | $104,773 | $97,721 |
| Total | $45,445 | $42,768 |
Family Income in East Lexington
Family Income Brackets in East Lexington
According to the East Lexington family income data, there are 163 families falling into the $25,000 to $34,999 income range, which is the most common income bracket and makes up 29.7% of all families.
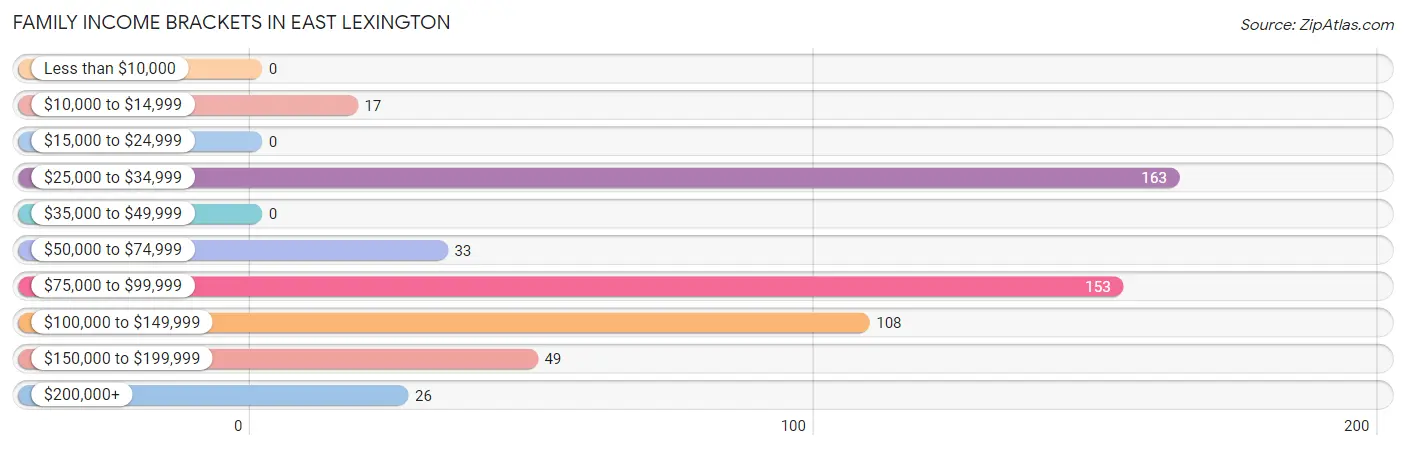
| Income Bracket | # Families | % Families |
| Less than $10,000 | 0 | 0.0% |
| $10,000 to $14,999 | 17 | 3.1% |
| $15,000 to $24,999 | 0 | 0.0% |
| $25,000 to $34,999 | 163 | 29.7% |
| $35,000 to $49,999 | 0 | 0.0% |
| $50,000 to $74,999 | 33 | 6.0% |
| $75,000 to $99,999 | 153 | 27.9% |
| $100,000 to $149,999 | 108 | 19.7% |
| $150,000 to $199,999 | 49 | 8.9% |
| $200,000+ | 26 | 4.7% |
Family Income by Famaliy Size in East Lexington
4-person families (40 | 7.3%) account for the highest median family income in East Lexington with $108,036 per family, while 4-person families (40 | 7.3%) have the highest median income of $27,009 per family member.
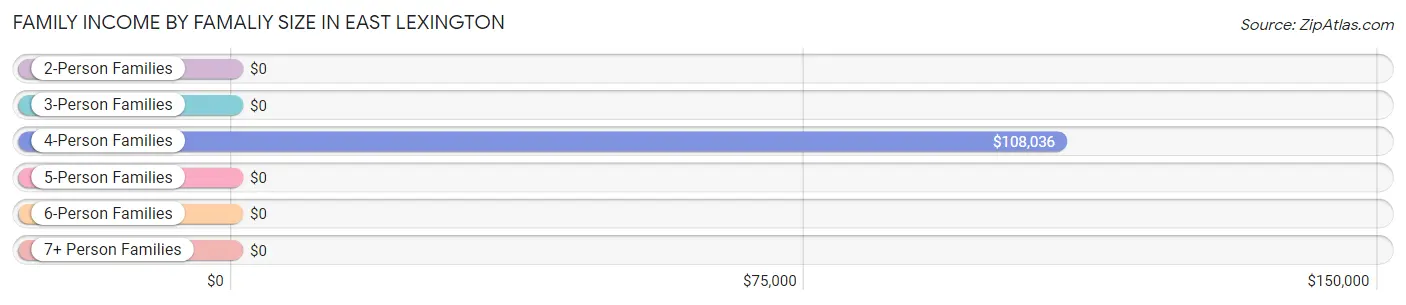
| Income Bracket | # Families | Median Income |
| 2-Person Families | 362 (65.9%) | $0 |
| 3-Person Families | 101 (18.4%) | $0 |
| 4-Person Families | 40 (7.3%) | $108,036 |
| 5-Person Families | 30 (5.5%) | $0 |
| 6-Person Families | 16 (2.9%) | $0 |
| 7+ Person Families | 0 (0.0%) | $0 |
| Total | 549 (100.0%) | $76,411 |
Family Income by Number of Earners in East Lexington
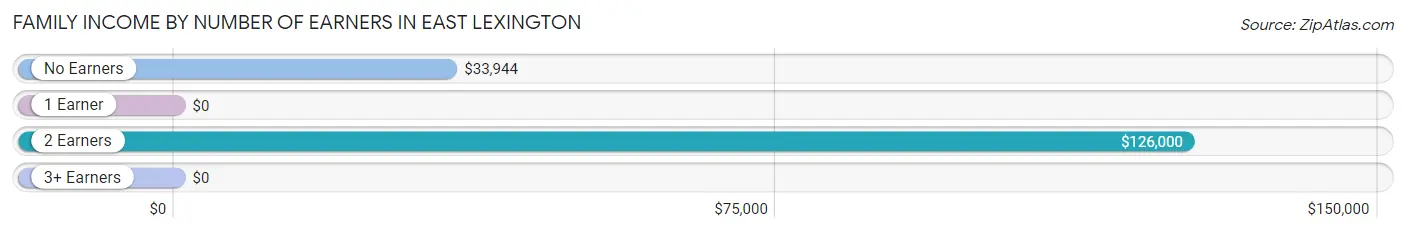
| Number of Earners | # Families | Median Income |
| No Earners | 64 (11.7%) | $33,944 |
| 1 Earner | 292 (53.2%) | $0 |
| 2 Earners | 186 (33.9%) | $126,000 |
| 3+ Earners | 7 (1.3%) | $0 |
| Total | 549 (100.0%) | $76,411 |
Household Income in East Lexington
Household Income Brackets in East Lexington
With 195 households falling in the category, the $25,000 to $34,999 income range is the most frequent in East Lexington, accounting for 30.9% of all households.
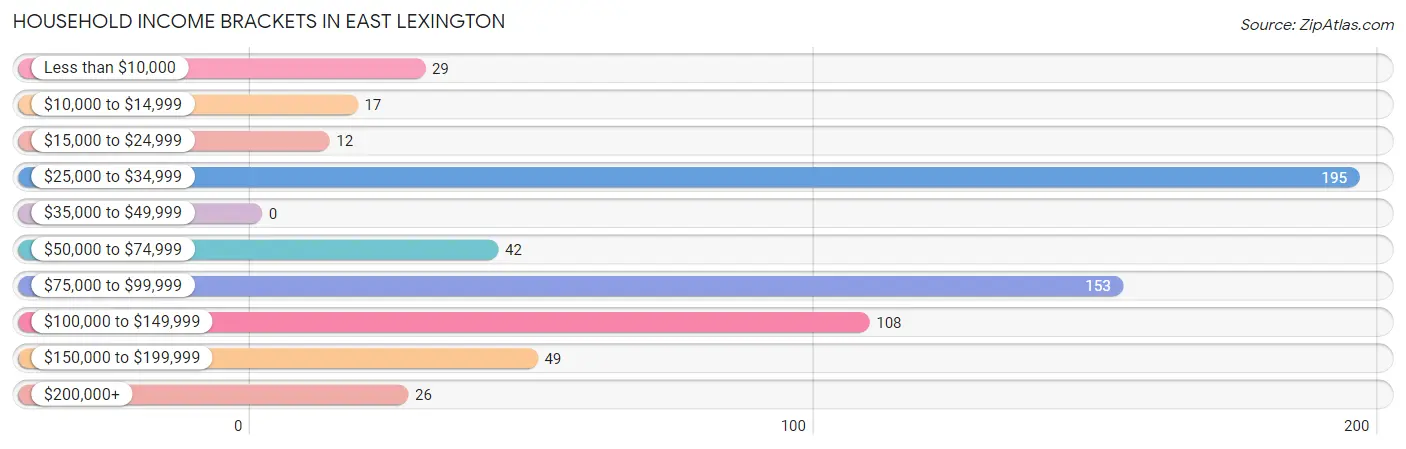
| Income Bracket | # Households | % Households |
| Less than $10,000 | 29 | 4.6% |
| $10,000 to $14,999 | 17 | 2.7% |
| $15,000 to $24,999 | 12 | 1.9% |
| $25,000 to $34,999 | 195 | 30.9% |
| $35,000 to $49,999 | 0 | 0.0% |
| $50,000 to $74,999 | 42 | 6.7% |
| $75,000 to $99,999 | 153 | 24.2% |
| $100,000 to $149,999 | 108 | 17.1% |
| $150,000 to $199,999 | 49 | 7.8% |
| $200,000+ | 26 | 4.1% |
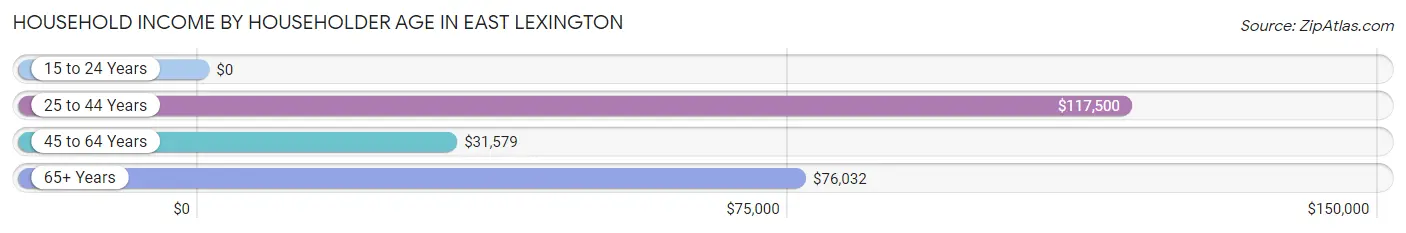
Household Income by Householder Age in East Lexington
The median household income in East Lexington is $75,470, with the highest median household income of $117,500 found in the 25 to 44 years age bracket for the primary householder. A total of 178 households (28.2%) fall into this category. Meanwhile, the 15 to 24 years age bracket for the primary householder has the lowest median household income of $0, with 35 households (5.6%) in this group.
| Income Bracket | # Households | Median Income |
| 15 to 24 Years | 35 (5.6%) | $0 |
| 25 to 44 Years | 178 (28.2%) | $117,500 |
| 45 to 64 Years | 226 (35.8%) | $31,579 |
| 65+ Years | 192 (30.4%) | $76,032 |
| Total | 631 (100.0%) | $75,470 |
Poverty in East Lexington
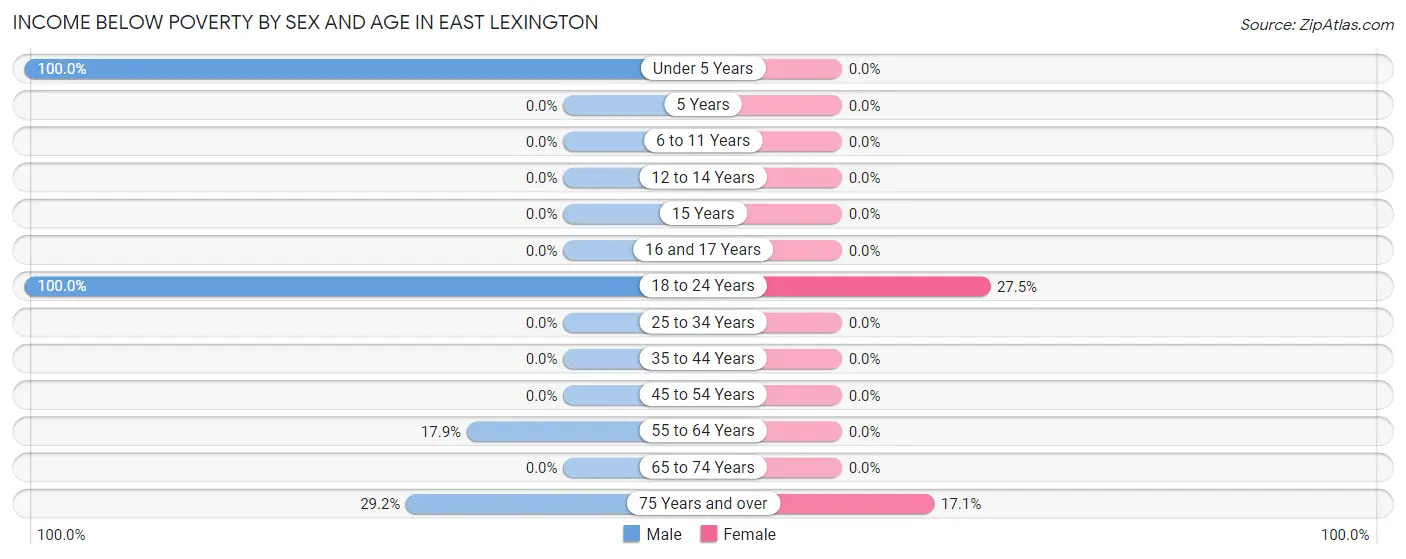
Income Below Poverty by Sex and Age in East Lexington
With 23.4% poverty level for males and 1.9% for females among the residents of East Lexington, under 5 year old males and 18 to 24 year old females are the most vulnerable to poverty, with 17 males (100.0%) and 11 females (27.5%) in their respective age groups living below the poverty level.
| Age Bracket | Male | Female |
| Under 5 Years | 17 (100.0%) | 0 (0.0%) |
| 5 Years | 0 (0.0%) | 0 (0.0%) |
| 6 to 11 Years | 0 (0.0%) | 0 (0.0%) |
| 12 to 14 Years | 0 (0.0%) | 0 (0.0%) |
| 15 Years | 0 (0.0%) | 0 (0.0%) |
| 16 and 17 Years | 0 (0.0%) | 0 (0.0%) |
| 18 to 24 Years | 195 (100.0%) | 11 (27.5%) |
| 25 to 34 Years | 0 (0.0%) | 0 (0.0%) |
| 35 to 44 Years | 0 (0.0%) | 0 (0.0%) |
| 45 to 54 Years | 0 (0.0%) | 0 (0.0%) |
| 55 to 64 Years | 29 (17.9%) | 0 (0.0%) |
| 65 to 74 Years | 0 (0.0%) | 0 (0.0%) |
| 75 Years and over | 7 (29.2%) | 6 (17.1%) |
| Total | 248 (23.4%) | 17 (1.9%) |
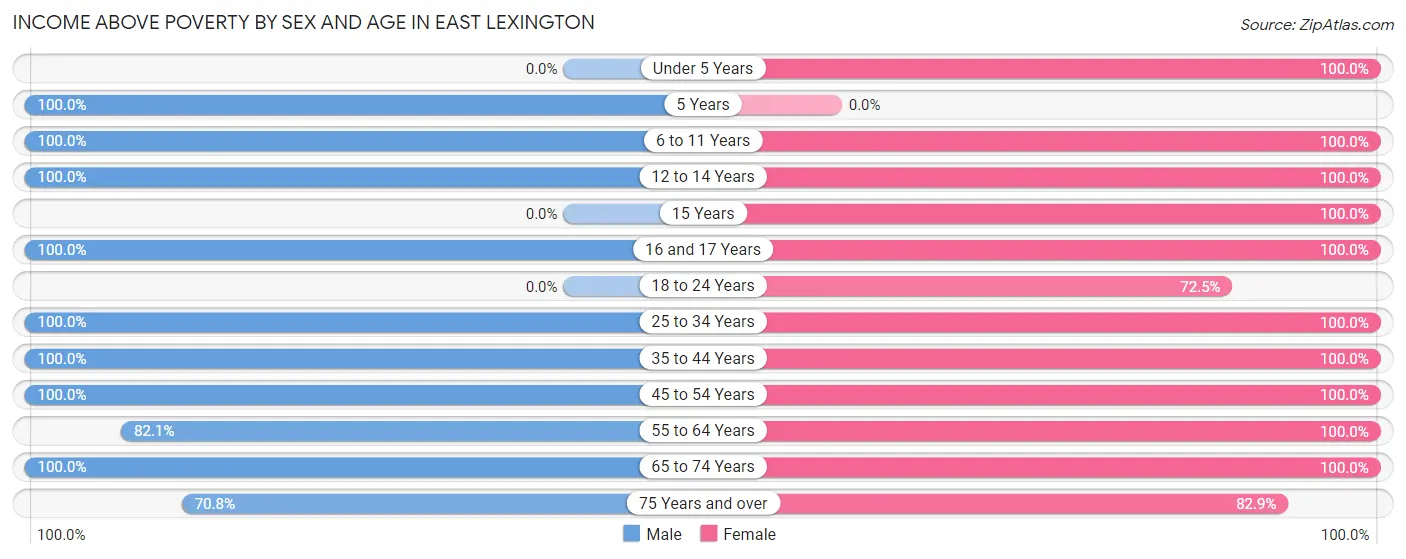
Income Above Poverty by Sex and Age in East Lexington
According to the poverty statistics in East Lexington, males aged 5 years and females aged under 5 years are the age groups that are most secure financially, with 100.0% of males and 100.0% of females in these age groups living above the poverty line.
| Age Bracket | Male | Female |
| Under 5 Years | 0 (0.0%) | 66 (100.0%) |
| 5 Years | 54 (100.0%) | 0 (0.0%) |
| 6 to 11 Years | 67 (100.0%) | 79 (100.0%) |
| 12 to 14 Years | 67 (100.0%) | 24 (100.0%) |
| 15 Years | 0 (0.0%) | 52 (100.0%) |
| 16 and 17 Years | 17 (100.0%) | 27 (100.0%) |
| 18 to 24 Years | 0 (0.0%) | 29 (72.5%) |
| 25 to 34 Years | 86 (100.0%) | 69 (100.0%) |
| 35 to 44 Years | 270 (100.0%) | 120 (100.0%) |
| 45 to 54 Years | 59 (100.0%) | 118 (100.0%) |
| 55 to 64 Years | 133 (82.1%) | 91 (100.0%) |
| 65 to 74 Years | 44 (100.0%) | 150 (100.0%) |
| 75 Years and over | 17 (70.8%) | 29 (82.9%) |
| Total | 814 (76.6%) | 854 (98.1%) |
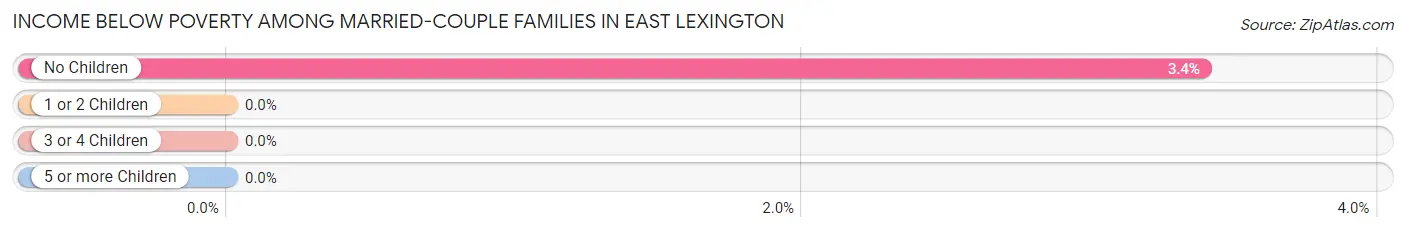
Income Below Poverty Among Married-Couple Families in East Lexington
The poverty statistics for married-couple families in East Lexington show that 2.0% or 6 of the total 305 families live below the poverty line. Families with no children have the highest poverty rate of 3.4%, comprising of 6 families. On the other hand, families with 1 or 2 children have the lowest poverty rate of 0.0%, which includes 0 families.
| Children | Above Poverty | Below Poverty |
| No Children | 171 (96.6%) | 6 (3.4%) |
| 1 or 2 Children | 82 (100.0%) | 0 (0.0%) |
| 3 or 4 Children | 46 (100.0%) | 0 (0.0%) |
| 5 or more Children | 0 (0.0%) | 0 (0.0%) |
| Total | 299 (98.0%) | 6 (2.0%) |
Income Below Poverty Among Single-Parent Households in East Lexington
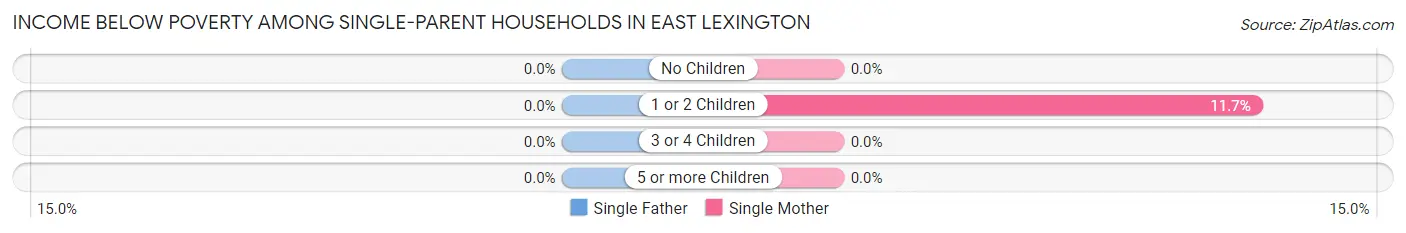
| Children | Single Father | Single Mother |
| No Children | 0 (0.0%) | 0 (0.0%) |
| 1 or 2 Children | 0 (0.0%) | 11 (11.7%) |
| 3 or 4 Children | 0 (0.0%) | 0 (0.0%) |
| 5 or more Children | 0 (0.0%) | 0 (0.0%) |
| Total | 0 (0.0%) | 11 (4.7%) |
Income Below Poverty Among Married-Couple vs Single-Parent Households in East Lexington
The poverty data for East Lexington shows that 6 of the married-couple family households (2.0%) and 11 of the single-parent households (4.5%) are living below the poverty level. Within the married-couple family households, those with no children have the highest poverty rate, with 6 households (3.4%) falling below the poverty line. Among the single-parent households, those with 1 or 2 children have the highest poverty rate, with 11 household (11.7%) living below poverty.
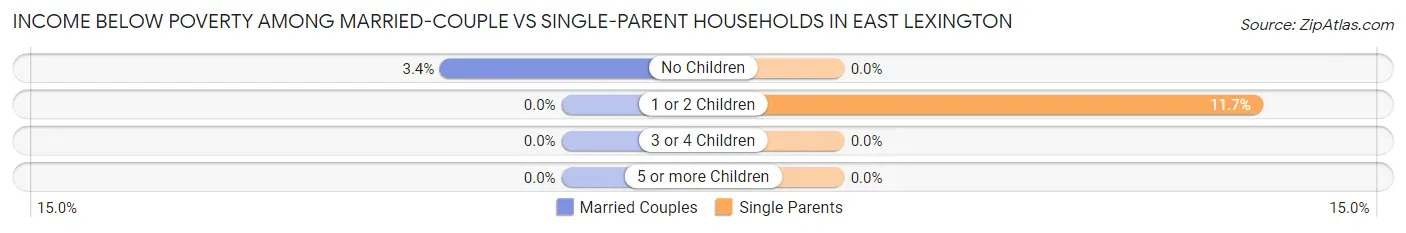
| Children | Married-Couple Families | Single-Parent Households |
| No Children | 6 (3.4%) | 0 (0.0%) |
| 1 or 2 Children | 0 (0.0%) | 11 (11.7%) |
| 3 or 4 Children | 0 (0.0%) | 0 (0.0%) |
| 5 or more Children | 0 (0.0%) | 0 (0.0%) |
| Total | 6 (2.0%) | 11 (4.5%) |
Race in East Lexington
The most populous races in East Lexington are White / Caucasian (1,617 | 79.5%), Black / African American (320 | 15.7%), and Two or more Races (84 | 4.1%).
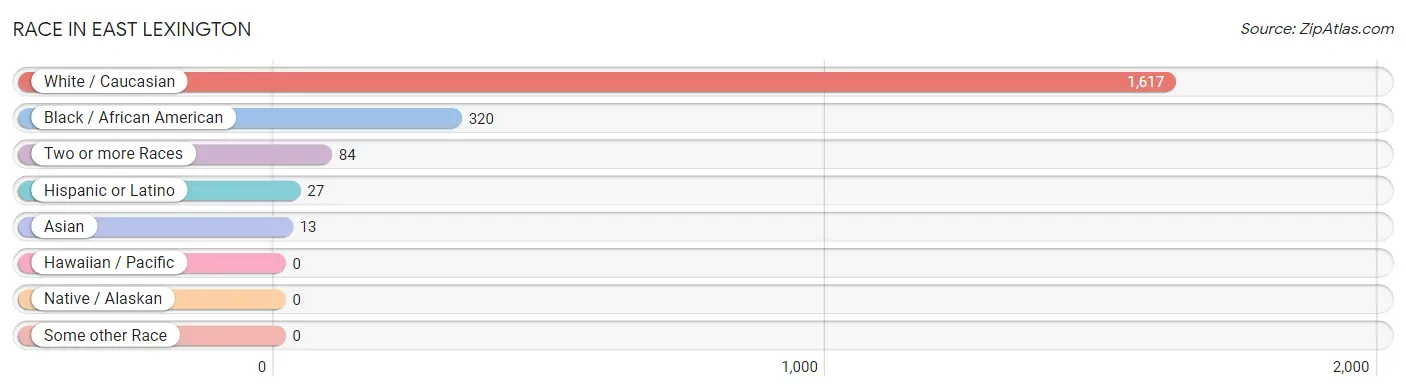
| Race | # Population | % Population |
| Asian | 13 | 0.6% |
| Black / African American | 320 | 15.7% |
| Hawaiian / Pacific | 0 | 0.0% |
| Hispanic or Latino | 27 | 1.3% |
| Native / Alaskan | 0 | 0.0% |
| White / Caucasian | 1,617 | 79.5% |
| Two or more Races | 84 | 4.1% |
| Some other Race | 0 | 0.0% |
| Total | 2,034 | 100.0% |
Ancestry in East Lexington
The most populous ancestries reported in East Lexington are American (800 | 39.3%), German (237 | 11.7%), Subsaharan African (153 | 7.5%), European (148 | 7.3%), and Nigerian (102 | 5.0%), together accounting for 70.8% of all East Lexington residents.
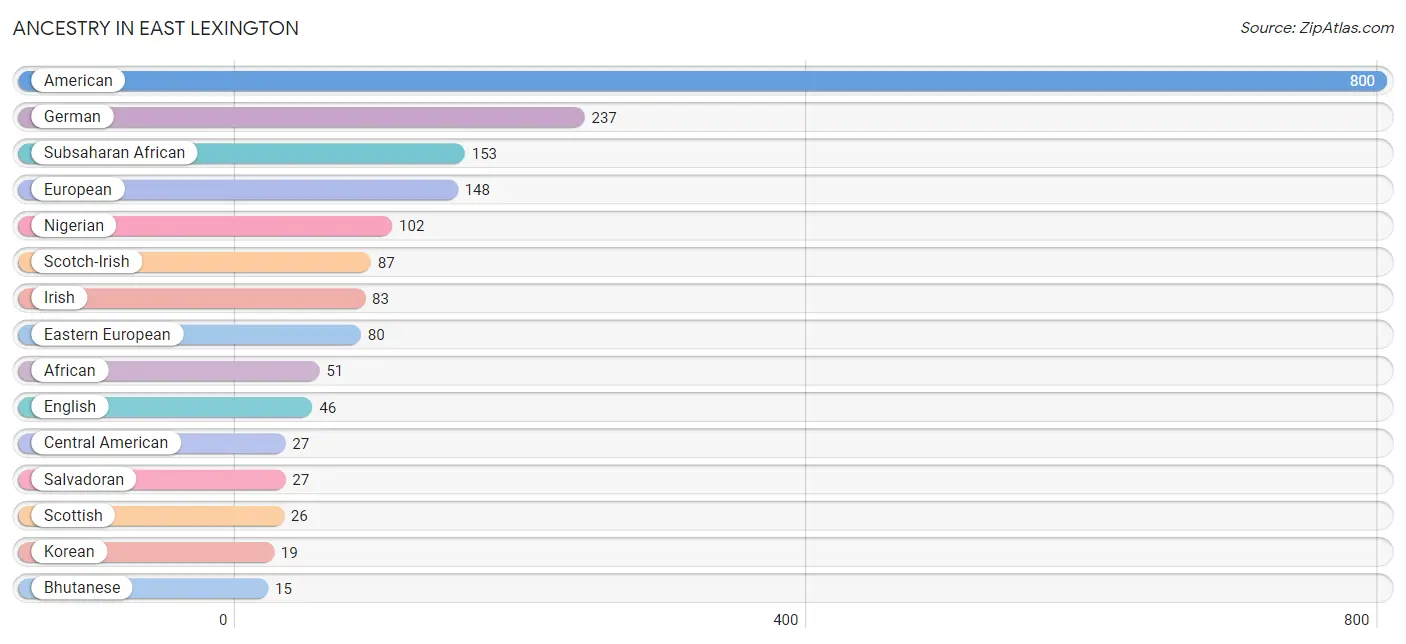
| Ancestry | # Population | % Population |
| African | 51 | 2.5% |
| American | 800 | 39.3% |
| Bhutanese | 15 | 0.7% |
| Burmese | 6 | 0.3% |
| Central American | 27 | 1.3% |
| Eastern European | 80 | 3.9% |
| English | 46 | 2.3% |
| European | 148 | 7.3% |
| French | 6 | 0.3% |
| French Canadian | 7 | 0.3% |
| German | 237 | 11.7% |
| Indian (Asian) | 7 | 0.3% |
| Irish | 83 | 4.1% |
| Italian | 14 | 0.7% |
| Korean | 19 | 0.9% |
| Native Hawaiian | 15 | 0.7% |
| Nigerian | 102 | 5.0% |
| Salvadoran | 27 | 1.3% |
| Scotch-Irish | 87 | 4.3% |
| Scottish | 26 | 1.3% |
| Subsaharan African | 153 | 7.5% | View All 21 Rows |
Immigrants in East Lexington
The most numerous immigrant groups reported in East Lexington came from Africa (52 | 2.6%), Nigeria (52 | 2.6%), Western Africa (52 | 2.6%), Asia (7 | 0.3%), and China (7 | 0.3%), together accounting for 8.4% of all East Lexington residents.
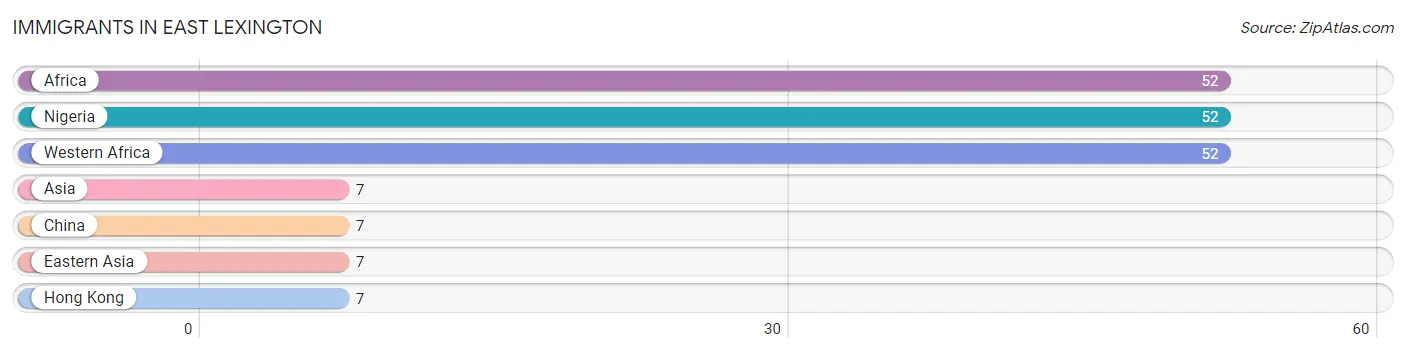
| Immigration Origin | # Population | % Population |
| Africa | 52 | 2.6% |
| Asia | 7 | 0.3% |
| China | 7 | 0.3% |
| Eastern Asia | 7 | 0.3% |
| Hong Kong | 7 | 0.3% |
| Nigeria | 52 | 2.6% |
| Western Africa | 52 | 2.6% | View All 7 Rows |
Sex and Age in East Lexington
Sex and Age in East Lexington
The most populous age groups in East Lexington are 40 to 44 Years (267 | 23.3%) for men and 70 to 74 Years (109 | 12.3%) for women.
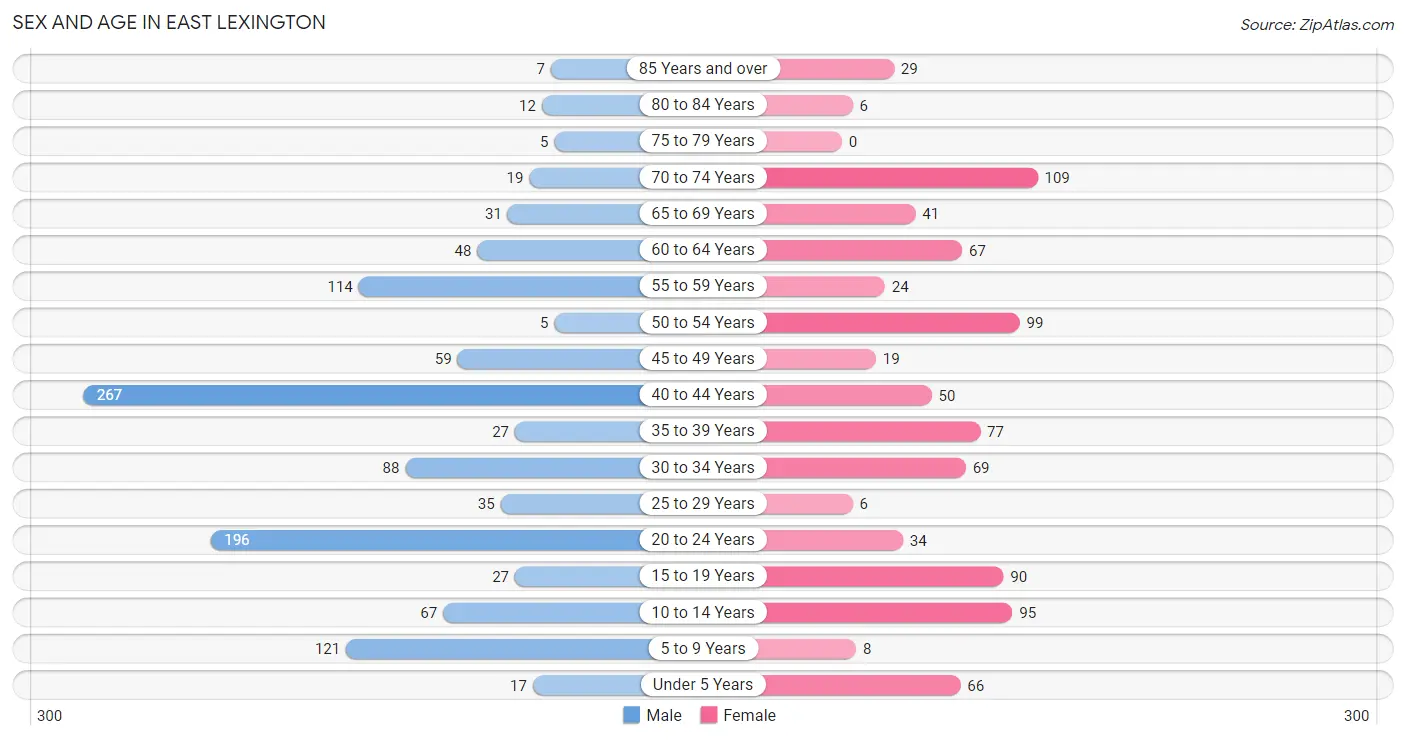
| Age Bracket | Male | Female |
| Under 5 Years | 17 (1.5%) | 66 (7.4%) |
| 5 to 9 Years | 121 (10.6%) | 8 (0.9%) |
| 10 to 14 Years | 67 (5.9%) | 95 (10.7%) |
| 15 to 19 Years | 27 (2.4%) | 90 (10.1%) |
| 20 to 24 Years | 196 (17.1%) | 34 (3.8%) |
| 25 to 29 Years | 35 (3.1%) | 6 (0.7%) |
| 30 to 34 Years | 88 (7.7%) | 69 (7.8%) |
| 35 to 39 Years | 27 (2.4%) | 77 (8.7%) |
| 40 to 44 Years | 267 (23.3%) | 50 (5.6%) |
| 45 to 49 Years | 59 (5.1%) | 19 (2.1%) |
| 50 to 54 Years | 5 (0.4%) | 99 (11.1%) |
| 55 to 59 Years | 114 (10.0%) | 24 (2.7%) |
| 60 to 64 Years | 48 (4.2%) | 67 (7.5%) |
| 65 to 69 Years | 31 (2.7%) | 41 (4.6%) |
| 70 to 74 Years | 19 (1.7%) | 109 (12.3%) |
| 75 to 79 Years | 5 (0.4%) | 0 (0.0%) |
| 80 to 84 Years | 12 (1.1%) | 6 (0.7%) |
| 85 Years and over | 7 (0.6%) | 29 (3.3%) |
| Total | 1,145 (100.0%) | 889 (100.0%) |
Families and Households in East Lexington
Median Family Size in East Lexington
The median family size in East Lexington is 3.03 persons per family, with married-couple families (305 | 55.6%) accounting for the largest median family size of 3.1 persons per family. On the other hand, single male/father families (12 | 2.2%) represent the smallest median family size with 2.67 persons per family.
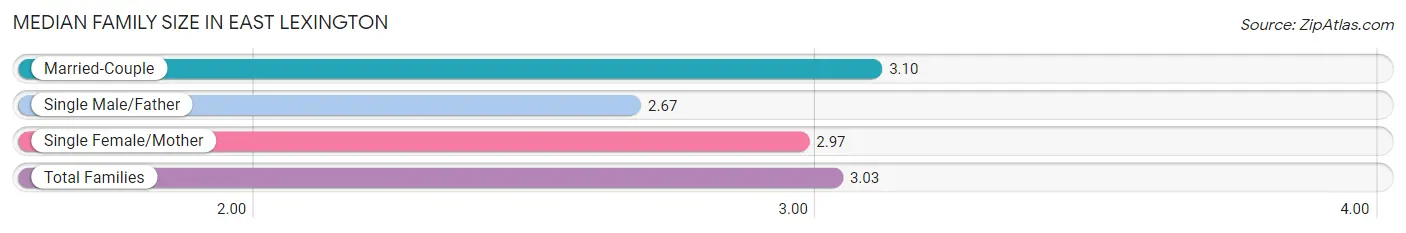
| Family Type | # Families | Family Size |
| Married-Couple | 305 (55.6%) | 3.10 |
| Single Male/Father | 12 (2.2%) | 2.67 |
| Single Female/Mother | 232 (42.3%) | 2.97 |
| Total Families | 549 (100.0%) | 3.03 |
Median Household Size in East Lexington
The median household size in East Lexington is 3.06 persons per household, with non-family households (82 | 13.0%) accounting for the largest median household size of 3.13 persons per household. single male/father households (12 | 1.9%) represent the smallest median household size with 2.67 persons per household.
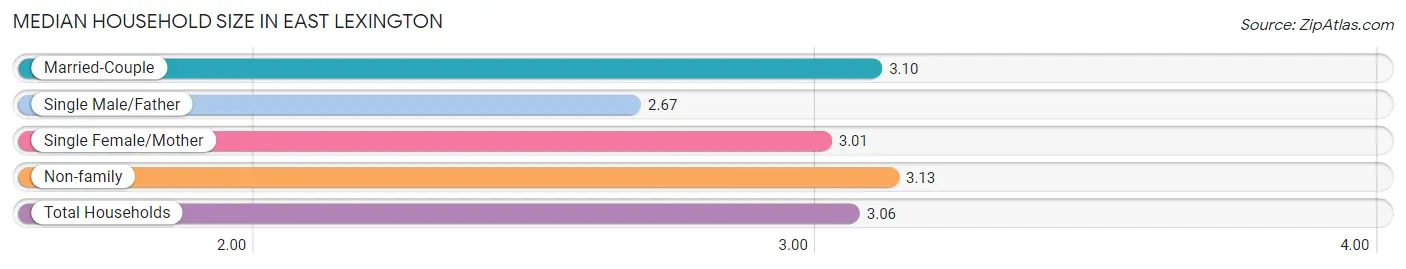
| Household Type | # Households | Household Size |
| Married-Couple | 305 (48.3%) | 3.10 |
| Single Male/Father | 12 (1.9%) | 2.67 |
| Single Female/Mother | 232 (36.8%) | 3.01 |
| Non-family | 82 (13.0%) | 3.13 |
| Total Households | 631 (100.0%) | 3.06 |
Household Size by Marriage Status in East Lexington
Out of a total of 631 households in East Lexington, 549 (87.0%) are family households, while 82 (13.0%) are nonfamily households. The most numerous type of family households are 2-person households, comprising 351, and the most common type of nonfamily households are 1-person households, comprising 49.
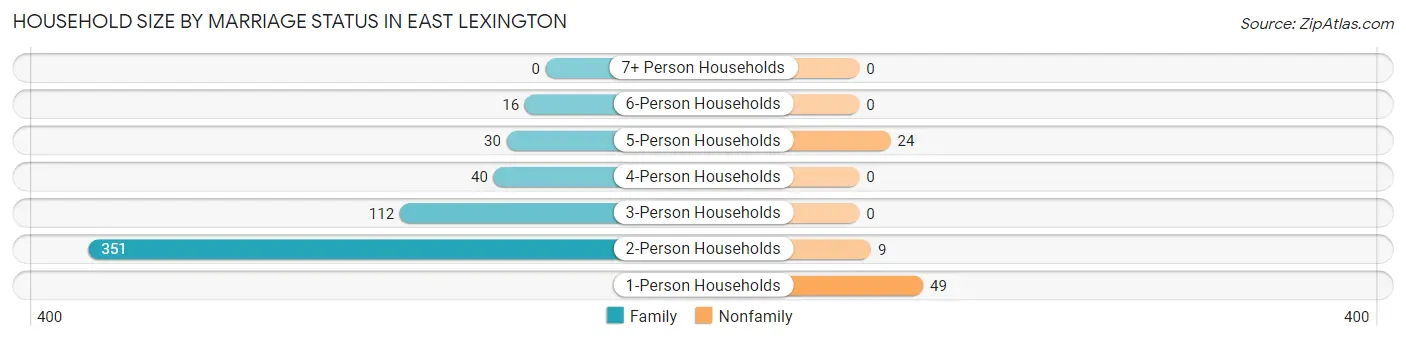
| Household Size | Family Households | Nonfamily Households |
| 1-Person Households | - | 49 (7.8%) |
| 2-Person Households | 351 (55.6%) | 9 (1.4%) |
| 3-Person Households | 112 (17.7%) | 0 (0.0%) |
| 4-Person Households | 40 (6.3%) | 0 (0.0%) |
| 5-Person Households | 30 (4.8%) | 24 (3.8%) |
| 6-Person Households | 16 (2.5%) | 0 (0.0%) |
| 7+ Person Households | 0 (0.0%) | 0 (0.0%) |
| Total | 549 (87.0%) | 82 (13.0%) |
Female Fertility in East Lexington
Fertility by Age in East Lexington
Average fertility rate in East Lexington is 87.0 births per 1,000 women. Women in the age bracket of 35 to 50 years have the highest fertility rate with 130.0 births per 1,000 women. Women in the age bracket of 35 to 50 years acount for 63.3% of all women with births.
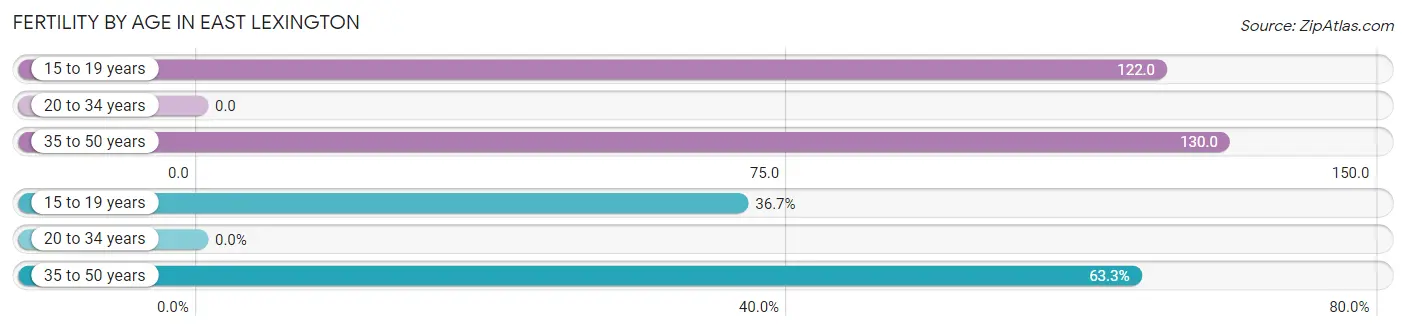
| Age Bracket | Women with Births | Births / 1,000 Women |
| 15 to 19 years | 11 (36.7%) | 122.0 |
| 20 to 34 years | 0 (0.0%) | 0.0 |
| 35 to 50 years | 19 (63.3%) | 130.0 |
| Total | 30 (100.0%) | 87.0 |
Fertility by Age by Marriage Status in East Lexington
63.3% of women with births (30) in East Lexington are married. The highest percentage of unmarried women with births falls into 15 to 19 years age bracket with 100.0% of them unmarried at the time of birth, while the lowest percentage of unmarried women with births belong to 35 to 50 years age bracket with 0.0% of them unmarried.
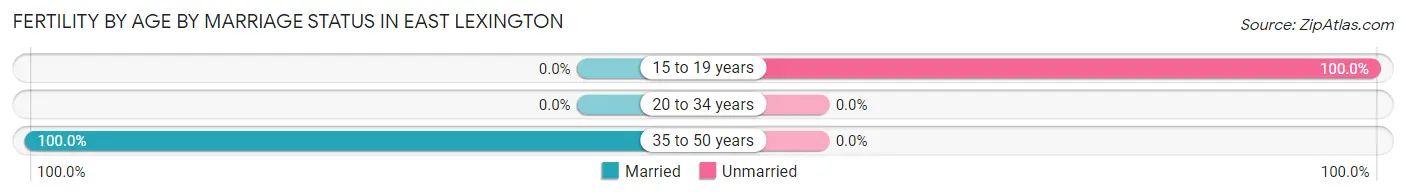
| Age Bracket | Married | Unmarried |
| 15 to 19 years | 0 (0.0%) | 11 (100.0%) |
| 20 to 34 years | 0 (0.0%) | 0 (0.0%) |
| 35 to 50 years | 19 (100.0%) | 0 (0.0%) |
| Total | 19 (63.3%) | 11 (36.7%) |
Fertility by Education in East Lexington
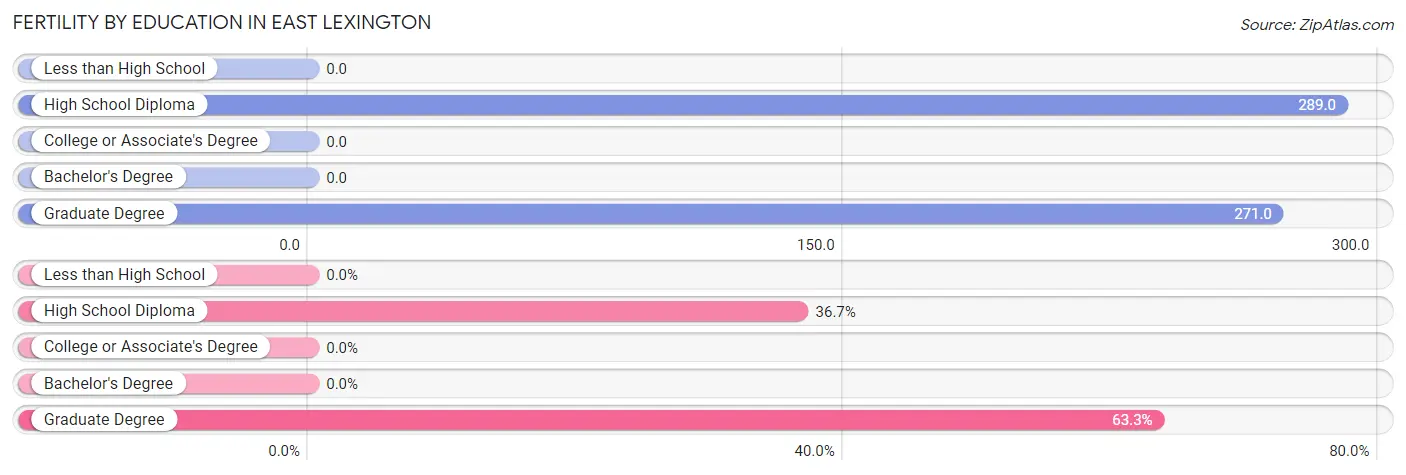
| Educational Attainment | Women with Births | Births / 1,000 Women |
| Less than High School | 0 (0.0%) | 0.0 |
| High School Diploma | 11 (36.7%) | 289.0 |
| College or Associate's Degree | 0 (0.0%) | 0.0 |
| Bachelor's Degree | 0 (0.0%) | 0.0 |
| Graduate Degree | 19 (63.3%) | 271.0 |
| Total | 30 (100.0%) | 87.0 |
Fertility by Education by Marriage Status in East Lexington
36.7% of women with births in East Lexington are unmarried. Women with the educational attainment of graduate degree are most likely to be married with 100.0% of them married at childbirth, while women with the educational attainment of high school diploma are least likely to be married with 100.0% of them unmarried at childbirth.
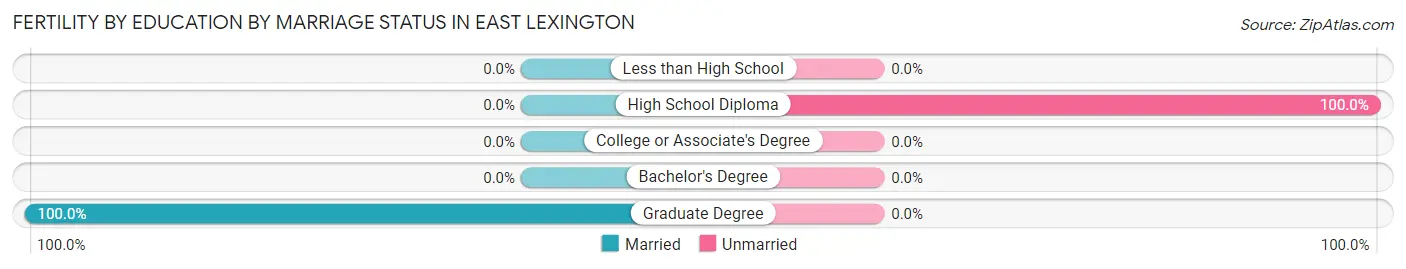
| Educational Attainment | Married | Unmarried |
| Less than High School | 0 (0.0%) | 0 (0.0%) |
| High School Diploma | 0 (0.0%) | 11 (100.0%) |
| College or Associate's Degree | 0 (0.0%) | 0 (0.0%) |
| Bachelor's Degree | 0 (0.0%) | 0 (0.0%) |
| Graduate Degree | 19 (100.0%) | 0 (0.0%) |
| Total | 19 (63.3%) | 11 (36.7%) |
Employment Characteristics in East Lexington
Employment by Class of Employer in East Lexington
Among the 834 employed individuals in East Lexington, private company employees (429 | 51.4%), not-for-profit organizations (163 | 19.5%), and self-employed (not incorporated) (129 | 15.5%) make up the most common classes of employment.
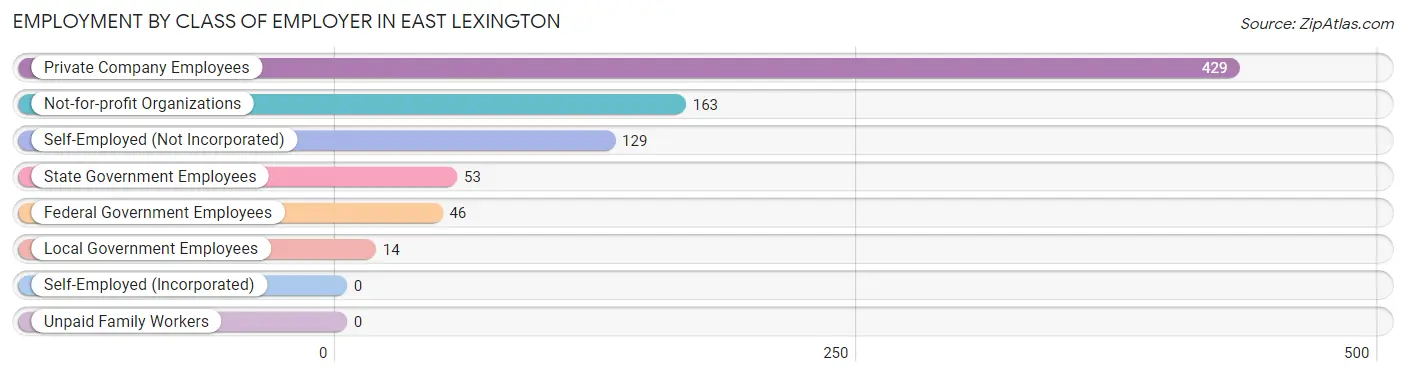
| Employer Class | # Employees | % Employees |
| Private Company Employees | 429 | 51.4% |
| Self-Employed (Incorporated) | 0 | 0.0% |
| Self-Employed (Not Incorporated) | 129 | 15.5% |
| Not-for-profit Organizations | 163 | 19.5% |
| Local Government Employees | 14 | 1.7% |
| State Government Employees | 53 | 6.4% |
| Federal Government Employees | 46 | 5.5% |
| Unpaid Family Workers | 0 | 0.0% |
| Total | 834 | 100.0% |
Employment Status by Age in East Lexington
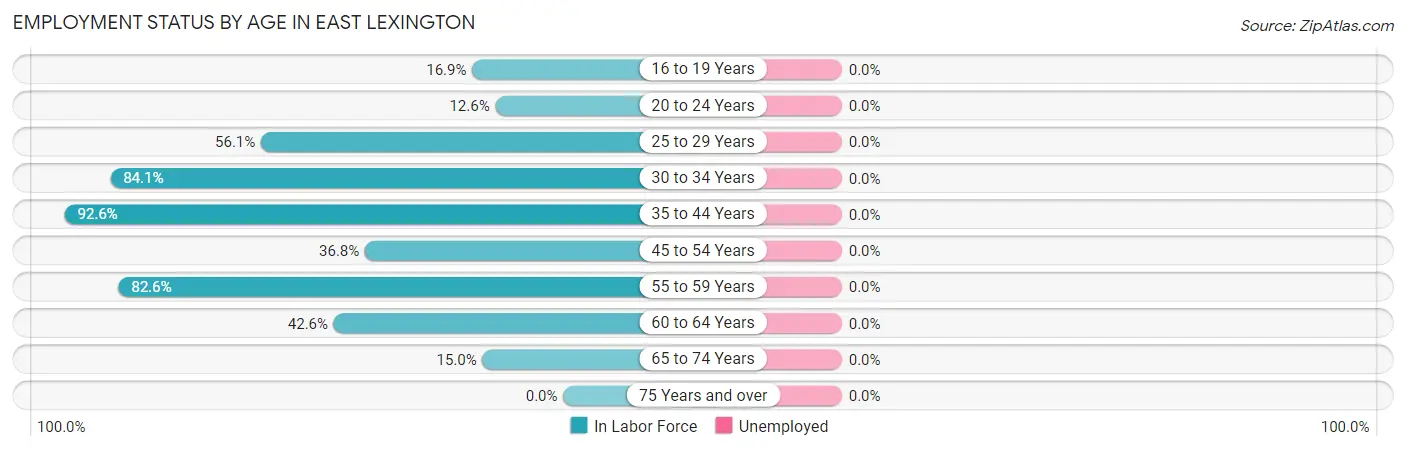
| Age Bracket | In Labor Force | Unemployed |
| 16 to 19 Years | 11 (16.9%) | 0 (0.0%) |
| 20 to 24 Years | 29 (12.6%) | 0 (0.0%) |
| 25 to 29 Years | 23 (56.1%) | 0 (0.0%) |
| 30 to 34 Years | 132 (84.1%) | 0 (0.0%) |
| 35 to 44 Years | 390 (92.6%) | 0 (0.0%) |
| 45 to 54 Years | 67 (36.8%) | 0 (0.0%) |
| 55 to 59 Years | 114 (82.6%) | 0 (0.0%) |
| 60 to 64 Years | 49 (42.6%) | 0 (0.0%) |
| 65 to 74 Years | 30 (15.0%) | 0 (0.0%) |
| 75 Years and over | 0 (0.0%) | 0 (0.0%) |
| Total | 844 (52.5%) | 0 (0.0%) |
Employment Status by Educational Attainment in East Lexington
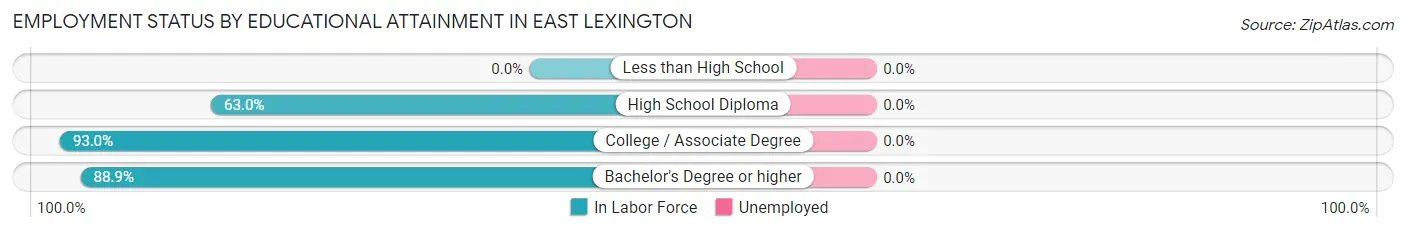
| Educational Attainment | In Labor Force | Unemployed |
| Less than High School | 0 (0.0%) | 0 (0.0%) |
| High School Diploma | 172 (63.0%) | 0 (0.0%) |
| College / Associate Degree | 387 (93.0%) | 0 (0.0%) |
| Bachelor's Degree or higher | 216 (88.9%) | 0 (0.0%) |
| Total | 775 (73.5%) | 0 (0.0%) |
Employment Occupations by Sex in East Lexington
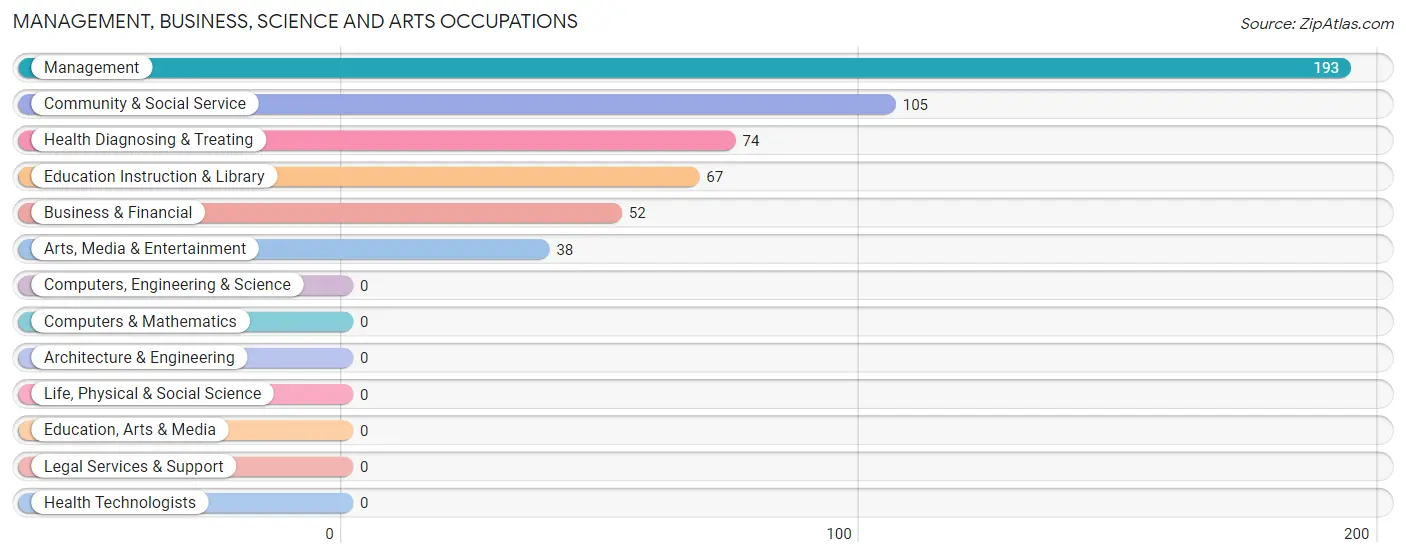
Management, Business, Science and Arts Occupations
The most common Management, Business, Science and Arts occupations in East Lexington are Management (193 | 22.8%), Community & Social Service (105 | 12.4%), Health Diagnosing & Treating (74 | 8.8%), Education Instruction & Library (67 | 7.9%), and Business & Financial (52 | 6.1%).
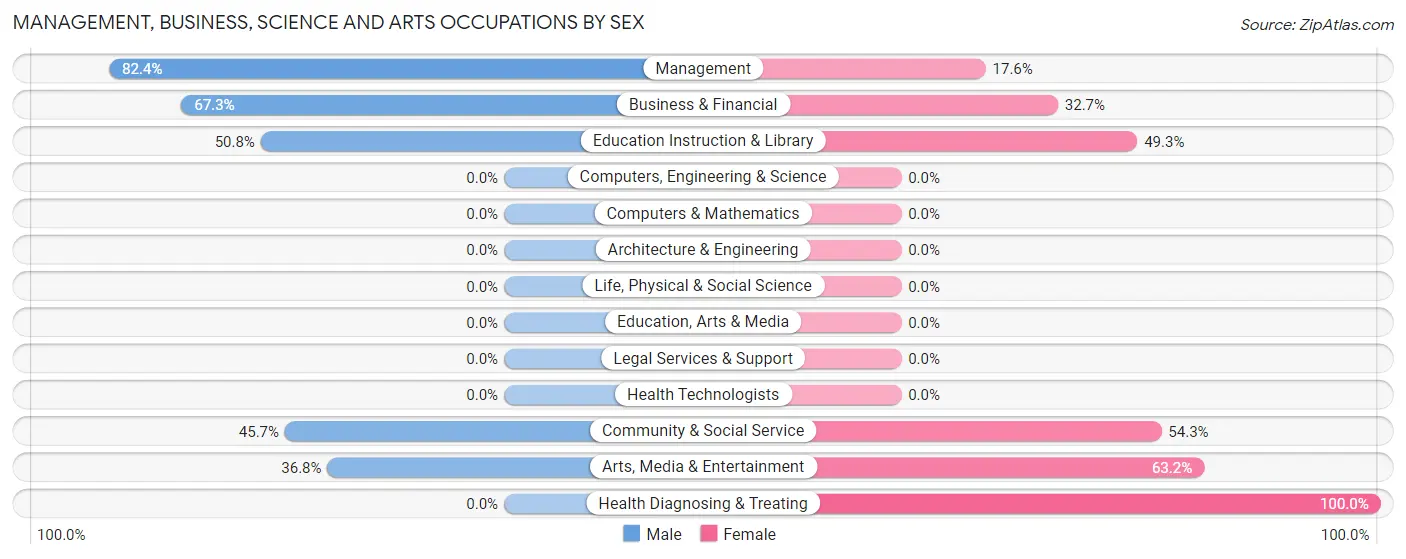
Management, Business, Science and Arts Occupations by Sex
Within the Management, Business, Science and Arts occupations in East Lexington, the most male-oriented occupations are Management (82.4%), Business & Financial (67.3%), and Education Instruction & Library (50.7%), while the most female-oriented occupations are Health Diagnosing & Treating (100.0%), Arts, Media & Entertainment (63.2%), and Community & Social Service (54.3%).
| Occupation | Male | Female |
| Management | 159 (82.4%) | 34 (17.6%) |
| Business & Financial | 35 (67.3%) | 17 (32.7%) |
| Computers, Engineering & Science | 0 (0.0%) | 0 (0.0%) |
| Computers & Mathematics | 0 (0.0%) | 0 (0.0%) |
| Architecture & Engineering | 0 (0.0%) | 0 (0.0%) |
| Life, Physical & Social Science | 0 (0.0%) | 0 (0.0%) |
| Community & Social Service | 48 (45.7%) | 57 (54.3%) |
| Education, Arts & Media | 0 (0.0%) | 0 (0.0%) |
| Legal Services & Support | 0 (0.0%) | 0 (0.0%) |
| Education Instruction & Library | 34 (50.7%) | 33 (49.2%) |
| Arts, Media & Entertainment | 14 (36.8%) | 24 (63.2%) |
| Health Diagnosing & Treating | 0 (0.0%) | 74 (100.0%) |
| Health Technologists | 0 (0.0%) | 0 (0.0%) |
| Total (Category) | 242 (57.1%) | 182 (42.9%) |
| Total (Overall) | 508 (60.1%) | 337 (39.9%) |
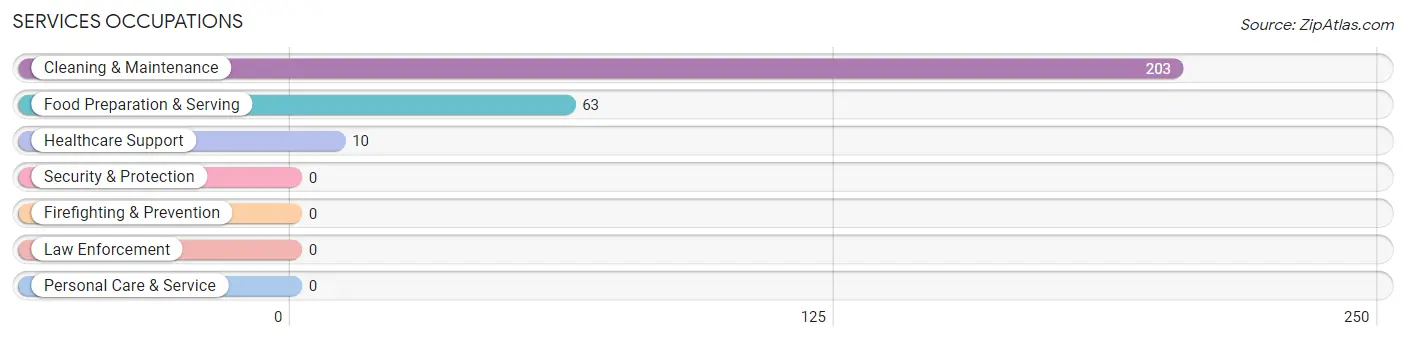
Services Occupations
The most common Services occupations in East Lexington are Cleaning & Maintenance (203 | 24.0%), Food Preparation & Serving (63 | 7.5%), and Healthcare Support (10 | 1.2%).
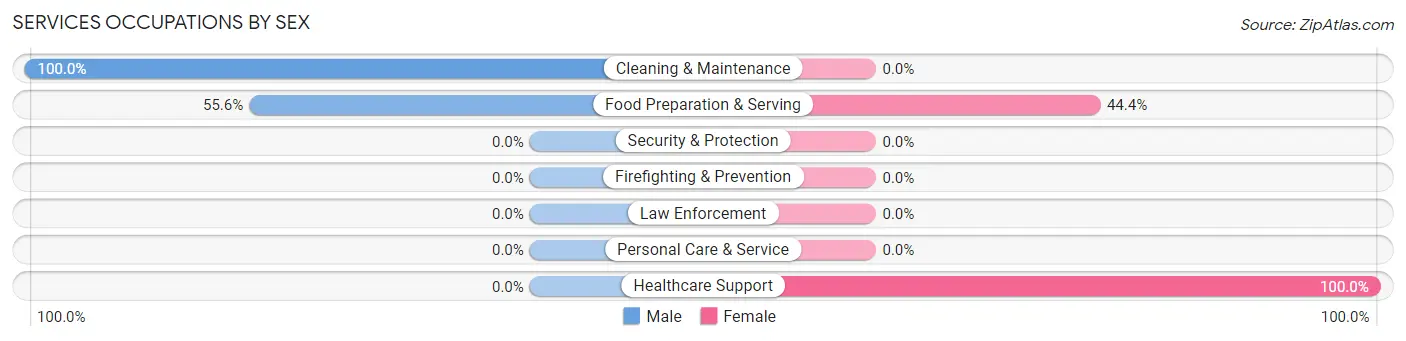
Services Occupations by Sex
Within the Services occupations in East Lexington, the most male-oriented occupations are Cleaning & Maintenance (100.0%), and Food Preparation & Serving (55.6%), while the most female-oriented occupations are Healthcare Support (100.0%), and Food Preparation & Serving (44.4%).
| Occupation | Male | Female |
| Healthcare Support | 0 (0.0%) | 10 (100.0%) |
| Security & Protection | 0 (0.0%) | 0 (0.0%) |
| Firefighting & Prevention | 0 (0.0%) | 0 (0.0%) |
| Law Enforcement | 0 (0.0%) | 0 (0.0%) |
| Food Preparation & Serving | 35 (55.6%) | 28 (44.4%) |
| Cleaning & Maintenance | 203 (100.0%) | 0 (0.0%) |
| Personal Care & Service | 0 (0.0%) | 0 (0.0%) |
| Total (Category) | 238 (86.2%) | 38 (13.8%) |
| Total (Overall) | 508 (60.1%) | 337 (39.9%) |
Sales and Office Occupations
The most common Sales and Office occupations in East Lexington are Sales & Related (43 | 5.1%), and Office & Administration (30 | 3.5%).
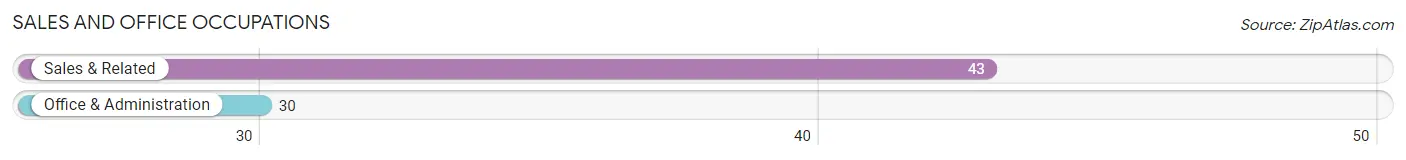
Sales and Office Occupations by Sex
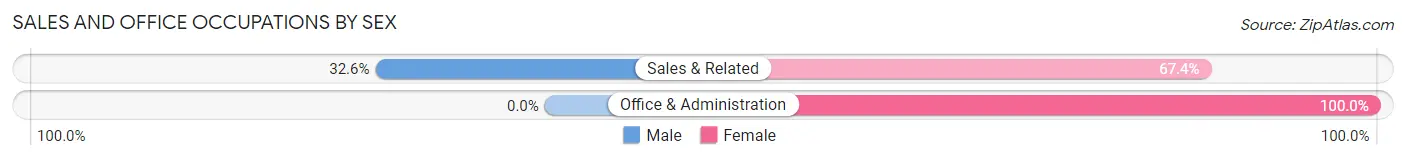
| Occupation | Male | Female |
| Sales & Related | 14 (32.6%) | 29 (67.4%) |
| Office & Administration | 0 (0.0%) | 30 (100.0%) |
| Total (Category) | 14 (19.2%) | 59 (80.8%) |
| Total (Overall) | 508 (60.1%) | 337 (39.9%) |
Natural Resources, Construction and Maintenance Occupations
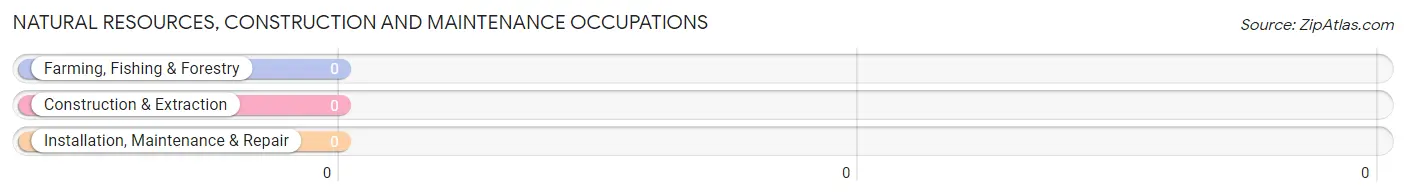
Natural Resources, Construction and Maintenance Occupations by Sex
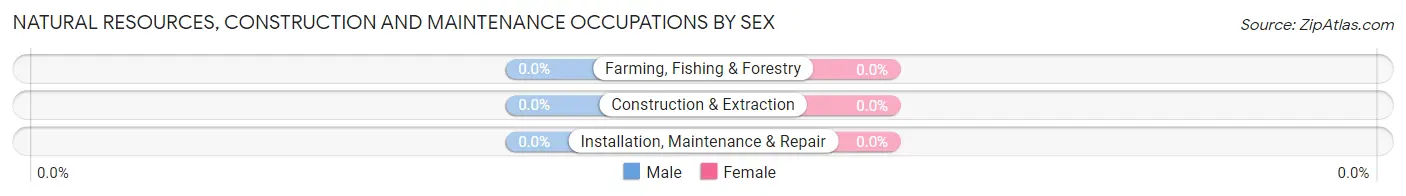
| Occupation | Male | Female |
| Farming, Fishing & Forestry | 0 (0.0%) | 0 (0.0%) |
| Construction & Extraction | 0 (0.0%) | 0 (0.0%) |
| Installation, Maintenance & Repair | 0 (0.0%) | 0 (0.0%) |
| Total (Category) | 0 (0.0%) | 0 (0.0%) |
| Total (Overall) | 508 (60.1%) | 337 (39.9%) |
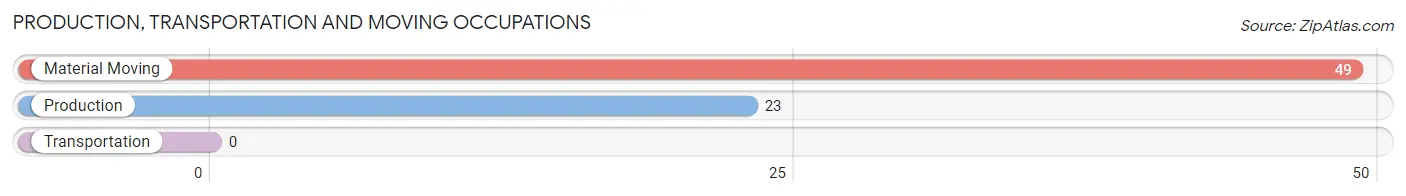
Production, Transportation and Moving Occupations
The most common Production, Transportation and Moving occupations in East Lexington are Material Moving (49 | 5.8%), and Production (23 | 2.7%).
Production, Transportation and Moving Occupations by Sex
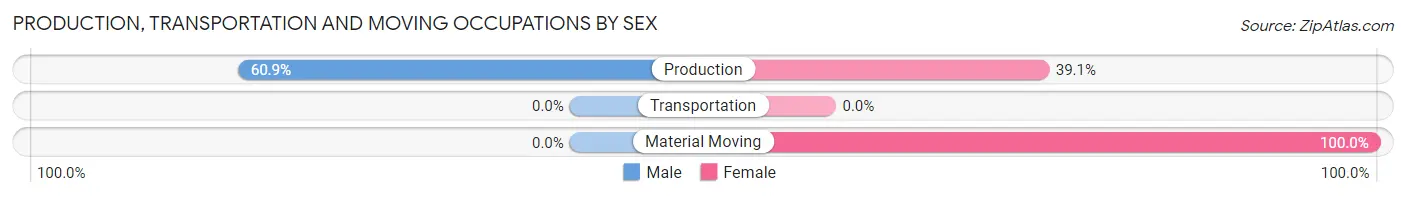
| Occupation | Male | Female |
| Production | 14 (60.9%) | 9 (39.1%) |
| Transportation | 0 (0.0%) | 0 (0.0%) |
| Material Moving | 0 (0.0%) | 49 (100.0%) |
| Total (Category) | 14 (19.4%) | 58 (80.6%) |
| Total (Overall) | 508 (60.1%) | 337 (39.9%) |
Employment Industries by Sex in East Lexington
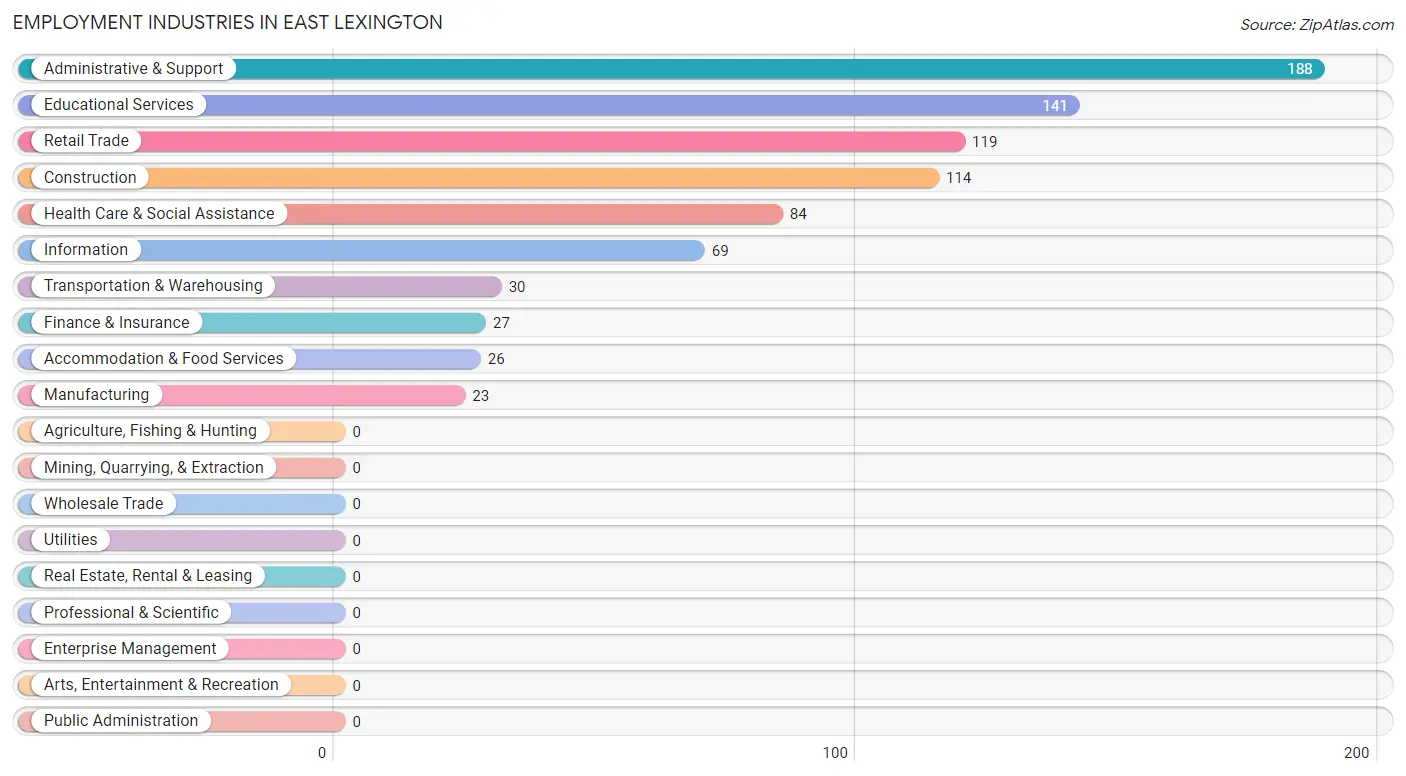
Employment Industries in East Lexington
The major employment industries in East Lexington include Administrative & Support (188 | 22.3%), Educational Services (141 | 16.7%), Retail Trade (119 | 14.1%), Construction (114 | 13.5%), and Health Care & Social Assistance (84 | 9.9%).
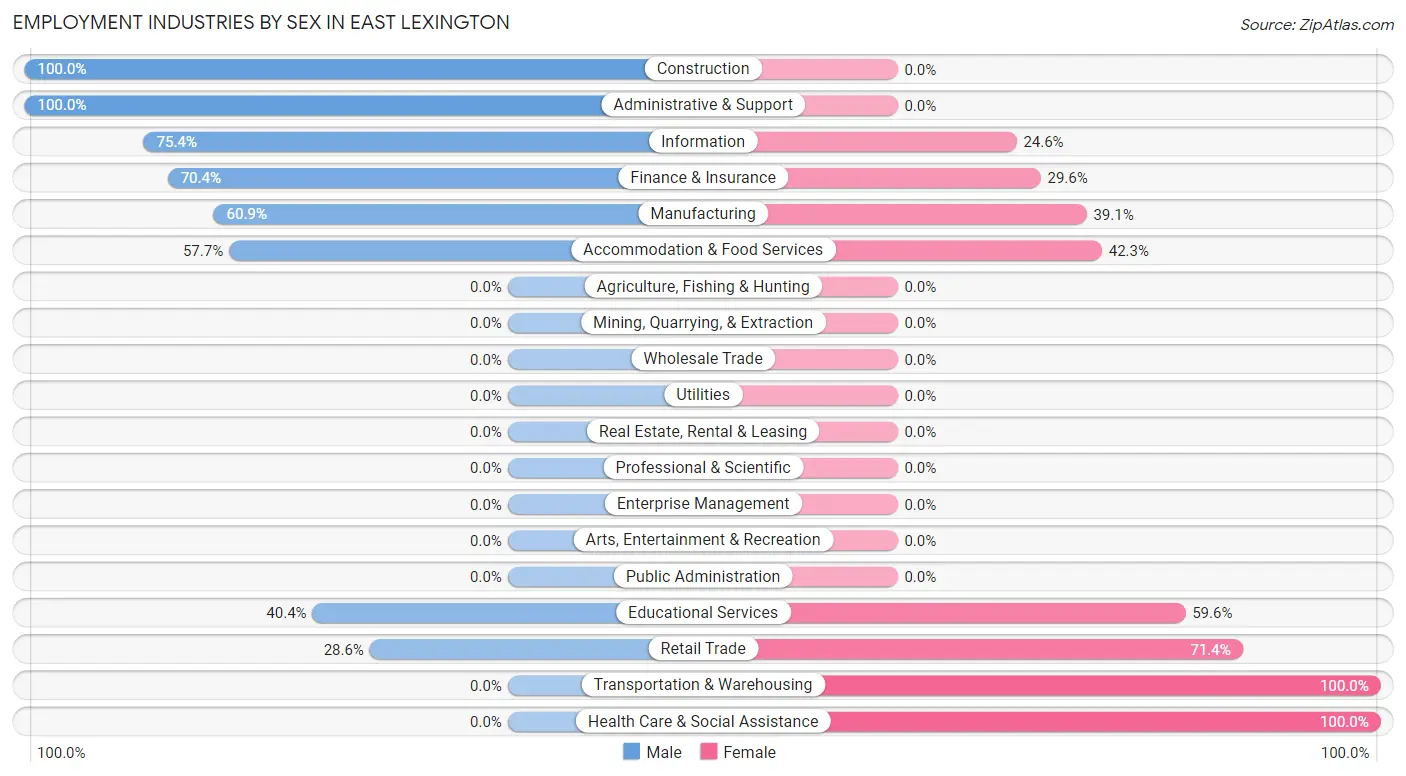
Employment Industries by Sex in East Lexington
The East Lexington industries that see more men than women are Construction (100.0%), Administrative & Support (100.0%), and Information (75.4%), whereas the industries that tend to have a higher number of women are Transportation & Warehousing (100.0%), Health Care & Social Assistance (100.0%), and Retail Trade (71.4%).
| Industry | Male | Female |
| Agriculture, Fishing & Hunting | 0 (0.0%) | 0 (0.0%) |
| Mining, Quarrying, & Extraction | 0 (0.0%) | 0 (0.0%) |
| Construction | 114 (100.0%) | 0 (0.0%) |
| Manufacturing | 14 (60.9%) | 9 (39.1%) |
| Wholesale Trade | 0 (0.0%) | 0 (0.0%) |
| Retail Trade | 34 (28.6%) | 85 (71.4%) |
| Transportation & Warehousing | 0 (0.0%) | 30 (100.0%) |
| Utilities | 0 (0.0%) | 0 (0.0%) |
| Information | 52 (75.4%) | 17 (24.6%) |
| Finance & Insurance | 19 (70.4%) | 8 (29.6%) |
| Real Estate, Rental & Leasing | 0 (0.0%) | 0 (0.0%) |
| Professional & Scientific | 0 (0.0%) | 0 (0.0%) |
| Enterprise Management | 0 (0.0%) | 0 (0.0%) |
| Administrative & Support | 188 (100.0%) | 0 (0.0%) |
| Educational Services | 57 (40.4%) | 84 (59.6%) |
| Health Care & Social Assistance | 0 (0.0%) | 84 (100.0%) |
| Arts, Entertainment & Recreation | 0 (0.0%) | 0 (0.0%) |
| Accommodation & Food Services | 15 (57.7%) | 11 (42.3%) |
| Public Administration | 0 (0.0%) | 0 (0.0%) |
| Total | 508 (60.1%) | 337 (39.9%) |
Education in East Lexington
School Enrollment in East Lexington
The most common levels of schooling among the 614 students in East Lexington are college / undergraduate (199 | 32.4%), elementary school (126 | 20.5%), and middle school (111 | 18.1%).
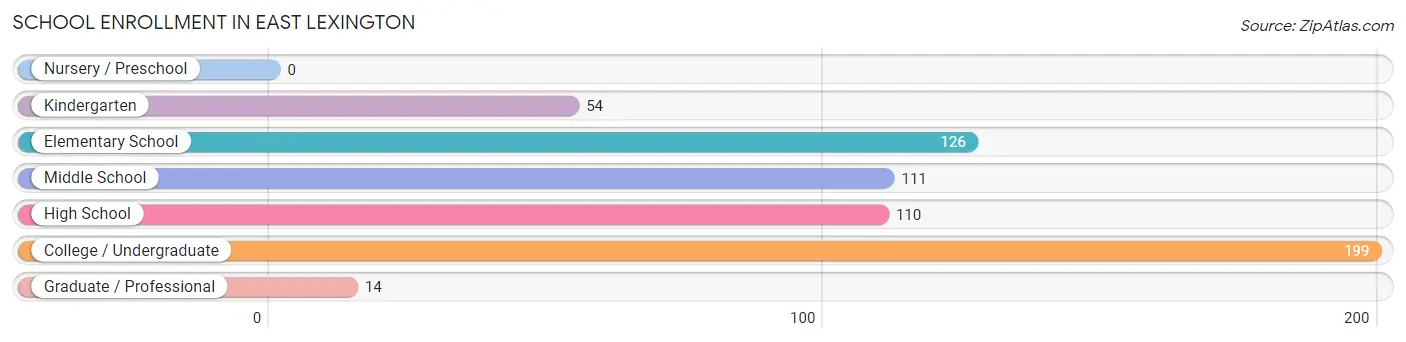
| School Level | # Students | % Students |
| Nursery / Preschool | 0 | 0.0% |
| Kindergarten | 54 | 8.8% |
| Elementary School | 126 | 20.5% |
| Middle School | 111 | 18.1% |
| High School | 110 | 17.9% |
| College / Undergraduate | 199 | 32.4% |
| Graduate / Professional | 14 | 2.3% |
| Total | 614 | 100.0% |
School Enrollment by Age by Funding Source in East Lexington
Out of a total of 614 students who are enrolled in schools in East Lexington, 243 (39.6%) attend a private institution, while the remaining 371 (60.4%) are enrolled in public schools. The age group of 20 to 24 year olds has the highest likelihood of being enrolled in private schools, with 185 (100.0% in the age bracket) enrolled. Conversely, the age group of 15 to 17 year olds has the lowest likelihood of being enrolled in a private school, with 96 (100.0% in the age bracket) attending a public institution.
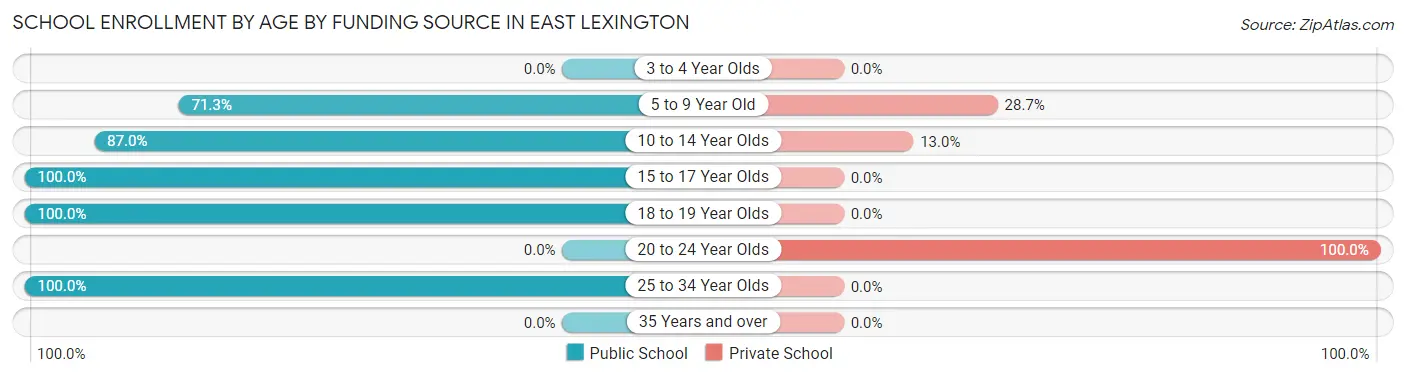
| Age Bracket | Public School | Private School |
| 3 to 4 Year Olds | 0 (0.0%) | 0 (0.0%) |
| 5 to 9 Year Old | 92 (71.3%) | 37 (28.7%) |
| 10 to 14 Year Olds | 141 (87.0%) | 21 (13.0%) |
| 15 to 17 Year Olds | 96 (100.0%) | 0 (0.0%) |
| 18 to 19 Year Olds | 10 (100.0%) | 0 (0.0%) |
| 20 to 24 Year Olds | 0 (0.0%) | 185 (100.0%) |
| 25 to 34 Year Olds | 32 (100.0%) | 0 (0.0%) |
| 35 Years and over | 0 (0.0%) | 0 (0.0%) |
| Total | 371 (60.4%) | 243 (39.6%) |
Educational Attainment by Field of Study in East Lexington
Business (86 | 29.8%), computers & mathematics (54 | 18.7%), science & technology (31 | 10.7%), psychology (28 | 9.7%), and literature & languages (24 | 8.3%) are the most common fields of study among 289 individuals in East Lexington who have obtained a bachelor's degree or higher.
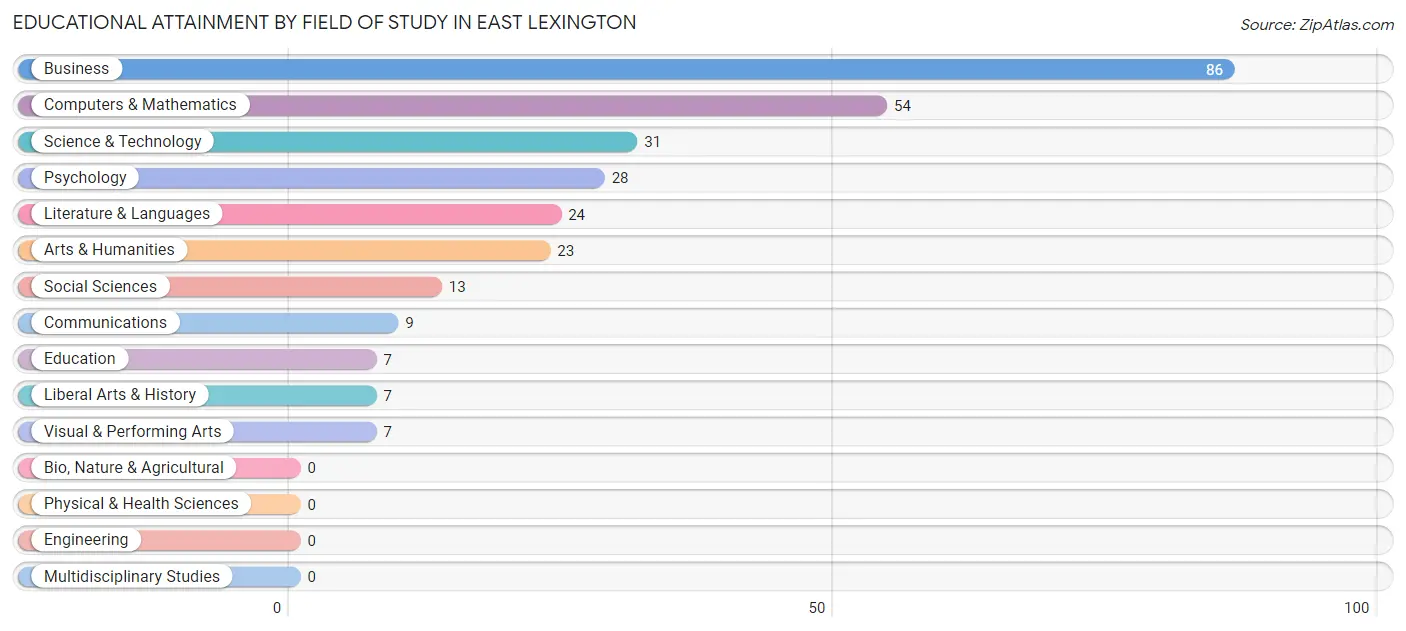
| Field of Study | # Graduates | % Graduates |
| Computers & Mathematics | 54 | 18.7% |
| Bio, Nature & Agricultural | 0 | 0.0% |
| Physical & Health Sciences | 0 | 0.0% |
| Psychology | 28 | 9.7% |
| Social Sciences | 13 | 4.5% |
| Engineering | 0 | 0.0% |
| Multidisciplinary Studies | 0 | 0.0% |
| Science & Technology | 31 | 10.7% |
| Business | 86 | 29.8% |
| Education | 7 | 2.4% |
| Literature & Languages | 24 | 8.3% |
| Liberal Arts & History | 7 | 2.4% |
| Visual & Performing Arts | 7 | 2.4% |
| Communications | 9 | 3.1% |
| Arts & Humanities | 23 | 8.0% |
| Total | 289 | 100.0% |
Transportation & Commute in East Lexington
Vehicle Availability by Sex in East Lexington
The most prevalent vehicle ownership categories in East Lexington are males with 1 vehicle (203, accounting for 40.0%) and females with 1 vehicle (35, making up 62.3%).
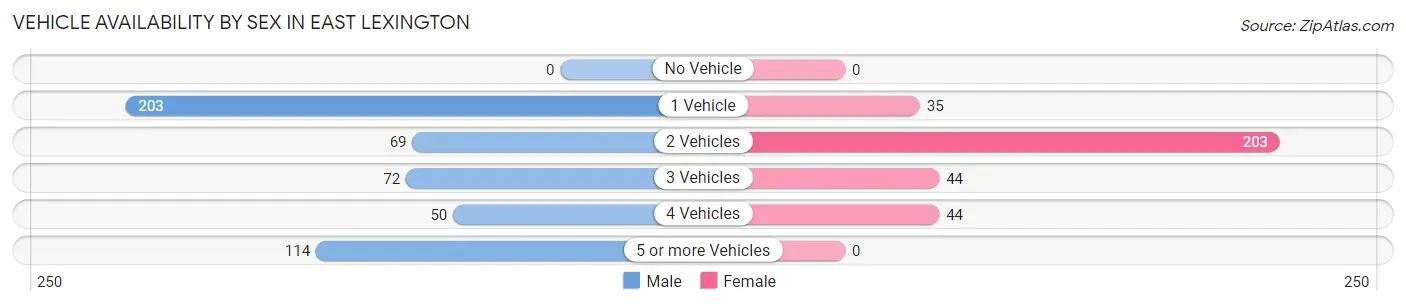
| Vehicles Available | Male | Female |
| No Vehicle | 0 (0.0%) | 0 (0.0%) |
| 1 Vehicle | 203 (40.0%) | 35 (10.7%) |
| 2 Vehicles | 69 (13.6%) | 203 (62.3%) |
| 3 Vehicles | 72 (14.2%) | 44 (13.5%) |
| 4 Vehicles | 50 (9.8%) | 44 (13.5%) |
| 5 or more Vehicles | 114 (22.4%) | 0 (0.0%) |
| Total | 508 (100.0%) | 326 (100.0%) |
Commute Time in East Lexington
The most frequently occuring commute durations in East Lexington are 10 to 14 minutes (206 commuters, 29.6%), 30 to 34 minutes (188 commuters, 27.1%), and 5 to 9 minutes (144 commuters, 20.7%).
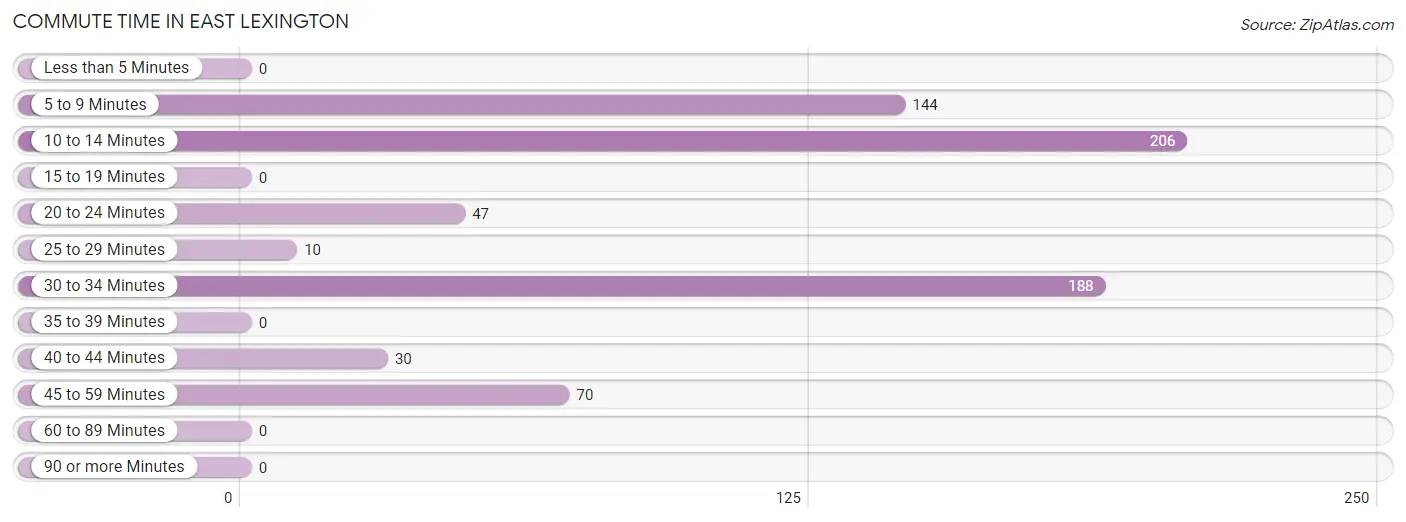
| Commute Time | # Commuters | % Commuters |
| Less than 5 Minutes | 0 | 0.0% |
| 5 to 9 Minutes | 144 | 20.7% |
| 10 to 14 Minutes | 206 | 29.6% |
| 15 to 19 Minutes | 0 | 0.0% |
| 20 to 24 Minutes | 47 | 6.8% |
| 25 to 29 Minutes | 10 | 1.4% |
| 30 to 34 Minutes | 188 | 27.1% |
| 35 to 39 Minutes | 0 | 0.0% |
| 40 to 44 Minutes | 30 | 4.3% |
| 45 to 59 Minutes | 70 | 10.1% |
| 60 to 89 Minutes | 0 | 0.0% |
| 90 or more Minutes | 0 | 0.0% |
Commute Time by Sex in East Lexington
The most common commute times in East Lexington are 30 to 34 minutes (188 commuters, 47.7%) for males and 10 to 14 minutes (145 commuters, 48.2%) for females.
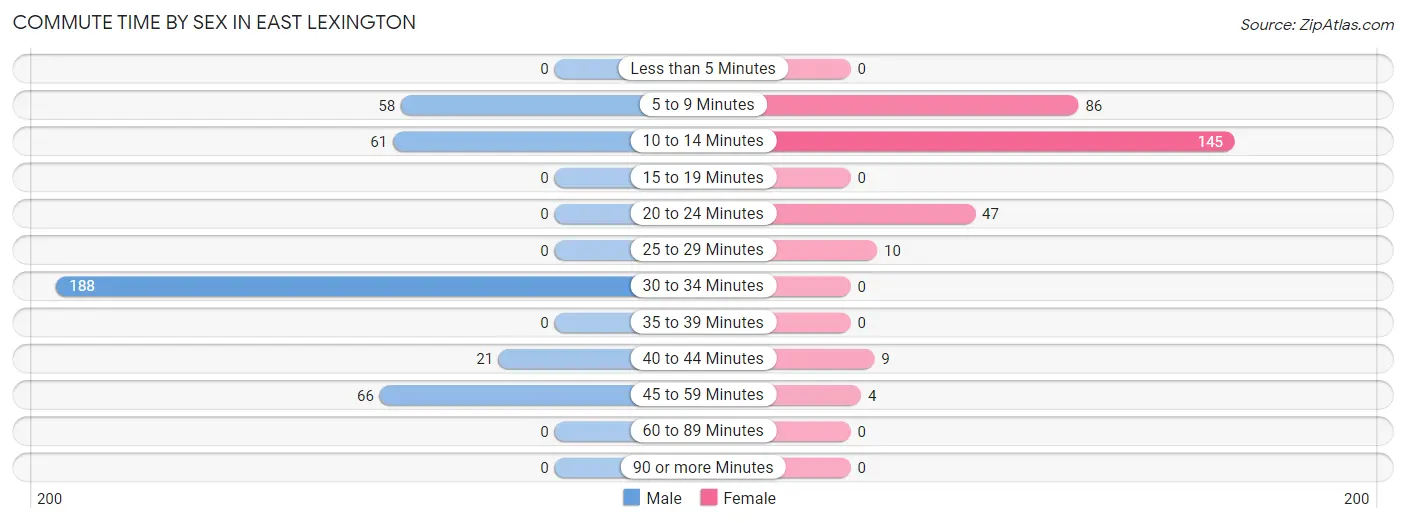
| Commute Time | Male | Female |
| Less than 5 Minutes | 0 (0.0%) | 0 (0.0%) |
| 5 to 9 Minutes | 58 (14.7%) | 86 (28.6%) |
| 10 to 14 Minutes | 61 (15.5%) | 145 (48.2%) |
| 15 to 19 Minutes | 0 (0.0%) | 0 (0.0%) |
| 20 to 24 Minutes | 0 (0.0%) | 47 (15.6%) |
| 25 to 29 Minutes | 0 (0.0%) | 10 (3.3%) |
| 30 to 34 Minutes | 188 (47.7%) | 0 (0.0%) |
| 35 to 39 Minutes | 0 (0.0%) | 0 (0.0%) |
| 40 to 44 Minutes | 21 (5.3%) | 9 (3.0%) |
| 45 to 59 Minutes | 66 (16.8%) | 4 (1.3%) |
| 60 to 89 Minutes | 0 (0.0%) | 0 (0.0%) |
| 90 or more Minutes | 0 (0.0%) | 0 (0.0%) |
Time of Departure to Work by Sex in East Lexington
The most frequent times of departure to work in East Lexington are 12:00 PM to 3:59 PM (188, 47.7%) for males and 4:00 PM to 11:59 PM (86, 28.6%) for females.
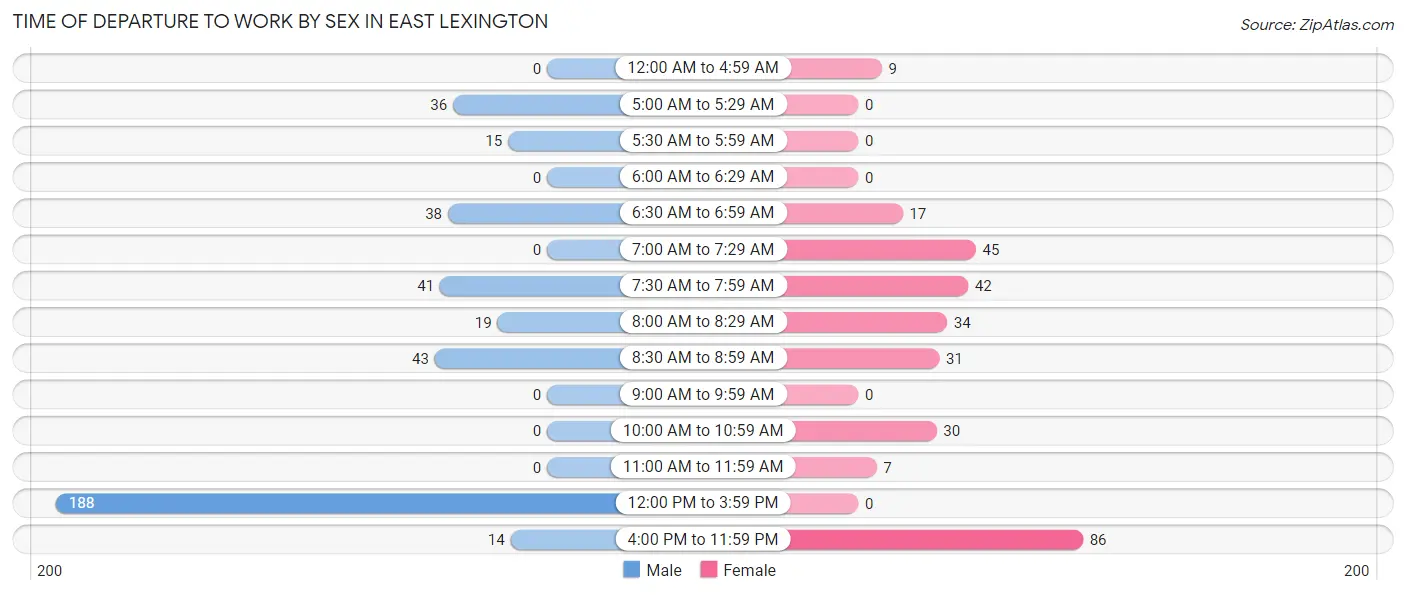
| Time of Departure | Male | Female |
| 12:00 AM to 4:59 AM | 0 (0.0%) | 9 (3.0%) |
| 5:00 AM to 5:29 AM | 36 (9.1%) | 0 (0.0%) |
| 5:30 AM to 5:59 AM | 15 (3.8%) | 0 (0.0%) |
| 6:00 AM to 6:29 AM | 0 (0.0%) | 0 (0.0%) |
| 6:30 AM to 6:59 AM | 38 (9.6%) | 17 (5.7%) |
| 7:00 AM to 7:29 AM | 0 (0.0%) | 45 (14.9%) |
| 7:30 AM to 7:59 AM | 41 (10.4%) | 42 (14.0%) |
| 8:00 AM to 8:29 AM | 19 (4.8%) | 34 (11.3%) |
| 8:30 AM to 8:59 AM | 43 (10.9%) | 31 (10.3%) |
| 9:00 AM to 9:59 AM | 0 (0.0%) | 0 (0.0%) |
| 10:00 AM to 10:59 AM | 0 (0.0%) | 30 (10.0%) |
| 11:00 AM to 11:59 AM | 0 (0.0%) | 7 (2.3%) |
| 12:00 PM to 3:59 PM | 188 (47.7%) | 0 (0.0%) |
| 4:00 PM to 11:59 PM | 14 (3.5%) | 86 (28.6%) |
| Total | 394 (100.0%) | 301 (100.0%) |
Housing Occupancy in East Lexington
Occupancy by Ownership in East Lexington
Of the total 631 dwellings in East Lexington, owner-occupied units account for 325 (51.5%), while renter-occupied units make up 306 (48.5%).
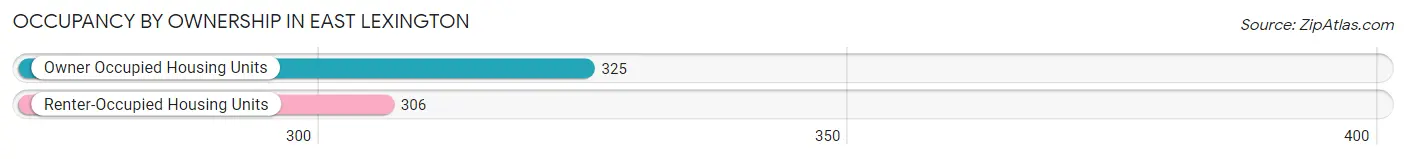
| Occupancy | # Housing Units | % Housing Units |
| Owner Occupied Housing Units | 325 | 51.5% |
| Renter-Occupied Housing Units | 306 | 48.5% |
| Total Occupied Housing Units | 631 | 100.0% |
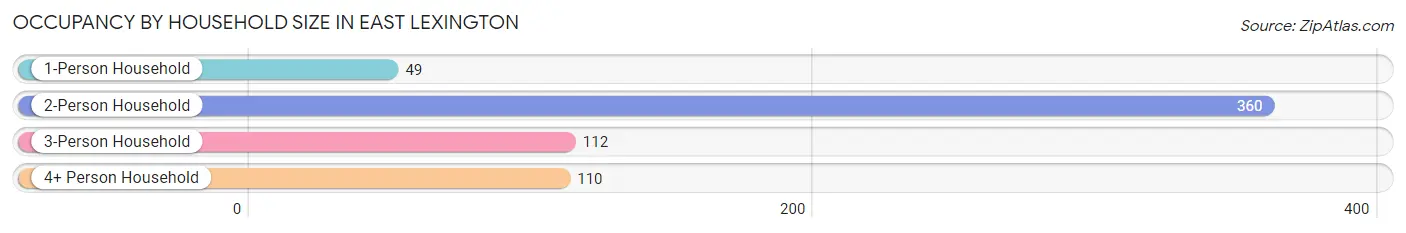
Occupancy by Household Size in East Lexington
| Household Size | # Housing Units | % Housing Units |
| 1-Person Household | 49 | 7.8% |
| 2-Person Household | 360 | 57.1% |
| 3-Person Household | 112 | 17.7% |
| 4+ Person Household | 110 | 17.4% |
| Total Housing Units | 631 | 100.0% |
Occupancy by Ownership by Household Size in East Lexington
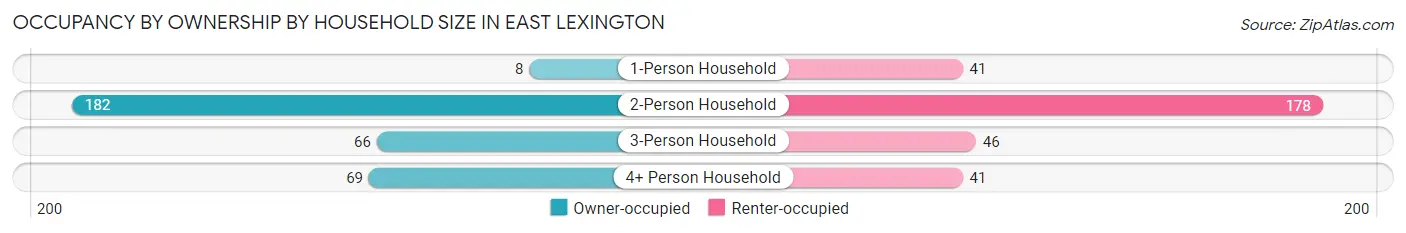
| Household Size | Owner-occupied | Renter-occupied |
| 1-Person Household | 8 (16.3%) | 41 (83.7%) |
| 2-Person Household | 182 (50.6%) | 178 (49.4%) |
| 3-Person Household | 66 (58.9%) | 46 (41.1%) |
| 4+ Person Household | 69 (62.7%) | 41 (37.3%) |
| Total Housing Units | 325 (51.5%) | 306 (48.5%) |
Occupancy by Educational Attainment in East Lexington
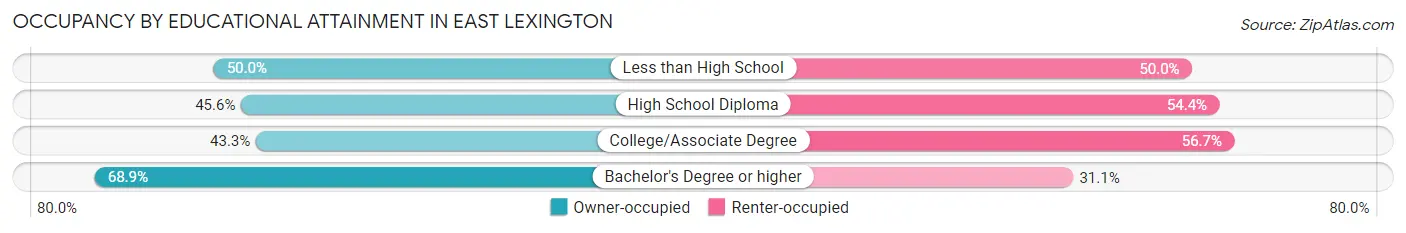
| Household Size | Owner-occupied | Renter-occupied |
| Less than High School | 16 (50.0%) | 16 (50.0%) |
| High School Diploma | 136 (45.6%) | 162 (54.4%) |
| College/Associate Degree | 58 (43.3%) | 76 (56.7%) |
| Bachelor's Degree or higher | 115 (68.9%) | 52 (31.1%) |
Occupancy by Age of Householder in East Lexington
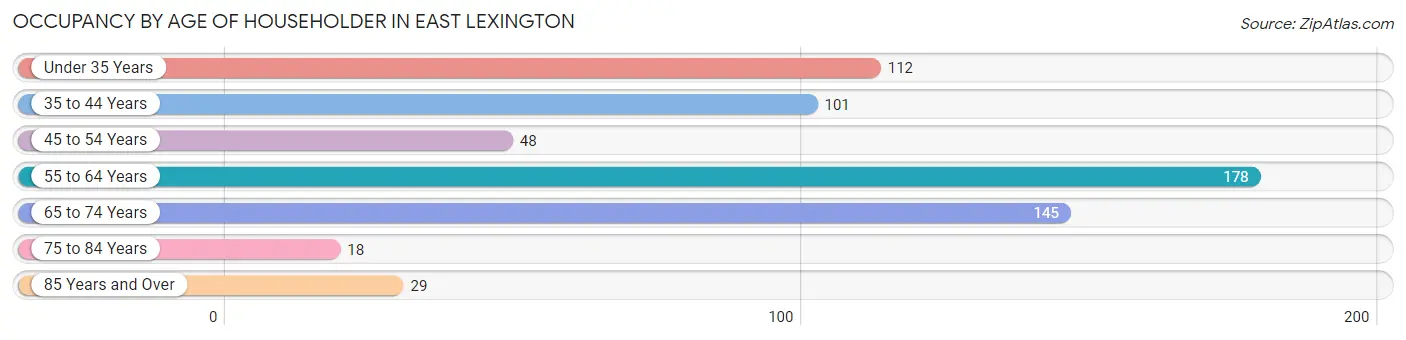
| Age Bracket | # Households | % Households |
| Under 35 Years | 112 | 17.7% |
| 35 to 44 Years | 101 | 16.0% |
| 45 to 54 Years | 48 | 7.6% |
| 55 to 64 Years | 178 | 28.2% |
| 65 to 74 Years | 145 | 23.0% |
| 75 to 84 Years | 18 | 2.9% |
| 85 Years and Over | 29 | 4.6% |
| Total | 631 | 100.0% |
Housing Finances in East Lexington
Median Income by Occupancy in East Lexington
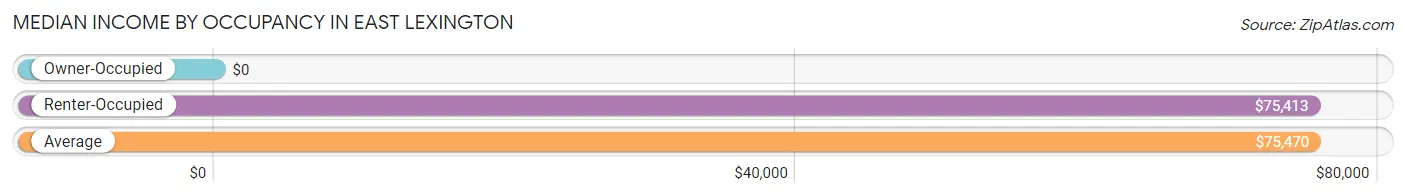
| Occupancy Type | # Households | Median Income |
| Owner-Occupied | 325 (51.5%) | $0 |
| Renter-Occupied | 306 (48.5%) | $75,413 |
| Average | 631 (100.0%) | $75,470 |
Occupancy by Householder Income Bracket in East Lexington
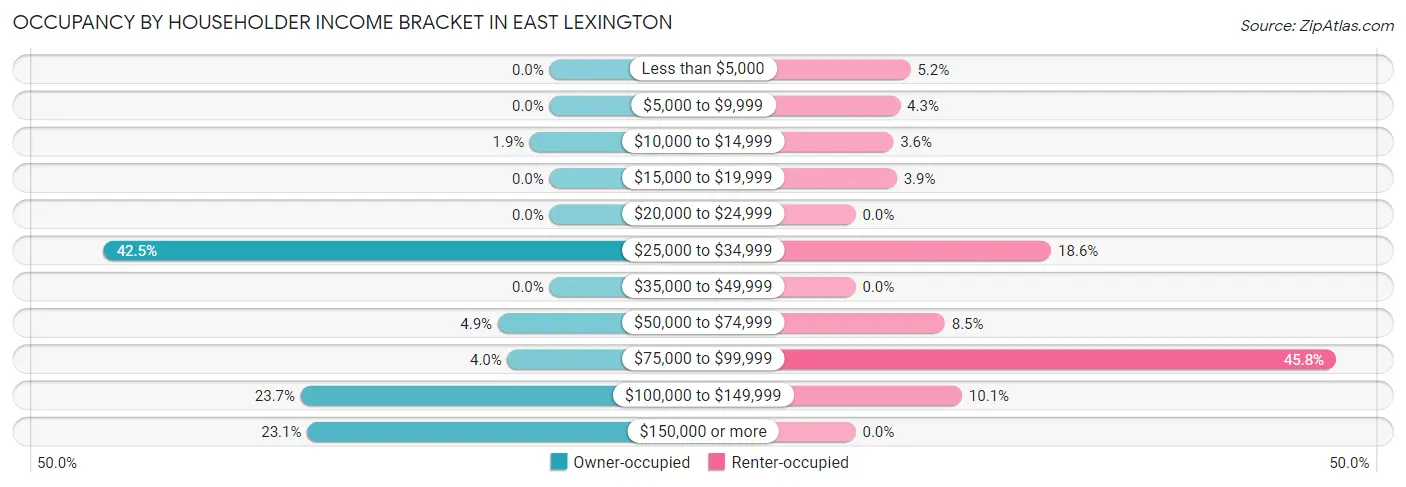
| Income Bracket | Owner-occupied | Renter-occupied |
| Less than $5,000 | 0 (0.0%) | 16 (5.2%) |
| $5,000 to $9,999 | 0 (0.0%) | 13 (4.3%) |
| $10,000 to $14,999 | 6 (1.8%) | 11 (3.6%) |
| $15,000 to $19,999 | 0 (0.0%) | 12 (3.9%) |
| $20,000 to $24,999 | 0 (0.0%) | 0 (0.0%) |
| $25,000 to $34,999 | 138 (42.5%) | 57 (18.6%) |
| $35,000 to $49,999 | 0 (0.0%) | 0 (0.0%) |
| $50,000 to $74,999 | 16 (4.9%) | 26 (8.5%) |
| $75,000 to $99,999 | 13 (4.0%) | 140 (45.8%) |
| $100,000 to $149,999 | 77 (23.7%) | 31 (10.1%) |
| $150,000 or more | 75 (23.1%) | 0 (0.0%) |
| Total | 325 (100.0%) | 306 (100.0%) |
Monthly Housing Cost Tiers in East Lexington
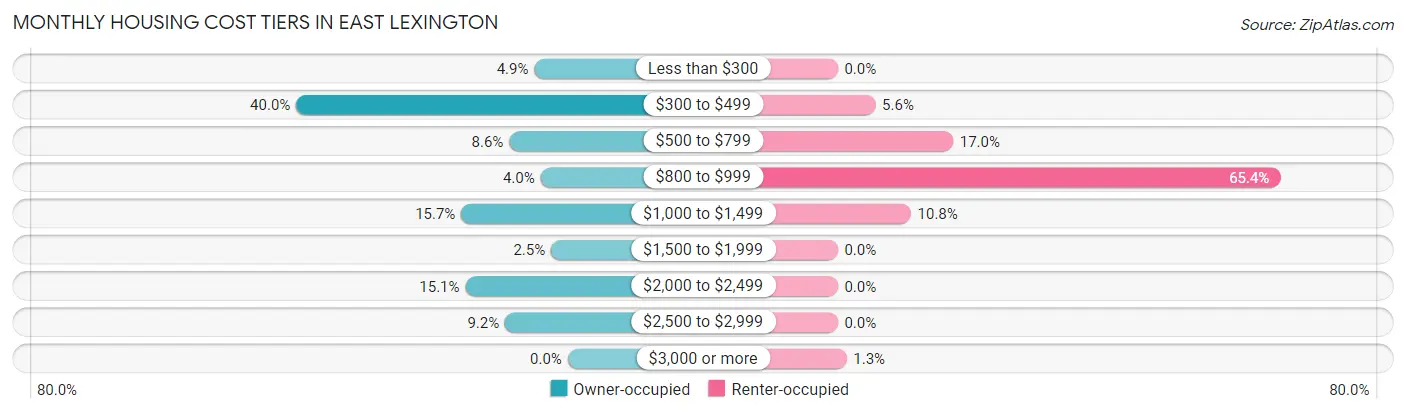
| Monthly Cost | Owner-occupied | Renter-occupied |
| Less than $300 | 16 (4.9%) | 0 (0.0%) |
| $300 to $499 | 130 (40.0%) | 17 (5.6%) |
| $500 to $799 | 28 (8.6%) | 52 (17.0%) |
| $800 to $999 | 13 (4.0%) | 200 (65.4%) |
| $1,000 to $1,499 | 51 (15.7%) | 33 (10.8%) |
| $1,500 to $1,999 | 8 (2.5%) | 0 (0.0%) |
| $2,000 to $2,499 | 49 (15.1%) | 0 (0.0%) |
| $2,500 to $2,999 | 30 (9.2%) | 0 (0.0%) |
| $3,000 or more | 0 (0.0%) | 4 (1.3%) |
| Total | 325 (100.0%) | 306 (100.0%) |
Physical Housing Characteristics in East Lexington
Housing Structures in East Lexington
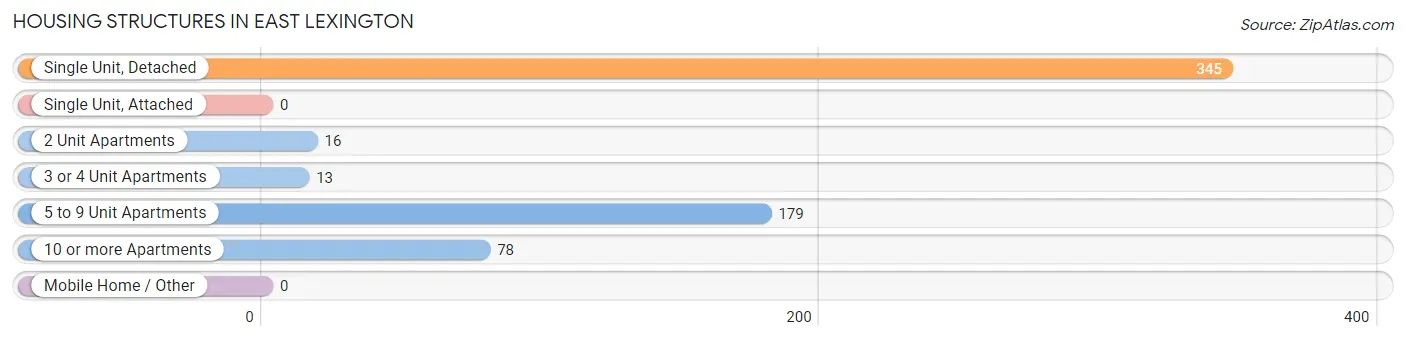
| Structure Type | # Housing Units | % Housing Units |
| Single Unit, Detached | 345 | 54.7% |
| Single Unit, Attached | 0 | 0.0% |
| 2 Unit Apartments | 16 | 2.5% |
| 3 or 4 Unit Apartments | 13 | 2.1% |
| 5 to 9 Unit Apartments | 179 | 28.4% |
| 10 or more Apartments | 78 | 12.4% |
| Mobile Home / Other | 0 | 0.0% |
| Total | 631 | 100.0% |
Housing Structures by Occupancy in East Lexington
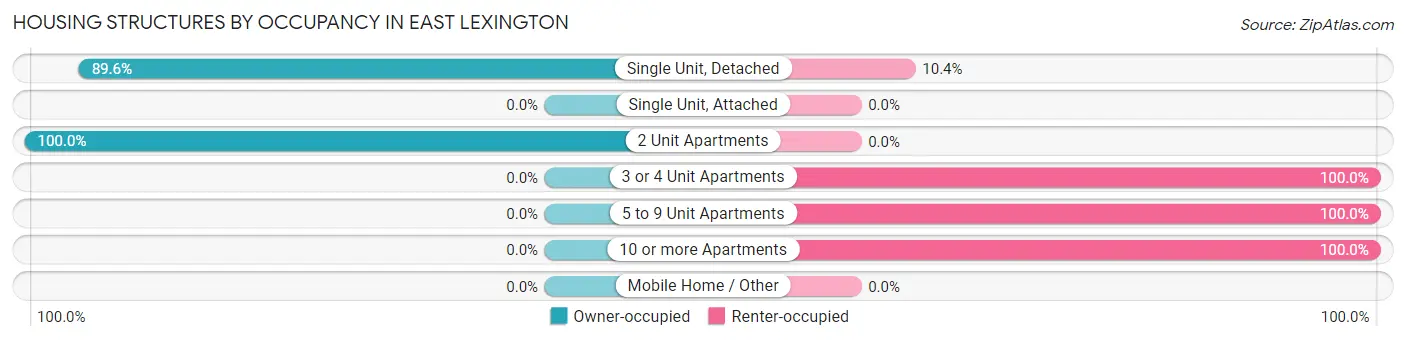
| Structure Type | Owner-occupied | Renter-occupied |
| Single Unit, Detached | 309 (89.6%) | 36 (10.4%) |
| Single Unit, Attached | 0 (0.0%) | 0 (0.0%) |
| 2 Unit Apartments | 16 (100.0%) | 0 (0.0%) |
| 3 or 4 Unit Apartments | 0 (0.0%) | 13 (100.0%) |
| 5 to 9 Unit Apartments | 0 (0.0%) | 179 (100.0%) |
| 10 or more Apartments | 0 (0.0%) | 78 (100.0%) |
| Mobile Home / Other | 0 (0.0%) | 0 (0.0%) |
| Total | 325 (51.5%) | 306 (48.5%) |
Housing Structures by Number of Rooms in East Lexington
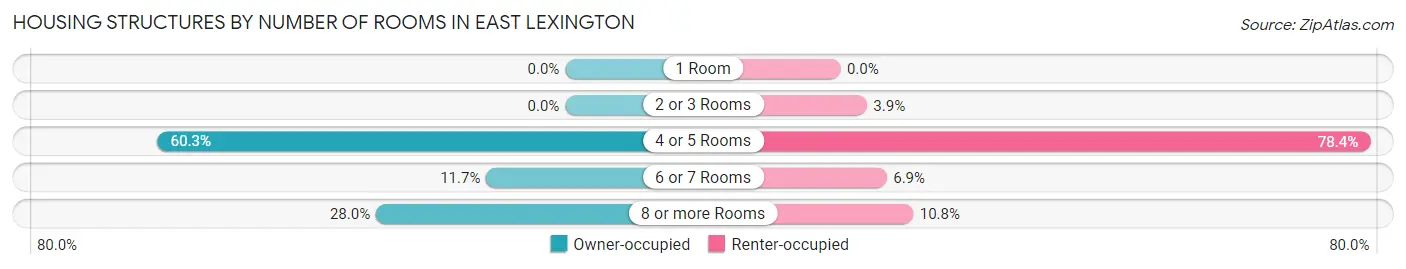
| Number of Rooms | Owner-occupied | Renter-occupied |
| 1 Room | 0 (0.0%) | 0 (0.0%) |
| 2 or 3 Rooms | 0 (0.0%) | 12 (3.9%) |
| 4 or 5 Rooms | 196 (60.3%) | 240 (78.4%) |
| 6 or 7 Rooms | 38 (11.7%) | 21 (6.9%) |
| 8 or more Rooms | 91 (28.0%) | 33 (10.8%) |
| Total | 325 (100.0%) | 306 (100.0%) |
Housing Structure by Heating Type in East Lexington
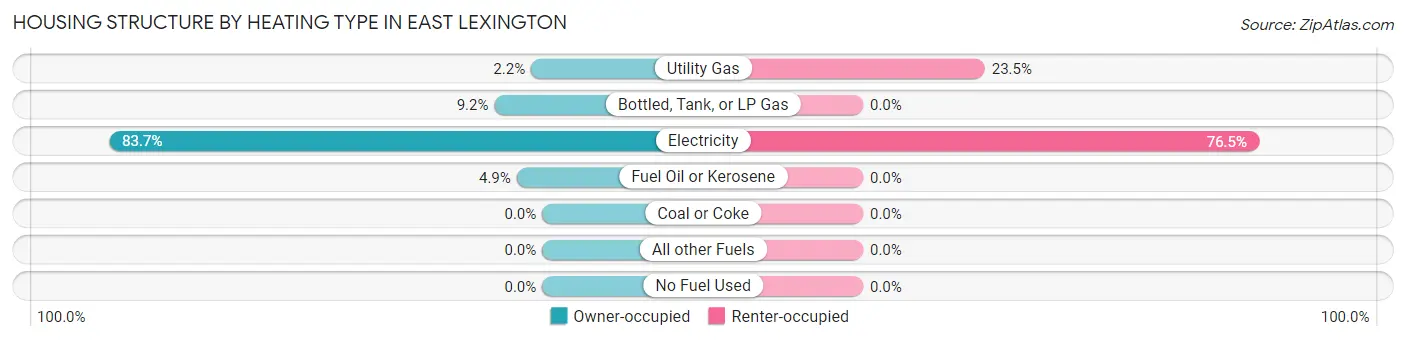
| Heating Type | Owner-occupied | Renter-occupied |
| Utility Gas | 7 (2.1%) | 72 (23.5%) |
| Bottled, Tank, or LP Gas | 30 (9.2%) | 0 (0.0%) |
| Electricity | 272 (83.7%) | 234 (76.5%) |
| Fuel Oil or Kerosene | 16 (4.9%) | 0 (0.0%) |
| Coal or Coke | 0 (0.0%) | 0 (0.0%) |
| All other Fuels | 0 (0.0%) | 0 (0.0%) |
| No Fuel Used | 0 (0.0%) | 0 (0.0%) |
| Total | 325 (100.0%) | 306 (100.0%) |
Household Vehicle Usage in East Lexington
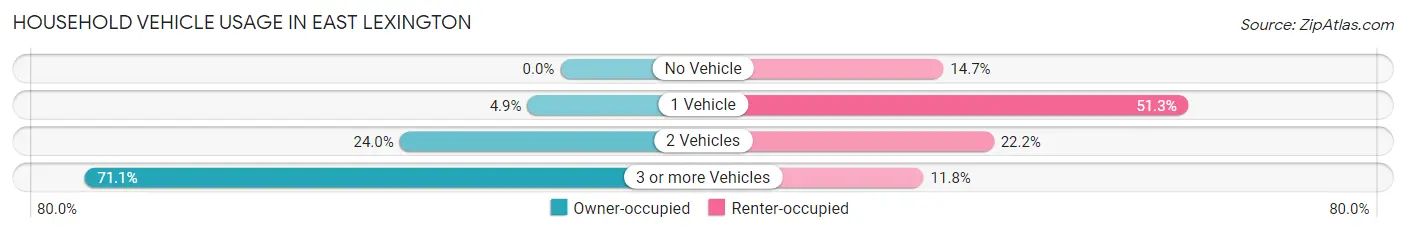
| Vehicles per Household | Owner-occupied | Renter-occupied |
| No Vehicle | 0 (0.0%) | 45 (14.7%) |
| 1 Vehicle | 16 (4.9%) | 157 (51.3%) |
| 2 Vehicles | 78 (24.0%) | 68 (22.2%) |
| 3 or more Vehicles | 231 (71.1%) | 36 (11.8%) |
| Total | 325 (100.0%) | 306 (100.0%) |
Real Estate & Mortgages in East Lexington
Real Estate and Mortgage Overview in East Lexington
| Characteristic | Without Mortgage | With Mortgage |
| Housing Units | 181 | 144 |
| Median Property Value | $232,700 | $294,300 |
| Median Household Income | $31,985 | $52 |
| Monthly Housing Costs | $333 | $0 |
| Real Estate Taxes | $1,287 | $6 |
Property Value by Mortgage Status in East Lexington
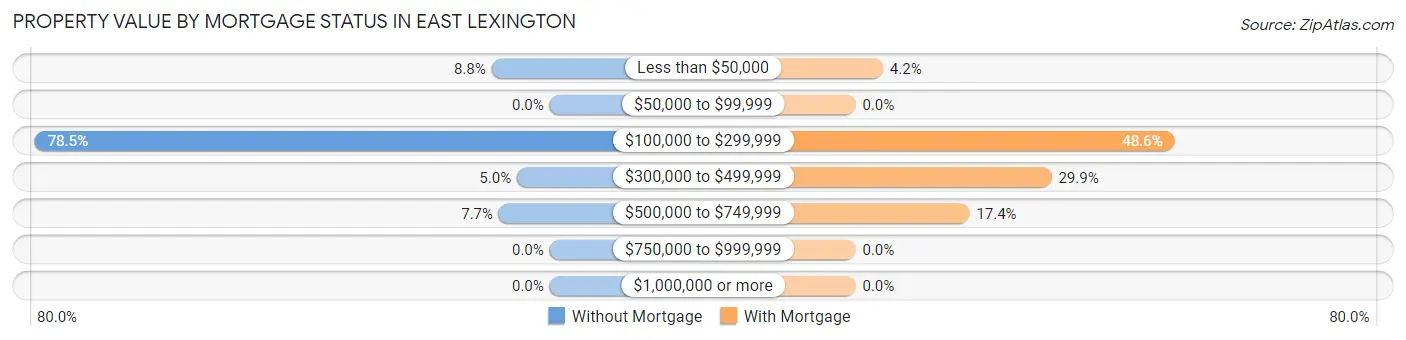
| Property Value | Without Mortgage | With Mortgage |
| Less than $50,000 | 16 (8.8%) | 6 (4.2%) |
| $50,000 to $99,999 | 0 (0.0%) | 0 (0.0%) |
| $100,000 to $299,999 | 142 (78.4%) | 70 (48.6%) |
| $300,000 to $499,999 | 9 (5.0%) | 43 (29.9%) |
| $500,000 to $749,999 | 14 (7.7%) | 25 (17.4%) |
| $750,000 to $999,999 | 0 (0.0%) | 0 (0.0%) |
| $1,000,000 or more | 0 (0.0%) | 0 (0.0%) |
| Total | 181 (100.0%) | 144 (100.0%) |
Household Income by Mortgage Status in East Lexington
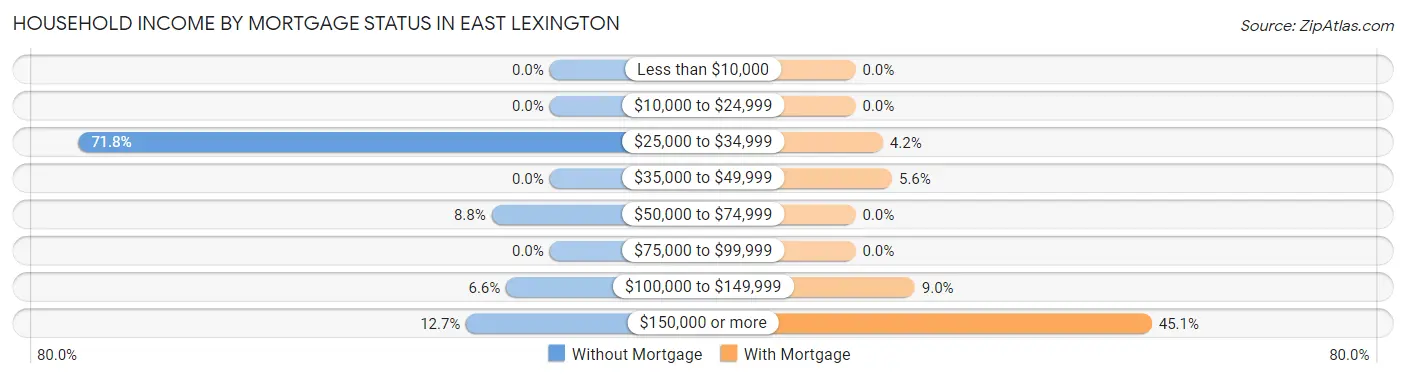
| Household Income | Without Mortgage | With Mortgage |
| Less than $10,000 | 0 (0.0%) | 0 (0.0%) |
| $10,000 to $24,999 | 0 (0.0%) | 0 (0.0%) |
| $25,000 to $34,999 | 130 (71.8%) | 6 (4.2%) |
| $35,000 to $49,999 | 0 (0.0%) | 8 (5.6%) |
| $50,000 to $74,999 | 16 (8.8%) | 0 (0.0%) |
| $75,000 to $99,999 | 0 (0.0%) | 0 (0.0%) |
| $100,000 to $149,999 | 12 (6.6%) | 13 (9.0%) |
| $150,000 or more | 23 (12.7%) | 65 (45.1%) |
| Total | 181 (100.0%) | 144 (100.0%) |
Property Value to Household Income Ratio in East Lexington
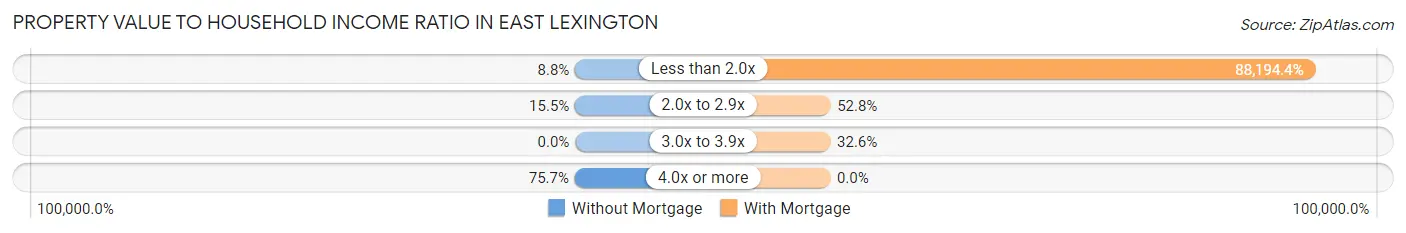
| Value-to-Income Ratio | Without Mortgage | With Mortgage |
| Less than 2.0x | 16 (8.8%) | 127,000 (88,194.4%) |
| 2.0x to 2.9x | 28 (15.5%) | 76 (52.8%) |
| 3.0x to 3.9x | 0 (0.0%) | 47 (32.6%) |
| 4.0x or more | 137 (75.7%) | 0 (0.0%) |
| Total | 181 (100.0%) | 144 (100.0%) |
Real Estate Taxes by Mortgage Status in East Lexington
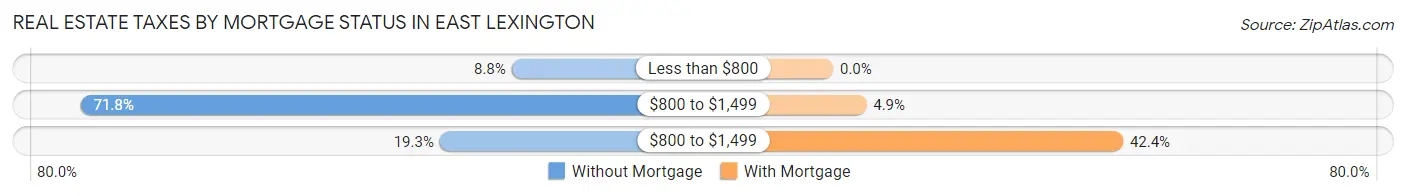
| Property Taxes | Without Mortgage | With Mortgage |
| Less than $800 | 16 (8.8%) | 0 (0.0%) |
| $800 to $1,499 | 130 (71.8%) | 7 (4.9%) |
| $800 to $1,499 | 35 (19.3%) | 61 (42.4%) |
| Total | 181 (100.0%) | 144 (100.0%) |
Health & Disability in East Lexington
Health Insurance Coverage by Age in East Lexington
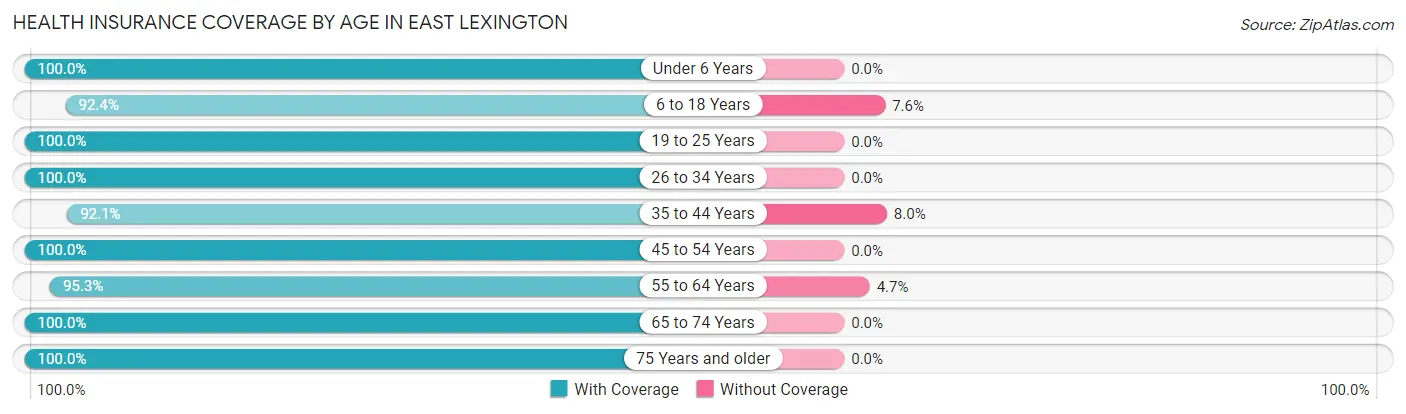
| Age Bracket | With Coverage | Without Coverage |
| Under 6 Years | 137 (100.0%) | 0 (0.0%) |
| 6 to 18 Years | 327 (92.4%) | 27 (7.6%) |
| 19 to 25 Years | 237 (100.0%) | 0 (0.0%) |
| 26 to 34 Years | 132 (100.0%) | 0 (0.0%) |
| 35 to 44 Years | 359 (92.0%) | 31 (8.0%) |
| 45 to 54 Years | 177 (100.0%) | 0 (0.0%) |
| 55 to 64 Years | 241 (95.3%) | 12 (4.7%) |
| 65 to 74 Years | 194 (100.0%) | 0 (0.0%) |
| 75 Years and older | 59 (100.0%) | 0 (0.0%) |
| Total | 1,863 (96.4%) | 70 (3.6%) |
Health Insurance Coverage by Citizenship Status in East Lexington
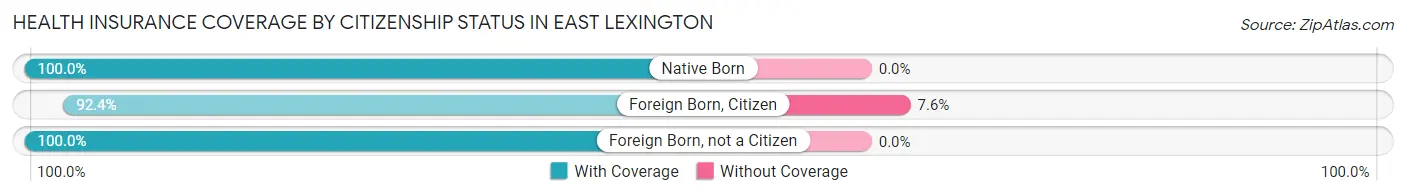
| Citizenship Status | With Coverage | Without Coverage |
| Native Born | 137 (100.0%) | 0 (0.0%) |
| Foreign Born, Citizen | 327 (92.4%) | 27 (7.6%) |
| Foreign Born, not a Citizen | 237 (100.0%) | 0 (0.0%) |
Health Insurance Coverage by Household Income in East Lexington
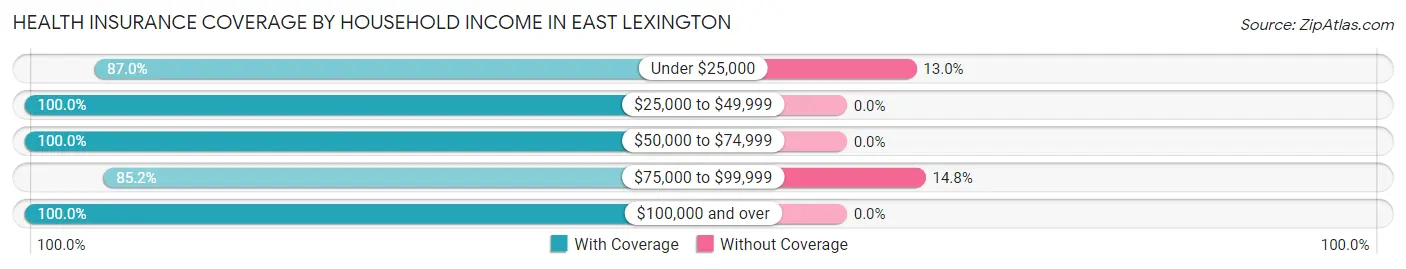
| Household Income | With Coverage | Without Coverage |
| Under $25,000 | 80 (87.0%) | 12 (13.0%) |
| $25,000 to $49,999 | 500 (100.0%) | 0 (0.0%) |
| $50,000 to $74,999 | 158 (100.0%) | 0 (0.0%) |
| $75,000 to $99,999 | 335 (85.2%) | 58 (14.8%) |
| $100,000 and over | 790 (100.0%) | 0 (0.0%) |
Public vs Private Health Insurance Coverage by Age in East Lexington
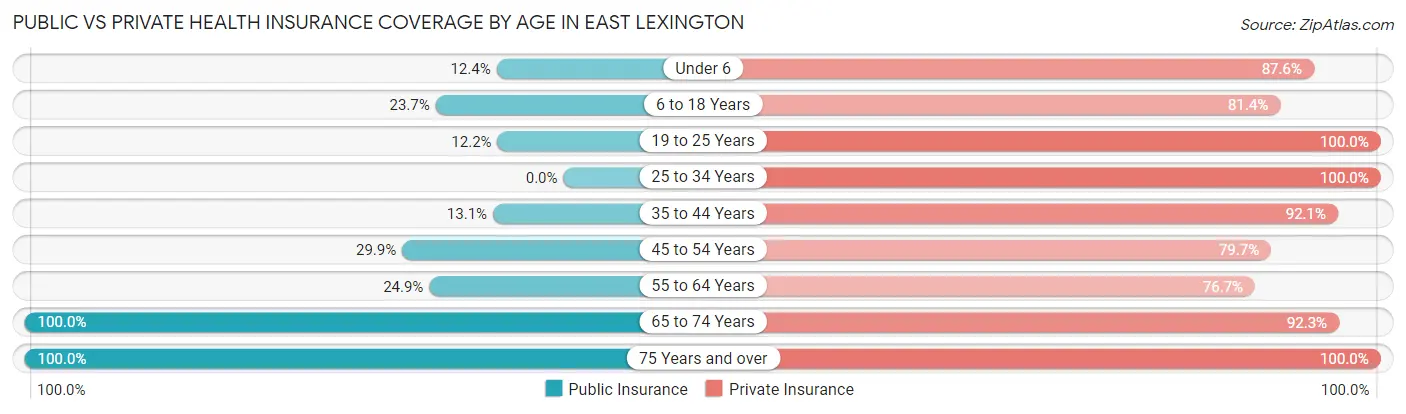
| Age Bracket | Public Insurance | Private Insurance |
| Under 6 | 17 (12.4%) | 120 (87.6%) |
| 6 to 18 Years | 84 (23.7%) | 288 (81.4%) |
| 19 to 25 Years | 29 (12.2%) | 237 (100.0%) |
| 25 to 34 Years | 0 (0.0%) | 132 (100.0%) |
| 35 to 44 Years | 51 (13.1%) | 359 (92.0%) |
| 45 to 54 Years | 53 (29.9%) | 141 (79.7%) |
| 55 to 64 Years | 63 (24.9%) | 194 (76.7%) |
| 65 to 74 Years | 194 (100.0%) | 179 (92.3%) |
| 75 Years and over | 59 (100.0%) | 59 (100.0%) |
| Total | 550 (28.4%) | 1,709 (88.4%) |
Disability Status by Sex by Age in East Lexington
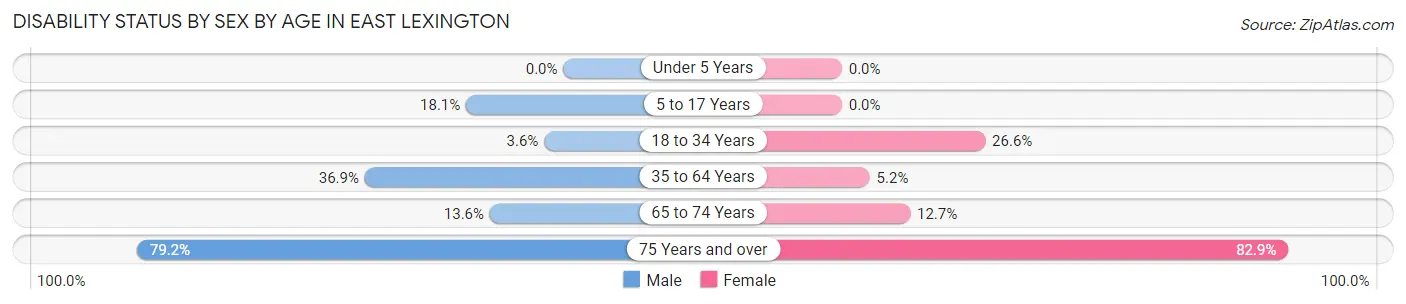
| Age Bracket | Male | Female |
| Under 5 Years | 0 (0.0%) | 0 (0.0%) |
| 5 to 17 Years | 37 (18.0%) | 0 (0.0%) |
| 18 to 34 Years | 10 (3.6%) | 29 (26.6%) |
| 35 to 64 Years | 181 (36.9%) | 17 (5.2%) |
| 65 to 74 Years | 6 (13.6%) | 19 (12.7%) |
| 75 Years and over | 19 (79.2%) | 29 (82.9%) |
Disability Class by Sex by Age in East Lexington
Disability Class: Hearing Difficulty
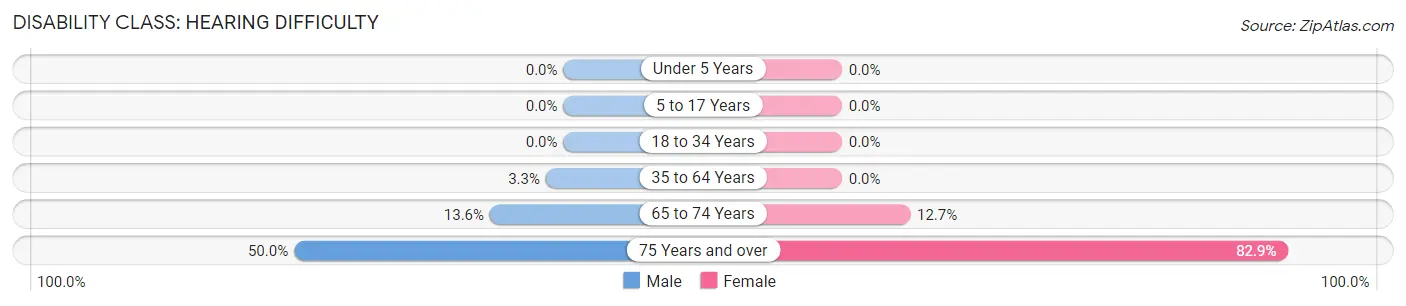
| Age Bracket | Male | Female |
| Under 5 Years | 0 (0.0%) | 0 (0.0%) |
| 5 to 17 Years | 0 (0.0%) | 0 (0.0%) |
| 18 to 34 Years | 0 (0.0%) | 0 (0.0%) |
| 35 to 64 Years | 16 (3.3%) | 0 (0.0%) |
| 65 to 74 Years | 6 (13.6%) | 19 (12.7%) |
| 75 Years and over | 12 (50.0%) | 29 (82.9%) |
Disability Class: Vision Difficulty
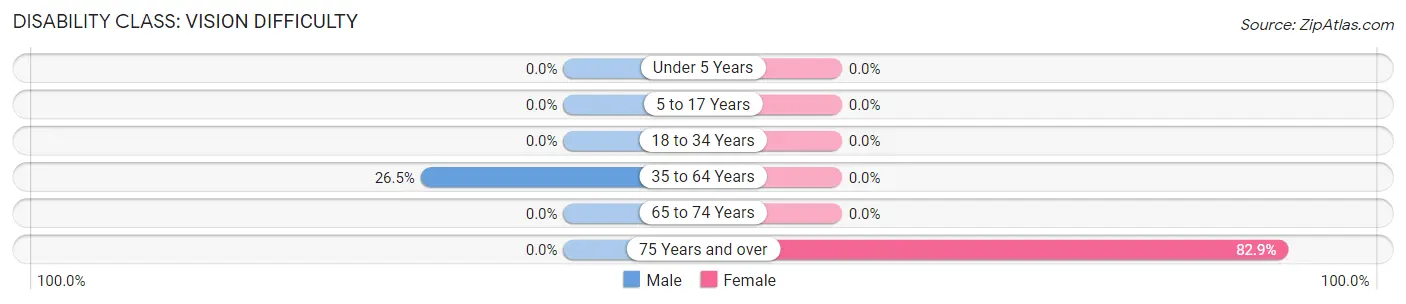
| Age Bracket | Male | Female |
| Under 5 Years | 0 (0.0%) | 0 (0.0%) |
| 5 to 17 Years | 0 (0.0%) | 0 (0.0%) |
| 18 to 34 Years | 0 (0.0%) | 0 (0.0%) |
| 35 to 64 Years | 130 (26.5%) | 0 (0.0%) |
| 65 to 74 Years | 0 (0.0%) | 0 (0.0%) |
| 75 Years and over | 0 (0.0%) | 29 (82.9%) |
Disability Class: Cognitive Difficulty
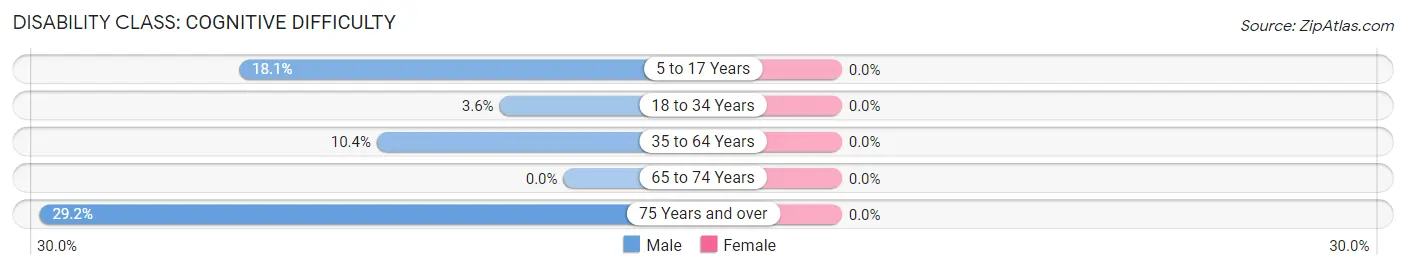
| Age Bracket | Male | Female |
| 5 to 17 Years | 37 (18.0%) | 0 (0.0%) |
| 18 to 34 Years | 10 (3.6%) | 0 (0.0%) |
| 35 to 64 Years | 51 (10.4%) | 0 (0.0%) |
| 65 to 74 Years | 0 (0.0%) | 0 (0.0%) |
| 75 Years and over | 7 (29.2%) | 0 (0.0%) |
Disability Class: Ambulatory Difficulty
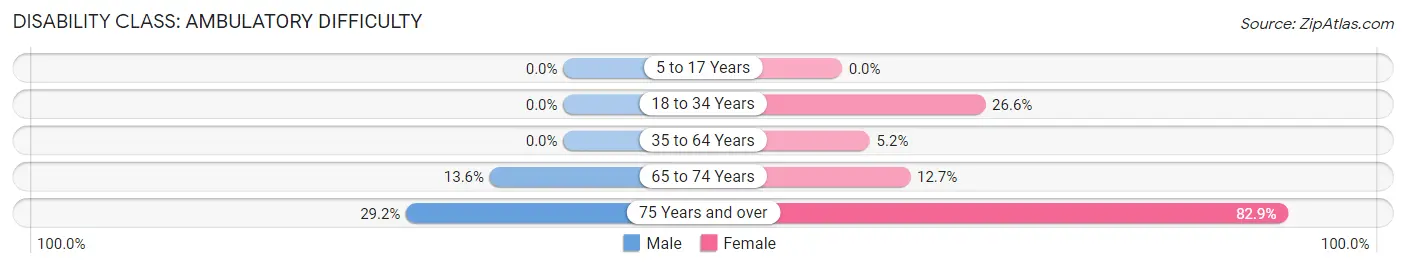
| Age Bracket | Male | Female |
| 5 to 17 Years | 0 (0.0%) | 0 (0.0%) |
| 18 to 34 Years | 0 (0.0%) | 29 (26.6%) |
| 35 to 64 Years | 0 (0.0%) | 17 (5.2%) |
| 65 to 74 Years | 6 (13.6%) | 19 (12.7%) |
| 75 Years and over | 7 (29.2%) | 29 (82.9%) |
Disability Class: Self-Care Difficulty
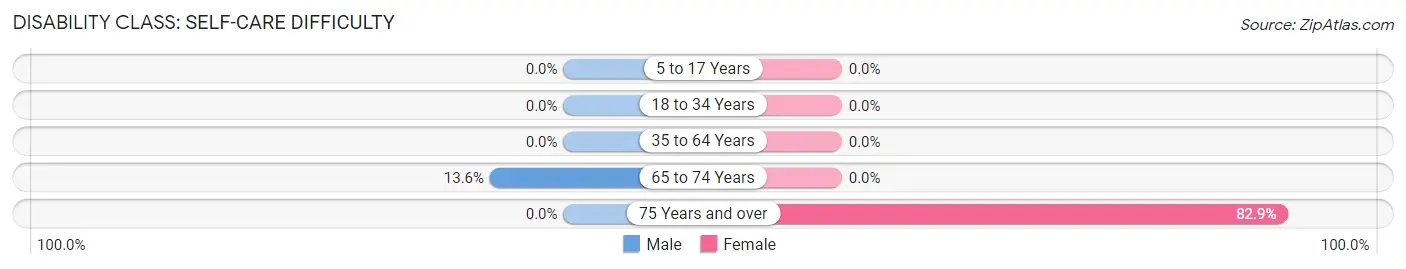
| Age Bracket | Male | Female |
| 5 to 17 Years | 0 (0.0%) | 0 (0.0%) |
| 18 to 34 Years | 0 (0.0%) | 0 (0.0%) |
| 35 to 64 Years | 0 (0.0%) | 0 (0.0%) |
| 65 to 74 Years | 6 (13.6%) | 0 (0.0%) |
| 75 Years and over | 0 (0.0%) | 29 (82.9%) |
Technology Access in East Lexington
Computing Device Access in East Lexington
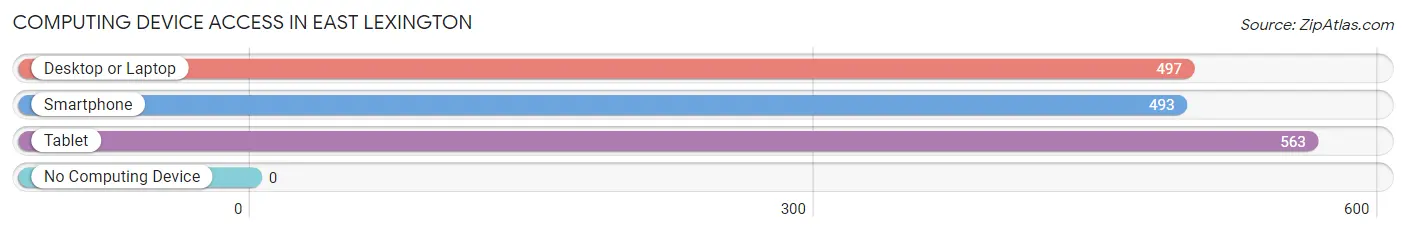
| Device Type | # Households | % Households |
| Desktop or Laptop | 497 | 78.8% |
| Smartphone | 493 | 78.1% |
| Tablet | 563 | 89.2% |
| No Computing Device | 0 | 0.0% |
| Total | 631 | 100.0% |
Internet Access in East Lexington
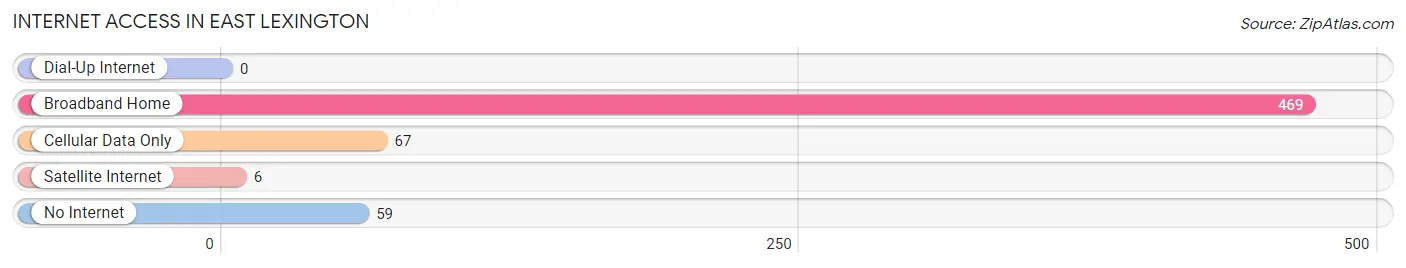
| Internet Type | # Households | % Households |
| Dial-Up Internet | 0 | 0.0% |
| Broadband Home | 469 | 74.3% |
| Cellular Data Only | 67 | 10.6% |
| Satellite Internet | 6 | 0.9% |
| No Internet | 59 | 9.3% |
| Total | 631 | 100.0% |
East Lexington Summary
Lexington is a small town located in Rockbridge County, Virginia. It is situated in the Shenandoah Valley, approximately 20 miles north of Roanoke and about 50 miles south of Charlottesville. The town is known for its historic downtown, which is home to a variety of shops, restaurants, and other businesses. Lexington is also home to Washington and Lee University, a private liberal arts college.
History
The area that is now Lexington was first settled in the late 1700s by German and Scots-Irish immigrants. The town was originally known as “Staunton”, after the nearby town of Staunton, Virginia. In 1778, the town was renamed “Lexington” in honor of the Battle of Lexington, which had taken place in Massachusetts in 1775.
In the early 1800s, Lexington became a center of education and culture. The town was home to several schools, including the Virginia Military Institute (VMI) and Washington and Lee University. In addition, the town was home to several prominent figures, including Robert E. Lee, who served as president of Washington and Lee University from 1865 to 1870.
Geography
Lexington is located in the Shenandoah Valley, approximately 20 miles north of Roanoke and about 50 miles south of Charlottesville. The town is situated at the confluence of the Maury and North Rivers, which form the James River. The town is surrounded by the Blue Ridge Mountains to the east and the Allegheny Mountains to the west.
The climate in Lexington is temperate, with hot summers and cold winters. The average annual temperature is around 55 degrees Fahrenheit. The town receives an average of 43 inches of precipitation per year, with most of it falling in the form of rain.
Economy
The economy of Lexington is largely based on education, tourism, and agriculture. Washington and Lee University is the largest employer in the town, providing jobs for faculty, staff, and students. The university also attracts a large number of visitors to the town, which helps to support the local economy.
Agriculture is also an important part of the local economy. The area is home to several farms, which produce a variety of crops, including corn, soybeans, wheat, and hay. In addition, the area is home to several wineries, which produce a variety of wines.
Demographics
As of the 2010 census, the population of Lexington was 7,042. The town is predominantly white, with a small African American population. The median household income in the town is $45,000, and the median home value is $200,000. The town has a low unemployment rate of 3.7%.
Conclusion
Lexington is a small town located in Rockbridge County, Virginia. It is situated in the Shenandoah Valley, approximately 20 miles north of Roanoke and about 50 miles south of Charlottesville. The town is known for its historic downtown, which is home to a variety of shops, restaurants, and other businesses. Lexington is also home to Washington and Lee University, a private liberal arts college. The economy of Lexington is largely based on education, tourism, and agriculture. The town has a population of 7,042, with a median household income of $45,000 and a median home value of $200,000.
Common Questions
What is Per Capita Income in East Lexington?
Per Capita income in East Lexington is $27,716.
What is the Median Family Income in East Lexington?
Median Family Income in East Lexington is $76,411.
What is the Median Household income in East Lexington?
Median Household Income in East Lexington is $75,470.
What is Income or Wage Gap in East Lexington?
Income or Wage Gap in East Lexington is 28.0%.
Women in East Lexington earn 72.0 cents for every dollar earned by a man.
What is Inequality or Gini Index in East Lexington?
Inequality or Gini Index in East Lexington is 0.38.
What is the Total Population of East Lexington?
Total Population of East Lexington is 2,034.
What is the Total Male Population of East Lexington?
Total Male Population of East Lexington is 1,145.
What is the Total Female Population of East Lexington?
Total Female Population of East Lexington is 889.
What is the Ratio of Males per 100 Females in East Lexington?
There are 128.80 Males per 100 Females in East Lexington.
What is the Ratio of Females per 100 Males in East Lexington?
There are 77.64 Females per 100 Males in East Lexington.
What is the Median Population Age in East Lexington?
Median Population Age in East Lexington is 39.6 Years.
What is the Average Family Size in East Lexington
Average Family Size in East Lexington is 3.0 People.
What is the Average Household Size in East Lexington
Average Household Size in East Lexington is 3.1 People.
How Large is the Labor Force in East Lexington?
There are 844 People in the Labor Forcein in East Lexington.
What is the Percentage of People in the Labor Force in East Lexington?
52.5% of People are in the Labor Force in East Lexington.