Chamberlayne, VA Map & Demographics
Chamberlayne Map
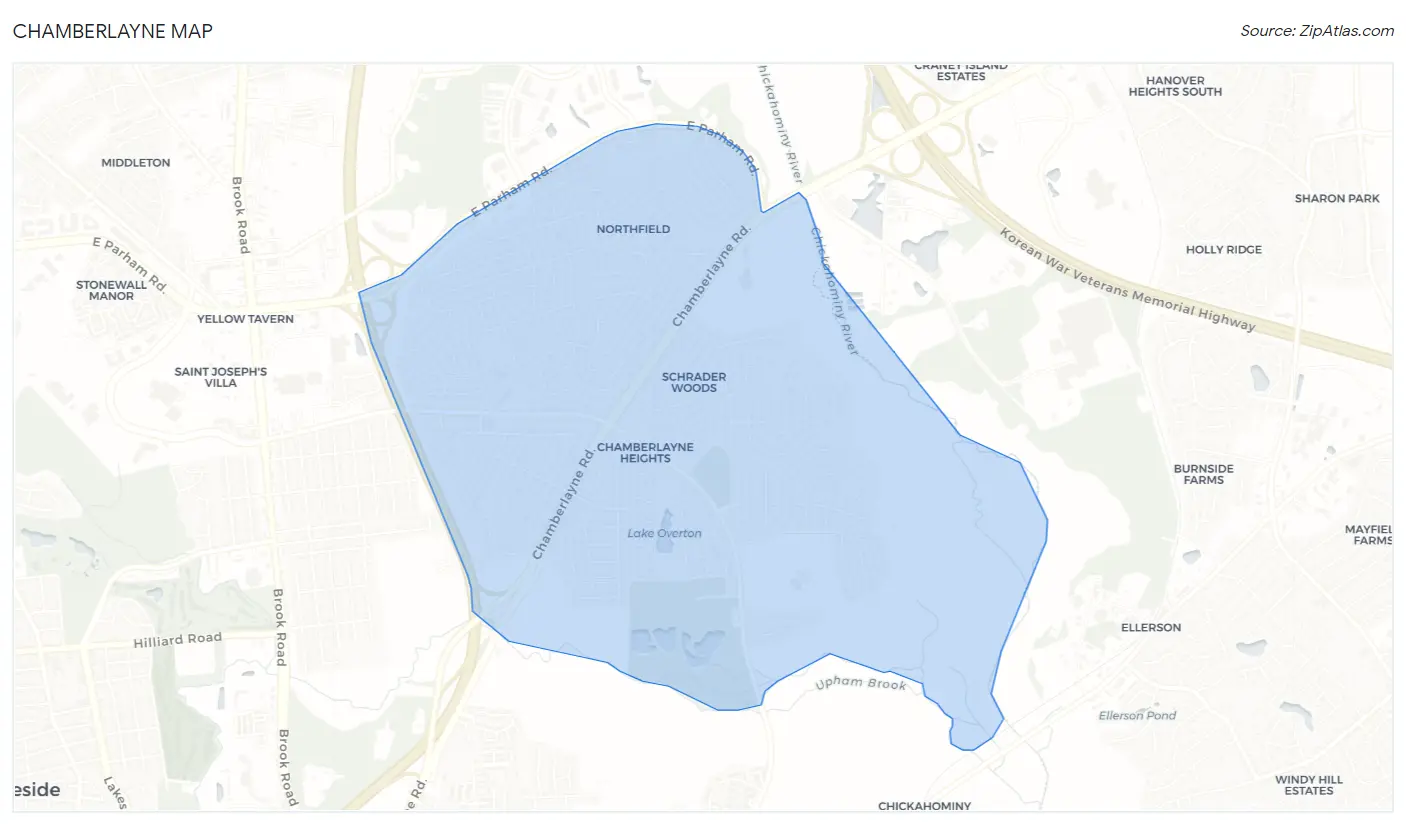
Chamberlayne Overview
$49,125
PER CAPITA INCOME
$112,625
AVG FAMILY INCOME
$90,127
AVG HOUSEHOLD INCOME
15.7%
WAGE / INCOME GAP [ % ]
84.3¢/ $1
WAGE / INCOME GAP [ $ ]
0.39
INEQUALITY / GINI INDEX
4,965
TOTAL POPULATION
2,246
MALE POPULATION
2,719
FEMALE POPULATION
82.60
MALES / 100 FEMALES
121.06
FEMALES / 100 MALES
55.4
MEDIAN AGE
2.9
AVG FAMILY SIZE
2.4
AVG HOUSEHOLD SIZE
2,772
LABOR FORCE [ PEOPLE ]
60.2%
PERCENT IN LABOR FORCE
7.2%
UNEMPLOYMENT RATE
Income in Chamberlayne
Income Overview in Chamberlayne
Per Capita Income in Chamberlayne is $49,125, while median incomes of families and households are $112,625 and $90,127 respectively.
| Characteristic | Number | Measure |
| Per Capita Income | 4,965 | $49,125 |
| Median Family Income | 1,455 | $112,625 |
| Mean Family Income | 1,455 | $118,775 |
| Median Household Income | 2,082 | $90,127 |
| Mean Household Income | 2,082 | $113,323 |
| Income Deficit | 1,455 | $0 |
| Wage / Income Gap (%) | 4,965 | 15.74% |
| Wage / Income Gap ($) | 4,965 | 84.26¢ per $1 |
| Gini / Inequality Index | 4,965 | 0.39 |
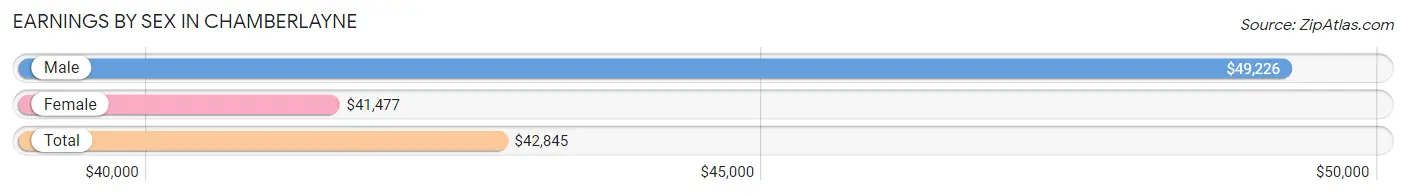
Earnings by Sex in Chamberlayne
Average Earnings in Chamberlayne are $42,845, $49,226 for men and $41,477 for women, a difference of 15.7%.
| Sex | Number | Average Earnings |
| Male | 1,363 (48.6%) | $49,226 |
| Female | 1,441 (51.4%) | $41,477 |
| Total | 2,804 (100.0%) | $42,845 |
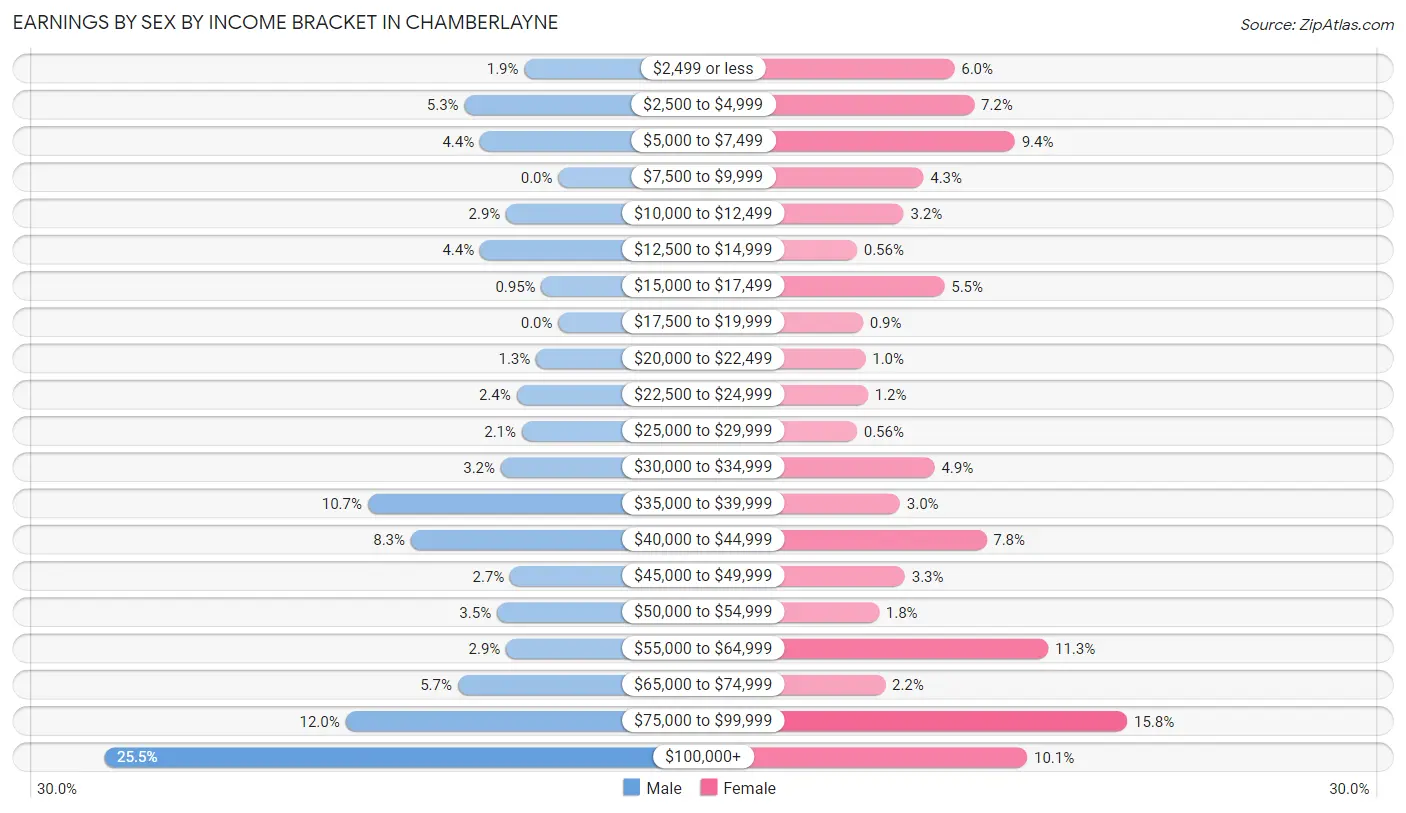
Earnings by Sex by Income Bracket in Chamberlayne
The most common earnings brackets in Chamberlayne are $100,000+ for men (348 | 25.5%) and $75,000 to $99,999 for women (227 | 15.8%).
| Income | Male | Female |
| $2,499 or less | 26 (1.9%) | 87 (6.0%) |
| $2,500 to $4,999 | 72 (5.3%) | 103 (7.1%) |
| $5,000 to $7,499 | 60 (4.4%) | 136 (9.4%) |
| $7,500 to $9,999 | 0 (0.0%) | 62 (4.3%) |
| $10,000 to $12,499 | 40 (2.9%) | 46 (3.2%) |
| $12,500 to $14,999 | 60 (4.4%) | 8 (0.6%) |
| $15,000 to $17,499 | 13 (0.9%) | 79 (5.5%) |
| $17,500 to $19,999 | 0 (0.0%) | 13 (0.9%) |
| $20,000 to $22,499 | 17 (1.3%) | 15 (1.0%) |
| $22,500 to $24,999 | 32 (2.4%) | 17 (1.2%) |
| $25,000 to $29,999 | 28 (2.1%) | 8 (0.6%) |
| $30,000 to $34,999 | 44 (3.2%) | 71 (4.9%) |
| $35,000 to $39,999 | 146 (10.7%) | 43 (3.0%) |
| $40,000 to $44,999 | 113 (8.3%) | 113 (7.8%) |
| $45,000 to $49,999 | 37 (2.7%) | 47 (3.3%) |
| $50,000 to $54,999 | 47 (3.5%) | 26 (1.8%) |
| $55,000 to $64,999 | 40 (2.9%) | 163 (11.3%) |
| $65,000 to $74,999 | 77 (5.7%) | 31 (2.1%) |
| $75,000 to $99,999 | 163 (12.0%) | 227 (15.8%) |
| $100,000+ | 348 (25.5%) | 146 (10.1%) |
| Total | 1,363 (100.0%) | 1,441 (100.0%) |
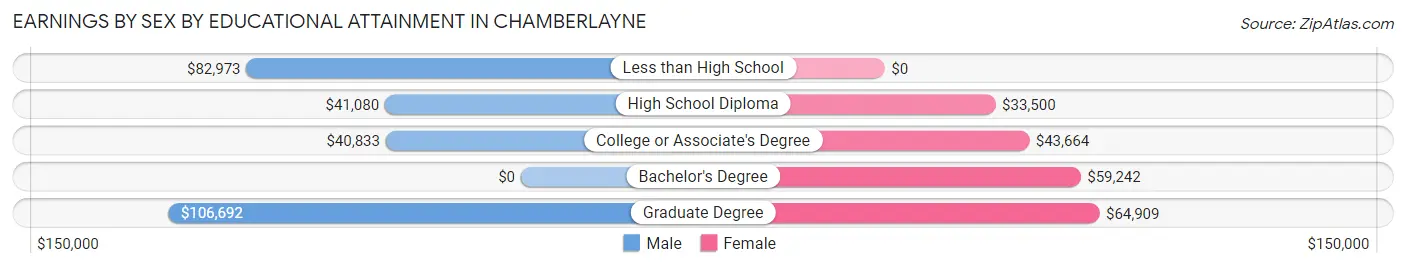
Earnings by Sex by Educational Attainment in Chamberlayne
Average earnings in Chamberlayne are $63,281 for men and $46,330 for women, a difference of 26.8%. Men with an educational attainment of graduate degree enjoy the highest average annual earnings of $106,692, while those with college or associate's degree education earn the least with $40,833. Women with an educational attainment of graduate degree earn the most with the average annual earnings of $64,909, while those with high school diploma education have the smallest earnings of $33,500.
| Educational Attainment | Male Income | Female Income |
| Less than High School | $82,973 | $0 |
| High School Diploma | $41,080 | $33,500 |
| College or Associate's Degree | $40,833 | $43,664 |
| Bachelor's Degree | - | - |
| Graduate Degree | $106,692 | $64,909 |
| Total | $63,281 | $46,330 |
Family Income in Chamberlayne
Family Income Brackets in Chamberlayne
According to the Chamberlayne family income data, there are 372 families falling into the $100,000 to $149,999 income range, which is the most common income bracket and makes up 25.6% of all families.
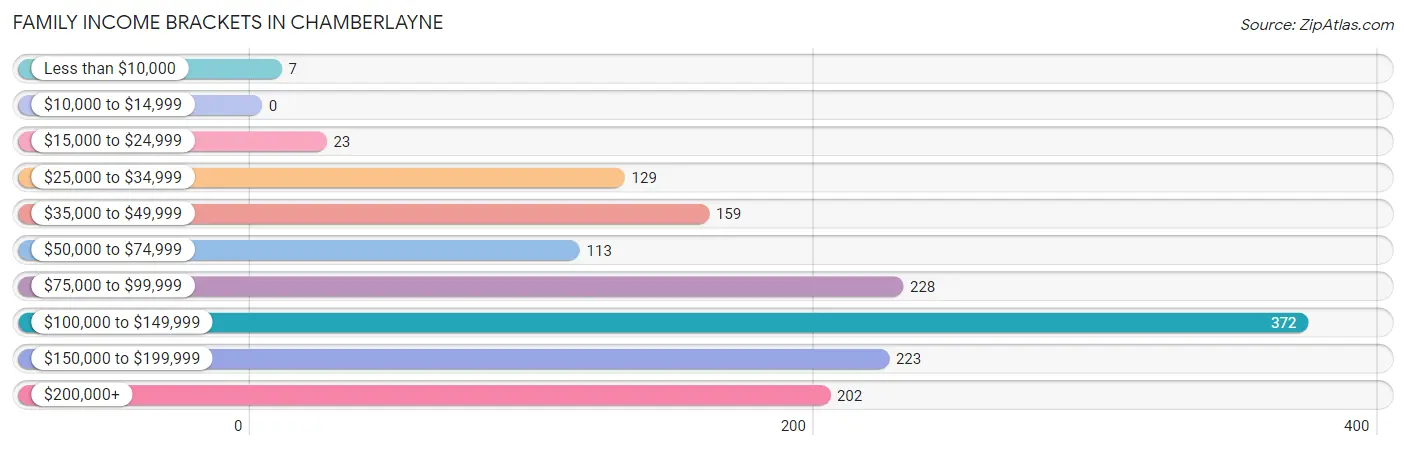
| Income Bracket | # Families | % Families |
| Less than $10,000 | 7 | 0.5% |
| $10,000 to $14,999 | 0 | 0.0% |
| $15,000 to $24,999 | 23 | 1.6% |
| $25,000 to $34,999 | 129 | 8.9% |
| $35,000 to $49,999 | 159 | 10.9% |
| $50,000 to $74,999 | 113 | 7.8% |
| $75,000 to $99,999 | 228 | 15.7% |
| $100,000 to $149,999 | 372 | 25.6% |
| $150,000 to $199,999 | 223 | 15.3% |
| $200,000+ | 202 | 13.9% |
Family Income by Famaliy Size in Chamberlayne
4-person families (182 | 12.5%) account for the highest median family income in Chamberlayne with $143,804 per family, while 2-person families (827 | 56.8%) have the highest median income of $43,696 per family member.
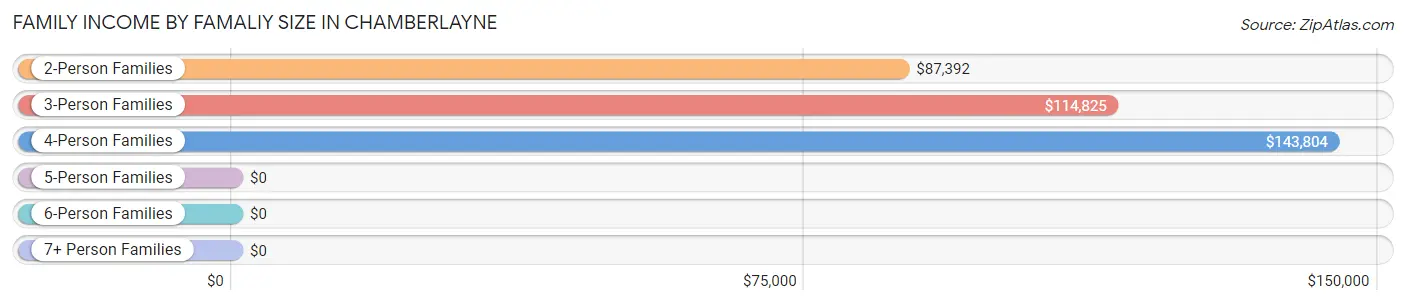
| Income Bracket | # Families | Median Income |
| 2-Person Families | 827 (56.8%) | $87,392 |
| 3-Person Families | 389 (26.7%) | $114,825 |
| 4-Person Families | 182 (12.5%) | $143,804 |
| 5-Person Families | 45 (3.1%) | $0 |
| 6-Person Families | 4 (0.3%) | $0 |
| 7+ Person Families | 8 (0.5%) | $0 |
| Total | 1,455 (100.0%) | $112,625 |
Family Income by Number of Earners in Chamberlayne
The median family income in Chamberlayne is $112,625, with families comprising 3+ earners (149) having the highest median family income of $153,669, while families with no earners (254) have the lowest median family income of $45,000, accounting for 10.2% and 17.5% of families, respectively.
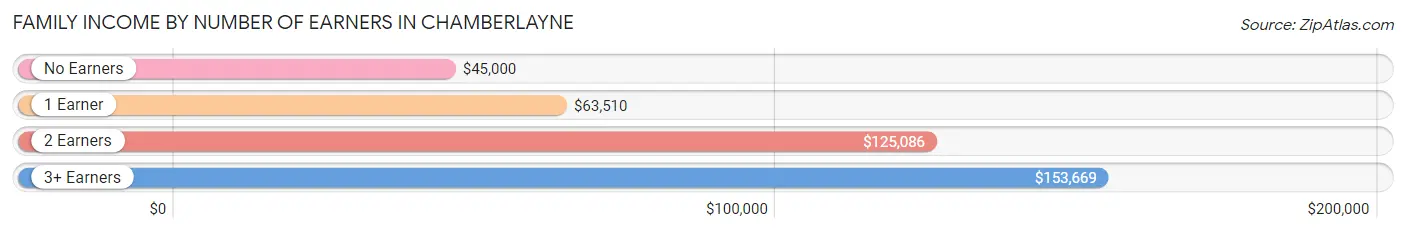
| Number of Earners | # Families | Median Income |
| No Earners | 254 (17.5%) | $45,000 |
| 1 Earner | 354 (24.3%) | $63,510 |
| 2 Earners | 698 (48.0%) | $125,086 |
| 3+ Earners | 149 (10.2%) | $153,669 |
| Total | 1,455 (100.0%) | $112,625 |
Household Income in Chamberlayne
Household Income Brackets in Chamberlayne
With 441 households falling in the category, the $100,000 to $149,999 income range is the most frequent in Chamberlayne, accounting for 21.2% of all households. In contrast, only 10 households (0.5%) fall into the $10,000 to $14,999 income bracket, making it the least populous group.
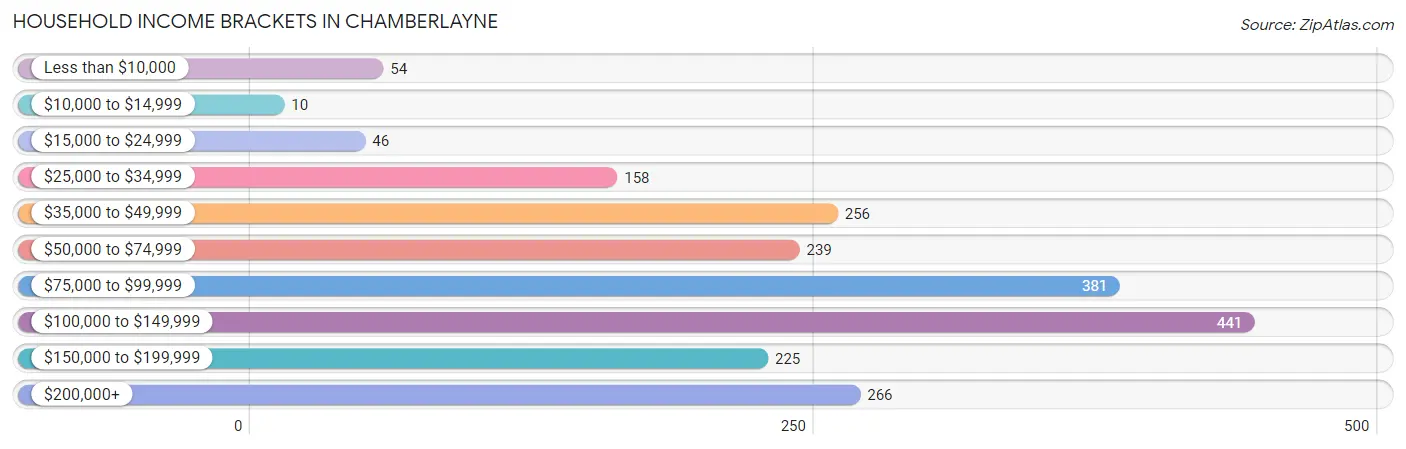
| Income Bracket | # Households | % Households |
| Less than $10,000 | 54 | 2.6% |
| $10,000 to $14,999 | 10 | 0.5% |
| $15,000 to $24,999 | 46 | 2.2% |
| $25,000 to $34,999 | 158 | 7.6% |
| $35,000 to $49,999 | 256 | 12.3% |
| $50,000 to $74,999 | 239 | 11.5% |
| $75,000 to $99,999 | 381 | 18.3% |
| $100,000 to $149,999 | 441 | 21.2% |
| $150,000 to $199,999 | 225 | 10.8% |
| $200,000+ | 266 | 12.8% |
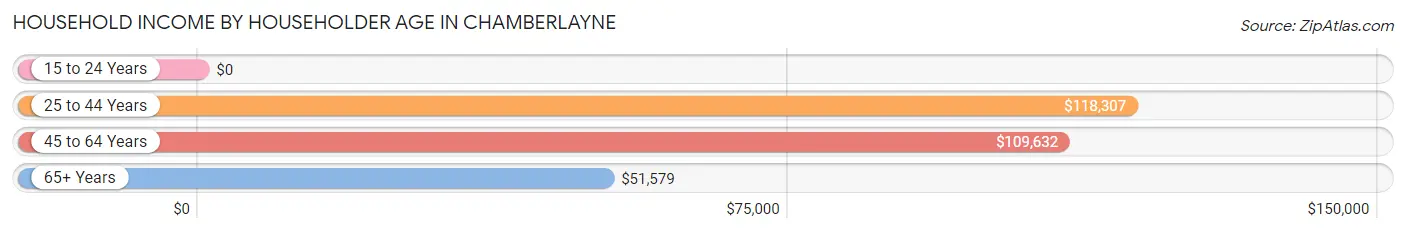
Household Income by Householder Age in Chamberlayne
The median household income in Chamberlayne is $90,127, with the highest median household income of $118,307 found in the 25 to 44 years age bracket for the primary householder. A total of 313 households (15.0%) fall into this category.
| Income Bracket | # Households | Median Income |
| 15 to 24 Years | 0 (0.0%) | $0 |
| 25 to 44 Years | 313 (15.0%) | $118,307 |
| 45 to 64 Years | 939 (45.1%) | $109,632 |
| 65+ Years | 830 (39.9%) | $51,579 |
| Total | 2,082 (100.0%) | $90,127 |
Poverty in Chamberlayne
Income Below Poverty by Sex and Age in Chamberlayne
With 2.7% poverty level for males and 2.8% for females among the residents of Chamberlayne, 25 to 34 year old males and 6 to 11 year old females are the most vulnerable to poverty, with 11 males (5.9%) and 6 females (17.1%) in their respective age groups living below the poverty level.
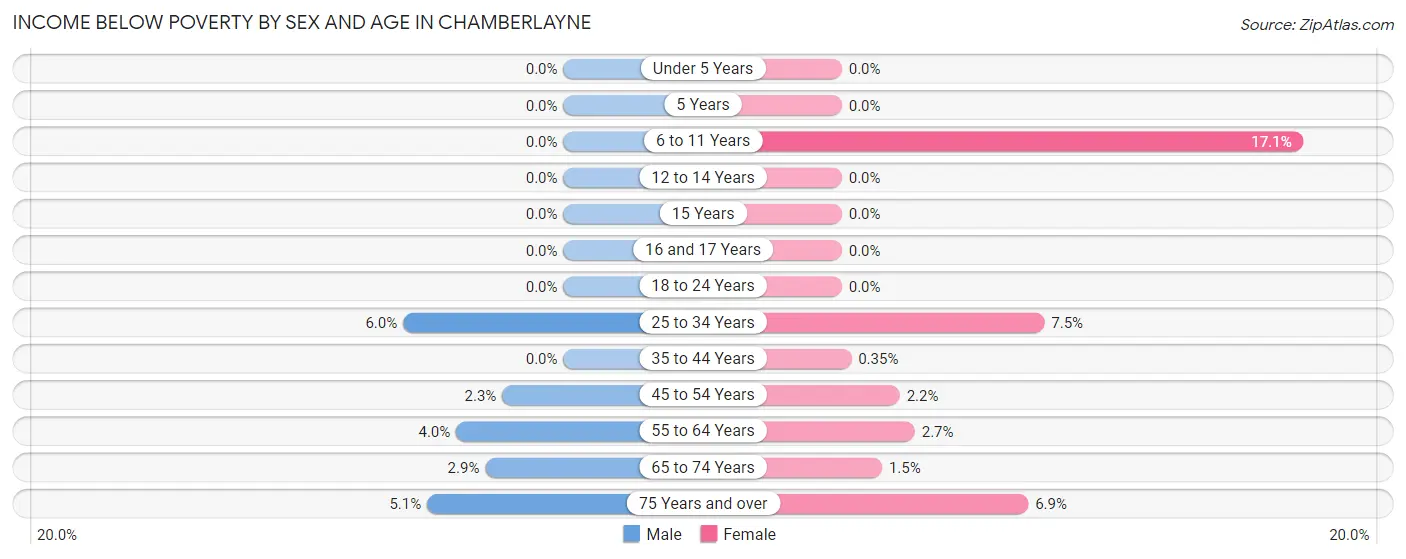
| Age Bracket | Male | Female |
| Under 5 Years | 0 (0.0%) | 0 (0.0%) |
| 5 Years | 0 (0.0%) | 0 (0.0%) |
| 6 to 11 Years | 0 (0.0%) | 6 (17.1%) |
| 12 to 14 Years | 0 (0.0%) | 0 (0.0%) |
| 15 Years | 0 (0.0%) | 0 (0.0%) |
| 16 and 17 Years | 0 (0.0%) | 0 (0.0%) |
| 18 to 24 Years | 0 (0.0%) | 0 (0.0%) |
| 25 to 34 Years | 11 (5.9%) | 10 (7.5%) |
| 35 to 44 Years | 0 (0.0%) | 1 (0.4%) |
| 45 to 54 Years | 7 (2.3%) | 7 (2.1%) |
| 55 to 64 Years | 20 (4.0%) | 19 (2.7%) |
| 65 to 74 Years | 7 (2.9%) | 5 (1.5%) |
| 75 Years and over | 16 (5.1%) | 29 (6.9%) |
| Total | 61 (2.7%) | 77 (2.8%) |
Income Above Poverty by Sex and Age in Chamberlayne
According to the poverty statistics in Chamberlayne, males aged under 5 years and females aged under 5 years are the age groups that are most secure financially, with 100.0% of males and 100.0% of females in these age groups living above the poverty line.
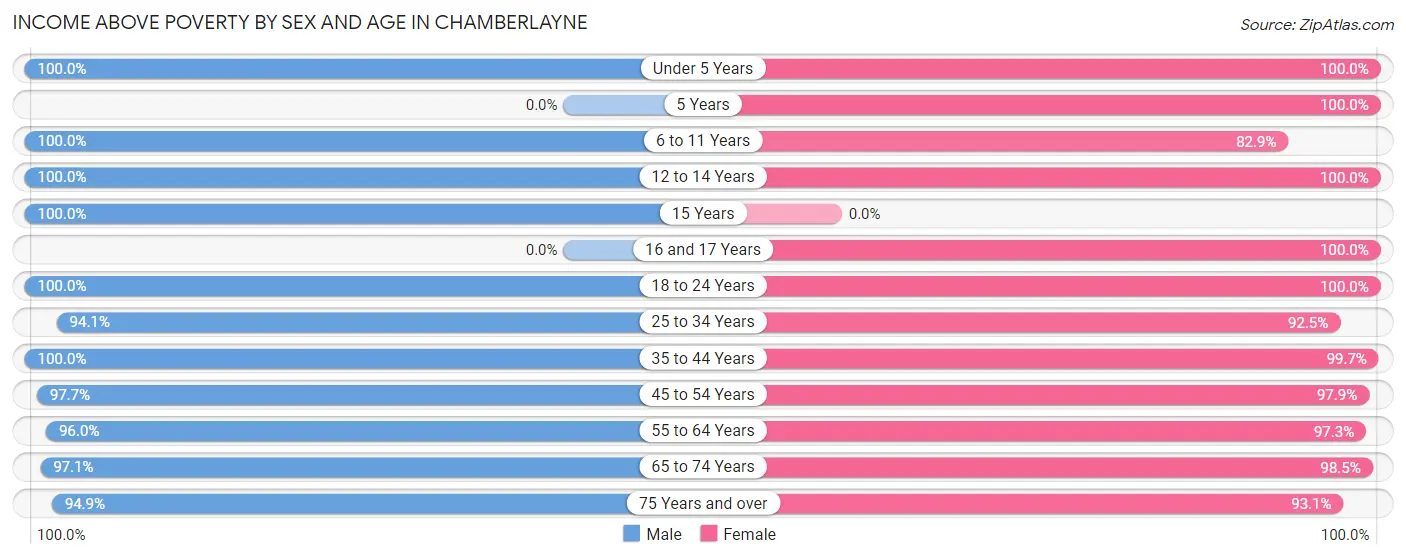
| Age Bracket | Male | Female |
| Under 5 Years | 88 (100.0%) | 40 (100.0%) |
| 5 Years | 0 (0.0%) | 9 (100.0%) |
| 6 to 11 Years | 37 (100.0%) | 29 (82.9%) |
| 12 to 14 Years | 25 (100.0%) | 95 (100.0%) |
| 15 Years | 31 (100.0%) | 0 (0.0%) |
| 16 and 17 Years | 0 (0.0%) | 84 (100.0%) |
| 18 to 24 Years | 241 (100.0%) | 256 (100.0%) |
| 25 to 34 Years | 174 (94.1%) | 123 (92.5%) |
| 35 to 44 Years | 268 (100.0%) | 285 (99.7%) |
| 45 to 54 Years | 301 (97.7%) | 319 (97.9%) |
| 55 to 64 Years | 483 (96.0%) | 682 (97.3%) |
| 65 to 74 Years | 234 (97.1%) | 330 (98.5%) |
| 75 Years and over | 300 (94.9%) | 390 (93.1%) |
| Total | 2,182 (97.3%) | 2,642 (97.2%) |
Income Below Poverty Among Married-Couple Families in Chamberlayne
The poverty statistics for married-couple families in Chamberlayne show that 0.7% or 7 of the total 984 families live below the poverty line. Families with no children have the highest poverty rate of 0.9%, comprising of 7 families. On the other hand, families with 1 or 2 children have the lowest poverty rate of 0.0%, which includes 0 families.
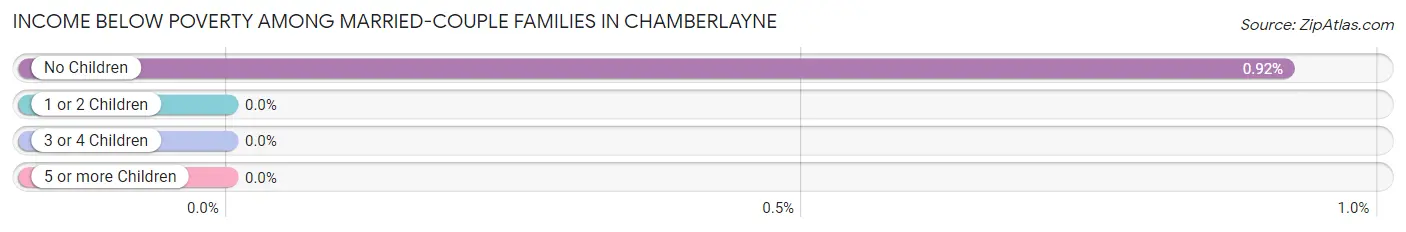
| Children | Above Poverty | Below Poverty |
| No Children | 758 (99.1%) | 7 (0.9%) |
| 1 or 2 Children | 219 (100.0%) | 0 (0.0%) |
| 3 or 4 Children | 0 (0.0%) | 0 (0.0%) |
| 5 or more Children | 0 (0.0%) | 0 (0.0%) |
| Total | 977 (99.3%) | 7 (0.7%) |
Income Below Poverty Among Single-Parent Households in Chamberlayne
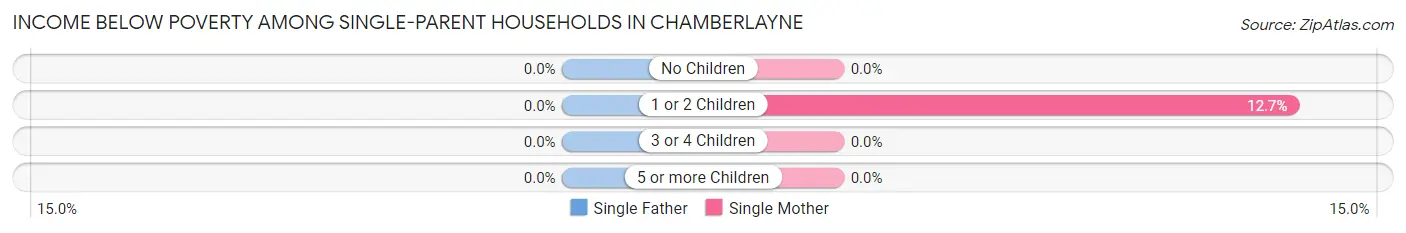
| Children | Single Father | Single Mother |
| No Children | 0 (0.0%) | 0 (0.0%) |
| 1 or 2 Children | 0 (0.0%) | 7 (12.7%) |
| 3 or 4 Children | 0 (0.0%) | 0 (0.0%) |
| 5 or more Children | 0 (0.0%) | 0 (0.0%) |
| Total | 0 (0.0%) | 7 (2.4%) |
Income Below Poverty Among Married-Couple vs Single-Parent Households in Chamberlayne
The poverty data for Chamberlayne shows that 7 of the married-couple family households (0.7%) and 7 of the single-parent households (1.5%) are living below the poverty level. Within the married-couple family households, those with no children have the highest poverty rate, with 7 households (0.9%) falling below the poverty line. Among the single-parent households, those with 1 or 2 children have the highest poverty rate, with 7 household (5.8%) living below poverty.
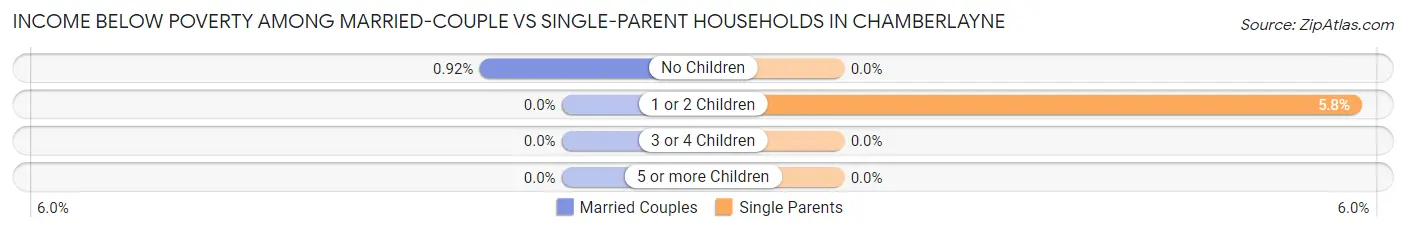
| Children | Married-Couple Families | Single-Parent Households |
| No Children | 7 (0.9%) | 0 (0.0%) |
| 1 or 2 Children | 0 (0.0%) | 7 (5.8%) |
| 3 or 4 Children | 0 (0.0%) | 0 (0.0%) |
| 5 or more Children | 0 (0.0%) | 0 (0.0%) |
| Total | 7 (0.7%) | 7 (1.5%) |
Race in Chamberlayne
The most populous races in Chamberlayne are Black / African American (2,921 | 58.8%), White / Caucasian (1,786 | 36.0%), and Two or more Races (195 | 3.9%).
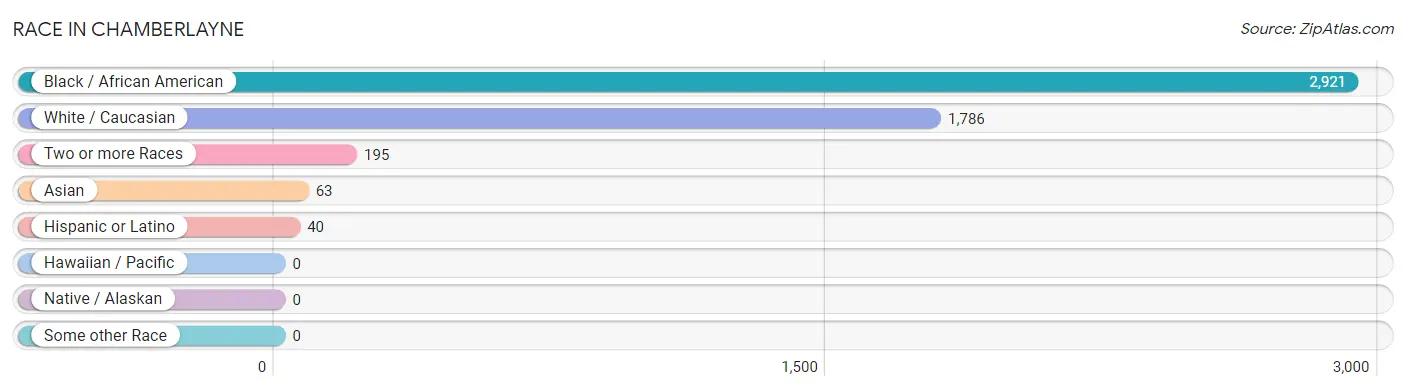
| Race | # Population | % Population |
| Asian | 63 | 1.3% |
| Black / African American | 2,921 | 58.8% |
| Hawaiian / Pacific | 0 | 0.0% |
| Hispanic or Latino | 40 | 0.8% |
| Native / Alaskan | 0 | 0.0% |
| White / Caucasian | 1,786 | 36.0% |
| Two or more Races | 195 | 3.9% |
| Some other Race | 0 | 0.0% |
| Total | 4,965 | 100.0% |
Ancestry in Chamberlayne
The most populous ancestries reported in Chamberlayne are German (346 | 7.0%), English (310 | 6.2%), Irish (225 | 4.5%), American (140 | 2.8%), and Scottish (139 | 2.8%), together accounting for 23.4% of all Chamberlayne residents.
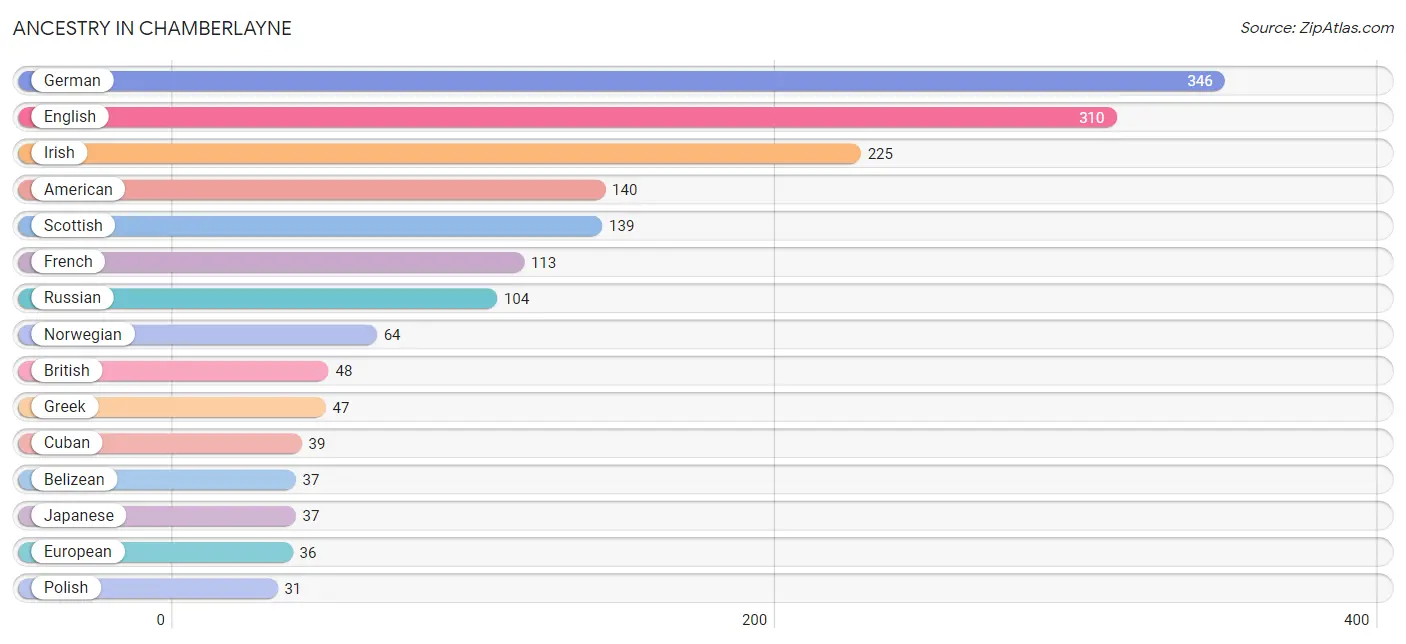
| Ancestry | # Population | % Population |
| American | 140 | 2.8% |
| Belizean | 37 | 0.7% |
| British | 48 | 1.0% |
| Cherokee | 29 | 0.6% |
| Cuban | 39 | 0.8% |
| Czech | 14 | 0.3% |
| Dutch | 5 | 0.1% |
| English | 310 | 6.2% |
| Ethiopian | 3 | 0.1% |
| European | 36 | 0.7% |
| French | 113 | 2.3% |
| German | 346 | 7.0% |
| Greek | 47 | 0.9% |
| Iranian | 12 | 0.2% |
| Irish | 225 | 4.5% |
| Italian | 21 | 0.4% |
| Japanese | 37 | 0.7% |
| Lithuanian | 14 | 0.3% |
| Norwegian | 64 | 1.3% |
| Polish | 31 | 0.6% |
| Puerto Rican | 1 | 0.0% |
| Russian | 104 | 2.1% |
| Scandinavian | 14 | 0.3% |
| Scotch-Irish | 5 | 0.1% |
| Scottish | 139 | 2.8% |
| Sri Lankan | 11 | 0.2% |
| Subsaharan African | 3 | 0.1% |
| Welsh | 14 | 0.3% | View All 28 Rows |
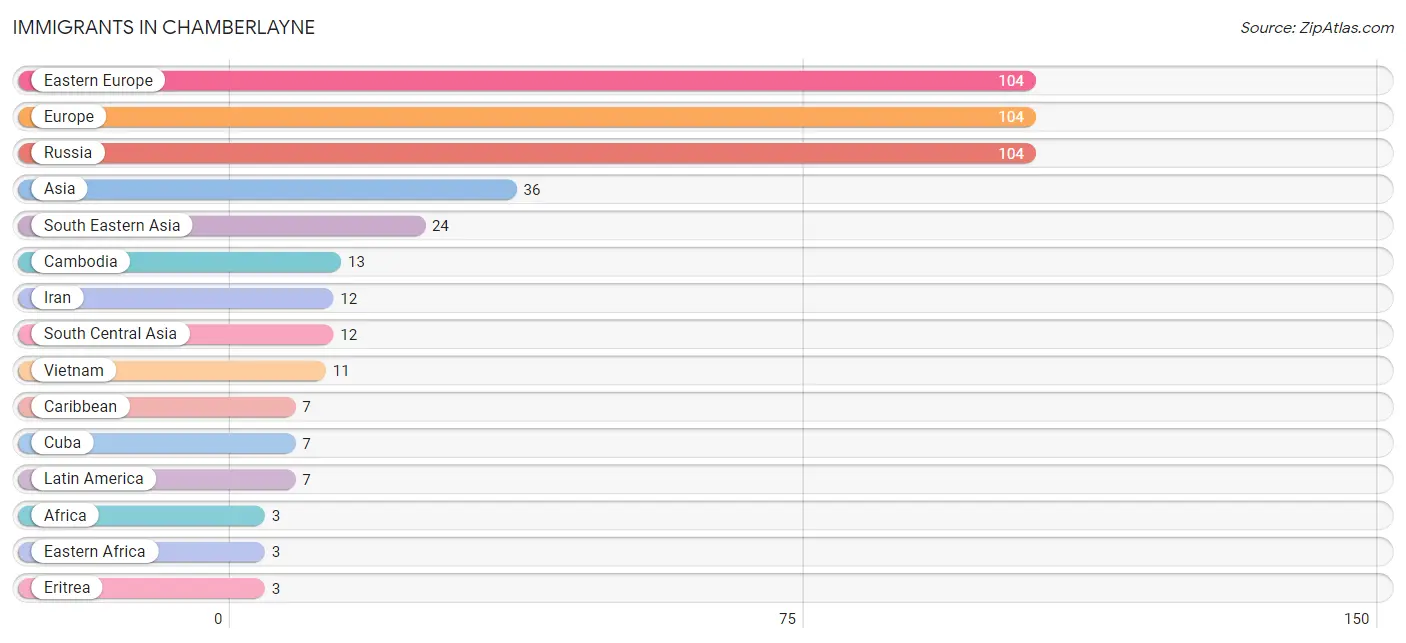
Immigrants in Chamberlayne
The most numerous immigrant groups reported in Chamberlayne came from Eastern Europe (104 | 2.1%), Europe (104 | 2.1%), Russia (104 | 2.1%), Asia (36 | 0.7%), and South Eastern Asia (24 | 0.5%), together accounting for 7.5% of all Chamberlayne residents.
| Immigration Origin | # Population | % Population |
| Africa | 3 | 0.1% |
| Asia | 36 | 0.7% |
| Cambodia | 13 | 0.3% |
| Caribbean | 7 | 0.1% |
| Cuba | 7 | 0.1% |
| Eastern Africa | 3 | 0.1% |
| Eastern Europe | 104 | 2.1% |
| Eritrea | 3 | 0.1% |
| Europe | 104 | 2.1% |
| Iran | 12 | 0.2% |
| Latin America | 7 | 0.1% |
| Russia | 104 | 2.1% |
| South Central Asia | 12 | 0.2% |
| South Eastern Asia | 24 | 0.5% |
| Vietnam | 11 | 0.2% | View All 15 Rows |
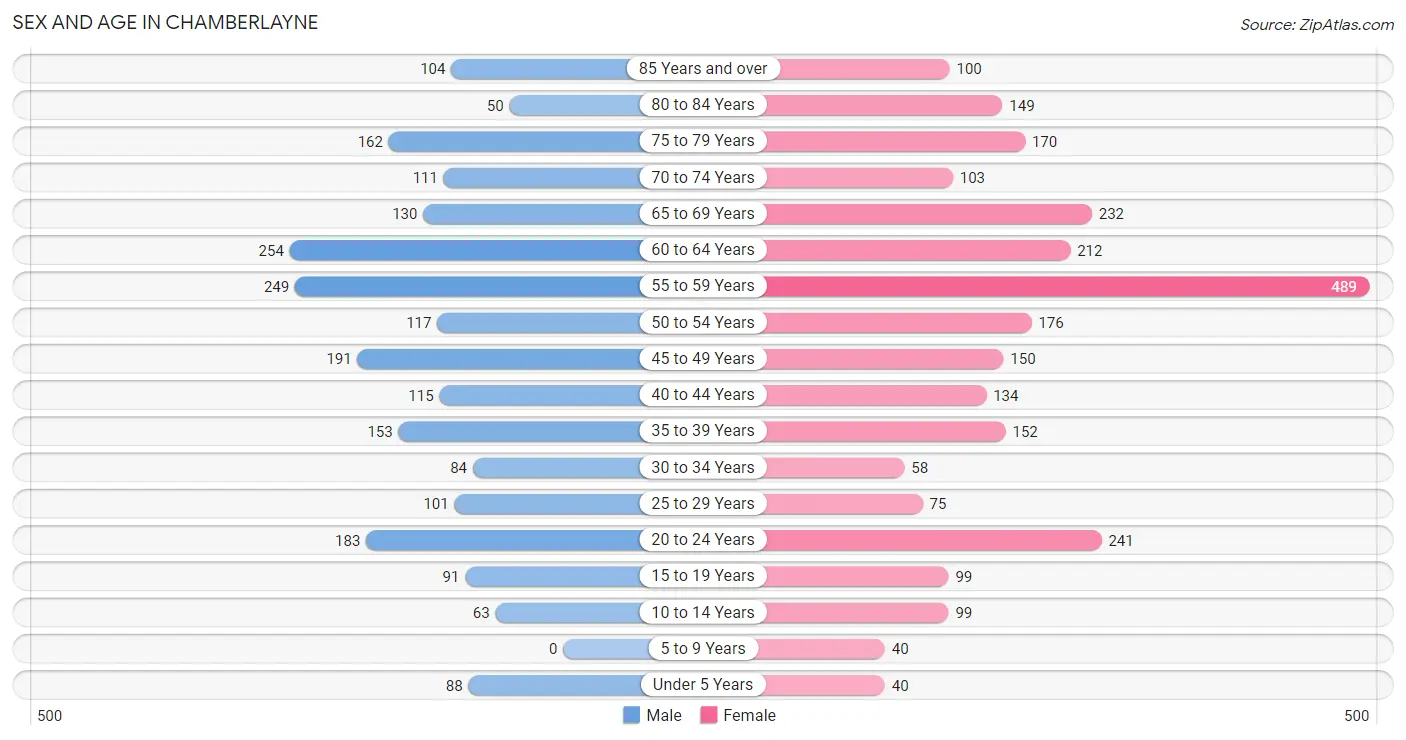
Sex and Age in Chamberlayne
Sex and Age in Chamberlayne
The most populous age groups in Chamberlayne are 60 to 64 Years (254 | 11.3%) for men and 55 to 59 Years (489 | 18.0%) for women.
| Age Bracket | Male | Female |
| Under 5 Years | 88 (3.9%) | 40 (1.5%) |
| 5 to 9 Years | 0 (0.0%) | 40 (1.5%) |
| 10 to 14 Years | 63 (2.8%) | 99 (3.6%) |
| 15 to 19 Years | 91 (4.1%) | 99 (3.6%) |
| 20 to 24 Years | 183 (8.2%) | 241 (8.9%) |
| 25 to 29 Years | 101 (4.5%) | 75 (2.8%) |
| 30 to 34 Years | 84 (3.7%) | 58 (2.1%) |
| 35 to 39 Years | 153 (6.8%) | 152 (5.6%) |
| 40 to 44 Years | 115 (5.1%) | 134 (4.9%) |
| 45 to 49 Years | 191 (8.5%) | 150 (5.5%) |
| 50 to 54 Years | 117 (5.2%) | 176 (6.5%) |
| 55 to 59 Years | 249 (11.1%) | 489 (18.0%) |
| 60 to 64 Years | 254 (11.3%) | 212 (7.8%) |
| 65 to 69 Years | 130 (5.8%) | 232 (8.5%) |
| 70 to 74 Years | 111 (4.9%) | 103 (3.8%) |
| 75 to 79 Years | 162 (7.2%) | 170 (6.2%) |
| 80 to 84 Years | 50 (2.2%) | 149 (5.5%) |
| 85 Years and over | 104 (4.6%) | 100 (3.7%) |
| Total | 2,246 (100.0%) | 2,719 (100.0%) |
Families and Households in Chamberlayne
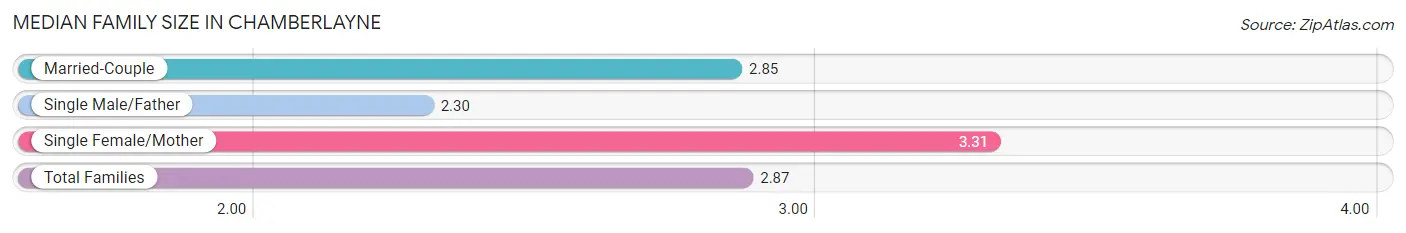
Median Family Size in Chamberlayne
The median family size in Chamberlayne is 2.87 persons per family, with single female/mother families (295 | 20.3%) accounting for the largest median family size of 3.31 persons per family. On the other hand, single male/father families (176 | 12.1%) represent the smallest median family size with 2.30 persons per family.
| Family Type | # Families | Family Size |
| Married-Couple | 984 (67.6%) | 2.85 |
| Single Male/Father | 176 (12.1%) | 2.30 |
| Single Female/Mother | 295 (20.3%) | 3.31 |
| Total Families | 1,455 (100.0%) | 2.87 |
Median Household Size in Chamberlayne
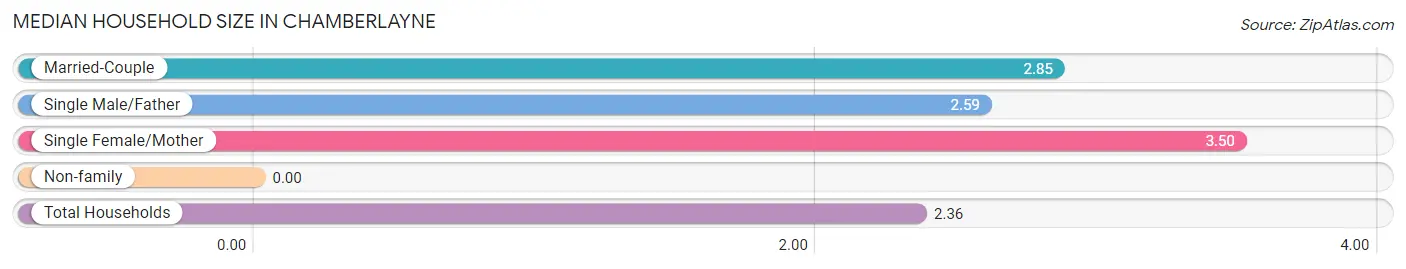
| Household Type | # Households | Household Size |
| Married-Couple | 984 (47.3%) | 2.85 |
| Single Male/Father | 176 (8.5%) | 2.59 |
| Single Female/Mother | 295 (14.2%) | 3.50 |
| Non-family | 627 (30.1%) | - |
| Total Households | 2,082 (100.0%) | 2.36 |
Household Size by Marriage Status in Chamberlayne
Out of a total of 2,082 households in Chamberlayne, 1,455 (69.9%) are family households, while 627 (30.1%) are nonfamily households. The most numerous type of family households are 2-person households, comprising 748, and the most common type of nonfamily households are 1-person households, comprising 627.
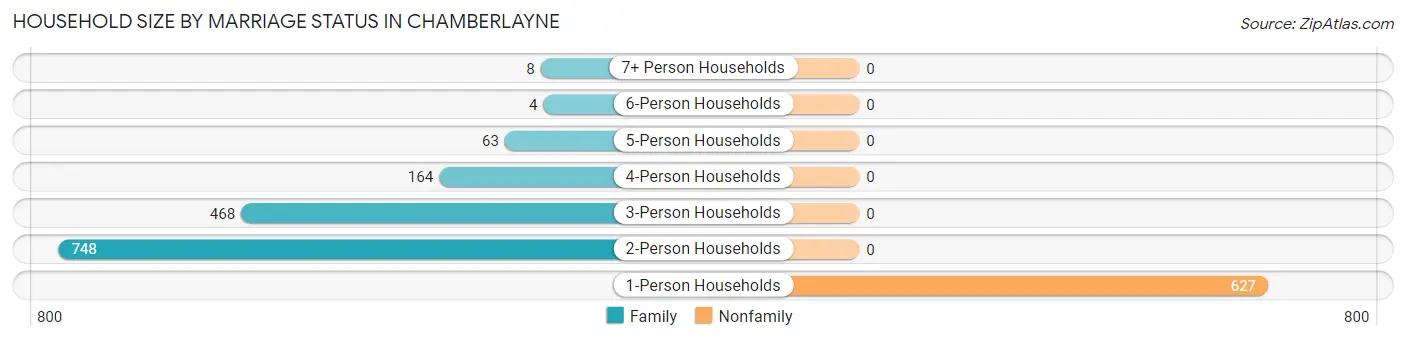
| Household Size | Family Households | Nonfamily Households |
| 1-Person Households | - | 627 (30.1%) |
| 2-Person Households | 748 (35.9%) | 0 (0.0%) |
| 3-Person Households | 468 (22.5%) | 0 (0.0%) |
| 4-Person Households | 164 (7.9%) | 0 (0.0%) |
| 5-Person Households | 63 (3.0%) | 0 (0.0%) |
| 6-Person Households | 4 (0.2%) | 0 (0.0%) |
| 7+ Person Households | 8 (0.4%) | 0 (0.0%) |
| Total | 1,455 (69.9%) | 627 (30.1%) |
Female Fertility in Chamberlayne
Fertility by Age in Chamberlayne
Average fertility rate in Chamberlayne is 62.0 births per 1,000 women. Women in the age bracket of 35 to 50 years have the highest fertility rate with 129.0 births per 1,000 women. Women in the age bracket of 35 to 50 years acount for 100.0% of all women with births.
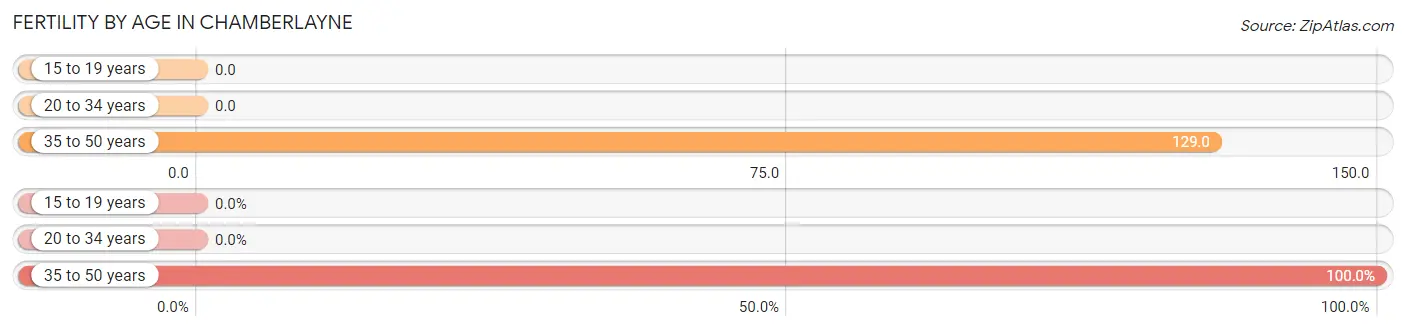
| Age Bracket | Women with Births | Births / 1,000 Women |
| 15 to 19 years | 0 (0.0%) | 0.0 |
| 20 to 34 years | 0 (0.0%) | 0.0 |
| 35 to 50 years | 57 (100.0%) | 129.0 |
| Total | 57 (100.0%) | 62.0 |
Fertility by Age by Marriage Status in Chamberlayne
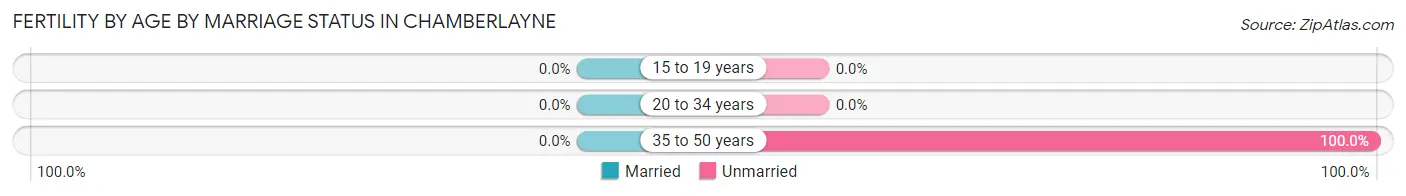
| Age Bracket | Married | Unmarried |
| 15 to 19 years | 0 (0.0%) | 0 (0.0%) |
| 20 to 34 years | 0 (0.0%) | 0 (0.0%) |
| 35 to 50 years | 0 (0.0%) | 57 (100.0%) |
| Total | 0 (0.0%) | 57 (100.0%) |
Fertility by Education in Chamberlayne
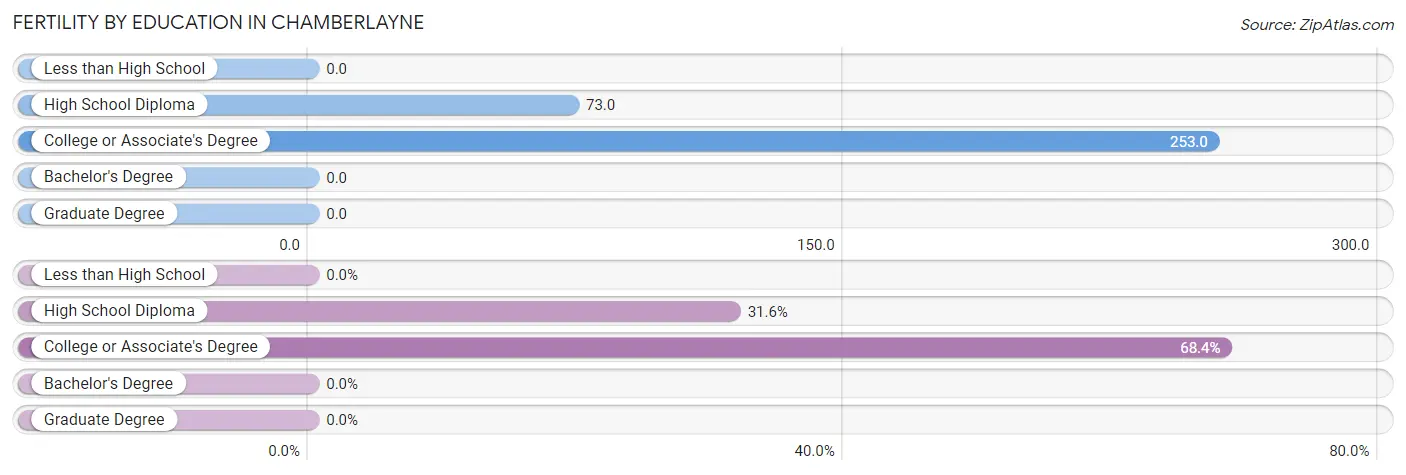
| Educational Attainment | Women with Births | Births / 1,000 Women |
| Less than High School | 0 (0.0%) | 0.0 |
| High School Diploma | 18 (31.6%) | 73.0 |
| College or Associate's Degree | 39 (68.4%) | 253.0 |
| Bachelor's Degree | 0 (0.0%) | 0.0 |
| Graduate Degree | 0 (0.0%) | 0.0 |
| Total | 57 (100.0%) | 62.0 |
Fertility by Education by Marriage Status in Chamberlayne
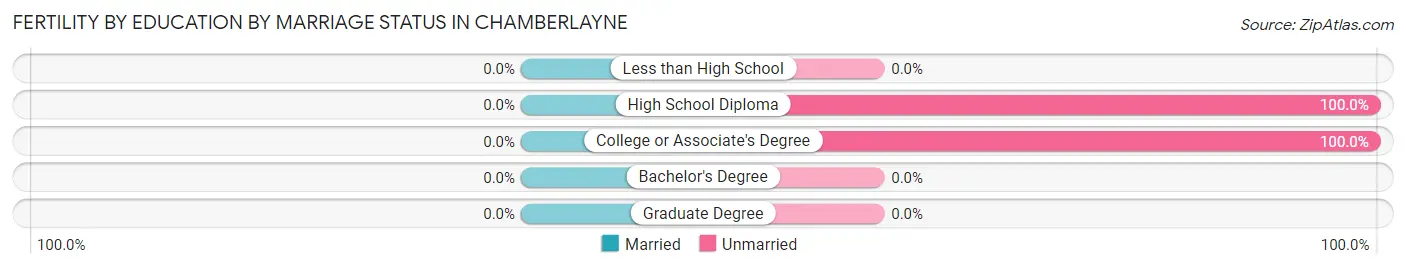
| Educational Attainment | Married | Unmarried |
| Less than High School | 0 (0.0%) | 0 (0.0%) |
| High School Diploma | 0 (0.0%) | 18 (100.0%) |
| College or Associate's Degree | 0 (0.0%) | 39 (100.0%) |
| Bachelor's Degree | 0 (0.0%) | 0 (0.0%) |
| Graduate Degree | 0 (0.0%) | 0 (0.0%) |
| Total | 0 (0.0%) | 57 (100.0%) |
Employment Characteristics in Chamberlayne
Employment by Class of Employer in Chamberlayne
Among the 2,570 employed individuals in Chamberlayne, private company employees (1,670 | 65.0%), state government employees (252 | 9.8%), and not-for-profit organizations (193 | 7.5%) make up the most common classes of employment.
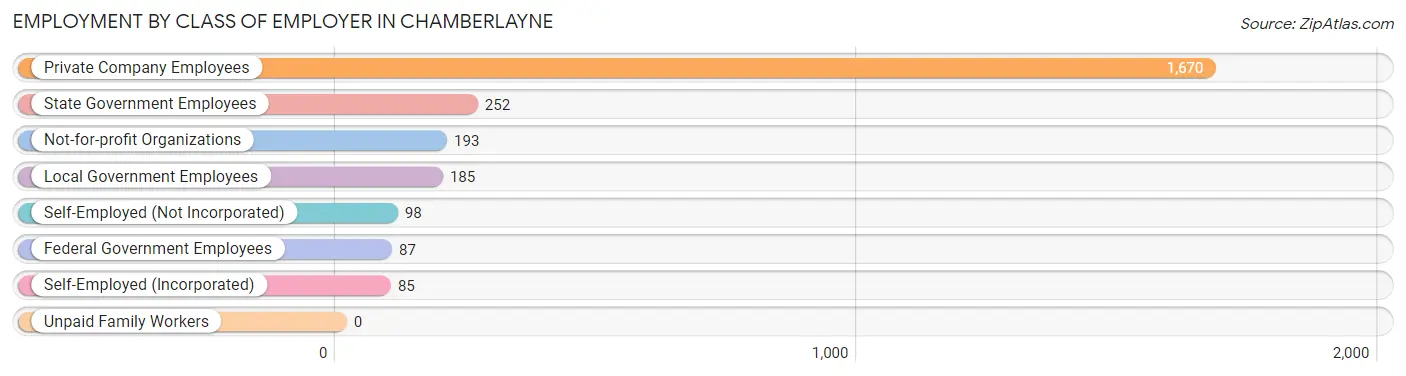
| Employer Class | # Employees | % Employees |
| Private Company Employees | 1,670 | 65.0% |
| Self-Employed (Incorporated) | 85 | 3.3% |
| Self-Employed (Not Incorporated) | 98 | 3.8% |
| Not-for-profit Organizations | 193 | 7.5% |
| Local Government Employees | 185 | 7.2% |
| State Government Employees | 252 | 9.8% |
| Federal Government Employees | 87 | 3.4% |
| Unpaid Family Workers | 0 | 0.0% |
| Total | 2,570 | 100.0% |
Employment Status by Age in Chamberlayne
According to the labor force statistics for Chamberlayne, out of the total population over 16 years of age (4,604), 60.2% or 2,772 individuals are in the labor force, with 7.2% or 200 of them unemployed. The age group with the highest labor force participation rate is 30 to 34 years, with 100.0% or 142 individuals in the labor force. Within the labor force, the 20 to 24 years age range has the highest percentage of unemployed individuals, with 37.8% or 115 of them being unemployed.
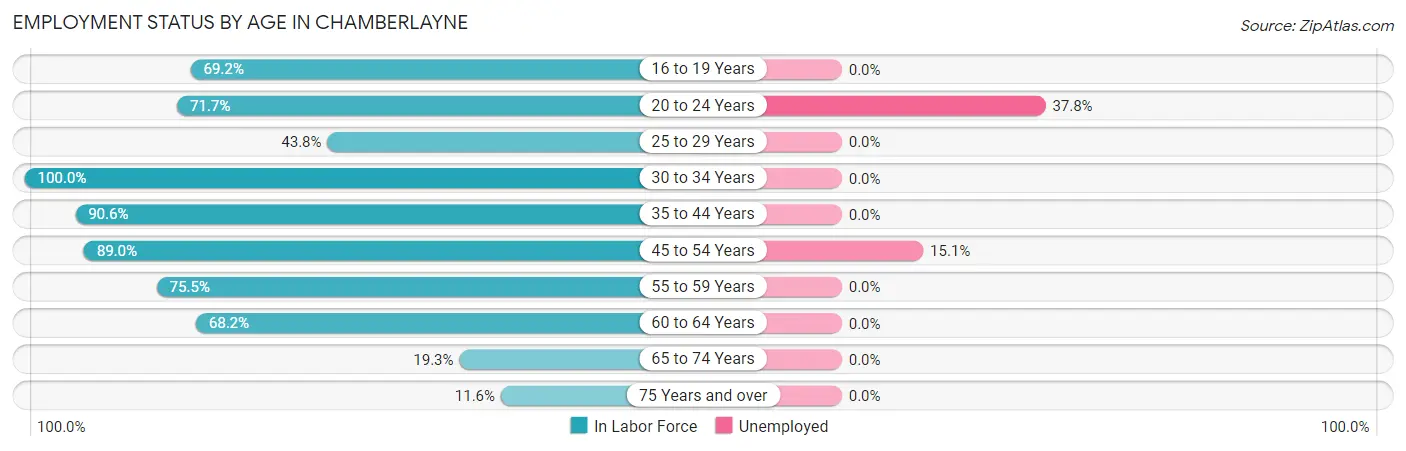
| Age Bracket | In Labor Force | Unemployed |
| 16 to 19 Years | 110 (69.2%) | 0 (0.0%) |
| 20 to 24 Years | 304 (71.7%) | 115 (37.8%) |
| 25 to 29 Years | 77 (43.8%) | 0 (0.0%) |
| 30 to 34 Years | 142 (100.0%) | 0 (0.0%) |
| 35 to 44 Years | 502 (90.6%) | 0 (0.0%) |
| 45 to 54 Years | 564 (89.0%) | 85 (15.1%) |
| 55 to 59 Years | 557 (75.5%) | 0 (0.0%) |
| 60 to 64 Years | 318 (68.2%) | 0 (0.0%) |
| 65 to 74 Years | 111 (19.3%) | 0 (0.0%) |
| 75 Years and over | 85 (11.6%) | 0 (0.0%) |
| Total | 2,772 (60.2%) | 200 (7.2%) |
Employment Status by Educational Attainment in Chamberlayne
According to labor force statistics for Chamberlayne, 79.7% of individuals (2,160) out of the total population between 25 and 64 years of age (2,710) are in the labor force, with 4.0% or 86 of them being unemployed. The group with the highest labor force participation rate are those with the educational attainment of bachelor's degree or higher, with 87.2% or 1,190 individuals in the labor force. Within the labor force, individuals with less than high school education have the highest percentage of unemployment, with 8.5% or 7 of them being unemployed.
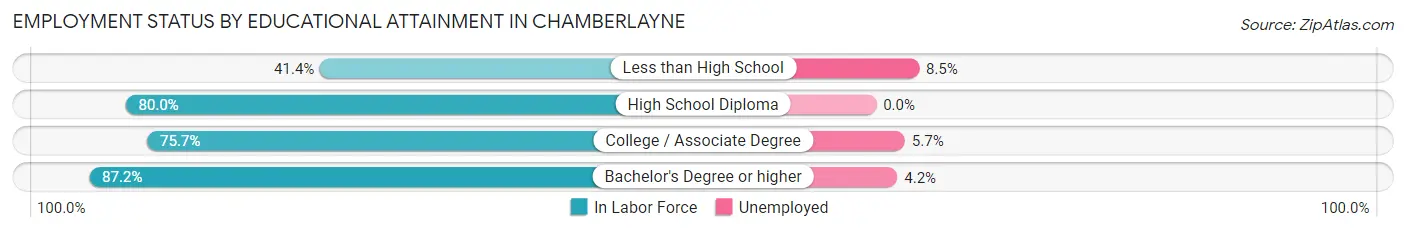
| Educational Attainment | In Labor Force | Unemployed |
| Less than High School | 82 (41.4%) | 17 (8.5%) |
| High School Diploma | 375 (80.0%) | 0 (0.0%) |
| College / Associate Degree | 513 (75.7%) | 39 (5.7%) |
| Bachelor's Degree or higher | 1,190 (87.2%) | 57 (4.2%) |
| Total | 2,160 (79.7%) | 108 (4.0%) |
Employment Occupations by Sex in Chamberlayne
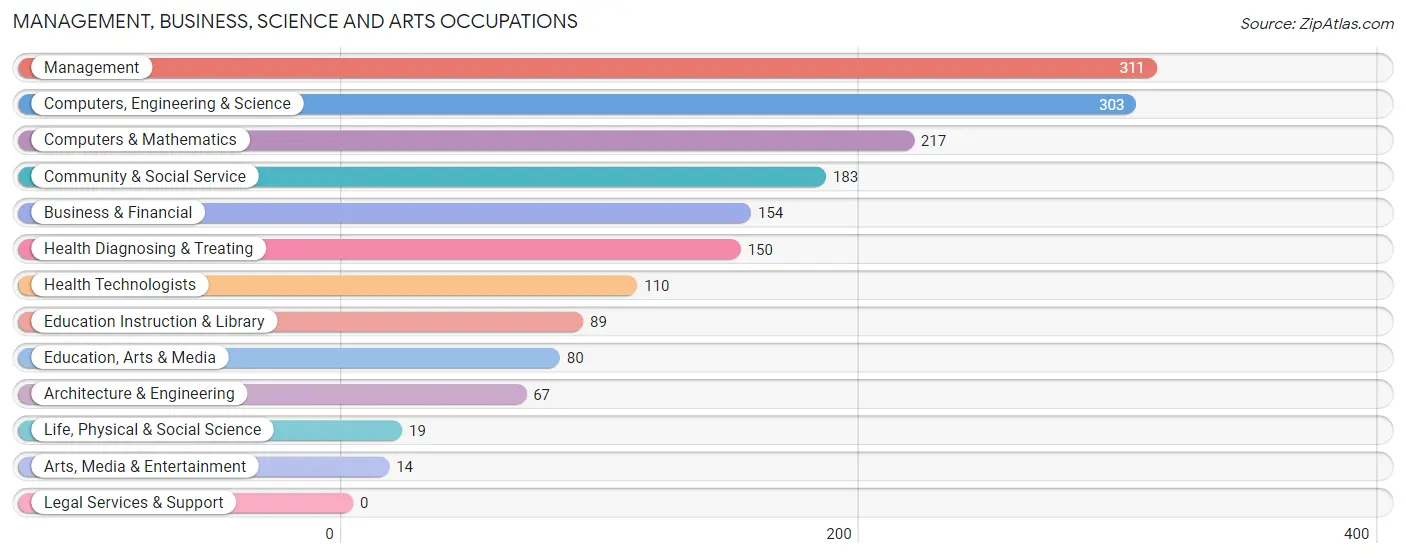
Management, Business, Science and Arts Occupations
The most common Management, Business, Science and Arts occupations in Chamberlayne are Management (311 | 12.1%), Computers, Engineering & Science (303 | 11.8%), Computers & Mathematics (217 | 8.5%), Community & Social Service (183 | 7.1%), and Business & Financial (154 | 6.0%).
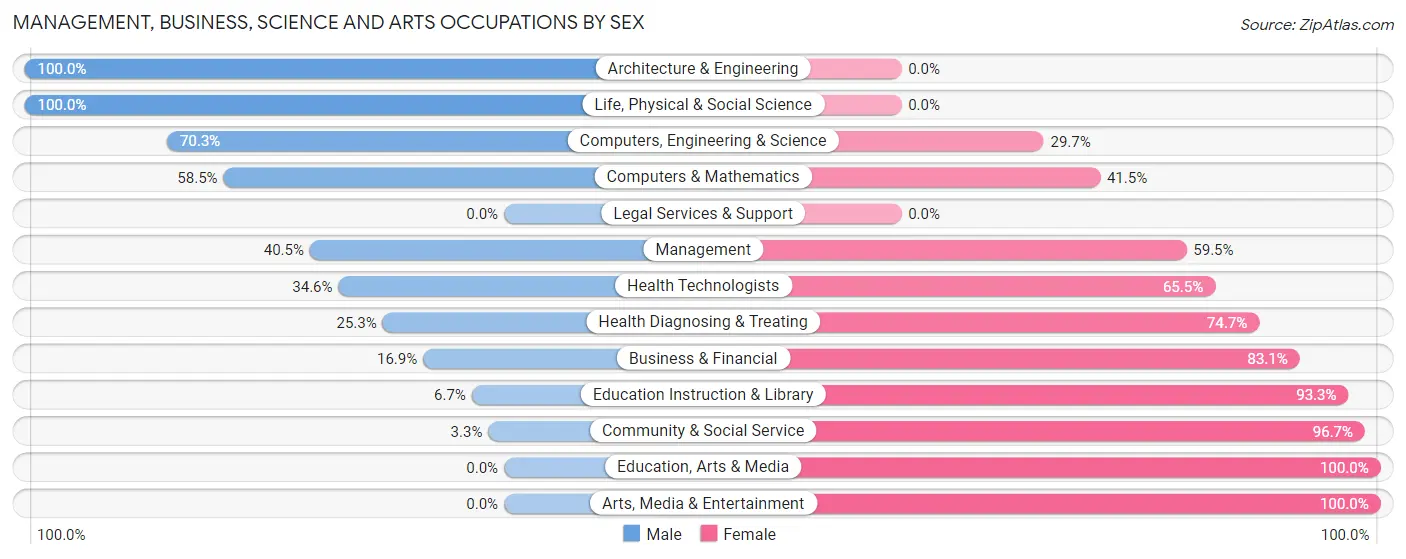
Management, Business, Science and Arts Occupations by Sex
Within the Management, Business, Science and Arts occupations in Chamberlayne, the most male-oriented occupations are Architecture & Engineering (100.0%), Life, Physical & Social Science (100.0%), and Computers, Engineering & Science (70.3%), while the most female-oriented occupations are Education, Arts & Media (100.0%), Arts, Media & Entertainment (100.0%), and Community & Social Service (96.7%).
| Occupation | Male | Female |
| Management | 126 (40.5%) | 185 (59.5%) |
| Business & Financial | 26 (16.9%) | 128 (83.1%) |
| Computers, Engineering & Science | 213 (70.3%) | 90 (29.7%) |
| Computers & Mathematics | 127 (58.5%) | 90 (41.5%) |
| Architecture & Engineering | 67 (100.0%) | 0 (0.0%) |
| Life, Physical & Social Science | 19 (100.0%) | 0 (0.0%) |
| Community & Social Service | 6 (3.3%) | 177 (96.7%) |
| Education, Arts & Media | 0 (0.0%) | 80 (100.0%) |
| Legal Services & Support | 0 (0.0%) | 0 (0.0%) |
| Education Instruction & Library | 6 (6.7%) | 83 (93.3%) |
| Arts, Media & Entertainment | 0 (0.0%) | 14 (100.0%) |
| Health Diagnosing & Treating | 38 (25.3%) | 112 (74.7%) |
| Health Technologists | 38 (34.5%) | 72 (65.4%) |
| Total (Category) | 409 (37.1%) | 692 (62.8%) |
| Total (Overall) | 1,247 (48.7%) | 1,312 (51.3%) |
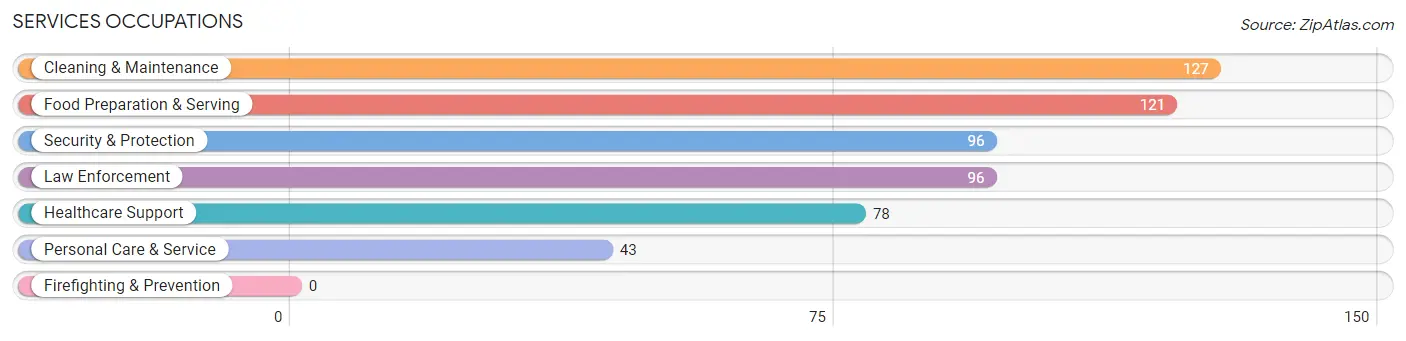
Services Occupations
The most common Services occupations in Chamberlayne are Cleaning & Maintenance (127 | 5.0%), Food Preparation & Serving (121 | 4.7%), Security & Protection (96 | 3.7%), Law Enforcement (96 | 3.7%), and Healthcare Support (78 | 3.0%).
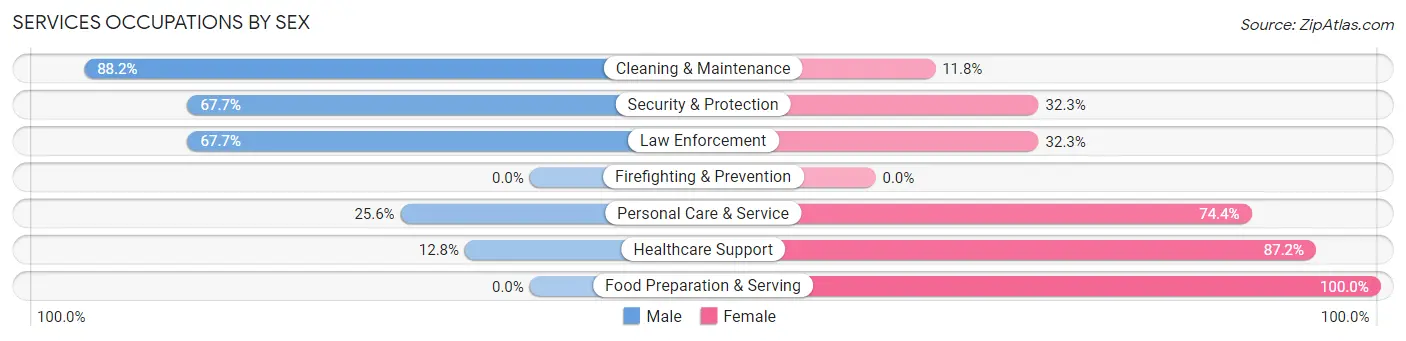
Services Occupations by Sex
Within the Services occupations in Chamberlayne, the most male-oriented occupations are Cleaning & Maintenance (88.2%), Security & Protection (67.7%), and Law Enforcement (67.7%), while the most female-oriented occupations are Food Preparation & Serving (100.0%), Healthcare Support (87.2%), and Personal Care & Service (74.4%).
| Occupation | Male | Female |
| Healthcare Support | 10 (12.8%) | 68 (87.2%) |
| Security & Protection | 65 (67.7%) | 31 (32.3%) |
| Firefighting & Prevention | 0 (0.0%) | 0 (0.0%) |
| Law Enforcement | 65 (67.7%) | 31 (32.3%) |
| Food Preparation & Serving | 0 (0.0%) | 121 (100.0%) |
| Cleaning & Maintenance | 112 (88.2%) | 15 (11.8%) |
| Personal Care & Service | 11 (25.6%) | 32 (74.4%) |
| Total (Category) | 198 (42.6%) | 267 (57.4%) |
| Total (Overall) | 1,247 (48.7%) | 1,312 (51.3%) |
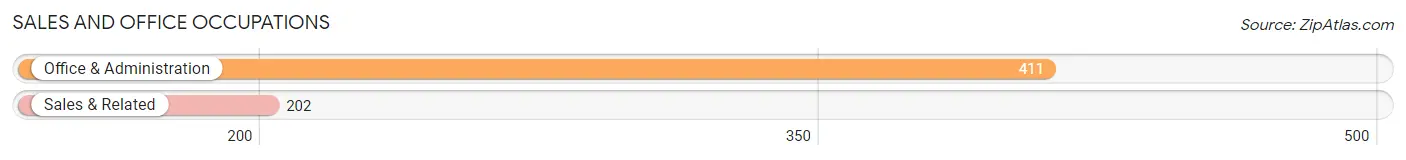
Sales and Office Occupations
The most common Sales and Office occupations in Chamberlayne are Office & Administration (411 | 16.1%), and Sales & Related (202 | 7.9%).
Sales and Office Occupations by Sex
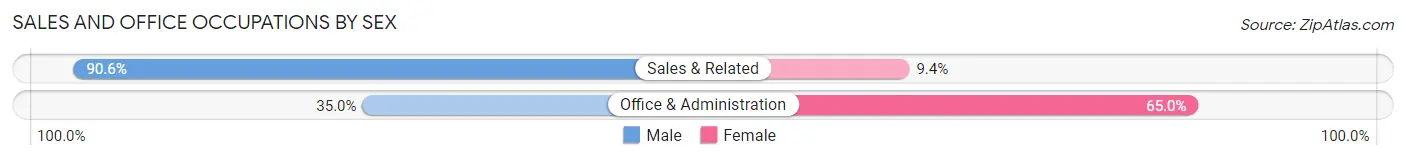
| Occupation | Male | Female |
| Sales & Related | 183 (90.6%) | 19 (9.4%) |
| Office & Administration | 144 (35.0%) | 267 (65.0%) |
| Total (Category) | 327 (53.3%) | 286 (46.7%) |
| Total (Overall) | 1,247 (48.7%) | 1,312 (51.3%) |
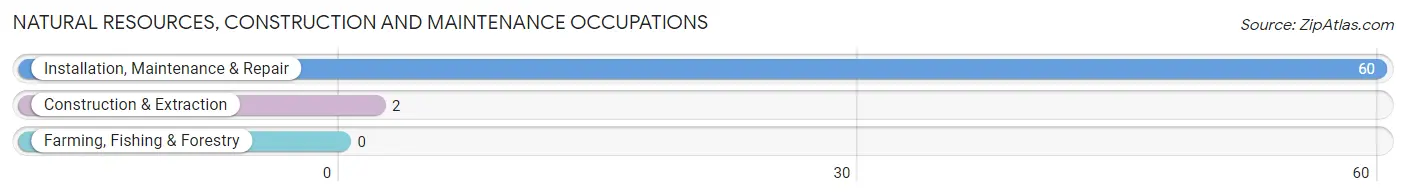
Natural Resources, Construction and Maintenance Occupations
The most common Natural Resources, Construction and Maintenance occupations in Chamberlayne are Installation, Maintenance & Repair (60 | 2.3%), and Construction & Extraction (2 | 0.1%).
Natural Resources, Construction and Maintenance Occupations by Sex
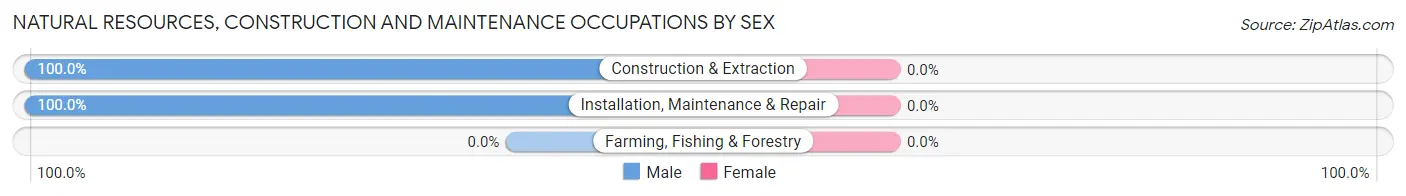
| Occupation | Male | Female |
| Farming, Fishing & Forestry | 0 (0.0%) | 0 (0.0%) |
| Construction & Extraction | 2 (100.0%) | 0 (0.0%) |
| Installation, Maintenance & Repair | 60 (100.0%) | 0 (0.0%) |
| Total (Category) | 62 (100.0%) | 0 (0.0%) |
| Total (Overall) | 1,247 (48.7%) | 1,312 (51.3%) |
Production, Transportation and Moving Occupations
The most common Production, Transportation and Moving occupations in Chamberlayne are Material Moving (156 | 6.1%), Transportation (109 | 4.3%), and Production (53 | 2.1%).
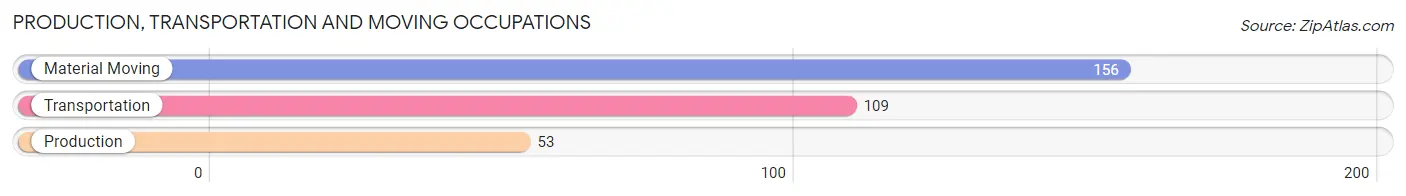
Production, Transportation and Moving Occupations by Sex
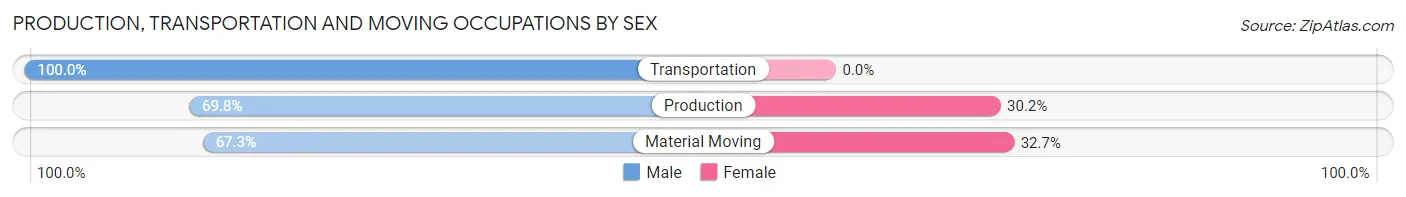
| Occupation | Male | Female |
| Production | 37 (69.8%) | 16 (30.2%) |
| Transportation | 109 (100.0%) | 0 (0.0%) |
| Material Moving | 105 (67.3%) | 51 (32.7%) |
| Total (Category) | 251 (78.9%) | 67 (21.1%) |
| Total (Overall) | 1,247 (48.7%) | 1,312 (51.3%) |
Employment Industries by Sex in Chamberlayne
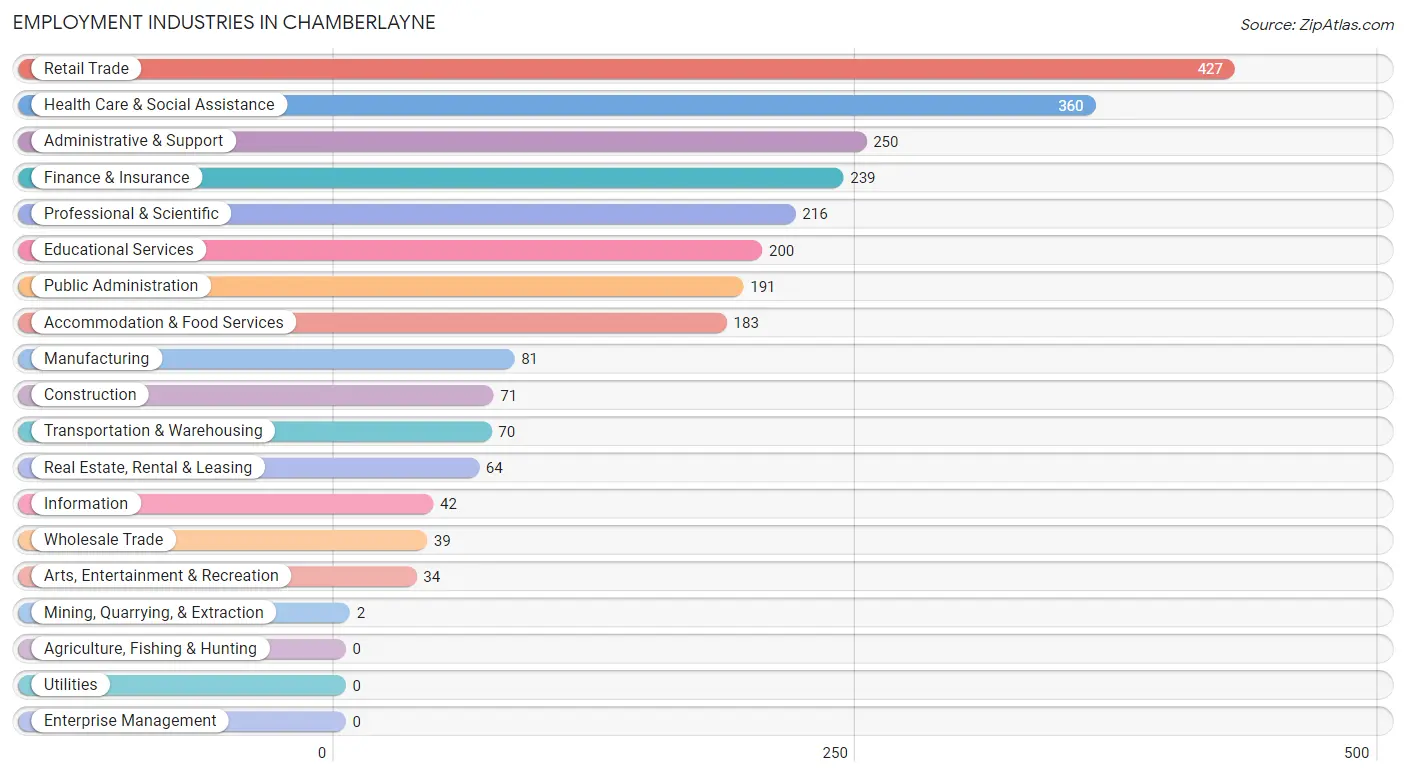
Employment Industries in Chamberlayne
The major employment industries in Chamberlayne include Retail Trade (427 | 16.7%), Health Care & Social Assistance (360 | 14.1%), Administrative & Support (250 | 9.8%), Finance & Insurance (239 | 9.3%), and Professional & Scientific (216 | 8.4%).
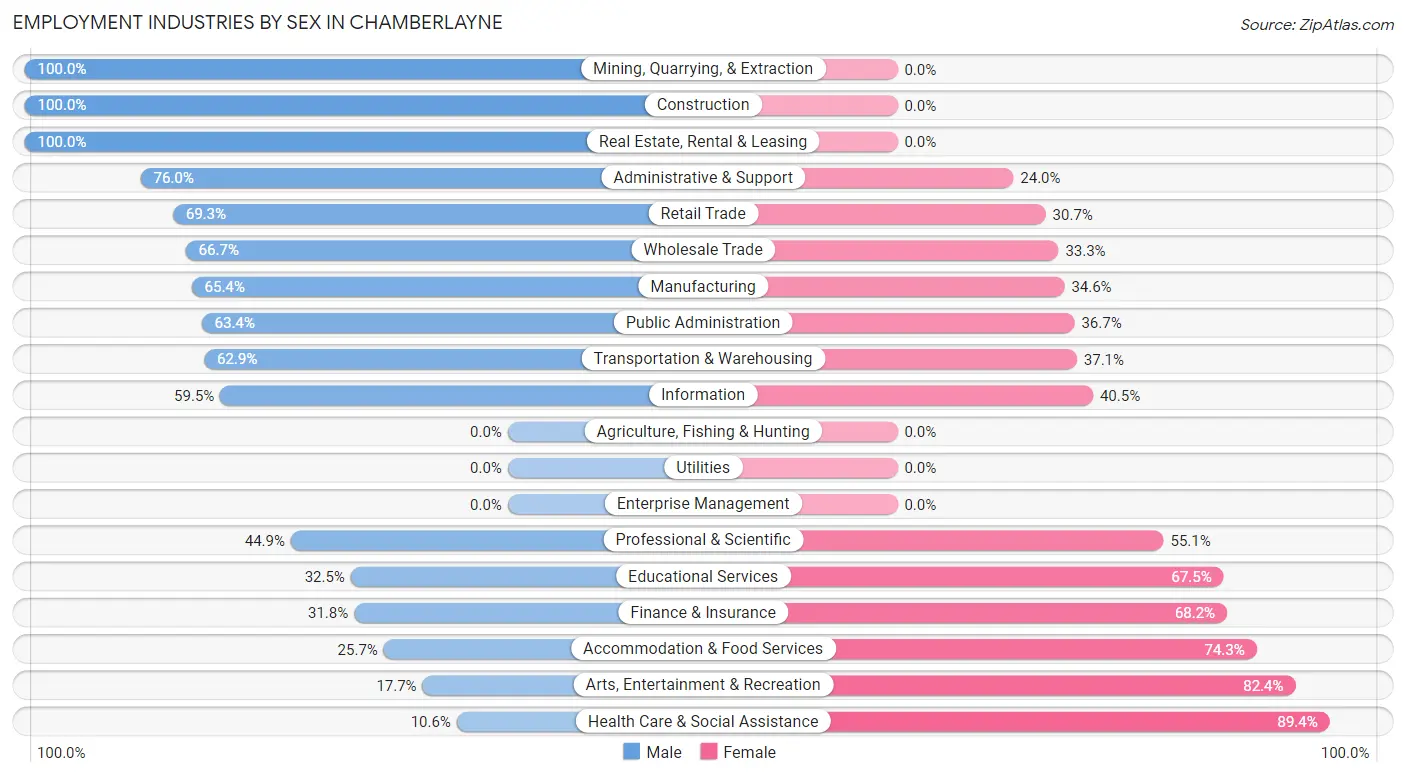
Employment Industries by Sex in Chamberlayne
The Chamberlayne industries that see more men than women are Mining, Quarrying, & Extraction (100.0%), Construction (100.0%), and Real Estate, Rental & Leasing (100.0%), whereas the industries that tend to have a higher number of women are Health Care & Social Assistance (89.4%), Arts, Entertainment & Recreation (82.4%), and Accommodation & Food Services (74.3%).
| Industry | Male | Female |
| Agriculture, Fishing & Hunting | 0 (0.0%) | 0 (0.0%) |
| Mining, Quarrying, & Extraction | 2 (100.0%) | 0 (0.0%) |
| Construction | 71 (100.0%) | 0 (0.0%) |
| Manufacturing | 53 (65.4%) | 28 (34.6%) |
| Wholesale Trade | 26 (66.7%) | 13 (33.3%) |
| Retail Trade | 296 (69.3%) | 131 (30.7%) |
| Transportation & Warehousing | 44 (62.9%) | 26 (37.1%) |
| Utilities | 0 (0.0%) | 0 (0.0%) |
| Information | 25 (59.5%) | 17 (40.5%) |
| Finance & Insurance | 76 (31.8%) | 163 (68.2%) |
| Real Estate, Rental & Leasing | 64 (100.0%) | 0 (0.0%) |
| Professional & Scientific | 97 (44.9%) | 119 (55.1%) |
| Enterprise Management | 0 (0.0%) | 0 (0.0%) |
| Administrative & Support | 190 (76.0%) | 60 (24.0%) |
| Educational Services | 65 (32.5%) | 135 (67.5%) |
| Health Care & Social Assistance | 38 (10.6%) | 322 (89.4%) |
| Arts, Entertainment & Recreation | 6 (17.6%) | 28 (82.4%) |
| Accommodation & Food Services | 47 (25.7%) | 136 (74.3%) |
| Public Administration | 121 (63.3%) | 70 (36.6%) |
| Total | 1,247 (48.7%) | 1,312 (51.3%) |
Education in Chamberlayne
School Enrollment in Chamberlayne
The most common levels of schooling among the 850 students in Chamberlayne are college / undergraduate (325 | 38.2%), graduate / professional (167 | 19.7%), and high school (163 | 19.2%).
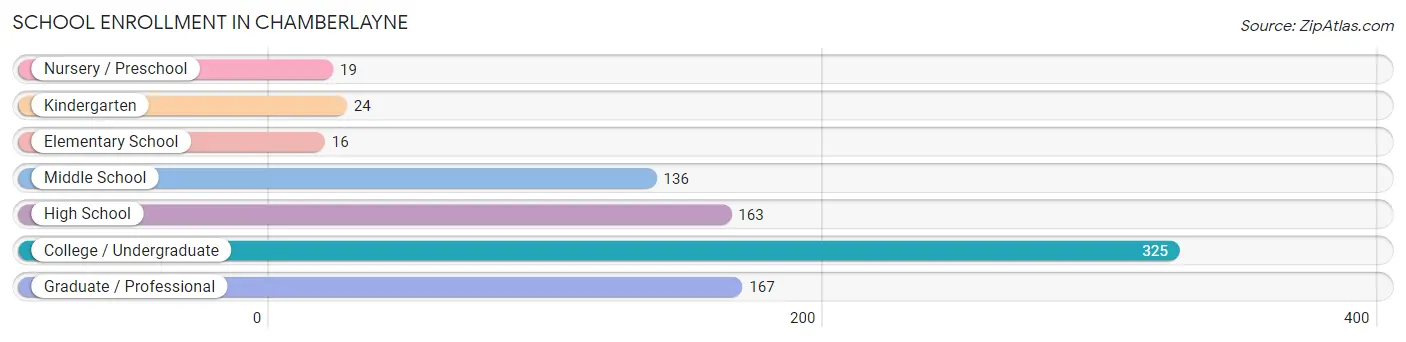
| School Level | # Students | % Students |
| Nursery / Preschool | 19 | 2.2% |
| Kindergarten | 24 | 2.8% |
| Elementary School | 16 | 1.9% |
| Middle School | 136 | 16.0% |
| High School | 163 | 19.2% |
| College / Undergraduate | 325 | 38.2% |
| Graduate / Professional | 167 | 19.7% |
| Total | 850 | 100.0% |
School Enrollment by Age by Funding Source in Chamberlayne
Out of a total of 850 students who are enrolled in schools in Chamberlayne, 122 (14.4%) attend a private institution, while the remaining 728 (85.6%) are enrolled in public schools. The age group of 20 to 24 year olds has the highest likelihood of being enrolled in private schools, with 100 (55.6% in the age bracket) enrolled. Conversely, the age group of 3 to 4 year olds has the lowest likelihood of being enrolled in a private school, with 19 (100.0% in the age bracket) attending a public institution.
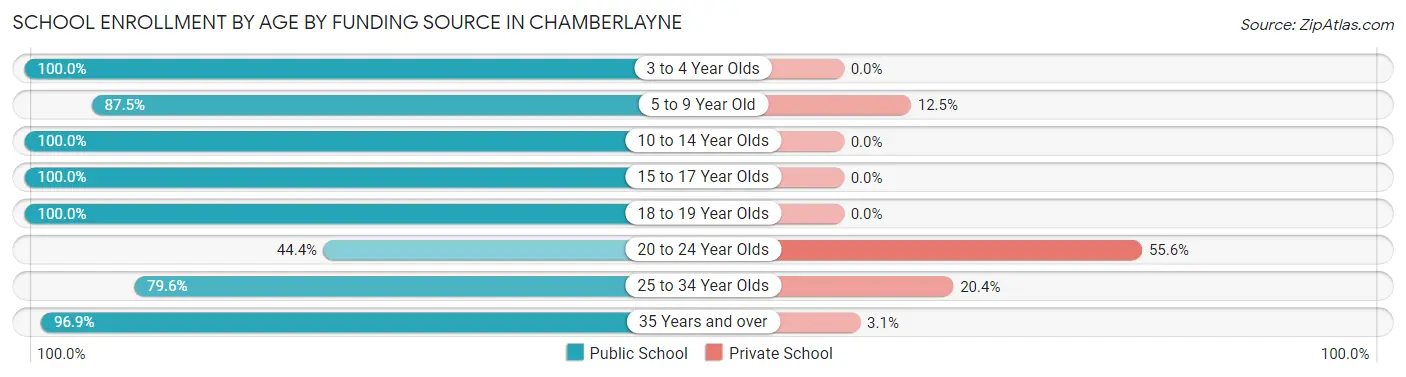
| Age Bracket | Public School | Private School |
| 3 to 4 Year Olds | 19 (100.0%) | 0 (0.0%) |
| 5 to 9 Year Old | 35 (87.5%) | 5 (12.5%) |
| 10 to 14 Year Olds | 162 (100.0%) | 0 (0.0%) |
| 15 to 17 Year Olds | 117 (100.0%) | 0 (0.0%) |
| 18 to 19 Year Olds | 55 (100.0%) | 0 (0.0%) |
| 20 to 24 Year Olds | 80 (44.4%) | 100 (55.6%) |
| 25 to 34 Year Olds | 39 (79.6%) | 10 (20.4%) |
| 35 Years and over | 221 (96.9%) | 7 (3.1%) |
| Total | 728 (85.6%) | 122 (14.4%) |
Educational Attainment by Field of Study in Chamberlayne
Education (435 | 21.7%), business (403 | 20.1%), computers & mathematics (183 | 9.1%), bio, nature & agricultural (148 | 7.4%), and social sciences (136 | 6.8%) are the most common fields of study among 2,002 individuals in Chamberlayne who have obtained a bachelor's degree or higher.
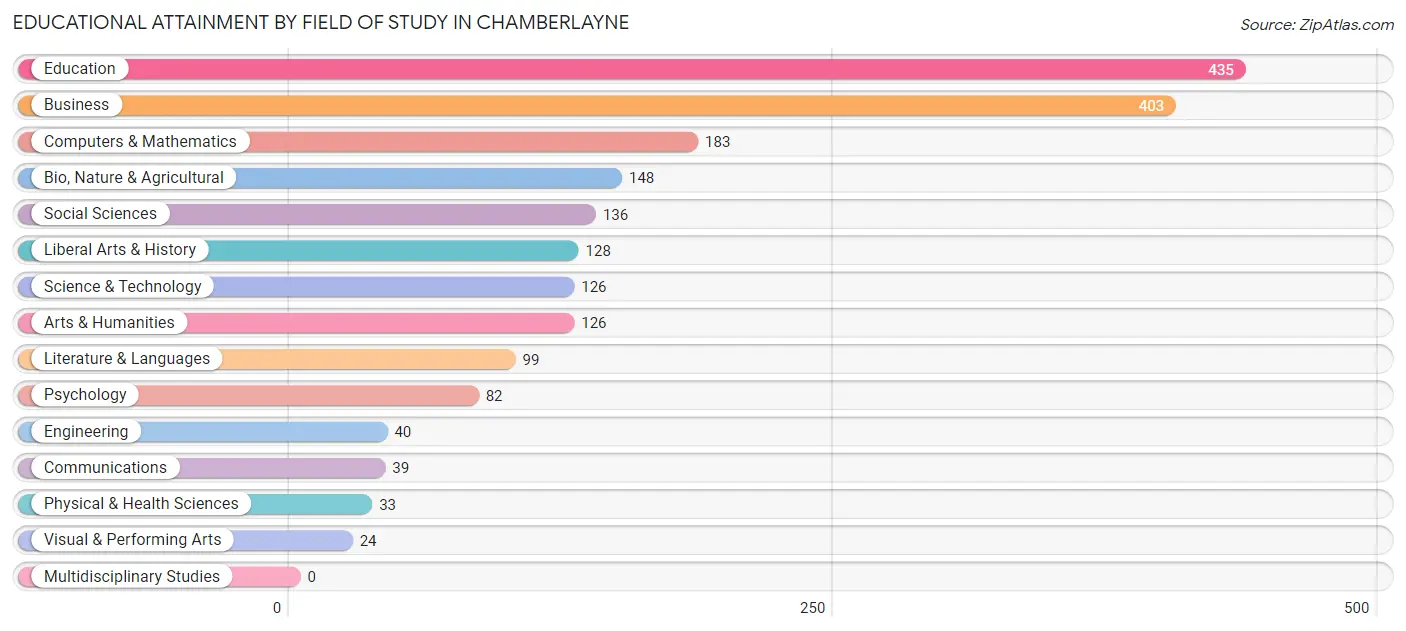
| Field of Study | # Graduates | % Graduates |
| Computers & Mathematics | 183 | 9.1% |
| Bio, Nature & Agricultural | 148 | 7.4% |
| Physical & Health Sciences | 33 | 1.7% |
| Psychology | 82 | 4.1% |
| Social Sciences | 136 | 6.8% |
| Engineering | 40 | 2.0% |
| Multidisciplinary Studies | 0 | 0.0% |
| Science & Technology | 126 | 6.3% |
| Business | 403 | 20.1% |
| Education | 435 | 21.7% |
| Literature & Languages | 99 | 5.0% |
| Liberal Arts & History | 128 | 6.4% |
| Visual & Performing Arts | 24 | 1.2% |
| Communications | 39 | 1.9% |
| Arts & Humanities | 126 | 6.3% |
| Total | 2,002 | 100.0% |
Transportation & Commute in Chamberlayne
Vehicle Availability by Sex in Chamberlayne
The most prevalent vehicle ownership categories in Chamberlayne are males with 2 vehicles (470, accounting for 37.7%) and females with 2 vehicles (531, making up 35.9%).
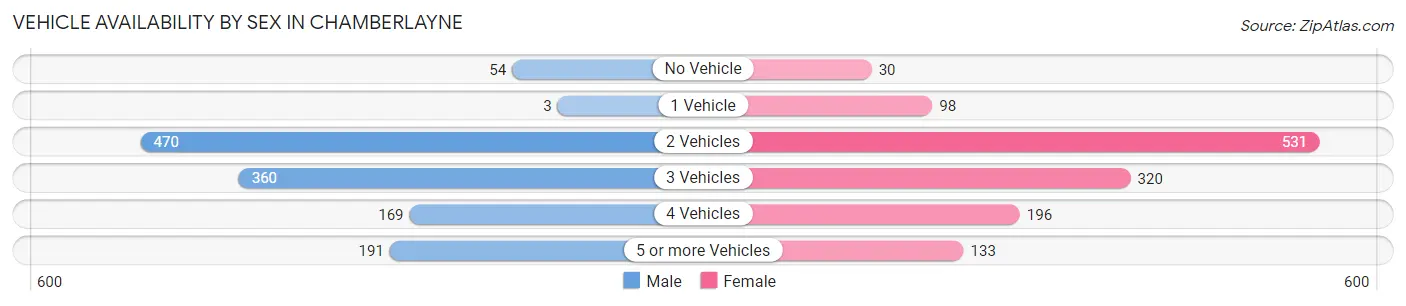
| Vehicles Available | Male | Female |
| No Vehicle | 54 (4.3%) | 30 (2.3%) |
| 1 Vehicle | 3 (0.2%) | 98 (7.5%) |
| 2 Vehicles | 470 (37.7%) | 531 (40.6%) |
| 3 Vehicles | 360 (28.9%) | 320 (24.5%) |
| 4 Vehicles | 169 (13.6%) | 196 (15.0%) |
| 5 or more Vehicles | 191 (15.3%) | 133 (10.2%) |
| Total | 1,247 (100.0%) | 1,308 (100.0%) |
Commute Time in Chamberlayne
The most frequently occuring commute durations in Chamberlayne are 15 to 19 minutes (603 commuters, 27.7%), 20 to 24 minutes (489 commuters, 22.4%), and 10 to 14 minutes (247 commuters, 11.3%).
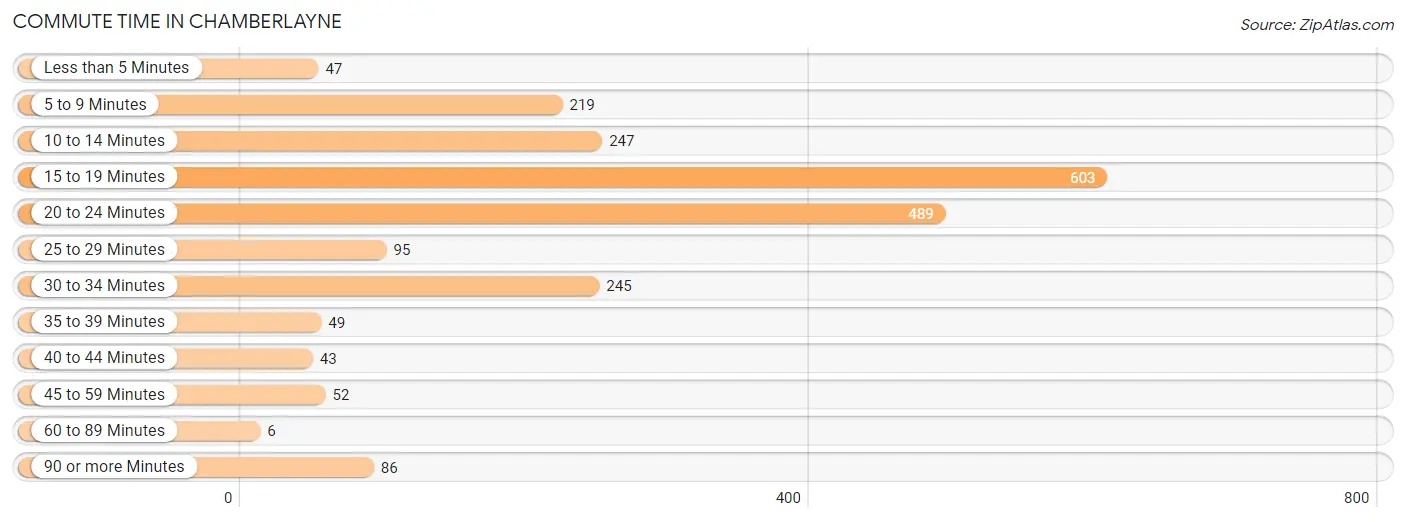
| Commute Time | # Commuters | % Commuters |
| Less than 5 Minutes | 47 | 2.1% |
| 5 to 9 Minutes | 219 | 10.0% |
| 10 to 14 Minutes | 247 | 11.3% |
| 15 to 19 Minutes | 603 | 27.7% |
| 20 to 24 Minutes | 489 | 22.4% |
| 25 to 29 Minutes | 95 | 4.4% |
| 30 to 34 Minutes | 245 | 11.2% |
| 35 to 39 Minutes | 49 | 2.2% |
| 40 to 44 Minutes | 43 | 2.0% |
| 45 to 59 Minutes | 52 | 2.4% |
| 60 to 89 Minutes | 6 | 0.3% |
| 90 or more Minutes | 86 | 3.9% |
Commute Time by Sex in Chamberlayne
The most common commute times in Chamberlayne are 20 to 24 minutes (249 commuters, 23.7%) for males and 15 to 19 minutes (364 commuters, 32.2%) for females.
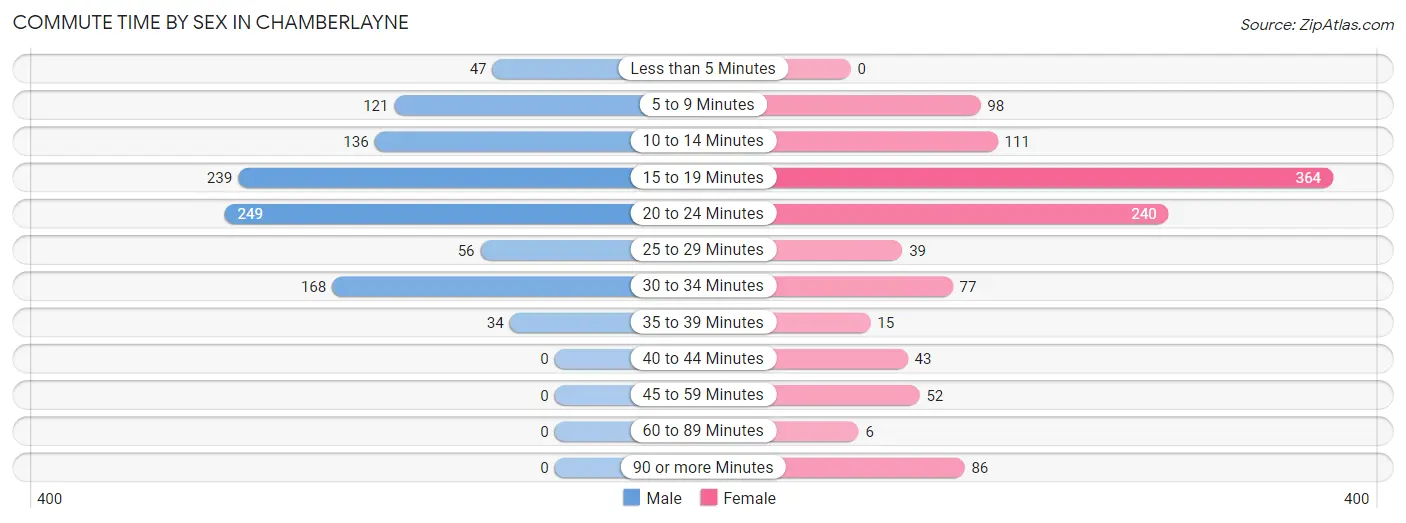
| Commute Time | Male | Female |
| Less than 5 Minutes | 47 (4.5%) | 0 (0.0%) |
| 5 to 9 Minutes | 121 (11.5%) | 98 (8.7%) |
| 10 to 14 Minutes | 136 (13.0%) | 111 (9.8%) |
| 15 to 19 Minutes | 239 (22.8%) | 364 (32.2%) |
| 20 to 24 Minutes | 249 (23.7%) | 240 (21.2%) |
| 25 to 29 Minutes | 56 (5.3%) | 39 (3.5%) |
| 30 to 34 Minutes | 168 (16.0%) | 77 (6.8%) |
| 35 to 39 Minutes | 34 (3.2%) | 15 (1.3%) |
| 40 to 44 Minutes | 0 (0.0%) | 43 (3.8%) |
| 45 to 59 Minutes | 0 (0.0%) | 52 (4.6%) |
| 60 to 89 Minutes | 0 (0.0%) | 6 (0.5%) |
| 90 or more Minutes | 0 (0.0%) | 86 (7.6%) |
Time of Departure to Work by Sex in Chamberlayne
The most frequent times of departure to work in Chamberlayne are 9:00 AM to 9:59 AM (303, 28.9%) for males and 7:00 AM to 7:29 AM (275, 24.3%) for females.
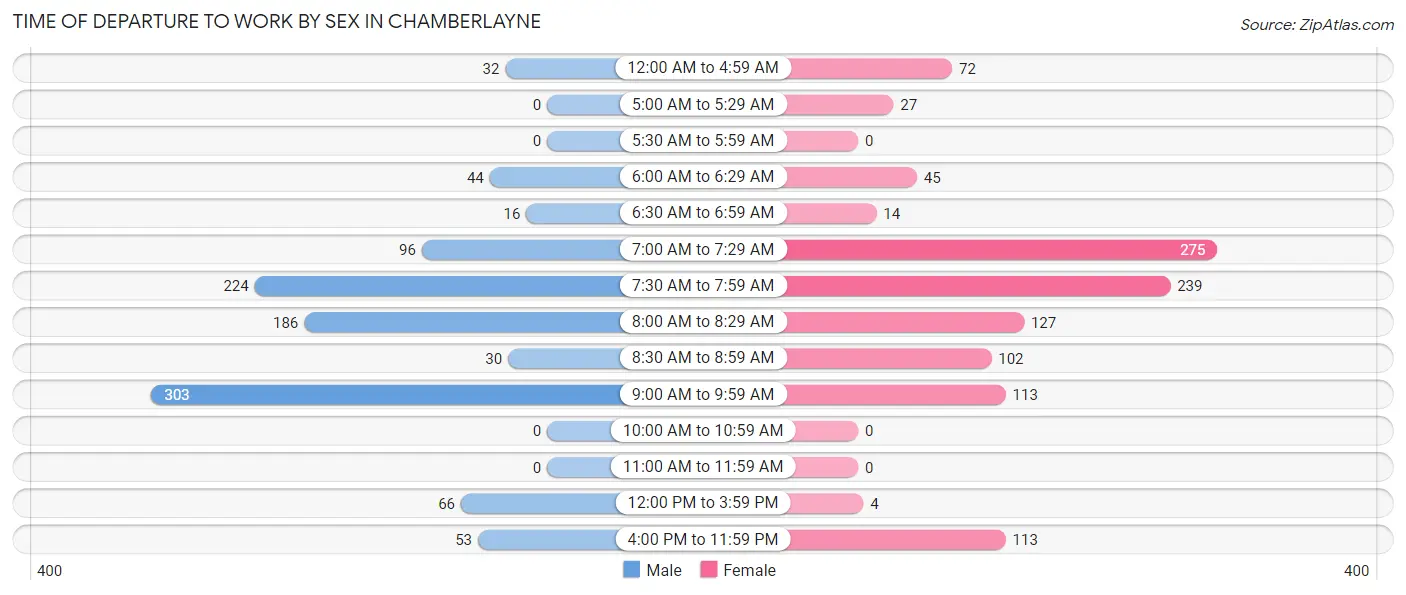
| Time of Departure | Male | Female |
| 12:00 AM to 4:59 AM | 32 (3.0%) | 72 (6.4%) |
| 5:00 AM to 5:29 AM | 0 (0.0%) | 27 (2.4%) |
| 5:30 AM to 5:59 AM | 0 (0.0%) | 0 (0.0%) |
| 6:00 AM to 6:29 AM | 44 (4.2%) | 45 (4.0%) |
| 6:30 AM to 6:59 AM | 16 (1.5%) | 14 (1.2%) |
| 7:00 AM to 7:29 AM | 96 (9.1%) | 275 (24.3%) |
| 7:30 AM to 7:59 AM | 224 (21.3%) | 239 (21.1%) |
| 8:00 AM to 8:29 AM | 186 (17.7%) | 127 (11.2%) |
| 8:30 AM to 8:59 AM | 30 (2.9%) | 102 (9.0%) |
| 9:00 AM to 9:59 AM | 303 (28.9%) | 113 (10.0%) |
| 10:00 AM to 10:59 AM | 0 (0.0%) | 0 (0.0%) |
| 11:00 AM to 11:59 AM | 0 (0.0%) | 0 (0.0%) |
| 12:00 PM to 3:59 PM | 66 (6.3%) | 4 (0.4%) |
| 4:00 PM to 11:59 PM | 53 (5.1%) | 113 (10.0%) |
| Total | 1,050 (100.0%) | 1,131 (100.0%) |
Housing Occupancy in Chamberlayne
Occupancy by Ownership in Chamberlayne
Of the total 2,082 dwellings in Chamberlayne, owner-occupied units account for 1,975 (94.9%), while renter-occupied units make up 107 (5.1%).
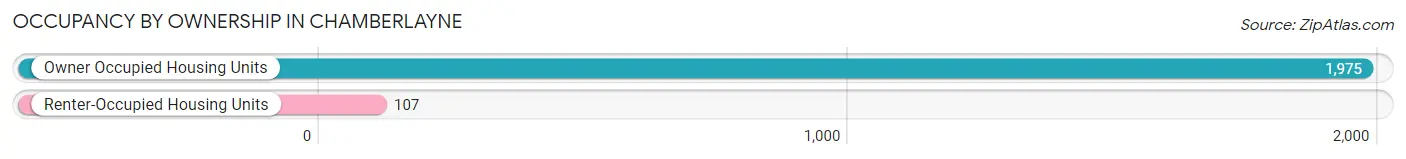
| Occupancy | # Housing Units | % Housing Units |
| Owner Occupied Housing Units | 1,975 | 94.9% |
| Renter-Occupied Housing Units | 107 | 5.1% |
| Total Occupied Housing Units | 2,082 | 100.0% |
Occupancy by Household Size in Chamberlayne
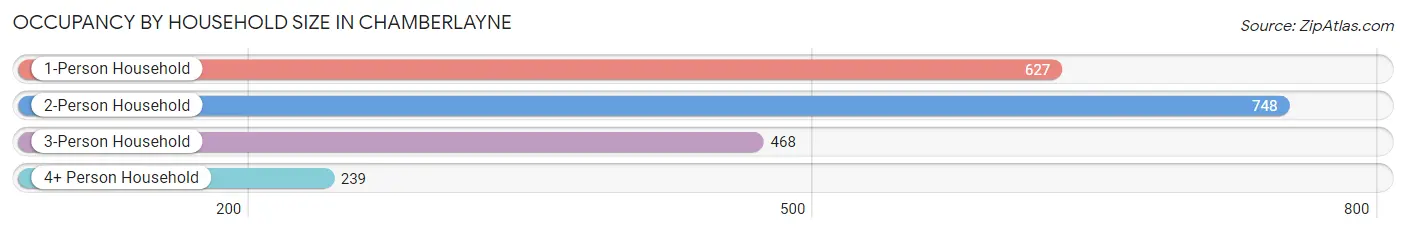
| Household Size | # Housing Units | % Housing Units |
| 1-Person Household | 627 | 30.1% |
| 2-Person Household | 748 | 35.9% |
| 3-Person Household | 468 | 22.5% |
| 4+ Person Household | 239 | 11.5% |
| Total Housing Units | 2,082 | 100.0% |
Occupancy by Ownership by Household Size in Chamberlayne
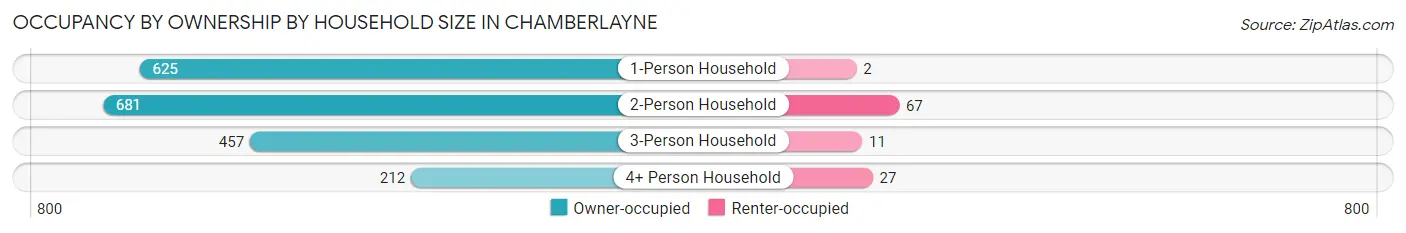
| Household Size | Owner-occupied | Renter-occupied |
| 1-Person Household | 625 (99.7%) | 2 (0.3%) |
| 2-Person Household | 681 (91.0%) | 67 (9.0%) |
| 3-Person Household | 457 (97.7%) | 11 (2.4%) |
| 4+ Person Household | 212 (88.7%) | 27 (11.3%) |
| Total Housing Units | 1,975 (94.9%) | 107 (5.1%) |
Occupancy by Educational Attainment in Chamberlayne
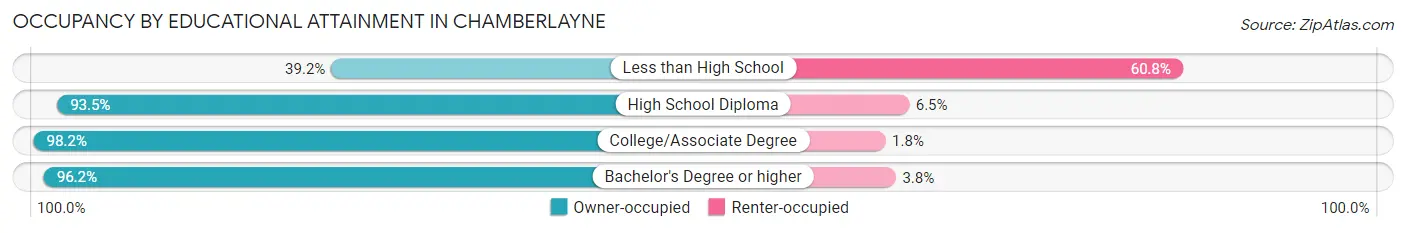
| Household Size | Owner-occupied | Renter-occupied |
| Less than High School | 20 (39.2%) | 31 (60.8%) |
| High School Diploma | 347 (93.5%) | 24 (6.5%) |
| College/Associate Degree | 551 (98.2%) | 10 (1.8%) |
| Bachelor's Degree or higher | 1,057 (96.2%) | 42 (3.8%) |
Occupancy by Age of Householder in Chamberlayne
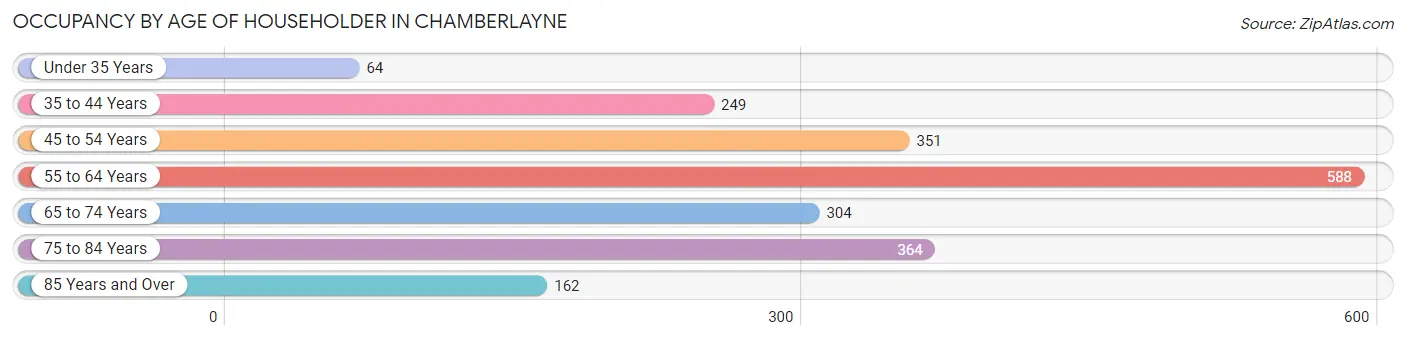
| Age Bracket | # Households | % Households |
| Under 35 Years | 64 | 3.1% |
| 35 to 44 Years | 249 | 12.0% |
| 45 to 54 Years | 351 | 16.9% |
| 55 to 64 Years | 588 | 28.2% |
| 65 to 74 Years | 304 | 14.6% |
| 75 to 84 Years | 364 | 17.5% |
| 85 Years and Over | 162 | 7.8% |
| Total | 2,082 | 100.0% |
Housing Finances in Chamberlayne
Median Income by Occupancy in Chamberlayne
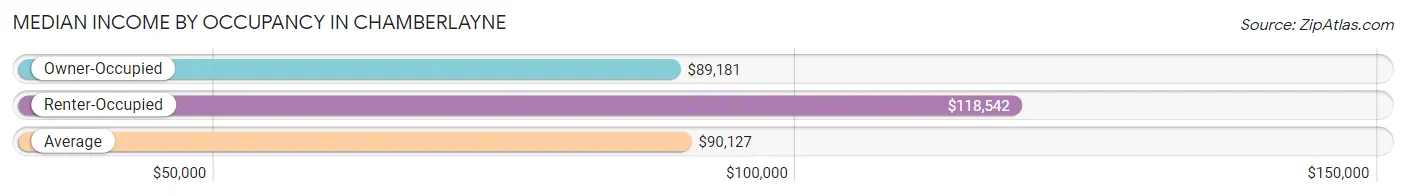
| Occupancy Type | # Households | Median Income |
| Owner-Occupied | 1,975 (94.9%) | $89,181 |
| Renter-Occupied | 107 (5.1%) | $118,542 |
| Average | 2,082 (100.0%) | $90,127 |
Occupancy by Householder Income Bracket in Chamberlayne
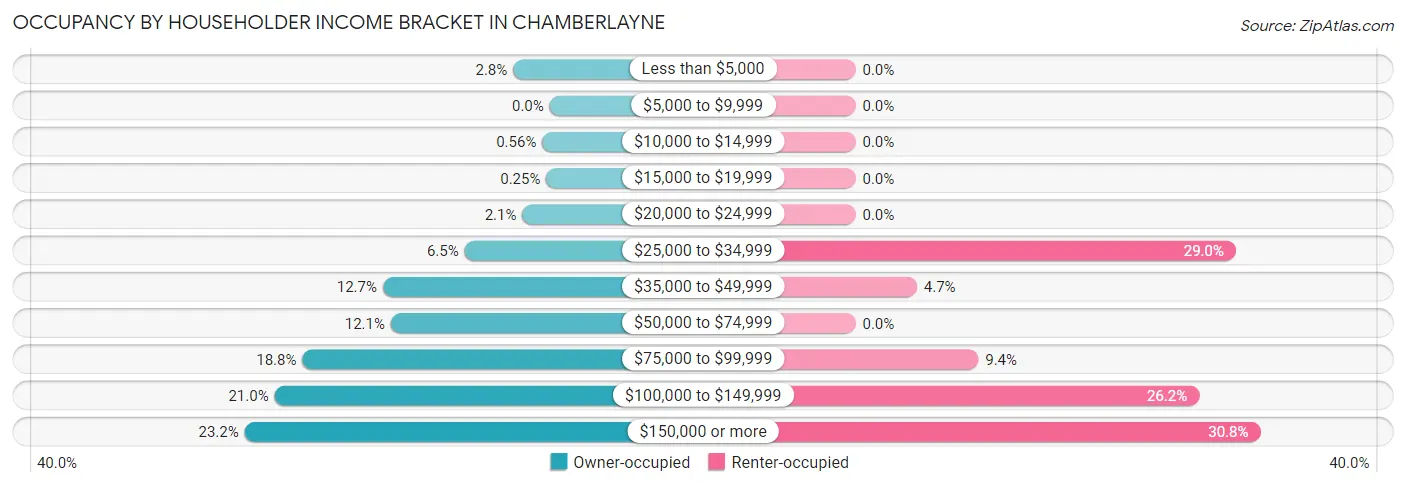
| Income Bracket | Owner-occupied | Renter-occupied |
| Less than $5,000 | 55 (2.8%) | 0 (0.0%) |
| $5,000 to $9,999 | 0 (0.0%) | 0 (0.0%) |
| $10,000 to $14,999 | 11 (0.6%) | 0 (0.0%) |
| $15,000 to $19,999 | 5 (0.3%) | 0 (0.0%) |
| $20,000 to $24,999 | 41 (2.1%) | 0 (0.0%) |
| $25,000 to $34,999 | 128 (6.5%) | 31 (29.0%) |
| $35,000 to $49,999 | 251 (12.7%) | 5 (4.7%) |
| $50,000 to $74,999 | 239 (12.1%) | 0 (0.0%) |
| $75,000 to $99,999 | 372 (18.8%) | 10 (9.3%) |
| $100,000 to $149,999 | 414 (21.0%) | 28 (26.2%) |
| $150,000 or more | 459 (23.2%) | 33 (30.8%) |
| Total | 1,975 (100.0%) | 107 (100.0%) |
Monthly Housing Cost Tiers in Chamberlayne
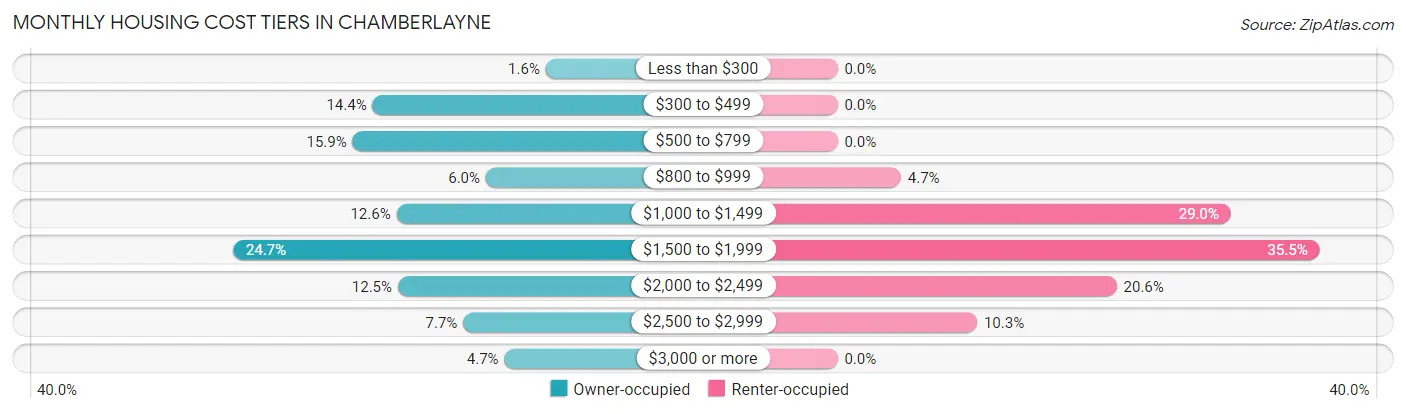
| Monthly Cost | Owner-occupied | Renter-occupied |
| Less than $300 | 32 (1.6%) | 0 (0.0%) |
| $300 to $499 | 284 (14.4%) | 0 (0.0%) |
| $500 to $799 | 313 (15.9%) | 0 (0.0%) |
| $800 to $999 | 119 (6.0%) | 5 (4.7%) |
| $1,000 to $1,499 | 249 (12.6%) | 31 (29.0%) |
| $1,500 to $1,999 | 487 (24.7%) | 38 (35.5%) |
| $2,000 to $2,499 | 247 (12.5%) | 22 (20.6%) |
| $2,500 to $2,999 | 152 (7.7%) | 11 (10.3%) |
| $3,000 or more | 92 (4.7%) | 0 (0.0%) |
| Total | 1,975 (100.0%) | 107 (100.0%) |
Physical Housing Characteristics in Chamberlayne
Housing Structures in Chamberlayne
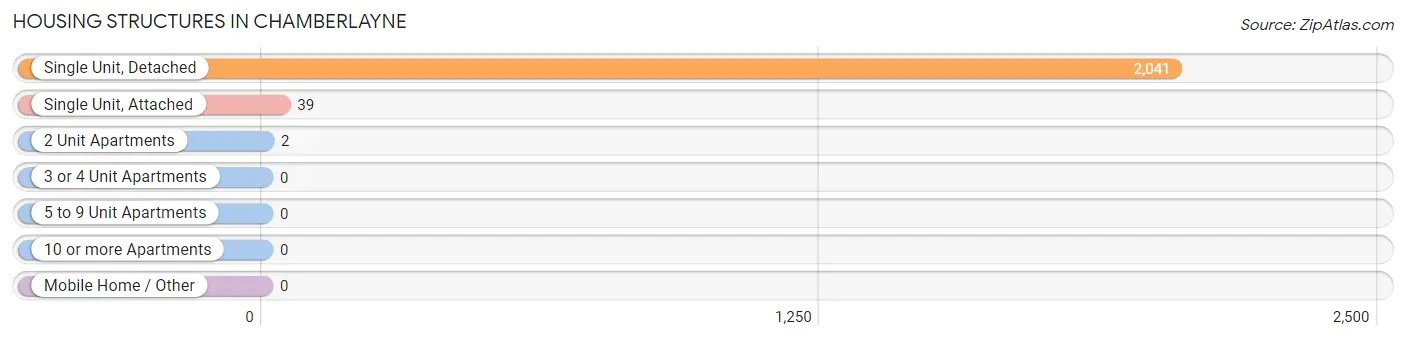
| Structure Type | # Housing Units | % Housing Units |
| Single Unit, Detached | 2,041 | 98.0% |
| Single Unit, Attached | 39 | 1.9% |
| 2 Unit Apartments | 2 | 0.1% |
| 3 or 4 Unit Apartments | 0 | 0.0% |
| 5 to 9 Unit Apartments | 0 | 0.0% |
| 10 or more Apartments | 0 | 0.0% |
| Mobile Home / Other | 0 | 0.0% |
| Total | 2,082 | 100.0% |
Housing Structures by Occupancy in Chamberlayne
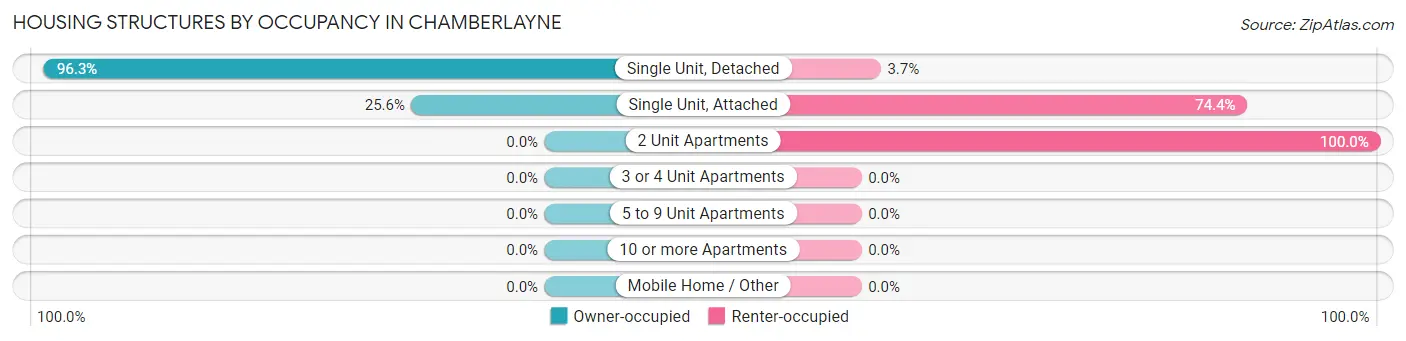
| Structure Type | Owner-occupied | Renter-occupied |
| Single Unit, Detached | 1,965 (96.3%) | 76 (3.7%) |
| Single Unit, Attached | 10 (25.6%) | 29 (74.4%) |
| 2 Unit Apartments | 0 (0.0%) | 2 (100.0%) |
| 3 or 4 Unit Apartments | 0 (0.0%) | 0 (0.0%) |
| 5 to 9 Unit Apartments | 0 (0.0%) | 0 (0.0%) |
| 10 or more Apartments | 0 (0.0%) | 0 (0.0%) |
| Mobile Home / Other | 0 (0.0%) | 0 (0.0%) |
| Total | 1,975 (94.9%) | 107 (5.1%) |
Housing Structures by Number of Rooms in Chamberlayne
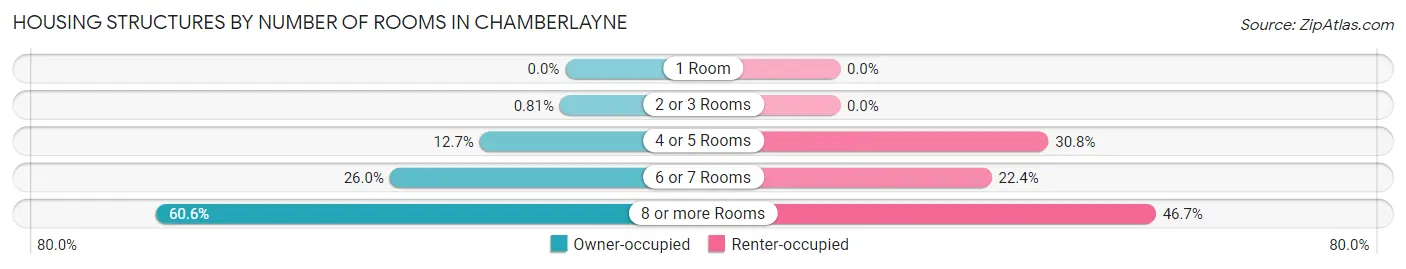
| Number of Rooms | Owner-occupied | Renter-occupied |
| 1 Room | 0 (0.0%) | 0 (0.0%) |
| 2 or 3 Rooms | 16 (0.8%) | 0 (0.0%) |
| 4 or 5 Rooms | 250 (12.7%) | 33 (30.8%) |
| 6 or 7 Rooms | 513 (26.0%) | 24 (22.4%) |
| 8 or more Rooms | 1,196 (60.6%) | 50 (46.7%) |
| Total | 1,975 (100.0%) | 107 (100.0%) |
Housing Structure by Heating Type in Chamberlayne
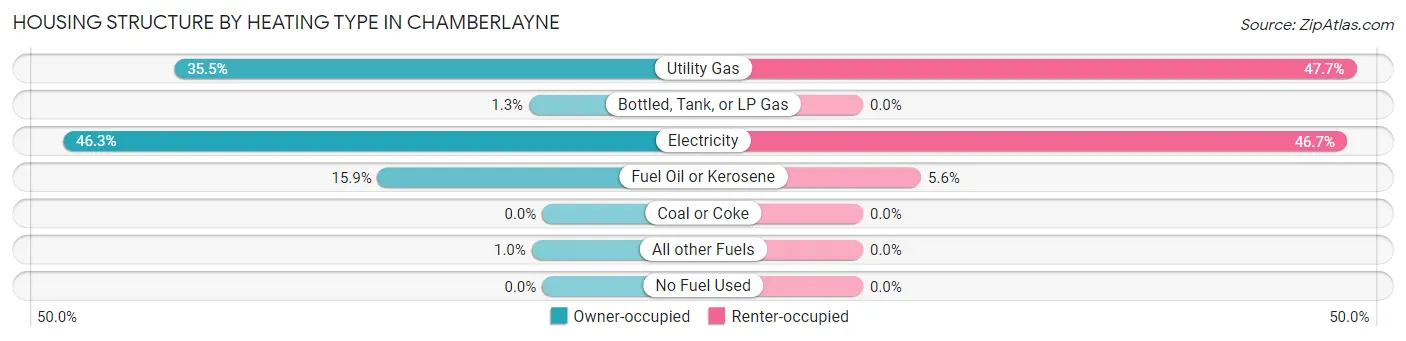
| Heating Type | Owner-occupied | Renter-occupied |
| Utility Gas | 702 (35.5%) | 51 (47.7%) |
| Bottled, Tank, or LP Gas | 25 (1.3%) | 0 (0.0%) |
| Electricity | 914 (46.3%) | 50 (46.7%) |
| Fuel Oil or Kerosene | 314 (15.9%) | 6 (5.6%) |
| Coal or Coke | 0 (0.0%) | 0 (0.0%) |
| All other Fuels | 20 (1.0%) | 0 (0.0%) |
| No Fuel Used | 0 (0.0%) | 0 (0.0%) |
| Total | 1,975 (100.0%) | 107 (100.0%) |
Household Vehicle Usage in Chamberlayne
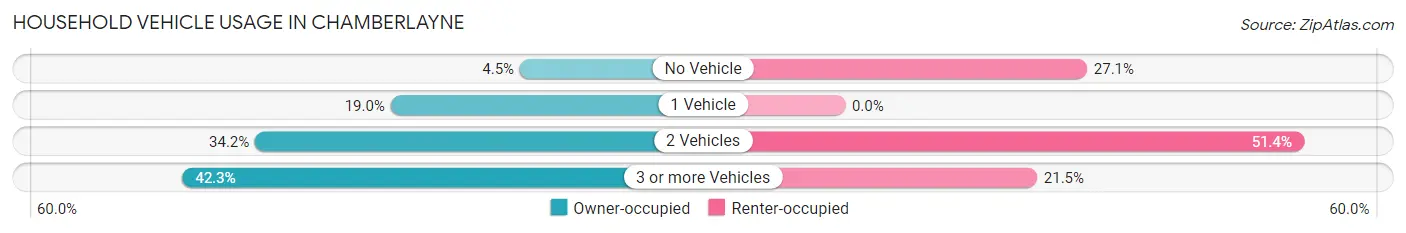
| Vehicles per Household | Owner-occupied | Renter-occupied |
| No Vehicle | 89 (4.5%) | 29 (27.1%) |
| 1 Vehicle | 375 (19.0%) | 0 (0.0%) |
| 2 Vehicles | 675 (34.2%) | 55 (51.4%) |
| 3 or more Vehicles | 836 (42.3%) | 23 (21.5%) |
| Total | 1,975 (100.0%) | 107 (100.0%) |
Real Estate & Mortgages in Chamberlayne
Real Estate and Mortgage Overview in Chamberlayne
| Characteristic | Without Mortgage | With Mortgage |
| Housing Units | 638 | 1,337 |
| Median Property Value | $267,800 | $298,800 |
| Median Household Income | $63,221 | $333 |
| Monthly Housing Costs | $522 | $92 |
| Real Estate Taxes | $1,918 | $24 |
Property Value by Mortgage Status in Chamberlayne
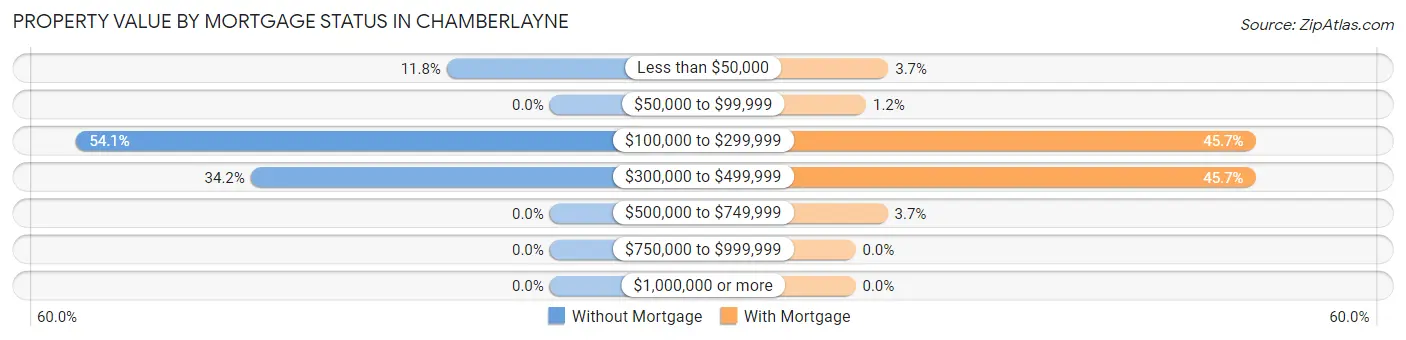
| Property Value | Without Mortgage | With Mortgage |
| Less than $50,000 | 75 (11.8%) | 50 (3.7%) |
| $50,000 to $99,999 | 0 (0.0%) | 16 (1.2%) |
| $100,000 to $299,999 | 345 (54.1%) | 611 (45.7%) |
| $300,000 to $499,999 | 218 (34.2%) | 611 (45.7%) |
| $500,000 to $749,999 | 0 (0.0%) | 49 (3.7%) |
| $750,000 to $999,999 | 0 (0.0%) | 0 (0.0%) |
| $1,000,000 or more | 0 (0.0%) | 0 (0.0%) |
| Total | 638 (100.0%) | 1,337 (100.0%) |
Household Income by Mortgage Status in Chamberlayne
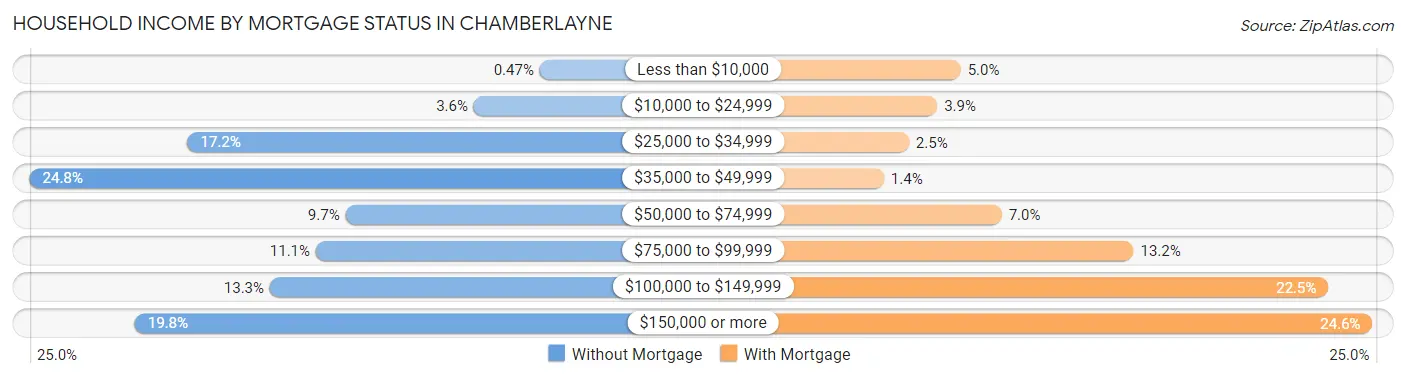
| Household Income | Without Mortgage | With Mortgage |
| Less than $10,000 | 3 (0.5%) | 67 (5.0%) |
| $10,000 to $24,999 | 23 (3.6%) | 52 (3.9%) |
| $25,000 to $34,999 | 110 (17.2%) | 34 (2.5%) |
| $35,000 to $49,999 | 158 (24.8%) | 18 (1.3%) |
| $50,000 to $74,999 | 62 (9.7%) | 93 (7.0%) |
| $75,000 to $99,999 | 71 (11.1%) | 177 (13.2%) |
| $100,000 to $149,999 | 85 (13.3%) | 301 (22.5%) |
| $150,000 or more | 126 (19.8%) | 329 (24.6%) |
| Total | 638 (100.0%) | 1,337 (100.0%) |
Property Value to Household Income Ratio in Chamberlayne
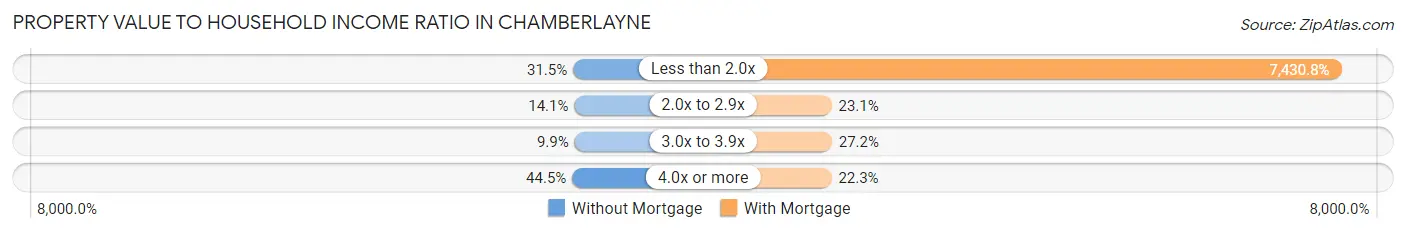
| Value-to-Income Ratio | Without Mortgage | With Mortgage |
| Less than 2.0x | 201 (31.5%) | 99,350 (7,430.8%) |
| 2.0x to 2.9x | 90 (14.1%) | 309 (23.1%) |
| 3.0x to 3.9x | 63 (9.9%) | 363 (27.2%) |
| 4.0x or more | 284 (44.5%) | 298 (22.3%) |
| Total | 638 (100.0%) | 1,337 (100.0%) |
Real Estate Taxes by Mortgage Status in Chamberlayne
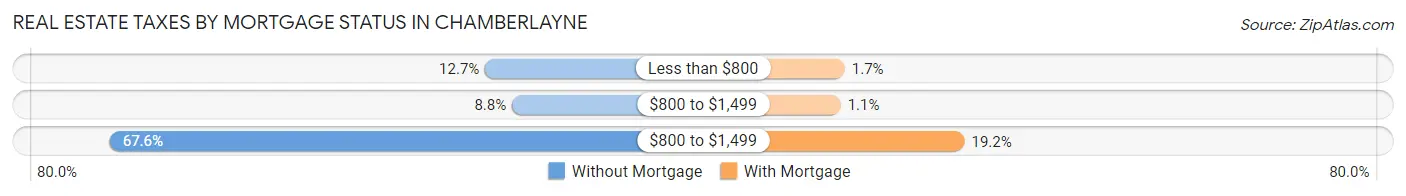
| Property Taxes | Without Mortgage | With Mortgage |
| Less than $800 | 81 (12.7%) | 23 (1.7%) |
| $800 to $1,499 | 56 (8.8%) | 15 (1.1%) |
| $800 to $1,499 | 431 (67.5%) | 257 (19.2%) |
| Total | 638 (100.0%) | 1,337 (100.0%) |
Health & Disability in Chamberlayne
Health Insurance Coverage by Age in Chamberlayne
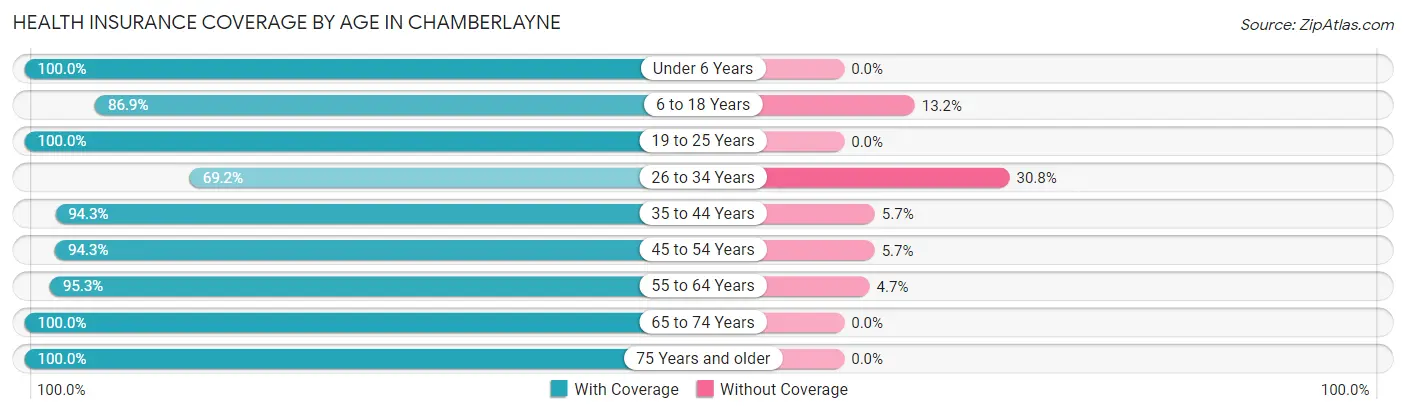
| Age Bracket | With Coverage | Without Coverage |
| Under 6 Years | 137 (100.0%) | 0 (0.0%) |
| 6 to 18 Years | 284 (86.9%) | 43 (13.2%) |
| 19 to 25 Years | 477 (100.0%) | 0 (0.0%) |
| 26 to 34 Years | 220 (69.2%) | 98 (30.8%) |
| 35 to 44 Years | 512 (94.3%) | 31 (5.7%) |
| 45 to 54 Years | 598 (94.3%) | 36 (5.7%) |
| 55 to 64 Years | 1,147 (95.3%) | 57 (4.7%) |
| 65 to 74 Years | 576 (100.0%) | 0 (0.0%) |
| 75 Years and older | 735 (100.0%) | 0 (0.0%) |
| Total | 4,686 (94.7%) | 265 (5.3%) |
Health Insurance Coverage by Citizenship Status in Chamberlayne
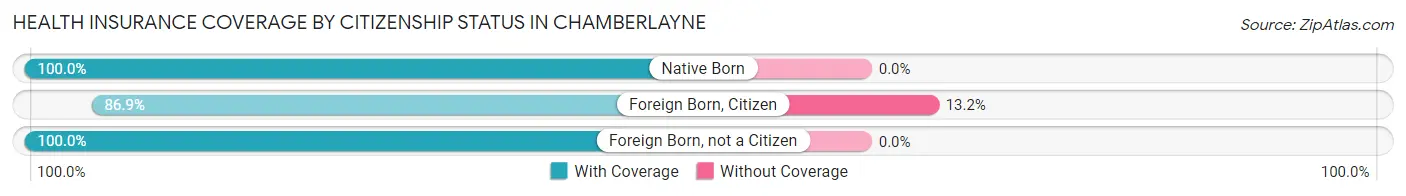
| Citizenship Status | With Coverage | Without Coverage |
| Native Born | 137 (100.0%) | 0 (0.0%) |
| Foreign Born, Citizen | 284 (86.9%) | 43 (13.2%) |
| Foreign Born, not a Citizen | 477 (100.0%) | 0 (0.0%) |
Health Insurance Coverage by Household Income in Chamberlayne
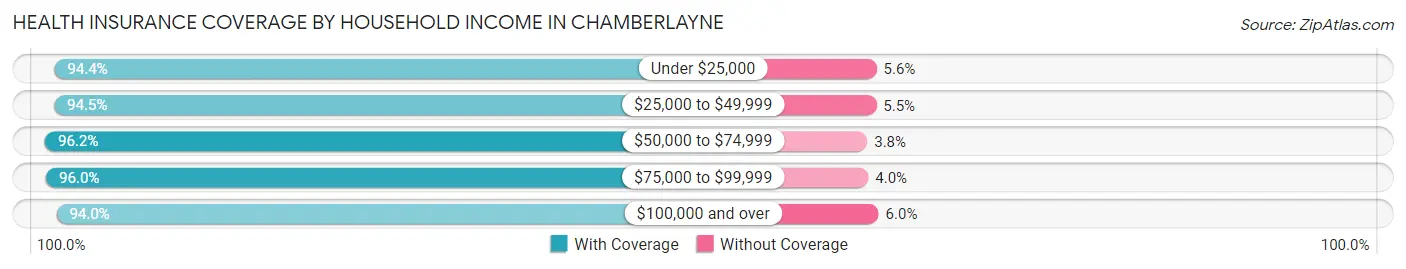
| Household Income | With Coverage | Without Coverage |
| Under $25,000 | 152 (94.4%) | 9 (5.6%) |
| $25,000 to $49,999 | 700 (94.5%) | 41 (5.5%) |
| $50,000 to $74,999 | 401 (96.2%) | 16 (3.8%) |
| $75,000 to $99,999 | 950 (96.0%) | 40 (4.0%) |
| $100,000 and over | 2,442 (94.0%) | 155 (6.0%) |
Public vs Private Health Insurance Coverage by Age in Chamberlayne
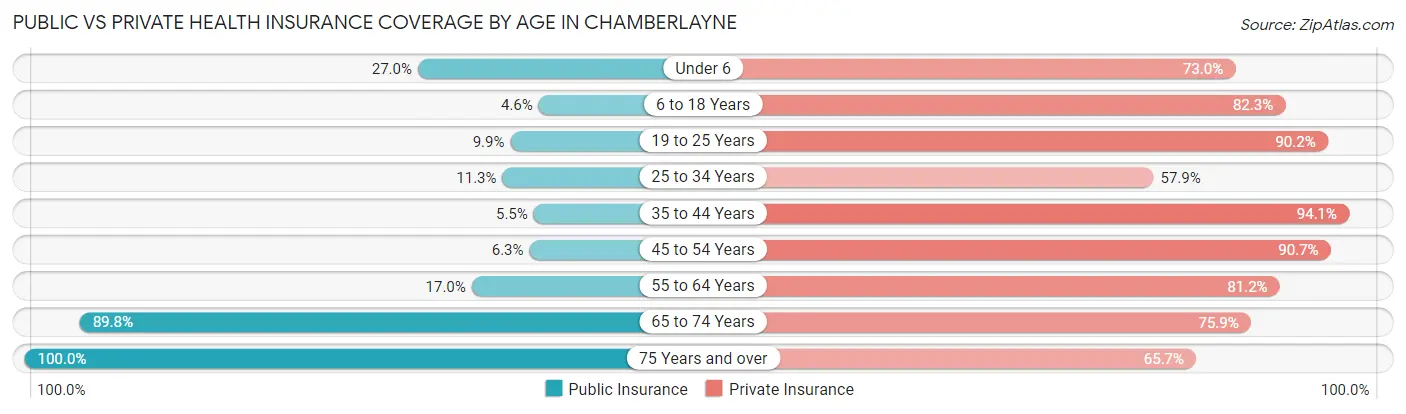
| Age Bracket | Public Insurance | Private Insurance |
| Under 6 | 37 (27.0%) | 100 (73.0%) |
| 6 to 18 Years | 15 (4.6%) | 269 (82.3%) |
| 19 to 25 Years | 47 (9.9%) | 430 (90.1%) |
| 25 to 34 Years | 36 (11.3%) | 184 (57.9%) |
| 35 to 44 Years | 30 (5.5%) | 511 (94.1%) |
| 45 to 54 Years | 40 (6.3%) | 575 (90.7%) |
| 55 to 64 Years | 205 (17.0%) | 978 (81.2%) |
| 65 to 74 Years | 517 (89.8%) | 437 (75.9%) |
| 75 Years and over | 735 (100.0%) | 483 (65.7%) |
| Total | 1,662 (33.6%) | 3,967 (80.1%) |
Disability Status by Sex by Age in Chamberlayne
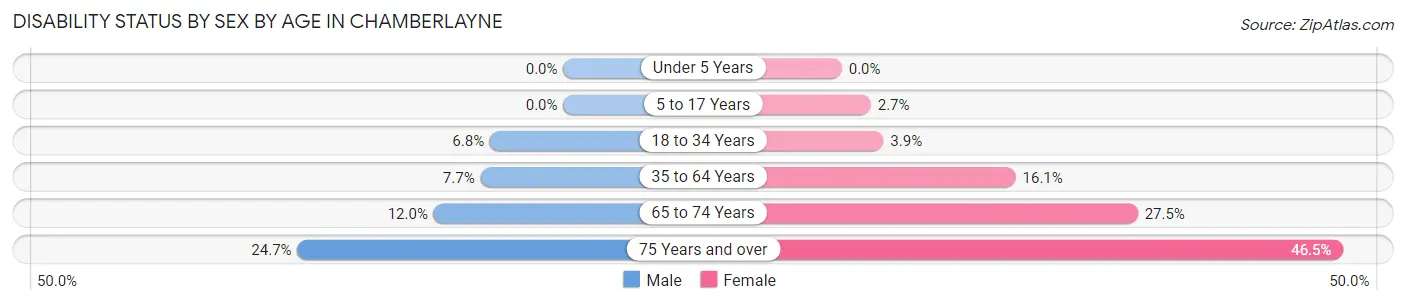
| Age Bracket | Male | Female |
| Under 5 Years | 0 (0.0%) | 0 (0.0%) |
| 5 to 17 Years | 0 (0.0%) | 6 (2.7%) |
| 18 to 34 Years | 29 (6.8%) | 15 (3.9%) |
| 35 to 64 Years | 83 (7.7%) | 210 (16.1%) |
| 65 to 74 Years | 29 (12.0%) | 92 (27.5%) |
| 75 Years and over | 78 (24.7%) | 195 (46.5%) |
Disability Class by Sex by Age in Chamberlayne
Disability Class: Hearing Difficulty
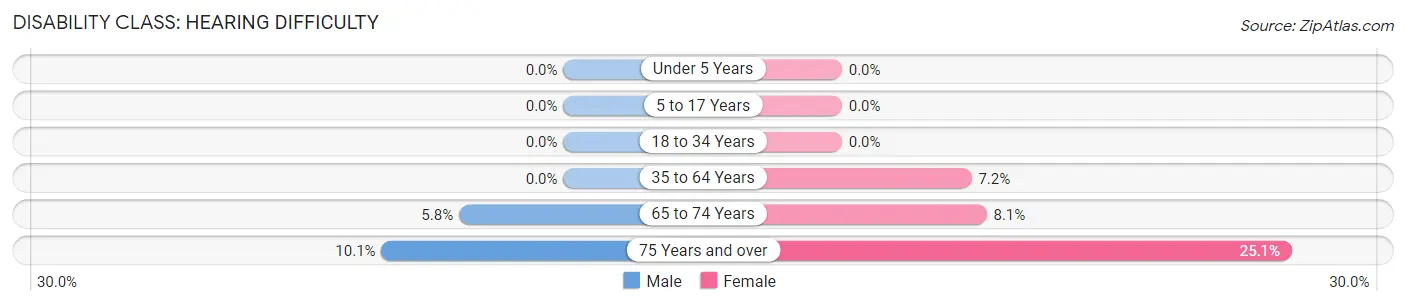
| Age Bracket | Male | Female |
| Under 5 Years | 0 (0.0%) | 0 (0.0%) |
| 5 to 17 Years | 0 (0.0%) | 0 (0.0%) |
| 18 to 34 Years | 0 (0.0%) | 0 (0.0%) |
| 35 to 64 Years | 0 (0.0%) | 94 (7.2%) |
| 65 to 74 Years | 14 (5.8%) | 27 (8.1%) |
| 75 Years and over | 32 (10.1%) | 105 (25.1%) |
Disability Class: Vision Difficulty
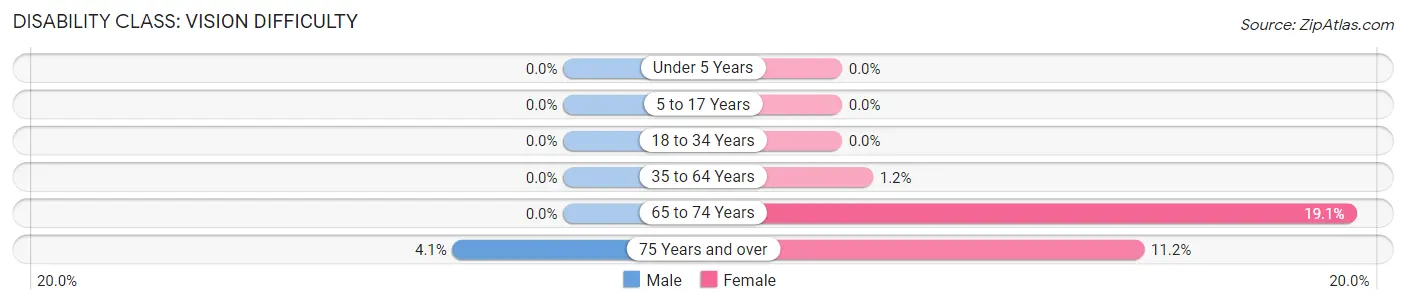
| Age Bracket | Male | Female |
| Under 5 Years | 0 (0.0%) | 0 (0.0%) |
| 5 to 17 Years | 0 (0.0%) | 0 (0.0%) |
| 18 to 34 Years | 0 (0.0%) | 0 (0.0%) |
| 35 to 64 Years | 0 (0.0%) | 15 (1.1%) |
| 65 to 74 Years | 0 (0.0%) | 64 (19.1%) |
| 75 Years and over | 13 (4.1%) | 47 (11.2%) |
Disability Class: Cognitive Difficulty
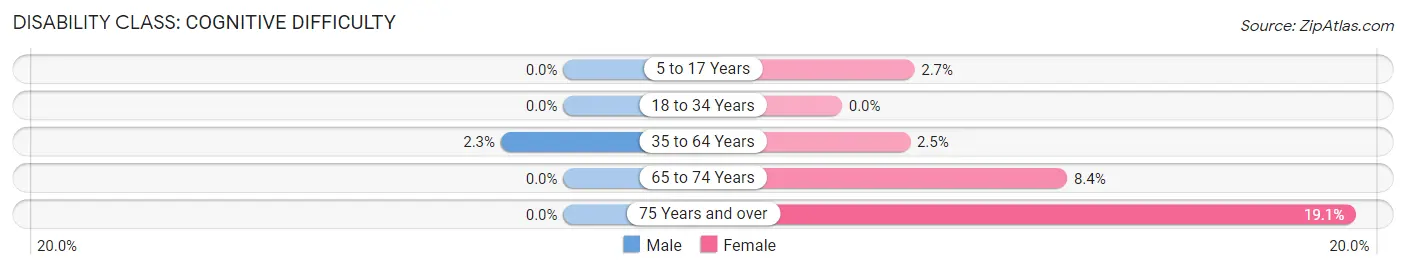
| Age Bracket | Male | Female |
| 5 to 17 Years | 0 (0.0%) | 6 (2.7%) |
| 18 to 34 Years | 0 (0.0%) | 0 (0.0%) |
| 35 to 64 Years | 25 (2.3%) | 33 (2.5%) |
| 65 to 74 Years | 0 (0.0%) | 28 (8.4%) |
| 75 Years and over | 0 (0.0%) | 80 (19.1%) |
Disability Class: Ambulatory Difficulty
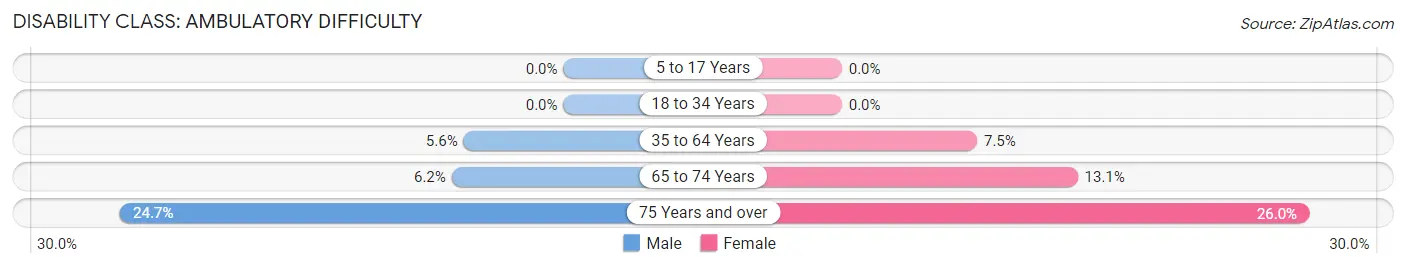
| Age Bracket | Male | Female |
| 5 to 17 Years | 0 (0.0%) | 0 (0.0%) |
| 18 to 34 Years | 0 (0.0%) | 0 (0.0%) |
| 35 to 64 Years | 60 (5.6%) | 98 (7.5%) |
| 65 to 74 Years | 15 (6.2%) | 44 (13.1%) |
| 75 Years and over | 78 (24.7%) | 109 (26.0%) |
Disability Class: Self-Care Difficulty
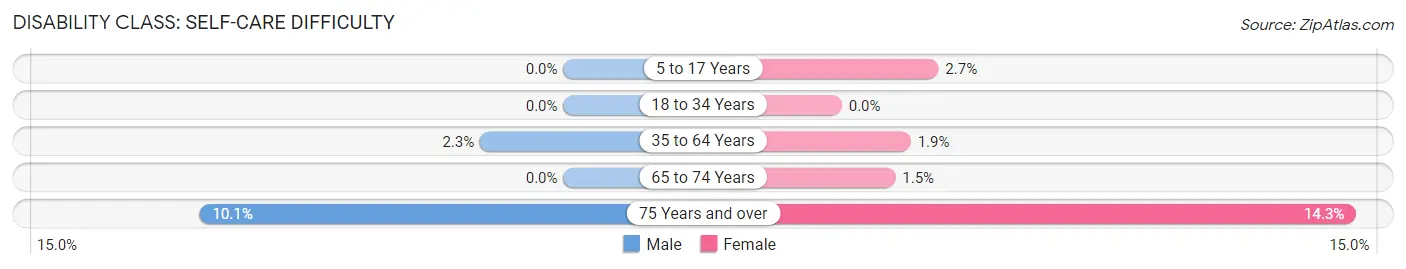
| Age Bracket | Male | Female |
| 5 to 17 Years | 0 (0.0%) | 6 (2.7%) |
| 18 to 34 Years | 0 (0.0%) | 0 (0.0%) |
| 35 to 64 Years | 25 (2.3%) | 25 (1.9%) |
| 65 to 74 Years | 0 (0.0%) | 5 (1.5%) |
| 75 Years and over | 32 (10.1%) | 60 (14.3%) |
Technology Access in Chamberlayne
Computing Device Access in Chamberlayne
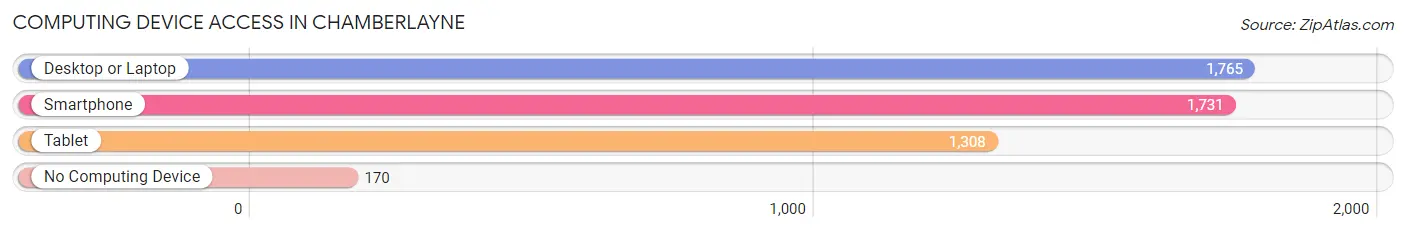
| Device Type | # Households | % Households |
| Desktop or Laptop | 1,765 | 84.8% |
| Smartphone | 1,731 | 83.1% |
| Tablet | 1,308 | 62.8% |
| No Computing Device | 170 | 8.2% |
| Total | 2,082 | 100.0% |
Internet Access in Chamberlayne
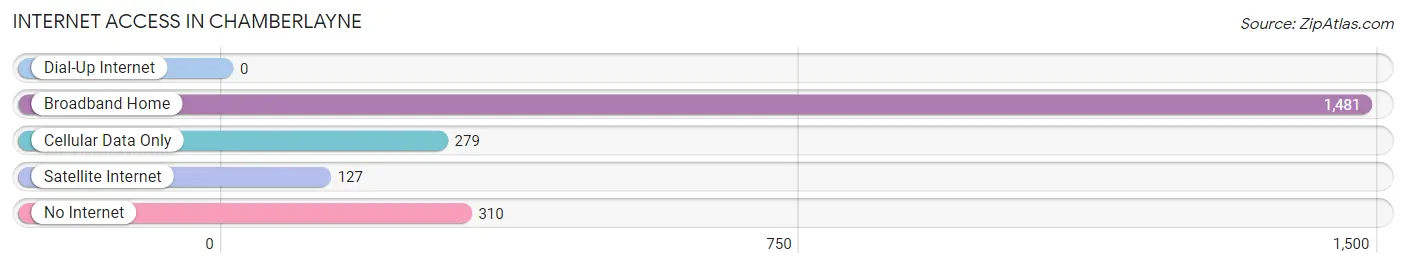
| Internet Type | # Households | % Households |
| Dial-Up Internet | 0 | 0.0% |
| Broadband Home | 1,481 | 71.1% |
| Cellular Data Only | 279 | 13.4% |
| Satellite Internet | 127 | 6.1% |
| No Internet | 310 | 14.9% |
| Total | 2,082 | 100.0% |
Chamberlayne Summary
Chamberlayne is a census-designated place (CDP) located in Henrico County, Virginia. It is a suburb of Richmond, the state capital, and is located approximately 10 miles east of the city. The population of Chamberlayne was 8,845 at the 2010 census.
History
Chamberlayne was first settled in the early 1700s by English colonists. The area was originally known as “Chamberlayne’s Store” after the store owned by the Chamberlayne family. The store was located at the intersection of what is now Chamberlayne Avenue and Brook Road. The area was officially incorporated as a town in 1875.
In the late 19th century, Chamberlayne was a popular destination for wealthy Richmonders looking to escape the city. The area was known for its large estates and luxurious homes. In the early 20th century, the area began to transition from a rural area to a more suburban one. The Chamberlayne area was annexed by the City of Richmond in 1926.
Geography
Chamberlayne is located in Henrico County, Virginia. It is situated approximately 10 miles east of Richmond, the state capital. The CDP has a total area of 4.2 square miles, all of which is land. The terrain is mostly flat, with some rolling hills.
Economy
Chamberlayne’s economy is largely based on the service industry. The area is home to a variety of restaurants, retail stores, and other businesses. The area is also home to several large employers, including the University of Richmond, Bon Secours Richmond Health System, and Capital One.
Demographics
As of the 2010 census, the population of Chamberlayne was 8,845. The racial makeup of the CDP was 79.3% White, 13.2% African American, 0.7% Native American, 2.2% Asian, 0.1% Pacific Islander, and 4.5% from other races. Hispanic or Latino of any race were 6.3% of the population.
The median household income in Chamberlayne was $60,945 in 2019. The median age was 38.7 years. The homeownership rate was 73.3%.
Chamberlayne is a diverse community with a variety of cultures and backgrounds. The area is home to a large number of immigrants from Latin America, Asia, and Africa. The area is also home to a large number of military veterans.
Common Questions
What is Per Capita Income in Chamberlayne?
Per Capita income in Chamberlayne is $49,125.
What is the Median Family Income in Chamberlayne?
Median Family Income in Chamberlayne is $112,625.
What is the Median Household income in Chamberlayne?
Median Household Income in Chamberlayne is $90,127.
What is Income or Wage Gap in Chamberlayne?
Income or Wage Gap in Chamberlayne is 15.7%.
Women in Chamberlayne earn 84.3 cents for every dollar earned by a man.
What is Inequality or Gini Index in Chamberlayne?
Inequality or Gini Index in Chamberlayne is 0.39.
What is the Total Population of Chamberlayne?
Total Population of Chamberlayne is 4,965.
What is the Total Male Population of Chamberlayne?
Total Male Population of Chamberlayne is 2,246.
What is the Total Female Population of Chamberlayne?
Total Female Population of Chamberlayne is 2,719.
What is the Ratio of Males per 100 Females in Chamberlayne?
There are 82.60 Males per 100 Females in Chamberlayne.
What is the Ratio of Females per 100 Males in Chamberlayne?
There are 121.06 Females per 100 Males in Chamberlayne.
What is the Median Population Age in Chamberlayne?
Median Population Age in Chamberlayne is 55.4 Years.
What is the Average Family Size in Chamberlayne
Average Family Size in Chamberlayne is 2.9 People.
What is the Average Household Size in Chamberlayne
Average Household Size in Chamberlayne is 2.4 People.
How Large is the Labor Force in Chamberlayne?
There are 2,772 People in the Labor Forcein in Chamberlayne.
What is the Percentage of People in the Labor Force in Chamberlayne?
60.2% of People are in the Labor Force in Chamberlayne.
What is the Unemployment Rate in Chamberlayne?
Unemployment Rate in Chamberlayne is 7.2%.