Zip Codes with the Highest Percentage of State Government Employees in Warren, OH
RELATED REPORTS & OPTIONS
State Government Employees
Warren
Compare Zip Codes
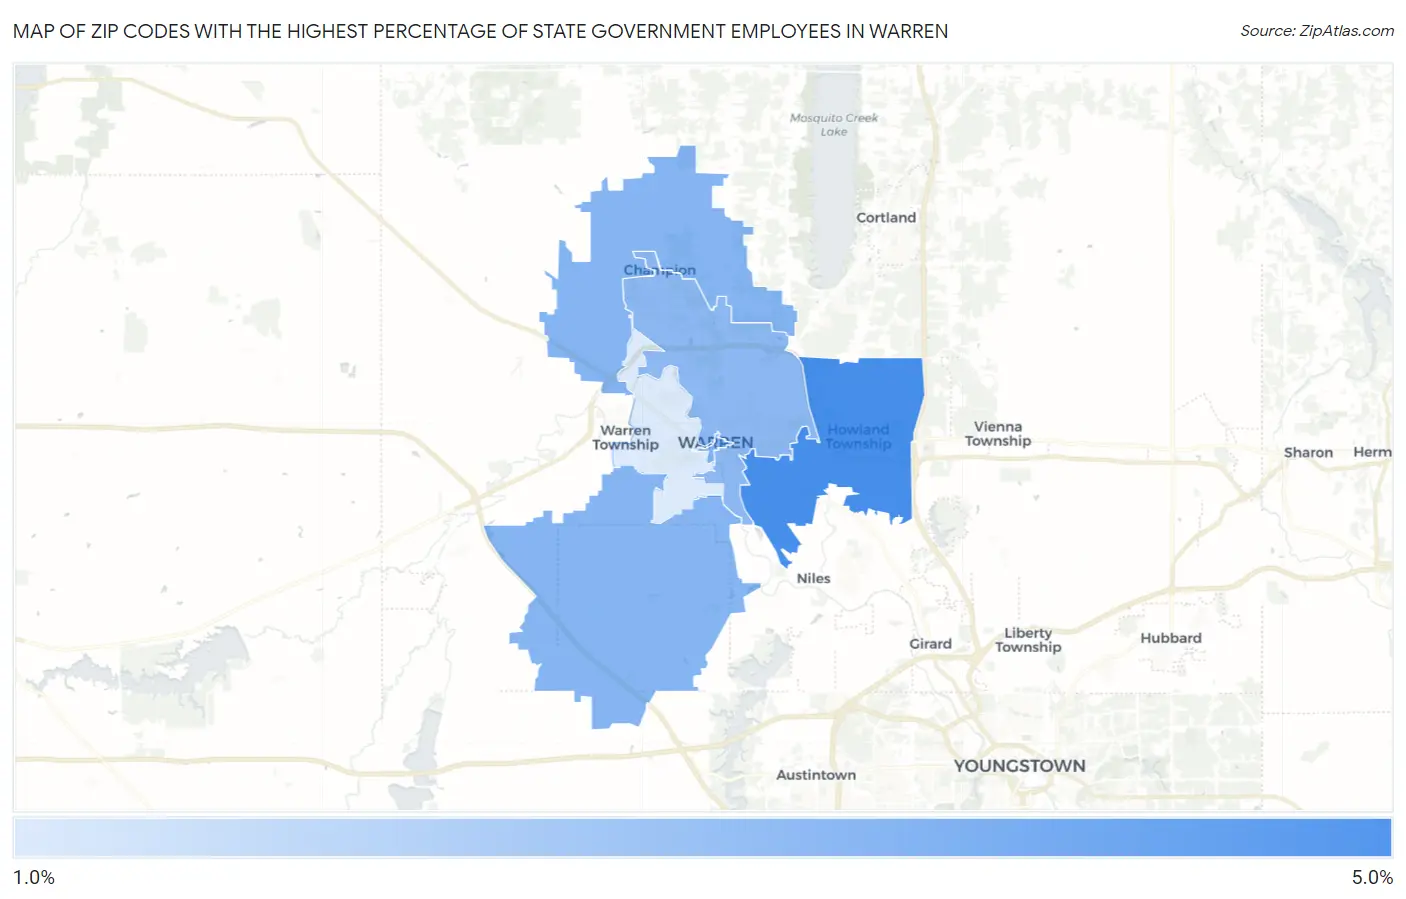
Map of Zip Codes with the Highest Percentage of State Government Employees in Warren
1.4%
4.1%
Zip Codes with the Highest Percentage of State Government Employees in Warren, OH
| Zip Code | % State Government Employees | vs State | vs National | |
| 1. | 44484 | 4.1% | 3.1%(+1.00)#261 | 4.2%(-0.143)#13,557 |
| 2. | 44481 | 2.9% | 3.1%(-0.168)#420 | 4.2%(-1.31)#18,249 |
| 3. | 44483 | 2.8% | 3.1%(-0.256)#438 | 4.2%(-1.40)#18,661 |
| 4. | 44485 | 1.4% | 3.1%(-1.75)#797 | 4.2%(-2.89)#25,392 |
1
Common Questions
What are the Top 3 Zip Codes with the Highest Percentage of State Government Employees in Warren, OH?
Top 3 Zip Codes with the Highest Percentage of State Government Employees in Warren, OH are:
What zip code has the Highest Percentage of State Government Employees in Warren, OH?
44484 has the Highest Percentage of State Government Employees in Warren, OH with 4.1%.
What is the Percentage of State Government Employees in Warren, OH?
Percentage of State Government Employees in Warren is 2.3%.
What is the Percentage of State Government Employees in Ohio?
Percentage of State Government Employees in Ohio is 3.1%.
What is the Percentage of State Government Employees in the United States?
Percentage of State Government Employees in the United States is 4.2%.