Zip Codes with the Highest Percentage of State Government Employees in Bowling Green, OH
RELATED REPORTS & OPTIONS
State Government Employees
Bowling Green
Compare Zip Codes
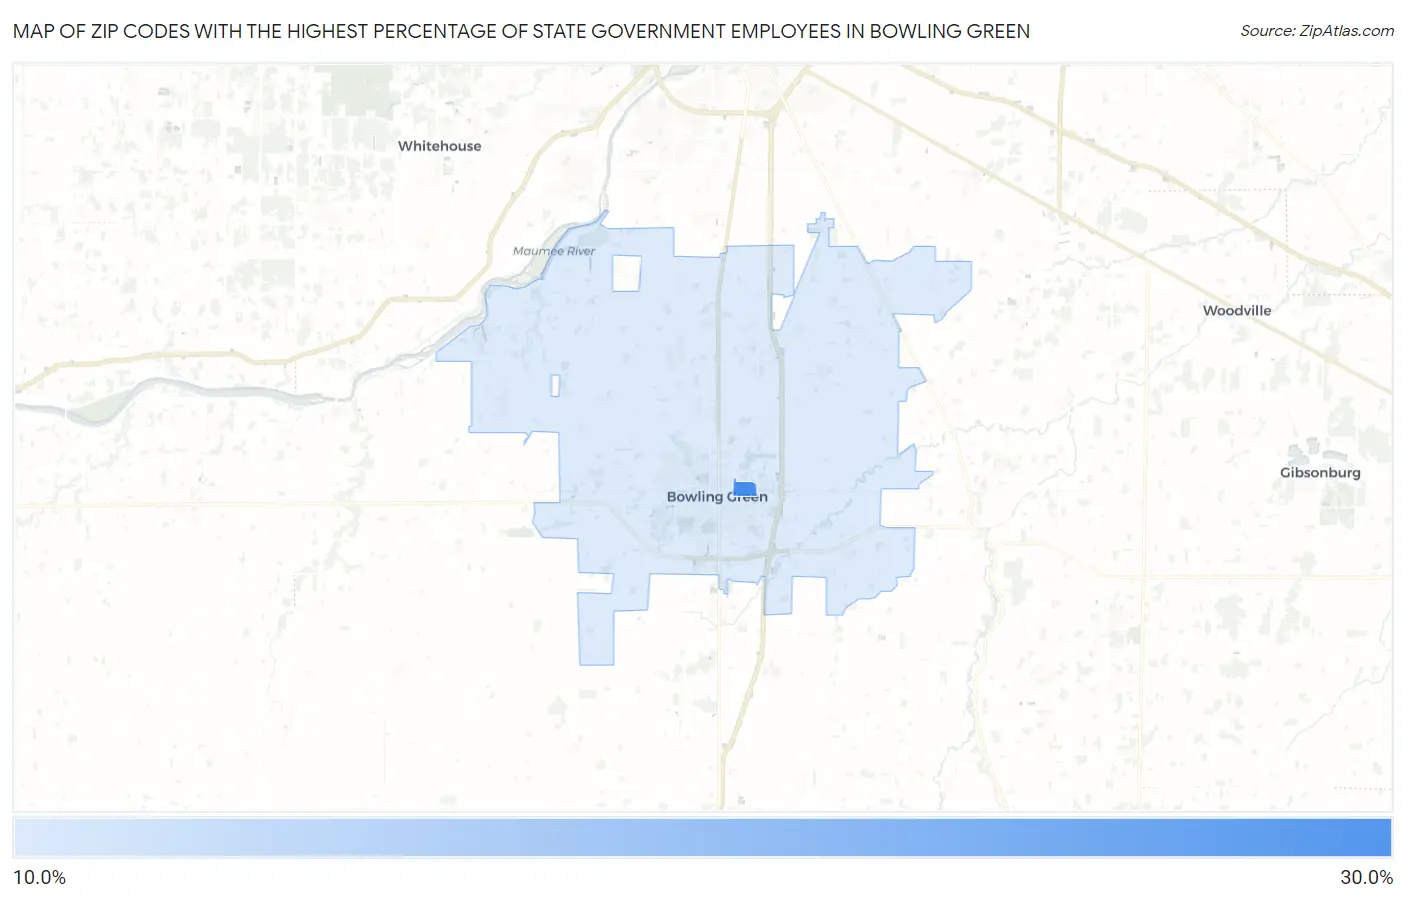
Map of Zip Codes with the Highest Percentage of State Government Employees in Bowling Green
11.1%
26.7%
Zip Codes with the Highest Percentage of State Government Employees in Bowling Green, OH
| Zip Code | % State Government Employees | vs State | vs National | |
| 1. | 43403 | 26.7% | 3.1%(+23.6)#12 | 4.2%(+22.4)#481 |
| 2. | 43402 | 11.1% | 3.1%(+8.04)#45 | 4.2%(+6.89)#3,141 |
1
Common Questions
What are the Top Zip Codes with the Highest Percentage of State Government Employees in Bowling Green, OH?
Top Zip Codes with the Highest Percentage of State Government Employees in Bowling Green, OH are:
What zip code has the Highest Percentage of State Government Employees in Bowling Green, OH?
43403 has the Highest Percentage of State Government Employees in Bowling Green, OH with 26.7%.
What is the Percentage of State Government Employees in Bowling Green, OH?
Percentage of State Government Employees in Bowling Green is 12.1%.
What is the Percentage of State Government Employees in Ohio?
Percentage of State Government Employees in Ohio is 3.1%.
What is the Percentage of State Government Employees in the United States?
Percentage of State Government Employees in the United States is 4.2%.