Beaverton, MI Map & Demographics
Beaverton Map
Beaverton Overview
$23,215
PER CAPITA INCOME
$48,125
AVG FAMILY INCOME
$31,985
AVG HOUSEHOLD INCOME
31.3%
WAGE / INCOME GAP [ % ]
68.7¢/ $1
WAGE / INCOME GAP [ $ ]
0.55
INEQUALITY / GINI INDEX
1,194
TOTAL POPULATION
521
MALE POPULATION
673
FEMALE POPULATION
77.41
MALES / 100 FEMALES
129.17
FEMALES / 100 MALES
39.6
MEDIAN AGE
3.2
AVG FAMILY SIZE
2.3
AVG HOUSEHOLD SIZE
472
LABOR FORCE [ PEOPLE ]
49.5%
PERCENT IN LABOR FORCE
7.4%
UNEMPLOYMENT RATE
Beaverton Zip Codes
Beaverton Area Codes
Income in Beaverton
Income Overview in Beaverton
Per Capita Income in Beaverton is $23,215, while median incomes of families and households are $48,125 and $31,985 respectively.
| Characteristic | Number | Measure |
| Per Capita Income | 1,194 | $23,215 |
| Median Family Income | 270 | $48,125 |
| Mean Family Income | 270 | $53,396 |
| Median Household Income | 519 | $31,985 |
| Mean Household Income | 519 | $53,406 |
| Income Deficit | 270 | $0 |
| Wage / Income Gap (%) | 1,194 | 31.28% |
| Wage / Income Gap ($) | 1,194 | 68.72¢ per $1 |
| Gini / Inequality Index | 1,194 | 0.55 |
Earnings by Sex in Beaverton
Average Earnings in Beaverton are $24,432, $27,283 for men and $18,750 for women, a difference of 31.3%.
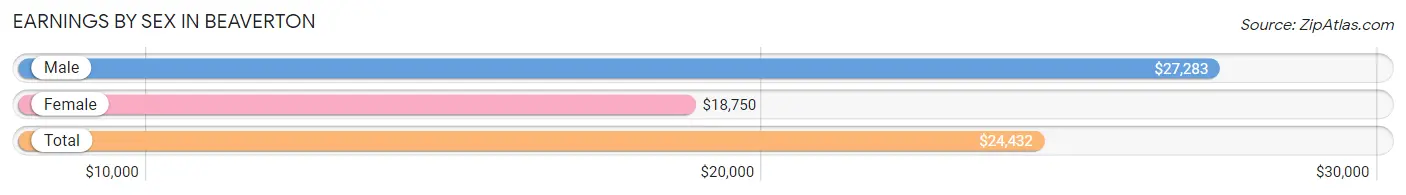
| Sex | Number | Average Earnings |
| Male | 234 (48.2%) | $27,283 |
| Female | 251 (51.7%) | $18,750 |
| Total | 485 (100.0%) | $24,432 |
Earnings by Sex by Income Bracket in Beaverton
The most common earnings brackets in Beaverton are $25,000 to $29,999 for men (31 | 13.3%) and $5,000 to $7,499 for women (49 | 19.5%).
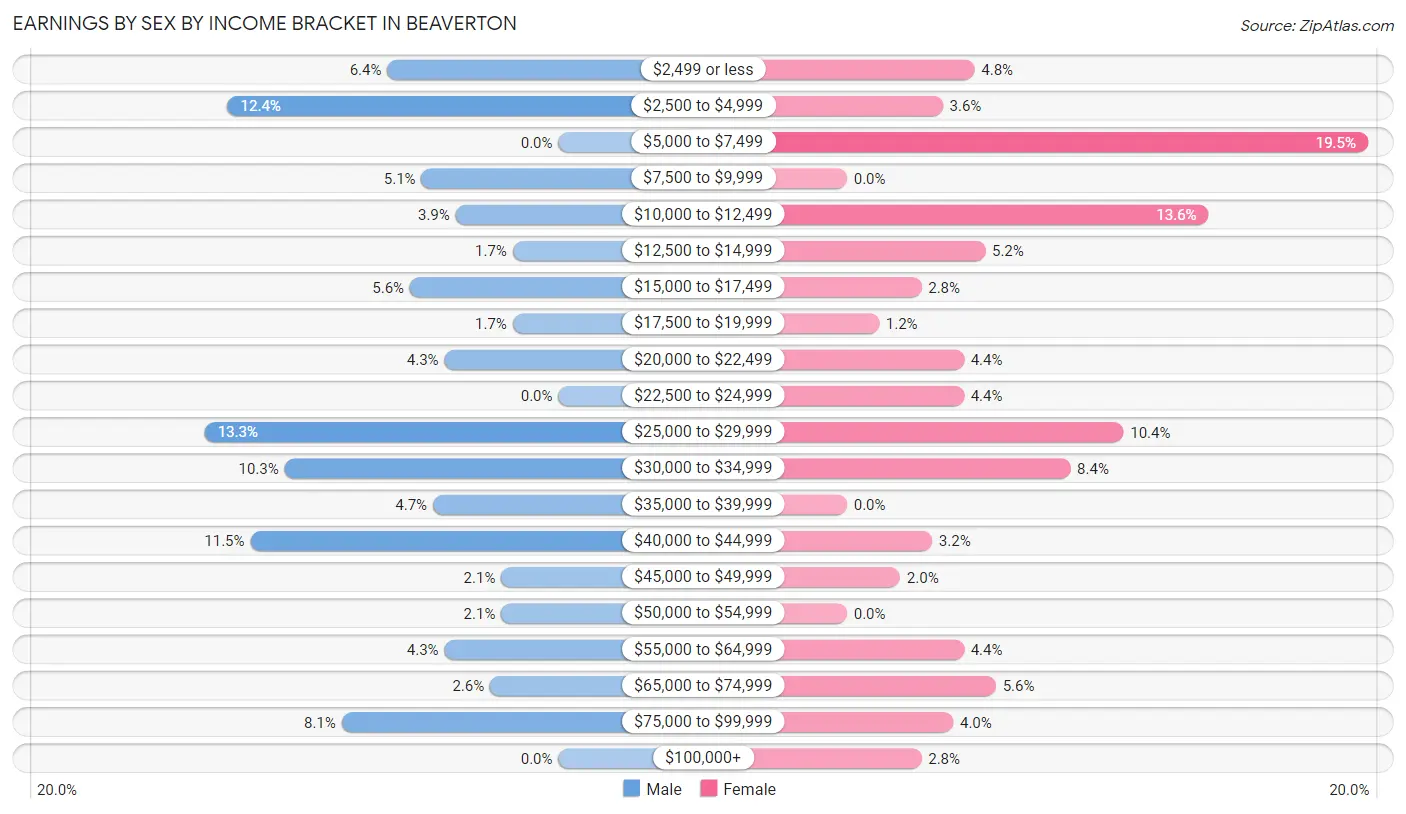
| Income | Male | Female |
| $2,499 or less | 15 (6.4%) | 12 (4.8%) |
| $2,500 to $4,999 | 29 (12.4%) | 9 (3.6%) |
| $5,000 to $7,499 | 0 (0.0%) | 49 (19.5%) |
| $7,500 to $9,999 | 12 (5.1%) | 0 (0.0%) |
| $10,000 to $12,499 | 9 (3.8%) | 34 (13.6%) |
| $12,500 to $14,999 | 4 (1.7%) | 13 (5.2%) |
| $15,000 to $17,499 | 13 (5.6%) | 7 (2.8%) |
| $17,500 to $19,999 | 4 (1.7%) | 3 (1.2%) |
| $20,000 to $22,499 | 10 (4.3%) | 11 (4.4%) |
| $22,500 to $24,999 | 0 (0.0%) | 11 (4.4%) |
| $25,000 to $29,999 | 31 (13.3%) | 26 (10.4%) |
| $30,000 to $34,999 | 24 (10.3%) | 21 (8.4%) |
| $35,000 to $39,999 | 11 (4.7%) | 0 (0.0%) |
| $40,000 to $44,999 | 27 (11.5%) | 8 (3.2%) |
| $45,000 to $49,999 | 5 (2.1%) | 5 (2.0%) |
| $50,000 to $54,999 | 5 (2.1%) | 0 (0.0%) |
| $55,000 to $64,999 | 10 (4.3%) | 11 (4.4%) |
| $65,000 to $74,999 | 6 (2.6%) | 14 (5.6%) |
| $75,000 to $99,999 | 19 (8.1%) | 10 (4.0%) |
| $100,000+ | 0 (0.0%) | 7 (2.8%) |
| Total | 234 (100.0%) | 251 (100.0%) |
Earnings by Sex by Educational Attainment in Beaverton
Average earnings in Beaverton are $29,844 for men and $24,792 for women, a difference of 16.9%. Men with an educational attainment of bachelor's degree enjoy the highest average annual earnings of $56,000, while those with high school diploma education earn the least with $28,281. Women with an educational attainment of graduate degree earn the most with the average annual earnings of $80,357, while those with less than high school education have the smallest earnings of $7,031.
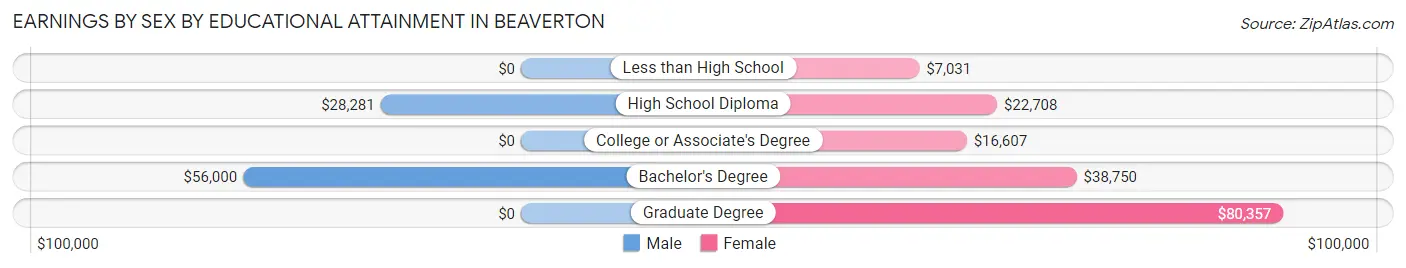
| Educational Attainment | Male Income | Female Income |
| Less than High School | - | - |
| High School Diploma | $28,281 | $22,708 |
| College or Associate's Degree | - | - |
| Bachelor's Degree | $56,000 | $38,750 |
| Graduate Degree | - | - |
| Total | $29,844 | $24,792 |
Family Income in Beaverton
Family Income Brackets in Beaverton
According to the Beaverton family income data, there are 68 families falling into the $50,000 to $74,999 income range, which is the most common income bracket and makes up 25.2% of all families.
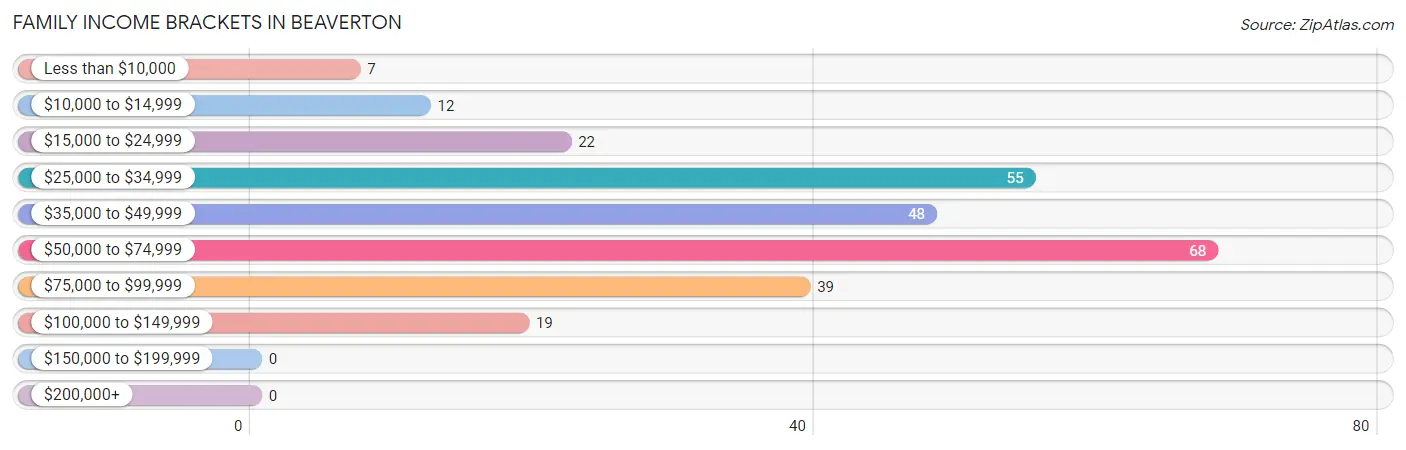
| Income Bracket | # Families | % Families |
| Less than $10,000 | 7 | 2.6% |
| $10,000 to $14,999 | 12 | 4.4% |
| $15,000 to $24,999 | 22 | 8.1% |
| $25,000 to $34,999 | 55 | 20.4% |
| $35,000 to $49,999 | 48 | 17.8% |
| $50,000 to $74,999 | 68 | 25.2% |
| $75,000 to $99,999 | 39 | 14.4% |
| $100,000 to $149,999 | 19 | 7.0% |
| $150,000 to $199,999 | 0 | 0.0% |
| $200,000+ | 0 | 0.0% |
Family Income by Famaliy Size in Beaverton
5-person families (27 | 10.0%) account for the highest median family income in Beaverton with $65,313 per family, while 2-person families (109 | 40.4%) have the highest median income of $25,938 per family member.
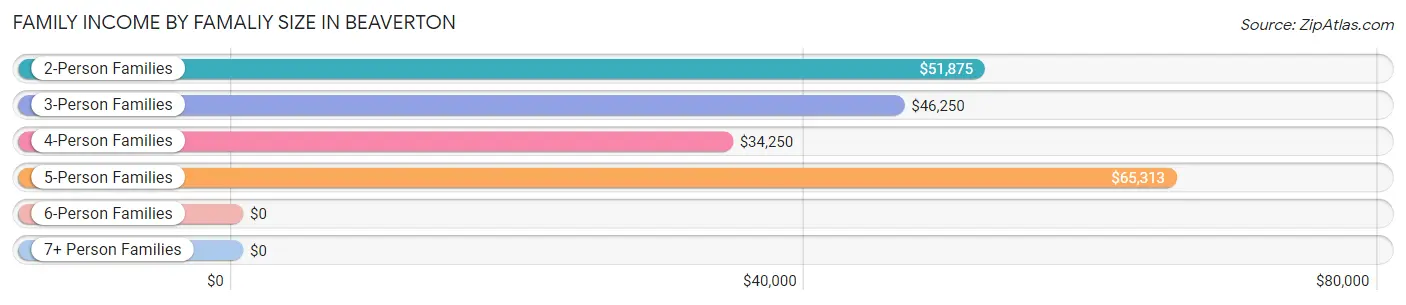
| Income Bracket | # Families | Median Income |
| 2-Person Families | 109 (40.4%) | $51,875 |
| 3-Person Families | 72 (26.7%) | $46,250 |
| 4-Person Families | 33 (12.2%) | $34,250 |
| 5-Person Families | 27 (10.0%) | $65,313 |
| 6-Person Families | 27 (10.0%) | $0 |
| 7+ Person Families | 2 (0.7%) | $0 |
| Total | 270 (100.0%) | $48,125 |
Family Income by Number of Earners in Beaverton
The median family income in Beaverton is $48,125, with families comprising 3+ earners (16) having the highest median family income of $73,750, while families with no earners (57) have the lowest median family income of $33,281, accounting for 5.9% and 21.1% of families, respectively.
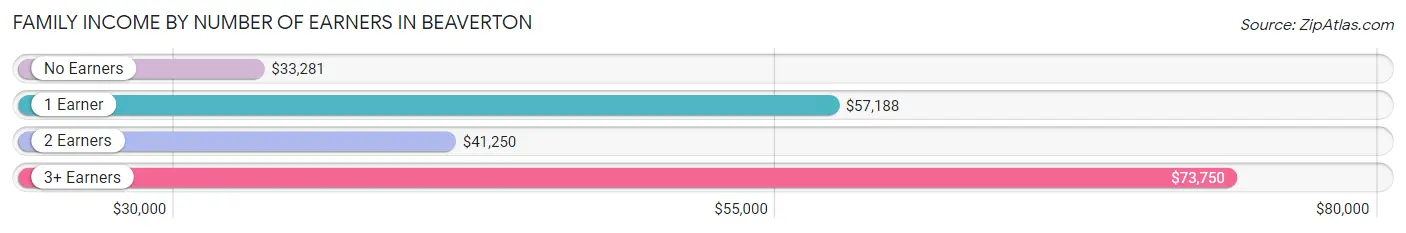
| Number of Earners | # Families | Median Income |
| No Earners | 57 (21.1%) | $33,281 |
| 1 Earner | 99 (36.7%) | $57,188 |
| 2 Earners | 98 (36.3%) | $41,250 |
| 3+ Earners | 16 (5.9%) | $73,750 |
| Total | 270 (100.0%) | $48,125 |
Household Income in Beaverton
Household Income Brackets in Beaverton
With 99 households falling in the category, the $50,000 to $74,999 income range is the most frequent in Beaverton, accounting for 19.1% of all households.
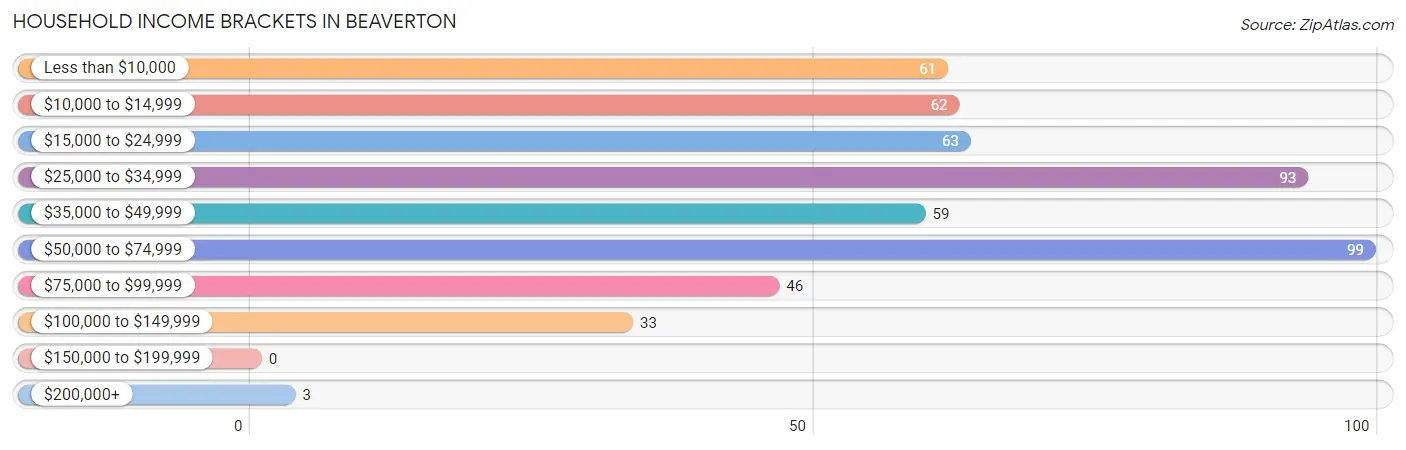
| Income Bracket | # Households | % Households |
| Less than $10,000 | 61 | 11.8% |
| $10,000 to $14,999 | 62 | 11.9% |
| $15,000 to $24,999 | 63 | 12.1% |
| $25,000 to $34,999 | 93 | 17.9% |
| $35,000 to $49,999 | 59 | 11.4% |
| $50,000 to $74,999 | 99 | 19.1% |
| $75,000 to $99,999 | 46 | 8.9% |
| $100,000 to $149,999 | 33 | 6.4% |
| $150,000 to $199,999 | 0 | 0.0% |
| $200,000+ | 3 | 0.6% |
Household Income by Householder Age in Beaverton
The median household income in Beaverton is $31,985, with the highest median household income of $51,000 found in the 15 to 24 years age bracket for the primary householder. A total of 12 households (2.3%) fall into this category. Meanwhile, the 45 to 64 years age bracket for the primary householder has the lowest median household income of $26,174, with 229 households (44.1%) in this group.
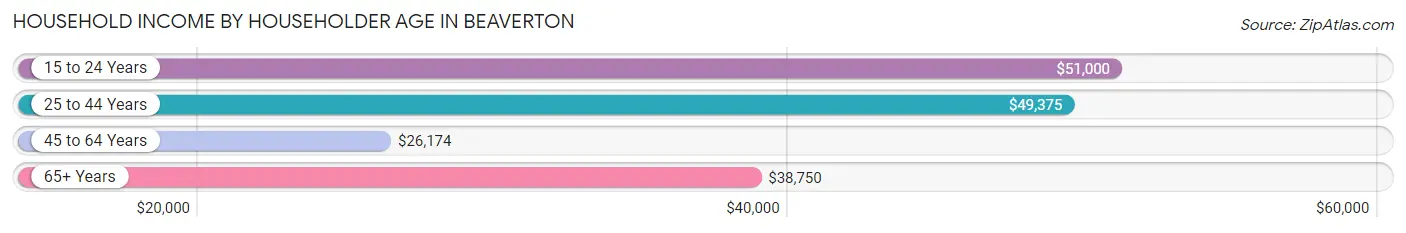
| Income Bracket | # Households | Median Income |
| 15 to 24 Years | 12 (2.3%) | $51,000 |
| 25 to 44 Years | 131 (25.2%) | $49,375 |
| 45 to 64 Years | 229 (44.1%) | $26,174 |
| 65+ Years | 147 (28.3%) | $38,750 |
| Total | 519 (100.0%) | $31,985 |
Poverty in Beaverton
Income Below Poverty by Sex and Age in Beaverton
With 22.1% poverty level for males and 30.6% for females among the residents of Beaverton, 5 year old males and 18 to 24 year old females are the most vulnerable to poverty, with 16 males (100.0%) and 30 females (54.5%) in their respective age groups living below the poverty level.
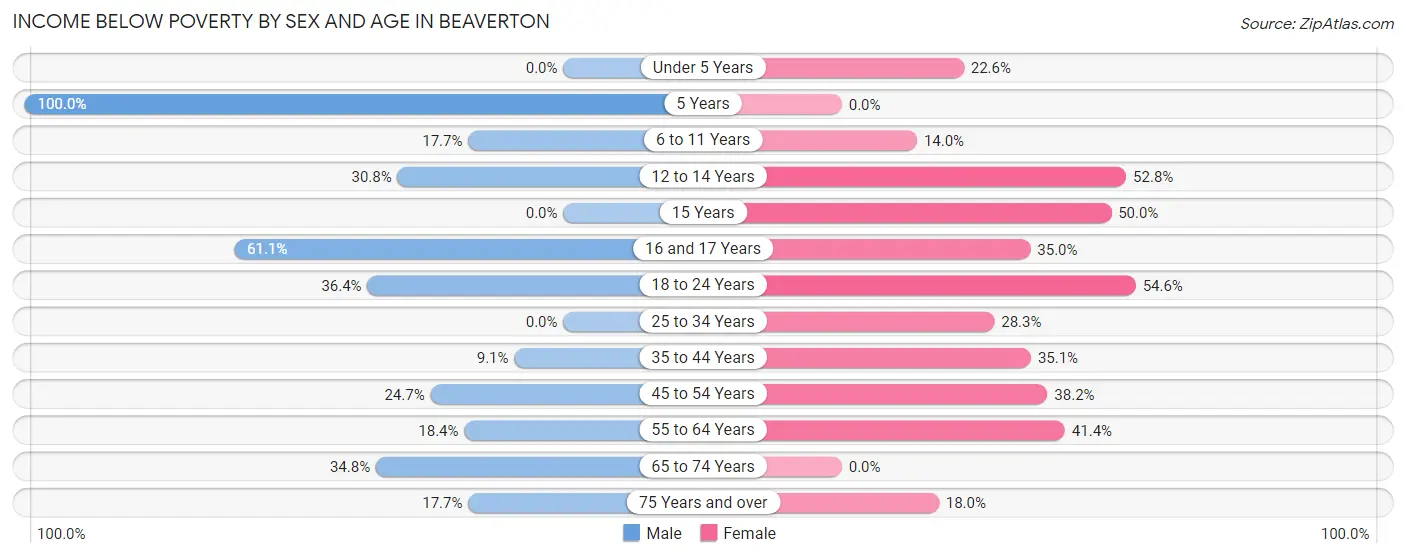
| Age Bracket | Male | Female |
| Under 5 Years | 0 (0.0%) | 12 (22.6%) |
| 5 Years | 16 (100.0%) | 0 (0.0%) |
| 6 to 11 Years | 9 (17.6%) | 6 (14.0%) |
| 12 to 14 Years | 4 (30.8%) | 19 (52.8%) |
| 15 Years | 0 (0.0%) | 5 (50.0%) |
| 16 and 17 Years | 11 (61.1%) | 7 (35.0%) |
| 18 to 24 Years | 20 (36.4%) | 30 (54.5%) |
| 25 to 34 Years | 0 (0.0%) | 15 (28.3%) |
| 35 to 44 Years | 8 (9.1%) | 33 (35.1%) |
| 45 to 54 Years | 18 (24.7%) | 29 (38.2%) |
| 55 to 64 Years | 18 (18.4%) | 41 (41.4%) |
| 65 to 74 Years | 8 (34.8%) | 0 (0.0%) |
| 75 Years and over | 3 (17.6%) | 9 (18.0%) |
| Total | 115 (22.1%) | 206 (30.6%) |
Income Above Poverty by Sex and Age in Beaverton
According to the poverty statistics in Beaverton, males aged under 5 years and females aged 5 years are the age groups that are most secure financially, with 100.0% of males and 100.0% of females in these age groups living above the poverty line.
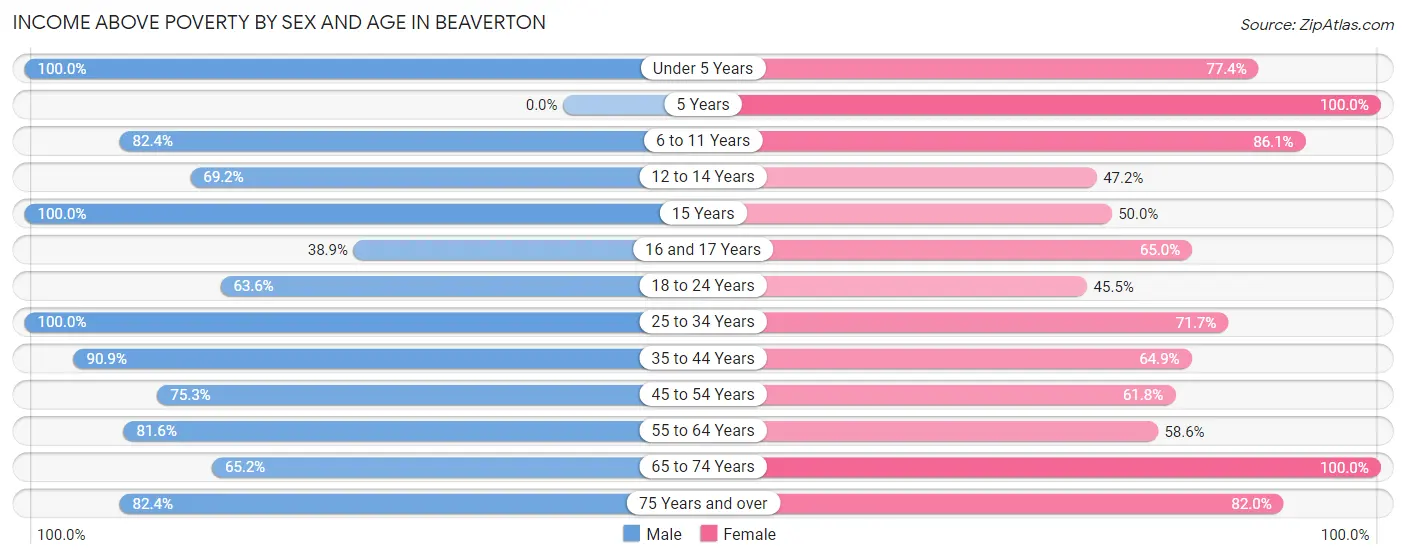
| Age Bracket | Male | Female |
| Under 5 Years | 12 (100.0%) | 41 (77.4%) |
| 5 Years | 0 (0.0%) | 4 (100.0%) |
| 6 to 11 Years | 42 (82.4%) | 37 (86.1%) |
| 12 to 14 Years | 9 (69.2%) | 17 (47.2%) |
| 15 Years | 2 (100.0%) | 5 (50.0%) |
| 16 and 17 Years | 7 (38.9%) | 13 (65.0%) |
| 18 to 24 Years | 35 (63.6%) | 25 (45.5%) |
| 25 to 34 Years | 55 (100.0%) | 38 (71.7%) |
| 35 to 44 Years | 80 (90.9%) | 61 (64.9%) |
| 45 to 54 Years | 55 (75.3%) | 47 (61.8%) |
| 55 to 64 Years | 80 (81.6%) | 58 (58.6%) |
| 65 to 74 Years | 15 (65.2%) | 80 (100.0%) |
| 75 Years and over | 14 (82.4%) | 41 (82.0%) |
| Total | 406 (77.9%) | 467 (69.4%) |
Income Below Poverty Among Married-Couple Families in Beaverton
The poverty statistics for married-couple families in Beaverton show that 5.9% or 10 of the total 171 families live below the poverty line. Families with no children have the highest poverty rate of 10.7%, comprising of 10 families. On the other hand, families with 1 or 2 children have the lowest poverty rate of 0.0%, which includes 0 families.
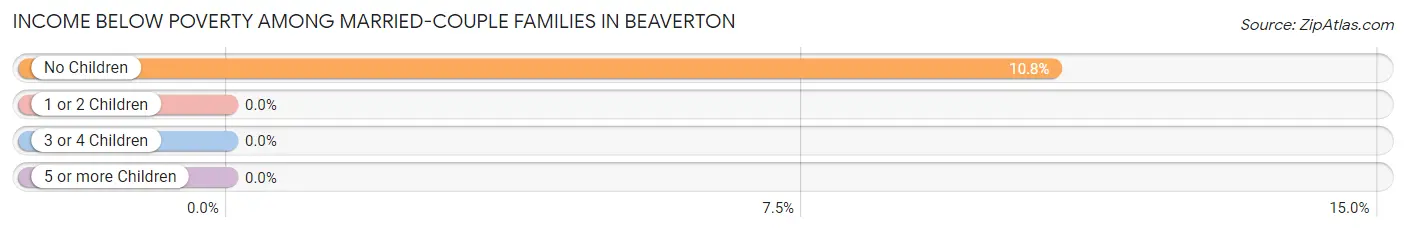
| Children | Above Poverty | Below Poverty |
| No Children | 83 (89.2%) | 10 (10.7%) |
| 1 or 2 Children | 41 (100.0%) | 0 (0.0%) |
| 3 or 4 Children | 35 (100.0%) | 0 (0.0%) |
| 5 or more Children | 2 (100.0%) | 0 (0.0%) |
| Total | 161 (94.2%) | 10 (5.9%) |
Income Below Poverty Among Single-Parent Households in Beaverton
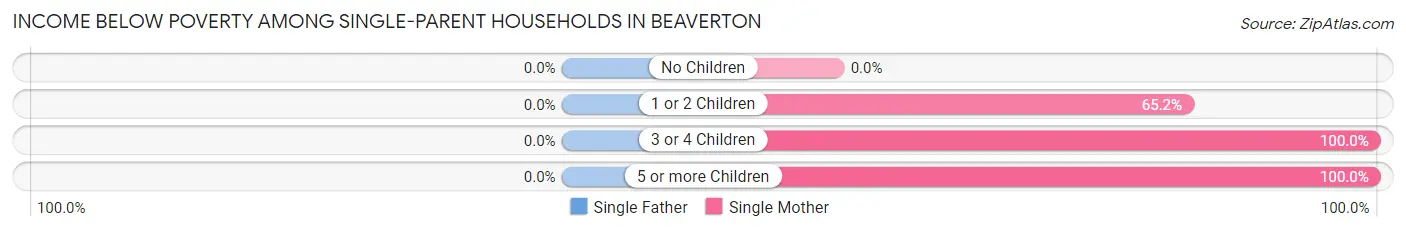
| Children | Single Father | Single Mother |
| No Children | 0 (0.0%) | 0 (0.0%) |
| 1 or 2 Children | 0 (0.0%) | 15 (65.2%) |
| 3 or 4 Children | 0 (0.0%) | 7 (100.0%) |
| 5 or more Children | 0 (0.0%) | 8 (100.0%) |
| Total | 0 (0.0%) | 30 (40.0%) |
Income Below Poverty Among Married-Couple vs Single-Parent Households in Beaverton
The poverty data for Beaverton shows that 10 of the married-couple family households (5.9%) and 30 of the single-parent households (30.3%) are living below the poverty level. Within the married-couple family households, those with no children have the highest poverty rate, with 10 households (10.7%) falling below the poverty line. Among the single-parent households, those with 3 or 4 children have the highest poverty rate, with 7 household (100.0%) living below poverty.
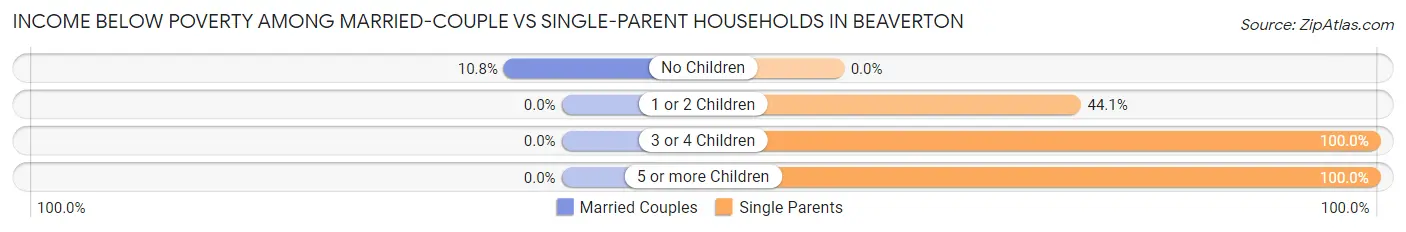
| Children | Married-Couple Families | Single-Parent Households |
| No Children | 10 (10.7%) | 0 (0.0%) |
| 1 or 2 Children | 0 (0.0%) | 15 (44.1%) |
| 3 or 4 Children | 0 (0.0%) | 7 (100.0%) |
| 5 or more Children | 0 (0.0%) | 8 (100.0%) |
| Total | 10 (5.9%) | 30 (30.3%) |
Race in Beaverton
The most populous races in Beaverton are White / Caucasian (1,124 | 94.1%), Two or more Races (61 | 5.1%), and Hispanic or Latino (11 | 0.9%).
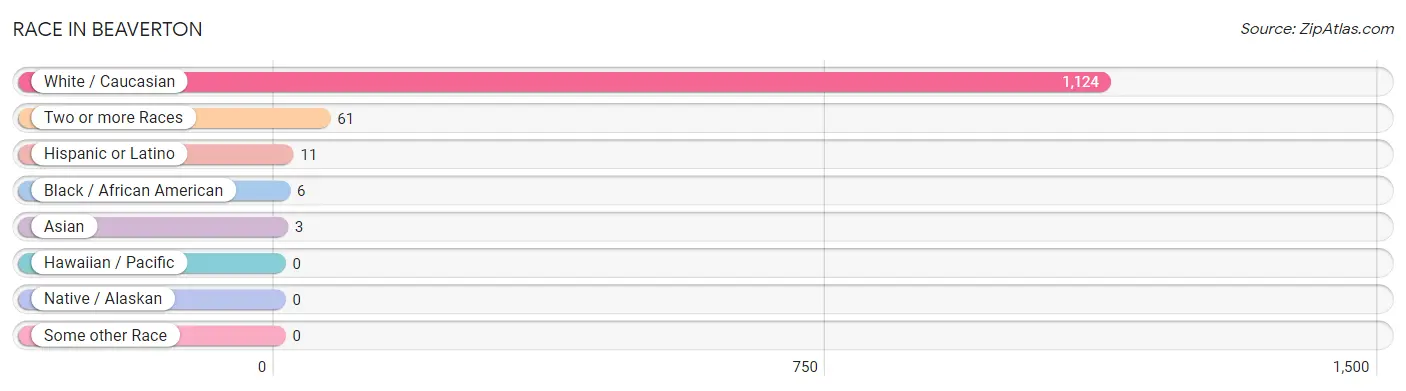
| Race | # Population | % Population |
| Asian | 3 | 0.3% |
| Black / African American | 6 | 0.5% |
| Hawaiian / Pacific | 0 | 0.0% |
| Hispanic or Latino | 11 | 0.9% |
| Native / Alaskan | 0 | 0.0% |
| White / Caucasian | 1,124 | 94.1% |
| Two or more Races | 61 | 5.1% |
| Some other Race | 0 | 0.0% |
| Total | 1,194 | 100.0% |
Ancestry in Beaverton
The most populous ancestries reported in Beaverton are German (276 | 23.1%), English (114 | 9.6%), Irish (76 | 6.4%), Polish (62 | 5.2%), and European (59 | 4.9%), together accounting for 49.2% of all Beaverton residents.
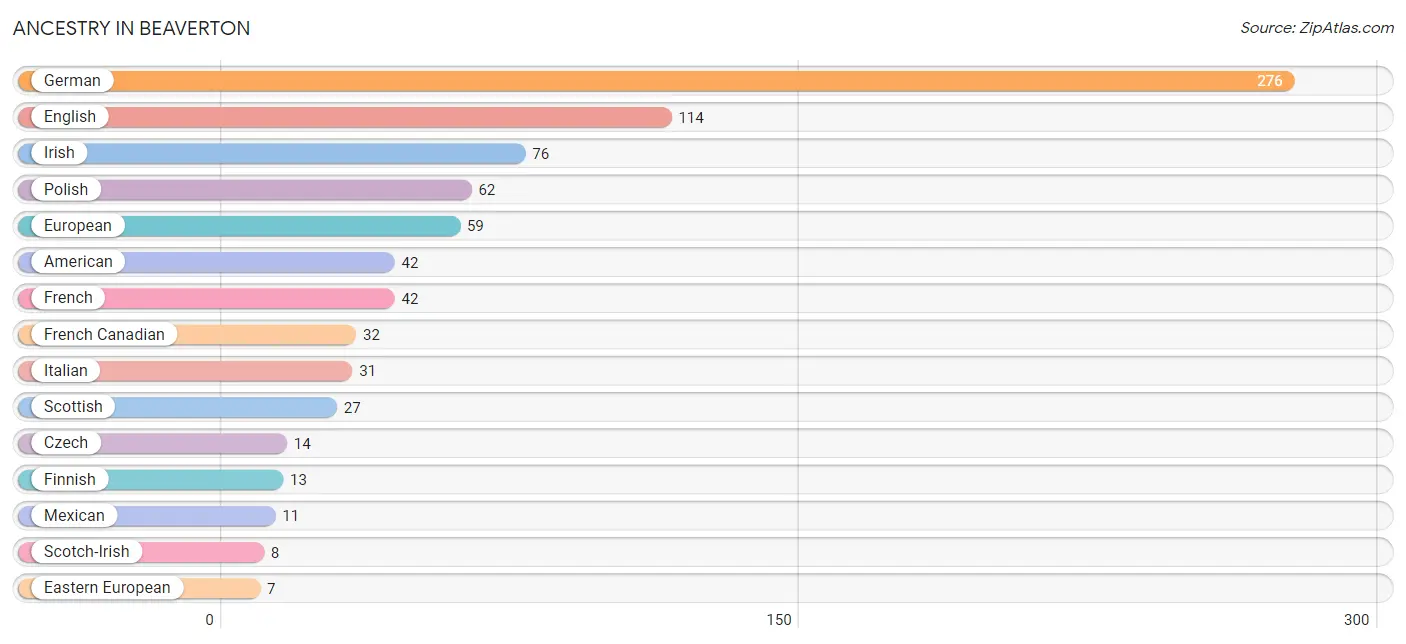
| Ancestry | # Population | % Population |
| African | 6 | 0.5% |
| American | 42 | 3.5% |
| Austrian | 4 | 0.3% |
| Burmese | 3 | 0.3% |
| Canadian | 5 | 0.4% |
| Croatian | 4 | 0.3% |
| Czech | 14 | 1.2% |
| Dutch | 4 | 0.3% |
| Eastern European | 7 | 0.6% |
| English | 114 | 9.6% |
| European | 59 | 4.9% |
| Finnish | 13 | 1.1% |
| French | 42 | 3.5% |
| French Canadian | 32 | 2.7% |
| German | 276 | 23.1% |
| Irish | 76 | 6.4% |
| Italian | 31 | 2.6% |
| Mexican | 11 | 0.9% |
| Norwegian | 7 | 0.6% |
| Polish | 62 | 5.2% |
| Scandinavian | 6 | 0.5% |
| Scotch-Irish | 8 | 0.7% |
| Scottish | 27 | 2.3% |
| Slovak | 2 | 0.2% |
| Subsaharan African | 6 | 0.5% | View All 25 Rows |
Immigrants in Beaverton
The most numerous immigrant groups reported in Beaverton came from Asia (3 | 0.3%), Eastern Asia (3 | 0.3%), and Korea (3 | 0.3%), together accounting for 0.7% of all Beaverton residents.
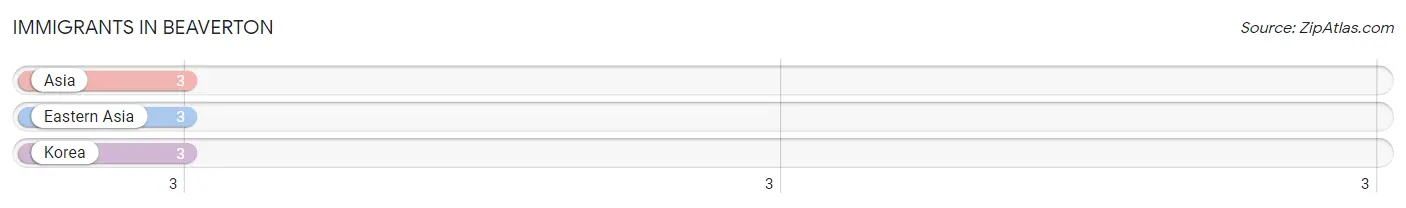
| Immigration Origin | # Population | % Population |
| Asia | 3 | 0.3% |
| Eastern Asia | 3 | 0.3% |
| Korea | 3 | 0.3% | View All 3 Rows |
Sex and Age in Beaverton
Sex and Age in Beaverton
The most populous age groups in Beaverton are 35 to 39 Years (64 | 12.3%) for men and 15 to 19 Years (66 | 9.8%) for women.
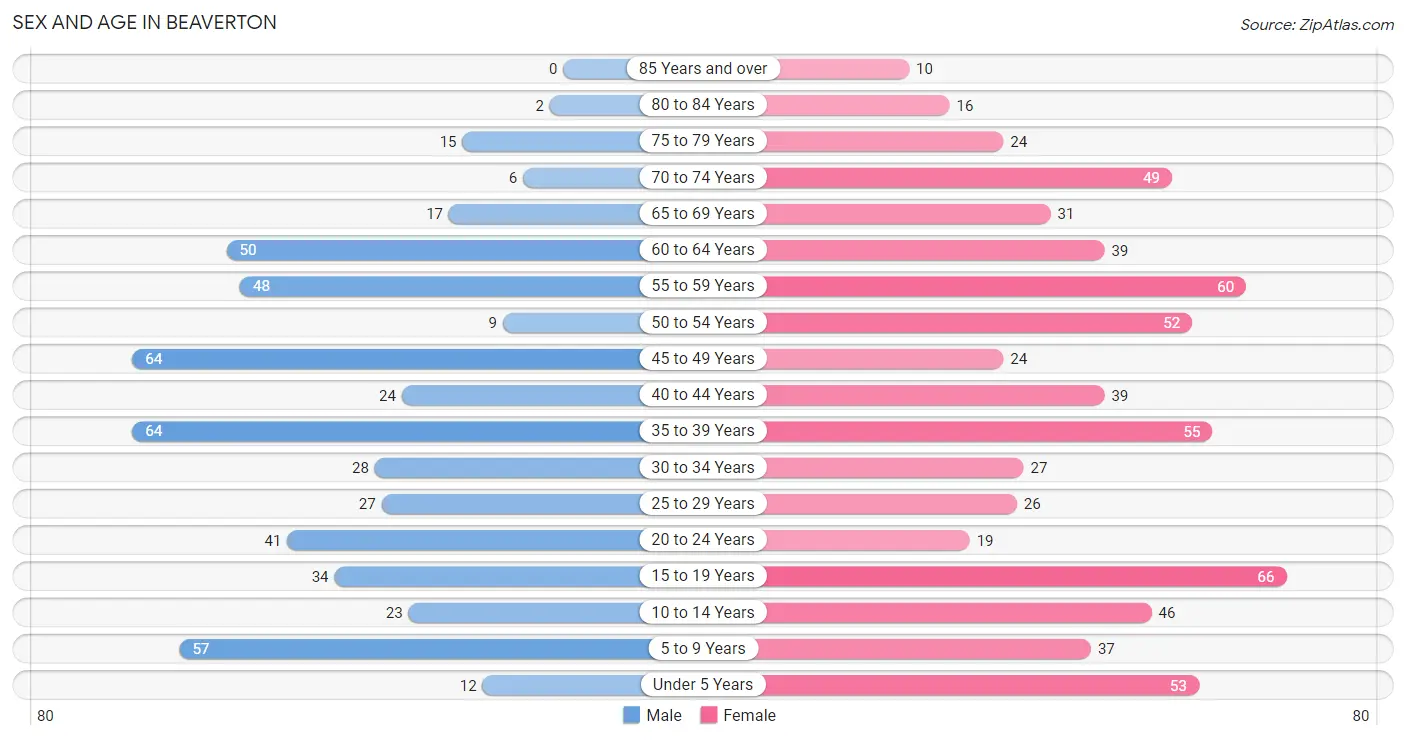
| Age Bracket | Male | Female |
| Under 5 Years | 12 (2.3%) | 53 (7.9%) |
| 5 to 9 Years | 57 (10.9%) | 37 (5.5%) |
| 10 to 14 Years | 23 (4.4%) | 46 (6.8%) |
| 15 to 19 Years | 34 (6.5%) | 66 (9.8%) |
| 20 to 24 Years | 41 (7.9%) | 19 (2.8%) |
| 25 to 29 Years | 27 (5.2%) | 26 (3.9%) |
| 30 to 34 Years | 28 (5.4%) | 27 (4.0%) |
| 35 to 39 Years | 64 (12.3%) | 55 (8.2%) |
| 40 to 44 Years | 24 (4.6%) | 39 (5.8%) |
| 45 to 49 Years | 64 (12.3%) | 24 (3.6%) |
| 50 to 54 Years | 9 (1.7%) | 52 (7.7%) |
| 55 to 59 Years | 48 (9.2%) | 60 (8.9%) |
| 60 to 64 Years | 50 (9.6%) | 39 (5.8%) |
| 65 to 69 Years | 17 (3.3%) | 31 (4.6%) |
| 70 to 74 Years | 6 (1.1%) | 49 (7.3%) |
| 75 to 79 Years | 15 (2.9%) | 24 (3.6%) |
| 80 to 84 Years | 2 (0.4%) | 16 (2.4%) |
| 85 Years and over | 0 (0.0%) | 10 (1.5%) |
| Total | 521 (100.0%) | 673 (100.0%) |
Families and Households in Beaverton
Median Family Size in Beaverton
The median family size in Beaverton is 3.23 persons per family, with single female/mother families (75 | 27.8%) accounting for the largest median family size of 3.75 persons per family. On the other hand, single male/father families (24 | 8.9%) represent the smallest median family size with 2.38 persons per family.
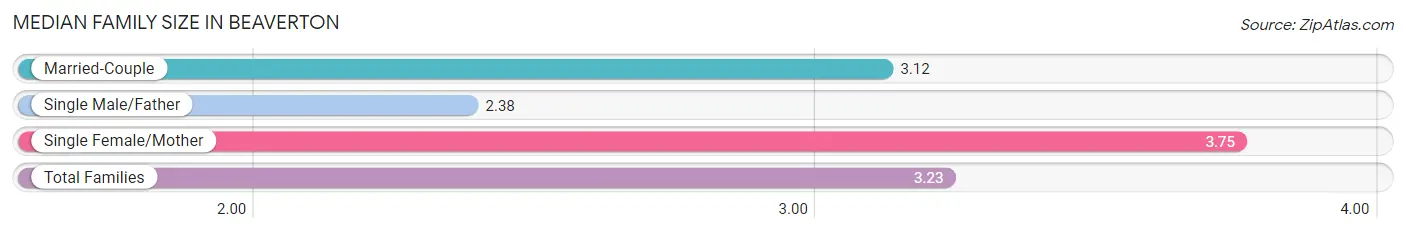
| Family Type | # Families | Family Size |
| Married-Couple | 171 (63.3%) | 3.12 |
| Single Male/Father | 24 (8.9%) | 2.38 |
| Single Female/Mother | 75 (27.8%) | 3.75 |
| Total Families | 270 (100.0%) | 3.23 |
Median Household Size in Beaverton
The median household size in Beaverton is 2.30 persons per household, with single female/mother households (75 | 14.4%) accounting for the largest median household size of 3.91 persons per household. non-family households (249 | 48.0%) represent the smallest median household size with 1.19 persons per household.
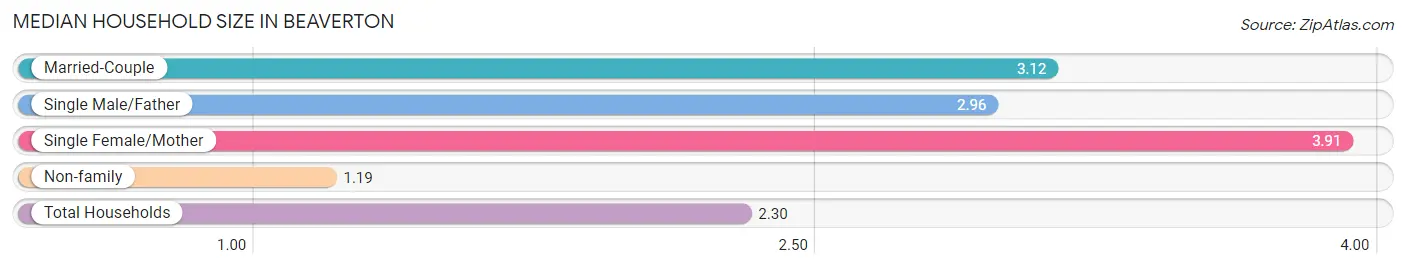
| Household Type | # Households | Household Size |
| Married-Couple | 171 (33.0%) | 3.12 |
| Single Male/Father | 24 (4.6%) | 2.96 |
| Single Female/Mother | 75 (14.4%) | 3.91 |
| Non-family | 249 (48.0%) | 1.19 |
| Total Households | 519 (100.0%) | 2.30 |
Household Size by Marriage Status in Beaverton
Out of a total of 519 households in Beaverton, 270 (52.0%) are family households, while 249 (48.0%) are nonfamily households. The most numerous type of family households are 2-person households, comprising 103, and the most common type of nonfamily households are 1-person households, comprising 201.
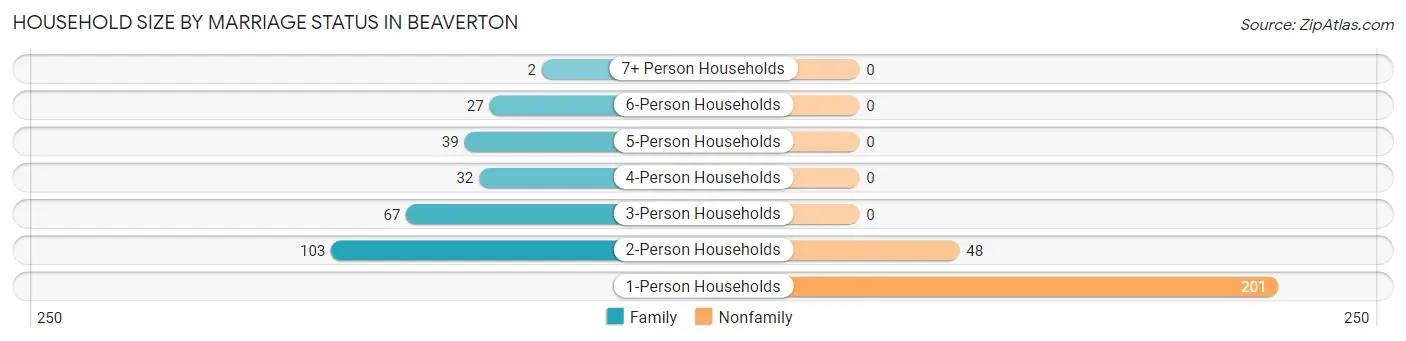
| Household Size | Family Households | Nonfamily Households |
| 1-Person Households | - | 201 (38.7%) |
| 2-Person Households | 103 (19.9%) | 48 (9.2%) |
| 3-Person Households | 67 (12.9%) | 0 (0.0%) |
| 4-Person Households | 32 (6.2%) | 0 (0.0%) |
| 5-Person Households | 39 (7.5%) | 0 (0.0%) |
| 6-Person Households | 27 (5.2%) | 0 (0.0%) |
| 7+ Person Households | 2 (0.4%) | 0 (0.0%) |
| Total | 270 (52.0%) | 249 (48.0%) |
Female Fertility in Beaverton
Fertility by Age in Beaverton
Average fertility rate in Beaverton is 41.0 births per 1,000 women. Women in the age bracket of 20 to 34 years have the highest fertility rate with 83.0 births per 1,000 women. Women in the age bracket of 20 to 34 years acount for 54.5% of all women with births.
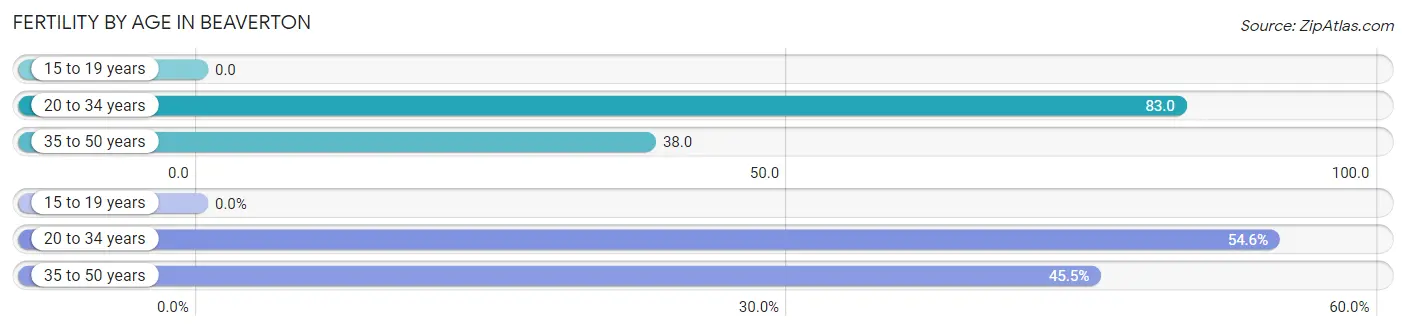
| Age Bracket | Women with Births | Births / 1,000 Women |
| 15 to 19 years | 0 (0.0%) | 0.0 |
| 20 to 34 years | 6 (54.5%) | 83.0 |
| 35 to 50 years | 5 (45.5%) | 38.0 |
| Total | 11 (100.0%) | 41.0 |
Fertility by Age by Marriage Status in Beaverton
54.5% of women with births (11) in Beaverton are married. The highest percentage of unmarried women with births falls into 20 to 34 years age bracket with 83.3% of them unmarried at the time of birth, while the lowest percentage of unmarried women with births belong to 35 to 50 years age bracket with 0.0% of them unmarried.
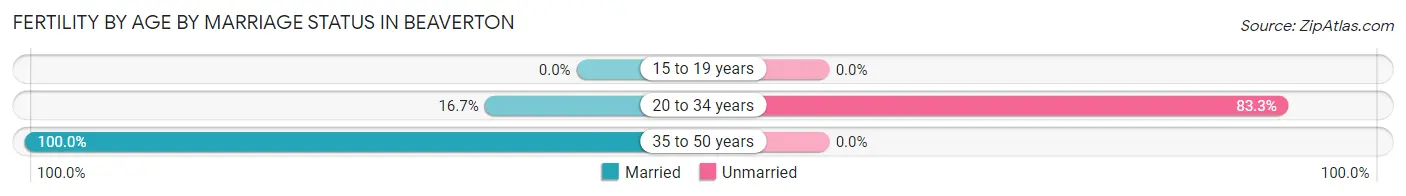
| Age Bracket | Married | Unmarried |
| 15 to 19 years | 0 (0.0%) | 0 (0.0%) |
| 20 to 34 years | 1 (16.7%) | 5 (83.3%) |
| 35 to 50 years | 5 (100.0%) | 0 (0.0%) |
| Total | 6 (54.5%) | 5 (45.5%) |
Fertility by Education in Beaverton
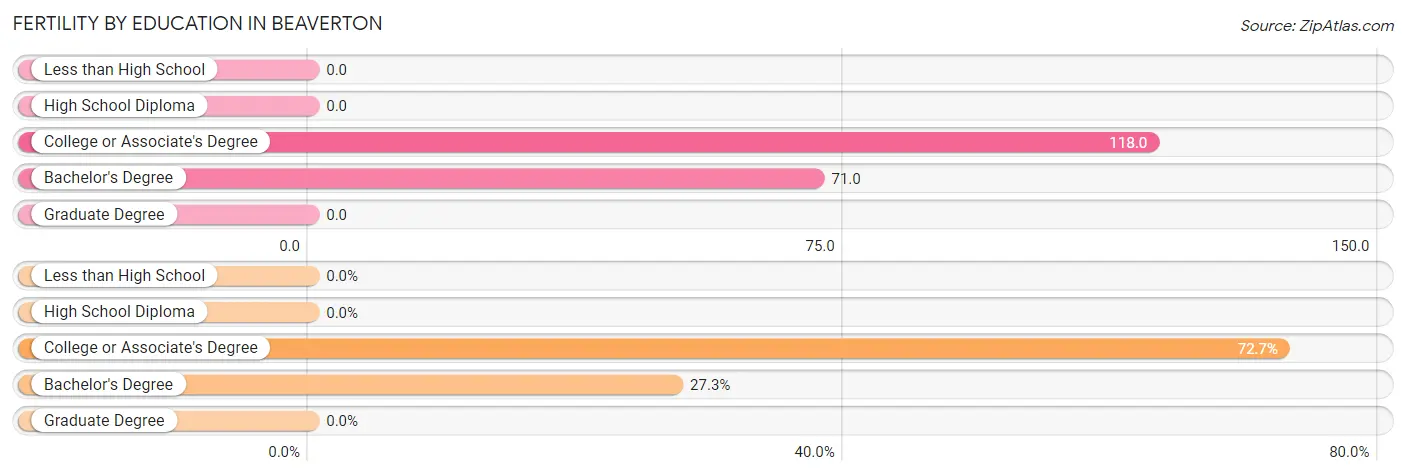
| Educational Attainment | Women with Births | Births / 1,000 Women |
| Less than High School | 0 (0.0%) | 0.0 |
| High School Diploma | 0 (0.0%) | 0.0 |
| College or Associate's Degree | 8 (72.7%) | 118.0 |
| Bachelor's Degree | 3 (27.3%) | 71.0 |
| Graduate Degree | 0 (0.0%) | 0.0 |
| Total | 11 (100.0%) | 41.0 |
Fertility by Education by Marriage Status in Beaverton
45.5% of women with births in Beaverton are unmarried. Women with the educational attainment of bachelor's degree are most likely to be married with 100.0% of them married at childbirth, while women with the educational attainment of college or associate's degree are least likely to be married with 62.5% of them unmarried at childbirth.
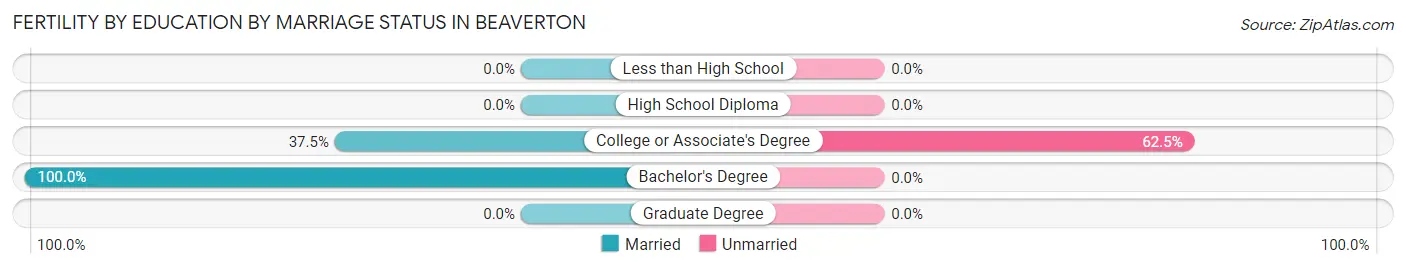
| Educational Attainment | Married | Unmarried |
| Less than High School | 0 (0.0%) | 0 (0.0%) |
| High School Diploma | 0 (0.0%) | 0 (0.0%) |
| College or Associate's Degree | 3 (37.5%) | 5 (62.5%) |
| Bachelor's Degree | 3 (100.0%) | 0 (0.0%) |
| Graduate Degree | 0 (0.0%) | 0 (0.0%) |
| Total | 6 (54.5%) | 5 (45.5%) |
Employment Characteristics in Beaverton
Employment by Class of Employer in Beaverton
Among the 426 employed individuals in Beaverton, private company employees (353 | 82.9%), not-for-profit organizations (27 | 6.3%), and state government employees (17 | 4.0%) make up the most common classes of employment.
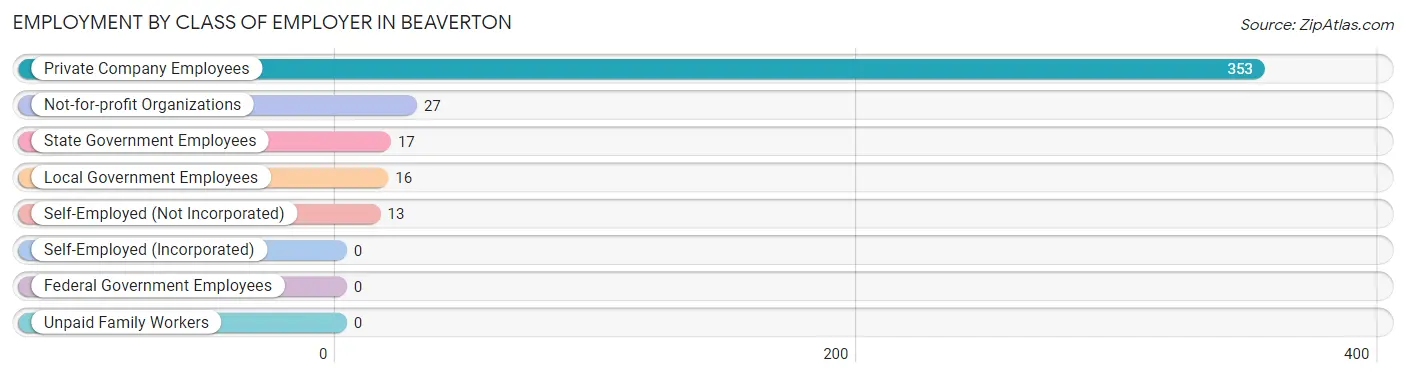
| Employer Class | # Employees | % Employees |
| Private Company Employees | 353 | 82.9% |
| Self-Employed (Incorporated) | 0 | 0.0% |
| Self-Employed (Not Incorporated) | 13 | 3.0% |
| Not-for-profit Organizations | 27 | 6.3% |
| Local Government Employees | 16 | 3.8% |
| State Government Employees | 17 | 4.0% |
| Federal Government Employees | 0 | 0.0% |
| Unpaid Family Workers | 0 | 0.0% |
| Total | 426 | 100.0% |
Employment Status by Age in Beaverton
According to the labor force statistics for Beaverton, out of the total population over 16 years of age (954), 49.5% or 472 individuals are in the labor force, with 7.4% or 35 of them unemployed. The age group with the highest labor force participation rate is 25 to 29 years, with 94.3% or 50 individuals in the labor force. Within the labor force, the 45 to 54 years age range has the highest percentage of unemployed individuals, with 16.0% or 12 of them being unemployed.
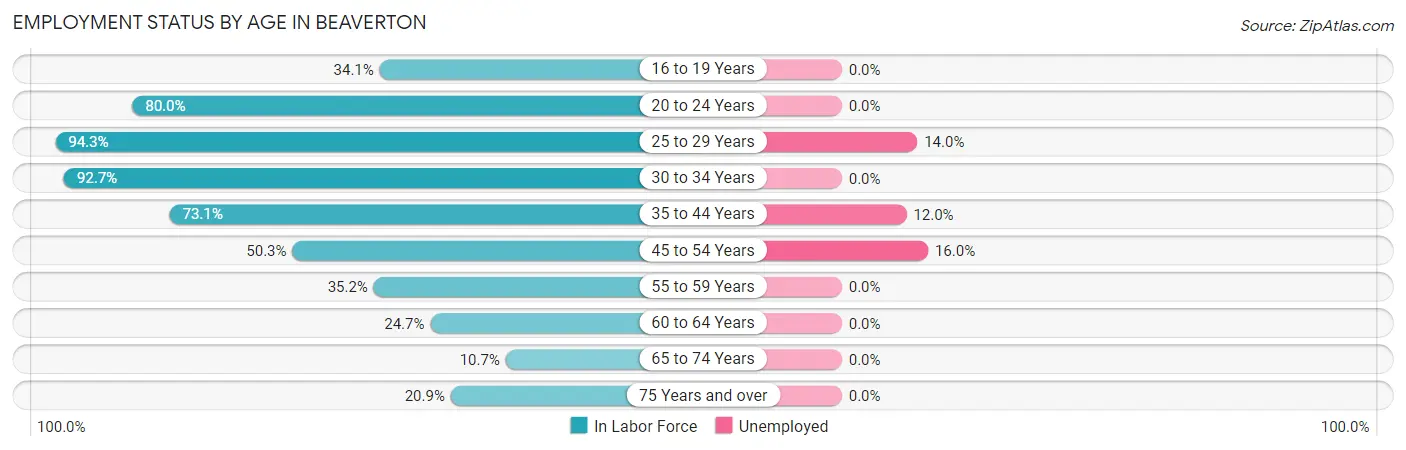
| Age Bracket | In Labor Force | Unemployed |
| 16 to 19 Years | 30 (34.1%) | 0 (0.0%) |
| 20 to 24 Years | 48 (80.0%) | 0 (0.0%) |
| 25 to 29 Years | 50 (94.3%) | 7 (14.0%) |
| 30 to 34 Years | 51 (92.7%) | 0 (0.0%) |
| 35 to 44 Years | 133 (73.1%) | 16 (12.0%) |
| 45 to 54 Years | 75 (50.3%) | 12 (16.0%) |
| 55 to 59 Years | 38 (35.2%) | 0 (0.0%) |
| 60 to 64 Years | 22 (24.7%) | 0 (0.0%) |
| 65 to 74 Years | 11 (10.7%) | 0 (0.0%) |
| 75 Years and over | 14 (20.9%) | 0 (0.0%) |
| Total | 472 (49.5%) | 35 (7.4%) |
Employment Status by Educational Attainment in Beaverton
According to labor force statistics for Beaverton, 58.0% of individuals (369) out of the total population between 25 and 64 years of age (636) are in the labor force, with 9.5% or 35 of them being unemployed. The group with the highest labor force participation rate are those with the educational attainment of bachelor's degree or higher, with 83.3% or 70 individuals in the labor force. Within the labor force, individuals with less than high school education have the highest percentage of unemployment, with 28.0% or 7 of them being unemployed.
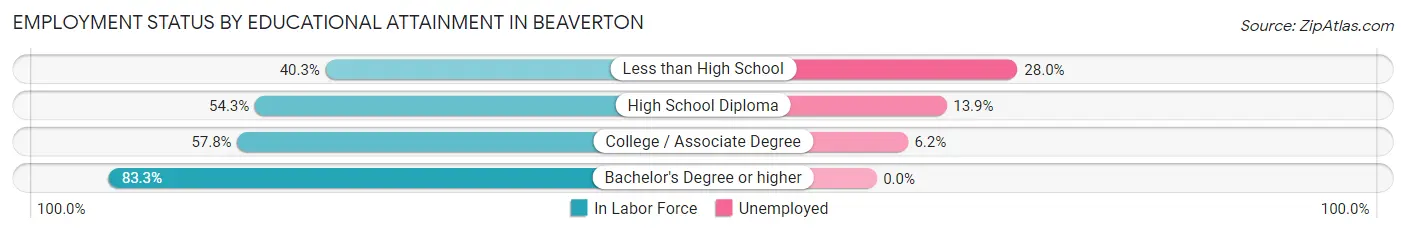
| Educational Attainment | In Labor Force | Unemployed |
| Less than High School | 25 (40.3%) | 17 (28.0%) |
| High School Diploma | 144 (54.3%) | 37 (13.9%) |
| College / Associate Degree | 130 (57.8%) | 14 (6.2%) |
| Bachelor's Degree or higher | 70 (83.3%) | 0 (0.0%) |
| Total | 369 (58.0%) | 60 (9.5%) |
Employment Occupations by Sex in Beaverton
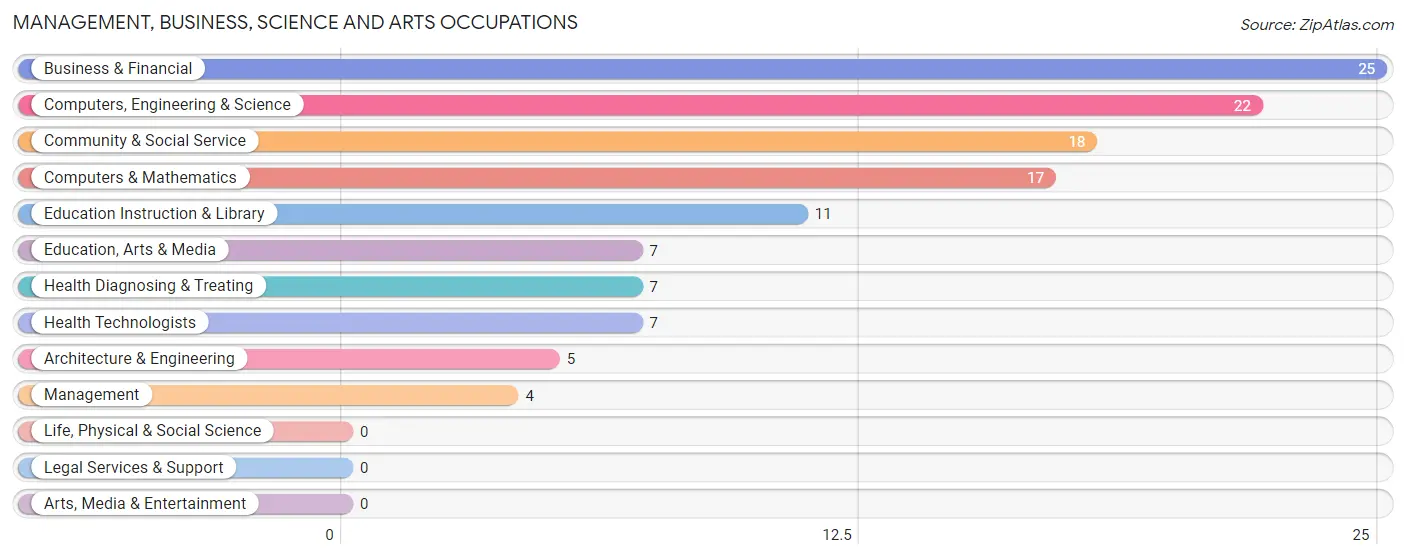
Management, Business, Science and Arts Occupations
The most common Management, Business, Science and Arts occupations in Beaverton are Business & Financial (25 | 5.7%), Computers, Engineering & Science (22 | 5.0%), Community & Social Service (18 | 4.1%), Computers & Mathematics (17 | 3.9%), and Education Instruction & Library (11 | 2.5%).
Management, Business, Science and Arts Occupations by Sex
Within the Management, Business, Science and Arts occupations in Beaverton, the most male-oriented occupations are Management (100.0%), Computers & Mathematics (100.0%), and Computers, Engineering & Science (95.5%), while the most female-oriented occupations are Business & Financial (100.0%), Education, Arts & Media (100.0%), and Health Diagnosing & Treating (100.0%).
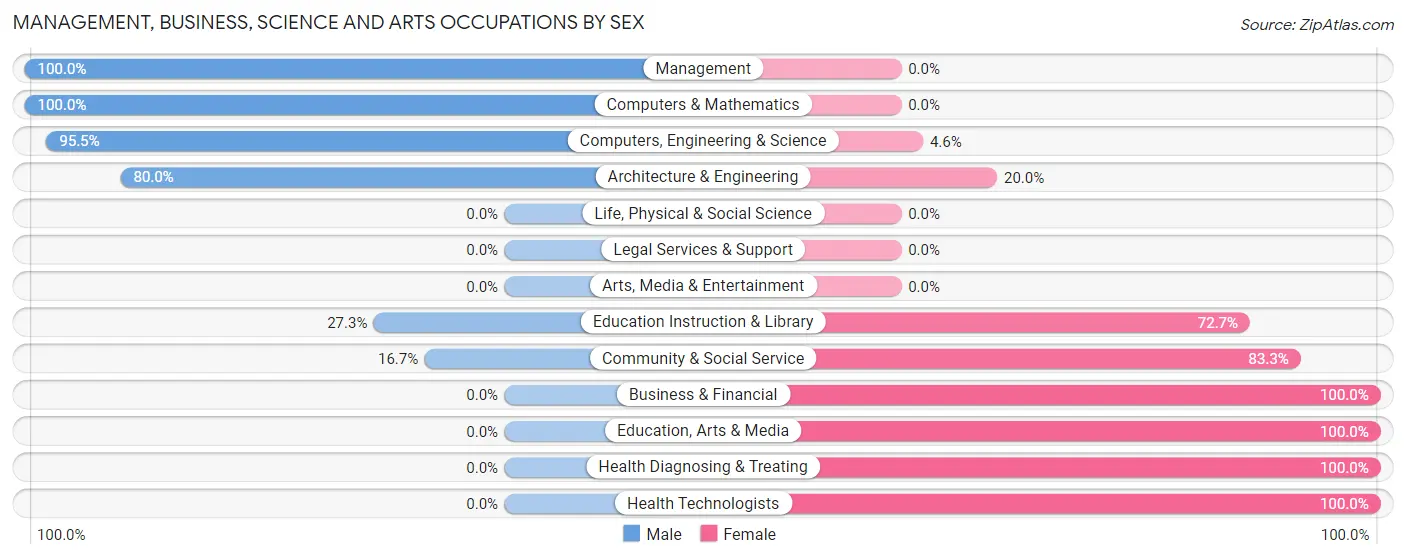
| Occupation | Male | Female |
| Management | 4 (100.0%) | 0 (0.0%) |
| Business & Financial | 0 (0.0%) | 25 (100.0%) |
| Computers, Engineering & Science | 21 (95.5%) | 1 (4.5%) |
| Computers & Mathematics | 17 (100.0%) | 0 (0.0%) |
| Architecture & Engineering | 4 (80.0%) | 1 (20.0%) |
| Life, Physical & Social Science | 0 (0.0%) | 0 (0.0%) |
| Community & Social Service | 3 (16.7%) | 15 (83.3%) |
| Education, Arts & Media | 0 (0.0%) | 7 (100.0%) |
| Legal Services & Support | 0 (0.0%) | 0 (0.0%) |
| Education Instruction & Library | 3 (27.3%) | 8 (72.7%) |
| Arts, Media & Entertainment | 0 (0.0%) | 0 (0.0%) |
| Health Diagnosing & Treating | 0 (0.0%) | 7 (100.0%) |
| Health Technologists | 0 (0.0%) | 7 (100.0%) |
| Total (Category) | 28 (36.8%) | 48 (63.2%) |
| Total (Overall) | 213 (48.7%) | 224 (51.3%) |
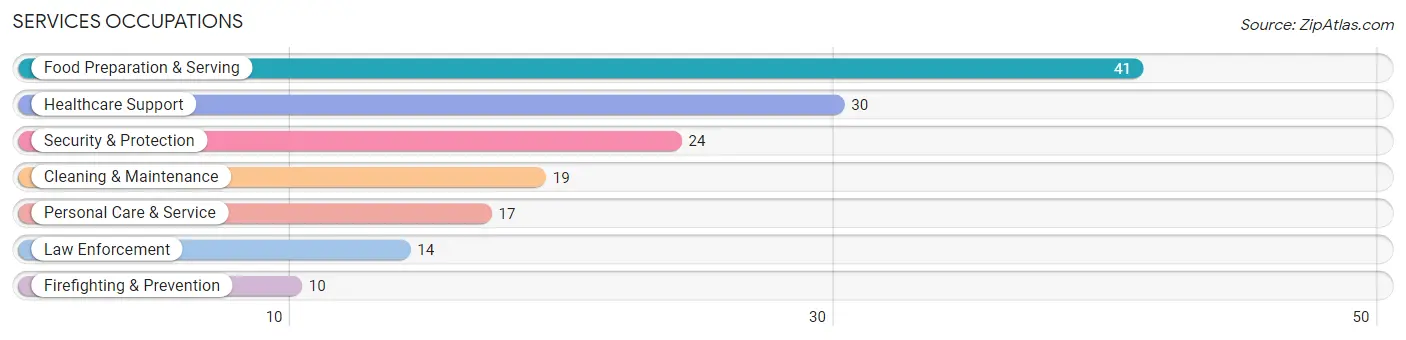
Services Occupations
The most common Services occupations in Beaverton are Food Preparation & Serving (41 | 9.4%), Healthcare Support (30 | 6.9%), Security & Protection (24 | 5.5%), Cleaning & Maintenance (19 | 4.3%), and Personal Care & Service (17 | 3.9%).
Services Occupations by Sex
Within the Services occupations in Beaverton, the most male-oriented occupations are Law Enforcement (78.6%), Security & Protection (66.7%), and Food Preparation & Serving (56.1%), while the most female-oriented occupations are Cleaning & Maintenance (78.9%), Personal Care & Service (76.5%), and Firefighting & Prevention (50.0%).
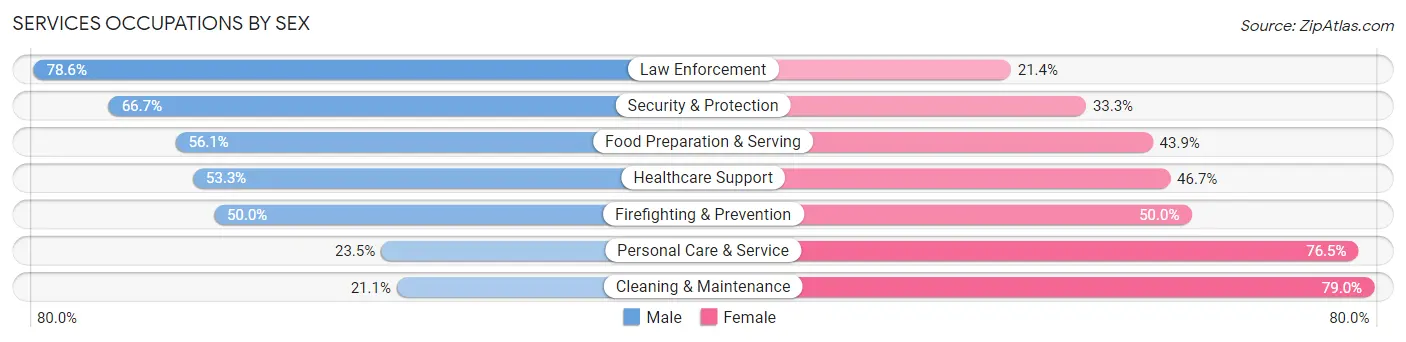
| Occupation | Male | Female |
| Healthcare Support | 16 (53.3%) | 14 (46.7%) |
| Security & Protection | 16 (66.7%) | 8 (33.3%) |
| Firefighting & Prevention | 5 (50.0%) | 5 (50.0%) |
| Law Enforcement | 11 (78.6%) | 3 (21.4%) |
| Food Preparation & Serving | 23 (56.1%) | 18 (43.9%) |
| Cleaning & Maintenance | 4 (21.0%) | 15 (78.9%) |
| Personal Care & Service | 4 (23.5%) | 13 (76.5%) |
| Total (Category) | 63 (48.1%) | 68 (51.9%) |
| Total (Overall) | 213 (48.7%) | 224 (51.3%) |
Sales and Office Occupations
The most common Sales and Office occupations in Beaverton are Sales & Related (60 | 13.7%), and Office & Administration (40 | 9.1%).
Sales and Office Occupations by Sex
| Occupation | Male | Female |
| Sales & Related | 24 (40.0%) | 36 (60.0%) |
| Office & Administration | 4 (10.0%) | 36 (90.0%) |
| Total (Category) | 28 (28.0%) | 72 (72.0%) |
| Total (Overall) | 213 (48.7%) | 224 (51.3%) |
Natural Resources, Construction and Maintenance Occupations
The most common Natural Resources, Construction and Maintenance occupations in Beaverton are Construction & Extraction (16 | 3.7%), and Installation, Maintenance & Repair (14 | 3.2%).
Natural Resources, Construction and Maintenance Occupations by Sex
| Occupation | Male | Female |
| Farming, Fishing & Forestry | 0 (0.0%) | 0 (0.0%) |
| Construction & Extraction | 16 (100.0%) | 0 (0.0%) |
| Installation, Maintenance & Repair | 14 (100.0%) | 0 (0.0%) |
| Total (Category) | 30 (100.0%) | 0 (0.0%) |
| Total (Overall) | 213 (48.7%) | 224 (51.3%) |
Production, Transportation and Moving Occupations
The most common Production, Transportation and Moving occupations in Beaverton are Production (57 | 13.0%), Transportation (24 | 5.5%), and Material Moving (19 | 4.3%).
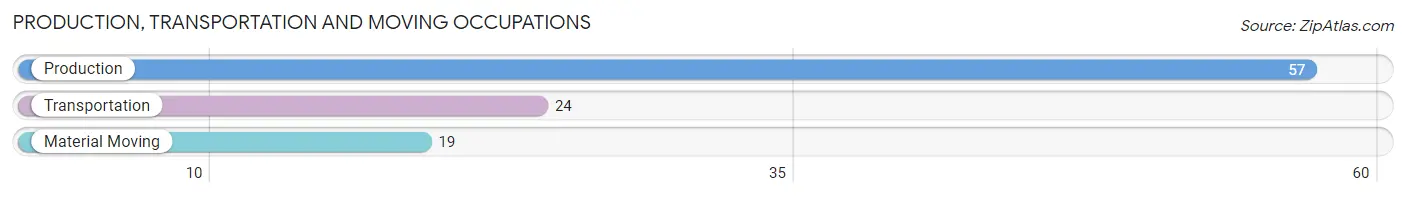
Production, Transportation and Moving Occupations by Sex
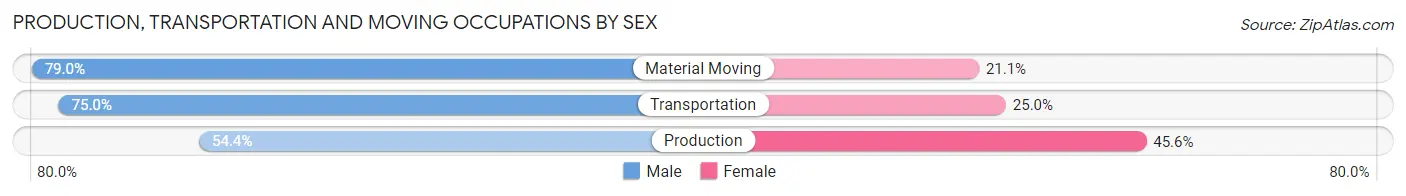
| Occupation | Male | Female |
| Production | 31 (54.4%) | 26 (45.6%) |
| Transportation | 18 (75.0%) | 6 (25.0%) |
| Material Moving | 15 (78.9%) | 4 (21.0%) |
| Total (Category) | 64 (64.0%) | 36 (36.0%) |
| Total (Overall) | 213 (48.7%) | 224 (51.3%) |
Employment Industries by Sex in Beaverton
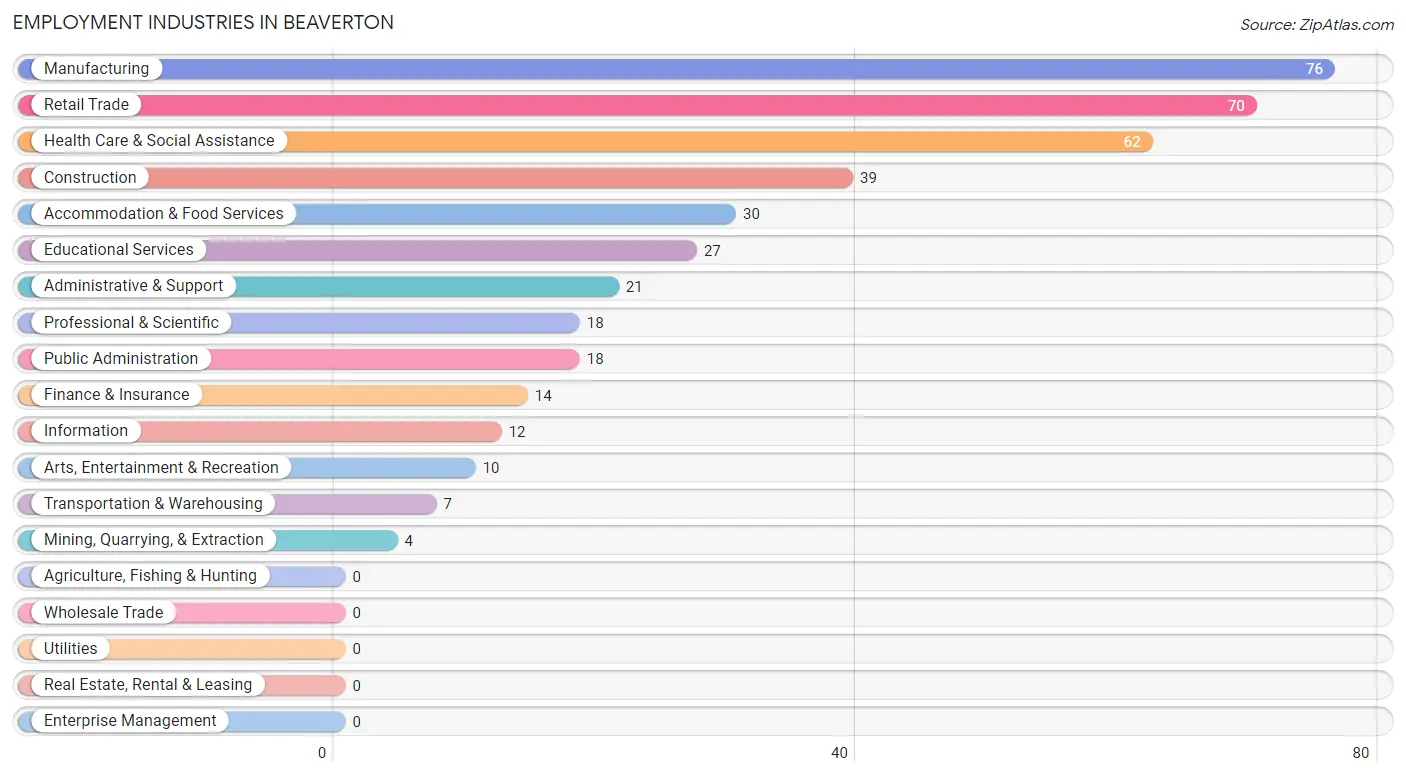
Employment Industries in Beaverton
The major employment industries in Beaverton include Manufacturing (76 | 17.4%), Retail Trade (70 | 16.0%), Health Care & Social Assistance (62 | 14.2%), Construction (39 | 8.9%), and Accommodation & Food Services (30 | 6.9%).
Employment Industries by Sex in Beaverton
The Beaverton industries that see more men than women are Mining, Quarrying, & Extraction (100.0%), Construction (100.0%), and Transportation & Warehousing (100.0%), whereas the industries that tend to have a higher number of women are Professional & Scientific (100.0%), Administrative & Support (85.7%), and Health Care & Social Assistance (80.6%).
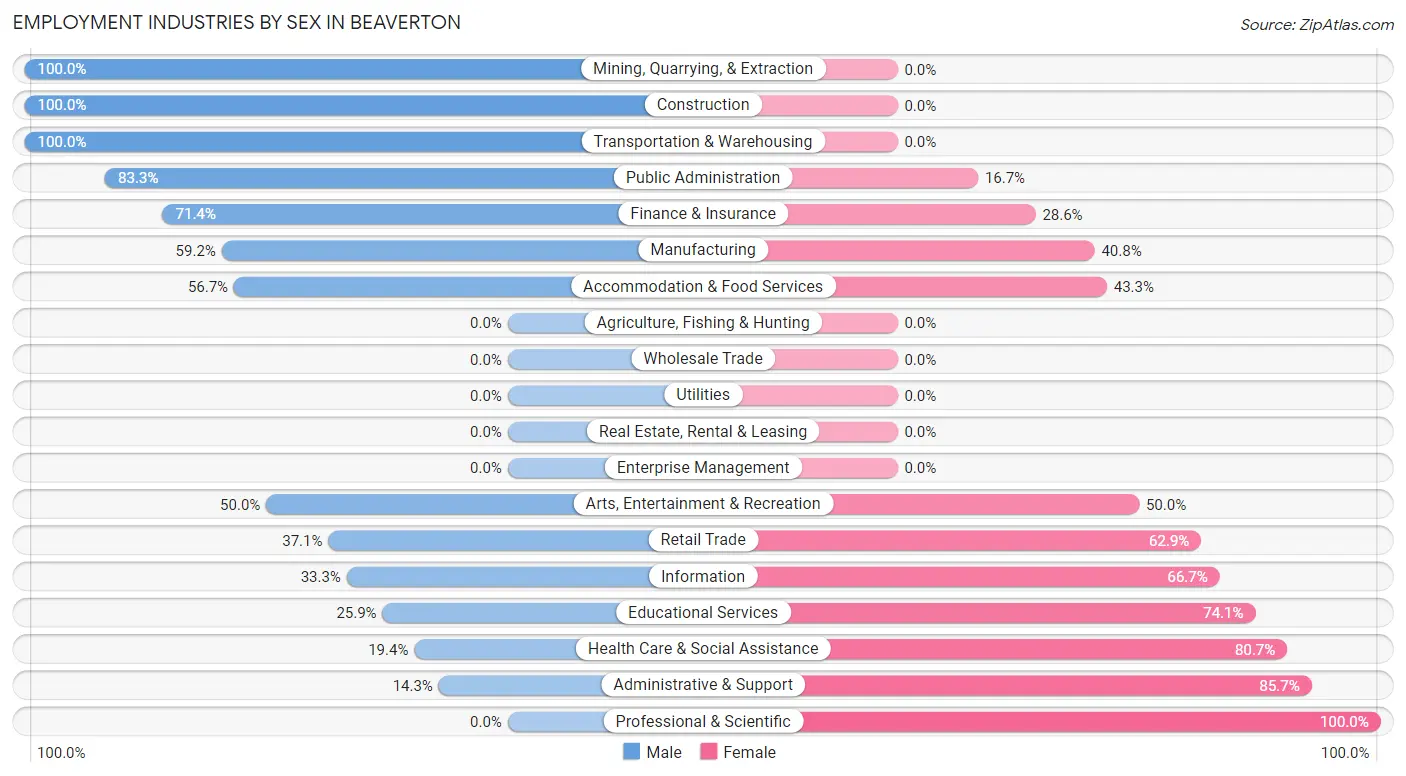
| Industry | Male | Female |
| Agriculture, Fishing & Hunting | 0 (0.0%) | 0 (0.0%) |
| Mining, Quarrying, & Extraction | 4 (100.0%) | 0 (0.0%) |
| Construction | 39 (100.0%) | 0 (0.0%) |
| Manufacturing | 45 (59.2%) | 31 (40.8%) |
| Wholesale Trade | 0 (0.0%) | 0 (0.0%) |
| Retail Trade | 26 (37.1%) | 44 (62.9%) |
| Transportation & Warehousing | 7 (100.0%) | 0 (0.0%) |
| Utilities | 0 (0.0%) | 0 (0.0%) |
| Information | 4 (33.3%) | 8 (66.7%) |
| Finance & Insurance | 10 (71.4%) | 4 (28.6%) |
| Real Estate, Rental & Leasing | 0 (0.0%) | 0 (0.0%) |
| Professional & Scientific | 0 (0.0%) | 18 (100.0%) |
| Enterprise Management | 0 (0.0%) | 0 (0.0%) |
| Administrative & Support | 3 (14.3%) | 18 (85.7%) |
| Educational Services | 7 (25.9%) | 20 (74.1%) |
| Health Care & Social Assistance | 12 (19.4%) | 50 (80.6%) |
| Arts, Entertainment & Recreation | 5 (50.0%) | 5 (50.0%) |
| Accommodation & Food Services | 17 (56.7%) | 13 (43.3%) |
| Public Administration | 15 (83.3%) | 3 (16.7%) |
| Total | 213 (48.7%) | 224 (51.3%) |
Education in Beaverton
School Enrollment in Beaverton
The most common levels of schooling among the 298 students in Beaverton are high school (86 | 28.9%), middle school (73 | 24.5%), and elementary school (53 | 17.8%).
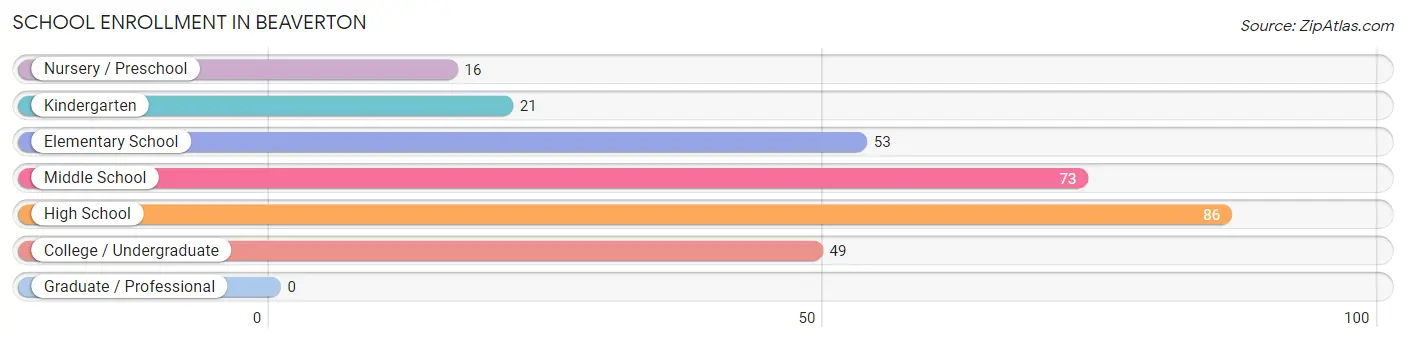
| School Level | # Students | % Students |
| Nursery / Preschool | 16 | 5.4% |
| Kindergarten | 21 | 7.0% |
| Elementary School | 53 | 17.8% |
| Middle School | 73 | 24.5% |
| High School | 86 | 28.9% |
| College / Undergraduate | 49 | 16.4% |
| Graduate / Professional | 0 | 0.0% |
| Total | 298 | 100.0% |
School Enrollment by Age by Funding Source in Beaverton
Out of a total of 298 students who are enrolled in schools in Beaverton, 47 (15.8%) attend a private institution, while the remaining 251 (84.2%) are enrolled in public schools. The age group of 5 to 9 year old has the highest likelihood of being enrolled in private schools, with 28 (41.2% in the age bracket) enrolled. Conversely, the age group of 3 to 4 year olds has the lowest likelihood of being enrolled in a private school, with 16 (100.0% in the age bracket) attending a public institution.
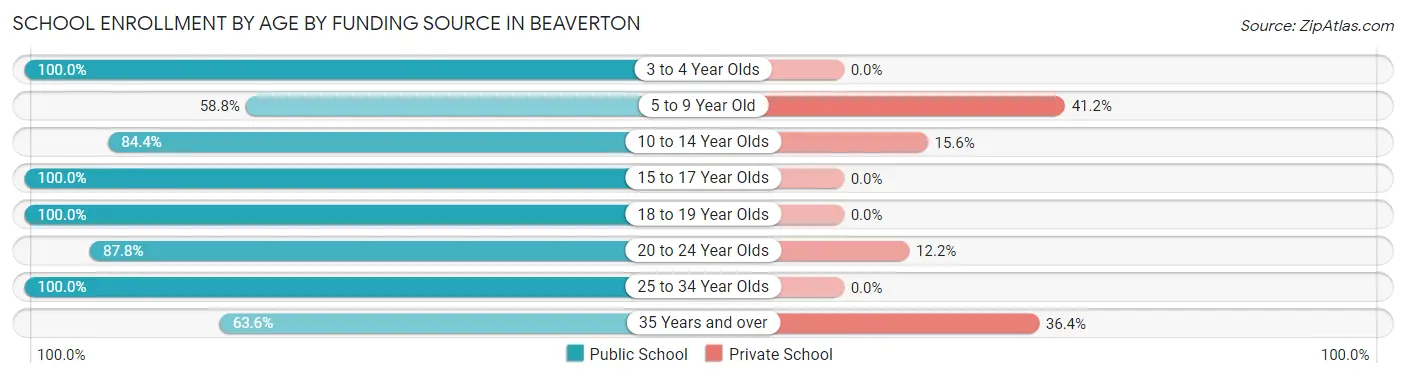
| Age Bracket | Public School | Private School |
| 3 to 4 Year Olds | 16 (100.0%) | 0 (0.0%) |
| 5 to 9 Year Old | 40 (58.8%) | 28 (41.2%) |
| 10 to 14 Year Olds | 54 (84.4%) | 10 (15.6%) |
| 15 to 17 Year Olds | 50 (100.0%) | 0 (0.0%) |
| 18 to 19 Year Olds | 35 (100.0%) | 0 (0.0%) |
| 20 to 24 Year Olds | 36 (87.8%) | 5 (12.2%) |
| 25 to 34 Year Olds | 13 (100.0%) | 0 (0.0%) |
| 35 Years and over | 7 (63.6%) | 4 (36.4%) |
| Total | 251 (84.2%) | 47 (15.8%) |
Educational Attainment by Field of Study in Beaverton
Education (37 | 38.5%), business (35 | 36.5%), communications (11 | 11.5%), computers & mathematics (4 | 4.2%), and science & technology (4 | 4.2%) are the most common fields of study among 96 individuals in Beaverton who have obtained a bachelor's degree or higher.
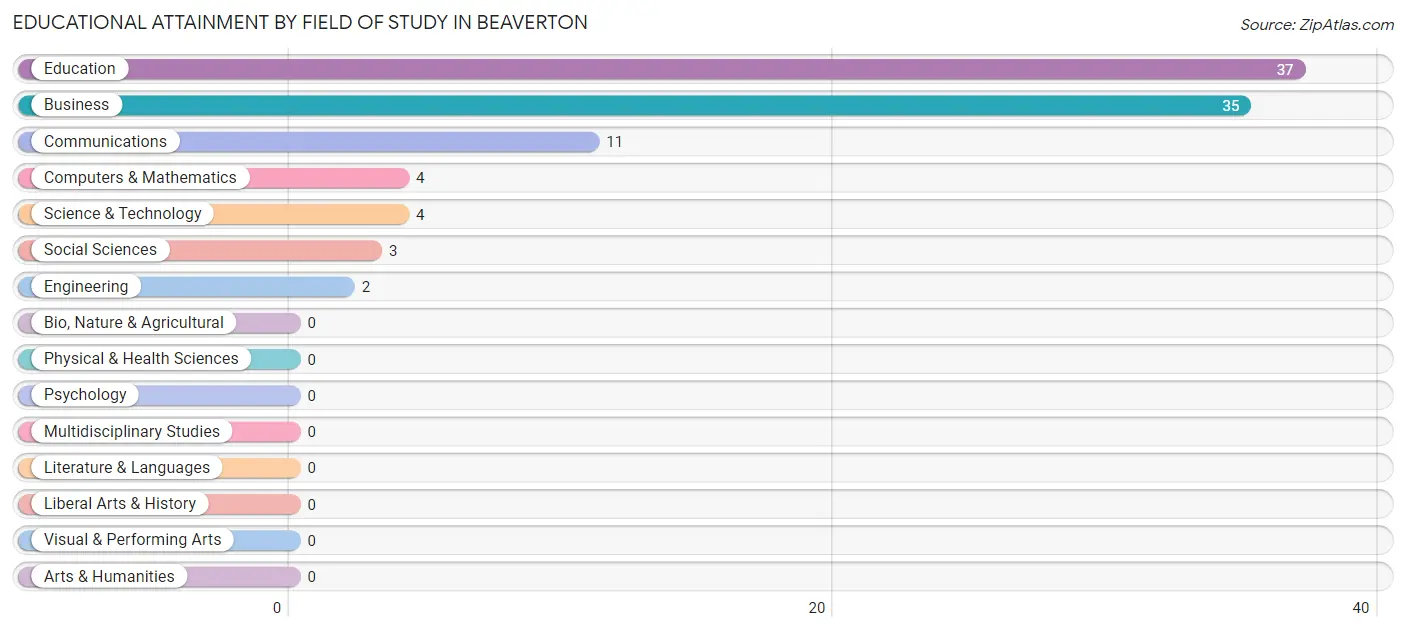
| Field of Study | # Graduates | % Graduates |
| Computers & Mathematics | 4 | 4.2% |
| Bio, Nature & Agricultural | 0 | 0.0% |
| Physical & Health Sciences | 0 | 0.0% |
| Psychology | 0 | 0.0% |
| Social Sciences | 3 | 3.1% |
| Engineering | 2 | 2.1% |
| Multidisciplinary Studies | 0 | 0.0% |
| Science & Technology | 4 | 4.2% |
| Business | 35 | 36.5% |
| Education | 37 | 38.5% |
| Literature & Languages | 0 | 0.0% |
| Liberal Arts & History | 0 | 0.0% |
| Visual & Performing Arts | 0 | 0.0% |
| Communications | 11 | 11.5% |
| Arts & Humanities | 0 | 0.0% |
| Total | 96 | 100.0% |
Transportation & Commute in Beaverton
Vehicle Availability by Sex in Beaverton
The most prevalent vehicle ownership categories in Beaverton are males with 2 vehicles (81, accounting for 39.3%) and females with 2 vehicles (89, making up 36.8%).
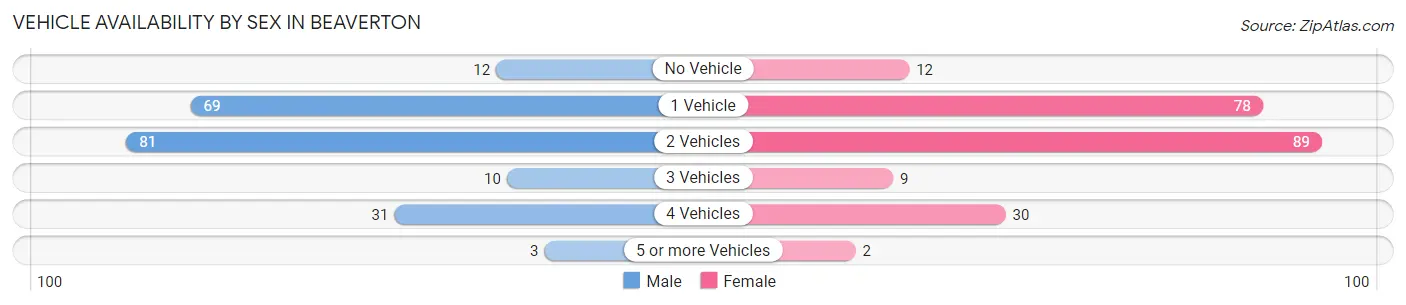
| Vehicles Available | Male | Female |
| No Vehicle | 12 (5.8%) | 12 (5.4%) |
| 1 Vehicle | 69 (33.5%) | 78 (35.4%) |
| 2 Vehicles | 81 (39.3%) | 89 (40.5%) |
| 3 Vehicles | 10 (4.9%) | 9 (4.1%) |
| 4 Vehicles | 31 (15.0%) | 30 (13.6%) |
| 5 or more Vehicles | 3 (1.5%) | 2 (0.9%) |
| Total | 206 (100.0%) | 220 (100.0%) |
Commute Time in Beaverton
The most frequently occuring commute durations in Beaverton are 5 to 9 minutes (76 commuters, 18.9%), 15 to 19 minutes (71 commuters, 17.7%), and 45 to 59 minutes (66 commuters, 16.4%).
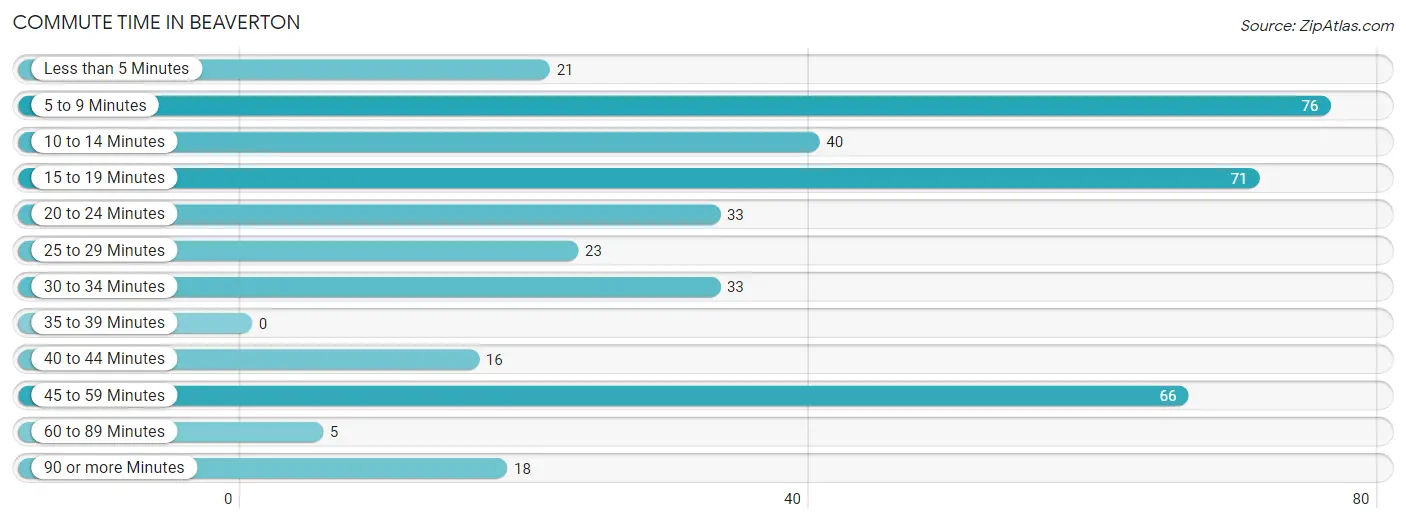
| Commute Time | # Commuters | % Commuters |
| Less than 5 Minutes | 21 | 5.2% |
| 5 to 9 Minutes | 76 | 18.9% |
| 10 to 14 Minutes | 40 | 10.0% |
| 15 to 19 Minutes | 71 | 17.7% |
| 20 to 24 Minutes | 33 | 8.2% |
| 25 to 29 Minutes | 23 | 5.7% |
| 30 to 34 Minutes | 33 | 8.2% |
| 35 to 39 Minutes | 0 | 0.0% |
| 40 to 44 Minutes | 16 | 4.0% |
| 45 to 59 Minutes | 66 | 16.4% |
| 60 to 89 Minutes | 5 | 1.2% |
| 90 or more Minutes | 18 | 4.5% |
Commute Time by Sex in Beaverton
The most common commute times in Beaverton are 45 to 59 minutes (40 commuters, 20.6%) for males and 5 to 9 minutes (50 commuters, 24.0%) for females.
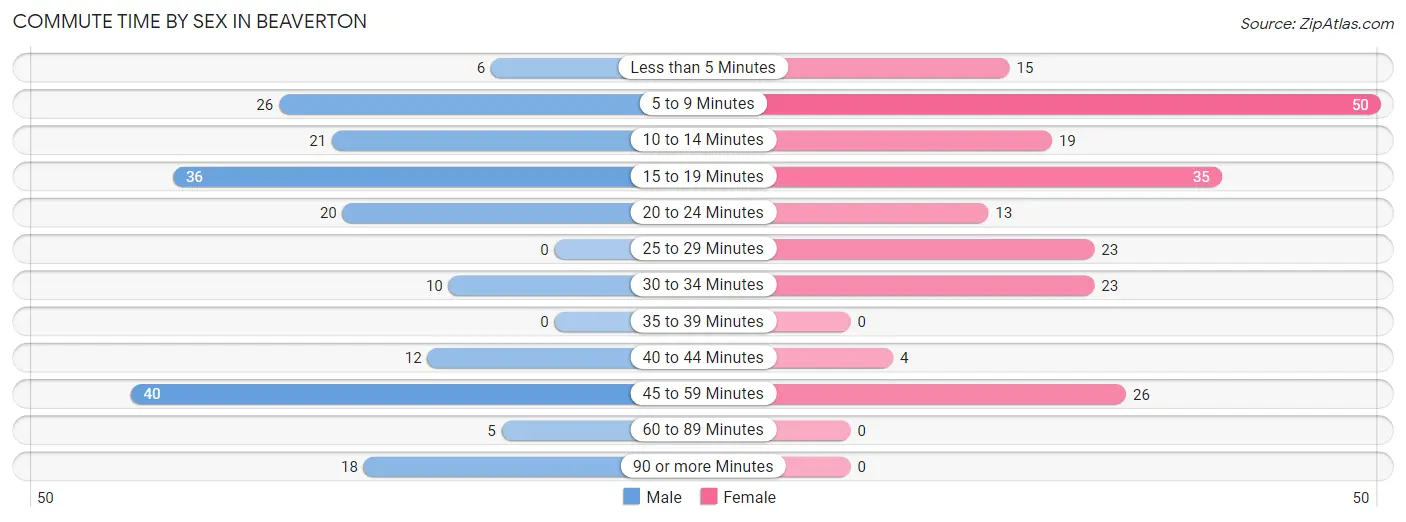
| Commute Time | Male | Female |
| Less than 5 Minutes | 6 (3.1%) | 15 (7.2%) |
| 5 to 9 Minutes | 26 (13.4%) | 50 (24.0%) |
| 10 to 14 Minutes | 21 (10.8%) | 19 (9.1%) |
| 15 to 19 Minutes | 36 (18.6%) | 35 (16.8%) |
| 20 to 24 Minutes | 20 (10.3%) | 13 (6.2%) |
| 25 to 29 Minutes | 0 (0.0%) | 23 (11.1%) |
| 30 to 34 Minutes | 10 (5.1%) | 23 (11.1%) |
| 35 to 39 Minutes | 0 (0.0%) | 0 (0.0%) |
| 40 to 44 Minutes | 12 (6.2%) | 4 (1.9%) |
| 45 to 59 Minutes | 40 (20.6%) | 26 (12.5%) |
| 60 to 89 Minutes | 5 (2.6%) | 0 (0.0%) |
| 90 or more Minutes | 18 (9.3%) | 0 (0.0%) |
Time of Departure to Work by Sex in Beaverton
The most frequent times of departure to work in Beaverton are 12:00 PM to 3:59 PM (42, 21.6%) for males and 7:30 AM to 7:59 AM (41, 19.7%) for females.
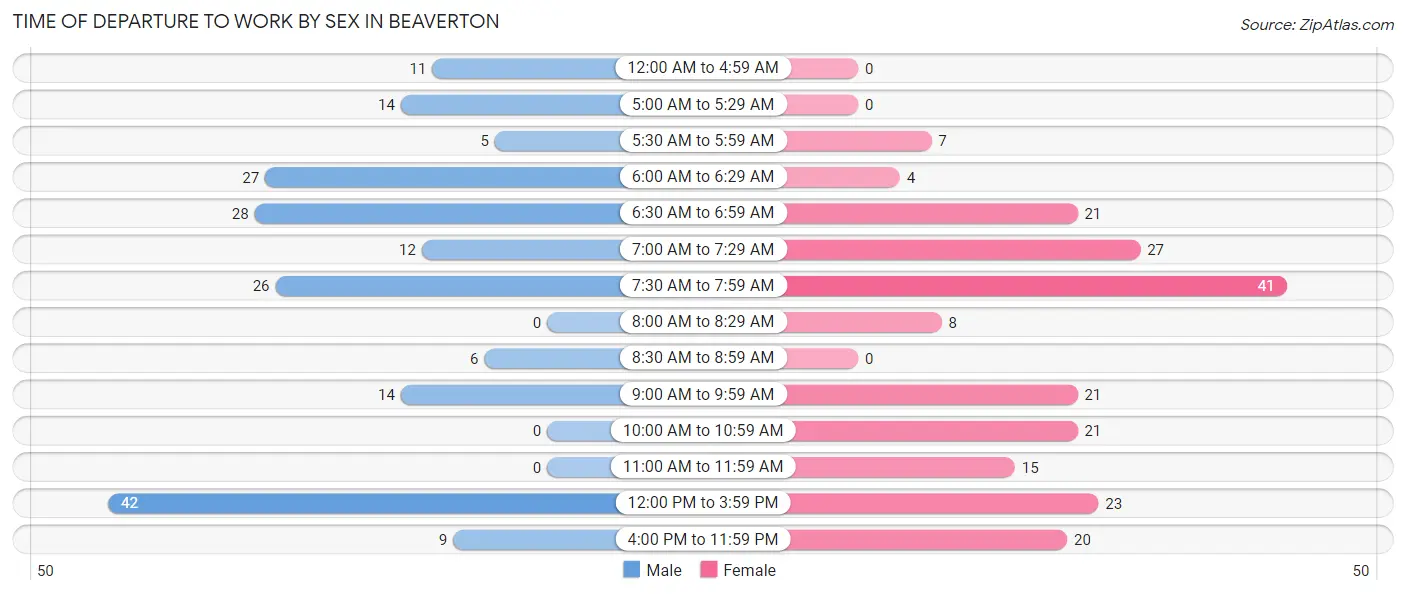
| Time of Departure | Male | Female |
| 12:00 AM to 4:59 AM | 11 (5.7%) | 0 (0.0%) |
| 5:00 AM to 5:29 AM | 14 (7.2%) | 0 (0.0%) |
| 5:30 AM to 5:59 AM | 5 (2.6%) | 7 (3.4%) |
| 6:00 AM to 6:29 AM | 27 (13.9%) | 4 (1.9%) |
| 6:30 AM to 6:59 AM | 28 (14.4%) | 21 (10.1%) |
| 7:00 AM to 7:29 AM | 12 (6.2%) | 27 (13.0%) |
| 7:30 AM to 7:59 AM | 26 (13.4%) | 41 (19.7%) |
| 8:00 AM to 8:29 AM | 0 (0.0%) | 8 (3.8%) |
| 8:30 AM to 8:59 AM | 6 (3.1%) | 0 (0.0%) |
| 9:00 AM to 9:59 AM | 14 (7.2%) | 21 (10.1%) |
| 10:00 AM to 10:59 AM | 0 (0.0%) | 21 (10.1%) |
| 11:00 AM to 11:59 AM | 0 (0.0%) | 15 (7.2%) |
| 12:00 PM to 3:59 PM | 42 (21.6%) | 23 (11.1%) |
| 4:00 PM to 11:59 PM | 9 (4.6%) | 20 (9.6%) |
| Total | 194 (100.0%) | 208 (100.0%) |
Housing Occupancy in Beaverton
Occupancy by Ownership in Beaverton
Of the total 519 dwellings in Beaverton, owner-occupied units account for 230 (44.3%), while renter-occupied units make up 289 (55.7%).
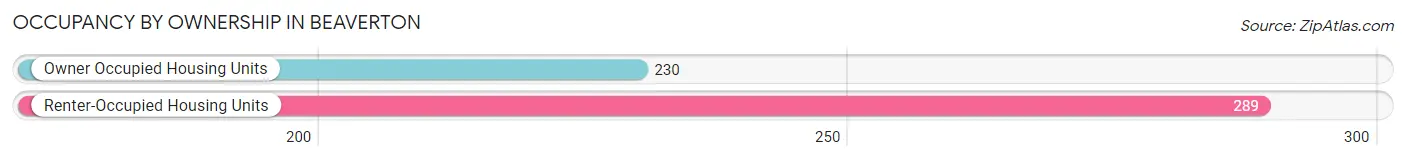
| Occupancy | # Housing Units | % Housing Units |
| Owner Occupied Housing Units | 230 | 44.3% |
| Renter-Occupied Housing Units | 289 | 55.7% |
| Total Occupied Housing Units | 519 | 100.0% |
Occupancy by Household Size in Beaverton
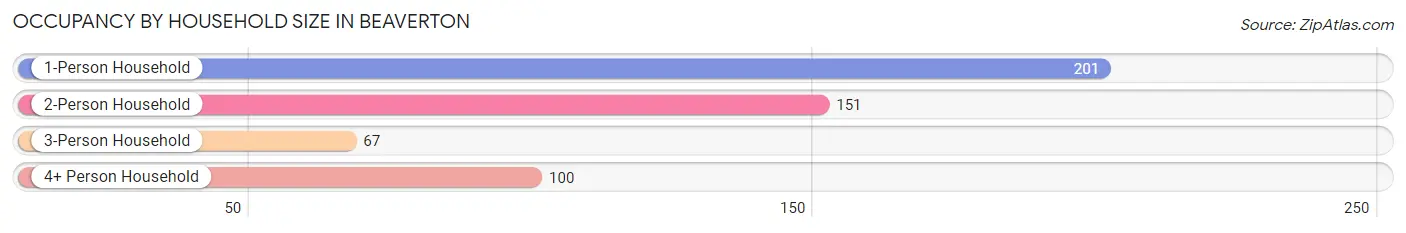
| Household Size | # Housing Units | % Housing Units |
| 1-Person Household | 201 | 38.7% |
| 2-Person Household | 151 | 29.1% |
| 3-Person Household | 67 | 12.9% |
| 4+ Person Household | 100 | 19.3% |
| Total Housing Units | 519 | 100.0% |
Occupancy by Ownership by Household Size in Beaverton
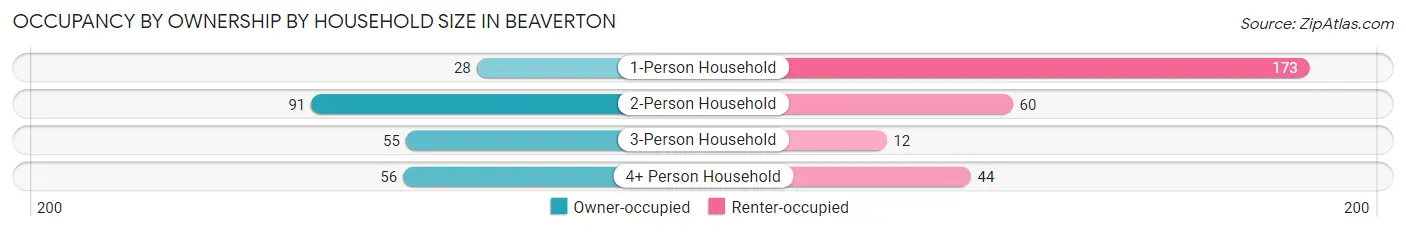
| Household Size | Owner-occupied | Renter-occupied |
| 1-Person Household | 28 (13.9%) | 173 (86.1%) |
| 2-Person Household | 91 (60.3%) | 60 (39.7%) |
| 3-Person Household | 55 (82.1%) | 12 (17.9%) |
| 4+ Person Household | 56 (56.0%) | 44 (44.0%) |
| Total Housing Units | 230 (44.3%) | 289 (55.7%) |
Occupancy by Educational Attainment in Beaverton
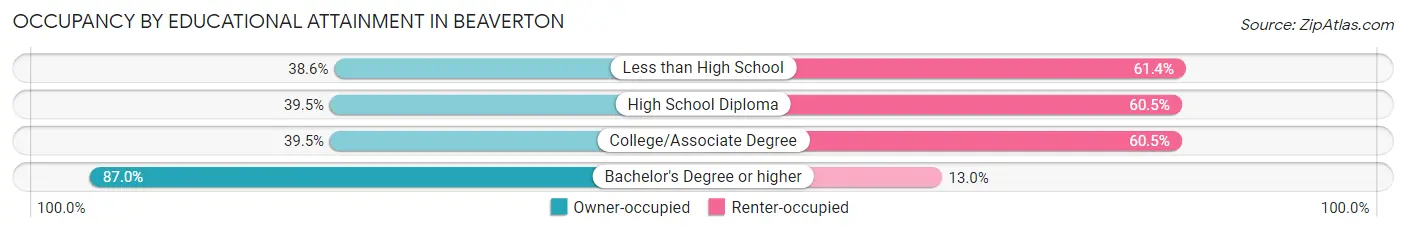
| Household Size | Owner-occupied | Renter-occupied |
| Less than High School | 22 (38.6%) | 35 (61.4%) |
| High School Diploma | 88 (39.5%) | 135 (60.5%) |
| College/Associate Degree | 73 (39.5%) | 112 (60.5%) |
| Bachelor's Degree or higher | 47 (87.0%) | 7 (13.0%) |
Occupancy by Age of Householder in Beaverton
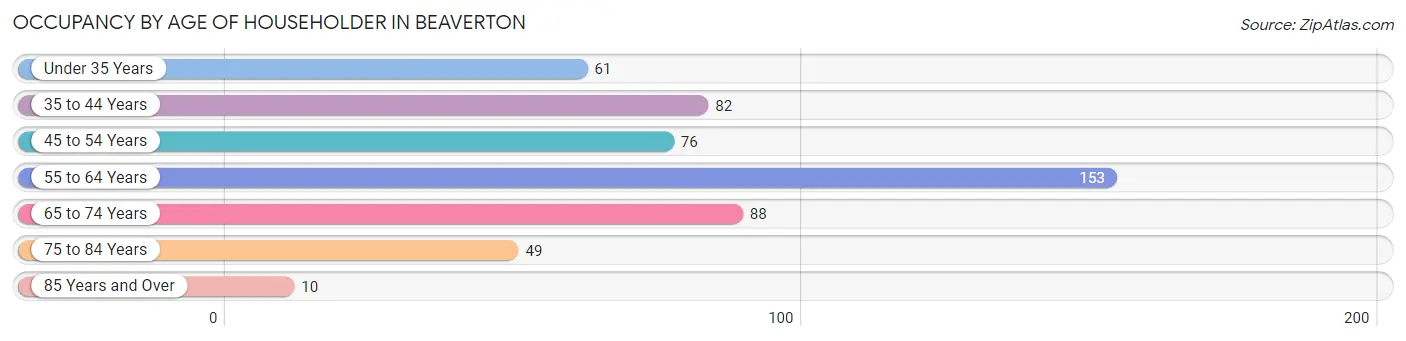
| Age Bracket | # Households | % Households |
| Under 35 Years | 61 | 11.7% |
| 35 to 44 Years | 82 | 15.8% |
| 45 to 54 Years | 76 | 14.6% |
| 55 to 64 Years | 153 | 29.5% |
| 65 to 74 Years | 88 | 17.0% |
| 75 to 84 Years | 49 | 9.4% |
| 85 Years and Over | 10 | 1.9% |
| Total | 519 | 100.0% |
Housing Finances in Beaverton
Median Income by Occupancy in Beaverton
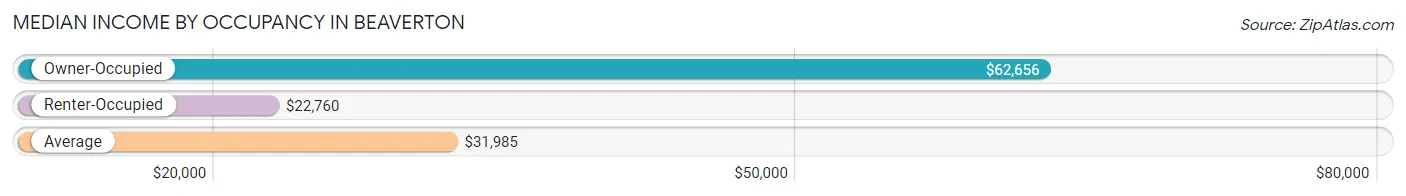
| Occupancy Type | # Households | Median Income |
| Owner-Occupied | 230 (44.3%) | $62,656 |
| Renter-Occupied | 289 (55.7%) | $22,760 |
| Average | 519 (100.0%) | $31,985 |
Occupancy by Householder Income Bracket in Beaverton
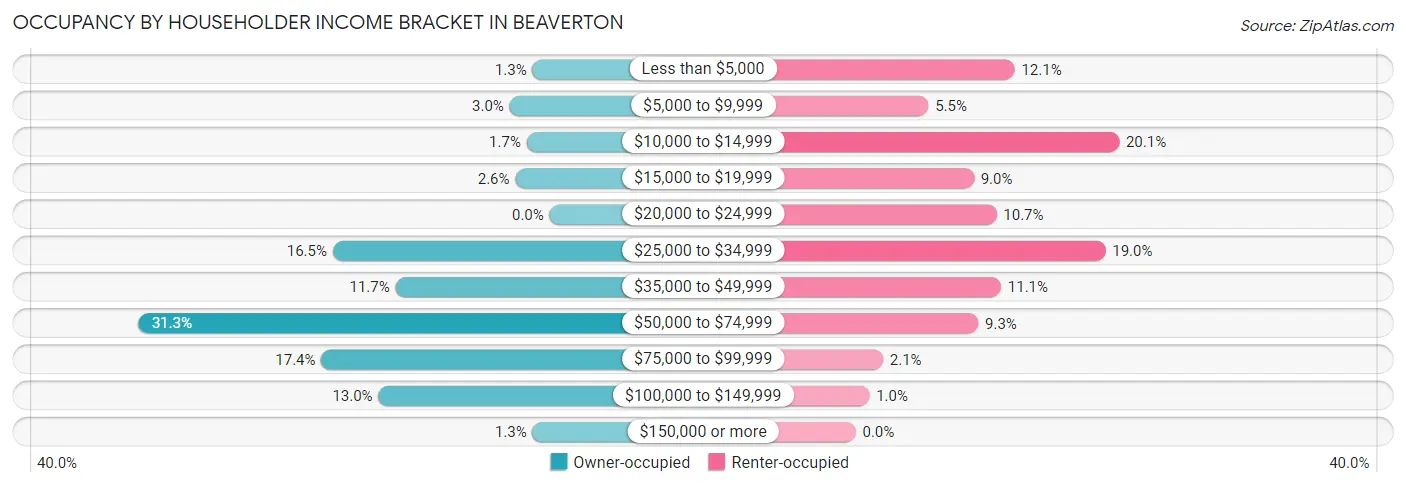
| Income Bracket | Owner-occupied | Renter-occupied |
| Less than $5,000 | 3 (1.3%) | 35 (12.1%) |
| $5,000 to $9,999 | 7 (3.0%) | 16 (5.5%) |
| $10,000 to $14,999 | 4 (1.7%) | 58 (20.1%) |
| $15,000 to $19,999 | 6 (2.6%) | 26 (9.0%) |
| $20,000 to $24,999 | 0 (0.0%) | 31 (10.7%) |
| $25,000 to $34,999 | 38 (16.5%) | 55 (19.0%) |
| $35,000 to $49,999 | 27 (11.7%) | 32 (11.1%) |
| $50,000 to $74,999 | 72 (31.3%) | 27 (9.3%) |
| $75,000 to $99,999 | 40 (17.4%) | 6 (2.1%) |
| $100,000 to $149,999 | 30 (13.0%) | 3 (1.0%) |
| $150,000 or more | 3 (1.3%) | 0 (0.0%) |
| Total | 230 (100.0%) | 289 (100.0%) |
Monthly Housing Cost Tiers in Beaverton
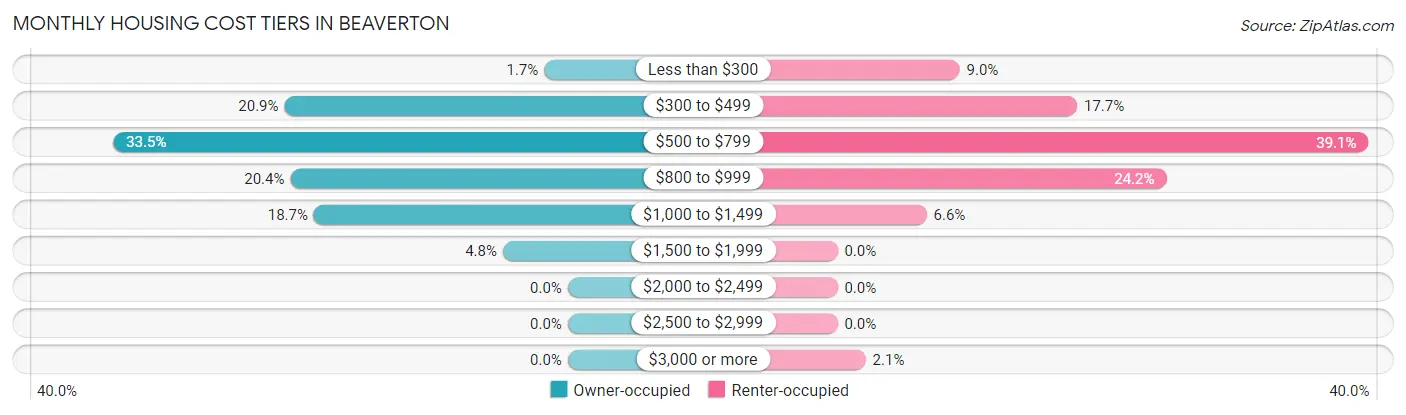
| Monthly Cost | Owner-occupied | Renter-occupied |
| Less than $300 | 4 (1.7%) | 26 (9.0%) |
| $300 to $499 | 48 (20.9%) | 51 (17.6%) |
| $500 to $799 | 77 (33.5%) | 113 (39.1%) |
| $800 to $999 | 47 (20.4%) | 70 (24.2%) |
| $1,000 to $1,499 | 43 (18.7%) | 19 (6.6%) |
| $1,500 to $1,999 | 11 (4.8%) | 0 (0.0%) |
| $2,000 to $2,499 | 0 (0.0%) | 0 (0.0%) |
| $2,500 to $2,999 | 0 (0.0%) | 0 (0.0%) |
| $3,000 or more | 0 (0.0%) | 6 (2.1%) |
| Total | 230 (100.0%) | 289 (100.0%) |
Physical Housing Characteristics in Beaverton
Housing Structures in Beaverton
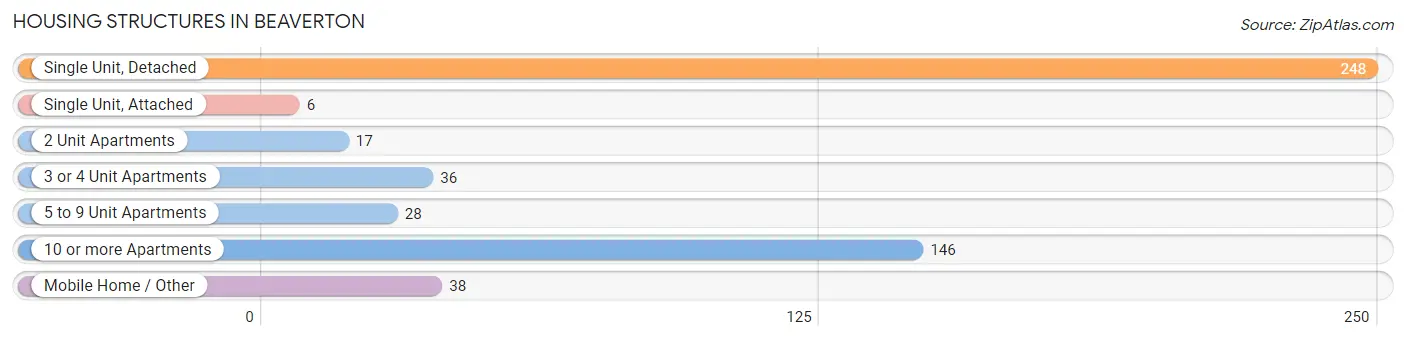
| Structure Type | # Housing Units | % Housing Units |
| Single Unit, Detached | 248 | 47.8% |
| Single Unit, Attached | 6 | 1.2% |
| 2 Unit Apartments | 17 | 3.3% |
| 3 or 4 Unit Apartments | 36 | 6.9% |
| 5 to 9 Unit Apartments | 28 | 5.4% |
| 10 or more Apartments | 146 | 28.1% |
| Mobile Home / Other | 38 | 7.3% |
| Total | 519 | 100.0% |
Housing Structures by Occupancy in Beaverton
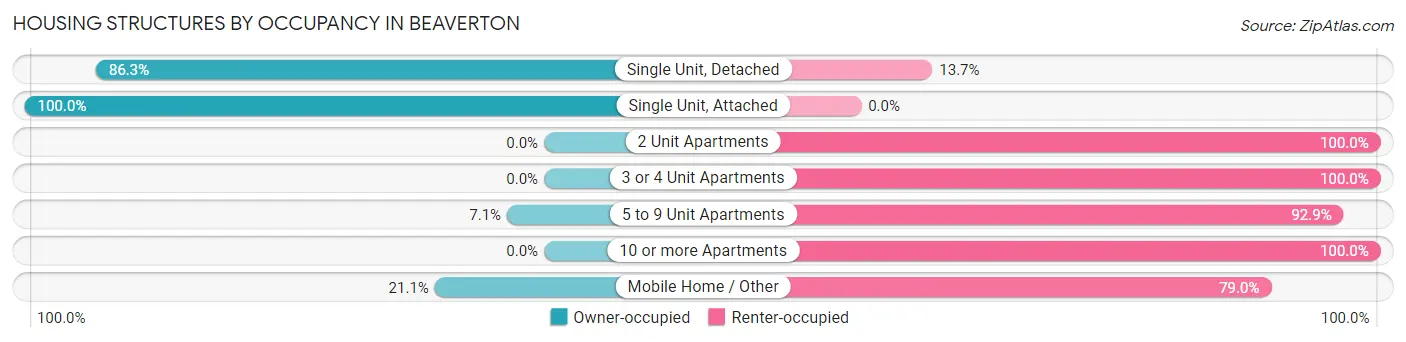
| Structure Type | Owner-occupied | Renter-occupied |
| Single Unit, Detached | 214 (86.3%) | 34 (13.7%) |
| Single Unit, Attached | 6 (100.0%) | 0 (0.0%) |
| 2 Unit Apartments | 0 (0.0%) | 17 (100.0%) |
| 3 or 4 Unit Apartments | 0 (0.0%) | 36 (100.0%) |
| 5 to 9 Unit Apartments | 2 (7.1%) | 26 (92.9%) |
| 10 or more Apartments | 0 (0.0%) | 146 (100.0%) |
| Mobile Home / Other | 8 (21.0%) | 30 (78.9%) |
| Total | 230 (44.3%) | 289 (55.7%) |
Housing Structures by Number of Rooms in Beaverton
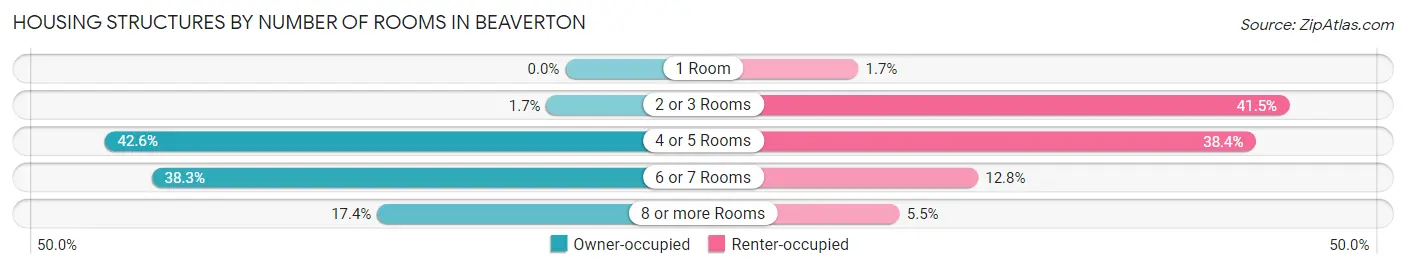
| Number of Rooms | Owner-occupied | Renter-occupied |
| 1 Room | 0 (0.0%) | 5 (1.7%) |
| 2 or 3 Rooms | 4 (1.7%) | 120 (41.5%) |
| 4 or 5 Rooms | 98 (42.6%) | 111 (38.4%) |
| 6 or 7 Rooms | 88 (38.3%) | 37 (12.8%) |
| 8 or more Rooms | 40 (17.4%) | 16 (5.5%) |
| Total | 230 (100.0%) | 289 (100.0%) |
Housing Structure by Heating Type in Beaverton
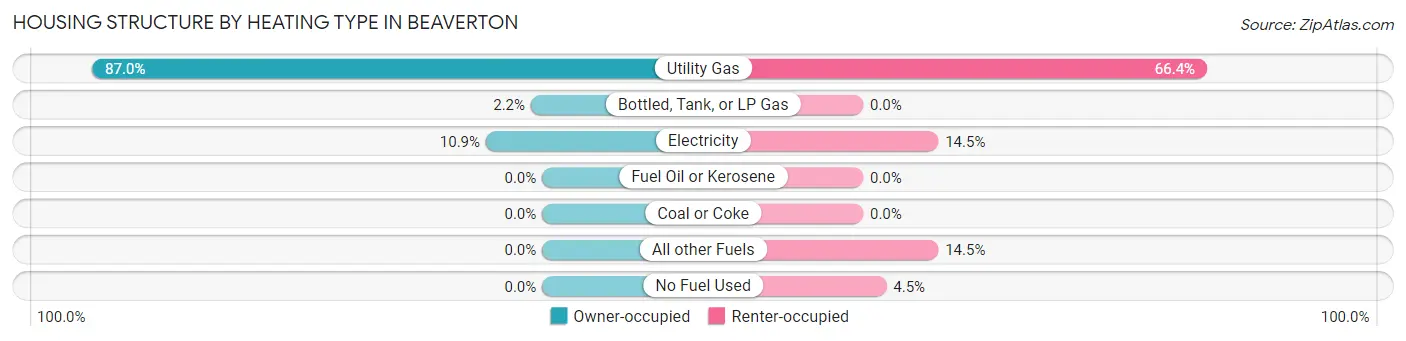
| Heating Type | Owner-occupied | Renter-occupied |
| Utility Gas | 200 (87.0%) | 192 (66.4%) |
| Bottled, Tank, or LP Gas | 5 (2.2%) | 0 (0.0%) |
| Electricity | 25 (10.9%) | 42 (14.5%) |
| Fuel Oil or Kerosene | 0 (0.0%) | 0 (0.0%) |
| Coal or Coke | 0 (0.0%) | 0 (0.0%) |
| All other Fuels | 0 (0.0%) | 42 (14.5%) |
| No Fuel Used | 0 (0.0%) | 13 (4.5%) |
| Total | 230 (100.0%) | 289 (100.0%) |
Household Vehicle Usage in Beaverton
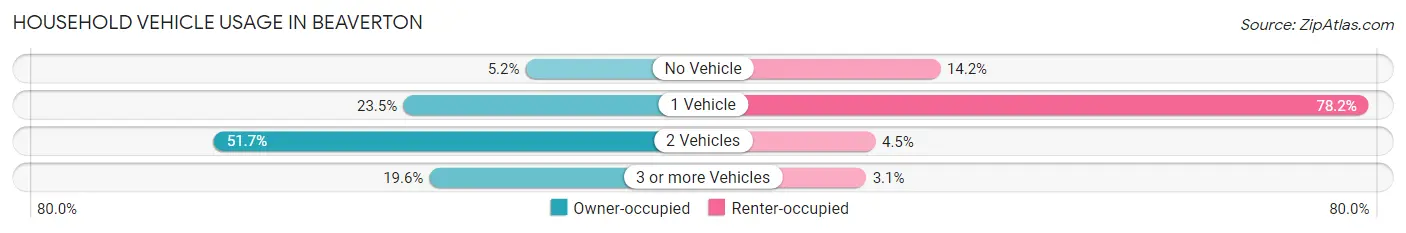
| Vehicles per Household | Owner-occupied | Renter-occupied |
| No Vehicle | 12 (5.2%) | 41 (14.2%) |
| 1 Vehicle | 54 (23.5%) | 226 (78.2%) |
| 2 Vehicles | 119 (51.7%) | 13 (4.5%) |
| 3 or more Vehicles | 45 (19.6%) | 9 (3.1%) |
| Total | 230 (100.0%) | 289 (100.0%) |
Real Estate & Mortgages in Beaverton
Real Estate and Mortgage Overview in Beaverton
| Characteristic | Without Mortgage | With Mortgage |
| Housing Units | 109 | 121 |
| Median Property Value | $103,100 | $95,000 |
| Median Household Income | $49,125 | $0 |
| Monthly Housing Costs | $506 | $0 |
| Real Estate Taxes | $1,242 | $4 |
Property Value by Mortgage Status in Beaverton
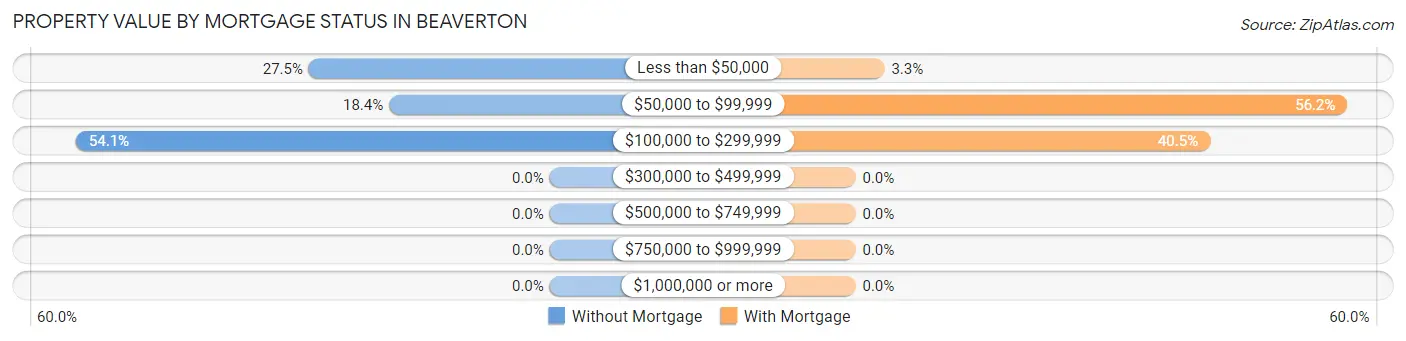
| Property Value | Without Mortgage | With Mortgage |
| Less than $50,000 | 30 (27.5%) | 4 (3.3%) |
| $50,000 to $99,999 | 20 (18.3%) | 68 (56.2%) |
| $100,000 to $299,999 | 59 (54.1%) | 49 (40.5%) |
| $300,000 to $499,999 | 0 (0.0%) | 0 (0.0%) |
| $500,000 to $749,999 | 0 (0.0%) | 0 (0.0%) |
| $750,000 to $999,999 | 0 (0.0%) | 0 (0.0%) |
| $1,000,000 or more | 0 (0.0%) | 0 (0.0%) |
| Total | 109 (100.0%) | 121 (100.0%) |
Household Income by Mortgage Status in Beaverton
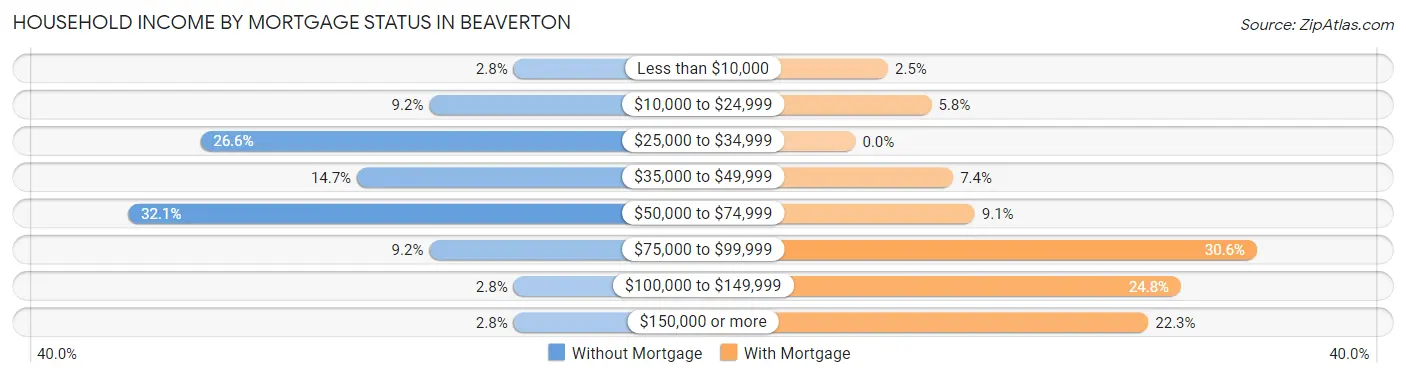
| Household Income | Without Mortgage | With Mortgage |
| Less than $10,000 | 3 (2.8%) | 3 (2.5%) |
| $10,000 to $24,999 | 10 (9.2%) | 7 (5.8%) |
| $25,000 to $34,999 | 29 (26.6%) | 0 (0.0%) |
| $35,000 to $49,999 | 16 (14.7%) | 9 (7.4%) |
| $50,000 to $74,999 | 35 (32.1%) | 11 (9.1%) |
| $75,000 to $99,999 | 10 (9.2%) | 37 (30.6%) |
| $100,000 to $149,999 | 3 (2.8%) | 30 (24.8%) |
| $150,000 or more | 3 (2.8%) | 27 (22.3%) |
| Total | 109 (100.0%) | 121 (100.0%) |
Property Value to Household Income Ratio in Beaverton
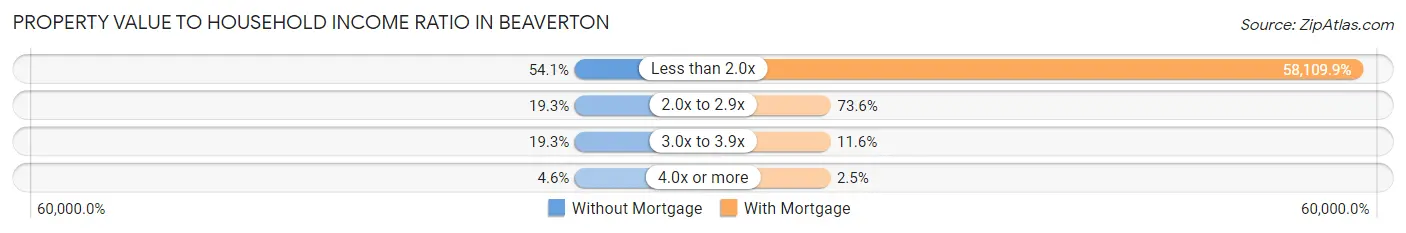
| Value-to-Income Ratio | Without Mortgage | With Mortgage |
| Less than 2.0x | 59 (54.1%) | 70,313 (58,109.9%) |
| 2.0x to 2.9x | 21 (19.3%) | 89 (73.6%) |
| 3.0x to 3.9x | 21 (19.3%) | 14 (11.6%) |
| 4.0x or more | 5 (4.6%) | 3 (2.5%) |
| Total | 109 (100.0%) | 121 (100.0%) |
Real Estate Taxes by Mortgage Status in Beaverton
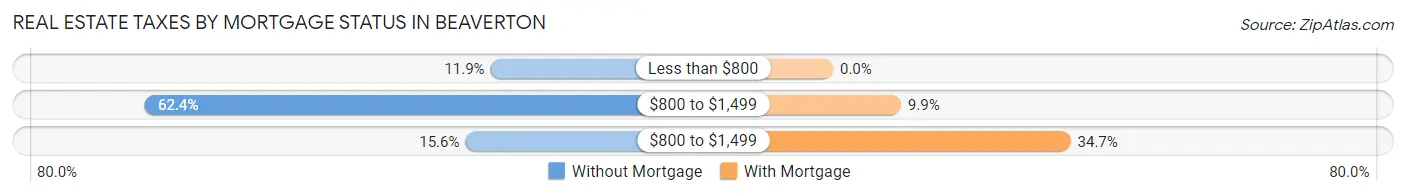
| Property Taxes | Without Mortgage | With Mortgage |
| Less than $800 | 13 (11.9%) | 0 (0.0%) |
| $800 to $1,499 | 68 (62.4%) | 12 (9.9%) |
| $800 to $1,499 | 17 (15.6%) | 42 (34.7%) |
| Total | 109 (100.0%) | 121 (100.0%) |
Health & Disability in Beaverton
Health Insurance Coverage by Age in Beaverton
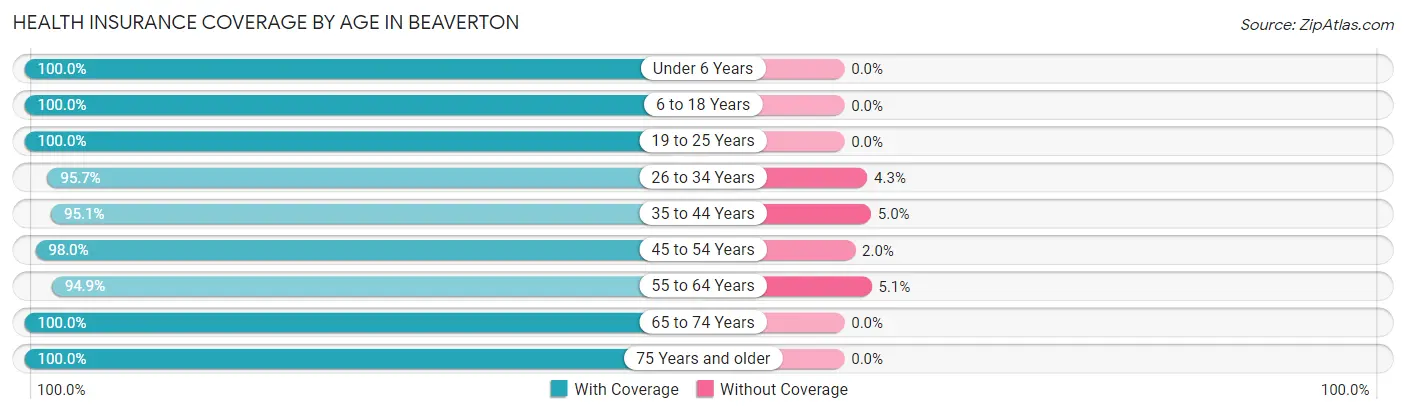
| Age Bracket | With Coverage | Without Coverage |
| Under 6 Years | 85 (100.0%) | 0 (0.0%) |
| 6 to 18 Years | 238 (100.0%) | 0 (0.0%) |
| 19 to 25 Years | 79 (100.0%) | 0 (0.0%) |
| 26 to 34 Years | 90 (95.7%) | 4 (4.3%) |
| 35 to 44 Years | 173 (95.1%) | 9 (5.0%) |
| 45 to 54 Years | 146 (98.0%) | 3 (2.0%) |
| 55 to 64 Years | 187 (94.9%) | 10 (5.1%) |
| 65 to 74 Years | 103 (100.0%) | 0 (0.0%) |
| 75 Years and older | 67 (100.0%) | 0 (0.0%) |
| Total | 1,168 (97.8%) | 26 (2.2%) |
Health Insurance Coverage by Citizenship Status in Beaverton
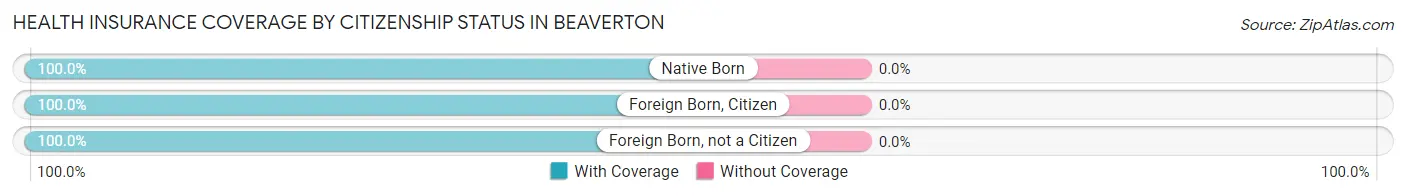
| Citizenship Status | With Coverage | Without Coverage |
| Native Born | 85 (100.0%) | 0 (0.0%) |
| Foreign Born, Citizen | 238 (100.0%) | 0 (0.0%) |
| Foreign Born, not a Citizen | 79 (100.0%) | 0 (0.0%) |
Health Insurance Coverage by Household Income in Beaverton
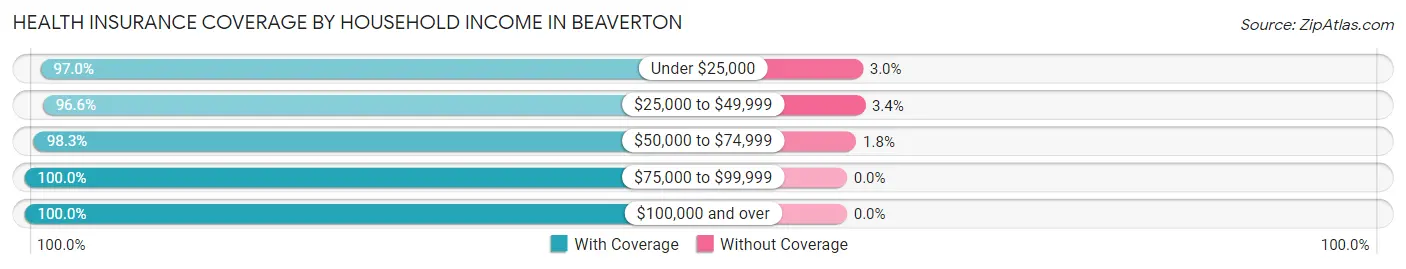
| Household Income | With Coverage | Without Coverage |
| Under $25,000 | 259 (97.0%) | 8 (3.0%) |
| $25,000 to $49,999 | 369 (96.6%) | 13 (3.4%) |
| $50,000 to $74,999 | 280 (98.3%) | 5 (1.8%) |
| $75,000 to $99,999 | 132 (100.0%) | 0 (0.0%) |
| $100,000 and over | 128 (100.0%) | 0 (0.0%) |
Public vs Private Health Insurance Coverage by Age in Beaverton
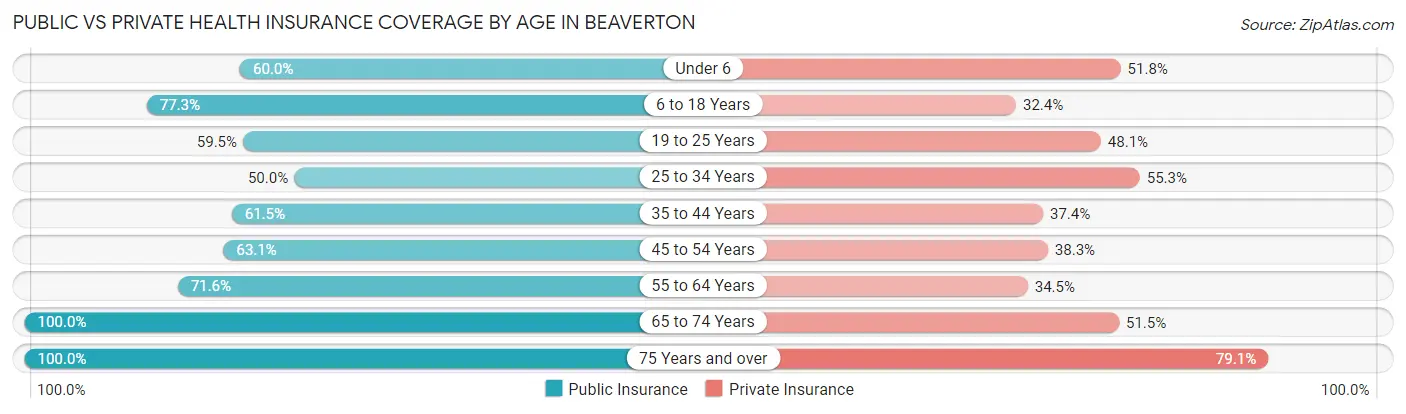
| Age Bracket | Public Insurance | Private Insurance |
| Under 6 | 51 (60.0%) | 44 (51.8%) |
| 6 to 18 Years | 184 (77.3%) | 77 (32.4%) |
| 19 to 25 Years | 47 (59.5%) | 38 (48.1%) |
| 25 to 34 Years | 47 (50.0%) | 52 (55.3%) |
| 35 to 44 Years | 112 (61.5%) | 68 (37.4%) |
| 45 to 54 Years | 94 (63.1%) | 57 (38.3%) |
| 55 to 64 Years | 141 (71.6%) | 68 (34.5%) |
| 65 to 74 Years | 103 (100.0%) | 53 (51.5%) |
| 75 Years and over | 67 (100.0%) | 53 (79.1%) |
| Total | 846 (70.9%) | 510 (42.7%) |
Disability Status by Sex by Age in Beaverton
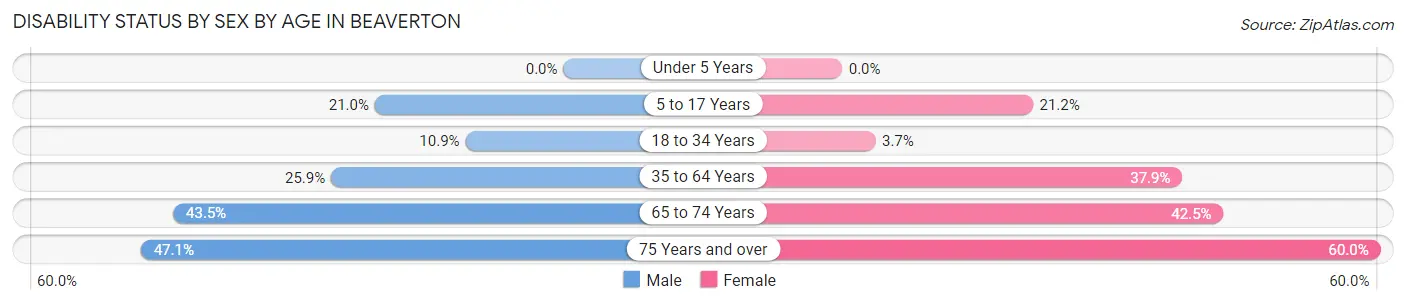
| Age Bracket | Male | Female |
| Under 5 Years | 0 (0.0%) | 0 (0.0%) |
| 5 to 17 Years | 21 (21.0%) | 24 (21.2%) |
| 18 to 34 Years | 12 (10.9%) | 4 (3.7%) |
| 35 to 64 Years | 67 (25.9%) | 102 (37.9%) |
| 65 to 74 Years | 10 (43.5%) | 34 (42.5%) |
| 75 Years and over | 8 (47.1%) | 30 (60.0%) |
Disability Class by Sex by Age in Beaverton
Disability Class: Hearing Difficulty
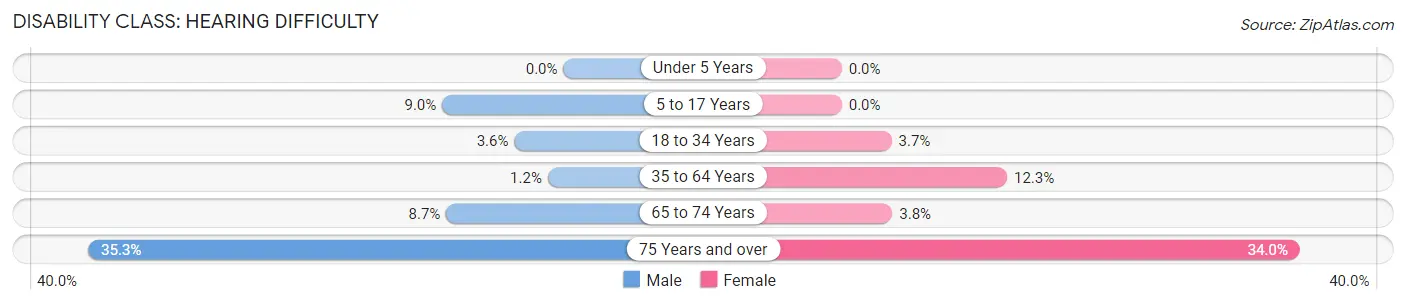
| Age Bracket | Male | Female |
| Under 5 Years | 0 (0.0%) | 0 (0.0%) |
| 5 to 17 Years | 9 (9.0%) | 0 (0.0%) |
| 18 to 34 Years | 4 (3.6%) | 4 (3.7%) |
| 35 to 64 Years | 3 (1.2%) | 33 (12.3%) |
| 65 to 74 Years | 2 (8.7%) | 3 (3.7%) |
| 75 Years and over | 6 (35.3%) | 17 (34.0%) |
Disability Class: Vision Difficulty
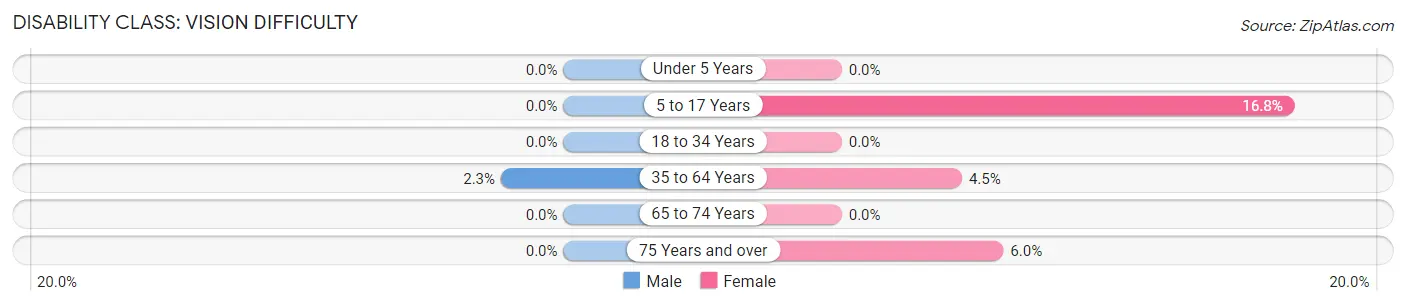
| Age Bracket | Male | Female |
| Under 5 Years | 0 (0.0%) | 0 (0.0%) |
| 5 to 17 Years | 0 (0.0%) | 19 (16.8%) |
| 18 to 34 Years | 0 (0.0%) | 0 (0.0%) |
| 35 to 64 Years | 6 (2.3%) | 12 (4.5%) |
| 65 to 74 Years | 0 (0.0%) | 0 (0.0%) |
| 75 Years and over | 0 (0.0%) | 3 (6.0%) |
Disability Class: Cognitive Difficulty
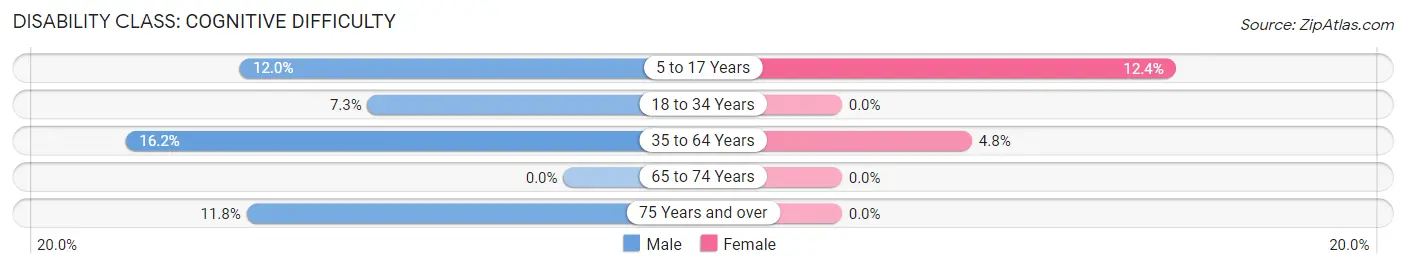
| Age Bracket | Male | Female |
| 5 to 17 Years | 12 (12.0%) | 14 (12.4%) |
| 18 to 34 Years | 8 (7.3%) | 0 (0.0%) |
| 35 to 64 Years | 42 (16.2%) | 13 (4.8%) |
| 65 to 74 Years | 0 (0.0%) | 0 (0.0%) |
| 75 Years and over | 2 (11.8%) | 0 (0.0%) |
Disability Class: Ambulatory Difficulty
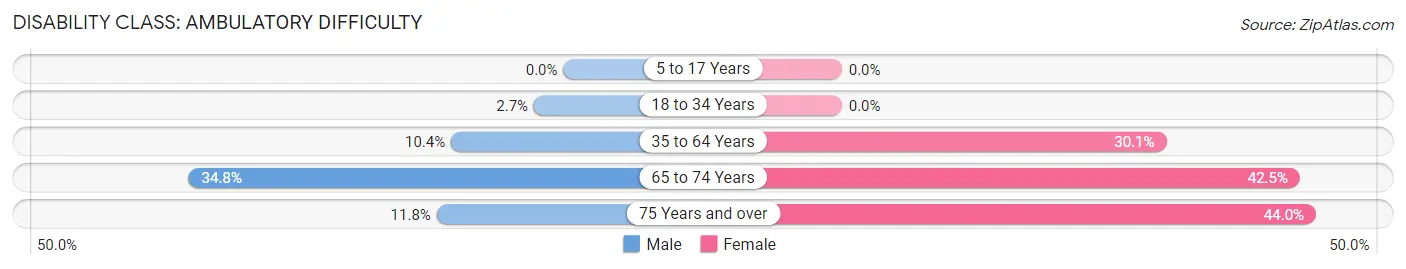
| Age Bracket | Male | Female |
| 5 to 17 Years | 0 (0.0%) | 0 (0.0%) |
| 18 to 34 Years | 3 (2.7%) | 0 (0.0%) |
| 35 to 64 Years | 27 (10.4%) | 81 (30.1%) |
| 65 to 74 Years | 8 (34.8%) | 34 (42.5%) |
| 75 Years and over | 2 (11.8%) | 22 (44.0%) |
Disability Class: Self-Care Difficulty
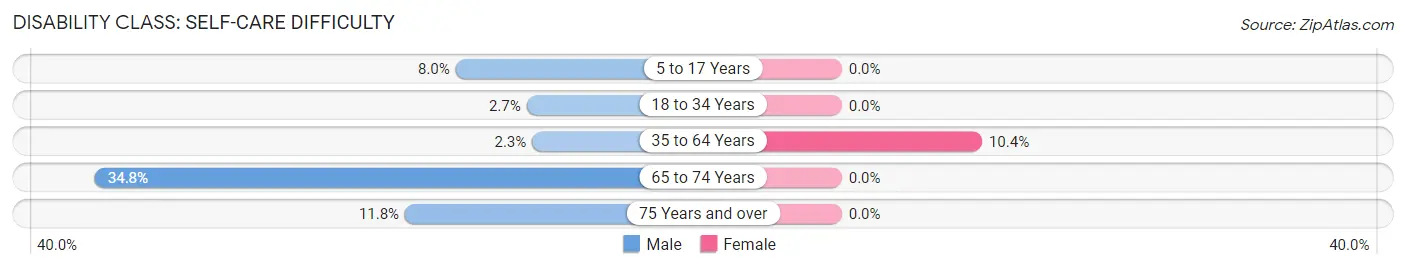
| Age Bracket | Male | Female |
| 5 to 17 Years | 8 (8.0%) | 0 (0.0%) |
| 18 to 34 Years | 3 (2.7%) | 0 (0.0%) |
| 35 to 64 Years | 6 (2.3%) | 28 (10.4%) |
| 65 to 74 Years | 8 (34.8%) | 0 (0.0%) |
| 75 Years and over | 2 (11.8%) | 0 (0.0%) |
Technology Access in Beaverton
Computing Device Access in Beaverton
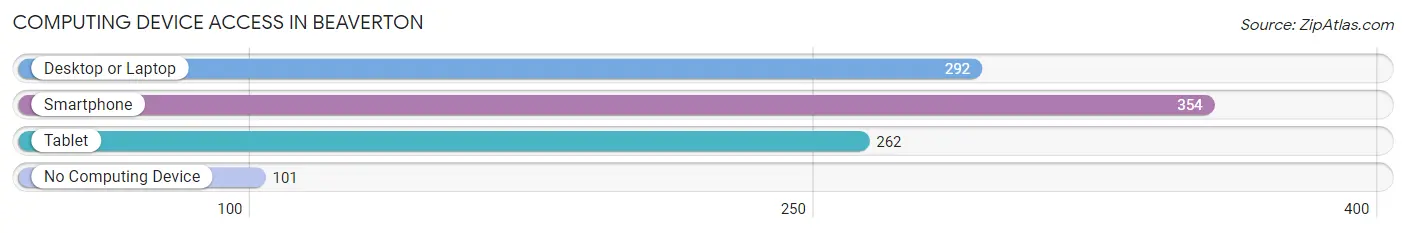
| Device Type | # Households | % Households |
| Desktop or Laptop | 292 | 56.3% |
| Smartphone | 354 | 68.2% |
| Tablet | 262 | 50.5% |
| No Computing Device | 101 | 19.5% |
| Total | 519 | 100.0% |
Internet Access in Beaverton
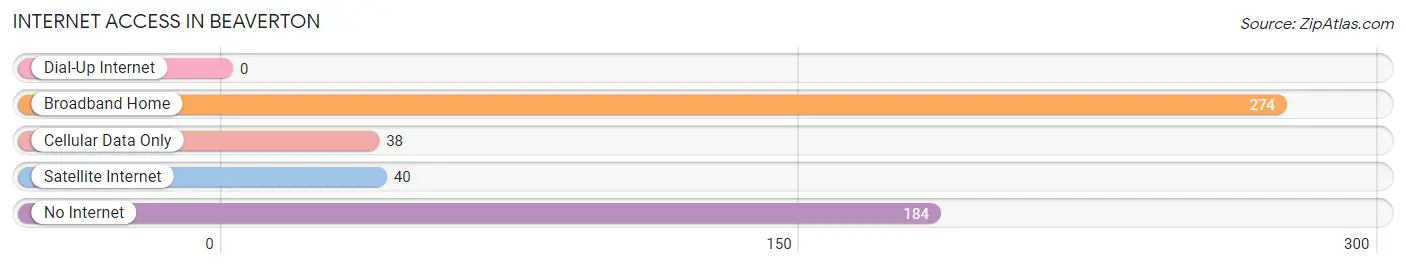
| Internet Type | # Households | % Households |
| Dial-Up Internet | 0 | 0.0% |
| Broadband Home | 274 | 52.8% |
| Cellular Data Only | 38 | 7.3% |
| Satellite Internet | 40 | 7.7% |
| No Internet | 184 | 35.4% |
| Total | 519 | 100.0% |
Beaverton Summary
Beaverton is a small city located in the northern part of Michigan’s Lower Peninsula. It is situated in the middle of Gladwin County, and is surrounded by the townships of Beaverton, Eden, Jerome, and Warren. The city is located on the Tobacco River, and is home to a population of approximately 1,500 people.
History
Beaverton was first settled in 1871 by a group of lumbermen from Canada. The town was named after the beaver, which was abundant in the area. The lumbermen built a sawmill and a gristmill, and the town quickly grew. By 1876, Beaverton had a post office, a school, and a general store.
In the late 1800s, Beaverton was a thriving lumber town. The town was home to several sawmills, a planing mill, and a shingle mill. The lumber industry provided employment for many of the town’s residents.
In the early 1900s, Beaverton began to transition from a lumber town to an agricultural community. The town was home to several farms, and the surrounding area was used for growing crops such as potatoes, corn, and beans.
In the 1950s, Beaverton began to experience a population decline. Many of the town’s residents moved away in search of better job opportunities. The decline continued until the late 1990s, when the town began to experience a population increase.
Geography
Beaverton is located in the northern part of Michigan’s Lower Peninsula. The city is situated in the middle of Gladwin County, and is surrounded by the townships of Beaverton, Eden, Jerome, and Warren. The city is located on the Tobacco River, and is home to a population of approximately 1,500 people.
The city of Beaverton is located in a rural area, and is surrounded by forests and farmland. The city is located approximately 30 miles from the city of Midland, and is approximately 60 miles from the city of Saginaw.
Economy
Beaverton’s economy is largely based on agriculture and tourism. The city is home to several farms, and the surrounding area is used for growing crops such as potatoes, corn, and beans. The city is also home to several tourist attractions, including the Beaverton Historical Museum and the Beaverton Nature Center.
The city is also home to several small businesses, including restaurants, retail stores, and service providers. The city is home to several manufacturing companies, including a furniture manufacturer and a metal fabrication company.
Demographics
As of the 2010 census, Beaverton had a population of 1,521 people. The racial makeup of the city was 95.3% White, 0.7% African American, 0.7% Native American, 0.3% Asian, 0.1% Pacific Islander, 0.7% from other races, and 2.0% from two or more races. Hispanic or Latino of any race were 2.2% of the population.
The median household income in Beaverton was $35,938, and the median family income was $41,250. The per capita income for the city was $17,845. About 16.2% of families and 19.2% of the population were below the poverty line, including 25.2% of those under age 18 and 11.2% of those age 65 or over.
Common Questions
What is Per Capita Income in Beaverton?
Per Capita income in Beaverton is $23,215.
What is the Median Family Income in Beaverton?
Median Family Income in Beaverton is $48,125.
What is the Median Household income in Beaverton?
Median Household Income in Beaverton is $31,985.
What is Income or Wage Gap in Beaverton?
Income or Wage Gap in Beaverton is 31.3%.
Women in Beaverton earn 68.7 cents for every dollar earned by a man.
What is Inequality or Gini Index in Beaverton?
Inequality or Gini Index in Beaverton is 0.55.
What is the Total Population of Beaverton?
Total Population of Beaverton is 1,194.
What is the Total Male Population of Beaverton?
Total Male Population of Beaverton is 521.
What is the Total Female Population of Beaverton?
Total Female Population of Beaverton is 673.
What is the Ratio of Males per 100 Females in Beaverton?
There are 77.41 Males per 100 Females in Beaverton.
What is the Ratio of Females per 100 Males in Beaverton?
There are 129.17 Females per 100 Males in Beaverton.
What is the Median Population Age in Beaverton?
Median Population Age in Beaverton is 39.6 Years.
What is the Average Family Size in Beaverton
Average Family Size in Beaverton is 3.2 People.
What is the Average Household Size in Beaverton
Average Household Size in Beaverton is 2.3 People.
How Large is the Labor Force in Beaverton?
There are 472 People in the Labor Forcein in Beaverton.
What is the Percentage of People in the Labor Force in Beaverton?
49.5% of People are in the Labor Force in Beaverton.
What is the Unemployment Rate in Beaverton?
Unemployment Rate in Beaverton is 7.4%.