Dimondale, MI Map & Demographics
Dimondale Map
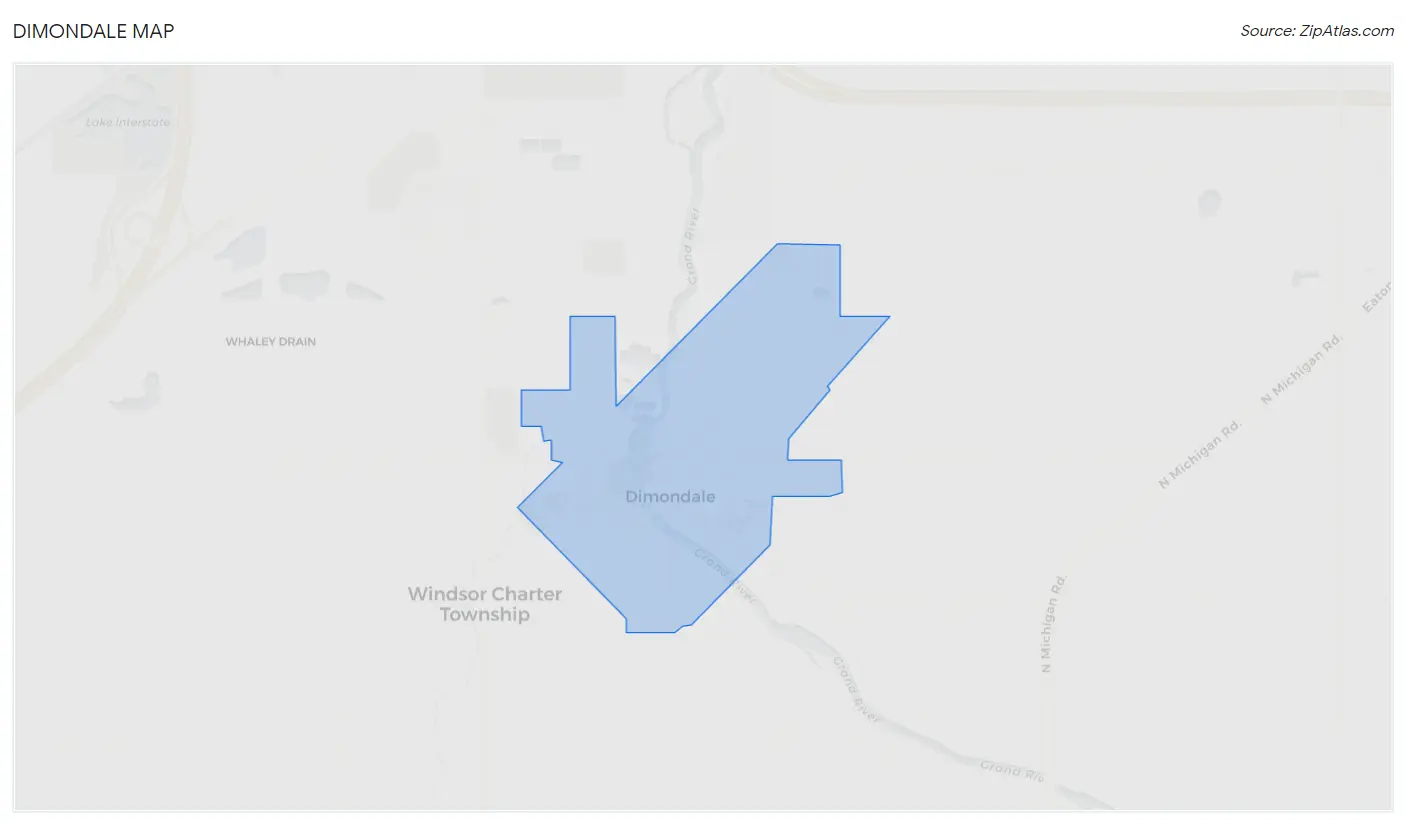
Dimondale Overview
$44,467
PER CAPITA INCOME
$124,688
AVG FAMILY INCOME
$112,500
AVG HOUSEHOLD INCOME
30.5%
WAGE / INCOME GAP [ % ]
69.5¢/ $1
WAGE / INCOME GAP [ $ ]
0.35
INEQUALITY / GINI INDEX
1,619
TOTAL POPULATION
704
MALE POPULATION
915
FEMALE POPULATION
76.94
MALES / 100 FEMALES
129.97
FEMALES / 100 MALES
42.3
MEDIAN AGE
3.2
AVG FAMILY SIZE
2.8
AVG HOUSEHOLD SIZE
846
LABOR FORCE [ PEOPLE ]
64.3%
PERCENT IN LABOR FORCE
2.0%
UNEMPLOYMENT RATE
Dimondale Zip Codes
Dimondale Area Codes
Income in Dimondale
Income Overview in Dimondale
Per Capita Income in Dimondale is $44,467, while median incomes of families and households are $124,688 and $112,500 respectively.
| Characteristic | Number | Measure |
| Per Capita Income | 1,619 | $44,467 |
| Median Family Income | 441 | $124,688 |
| Mean Family Income | 441 | $135,646 |
| Median Household Income | 580 | $112,500 |
| Mean Household Income | 580 | $122,296 |
| Income Deficit | 441 | $0 |
| Wage / Income Gap (%) | 1,619 | 30.47% |
| Wage / Income Gap ($) | 1,619 | 69.53¢ per $1 |
| Gini / Inequality Index | 1,619 | 0.35 |
Earnings by Sex in Dimondale
Average Earnings in Dimondale are $55,758, $63,472 for men and $44,132 for women, a difference of 30.5%.
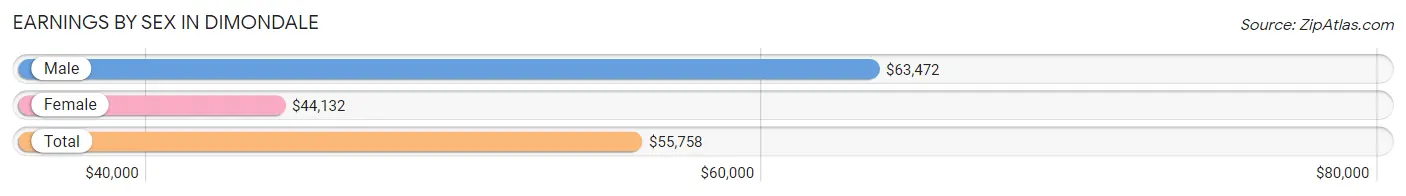
| Sex | Number | Average Earnings |
| Male | 399 (45.0%) | $63,472 |
| Female | 487 (55.0%) | $44,132 |
| Total | 886 (100.0%) | $55,758 |
Earnings by Sex by Income Bracket in Dimondale
The most common earnings brackets in Dimondale are $100,000+ for men (107 | 26.8%) and $100,000+ for women (55 | 11.3%).
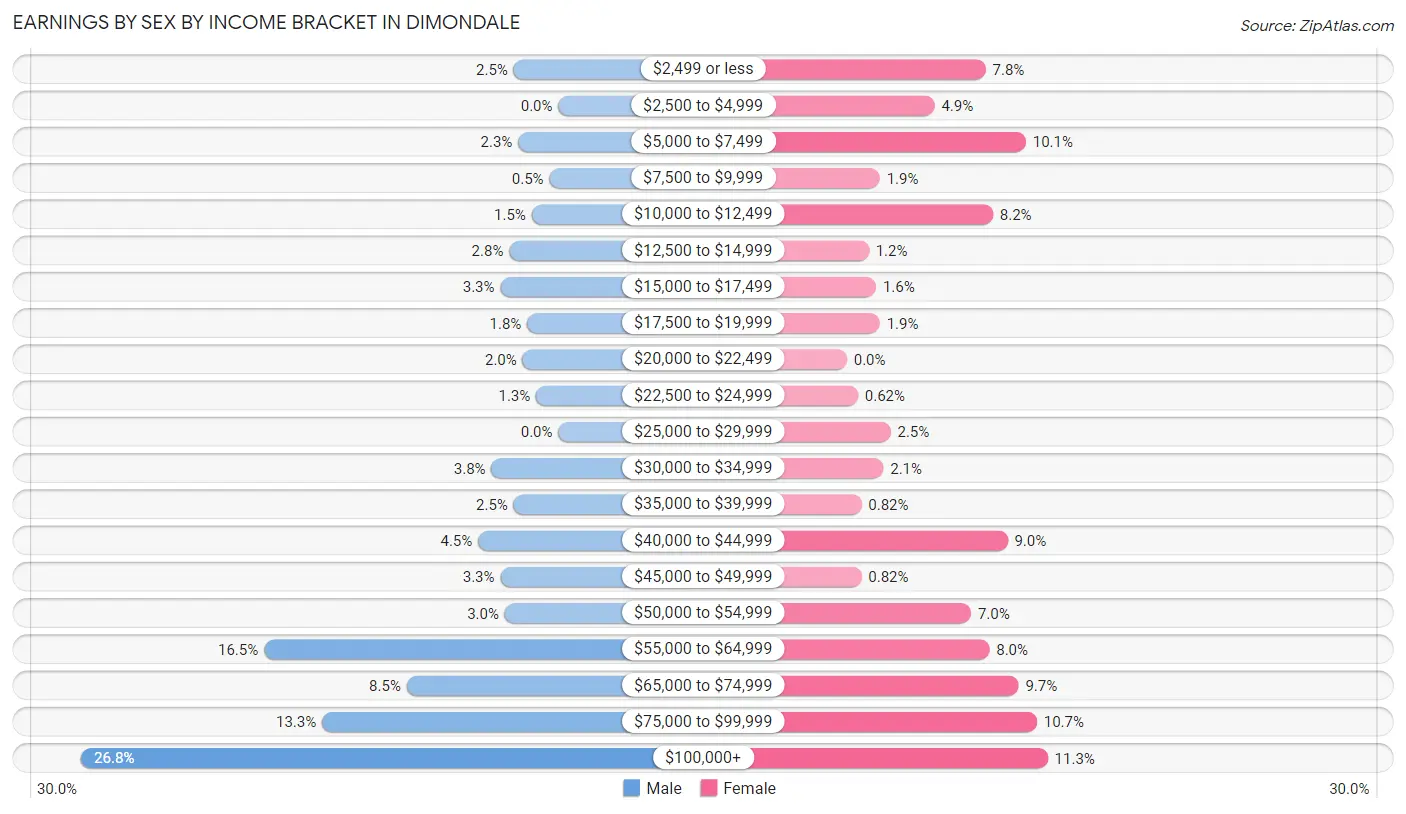
| Income | Male | Female |
| $2,499 or less | 10 (2.5%) | 38 (7.8%) |
| $2,500 to $4,999 | 0 (0.0%) | 24 (4.9%) |
| $5,000 to $7,499 | 9 (2.3%) | 49 (10.1%) |
| $7,500 to $9,999 | 2 (0.5%) | 9 (1.8%) |
| $10,000 to $12,499 | 6 (1.5%) | 40 (8.2%) |
| $12,500 to $14,999 | 11 (2.8%) | 6 (1.2%) |
| $15,000 to $17,499 | 13 (3.3%) | 8 (1.6%) |
| $17,500 to $19,999 | 7 (1.8%) | 9 (1.8%) |
| $20,000 to $22,499 | 8 (2.0%) | 0 (0.0%) |
| $22,500 to $24,999 | 5 (1.3%) | 3 (0.6%) |
| $25,000 to $29,999 | 0 (0.0%) | 12 (2.5%) |
| $30,000 to $34,999 | 15 (3.8%) | 10 (2.1%) |
| $35,000 to $39,999 | 10 (2.5%) | 4 (0.8%) |
| $40,000 to $44,999 | 18 (4.5%) | 44 (9.0%) |
| $45,000 to $49,999 | 13 (3.3%) | 4 (0.8%) |
| $50,000 to $54,999 | 12 (3.0%) | 34 (7.0%) |
| $55,000 to $64,999 | 66 (16.5%) | 39 (8.0%) |
| $65,000 to $74,999 | 34 (8.5%) | 47 (9.7%) |
| $75,000 to $99,999 | 53 (13.3%) | 52 (10.7%) |
| $100,000+ | 107 (26.8%) | 55 (11.3%) |
| Total | 399 (100.0%) | 487 (100.0%) |
Earnings by Sex by Educational Attainment in Dimondale
Average earnings in Dimondale are $64,861 for men and $54,152 for women, a difference of 16.5%. Men with an educational attainment of less than high school enjoy the highest average annual earnings of $131,012, while those with high school diploma education earn the least with $44,063. Women with an educational attainment of graduate degree earn the most with the average annual earnings of $71,667, while those with college or associate's degree education have the smallest earnings of $43,036.
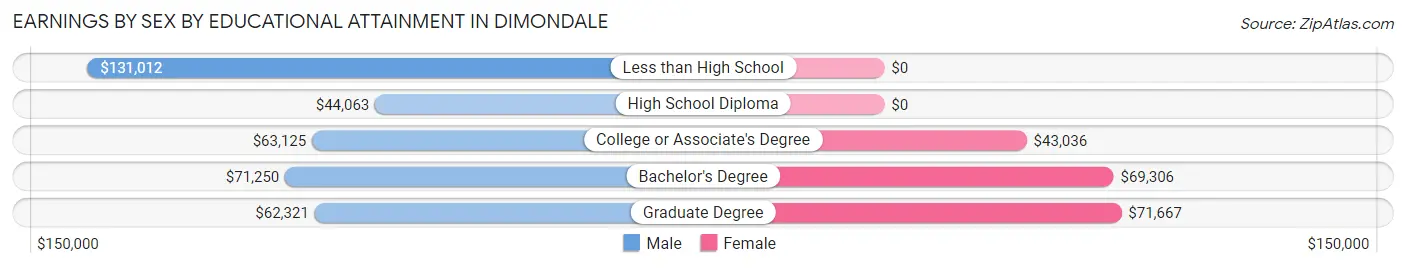
| Educational Attainment | Male Income | Female Income |
| Less than High School | $131,012 | $0 |
| High School Diploma | $44,063 | $0 |
| College or Associate's Degree | $63,125 | $43,036 |
| Bachelor's Degree | $71,250 | $69,306 |
| Graduate Degree | $62,321 | $71,667 |
| Total | $64,861 | $54,152 |
Family Income in Dimondale
Family Income Brackets in Dimondale
According to the Dimondale family income data, there are 116 families falling into the $150,000 to $199,999 income range, which is the most common income bracket and makes up 26.3% of all families.
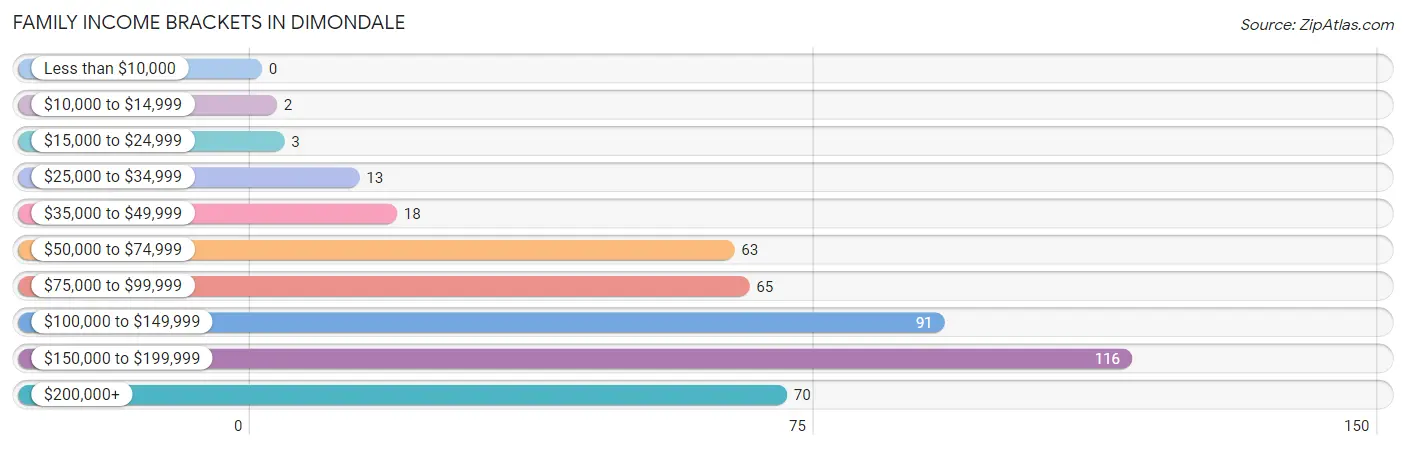
| Income Bracket | # Families | % Families |
| Less than $10,000 | 0 | 0.0% |
| $10,000 to $14,999 | 2 | 0.5% |
| $15,000 to $24,999 | 3 | 0.7% |
| $25,000 to $34,999 | 13 | 2.9% |
| $35,000 to $49,999 | 18 | 4.1% |
| $50,000 to $74,999 | 63 | 14.3% |
| $75,000 to $99,999 | 65 | 14.7% |
| $100,000 to $149,999 | 91 | 20.6% |
| $150,000 to $199,999 | 116 | 26.3% |
| $200,000+ | 70 | 15.9% |
Family Income by Famaliy Size in Dimondale
3-person families (73 | 16.6%) account for the highest median family income in Dimondale with $220,268 per family, while 3-person families (73 | 16.6%) have the highest median income of $73,423 per family member.
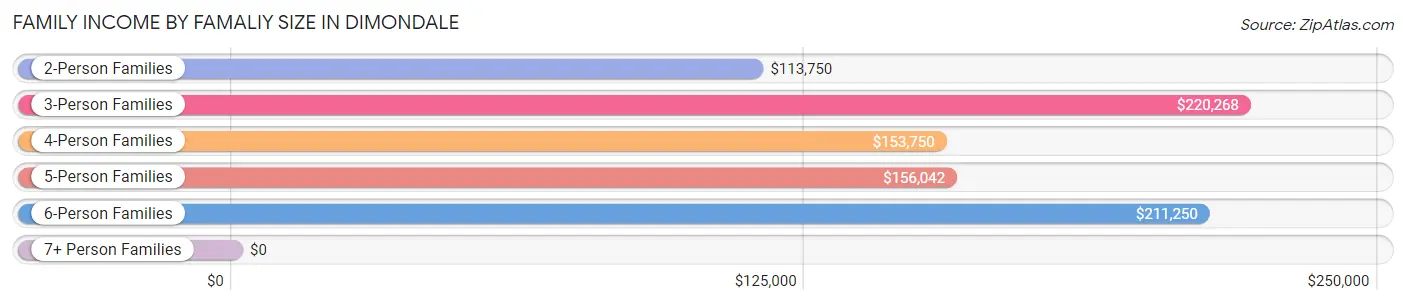
| Income Bracket | # Families | Median Income |
| 2-Person Families | 235 (53.3%) | $113,750 |
| 3-Person Families | 73 (16.6%) | $220,268 |
| 4-Person Families | 76 (17.2%) | $153,750 |
| 5-Person Families | 38 (8.6%) | $156,042 |
| 6-Person Families | 10 (2.3%) | $211,250 |
| 7+ Person Families | 9 (2.0%) | $0 |
| Total | 441 (100.0%) | $124,688 |
Family Income by Number of Earners in Dimondale
The median family income in Dimondale is $124,688, with families comprising 3+ earners (69) having the highest median family income of $164,792, while families with 1 earner (104) have the lowest median family income of $97,045, accounting for 15.7% and 23.6% of families, respectively.
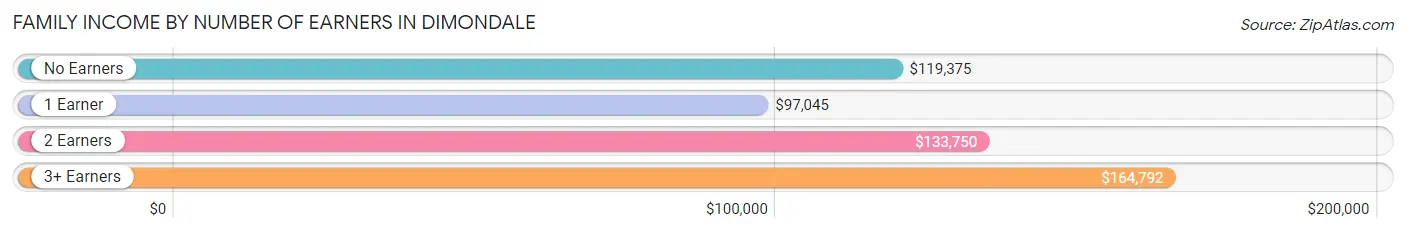
| Number of Earners | # Families | Median Income |
| No Earners | 81 (18.4%) | $119,375 |
| 1 Earner | 104 (23.6%) | $97,045 |
| 2 Earners | 187 (42.4%) | $133,750 |
| 3+ Earners | 69 (15.7%) | $164,792 |
| Total | 441 (100.0%) | $124,688 |
Household Income in Dimondale
Household Income Brackets in Dimondale
With 119 households falling in the category, the $150,000 to $199,999 income range is the most frequent in Dimondale, accounting for 20.5% of all households. In contrast, only 2 households (0.3%) fall into the $10,000 to $14,999 income bracket, making it the least populous group.
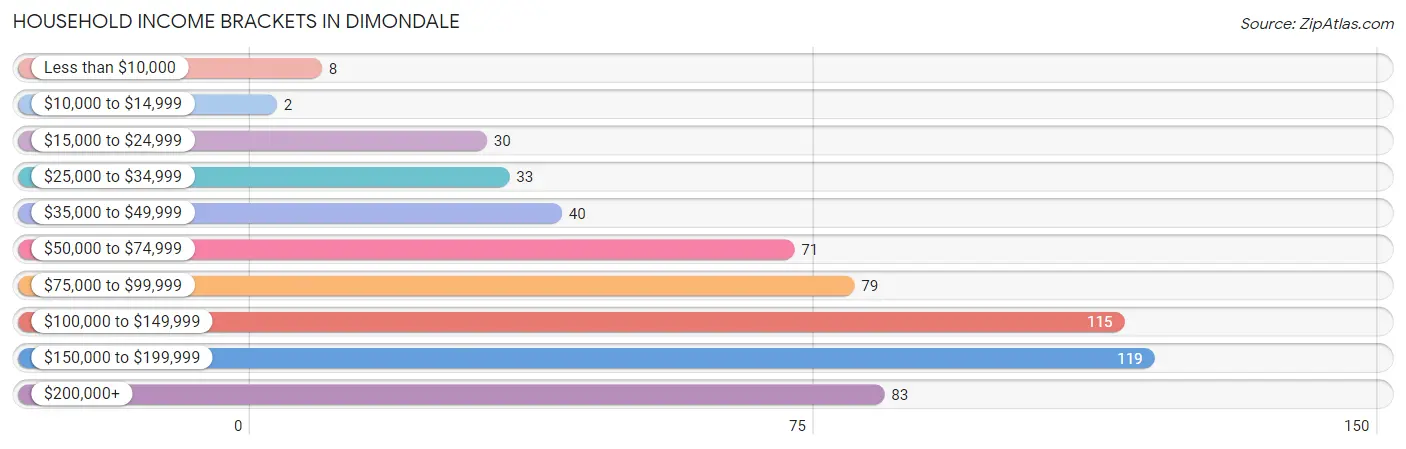
| Income Bracket | # Households | % Households |
| Less than $10,000 | 8 | 1.4% |
| $10,000 to $14,999 | 2 | 0.3% |
| $15,000 to $24,999 | 30 | 5.2% |
| $25,000 to $34,999 | 33 | 5.7% |
| $35,000 to $49,999 | 40 | 6.9% |
| $50,000 to $74,999 | 71 | 12.2% |
| $75,000 to $99,999 | 79 | 13.6% |
| $100,000 to $149,999 | 115 | 19.8% |
| $150,000 to $199,999 | 119 | 20.5% |
| $200,000+ | 83 | 14.3% |
Household Income by Householder Age in Dimondale
The median household income in Dimondale is $112,500, with the highest median household income of $136,250 found in the 25 to 44 years age bracket for the primary householder. A total of 144 households (24.8%) fall into this category. Meanwhile, the 15 to 24 years age bracket for the primary householder has the lowest median household income of $0, with 7 households (1.2%) in this group.
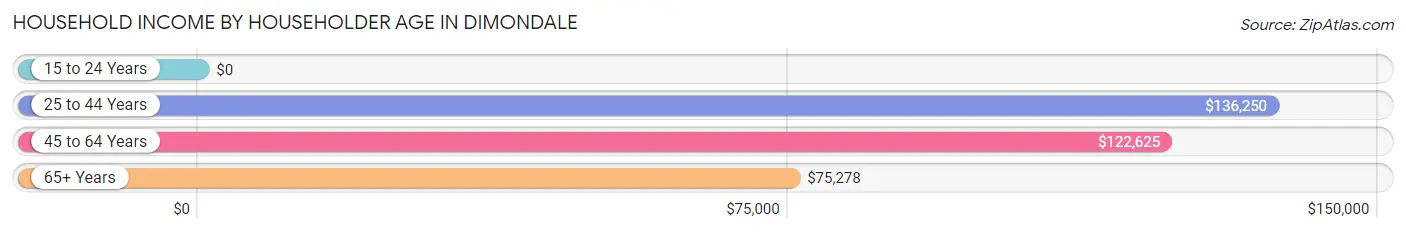
| Income Bracket | # Households | Median Income |
| 15 to 24 Years | 7 (1.2%) | $0 |
| 25 to 44 Years | 144 (24.8%) | $136,250 |
| 45 to 64 Years | 213 (36.7%) | $122,625 |
| 65+ Years | 216 (37.2%) | $75,278 |
| Total | 580 (100.0%) | $112,500 |
Poverty in Dimondale
Income Below Poverty by Sex and Age in Dimondale
With 7.1% poverty level for males and 8.0% for females among the residents of Dimondale, 12 to 14 year old males and 16 and 17 year old females are the most vulnerable to poverty, with 19 males (45.2%) and 21 females (26.6%) in their respective age groups living below the poverty level.
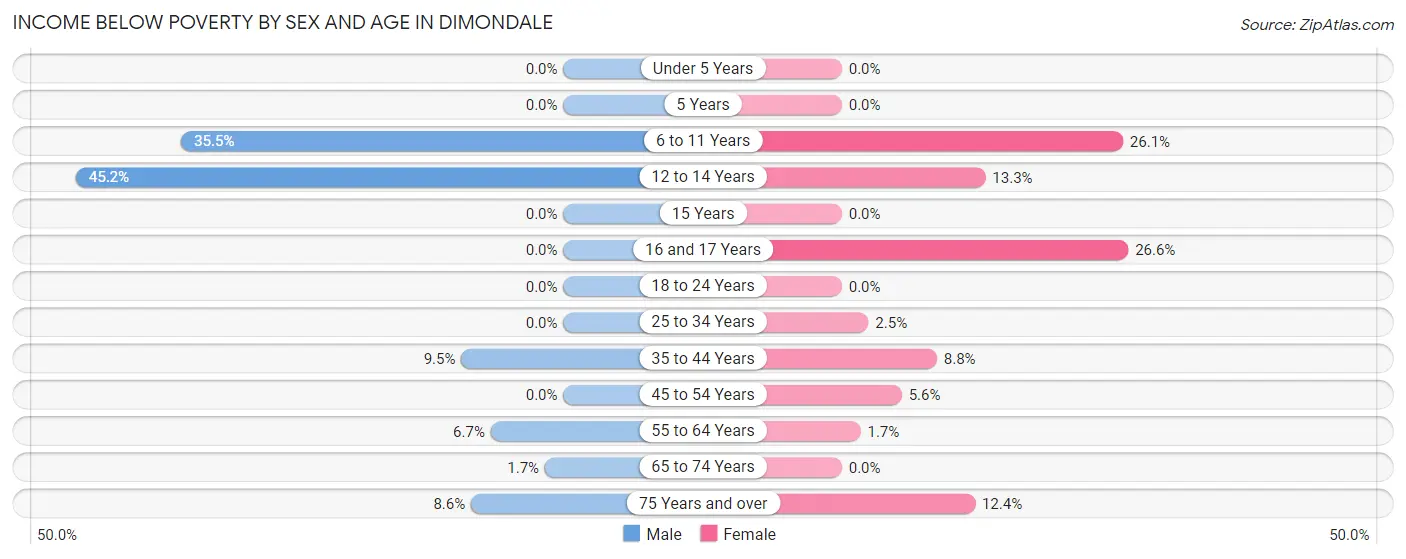
| Age Bracket | Male | Female |
| Under 5 Years | 0 (0.0%) | 0 (0.0%) |
| 5 Years | 0 (0.0%) | 0 (0.0%) |
| 6 to 11 Years | 11 (35.5%) | 12 (26.1%) |
| 12 to 14 Years | 19 (45.2%) | 10 (13.3%) |
| 15 Years | 0 (0.0%) | 0 (0.0%) |
| 16 and 17 Years | 0 (0.0%) | 21 (26.6%) |
| 18 to 24 Years | 0 (0.0%) | 0 (0.0%) |
| 25 to 34 Years | 0 (0.0%) | 2 (2.5%) |
| 35 to 44 Years | 9 (9.5%) | 9 (8.8%) |
| 45 to 54 Years | 0 (0.0%) | 6 (5.6%) |
| 55 to 64 Years | 6 (6.7%) | 2 (1.7%) |
| 65 to 74 Years | 2 (1.7%) | 0 (0.0%) |
| 75 Years and over | 3 (8.6%) | 11 (12.4%) |
| Total | 50 (7.1%) | 73 (8.0%) |
Income Above Poverty by Sex and Age in Dimondale
According to the poverty statistics in Dimondale, males aged under 5 years and females aged under 5 years are the age groups that are most secure financially, with 100.0% of males and 100.0% of females in these age groups living above the poverty line.
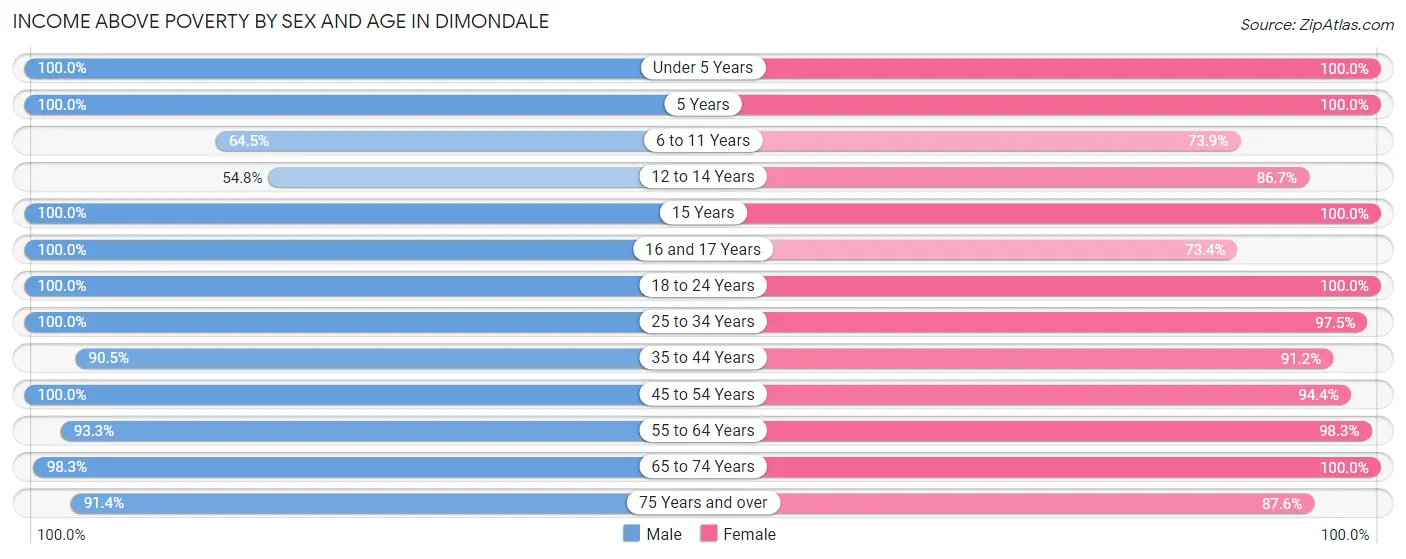
| Age Bracket | Male | Female |
| Under 5 Years | 29 (100.0%) | 22 (100.0%) |
| 5 Years | 19 (100.0%) | 13 (100.0%) |
| 6 to 11 Years | 20 (64.5%) | 34 (73.9%) |
| 12 to 14 Years | 23 (54.8%) | 65 (86.7%) |
| 15 Years | 17 (100.0%) | 10 (100.0%) |
| 16 and 17 Years | 12 (100.0%) | 58 (73.4%) |
| 18 to 24 Years | 40 (100.0%) | 69 (100.0%) |
| 25 to 34 Years | 68 (100.0%) | 79 (97.5%) |
| 35 to 44 Years | 86 (90.5%) | 93 (91.2%) |
| 45 to 54 Years | 110 (100.0%) | 102 (94.4%) |
| 55 to 64 Years | 83 (93.3%) | 113 (98.3%) |
| 65 to 74 Years | 115 (98.3%) | 106 (100.0%) |
| 75 Years and over | 32 (91.4%) | 78 (87.6%) |
| Total | 654 (92.9%) | 842 (92.0%) |
Income Below Poverty Among Married-Couple Families in Dimondale
The poverty statistics for married-couple families in Dimondale show that 3.3% or 12 of the total 367 families live below the poverty line. Families with 5 or more children have the highest poverty rate of 100.0%, comprising of 9 families. On the other hand, families with 1 or 2 children have the lowest poverty rate of 0.0%, which includes 0 families.
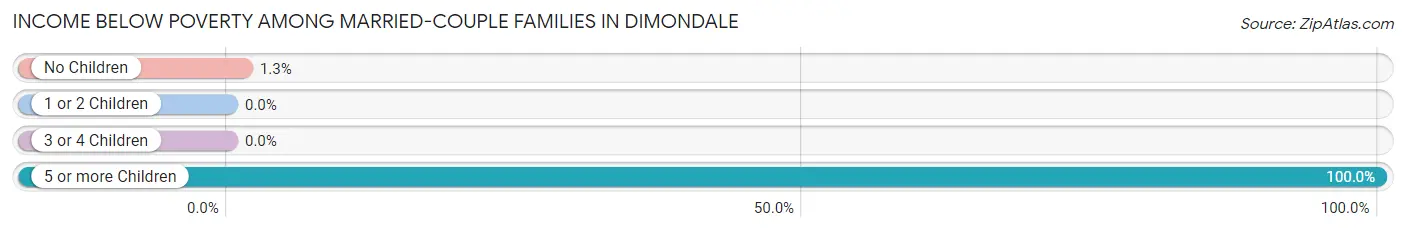
| Children | Above Poverty | Below Poverty |
| No Children | 227 (98.7%) | 3 (1.3%) |
| 1 or 2 Children | 99 (100.0%) | 0 (0.0%) |
| 3 or 4 Children | 29 (100.0%) | 0 (0.0%) |
| 5 or more Children | 0 (0.0%) | 9 (100.0%) |
| Total | 355 (96.7%) | 12 (3.3%) |
Income Below Poverty Among Single-Parent Households in Dimondale
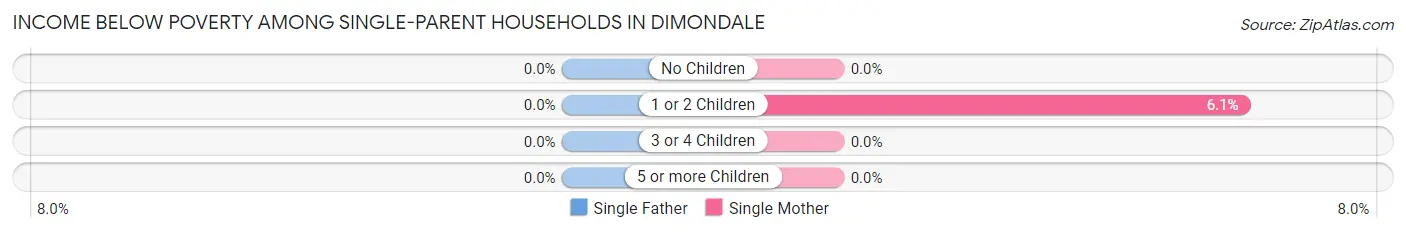
| Children | Single Father | Single Mother |
| No Children | 0 (0.0%) | 0 (0.0%) |
| 1 or 2 Children | 0 (0.0%) | 2 (6.1%) |
| 3 or 4 Children | 0 (0.0%) | 0 (0.0%) |
| 5 or more Children | 0 (0.0%) | 0 (0.0%) |
| Total | 0 (0.0%) | 2 (3.5%) |
Income Below Poverty Among Married-Couple vs Single-Parent Households in Dimondale
The poverty data for Dimondale shows that 12 of the married-couple family households (3.3%) and 2 of the single-parent households (2.7%) are living below the poverty level. Within the married-couple family households, those with 5 or more children have the highest poverty rate, with 9 households (100.0%) falling below the poverty line. Among the single-parent households, those with 1 or 2 children have the highest poverty rate, with 2 household (5.4%) living below poverty.
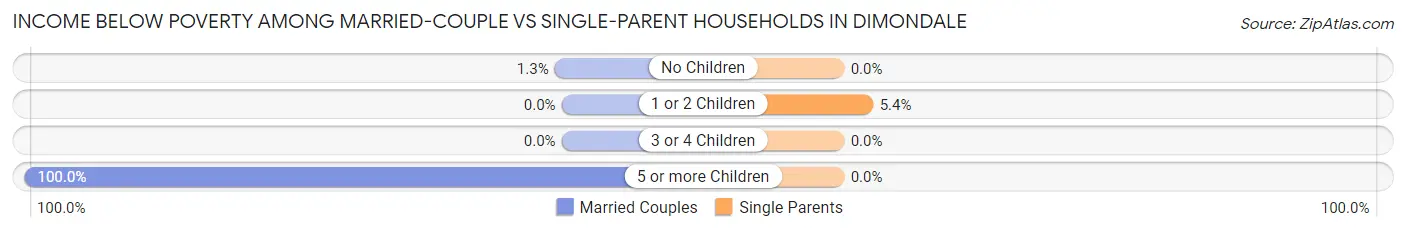
| Children | Married-Couple Families | Single-Parent Households |
| No Children | 3 (1.3%) | 0 (0.0%) |
| 1 or 2 Children | 0 (0.0%) | 2 (5.4%) |
| 3 or 4 Children | 0 (0.0%) | 0 (0.0%) |
| 5 or more Children | 9 (100.0%) | 0 (0.0%) |
| Total | 12 (3.3%) | 2 (2.7%) |
Race in Dimondale
The most populous races in Dimondale are White / Caucasian (1,494 | 92.3%), Hispanic or Latino (89 | 5.5%), and Two or more Races (73 | 4.5%).
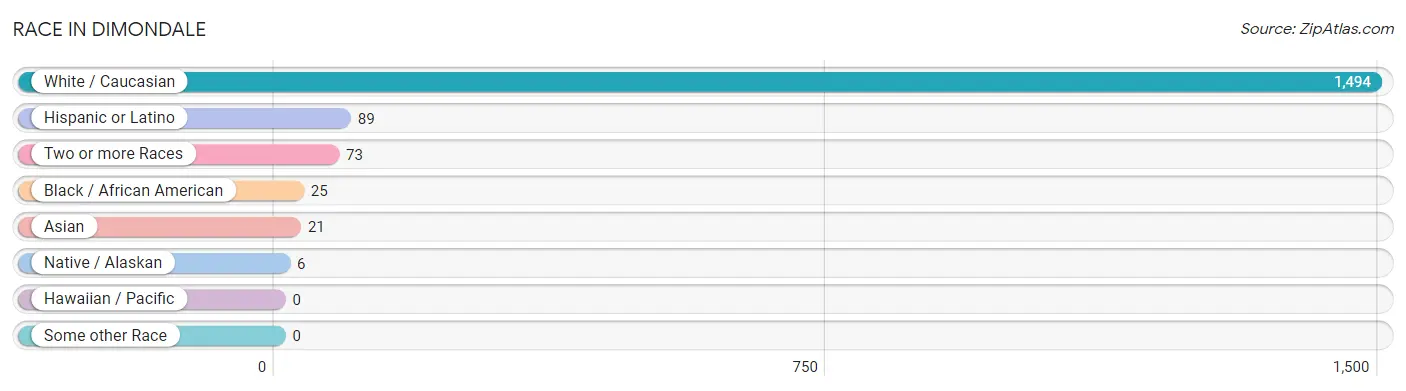
| Race | # Population | % Population |
| Asian | 21 | 1.3% |
| Black / African American | 25 | 1.5% |
| Hawaiian / Pacific | 0 | 0.0% |
| Hispanic or Latino | 89 | 5.5% |
| Native / Alaskan | 6 | 0.4% |
| White / Caucasian | 1,494 | 92.3% |
| Two or more Races | 73 | 4.5% |
| Some other Race | 0 | 0.0% |
| Total | 1,619 | 100.0% |
Ancestry in Dimondale
The most populous ancestries reported in Dimondale are German (384 | 23.7%), English (314 | 19.4%), Irish (236 | 14.6%), Polish (140 | 8.6%), and French (87 | 5.4%), together accounting for 71.7% of all Dimondale residents.
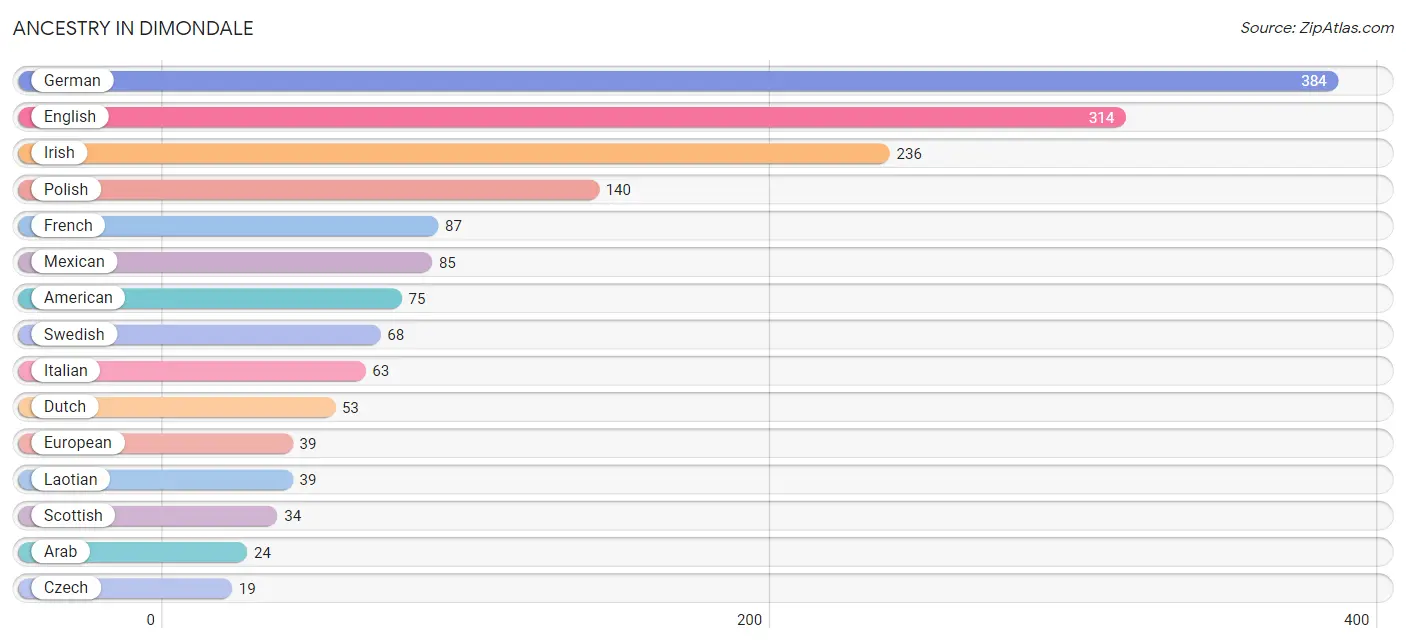
| Ancestry | # Population | % Population |
| American | 75 | 4.6% |
| Arab | 24 | 1.5% |
| British | 16 | 1.0% |
| Burmese | 3 | 0.2% |
| Cajun | 6 | 0.4% |
| Canadian | 5 | 0.3% |
| Chippewa | 2 | 0.1% |
| Czech | 19 | 1.2% |
| Danish | 10 | 0.6% |
| Dutch | 53 | 3.3% |
| Eastern European | 6 | 0.4% |
| English | 314 | 19.4% |
| European | 39 | 2.4% |
| Finnish | 11 | 0.7% |
| French | 87 | 5.4% |
| German | 384 | 23.7% |
| Irish | 236 | 14.6% |
| Italian | 63 | 3.9% |
| Korean | 6 | 0.4% |
| Laotian | 39 | 2.4% |
| Lithuanian | 3 | 0.2% |
| Mexican | 85 | 5.2% |
| Northern European | 17 | 1.1% |
| Norwegian | 15 | 0.9% |
| Ottawa | 4 | 0.3% |
| Polish | 140 | 8.6% |
| Scandinavian | 7 | 0.4% |
| Scotch-Irish | 7 | 0.4% |
| Scottish | 34 | 2.1% |
| Slavic | 3 | 0.2% |
| Slovak | 15 | 0.9% |
| Spanish | 4 | 0.3% |
| Swedish | 68 | 4.2% |
| Welsh | 2 | 0.1% | View All 34 Rows |
Immigrants in Dimondale
The most numerous immigrant groups reported in Dimondale came from Asia (21 | 1.3%), South Eastern Asia (18 | 1.1%), Indonesia (12 | 0.7%), Philippines (6 | 0.4%), and Eastern Asia (3 | 0.2%), together accounting for 3.7% of all Dimondale residents.
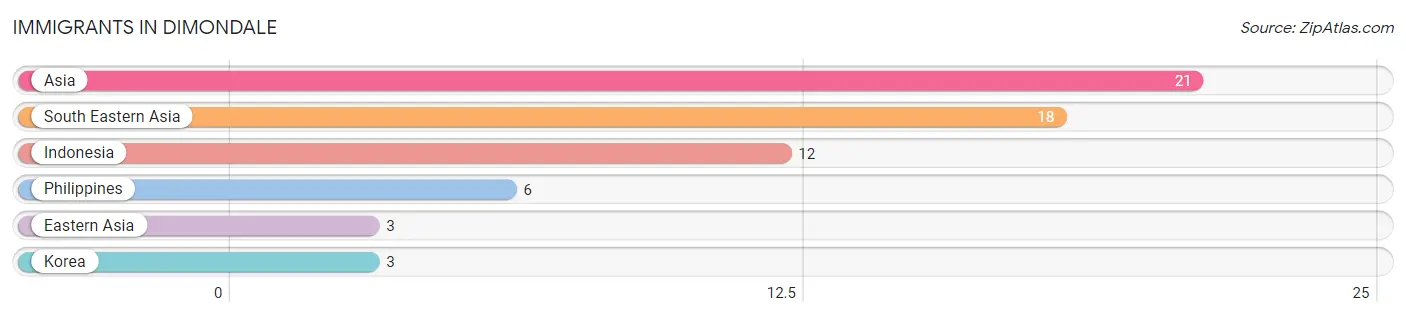
| Immigration Origin | # Population | % Population |
| Asia | 21 | 1.3% |
| Eastern Asia | 3 | 0.2% |
| Indonesia | 12 | 0.7% |
| Korea | 3 | 0.2% |
| Philippines | 6 | 0.4% |
| South Eastern Asia | 18 | 1.1% | View All 6 Rows |
Sex and Age in Dimondale
Sex and Age in Dimondale
The most populous age groups in Dimondale are 70 to 74 Years (63 | 8.9%) for men and 15 to 19 Years (108 | 11.8%) for women.
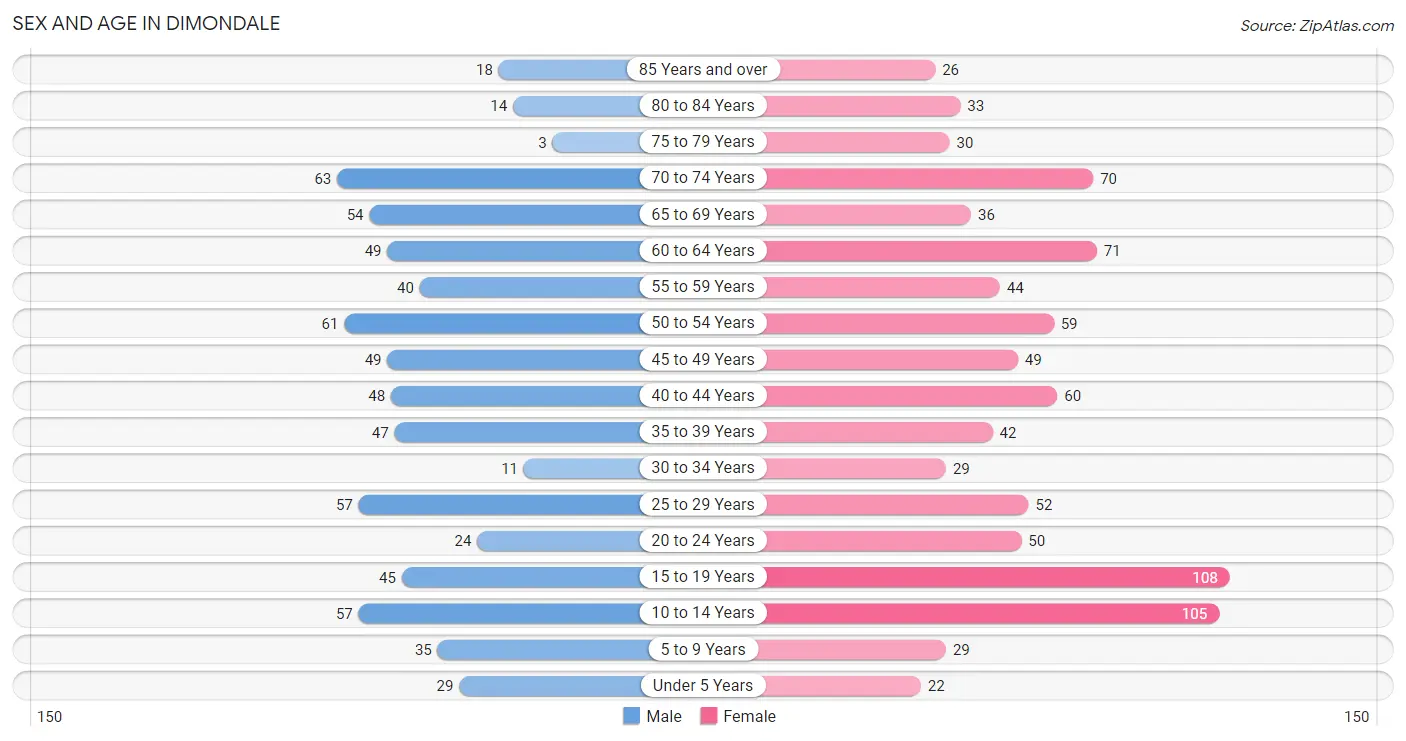
| Age Bracket | Male | Female |
| Under 5 Years | 29 (4.1%) | 22 (2.4%) |
| 5 to 9 Years | 35 (5.0%) | 29 (3.2%) |
| 10 to 14 Years | 57 (8.1%) | 105 (11.5%) |
| 15 to 19 Years | 45 (6.4%) | 108 (11.8%) |
| 20 to 24 Years | 24 (3.4%) | 50 (5.5%) |
| 25 to 29 Years | 57 (8.1%) | 52 (5.7%) |
| 30 to 34 Years | 11 (1.6%) | 29 (3.2%) |
| 35 to 39 Years | 47 (6.7%) | 42 (4.6%) |
| 40 to 44 Years | 48 (6.8%) | 60 (6.6%) |
| 45 to 49 Years | 49 (7.0%) | 49 (5.4%) |
| 50 to 54 Years | 61 (8.7%) | 59 (6.5%) |
| 55 to 59 Years | 40 (5.7%) | 44 (4.8%) |
| 60 to 64 Years | 49 (7.0%) | 71 (7.8%) |
| 65 to 69 Years | 54 (7.7%) | 36 (3.9%) |
| 70 to 74 Years | 63 (8.9%) | 70 (7.6%) |
| 75 to 79 Years | 3 (0.4%) | 30 (3.3%) |
| 80 to 84 Years | 14 (2.0%) | 33 (3.6%) |
| 85 Years and over | 18 (2.6%) | 26 (2.8%) |
| Total | 704 (100.0%) | 915 (100.0%) |
Families and Households in Dimondale
Median Family Size in Dimondale
The median family size in Dimondale is 3.20 persons per family, with single female/mother families (57 | 12.9%) accounting for the largest median family size of 3.39 persons per family. On the other hand, single male/father families (17 | 3.8%) represent the smallest median family size with 2.18 persons per family.
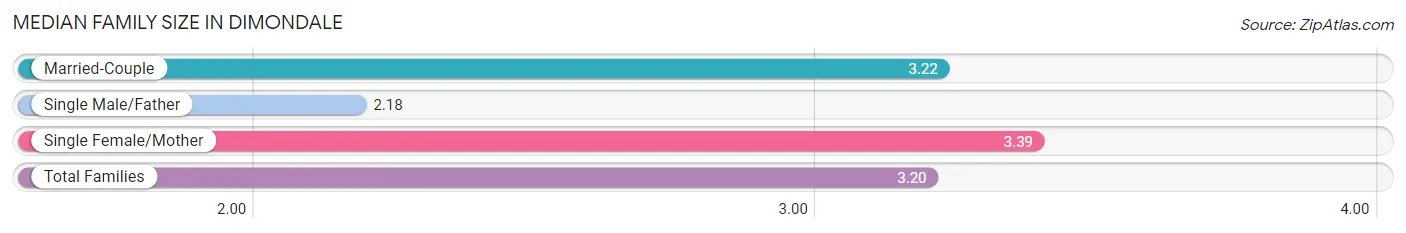
| Family Type | # Families | Family Size |
| Married-Couple | 367 (83.2%) | 3.22 |
| Single Male/Father | 17 (3.8%) | 2.18 |
| Single Female/Mother | 57 (12.9%) | 3.39 |
| Total Families | 441 (100.0%) | 3.20 |
Median Household Size in Dimondale
The median household size in Dimondale is 2.77 persons per household, with single female/mother households (57 | 9.8%) accounting for the largest median household size of 3.63 persons per household. non-family households (139 | 24.0%) represent the smallest median household size with 1.22 persons per household.
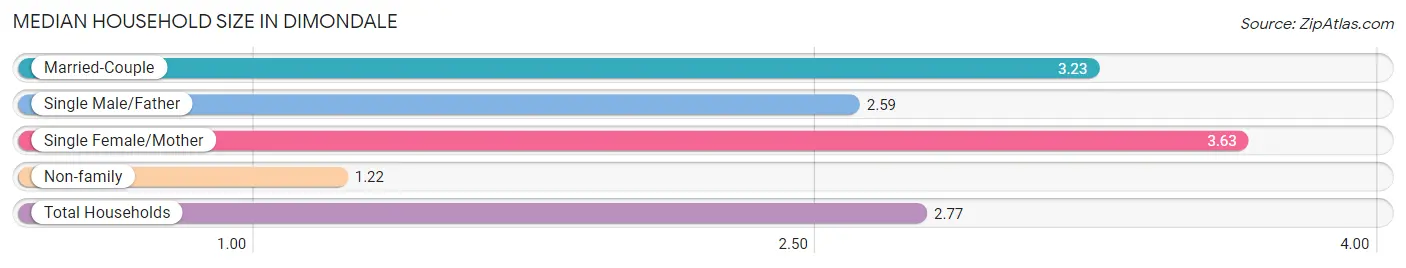
| Household Type | # Households | Household Size |
| Married-Couple | 367 (63.3%) | 3.23 |
| Single Male/Father | 17 (2.9%) | 2.59 |
| Single Female/Mother | 57 (9.8%) | 3.63 |
| Non-family | 139 (24.0%) | 1.22 |
| Total Households | 580 (100.0%) | 2.77 |
Household Size by Marriage Status in Dimondale
Out of a total of 580 households in Dimondale, 441 (76.0%) are family households, while 139 (24.0%) are nonfamily households. The most numerous type of family households are 2-person households, comprising 214, and the most common type of nonfamily households are 1-person households, comprising 116.
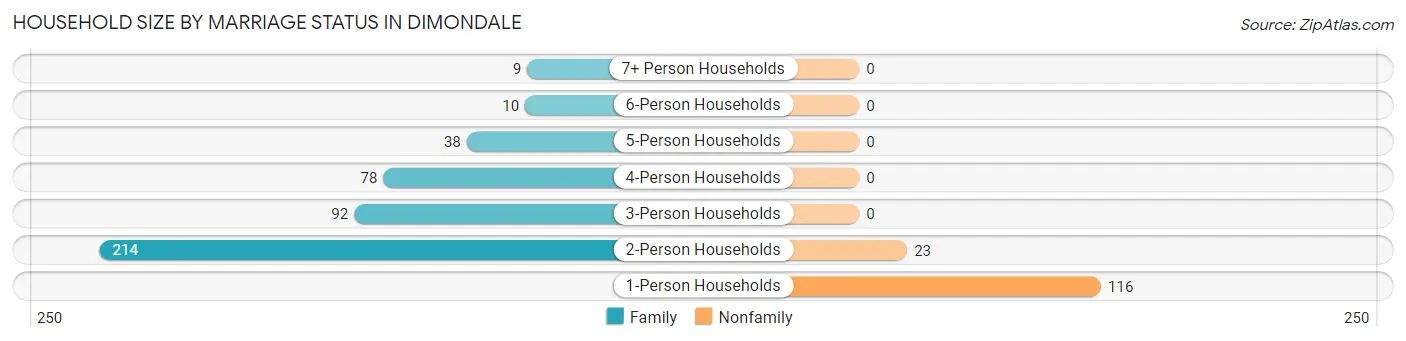
| Household Size | Family Households | Nonfamily Households |
| 1-Person Households | - | 116 (20.0%) |
| 2-Person Households | 214 (36.9%) | 23 (4.0%) |
| 3-Person Households | 92 (15.9%) | 0 (0.0%) |
| 4-Person Households | 78 (13.5%) | 0 (0.0%) |
| 5-Person Households | 38 (6.6%) | 0 (0.0%) |
| 6-Person Households | 10 (1.7%) | 0 (0.0%) |
| 7+ Person Households | 9 (1.5%) | 0 (0.0%) |
| Total | 441 (76.0%) | 139 (24.0%) |
Female Fertility in Dimondale
Fertility by Age in Dimondale
| Age Bracket | Women with Births | Births / 1,000 Women |
| 15 to 19 years | 0 (0.0%) | 0.0 |
| 20 to 34 years | 0 (0.0%) | 0.0 |
| 35 to 50 years | 0 (0.0%) | 0.0 |
| Total | 0 (0.0%) | 0.0 |
Fertility by Age by Marriage Status in Dimondale
| Age Bracket | Married | Unmarried |
| 15 to 19 years | 0 (0.0%) | 0 (0.0%) |
| 20 to 34 years | 0 (0.0%) | 0 (0.0%) |
| 35 to 50 years | 0 (0.0%) | 0 (0.0%) |
| Total | 0 (0.0%) | 0 (0.0%) |
Fertility by Education in Dimondale
| Educational Attainment | Women with Births | Births / 1,000 Women |
| Less than High School | 0 (0.0%) | 0.0 |
| High School Diploma | 0 (0.0%) | 0.0 |
| College or Associate's Degree | 0 (0.0%) | 0.0 |
| Bachelor's Degree | 0 (0.0%) | 0.0 |
| Graduate Degree | 0 (0.0%) | 0.0 |
| Total | 0 (0.0%) | 0.0 |
Fertility by Education by Marriage Status in Dimondale
| Educational Attainment | Married | Unmarried |
| Less than High School | 0 (0.0%) | 0 (0.0%) |
| High School Diploma | 0 (0.0%) | 0 (0.0%) |
| College or Associate's Degree | 0 (0.0%) | 0 (0.0%) |
| Bachelor's Degree | 0 (0.0%) | 0 (0.0%) |
| Graduate Degree | 0 (0.0%) | 0 (0.0%) |
| Total | 0 (0.0%) | 0 (0.0%) |
Employment Characteristics in Dimondale
Employment by Class of Employer in Dimondale
Among the 826 employed individuals in Dimondale, private company employees (418 | 50.6%), state government employees (164 | 19.9%), and not-for-profit organizations (150 | 18.2%) make up the most common classes of employment.
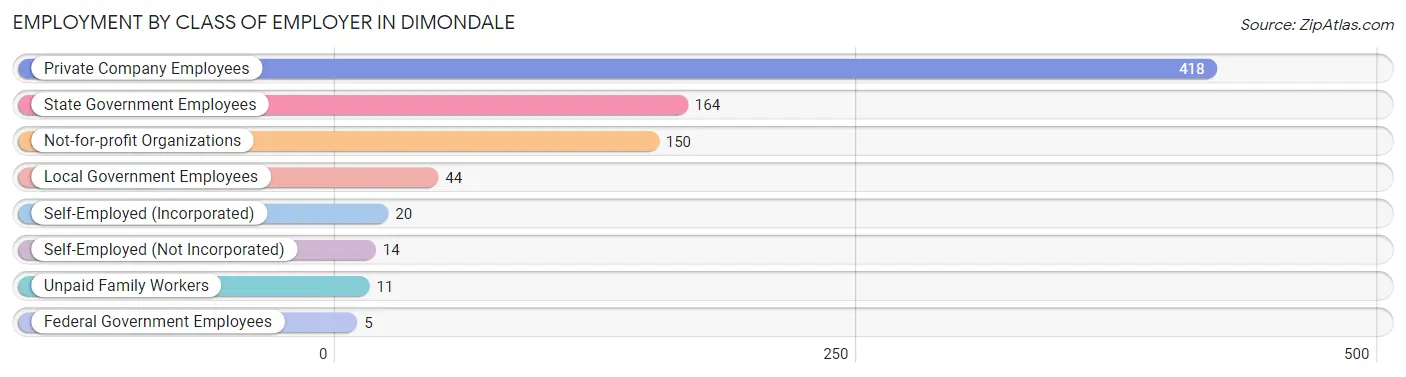
| Employer Class | # Employees | % Employees |
| Private Company Employees | 418 | 50.6% |
| Self-Employed (Incorporated) | 20 | 2.4% |
| Self-Employed (Not Incorporated) | 14 | 1.7% |
| Not-for-profit Organizations | 150 | 18.2% |
| Local Government Employees | 44 | 5.3% |
| State Government Employees | 164 | 19.9% |
| Federal Government Employees | 5 | 0.6% |
| Unpaid Family Workers | 11 | 1.3% |
| Total | 826 | 100.0% |
Employment Status by Age in Dimondale
According to the labor force statistics for Dimondale, out of the total population over 16 years of age (1,315), 64.3% or 846 individuals are in the labor force, with 2.0% or 17 of them unemployed. The age group with the highest labor force participation rate is 25 to 29 years, with 100.0% or 109 individuals in the labor force. Within the labor force, the 35 to 44 years age range has the highest percentage of unemployed individuals, with 7.4% or 13 of them being unemployed.
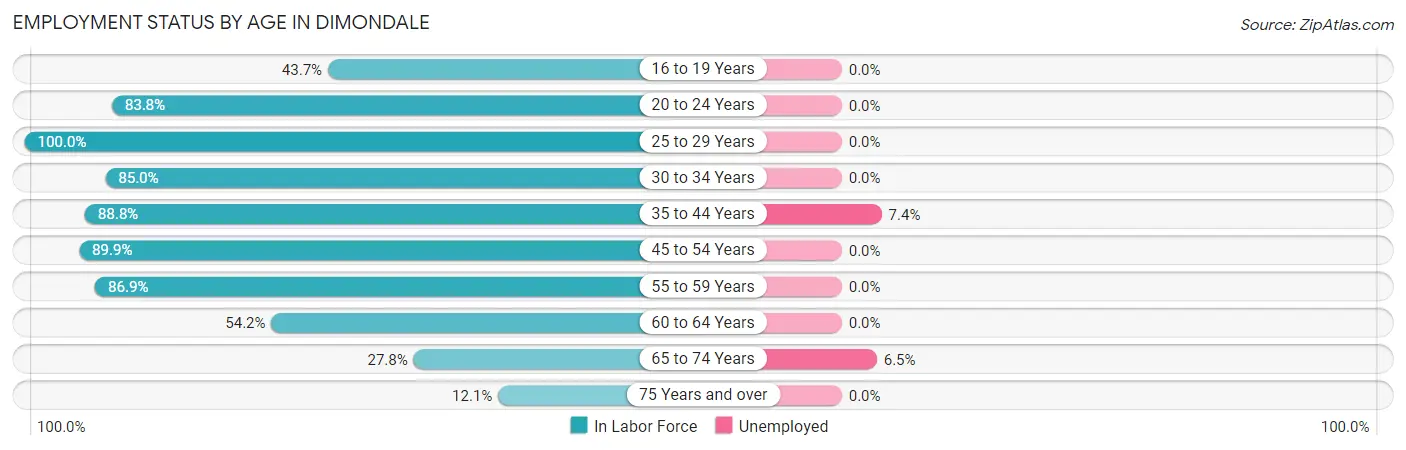
| Age Bracket | In Labor Force | Unemployed |
| 16 to 19 Years | 55 (43.7%) | 0 (0.0%) |
| 20 to 24 Years | 62 (83.8%) | 0 (0.0%) |
| 25 to 29 Years | 109 (100.0%) | 0 (0.0%) |
| 30 to 34 Years | 34 (85.0%) | 0 (0.0%) |
| 35 to 44 Years | 175 (88.8%) | 13 (7.4%) |
| 45 to 54 Years | 196 (89.9%) | 0 (0.0%) |
| 55 to 59 Years | 73 (86.9%) | 0 (0.0%) |
| 60 to 64 Years | 65 (54.2%) | 0 (0.0%) |
| 65 to 74 Years | 62 (27.8%) | 4 (6.5%) |
| 75 Years and over | 15 (12.1%) | 0 (0.0%) |
| Total | 846 (64.3%) | 17 (2.0%) |
Employment Status by Educational Attainment in Dimondale
According to labor force statistics for Dimondale, 84.9% of individuals (652) out of the total population between 25 and 64 years of age (768) are in the labor force, with 2.0% or 13 of them being unemployed. The group with the highest labor force participation rate are those with the educational attainment of less than high school, with 90.5% or 38 individuals in the labor force. Within the labor force, individuals with less than high school education have the highest percentage of unemployment, with 34.2% or 13 of them being unemployed.
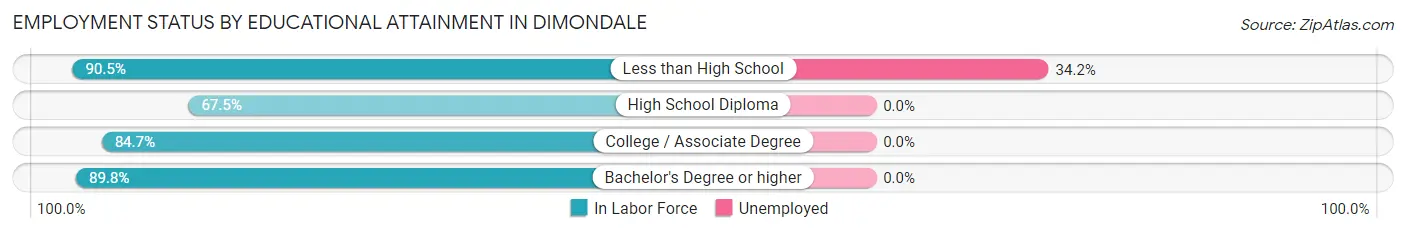
| Educational Attainment | In Labor Force | Unemployed |
| Less than High School | 38 (90.5%) | 14 (34.2%) |
| High School Diploma | 56 (67.5%) | 0 (0.0%) |
| College / Associate Degree | 321 (84.7%) | 0 (0.0%) |
| Bachelor's Degree or higher | 237 (89.8%) | 0 (0.0%) |
| Total | 652 (84.9%) | 15 (2.0%) |
Employment Occupations by Sex in Dimondale
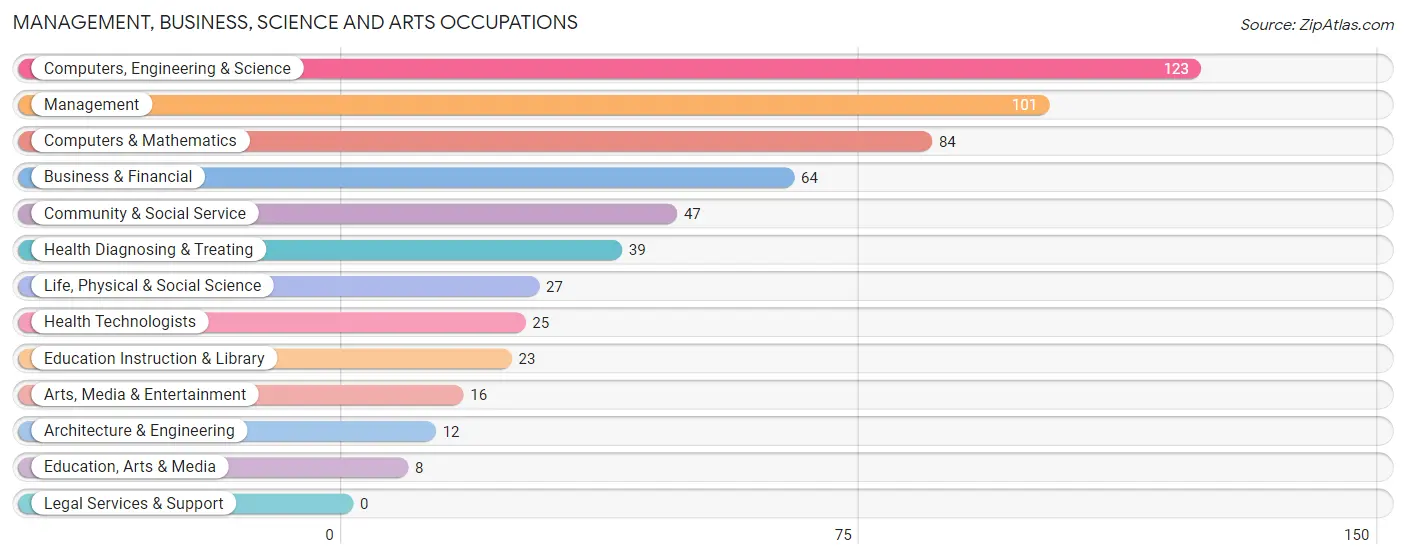
Management, Business, Science and Arts Occupations
The most common Management, Business, Science and Arts occupations in Dimondale are Computers, Engineering & Science (123 | 14.8%), Management (101 | 12.2%), Computers & Mathematics (84 | 10.1%), Business & Financial (64 | 7.7%), and Community & Social Service (47 | 5.7%).
Management, Business, Science and Arts Occupations by Sex
Within the Management, Business, Science and Arts occupations in Dimondale, the most male-oriented occupations are Health Technologists (84.0%), Computers & Mathematics (83.3%), and Architecture & Engineering (83.3%), while the most female-oriented occupations are Business & Financial (85.9%), Education Instruction & Library (73.9%), and Management (73.3%).
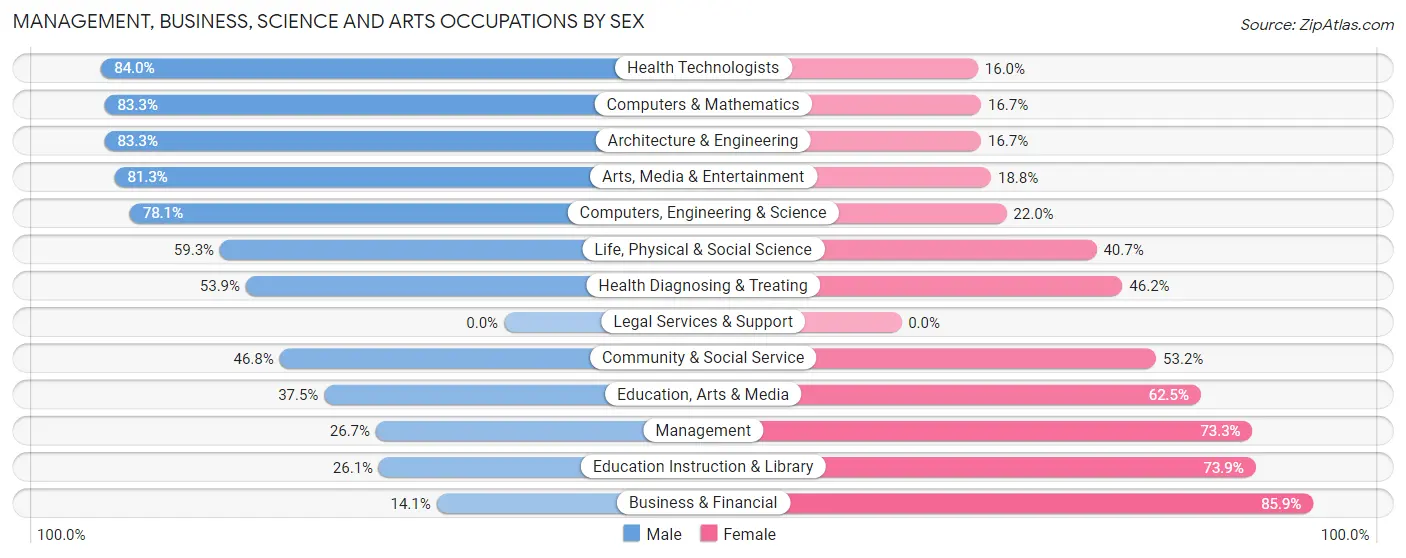
| Occupation | Male | Female |
| Management | 27 (26.7%) | 74 (73.3%) |
| Business & Financial | 9 (14.1%) | 55 (85.9%) |
| Computers, Engineering & Science | 96 (78.0%) | 27 (22.0%) |
| Computers & Mathematics | 70 (83.3%) | 14 (16.7%) |
| Architecture & Engineering | 10 (83.3%) | 2 (16.7%) |
| Life, Physical & Social Science | 16 (59.3%) | 11 (40.7%) |
| Community & Social Service | 22 (46.8%) | 25 (53.2%) |
| Education, Arts & Media | 3 (37.5%) | 5 (62.5%) |
| Legal Services & Support | 0 (0.0%) | 0 (0.0%) |
| Education Instruction & Library | 6 (26.1%) | 17 (73.9%) |
| Arts, Media & Entertainment | 13 (81.2%) | 3 (18.8%) |
| Health Diagnosing & Treating | 21 (53.8%) | 18 (46.2%) |
| Health Technologists | 21 (84.0%) | 4 (16.0%) |
| Total (Category) | 175 (46.8%) | 199 (53.2%) |
| Total (Overall) | 370 (44.6%) | 459 (55.4%) |
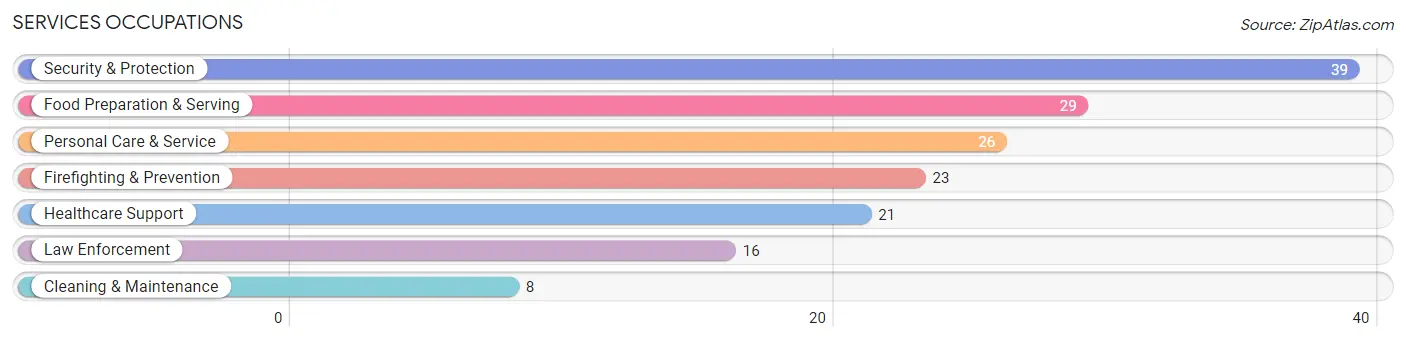
Services Occupations
The most common Services occupations in Dimondale are Security & Protection (39 | 4.7%), Food Preparation & Serving (29 | 3.5%), Personal Care & Service (26 | 3.1%), Firefighting & Prevention (23 | 2.8%), and Healthcare Support (21 | 2.5%).
Services Occupations by Sex
Within the Services occupations in Dimondale, the most male-oriented occupations are Law Enforcement (81.2%), Cleaning & Maintenance (75.0%), and Security & Protection (71.8%), while the most female-oriented occupations are Personal Care & Service (100.0%), Food Preparation & Serving (79.3%), and Healthcare Support (57.1%).
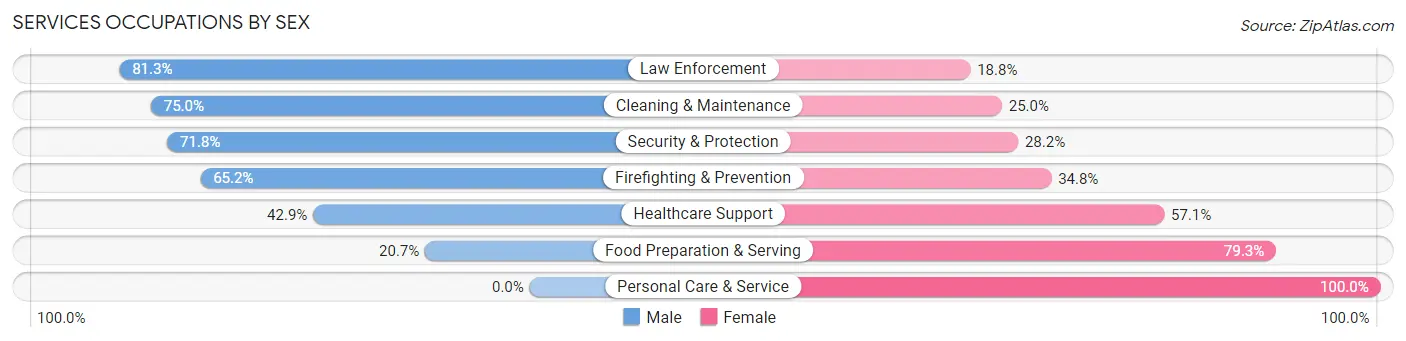
| Occupation | Male | Female |
| Healthcare Support | 9 (42.9%) | 12 (57.1%) |
| Security & Protection | 28 (71.8%) | 11 (28.2%) |
| Firefighting & Prevention | 15 (65.2%) | 8 (34.8%) |
| Law Enforcement | 13 (81.2%) | 3 (18.8%) |
| Food Preparation & Serving | 6 (20.7%) | 23 (79.3%) |
| Cleaning & Maintenance | 6 (75.0%) | 2 (25.0%) |
| Personal Care & Service | 0 (0.0%) | 26 (100.0%) |
| Total (Category) | 49 (39.8%) | 74 (60.2%) |
| Total (Overall) | 370 (44.6%) | 459 (55.4%) |
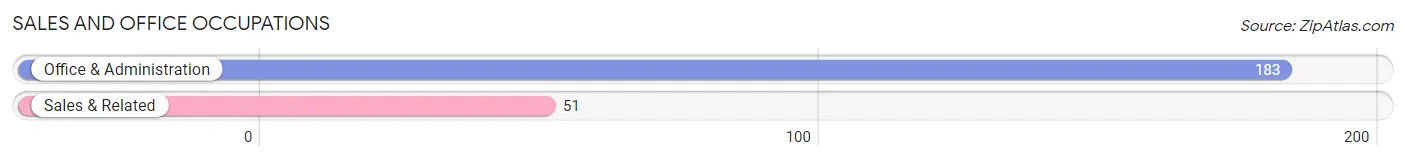
Sales and Office Occupations
The most common Sales and Office occupations in Dimondale are Office & Administration (183 | 22.1%), and Sales & Related (51 | 6.1%).
Sales and Office Occupations by Sex
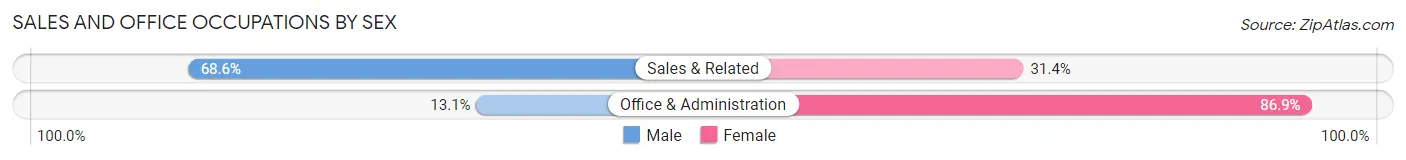
| Occupation | Male | Female |
| Sales & Related | 35 (68.6%) | 16 (31.4%) |
| Office & Administration | 24 (13.1%) | 159 (86.9%) |
| Total (Category) | 59 (25.2%) | 175 (74.8%) |
| Total (Overall) | 370 (44.6%) | 459 (55.4%) |
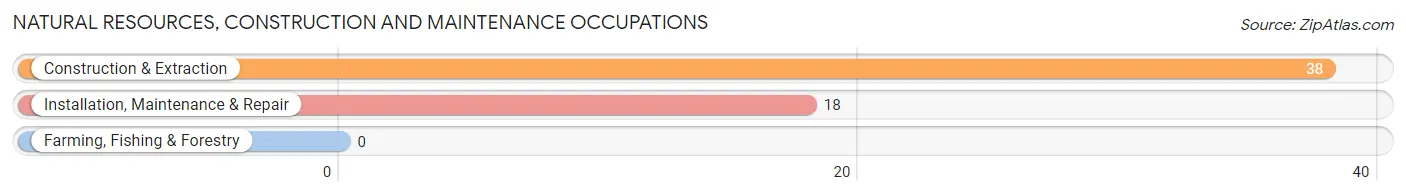
Natural Resources, Construction and Maintenance Occupations
The most common Natural Resources, Construction and Maintenance occupations in Dimondale are Construction & Extraction (38 | 4.6%), and Installation, Maintenance & Repair (18 | 2.2%).
Natural Resources, Construction and Maintenance Occupations by Sex
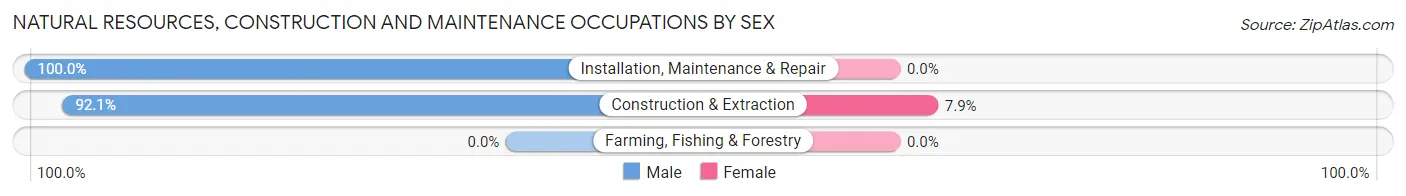
| Occupation | Male | Female |
| Farming, Fishing & Forestry | 0 (0.0%) | 0 (0.0%) |
| Construction & Extraction | 35 (92.1%) | 3 (7.9%) |
| Installation, Maintenance & Repair | 18 (100.0%) | 0 (0.0%) |
| Total (Category) | 53 (94.6%) | 3 (5.4%) |
| Total (Overall) | 370 (44.6%) | 459 (55.4%) |
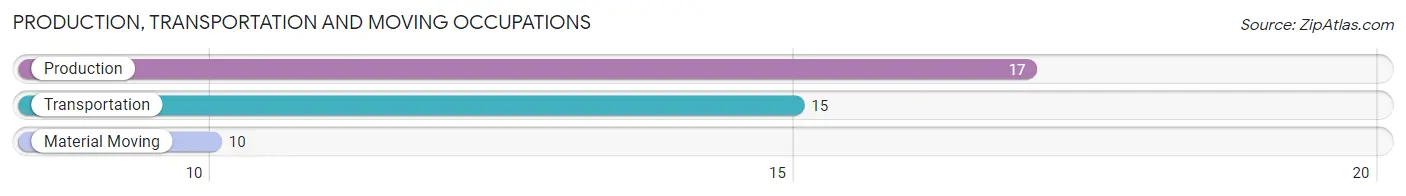
Production, Transportation and Moving Occupations
The most common Production, Transportation and Moving occupations in Dimondale are Production (17 | 2.1%), Transportation (15 | 1.8%), and Material Moving (10 | 1.2%).
Production, Transportation and Moving Occupations by Sex
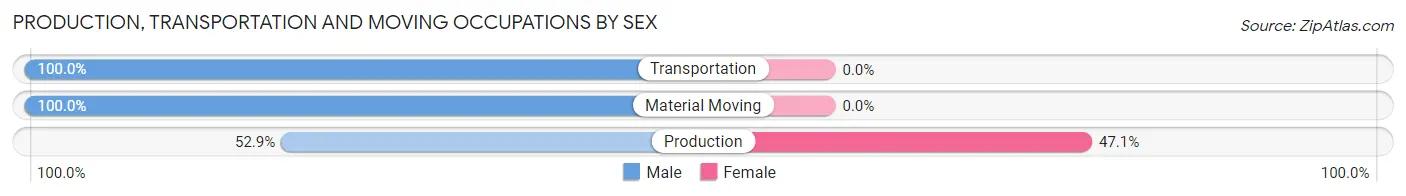
| Occupation | Male | Female |
| Production | 9 (52.9%) | 8 (47.1%) |
| Transportation | 15 (100.0%) | 0 (0.0%) |
| Material Moving | 10 (100.0%) | 0 (0.0%) |
| Total (Category) | 34 (80.9%) | 8 (19.1%) |
| Total (Overall) | 370 (44.6%) | 459 (55.4%) |
Employment Industries by Sex in Dimondale
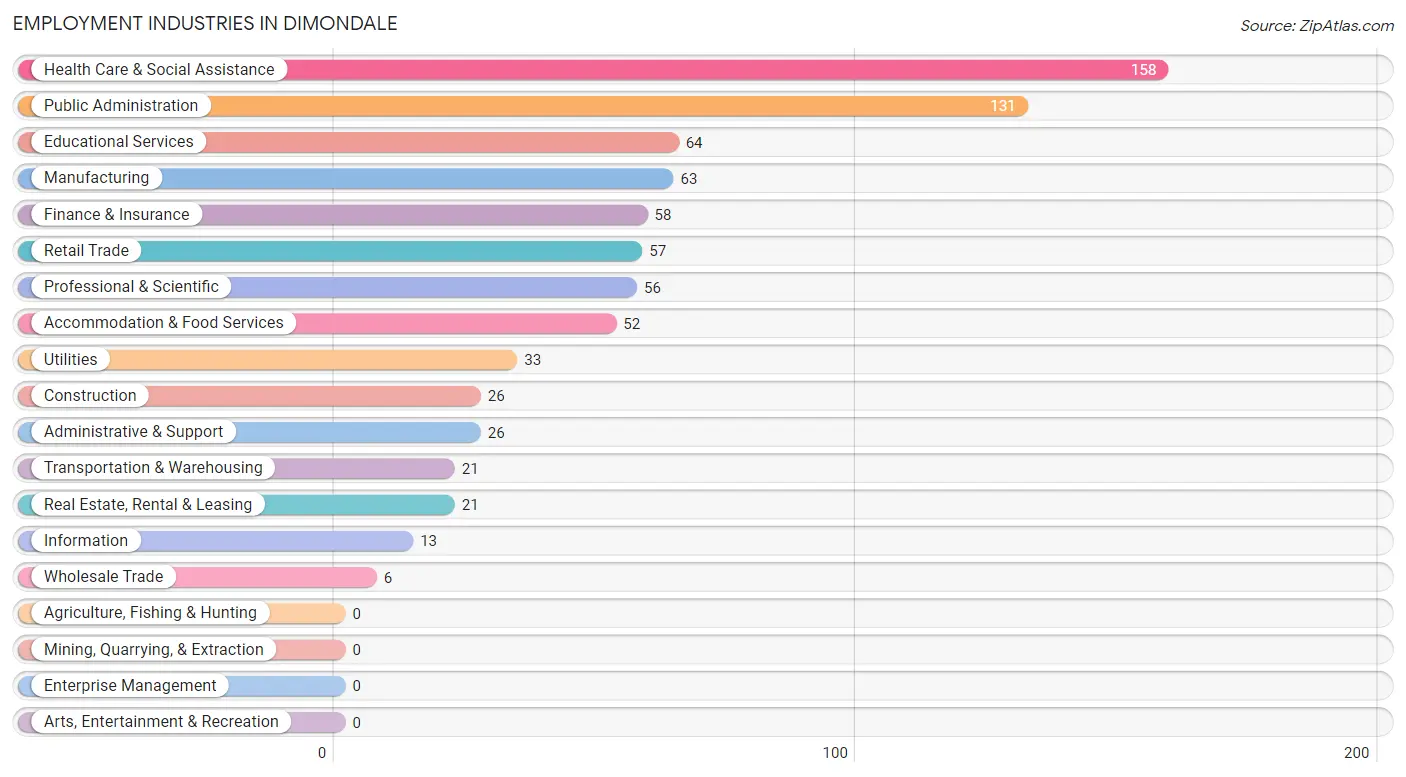
Employment Industries in Dimondale
The major employment industries in Dimondale include Health Care & Social Assistance (158 | 19.1%), Public Administration (131 | 15.8%), Educational Services (64 | 7.7%), Manufacturing (63 | 7.6%), and Finance & Insurance (58 | 7.0%).
Employment Industries by Sex in Dimondale
The Dimondale industries that see more men than women are Wholesale Trade (100.0%), Administrative & Support (92.3%), and Construction (88.5%), whereas the industries that tend to have a higher number of women are Finance & Insurance (91.4%), Transportation & Warehousing (85.7%), and Accommodation & Food Services (75.0%).
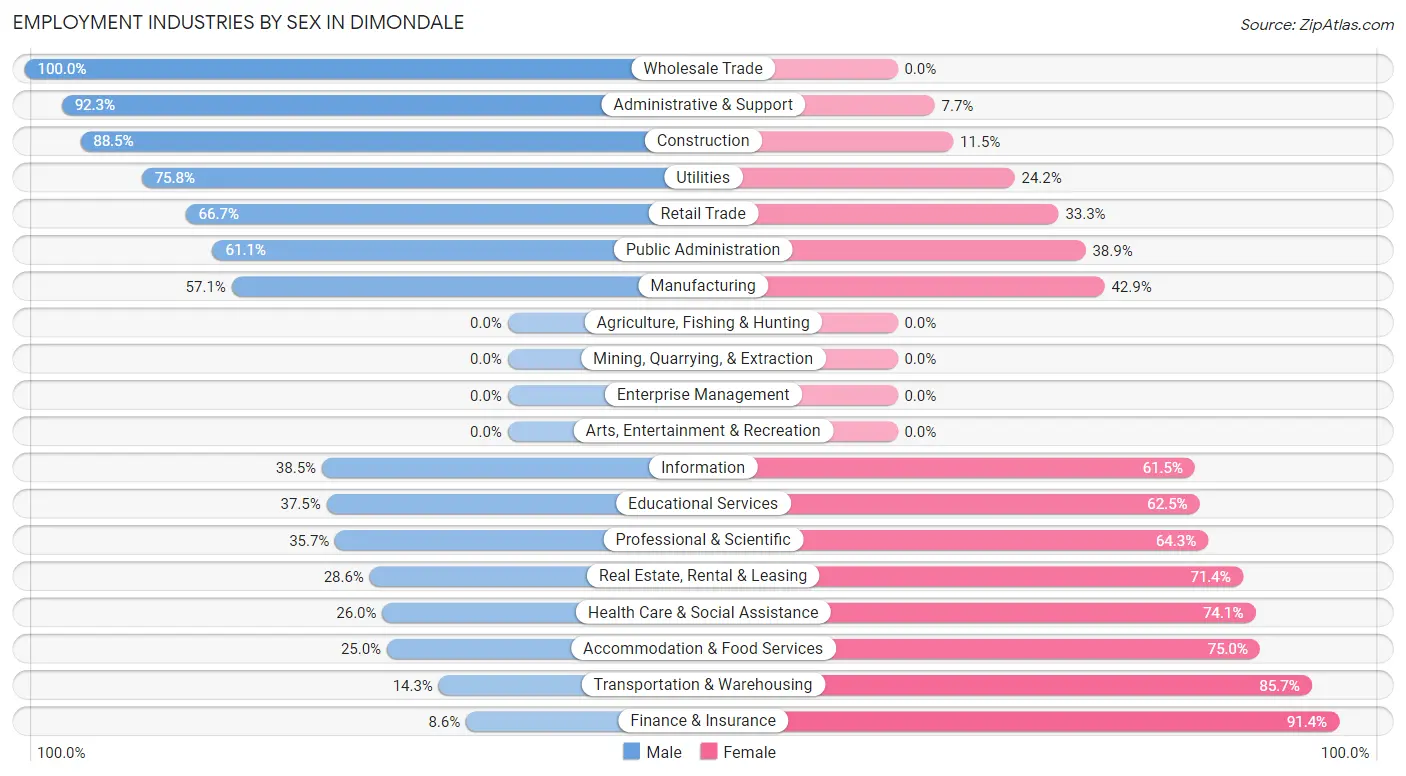
| Industry | Male | Female |
| Agriculture, Fishing & Hunting | 0 (0.0%) | 0 (0.0%) |
| Mining, Quarrying, & Extraction | 0 (0.0%) | 0 (0.0%) |
| Construction | 23 (88.5%) | 3 (11.5%) |
| Manufacturing | 36 (57.1%) | 27 (42.9%) |
| Wholesale Trade | 6 (100.0%) | 0 (0.0%) |
| Retail Trade | 38 (66.7%) | 19 (33.3%) |
| Transportation & Warehousing | 3 (14.3%) | 18 (85.7%) |
| Utilities | 25 (75.8%) | 8 (24.2%) |
| Information | 5 (38.5%) | 8 (61.5%) |
| Finance & Insurance | 5 (8.6%) | 53 (91.4%) |
| Real Estate, Rental & Leasing | 6 (28.6%) | 15 (71.4%) |
| Professional & Scientific | 20 (35.7%) | 36 (64.3%) |
| Enterprise Management | 0 (0.0%) | 0 (0.0%) |
| Administrative & Support | 24 (92.3%) | 2 (7.7%) |
| Educational Services | 24 (37.5%) | 40 (62.5%) |
| Health Care & Social Assistance | 41 (26.0%) | 117 (74.1%) |
| Arts, Entertainment & Recreation | 0 (0.0%) | 0 (0.0%) |
| Accommodation & Food Services | 13 (25.0%) | 39 (75.0%) |
| Public Administration | 80 (61.1%) | 51 (38.9%) |
| Total | 370 (44.6%) | 459 (55.4%) |
Education in Dimondale
School Enrollment in Dimondale
The most common levels of schooling among the 444 students in Dimondale are middle school (146 | 32.9%), high school (134 | 30.2%), and college / undergraduate (98 | 22.1%).
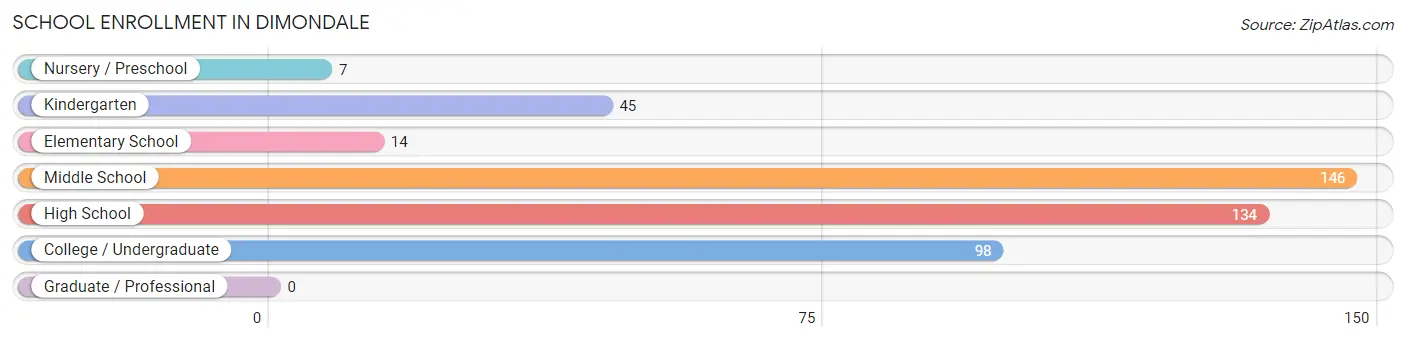
| School Level | # Students | % Students |
| Nursery / Preschool | 7 | 1.6% |
| Kindergarten | 45 | 10.1% |
| Elementary School | 14 | 3.2% |
| Middle School | 146 | 32.9% |
| High School | 134 | 30.2% |
| College / Undergraduate | 98 | 22.1% |
| Graduate / Professional | 0 | 0.0% |
| Total | 444 | 100.0% |
School Enrollment by Age by Funding Source in Dimondale
Out of a total of 444 students who are enrolled in schools in Dimondale, 36 (8.1%) attend a private institution, while the remaining 408 (91.9%) are enrolled in public schools. The age group of 25 to 34 year olds has the highest likelihood of being enrolled in private schools, with 24 (100.0% in the age bracket) enrolled. Conversely, the age group of 3 to 4 year olds has the lowest likelihood of being enrolled in a private school, with 7 (100.0% in the age bracket) attending a public institution.
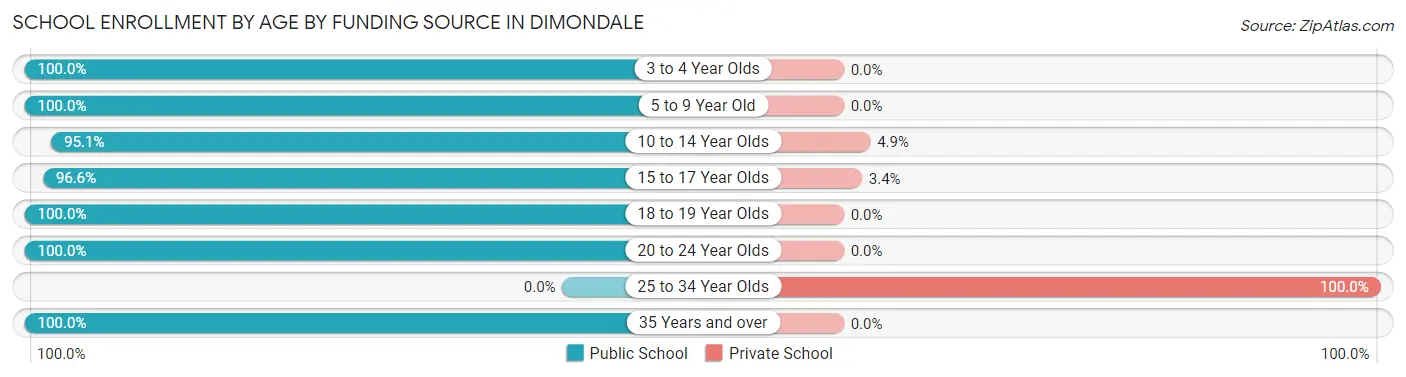
| Age Bracket | Public School | Private School |
| 3 to 4 Year Olds | 7 (100.0%) | 0 (0.0%) |
| 5 to 9 Year Old | 59 (100.0%) | 0 (0.0%) |
| 10 to 14 Year Olds | 154 (95.1%) | 8 (4.9%) |
| 15 to 17 Year Olds | 114 (96.6%) | 4 (3.4%) |
| 18 to 19 Year Olds | 33 (100.0%) | 0 (0.0%) |
| 20 to 24 Year Olds | 31 (100.0%) | 0 (0.0%) |
| 25 to 34 Year Olds | 0 (0.0%) | 24 (100.0%) |
| 35 Years and over | 10 (100.0%) | 0 (0.0%) |
| Total | 408 (91.9%) | 36 (8.1%) |
Educational Attainment by Field of Study in Dimondale
Business (81 | 20.5%), science & technology (45 | 11.4%), education (43 | 10.9%), bio, nature & agricultural (38 | 9.6%), and engineering (32 | 8.1%) are the most common fields of study among 395 individuals in Dimondale who have obtained a bachelor's degree or higher.
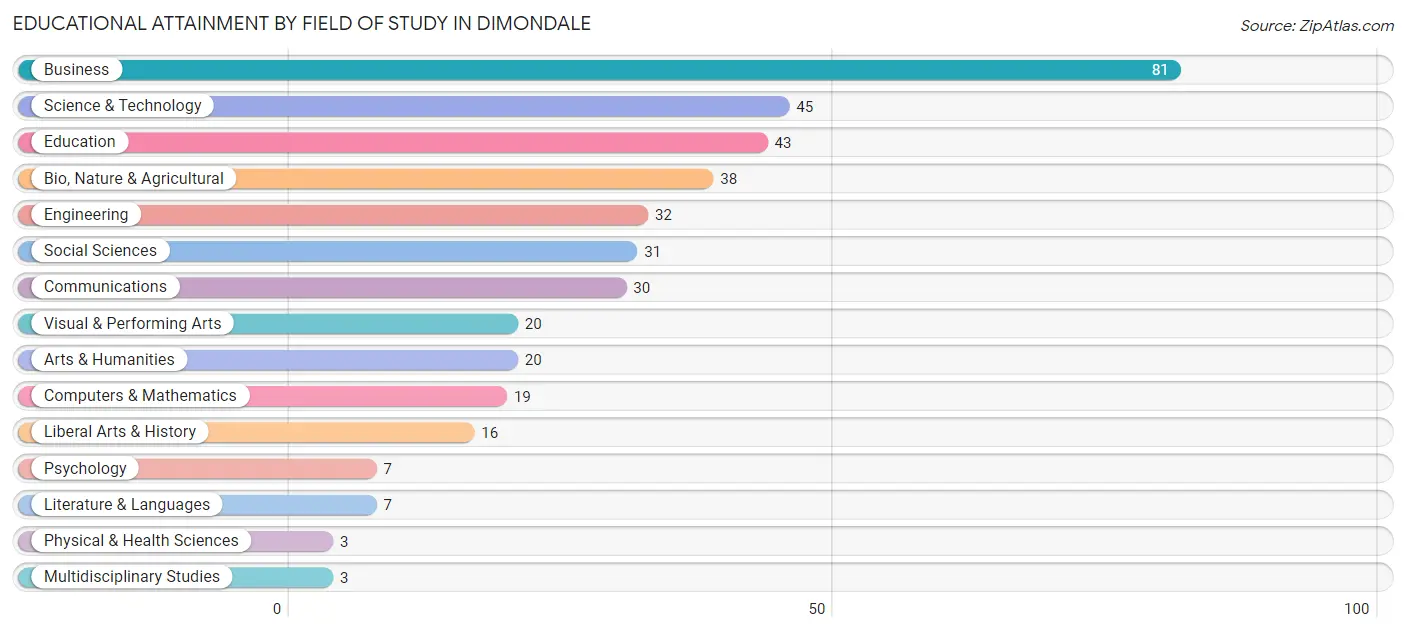
| Field of Study | # Graduates | % Graduates |
| Computers & Mathematics | 19 | 4.8% |
| Bio, Nature & Agricultural | 38 | 9.6% |
| Physical & Health Sciences | 3 | 0.8% |
| Psychology | 7 | 1.8% |
| Social Sciences | 31 | 7.9% |
| Engineering | 32 | 8.1% |
| Multidisciplinary Studies | 3 | 0.8% |
| Science & Technology | 45 | 11.4% |
| Business | 81 | 20.5% |
| Education | 43 | 10.9% |
| Literature & Languages | 7 | 1.8% |
| Liberal Arts & History | 16 | 4.1% |
| Visual & Performing Arts | 20 | 5.1% |
| Communications | 30 | 7.6% |
| Arts & Humanities | 20 | 5.1% |
| Total | 395 | 100.0% |
Transportation & Commute in Dimondale
Vehicle Availability by Sex in Dimondale
The most prevalent vehicle ownership categories in Dimondale are males with 2 vehicles (133, accounting for 36.2%) and females with 2 vehicles (178, making up 29.0%).
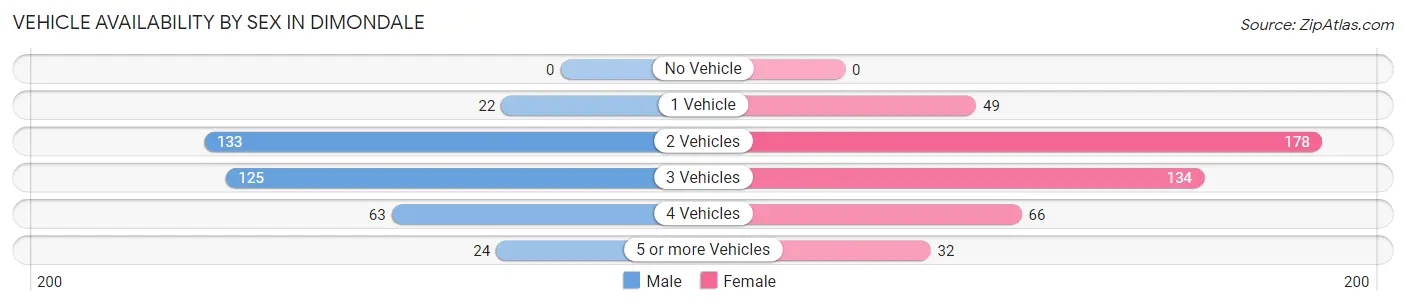
| Vehicles Available | Male | Female |
| No Vehicle | 0 (0.0%) | 0 (0.0%) |
| 1 Vehicle | 22 (6.0%) | 49 (10.7%) |
| 2 Vehicles | 133 (36.2%) | 178 (38.8%) |
| 3 Vehicles | 125 (34.1%) | 134 (29.2%) |
| 4 Vehicles | 63 (17.2%) | 66 (14.4%) |
| 5 or more Vehicles | 24 (6.5%) | 32 (7.0%) |
| Total | 367 (100.0%) | 459 (100.0%) |
Commute Time in Dimondale
The most frequently occuring commute durations in Dimondale are 20 to 24 minutes (256 commuters, 34.8%), 15 to 19 minutes (196 commuters, 26.6%), and 5 to 9 minutes (63 commuters, 8.6%).
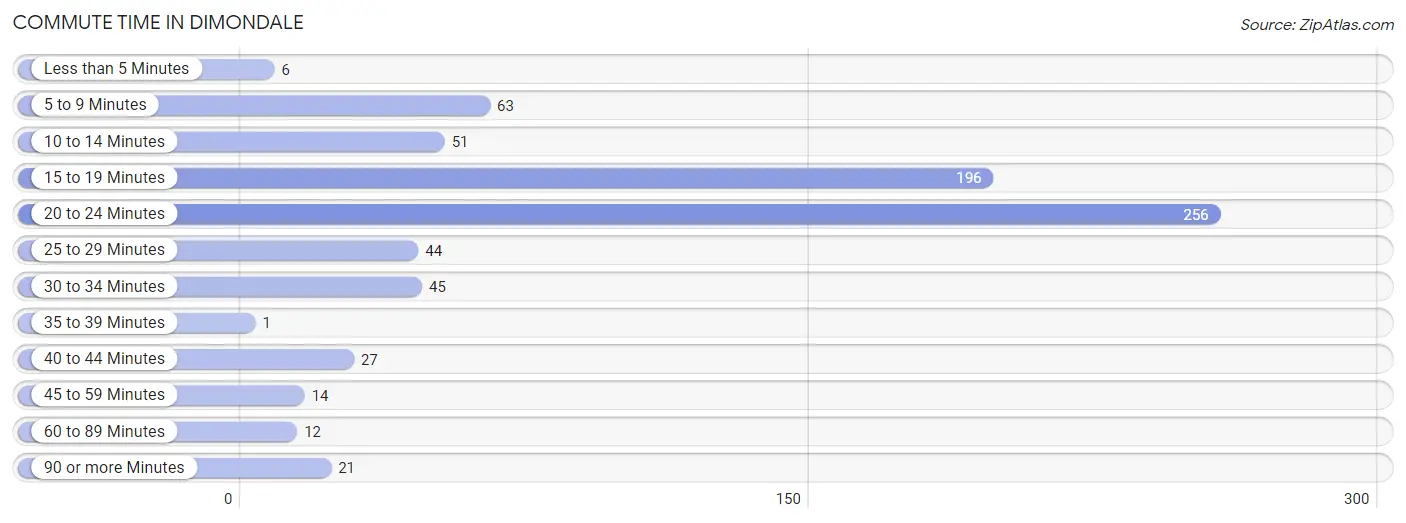
| Commute Time | # Commuters | % Commuters |
| Less than 5 Minutes | 6 | 0.8% |
| 5 to 9 Minutes | 63 | 8.6% |
| 10 to 14 Minutes | 51 | 6.9% |
| 15 to 19 Minutes | 196 | 26.6% |
| 20 to 24 Minutes | 256 | 34.8% |
| 25 to 29 Minutes | 44 | 6.0% |
| 30 to 34 Minutes | 45 | 6.1% |
| 35 to 39 Minutes | 1 | 0.1% |
| 40 to 44 Minutes | 27 | 3.7% |
| 45 to 59 Minutes | 14 | 1.9% |
| 60 to 89 Minutes | 12 | 1.6% |
| 90 or more Minutes | 21 | 2.9% |
Commute Time by Sex in Dimondale
The most common commute times in Dimondale are 20 to 24 minutes (106 commuters, 32.4%) for males and 20 to 24 minutes (150 commuters, 36.7%) for females.
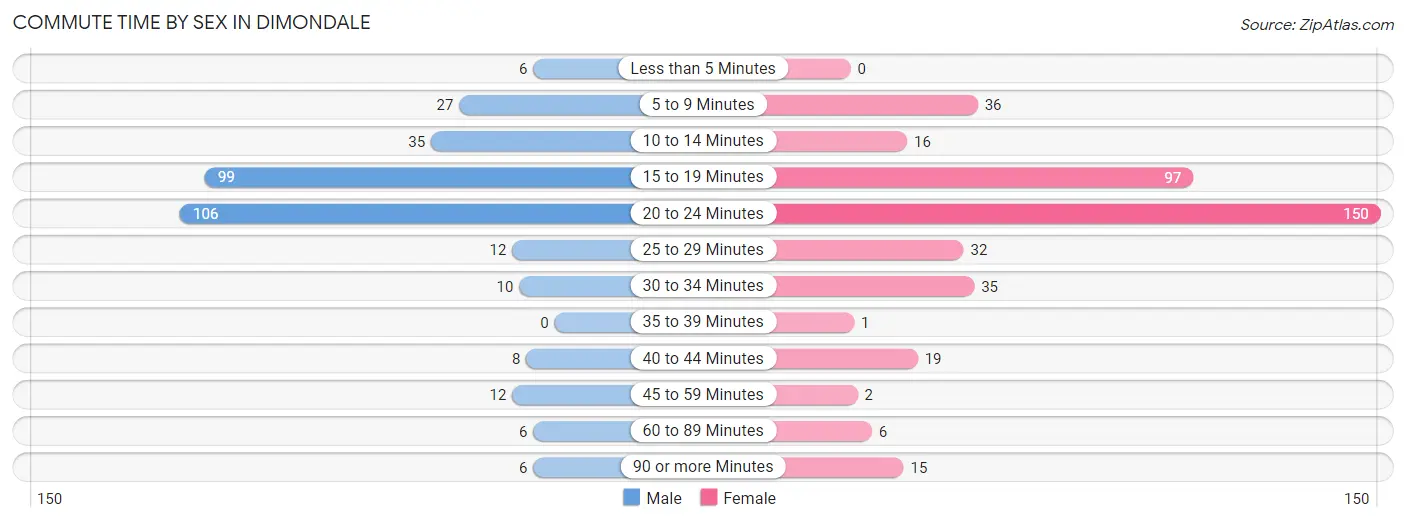
| Commute Time | Male | Female |
| Less than 5 Minutes | 6 (1.8%) | 0 (0.0%) |
| 5 to 9 Minutes | 27 (8.3%) | 36 (8.8%) |
| 10 to 14 Minutes | 35 (10.7%) | 16 (3.9%) |
| 15 to 19 Minutes | 99 (30.3%) | 97 (23.7%) |
| 20 to 24 Minutes | 106 (32.4%) | 150 (36.7%) |
| 25 to 29 Minutes | 12 (3.7%) | 32 (7.8%) |
| 30 to 34 Minutes | 10 (3.1%) | 35 (8.6%) |
| 35 to 39 Minutes | 0 (0.0%) | 1 (0.2%) |
| 40 to 44 Minutes | 8 (2.5%) | 19 (4.6%) |
| 45 to 59 Minutes | 12 (3.7%) | 2 (0.5%) |
| 60 to 89 Minutes | 6 (1.8%) | 6 (1.5%) |
| 90 or more Minutes | 6 (1.8%) | 15 (3.7%) |
Time of Departure to Work by Sex in Dimondale
The most frequent times of departure to work in Dimondale are 7:00 AM to 7:29 AM (71, 21.7%) for males and 7:00 AM to 7:29 AM (111, 27.1%) for females.
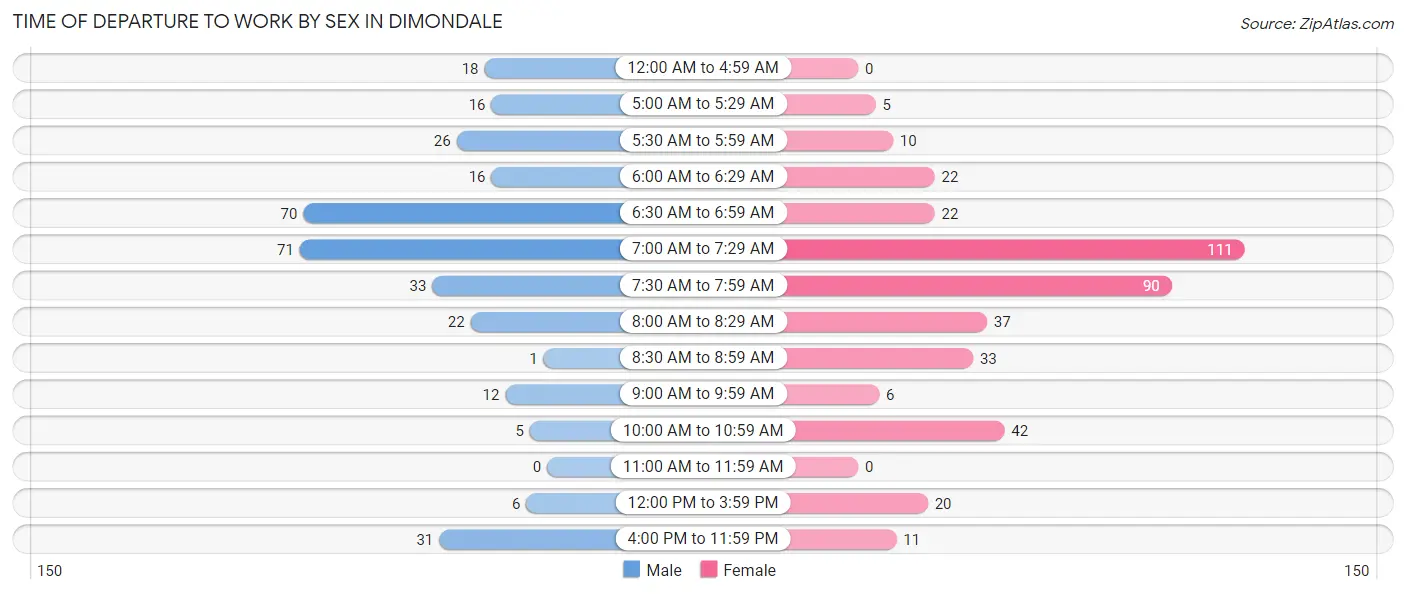
| Time of Departure | Male | Female |
| 12:00 AM to 4:59 AM | 18 (5.5%) | 0 (0.0%) |
| 5:00 AM to 5:29 AM | 16 (4.9%) | 5 (1.2%) |
| 5:30 AM to 5:59 AM | 26 (8.0%) | 10 (2.4%) |
| 6:00 AM to 6:29 AM | 16 (4.9%) | 22 (5.4%) |
| 6:30 AM to 6:59 AM | 70 (21.4%) | 22 (5.4%) |
| 7:00 AM to 7:29 AM | 71 (21.7%) | 111 (27.1%) |
| 7:30 AM to 7:59 AM | 33 (10.1%) | 90 (22.0%) |
| 8:00 AM to 8:29 AM | 22 (6.7%) | 37 (9.0%) |
| 8:30 AM to 8:59 AM | 1 (0.3%) | 33 (8.1%) |
| 9:00 AM to 9:59 AM | 12 (3.7%) | 6 (1.5%) |
| 10:00 AM to 10:59 AM | 5 (1.5%) | 42 (10.3%) |
| 11:00 AM to 11:59 AM | 0 (0.0%) | 0 (0.0%) |
| 12:00 PM to 3:59 PM | 6 (1.8%) | 20 (4.9%) |
| 4:00 PM to 11:59 PM | 31 (9.5%) | 11 (2.7%) |
| Total | 327 (100.0%) | 409 (100.0%) |
Housing Occupancy in Dimondale
Occupancy by Ownership in Dimondale
Of the total 580 dwellings in Dimondale, owner-occupied units account for 520 (89.7%), while renter-occupied units make up 60 (10.3%).
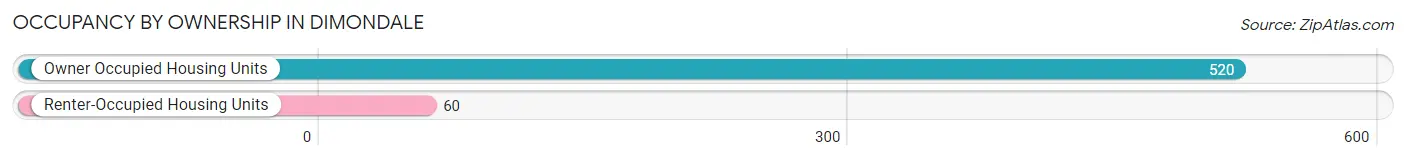
| Occupancy | # Housing Units | % Housing Units |
| Owner Occupied Housing Units | 520 | 89.7% |
| Renter-Occupied Housing Units | 60 | 10.3% |
| Total Occupied Housing Units | 580 | 100.0% |
Occupancy by Household Size in Dimondale
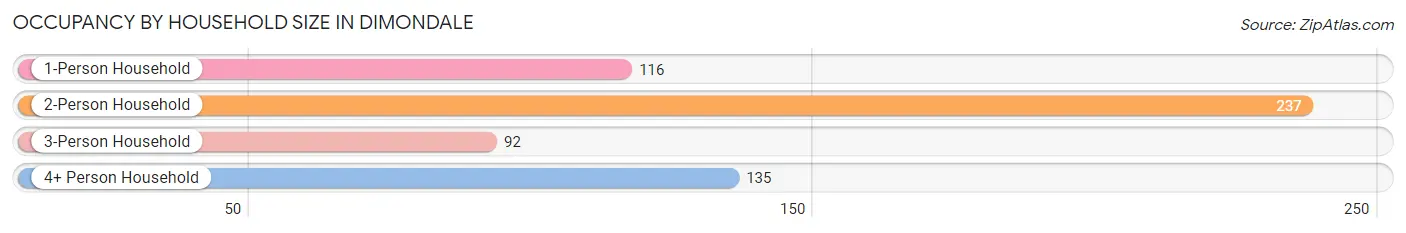
| Household Size | # Housing Units | % Housing Units |
| 1-Person Household | 116 | 20.0% |
| 2-Person Household | 237 | 40.9% |
| 3-Person Household | 92 | 15.9% |
| 4+ Person Household | 135 | 23.3% |
| Total Housing Units | 580 | 100.0% |
Occupancy by Ownership by Household Size in Dimondale
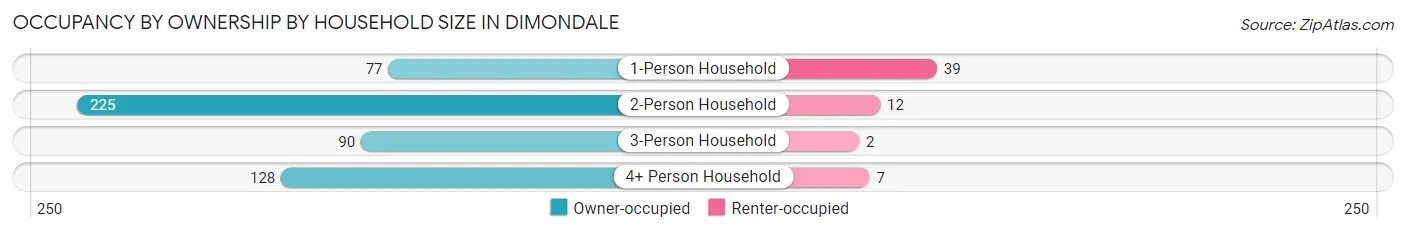
| Household Size | Owner-occupied | Renter-occupied |
| 1-Person Household | 77 (66.4%) | 39 (33.6%) |
| 2-Person Household | 225 (94.9%) | 12 (5.1%) |
| 3-Person Household | 90 (97.8%) | 2 (2.2%) |
| 4+ Person Household | 128 (94.8%) | 7 (5.2%) |
| Total Housing Units | 520 (89.7%) | 60 (10.3%) |
Occupancy by Educational Attainment in Dimondale
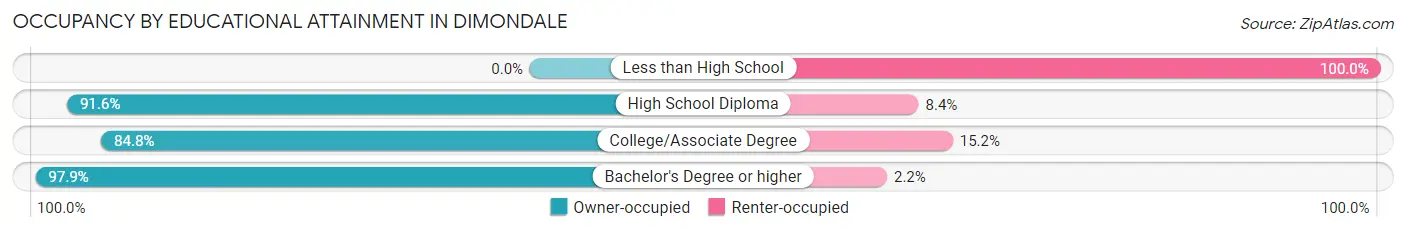
| Household Size | Owner-occupied | Renter-occupied |
| Less than High School | 0 (0.0%) | 4 (100.0%) |
| High School Diploma | 98 (91.6%) | 9 (8.4%) |
| College/Associate Degree | 240 (84.8%) | 43 (15.2%) |
| Bachelor's Degree or higher | 182 (97.9%) | 4 (2.1%) |
Occupancy by Age of Householder in Dimondale
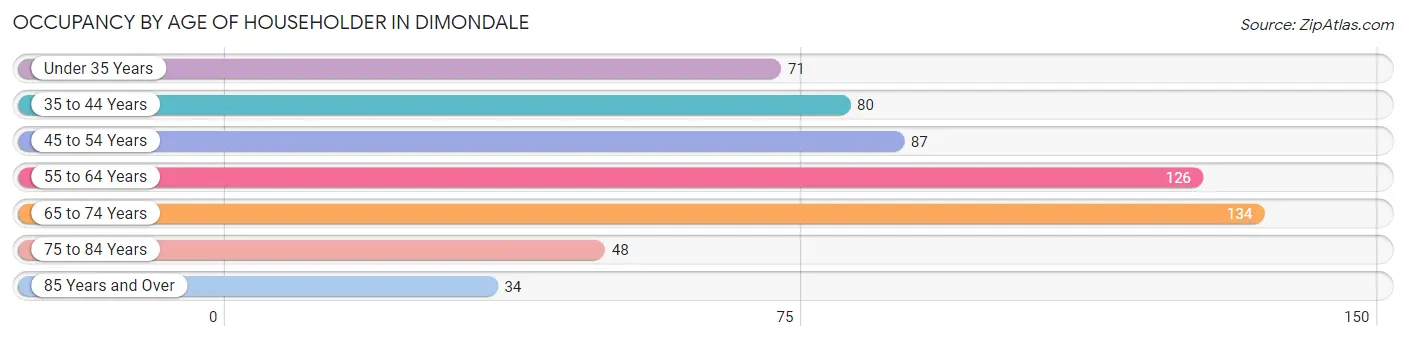
| Age Bracket | # Households | % Households |
| Under 35 Years | 71 | 12.2% |
| 35 to 44 Years | 80 | 13.8% |
| 45 to 54 Years | 87 | 15.0% |
| 55 to 64 Years | 126 | 21.7% |
| 65 to 74 Years | 134 | 23.1% |
| 75 to 84 Years | 48 | 8.3% |
| 85 Years and Over | 34 | 5.9% |
| Total | 580 | 100.0% |
Housing Finances in Dimondale
Median Income by Occupancy in Dimondale
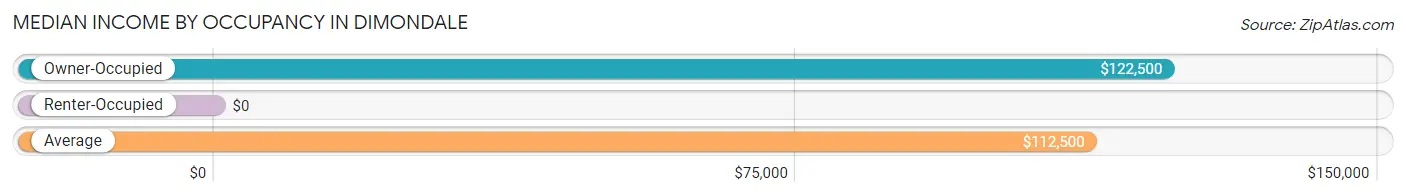
| Occupancy Type | # Households | Median Income |
| Owner-Occupied | 520 (89.7%) | $122,500 |
| Renter-Occupied | 60 (10.3%) | $0 |
| Average | 580 (100.0%) | $112,500 |
Occupancy by Householder Income Bracket in Dimondale
| Income Bracket | Owner-occupied | Renter-occupied |
| Less than $5,000 | 2 (0.4%) | 0 (0.0%) |
| $5,000 to $9,999 | 6 (1.1%) | 0 (0.0%) |
| $10,000 to $14,999 | 0 (0.0%) | 2 (3.3%) |
| $15,000 to $19,999 | 3 (0.6%) | 21 (35.0%) |
| $20,000 to $24,999 | 2 (0.4%) | 4 (6.7%) |
| $25,000 to $34,999 | 29 (5.6%) | 4 (6.7%) |
| $35,000 to $49,999 | 30 (5.8%) | 10 (16.7%) |
| $50,000 to $74,999 | 61 (11.7%) | 10 (16.7%) |
| $75,000 to $99,999 | 72 (13.9%) | 7 (11.7%) |
| $100,000 to $149,999 | 113 (21.7%) | 2 (3.3%) |
| $150,000 or more | 202 (38.9%) | 0 (0.0%) |
| Total | 520 (100.0%) | 60 (100.0%) |
Monthly Housing Cost Tiers in Dimondale
| Monthly Cost | Owner-occupied | Renter-occupied |
| Less than $300 | 8 (1.5%) | 0 (0.0%) |
| $300 to $499 | 66 (12.7%) | 2 (3.3%) |
| $500 to $799 | 96 (18.5%) | 4 (6.7%) |
| $800 to $999 | 32 (6.1%) | 37 (61.7%) |
| $1,000 to $1,499 | 108 (20.8%) | 10 (16.7%) |
| $1,500 to $1,999 | 94 (18.1%) | 7 (11.7%) |
| $2,000 to $2,499 | 95 (18.3%) | 0 (0.0%) |
| $2,500 to $2,999 | 18 (3.5%) | 0 (0.0%) |
| $3,000 or more | 3 (0.6%) | 0 (0.0%) |
| Total | 520 (100.0%) | 60 (100.0%) |
Physical Housing Characteristics in Dimondale
Housing Structures in Dimondale
| Structure Type | # Housing Units | % Housing Units |
| Single Unit, Detached | 531 | 91.5% |
| Single Unit, Attached | 7 | 1.2% |
| 2 Unit Apartments | 5 | 0.9% |
| 3 or 4 Unit Apartments | 0 | 0.0% |
| 5 to 9 Unit Apartments | 0 | 0.0% |
| 10 or more Apartments | 37 | 6.4% |
| Mobile Home / Other | 0 | 0.0% |
| Total | 580 | 100.0% |
Housing Structures by Occupancy in Dimondale
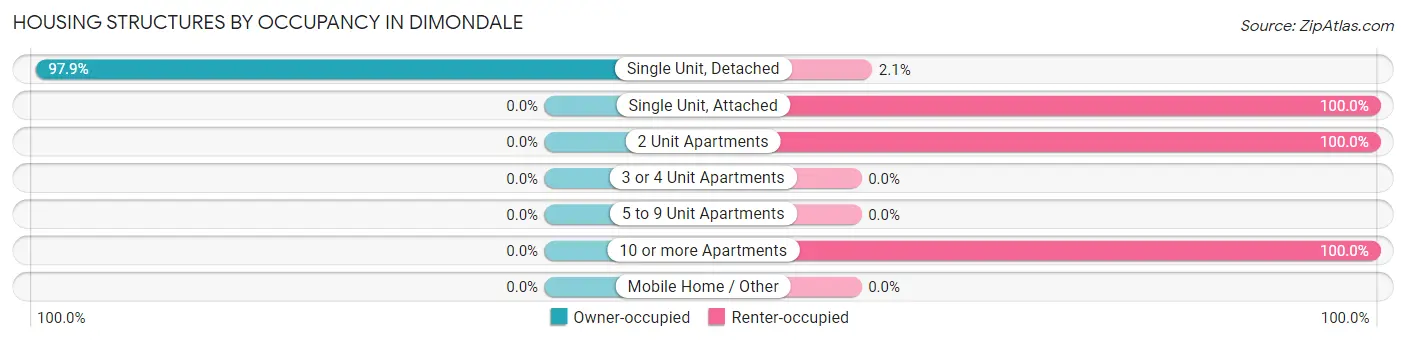
| Structure Type | Owner-occupied | Renter-occupied |
| Single Unit, Detached | 520 (97.9%) | 11 (2.1%) |
| Single Unit, Attached | 0 (0.0%) | 7 (100.0%) |
| 2 Unit Apartments | 0 (0.0%) | 5 (100.0%) |
| 3 or 4 Unit Apartments | 0 (0.0%) | 0 (0.0%) |
| 5 to 9 Unit Apartments | 0 (0.0%) | 0 (0.0%) |
| 10 or more Apartments | 0 (0.0%) | 37 (100.0%) |
| Mobile Home / Other | 0 (0.0%) | 0 (0.0%) |
| Total | 520 (89.7%) | 60 (10.3%) |
Housing Structures by Number of Rooms in Dimondale
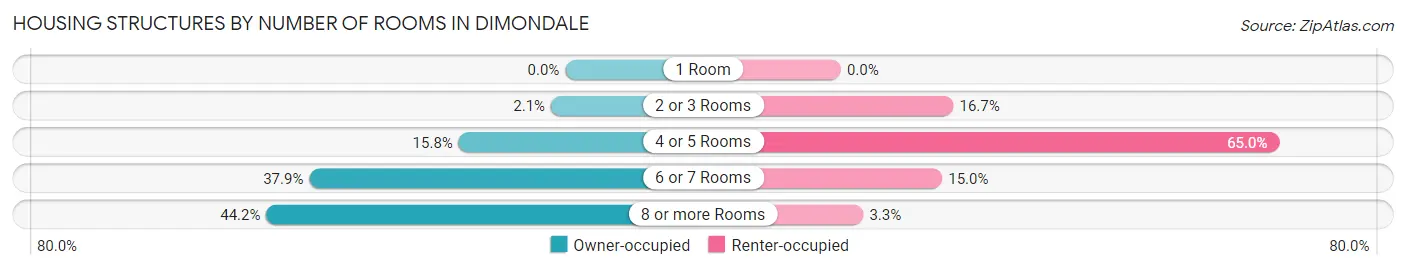
| Number of Rooms | Owner-occupied | Renter-occupied |
| 1 Room | 0 (0.0%) | 0 (0.0%) |
| 2 or 3 Rooms | 11 (2.1%) | 10 (16.7%) |
| 4 or 5 Rooms | 82 (15.8%) | 39 (65.0%) |
| 6 or 7 Rooms | 197 (37.9%) | 9 (15.0%) |
| 8 or more Rooms | 230 (44.2%) | 2 (3.3%) |
| Total | 520 (100.0%) | 60 (100.0%) |
Housing Structure by Heating Type in Dimondale
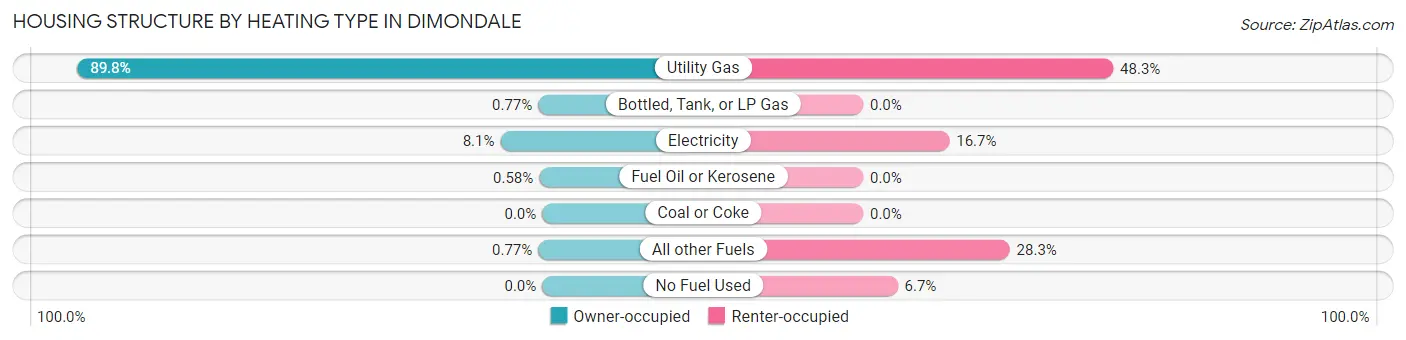
| Heating Type | Owner-occupied | Renter-occupied |
| Utility Gas | 467 (89.8%) | 29 (48.3%) |
| Bottled, Tank, or LP Gas | 4 (0.8%) | 0 (0.0%) |
| Electricity | 42 (8.1%) | 10 (16.7%) |
| Fuel Oil or Kerosene | 3 (0.6%) | 0 (0.0%) |
| Coal or Coke | 0 (0.0%) | 0 (0.0%) |
| All other Fuels | 4 (0.8%) | 17 (28.3%) |
| No Fuel Used | 0 (0.0%) | 4 (6.7%) |
| Total | 520 (100.0%) | 60 (100.0%) |
Household Vehicle Usage in Dimondale
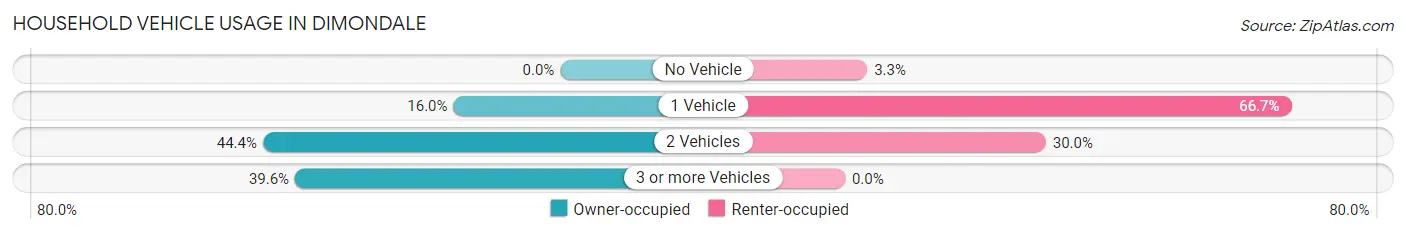
| Vehicles per Household | Owner-occupied | Renter-occupied |
| No Vehicle | 0 (0.0%) | 2 (3.3%) |
| 1 Vehicle | 83 (16.0%) | 40 (66.7%) |
| 2 Vehicles | 231 (44.4%) | 18 (30.0%) |
| 3 or more Vehicles | 206 (39.6%) | 0 (0.0%) |
| Total | 520 (100.0%) | 60 (100.0%) |
Real Estate & Mortgages in Dimondale
Real Estate and Mortgage Overview in Dimondale
| Characteristic | Without Mortgage | With Mortgage |
| Housing Units | 176 | 344 |
| Median Property Value | $175,000 | $216,800 |
| Median Household Income | $84,167 | $147 |
| Monthly Housing Costs | $552 | $3 |
| Real Estate Taxes | $3,612 | $33 |
Property Value by Mortgage Status in Dimondale
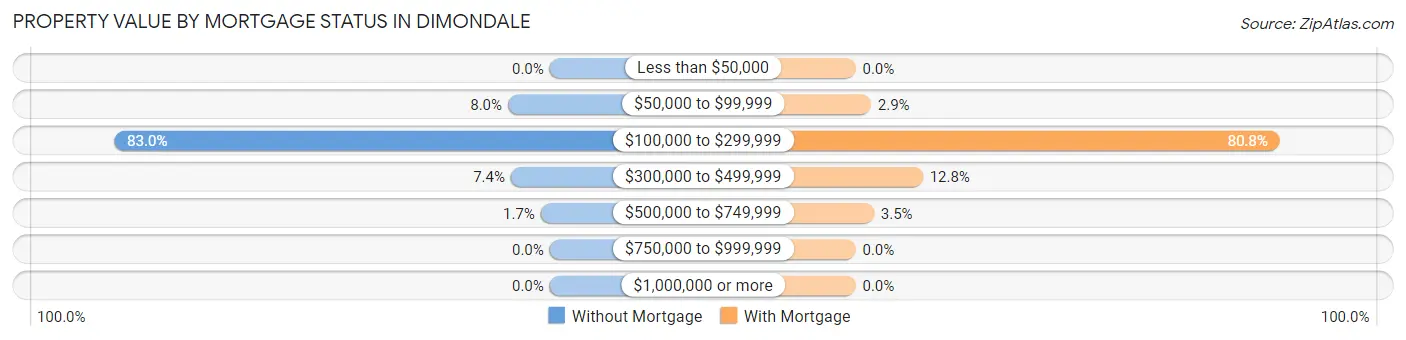
| Property Value | Without Mortgage | With Mortgage |
| Less than $50,000 | 0 (0.0%) | 0 (0.0%) |
| $50,000 to $99,999 | 14 (8.0%) | 10 (2.9%) |
| $100,000 to $299,999 | 146 (83.0%) | 278 (80.8%) |
| $300,000 to $499,999 | 13 (7.4%) | 44 (12.8%) |
| $500,000 to $749,999 | 3 (1.7%) | 12 (3.5%) |
| $750,000 to $999,999 | 0 (0.0%) | 0 (0.0%) |
| $1,000,000 or more | 0 (0.0%) | 0 (0.0%) |
| Total | 176 (100.0%) | 344 (100.0%) |
Household Income by Mortgage Status in Dimondale
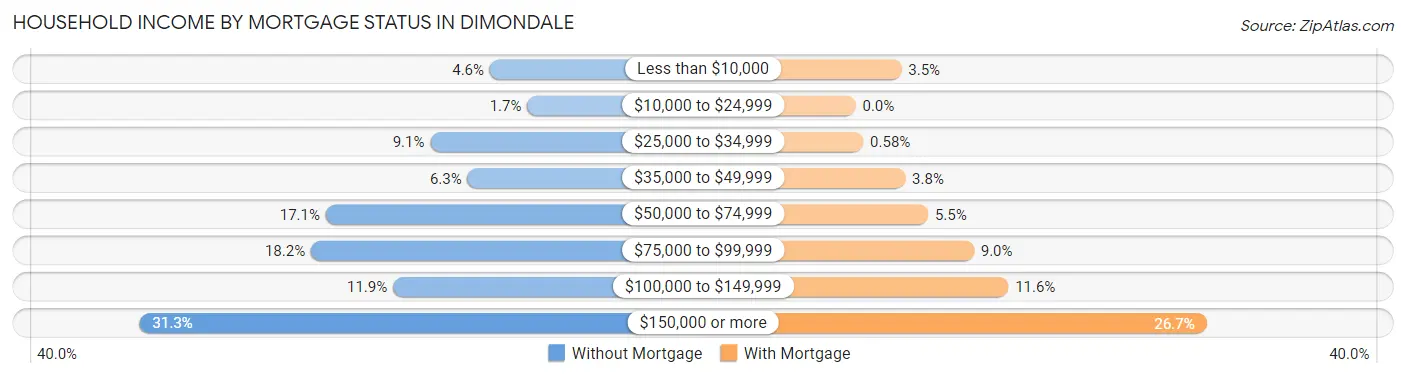
| Household Income | Without Mortgage | With Mortgage |
| Less than $10,000 | 8 (4.5%) | 12 (3.5%) |
| $10,000 to $24,999 | 3 (1.7%) | 0 (0.0%) |
| $25,000 to $34,999 | 16 (9.1%) | 2 (0.6%) |
| $35,000 to $49,999 | 11 (6.2%) | 13 (3.8%) |
| $50,000 to $74,999 | 30 (17.1%) | 19 (5.5%) |
| $75,000 to $99,999 | 32 (18.2%) | 31 (9.0%) |
| $100,000 to $149,999 | 21 (11.9%) | 40 (11.6%) |
| $150,000 or more | 55 (31.2%) | 92 (26.7%) |
| Total | 176 (100.0%) | 344 (100.0%) |
Property Value to Household Income Ratio in Dimondale
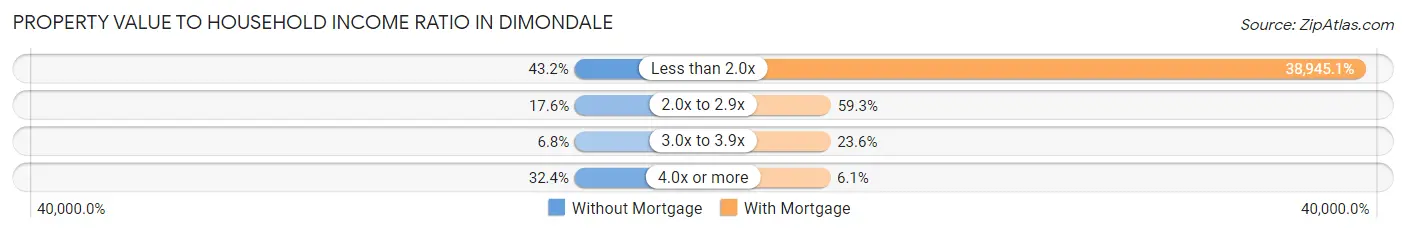
| Value-to-Income Ratio | Without Mortgage | With Mortgage |
| Less than 2.0x | 76 (43.2%) | 133,971 (38,945.1%) |
| 2.0x to 2.9x | 31 (17.6%) | 204 (59.3%) |
| 3.0x to 3.9x | 12 (6.8%) | 81 (23.5%) |
| 4.0x or more | 57 (32.4%) | 21 (6.1%) |
| Total | 176 (100.0%) | 344 (100.0%) |
Real Estate Taxes by Mortgage Status in Dimondale
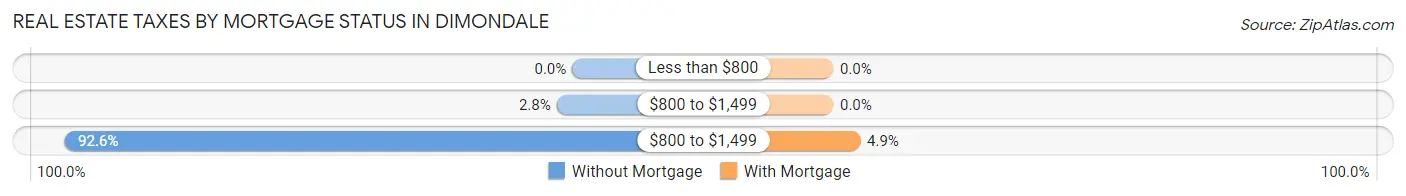
| Property Taxes | Without Mortgage | With Mortgage |
| Less than $800 | 0 (0.0%) | 0 (0.0%) |
| $800 to $1,499 | 5 (2.8%) | 0 (0.0%) |
| $800 to $1,499 | 163 (92.6%) | 17 (4.9%) |
| Total | 176 (100.0%) | 344 (100.0%) |
Health & Disability in Dimondale
Health Insurance Coverage by Age in Dimondale
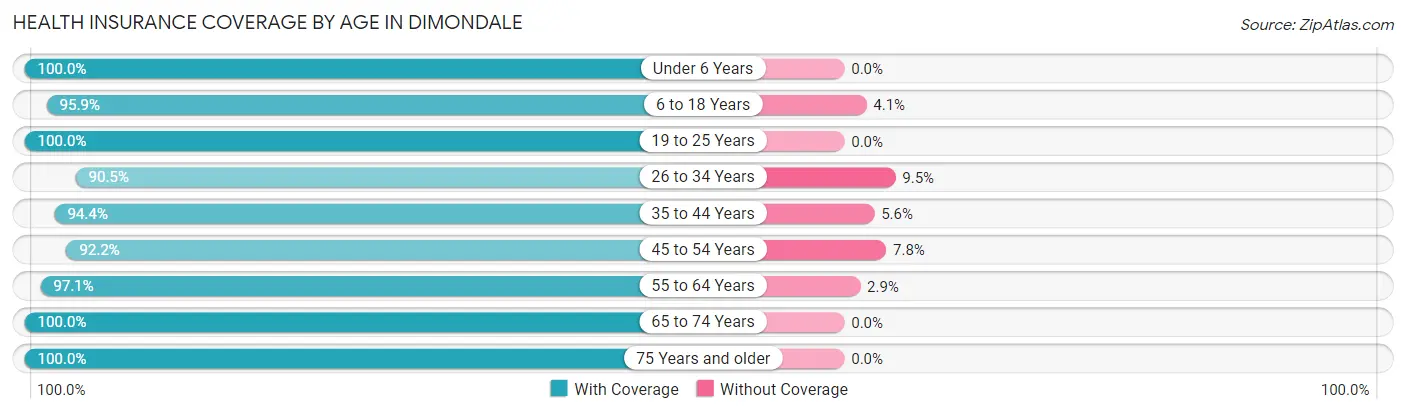
| Age Bracket | With Coverage | Without Coverage |
| Under 6 Years | 83 (100.0%) | 0 (0.0%) |
| 6 to 18 Years | 303 (95.9%) | 13 (4.1%) |
| 19 to 25 Years | 107 (100.0%) | 0 (0.0%) |
| 26 to 34 Years | 133 (90.5%) | 14 (9.5%) |
| 35 to 44 Years | 186 (94.4%) | 11 (5.6%) |
| 45 to 54 Years | 201 (92.2%) | 17 (7.8%) |
| 55 to 64 Years | 198 (97.1%) | 6 (2.9%) |
| 65 to 74 Years | 223 (100.0%) | 0 (0.0%) |
| 75 Years and older | 124 (100.0%) | 0 (0.0%) |
| Total | 1,558 (96.2%) | 61 (3.8%) |
Health Insurance Coverage by Citizenship Status in Dimondale
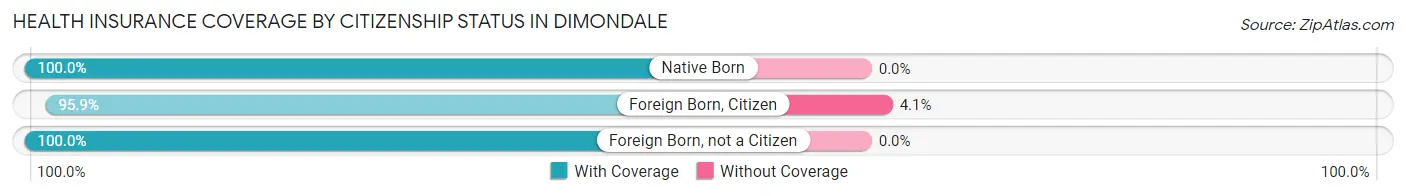
| Citizenship Status | With Coverage | Without Coverage |
| Native Born | 83 (100.0%) | 0 (0.0%) |
| Foreign Born, Citizen | 303 (95.9%) | 13 (4.1%) |
| Foreign Born, not a Citizen | 107 (100.0%) | 0 (0.0%) |
Health Insurance Coverage by Household Income in Dimondale
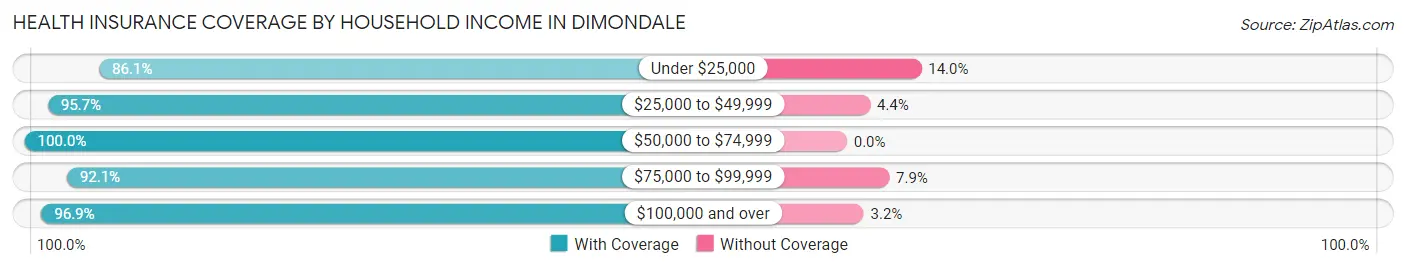
| Household Income | With Coverage | Without Coverage |
| Under $25,000 | 37 (86.1%) | 6 (14.0%) |
| $25,000 to $49,999 | 132 (95.7%) | 6 (4.3%) |
| $50,000 to $74,999 | 215 (100.0%) | 0 (0.0%) |
| $75,000 to $99,999 | 209 (92.1%) | 18 (7.9%) |
| $100,000 and over | 953 (96.9%) | 31 (3.2%) |
Public vs Private Health Insurance Coverage by Age in Dimondale
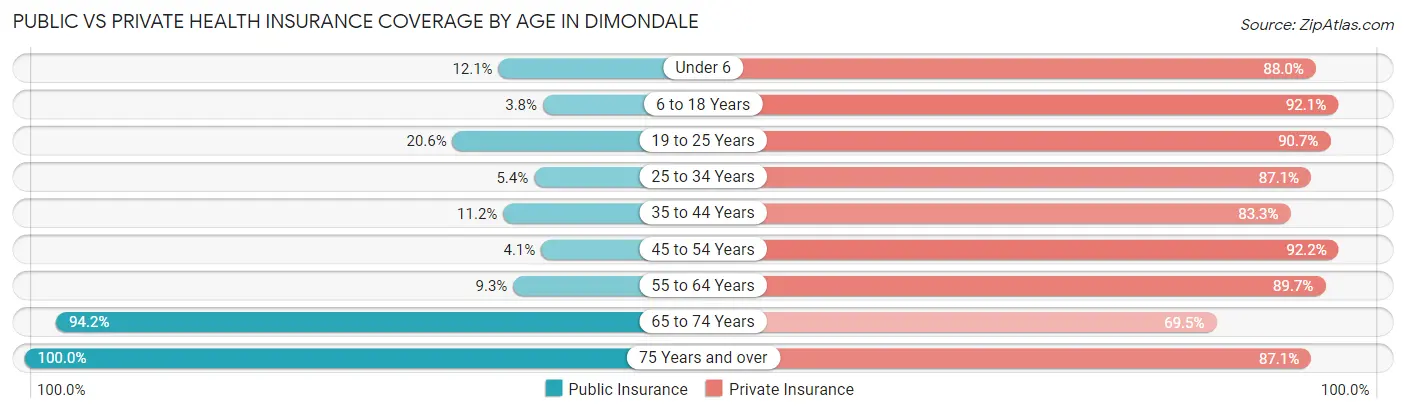
| Age Bracket | Public Insurance | Private Insurance |
| Under 6 | 10 (12.0%) | 73 (87.9%) |
| 6 to 18 Years | 12 (3.8%) | 291 (92.1%) |
| 19 to 25 Years | 22 (20.6%) | 97 (90.6%) |
| 25 to 34 Years | 8 (5.4%) | 128 (87.1%) |
| 35 to 44 Years | 22 (11.2%) | 164 (83.3%) |
| 45 to 54 Years | 9 (4.1%) | 201 (92.2%) |
| 55 to 64 Years | 19 (9.3%) | 183 (89.7%) |
| 65 to 74 Years | 210 (94.2%) | 155 (69.5%) |
| 75 Years and over | 124 (100.0%) | 108 (87.1%) |
| Total | 436 (26.9%) | 1,400 (86.5%) |
Disability Status by Sex by Age in Dimondale
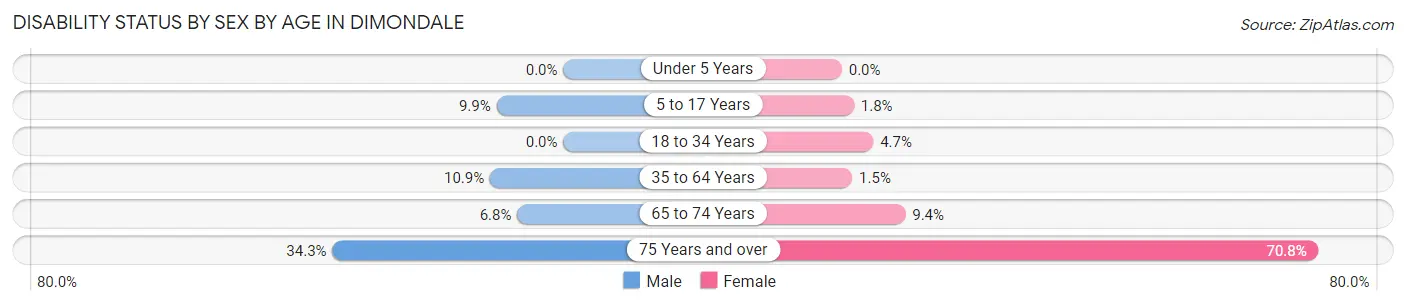
| Age Bracket | Male | Female |
| Under 5 Years | 0 (0.0%) | 0 (0.0%) |
| 5 to 17 Years | 12 (9.9%) | 4 (1.8%) |
| 18 to 34 Years | 0 (0.0%) | 7 (4.7%) |
| 35 to 64 Years | 32 (10.9%) | 5 (1.5%) |
| 65 to 74 Years | 8 (6.8%) | 10 (9.4%) |
| 75 Years and over | 12 (34.3%) | 63 (70.8%) |
Disability Class by Sex by Age in Dimondale
Disability Class: Hearing Difficulty
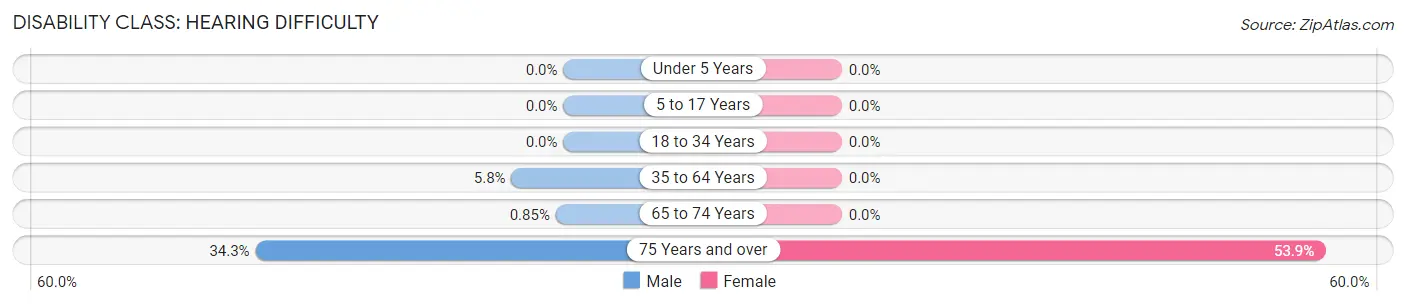
| Age Bracket | Male | Female |
| Under 5 Years | 0 (0.0%) | 0 (0.0%) |
| 5 to 17 Years | 0 (0.0%) | 0 (0.0%) |
| 18 to 34 Years | 0 (0.0%) | 0 (0.0%) |
| 35 to 64 Years | 17 (5.8%) | 0 (0.0%) |
| 65 to 74 Years | 1 (0.9%) | 0 (0.0%) |
| 75 Years and over | 12 (34.3%) | 48 (53.9%) |
Disability Class: Vision Difficulty
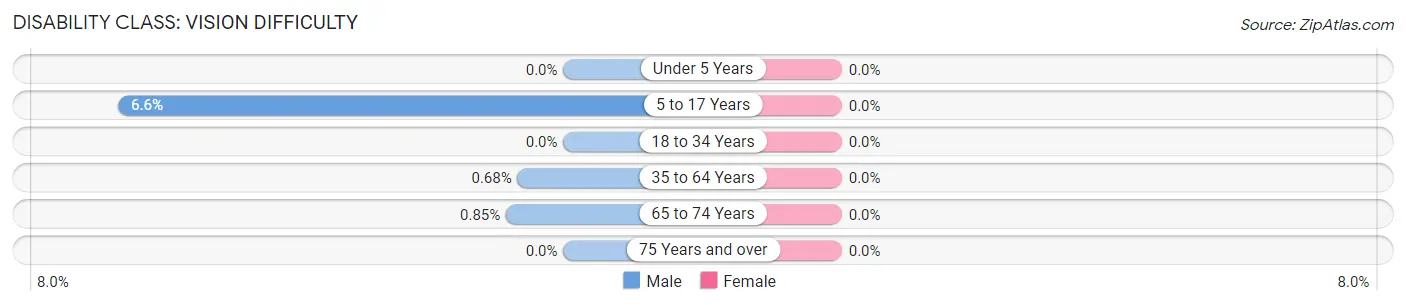
| Age Bracket | Male | Female |
| Under 5 Years | 0 (0.0%) | 0 (0.0%) |
| 5 to 17 Years | 8 (6.6%) | 0 (0.0%) |
| 18 to 34 Years | 0 (0.0%) | 0 (0.0%) |
| 35 to 64 Years | 2 (0.7%) | 0 (0.0%) |
| 65 to 74 Years | 1 (0.9%) | 0 (0.0%) |
| 75 Years and over | 0 (0.0%) | 0 (0.0%) |
Disability Class: Cognitive Difficulty
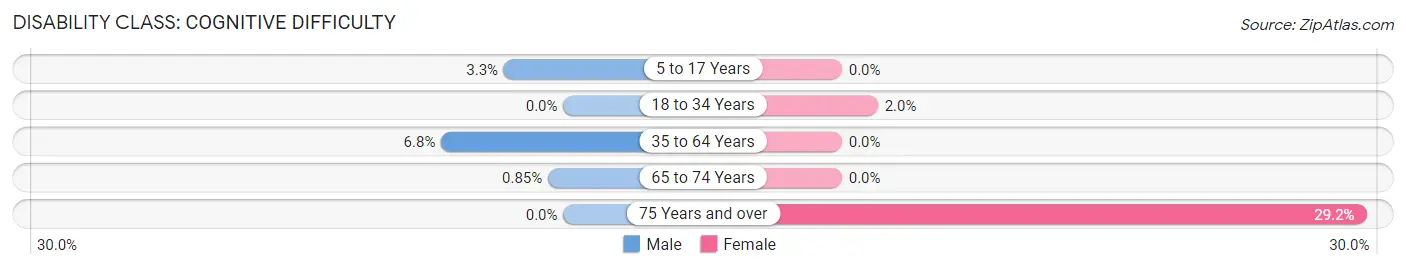
| Age Bracket | Male | Female |
| 5 to 17 Years | 4 (3.3%) | 0 (0.0%) |
| 18 to 34 Years | 0 (0.0%) | 3 (2.0%) |
| 35 to 64 Years | 20 (6.8%) | 0 (0.0%) |
| 65 to 74 Years | 1 (0.9%) | 0 (0.0%) |
| 75 Years and over | 0 (0.0%) | 26 (29.2%) |
Disability Class: Ambulatory Difficulty
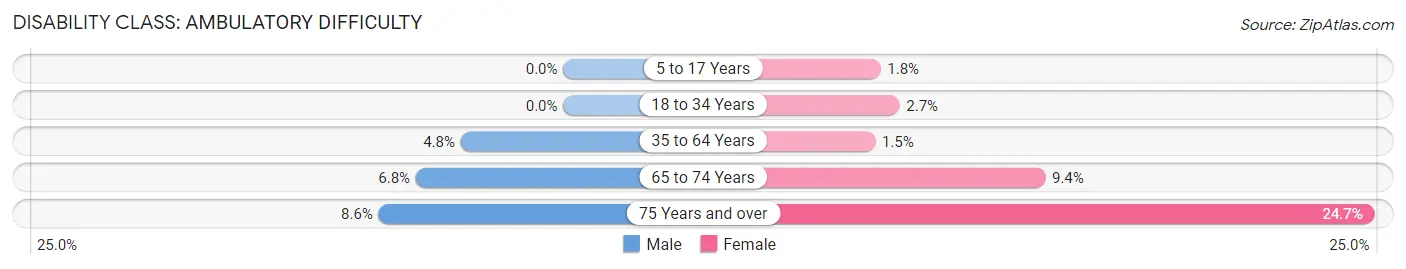
| Age Bracket | Male | Female |
| 5 to 17 Years | 0 (0.0%) | 4 (1.8%) |
| 18 to 34 Years | 0 (0.0%) | 4 (2.7%) |
| 35 to 64 Years | 14 (4.8%) | 5 (1.5%) |
| 65 to 74 Years | 8 (6.8%) | 10 (9.4%) |
| 75 Years and over | 3 (8.6%) | 22 (24.7%) |
Disability Class: Self-Care Difficulty
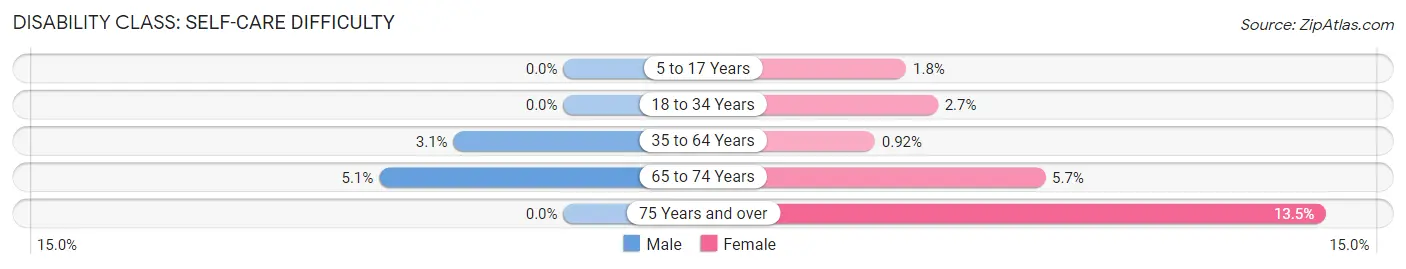
| Age Bracket | Male | Female |
| 5 to 17 Years | 0 (0.0%) | 4 (1.8%) |
| 18 to 34 Years | 0 (0.0%) | 4 (2.7%) |
| 35 to 64 Years | 9 (3.1%) | 3 (0.9%) |
| 65 to 74 Years | 6 (5.1%) | 6 (5.7%) |
| 75 Years and over | 0 (0.0%) | 12 (13.5%) |
Technology Access in Dimondale
Computing Device Access in Dimondale
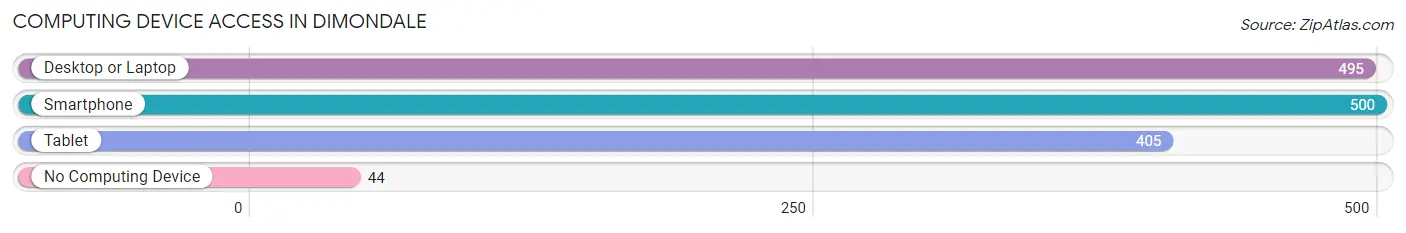
| Device Type | # Households | % Households |
| Desktop or Laptop | 495 | 85.3% |
| Smartphone | 500 | 86.2% |
| Tablet | 405 | 69.8% |
| No Computing Device | 44 | 7.6% |
| Total | 580 | 100.0% |
Internet Access in Dimondale
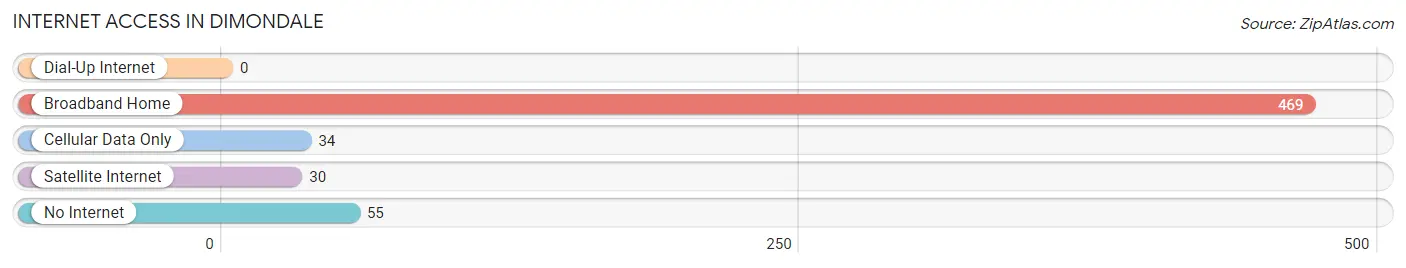
| Internet Type | # Households | % Households |
| Dial-Up Internet | 0 | 0.0% |
| Broadband Home | 469 | 80.9% |
| Cellular Data Only | 34 | 5.9% |
| Satellite Internet | 30 | 5.2% |
| No Internet | 55 | 9.5% |
| Total | 580 | 100.0% |
Dimondale Summary
Diamondale is a small unincorporated community located in Eaton County, Michigan. It is situated in the south-central part of the state, approximately 8 miles east of Lansing, the state capital. The population of Diamondale was estimated to be 1,845 in the 2010 census.
History
Diamondale was first settled in 1836 by a group of settlers from New York. The settlement was originally known as “Diamond”, after the diamond-shaped field that the settlers found when they arrived. The name was changed to Diamondale in 1845 when the post office was established.
The first industry in Diamondale was a sawmill, which was built in 1837. This was followed by a grist mill in 1845 and a woolen mill in 1848. The woolen mill was the first of its kind in the state of Michigan.
Diamondale was incorporated as a village in 1871. The village was home to a variety of businesses, including a hotel, a general store, a blacksmith shop, and a livery stable.
Geography
Diamondale is located in the south-central part of Michigan, approximately 8 miles east of Lansing, the state capital. The community is situated in the Grand River Valley, which is part of the larger Grand River watershed. The Grand River is the longest river in Michigan and is a major tributary of Lake Michigan.
The terrain of Diamondale is mostly flat, with some rolling hills. The soil is mostly sandy loam, with some areas of clay. The climate is humid continental, with hot summers and cold winters.
Economy
The economy of Diamondale is largely based on agriculture. The main crops grown in the area are corn, soybeans, and wheat. There are also several dairy farms in the area.
In addition to agriculture, Diamondale is home to several small businesses, including a grocery store, a hardware store, and a restaurant. There is also a small manufacturing plant in the area.
Demographics
The population of Diamondale was estimated to be 1,845 in the 2010 census. The racial makeup of the community is predominantly white (94.3%), with small percentages of African American (2.2%), Asian (1.2%), and Native American (0.7%) residents.
The median household income in Diamondale is $45,945, which is slightly lower than the state average of $48,411. The median age of residents is 38.7 years, which is slightly higher than the state average of 37.7 years.
The majority of residents (90.2%) are high school graduates or higher, and the unemployment rate is 4.2%, which is lower than the state average of 5.2%. The poverty rate is 11.2%, which is slightly higher than the state average of 10.7%.
Common Questions
What is Per Capita Income in Dimondale?
Per Capita income in Dimondale is $44,467.
What is the Median Family Income in Dimondale?
Median Family Income in Dimondale is $124,688.
What is the Median Household income in Dimondale?
Median Household Income in Dimondale is $112,500.
What is Income or Wage Gap in Dimondale?
Income or Wage Gap in Dimondale is 30.5%.
Women in Dimondale earn 69.5 cents for every dollar earned by a man.
What is Inequality or Gini Index in Dimondale?
Inequality or Gini Index in Dimondale is 0.35.
What is the Total Population of Dimondale?
Total Population of Dimondale is 1,619.
What is the Total Male Population of Dimondale?
Total Male Population of Dimondale is 704.
What is the Total Female Population of Dimondale?
Total Female Population of Dimondale is 915.
What is the Ratio of Males per 100 Females in Dimondale?
There are 76.94 Males per 100 Females in Dimondale.
What is the Ratio of Females per 100 Males in Dimondale?
There are 129.97 Females per 100 Males in Dimondale.
What is the Median Population Age in Dimondale?
Median Population Age in Dimondale is 42.3 Years.
What is the Average Family Size in Dimondale
Average Family Size in Dimondale is 3.2 People.
What is the Average Household Size in Dimondale
Average Household Size in Dimondale is 2.8 People.
How Large is the Labor Force in Dimondale?
There are 846 People in the Labor Forcein in Dimondale.
What is the Percentage of People in the Labor Force in Dimondale?
64.3% of People are in the Labor Force in Dimondale.
What is the Unemployment Rate in Dimondale?
Unemployment Rate in Dimondale is 2.0%.