Fremont, MI Map & Demographics
Fremont Map
Fremont Overview
$27,475
PER CAPITA INCOME
$69,403
AVG FAMILY INCOME
$53,125
AVG HOUSEHOLD INCOME
53.1%
WAGE / INCOME GAP [ % ]
46.9¢/ $1
WAGE / INCOME GAP [ $ ]
0.40
INEQUALITY / GINI INDEX
4,510
TOTAL POPULATION
1,891
MALE POPULATION
2,619
FEMALE POPULATION
72.20
MALES / 100 FEMALES
138.50
FEMALES / 100 MALES
37.9
MEDIAN AGE
3.4
AVG FAMILY SIZE
2.5
AVG HOUSEHOLD SIZE
2,050
LABOR FORCE [ PEOPLE ]
62.3%
PERCENT IN LABOR FORCE
3.2%
UNEMPLOYMENT RATE
Fremont Zip Codes
Fremont Area Codes
Income in Fremont
Income Overview in Fremont
Per Capita Income in Fremont is $27,475, while median incomes of families and households are $69,403 and $53,125 respectively.
| Characteristic | Number | Measure |
| Per Capita Income | 4,510 | $27,475 |
| Median Family Income | 1,054 | $69,403 |
| Mean Family Income | 1,054 | $78,291 |
| Median Household Income | 1,783 | $53,125 |
| Mean Household Income | 1,783 | $66,367 |
| Income Deficit | 1,054 | $0 |
| Wage / Income Gap (%) | 4,510 | 53.10% |
| Wage / Income Gap ($) | 4,510 | 46.90¢ per $1 |
| Gini / Inequality Index | 4,510 | 0.40 |
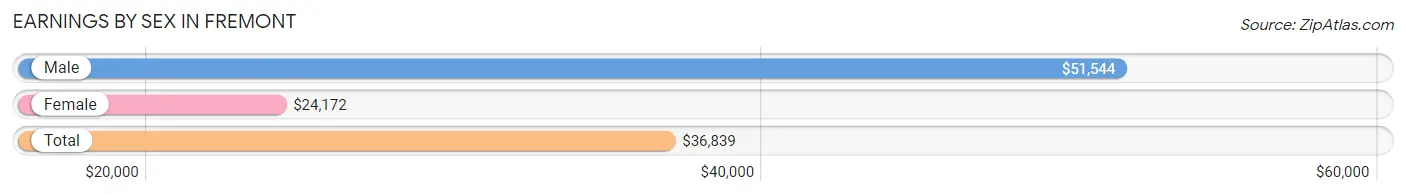
Earnings by Sex in Fremont
Average Earnings in Fremont are $36,839, $51,544 for men and $24,172 for women, a difference of 53.1%.
| Sex | Number | Average Earnings |
| Male | 907 (44.2%) | $51,544 |
| Female | 1,143 (55.8%) | $24,172 |
| Total | 2,050 (100.0%) | $36,839 |
Earnings by Sex by Income Bracket in Fremont
The most common earnings brackets in Fremont are $55,000 to $64,999 for men (155 | 17.1%) and $50,000 to $54,999 for women (133 | 11.6%).
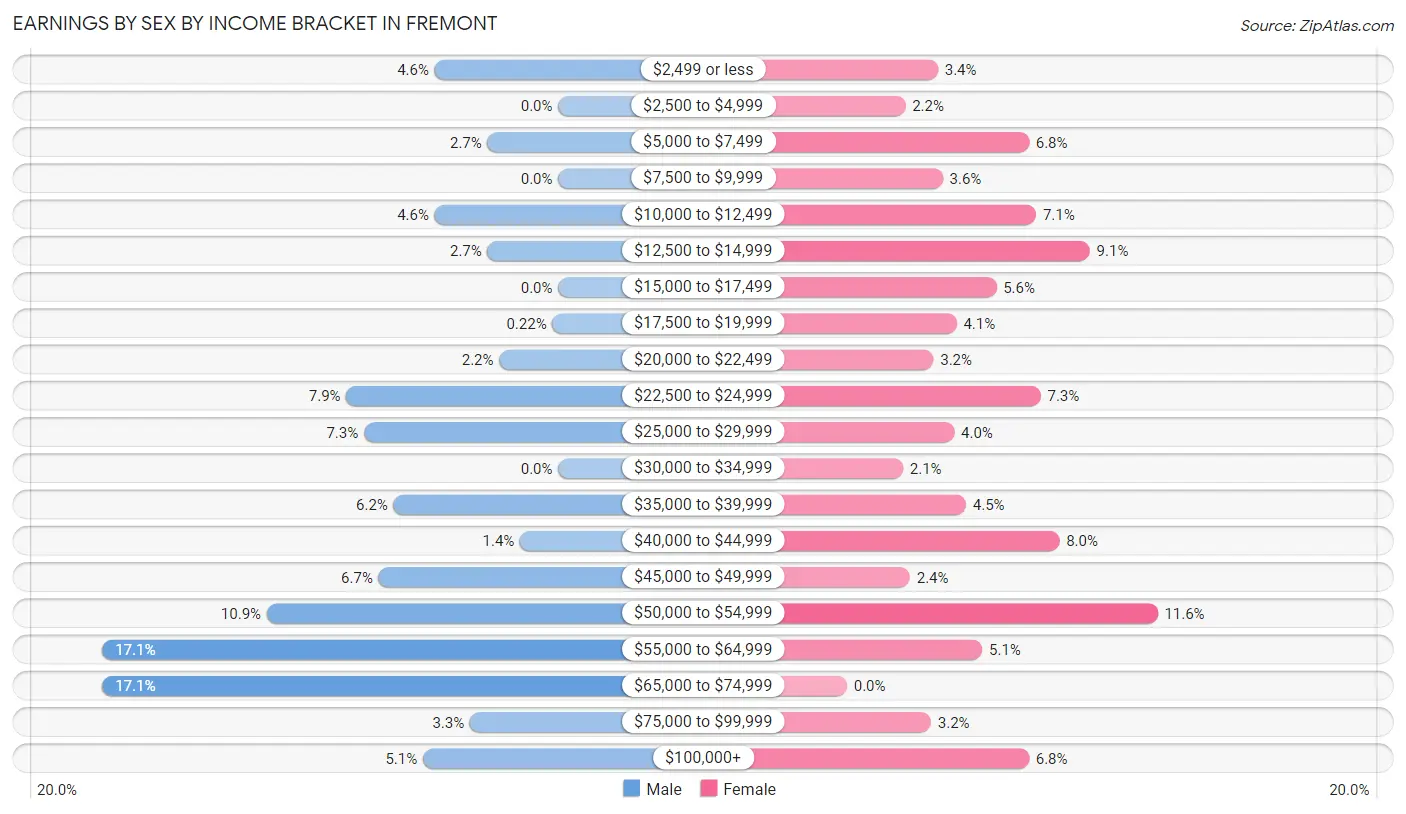
| Income | Male | Female |
| $2,499 or less | 42 (4.6%) | 39 (3.4%) |
| $2,500 to $4,999 | 0 (0.0%) | 25 (2.2%) |
| $5,000 to $7,499 | 24 (2.6%) | 78 (6.8%) |
| $7,500 to $9,999 | 0 (0.0%) | 41 (3.6%) |
| $10,000 to $12,499 | 42 (4.6%) | 81 (7.1%) |
| $12,500 to $14,999 | 24 (2.6%) | 104 (9.1%) |
| $15,000 to $17,499 | 0 (0.0%) | 64 (5.6%) |
| $17,500 to $19,999 | 2 (0.2%) | 47 (4.1%) |
| $20,000 to $22,499 | 20 (2.2%) | 37 (3.2%) |
| $22,500 to $24,999 | 72 (7.9%) | 83 (7.3%) |
| $25,000 to $29,999 | 66 (7.3%) | 46 (4.0%) |
| $30,000 to $34,999 | 0 (0.0%) | 24 (2.1%) |
| $35,000 to $39,999 | 56 (6.2%) | 51 (4.5%) |
| $40,000 to $44,999 | 13 (1.4%) | 91 (8.0%) |
| $45,000 to $49,999 | 61 (6.7%) | 27 (2.4%) |
| $50,000 to $54,999 | 99 (10.9%) | 133 (11.6%) |
| $55,000 to $64,999 | 155 (17.1%) | 58 (5.1%) |
| $65,000 to $74,999 | 155 (17.1%) | 0 (0.0%) |
| $75,000 to $99,999 | 30 (3.3%) | 36 (3.2%) |
| $100,000+ | 46 (5.1%) | 78 (6.8%) |
| Total | 907 (100.0%) | 1,143 (100.0%) |
Earnings by Sex by Educational Attainment in Fremont
Average earnings in Fremont are $53,594 for men and $35,260 for women, a difference of 34.2%. Men with an educational attainment of graduate degree enjoy the highest average annual earnings of $66,855, while those with college or associate's degree education earn the least with $42,692. Women with an educational attainment of graduate degree earn the most with the average annual earnings of $77,609, while those with high school diploma education have the smallest earnings of $23,844.
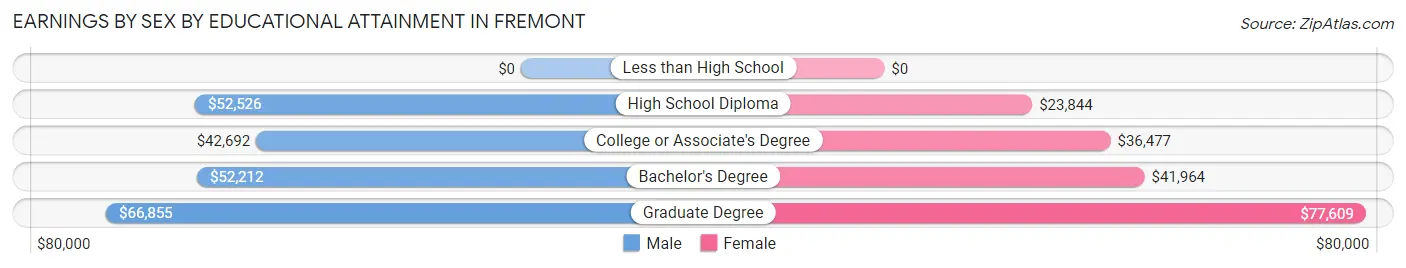
| Educational Attainment | Male Income | Female Income |
| Less than High School | - | - |
| High School Diploma | $52,526 | $23,844 |
| College or Associate's Degree | $42,692 | $36,477 |
| Bachelor's Degree | $52,212 | $41,964 |
| Graduate Degree | $66,855 | $77,609 |
| Total | $53,594 | $35,260 |
Family Income in Fremont
Family Income Brackets in Fremont
According to the Fremont family income data, there are 229 families falling into the $100,000 to $149,999 income range, which is the most common income bracket and makes up 21.7% of all families.
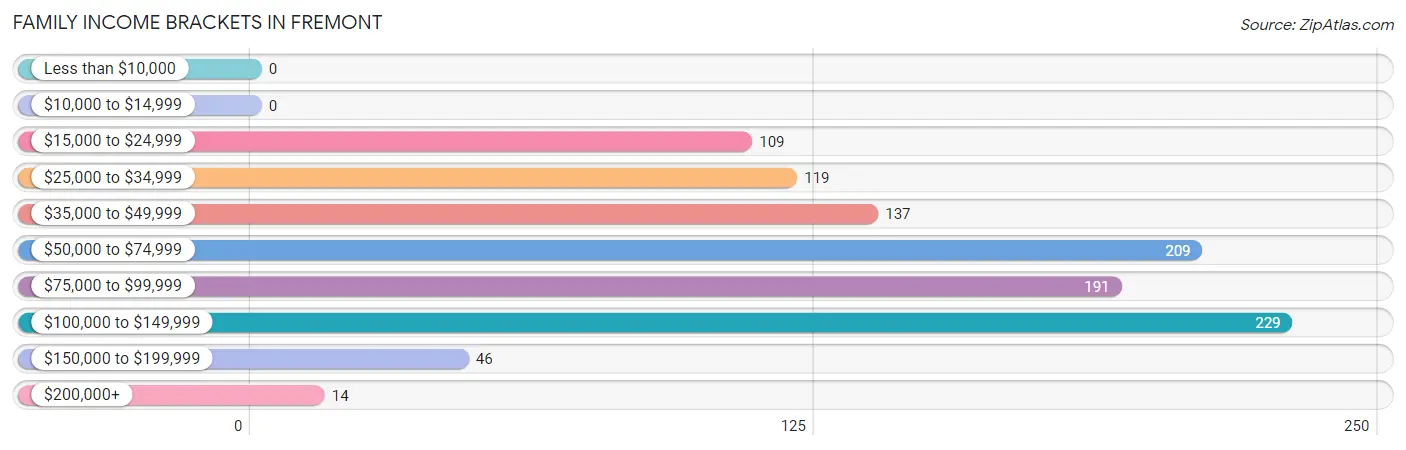
| Income Bracket | # Families | % Families |
| Less than $10,000 | 0 | 0.0% |
| $10,000 to $14,999 | 0 | 0.0% |
| $15,000 to $24,999 | 109 | 10.3% |
| $25,000 to $34,999 | 119 | 11.3% |
| $35,000 to $49,999 | 137 | 13.0% |
| $50,000 to $74,999 | 209 | 19.8% |
| $75,000 to $99,999 | 191 | 18.1% |
| $100,000 to $149,999 | 229 | 21.7% |
| $150,000 to $199,999 | 46 | 4.4% |
| $200,000+ | 14 | 1.3% |
Family Income by Famaliy Size in Fremont
4-person families (170 | 16.1%) account for the highest median family income in Fremont with $120,960 per family, while 2-person families (484 | 45.9%) have the highest median income of $32,188 per family member.
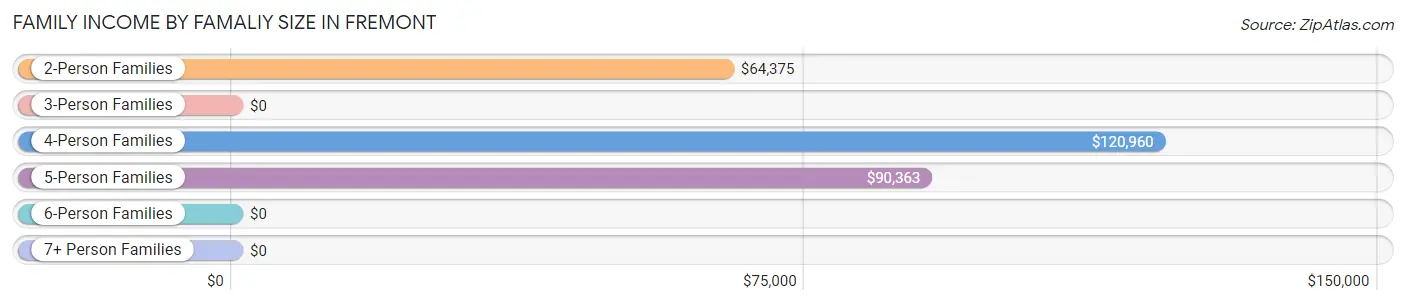
| Income Bracket | # Families | Median Income |
| 2-Person Families | 484 (45.9%) | $64,375 |
| 3-Person Families | 191 (18.1%) | $0 |
| 4-Person Families | 170 (16.1%) | $120,960 |
| 5-Person Families | 93 (8.8%) | $90,363 |
| 6-Person Families | 49 (4.6%) | $0 |
| 7+ Person Families | 67 (6.4%) | $0 |
| Total | 1,054 (100.0%) | $69,403 |
Family Income by Number of Earners in Fremont
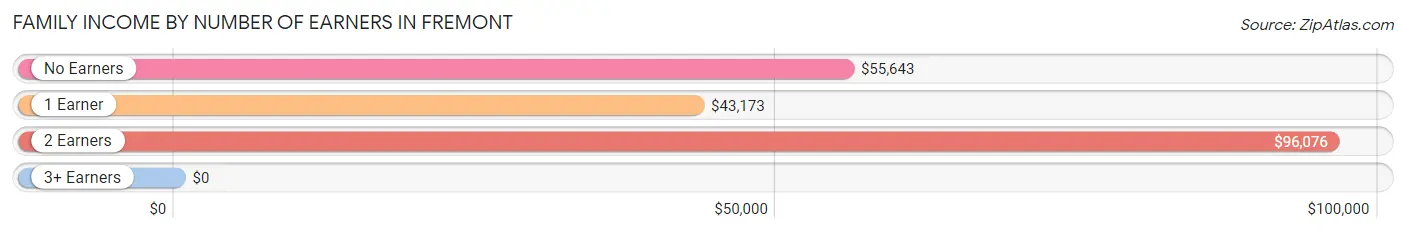
| Number of Earners | # Families | Median Income |
| No Earners | 214 (20.3%) | $55,643 |
| 1 Earner | 318 (30.2%) | $43,173 |
| 2 Earners | 465 (44.1%) | $96,076 |
| 3+ Earners | 57 (5.4%) | $0 |
| Total | 1,054 (100.0%) | $69,403 |
Household Income in Fremont
Household Income Brackets in Fremont
With 333 households falling in the category, the $100,000 to $149,999 income range is the most frequent in Fremont, accounting for 18.7% of all households. In contrast, only 14 households (0.8%) fall into the $200,000+ income bracket, making it the least populous group.
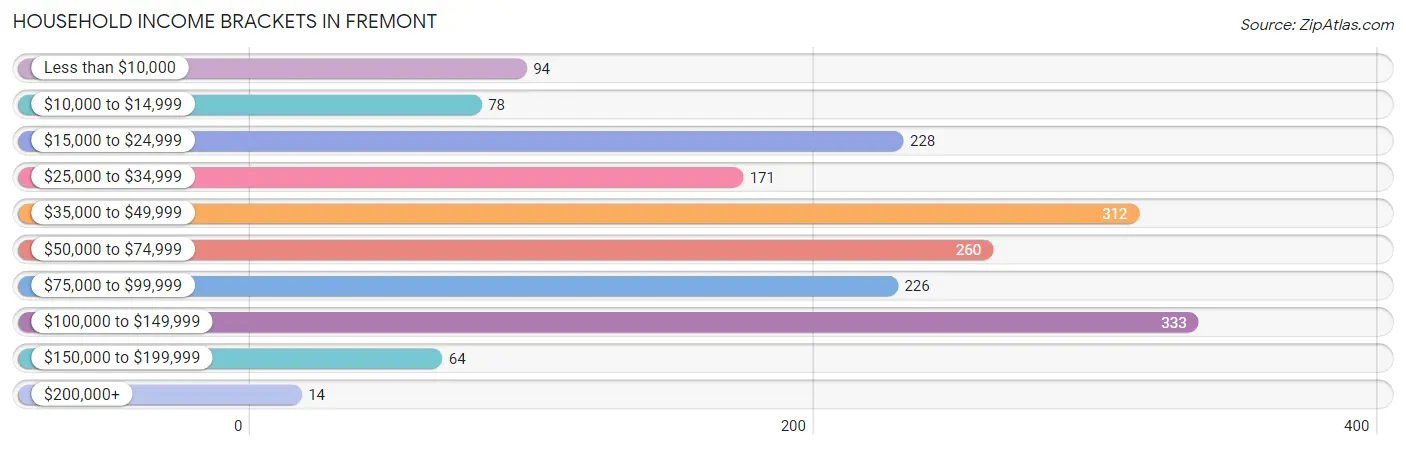
| Income Bracket | # Households | % Households |
| Less than $10,000 | 94 | 5.3% |
| $10,000 to $14,999 | 78 | 4.4% |
| $15,000 to $24,999 | 228 | 12.8% |
| $25,000 to $34,999 | 171 | 9.6% |
| $35,000 to $49,999 | 312 | 17.5% |
| $50,000 to $74,999 | 260 | 14.6% |
| $75,000 to $99,999 | 226 | 12.7% |
| $100,000 to $149,999 | 333 | 18.7% |
| $150,000 to $199,999 | 64 | 3.6% |
| $200,000+ | 14 | 0.8% |
Household Income by Householder Age in Fremont
The median household income in Fremont is $53,125, with the highest median household income of $76,367 found in the 25 to 44 years age bracket for the primary householder. A total of 641 households (35.9%) fall into this category. Meanwhile, the 45 to 64 years age bracket for the primary householder has the lowest median household income of $40,000, with 378 households (21.2%) in this group.
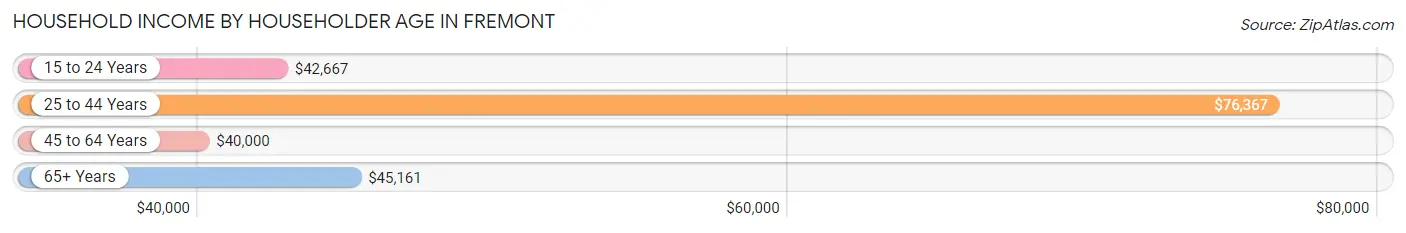
| Income Bracket | # Households | Median Income |
| 15 to 24 Years | 64 (3.6%) | $42,667 |
| 25 to 44 Years | 641 (35.9%) | $76,367 |
| 45 to 64 Years | 378 (21.2%) | $40,000 |
| 65+ Years | 700 (39.3%) | $45,161 |
| Total | 1,783 (100.0%) | $53,125 |
Poverty in Fremont
Income Below Poverty by Sex and Age in Fremont
With 13.9% poverty level for males and 24.9% for females among the residents of Fremont, 5 year old males and 12 to 14 year old females are the most vulnerable to poverty, with 35 males (100.0%) and 210 females (82.0%) in their respective age groups living below the poverty level.
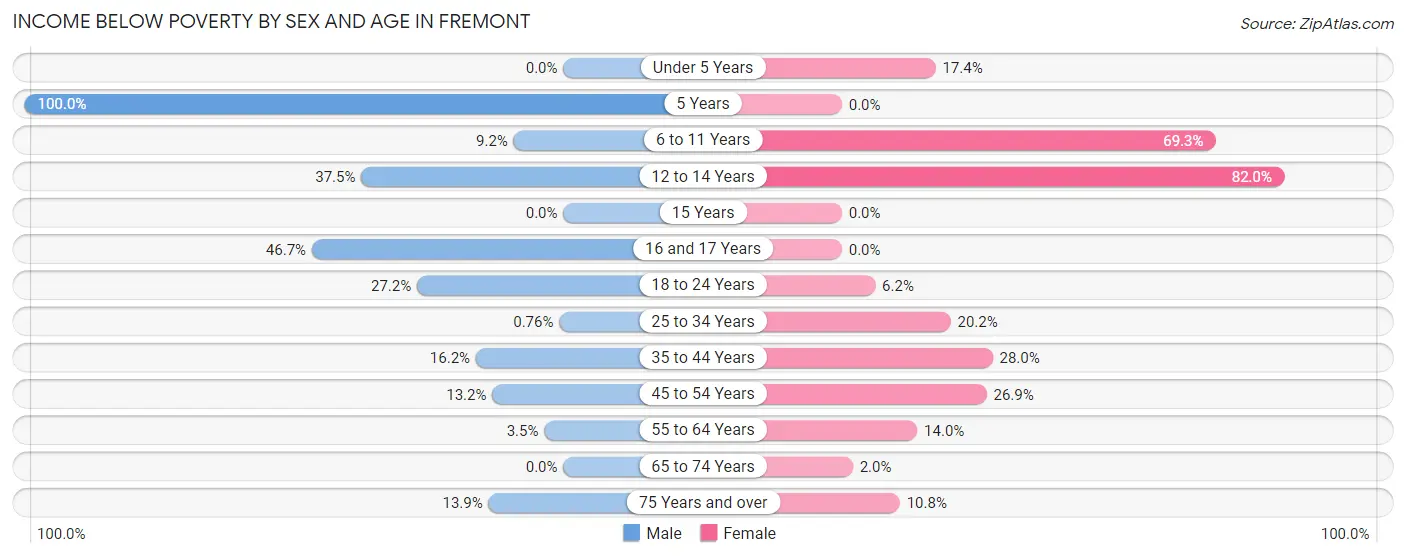
| Age Bracket | Male | Female |
| Under 5 Years | 0 (0.0%) | 36 (17.4%) |
| 5 Years | 35 (100.0%) | 0 (0.0%) |
| 6 to 11 Years | 19 (9.2%) | 104 (69.3%) |
| 12 to 14 Years | 39 (37.5%) | 210 (82.0%) |
| 15 Years | 0 (0.0%) | 0 (0.0%) |
| 16 and 17 Years | 28 (46.7%) | 0 (0.0%) |
| 18 to 24 Years | 22 (27.2%) | 13 (6.2%) |
| 25 to 34 Years | 1 (0.8%) | 46 (20.2%) |
| 35 to 44 Years | 62 (16.2%) | 115 (28.0%) |
| 45 to 54 Years | 24 (13.2%) | 61 (26.9%) |
| 55 to 64 Years | 3 (3.5%) | 27 (14.0%) |
| 65 to 74 Years | 0 (0.0%) | 5 (2.0%) |
| 75 Years and over | 25 (13.9%) | 36 (10.7%) |
| Total | 258 (13.9%) | 653 (24.9%) |
Income Above Poverty by Sex and Age in Fremont
According to the poverty statistics in Fremont, males aged under 5 years and females aged 5 years are the age groups that are most secure financially, with 100.0% of males and 100.0% of females in these age groups living above the poverty line.
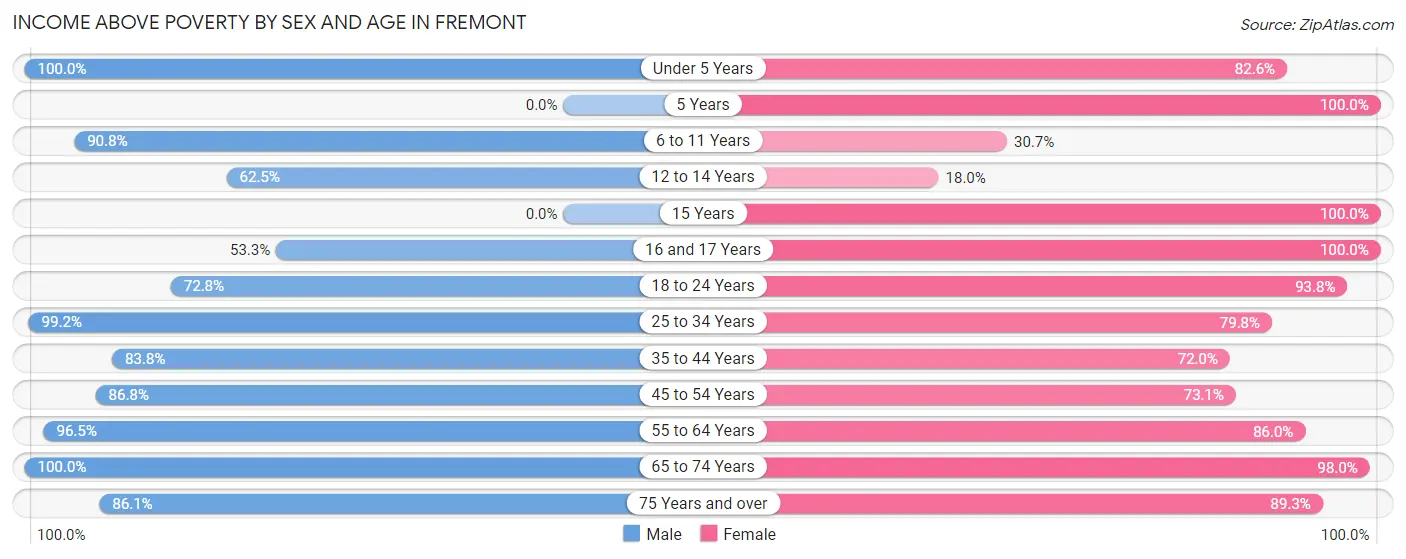
| Age Bracket | Male | Female |
| Under 5 Years | 135 (100.0%) | 171 (82.6%) |
| 5 Years | 0 (0.0%) | 29 (100.0%) |
| 6 to 11 Years | 187 (90.8%) | 46 (30.7%) |
| 12 to 14 Years | 65 (62.5%) | 46 (18.0%) |
| 15 Years | 0 (0.0%) | 98 (100.0%) |
| 16 and 17 Years | 32 (53.3%) | 29 (100.0%) |
| 18 to 24 Years | 59 (72.8%) | 197 (93.8%) |
| 25 to 34 Years | 131 (99.2%) | 182 (79.8%) |
| 35 to 44 Years | 320 (83.8%) | 296 (72.0%) |
| 45 to 54 Years | 158 (86.8%) | 166 (73.1%) |
| 55 to 64 Years | 82 (96.5%) | 166 (86.0%) |
| 65 to 74 Years | 280 (100.0%) | 241 (98.0%) |
| 75 Years and over | 155 (86.1%) | 299 (89.2%) |
| Total | 1,604 (86.1%) | 1,966 (75.1%) |
Income Below Poverty Among Married-Couple Families in Fremont
The poverty statistics for married-couple families in Fremont show that 8.1% or 67 of the total 826 families live below the poverty line. Families with 5 or more children have the highest poverty rate of 100.0%, comprising of 67 families. On the other hand, families with no children have the lowest poverty rate of 0.0%, which includes 0 families.
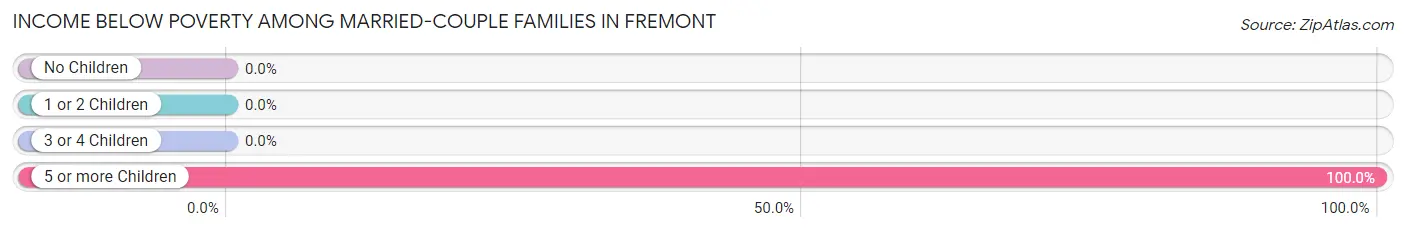
| Children | Above Poverty | Below Poverty |
| No Children | 414 (100.0%) | 0 (0.0%) |
| 1 or 2 Children | 276 (100.0%) | 0 (0.0%) |
| 3 or 4 Children | 69 (100.0%) | 0 (0.0%) |
| 5 or more Children | 0 (0.0%) | 67 (100.0%) |
| Total | 759 (91.9%) | 67 (8.1%) |
Income Below Poverty Among Single-Parent Households in Fremont
According to the poverty data in Fremont, 49.0% or 24 single-father households and 38.6% or 69 single-mother households are living below the poverty line. Among single-father households, those with 1 or 2 children have the highest poverty rate, with 24 households (100.0%) experiencing poverty. Likewise, among single-mother households, those with 1 or 2 children have the highest poverty rate, with 69 households (48.6%) falling below the poverty line.
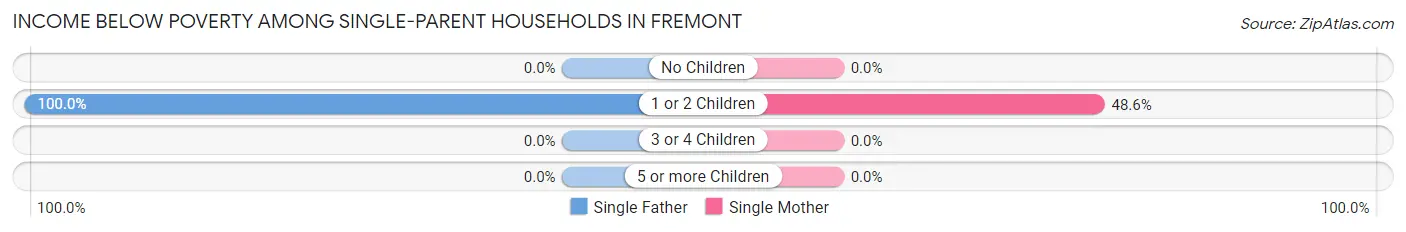
| Children | Single Father | Single Mother |
| No Children | 0 (0.0%) | 0 (0.0%) |
| 1 or 2 Children | 24 (100.0%) | 69 (48.6%) |
| 3 or 4 Children | 0 (0.0%) | 0 (0.0%) |
| 5 or more Children | 0 (0.0%) | 0 (0.0%) |
| Total | 24 (49.0%) | 69 (38.6%) |
Income Below Poverty Among Married-Couple vs Single-Parent Households in Fremont
The poverty data for Fremont shows that 67 of the married-couple family households (8.1%) and 93 of the single-parent households (40.8%) are living below the poverty level. Within the married-couple family households, those with 5 or more children have the highest poverty rate, with 67 households (100.0%) falling below the poverty line. Among the single-parent households, those with 1 or 2 children have the highest poverty rate, with 93 household (56.0%) living below poverty.
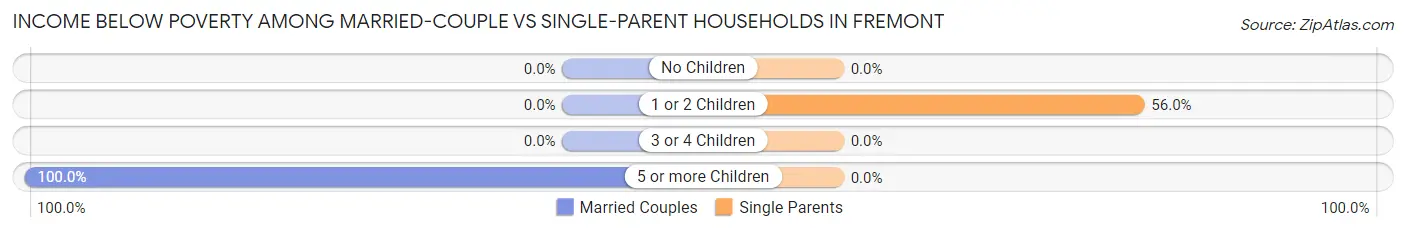
| Children | Married-Couple Families | Single-Parent Households |
| No Children | 0 (0.0%) | 0 (0.0%) |
| 1 or 2 Children | 0 (0.0%) | 93 (56.0%) |
| 3 or 4 Children | 0 (0.0%) | 0 (0.0%) |
| 5 or more Children | 67 (100.0%) | 0 (0.0%) |
| Total | 67 (8.1%) | 93 (40.8%) |
Race in Fremont
The most populous races in Fremont are White / Caucasian (4,282 | 94.9%), Two or more Races (226 | 5.0%), and Hispanic or Latino (107 | 2.4%).
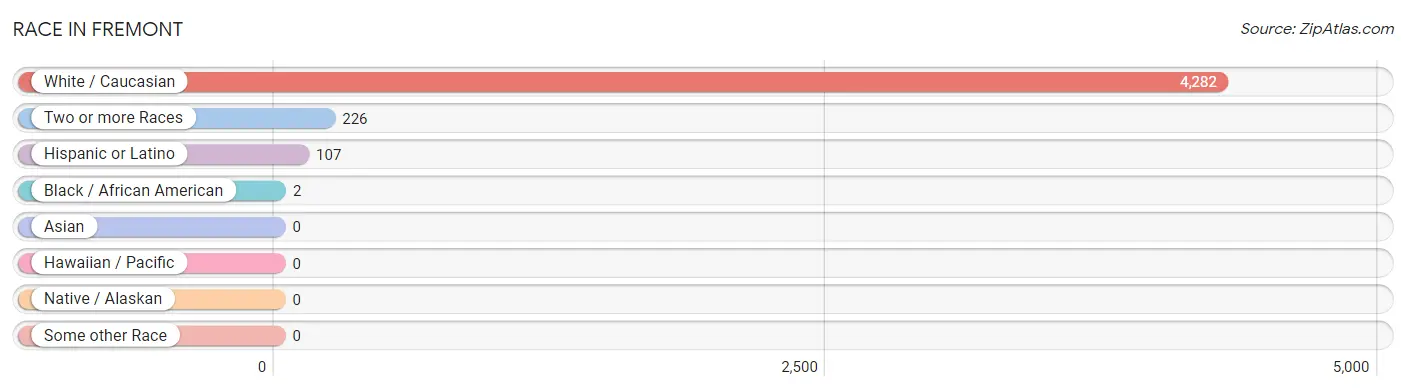
| Race | # Population | % Population |
| Asian | 0 | 0.0% |
| Black / African American | 2 | 0.0% |
| Hawaiian / Pacific | 0 | 0.0% |
| Hispanic or Latino | 107 | 2.4% |
| Native / Alaskan | 0 | 0.0% |
| White / Caucasian | 4,282 | 94.9% |
| Two or more Races | 226 | 5.0% |
| Some other Race | 0 | 0.0% |
| Total | 4,510 | 100.0% |
Ancestry in Fremont
The most populous ancestries reported in Fremont are American (826 | 18.3%), German (607 | 13.5%), Dutch (603 | 13.4%), Irish (371 | 8.2%), and English (314 | 7.0%), together accounting for 60.3% of all Fremont residents.
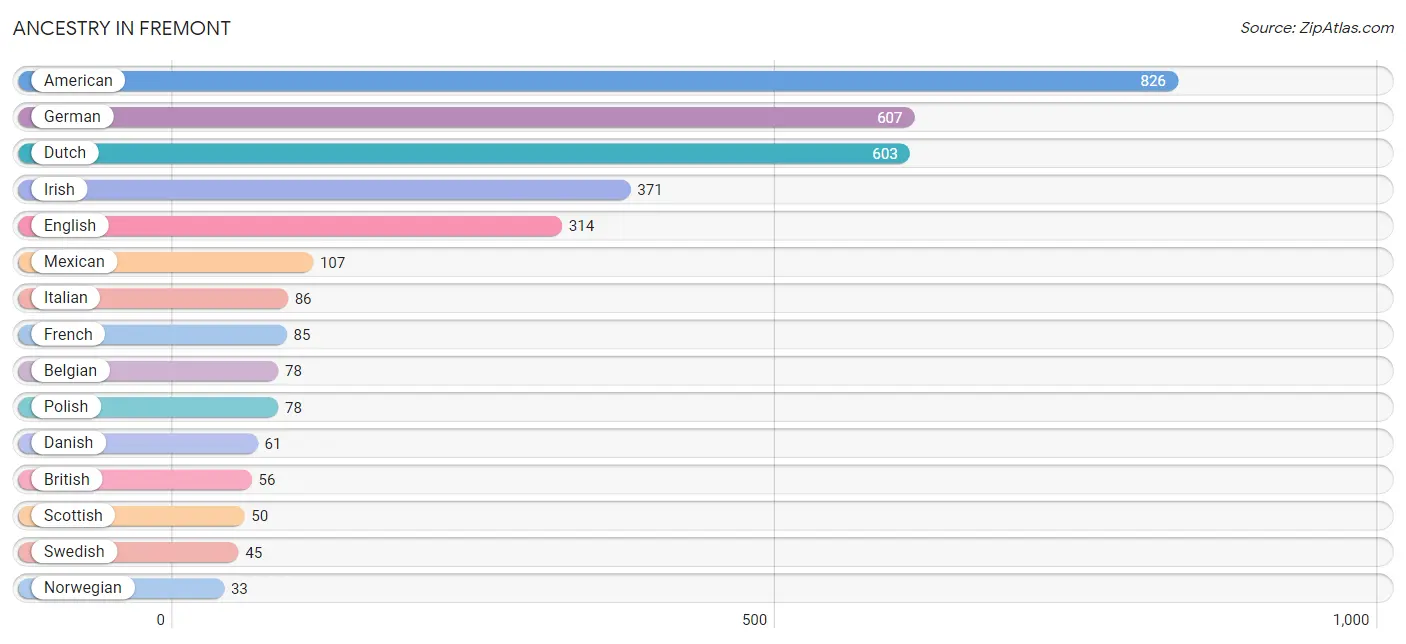
| Ancestry | # Population | % Population |
| American | 826 | 18.3% |
| Arab | 17 | 0.4% |
| Belgian | 78 | 1.7% |
| British | 56 | 1.2% |
| Chippewa | 25 | 0.5% |
| Danish | 61 | 1.3% |
| Dutch | 603 | 13.4% |
| English | 314 | 7.0% |
| French | 85 | 1.9% |
| French Canadian | 31 | 0.7% |
| German | 607 | 13.5% |
| Greek | 13 | 0.3% |
| Irish | 371 | 8.2% |
| Italian | 86 | 1.9% |
| Mexican | 107 | 2.4% |
| Norwegian | 33 | 0.7% |
| Pennsylvania German | 14 | 0.3% |
| Polish | 78 | 1.7% |
| Scotch-Irish | 31 | 0.7% |
| Scottish | 50 | 1.1% |
| Swedish | 45 | 1.0% | View All 21 Rows |
Immigrants in Fremont
The most numerous immigrant groups reported in Fremont came from Central America (48 | 1.1%), Latin America (48 | 1.1%), Mexico (48 | 1.1%), Europe (32 | 0.7%), and Germany (19 | 0.4%), together accounting for 4.3% of all Fremont residents.
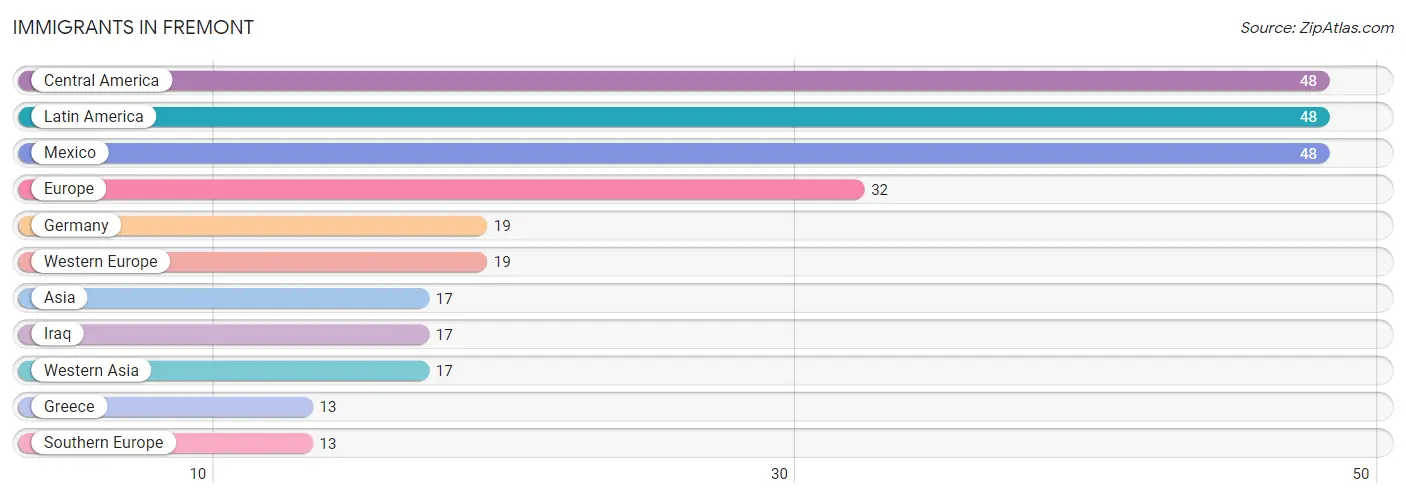
| Immigration Origin | # Population | % Population |
| Asia | 17 | 0.4% |
| Central America | 48 | 1.1% |
| Europe | 32 | 0.7% |
| Germany | 19 | 0.4% |
| Greece | 13 | 0.3% |
| Iraq | 17 | 0.4% |
| Latin America | 48 | 1.1% |
| Mexico | 48 | 1.1% |
| Southern Europe | 13 | 0.3% |
| Western Asia | 17 | 0.4% |
| Western Europe | 19 | 0.4% | View All 11 Rows |
Sex and Age in Fremont
Sex and Age in Fremont
The most populous age groups in Fremont are 10 to 14 Years (231 | 12.2%) for men and 10 to 14 Years (360 | 13.8%) for women.
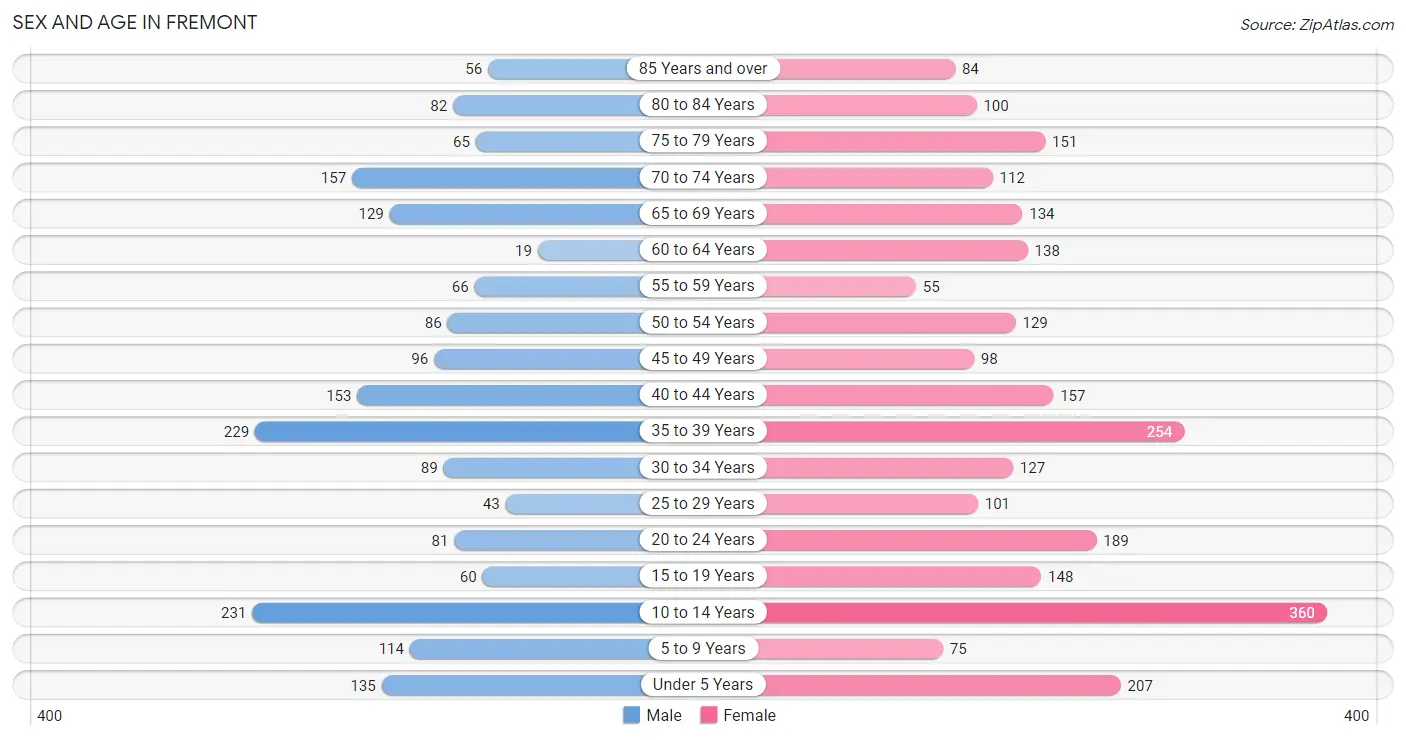
| Age Bracket | Male | Female |
| Under 5 Years | 135 (7.1%) | 207 (7.9%) |
| 5 to 9 Years | 114 (6.0%) | 75 (2.9%) |
| 10 to 14 Years | 231 (12.2%) | 360 (13.8%) |
| 15 to 19 Years | 60 (3.2%) | 148 (5.7%) |
| 20 to 24 Years | 81 (4.3%) | 189 (7.2%) |
| 25 to 29 Years | 43 (2.3%) | 101 (3.9%) |
| 30 to 34 Years | 89 (4.7%) | 127 (4.9%) |
| 35 to 39 Years | 229 (12.1%) | 254 (9.7%) |
| 40 to 44 Years | 153 (8.1%) | 157 (6.0%) |
| 45 to 49 Years | 96 (5.1%) | 98 (3.7%) |
| 50 to 54 Years | 86 (4.5%) | 129 (4.9%) |
| 55 to 59 Years | 66 (3.5%) | 55 (2.1%) |
| 60 to 64 Years | 19 (1.0%) | 138 (5.3%) |
| 65 to 69 Years | 129 (6.8%) | 134 (5.1%) |
| 70 to 74 Years | 157 (8.3%) | 112 (4.3%) |
| 75 to 79 Years | 65 (3.4%) | 151 (5.8%) |
| 80 to 84 Years | 82 (4.3%) | 100 (3.8%) |
| 85 Years and over | 56 (3.0%) | 84 (3.2%) |
| Total | 1,891 (100.0%) | 2,619 (100.0%) |
Families and Households in Fremont
Median Family Size in Fremont
The median family size in Fremont is 3.37 persons per family, with single male/father families (49 | 4.6%) accounting for the largest median family size of 3.59 persons per family. On the other hand, single female/mother families (179 | 17.0%) represent the smallest median family size with 2.51 persons per family.
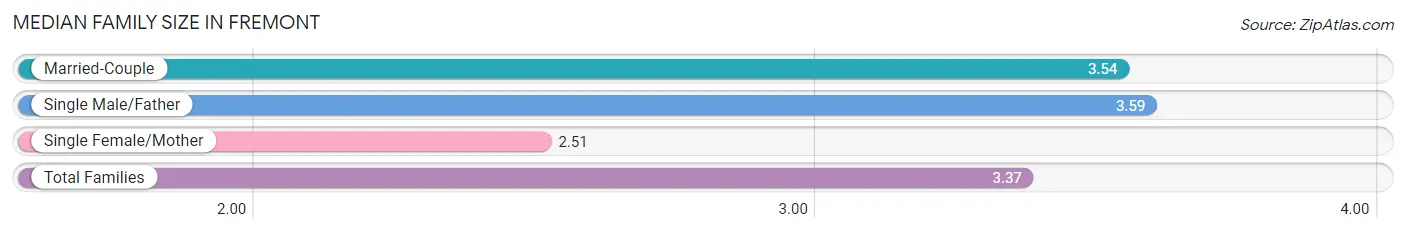
| Family Type | # Families | Family Size |
| Married-Couple | 826 (78.4%) | 3.54 |
| Single Male/Father | 49 (4.6%) | 3.59 |
| Single Female/Mother | 179 (17.0%) | 2.51 |
| Total Families | 1,054 (100.0%) | 3.37 |
Median Household Size in Fremont
The median household size in Fremont is 2.51 persons per household, with single male/father households (49 | 2.8%) accounting for the largest median household size of 3.92 persons per household. non-family households (729 | 40.9%) represent the smallest median household size with 1.16 persons per household.
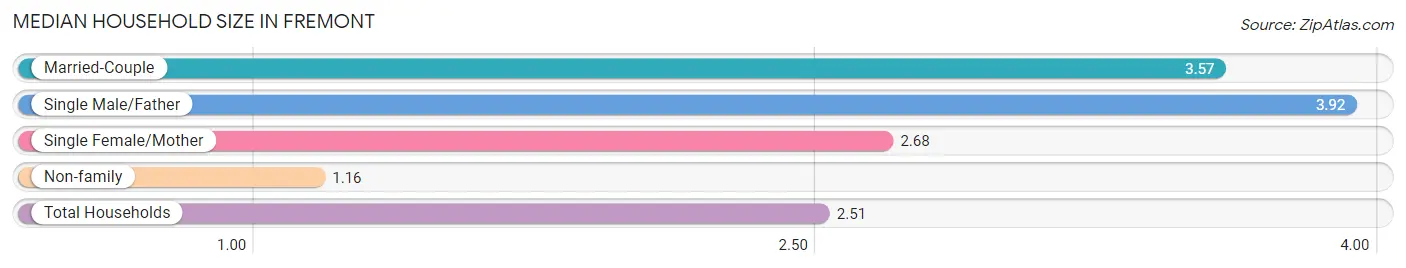
| Household Type | # Households | Household Size |
| Married-Couple | 826 (46.3%) | 3.57 |
| Single Male/Father | 49 (2.8%) | 3.92 |
| Single Female/Mother | 179 (10.0%) | 2.68 |
| Non-family | 729 (40.9%) | 1.16 |
| Total Households | 1,783 (100.0%) | 2.51 |
Household Size by Marriage Status in Fremont
Out of a total of 1,783 households in Fremont, 1,054 (59.1%) are family households, while 729 (40.9%) are nonfamily households. The most numerous type of family households are 2-person households, comprising 428, and the most common type of nonfamily households are 1-person households, comprising 623.
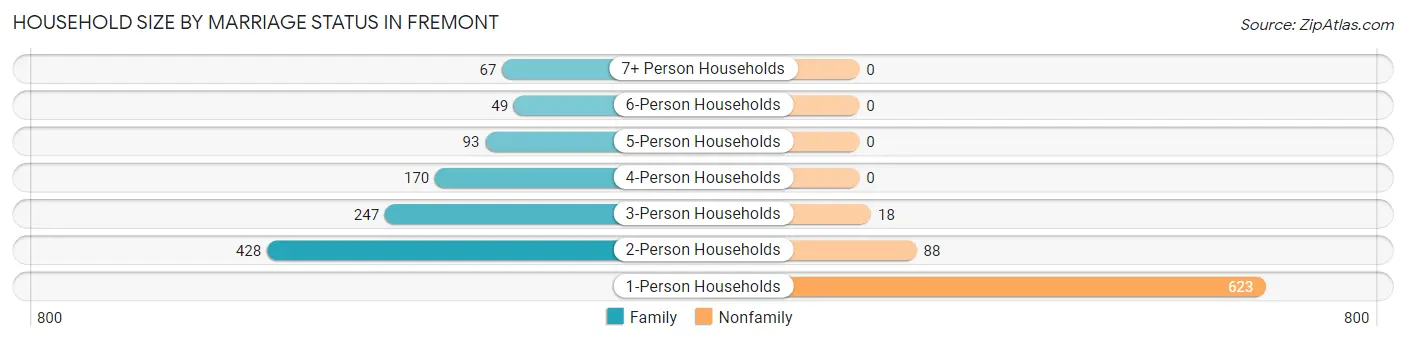
| Household Size | Family Households | Nonfamily Households |
| 1-Person Households | - | 623 (34.9%) |
| 2-Person Households | 428 (24.0%) | 88 (4.9%) |
| 3-Person Households | 247 (13.9%) | 18 (1.0%) |
| 4-Person Households | 170 (9.5%) | 0 (0.0%) |
| 5-Person Households | 93 (5.2%) | 0 (0.0%) |
| 6-Person Households | 49 (2.8%) | 0 (0.0%) |
| 7+ Person Households | 67 (3.8%) | 0 (0.0%) |
| Total | 1,054 (59.1%) | 729 (40.9%) |
Female Fertility in Fremont
Fertility by Age in Fremont
Average fertility rate in Fremont is 148.0 births per 1,000 women. Women in the age bracket of 35 to 50 years have the highest fertility rate with 222.0 births per 1,000 women. Women in the age bracket of 35 to 50 years acount for 72.2% of all women with births.
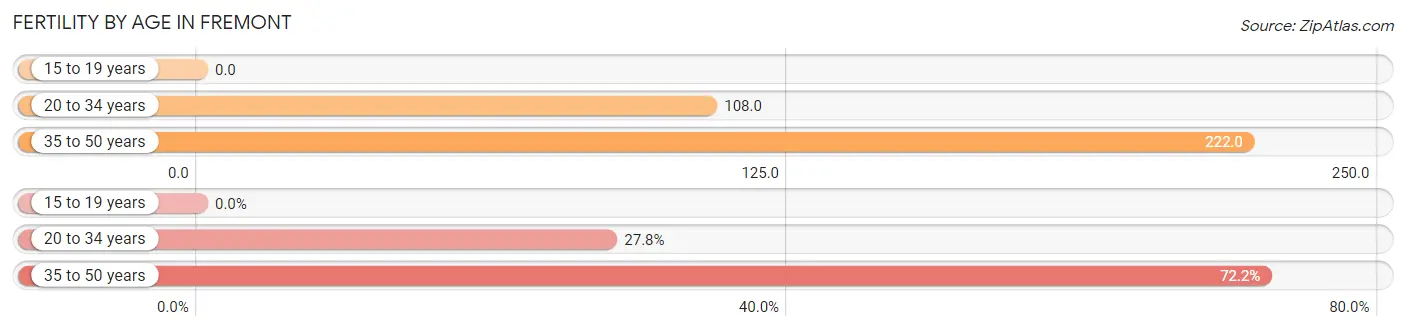
| Age Bracket | Women with Births | Births / 1,000 Women |
| 15 to 19 years | 0 (0.0%) | 0.0 |
| 20 to 34 years | 45 (27.8%) | 108.0 |
| 35 to 50 years | 117 (72.2%) | 222.0 |
| Total | 162 (100.0%) | 148.0 |
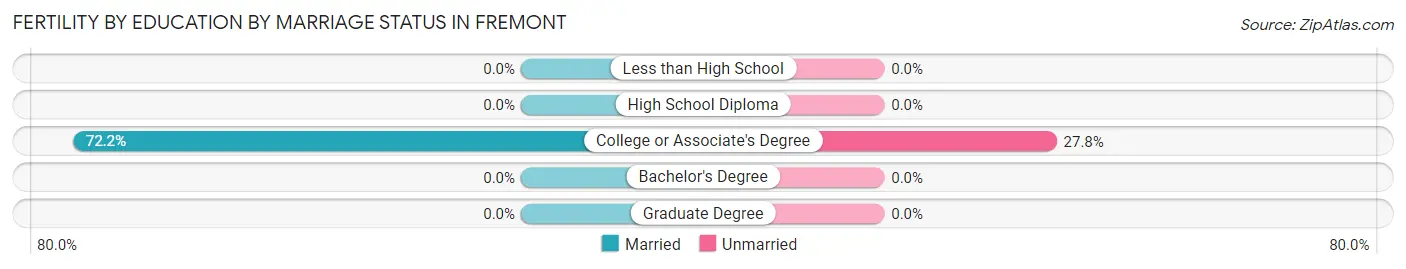
Fertility by Age by Marriage Status in Fremont
72.2% of women with births (162) in Fremont are married. The highest percentage of unmarried women with births falls into 20 to 34 years age bracket with 100.0% of them unmarried at the time of birth, while the lowest percentage of unmarried women with births belong to 35 to 50 years age bracket with 0.0% of them unmarried.
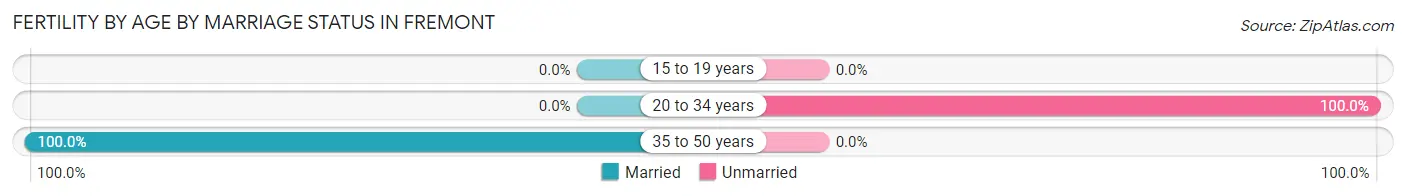
| Age Bracket | Married | Unmarried |
| 15 to 19 years | 0 (0.0%) | 0 (0.0%) |
| 20 to 34 years | 0 (0.0%) | 45 (100.0%) |
| 35 to 50 years | 117 (100.0%) | 0 (0.0%) |
| Total | 117 (72.2%) | 45 (27.8%) |
Fertility by Education in Fremont
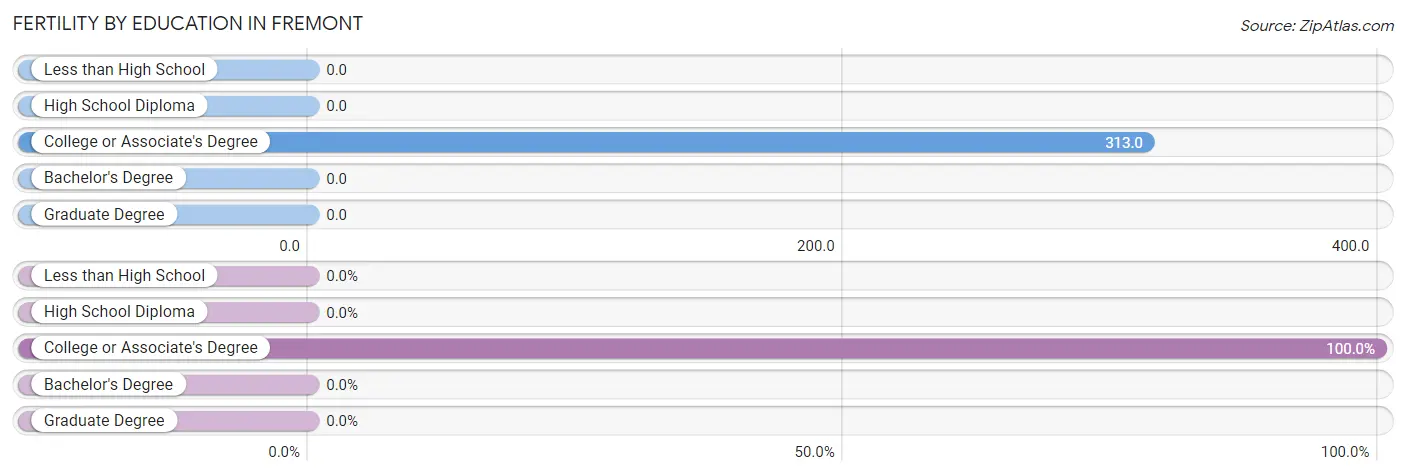
| Educational Attainment | Women with Births | Births / 1,000 Women |
| Less than High School | 0 (0.0%) | 0.0 |
| High School Diploma | 0 (0.0%) | 0.0 |
| College or Associate's Degree | 162 (100.0%) | 313.0 |
| Bachelor's Degree | 0 (0.0%) | 0.0 |
| Graduate Degree | 0 (0.0%) | 0.0 |
| Total | 162 (100.0%) | 148.0 |
Fertility by Education by Marriage Status in Fremont
27.8% of women with births in Fremont are unmarried. Women with the educational attainment of college or associate's degree are most likely to be married with 72.2% of them married at childbirth, while women with the educational attainment of college or associate's degree are least likely to be married with 27.8% of them unmarried at childbirth.
| Educational Attainment | Married | Unmarried |
| Less than High School | 0 (0.0%) | 0 (0.0%) |
| High School Diploma | 0 (0.0%) | 0 (0.0%) |
| College or Associate's Degree | 117 (72.2%) | 45 (27.8%) |
| Bachelor's Degree | 0 (0.0%) | 0 (0.0%) |
| Graduate Degree | 0 (0.0%) | 0 (0.0%) |
| Total | 117 (72.2%) | 45 (27.8%) |
Employment Characteristics in Fremont
Employment by Class of Employer in Fremont
Among the 1,986 employed individuals in Fremont, private company employees (1,447 | 72.9%), self-employed (not incorporated) (204 | 10.3%), and not-for-profit organizations (147 | 7.4%) make up the most common classes of employment.
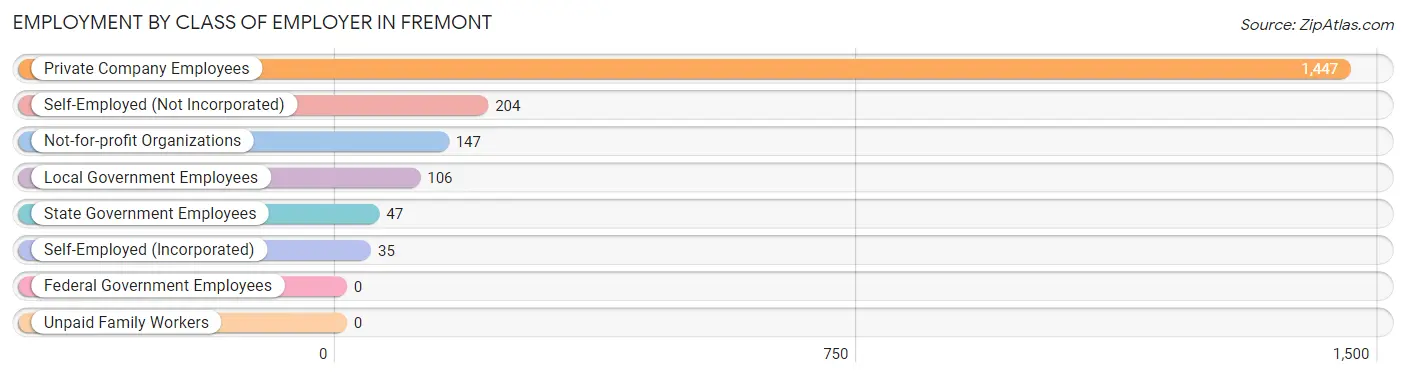
| Employer Class | # Employees | % Employees |
| Private Company Employees | 1,447 | 72.9% |
| Self-Employed (Incorporated) | 35 | 1.8% |
| Self-Employed (Not Incorporated) | 204 | 10.3% |
| Not-for-profit Organizations | 147 | 7.4% |
| Local Government Employees | 106 | 5.3% |
| State Government Employees | 47 | 2.4% |
| Federal Government Employees | 0 | 0.0% |
| Unpaid Family Workers | 0 | 0.0% |
| Total | 1,986 | 100.0% |
Employment Status by Age in Fremont
According to the labor force statistics for Fremont, out of the total population over 16 years of age (3,290), 62.3% or 2,050 individuals are in the labor force, with 3.2% or 66 of them unemployed. The age group with the highest labor force participation rate is 25 to 29 years, with 100.0% or 144 individuals in the labor force. Within the labor force, the 45 to 54 years age range has the highest percentage of unemployed individuals, with 15.4% or 57 of them being unemployed.
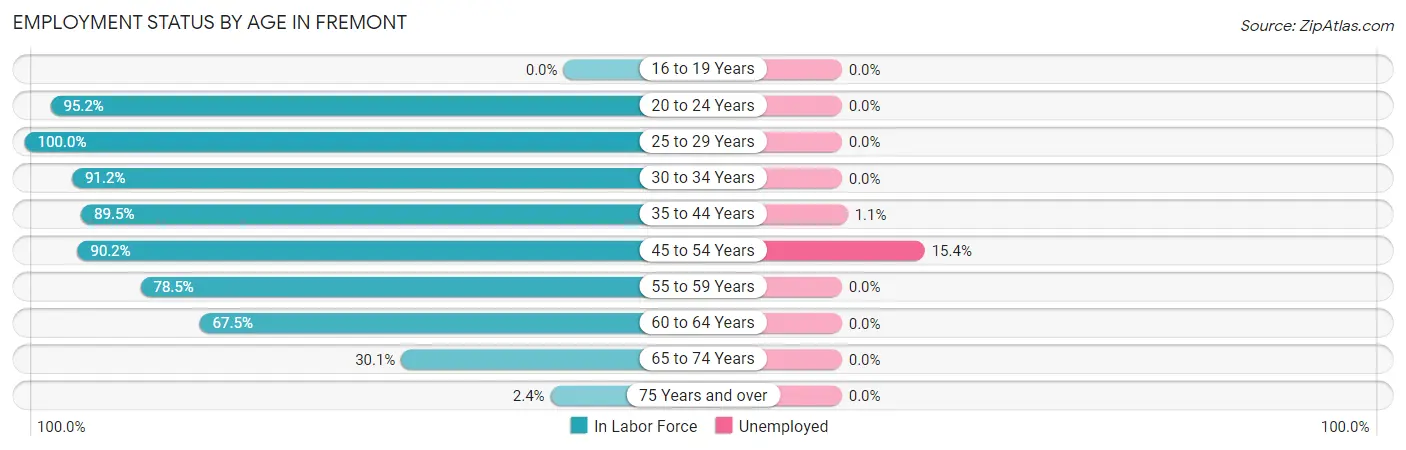
| Age Bracket | In Labor Force | Unemployed |
| 16 to 19 Years | 0 (0.0%) | 0 (0.0%) |
| 20 to 24 Years | 257 (95.2%) | 0 (0.0%) |
| 25 to 29 Years | 144 (100.0%) | 0 (0.0%) |
| 30 to 34 Years | 197 (91.2%) | 0 (0.0%) |
| 35 to 44 Years | 710 (89.5%) | 8 (1.1%) |
| 45 to 54 Years | 369 (90.2%) | 57 (15.4%) |
| 55 to 59 Years | 95 (78.5%) | 0 (0.0%) |
| 60 to 64 Years | 106 (67.5%) | 0 (0.0%) |
| 65 to 74 Years | 160 (30.1%) | 0 (0.0%) |
| 75 Years and over | 13 (2.4%) | 0 (0.0%) |
| Total | 2,050 (62.3%) | 66 (3.2%) |
Employment Status by Educational Attainment in Fremont
According to labor force statistics for Fremont, 88.1% of individuals (1,621) out of the total population between 25 and 64 years of age (1,840) are in the labor force, with 4.0% or 65 of them being unemployed. The group with the highest labor force participation rate are those with the educational attainment of bachelor's degree or higher, with 97.7% or 517 individuals in the labor force. Within the labor force, individuals with high school diploma education have the highest percentage of unemployment, with 6.1% or 30 of them being unemployed.
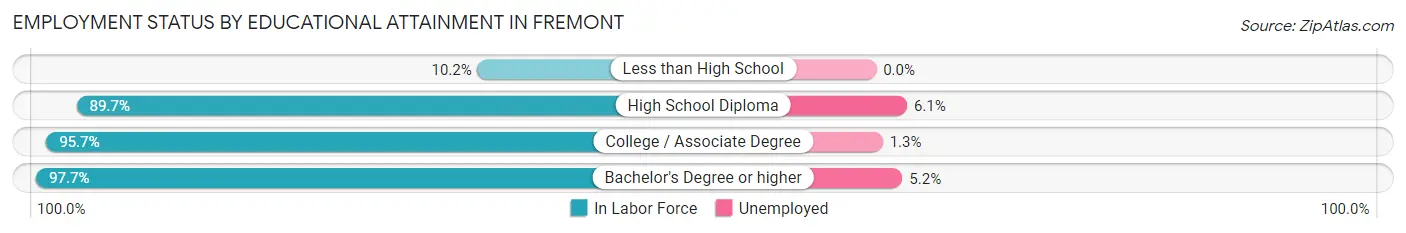
| Educational Attainment | In Labor Force | Unemployed |
| Less than High School | 14 (10.2%) | 0 (0.0%) |
| High School Diploma | 494 (89.7%) | 34 (6.1%) |
| College / Associate Degree | 596 (95.7%) | 8 (1.3%) |
| Bachelor's Degree or higher | 517 (97.7%) | 28 (5.2%) |
| Total | 1,621 (88.1%) | 74 (4.0%) |
Employment Occupations by Sex in Fremont
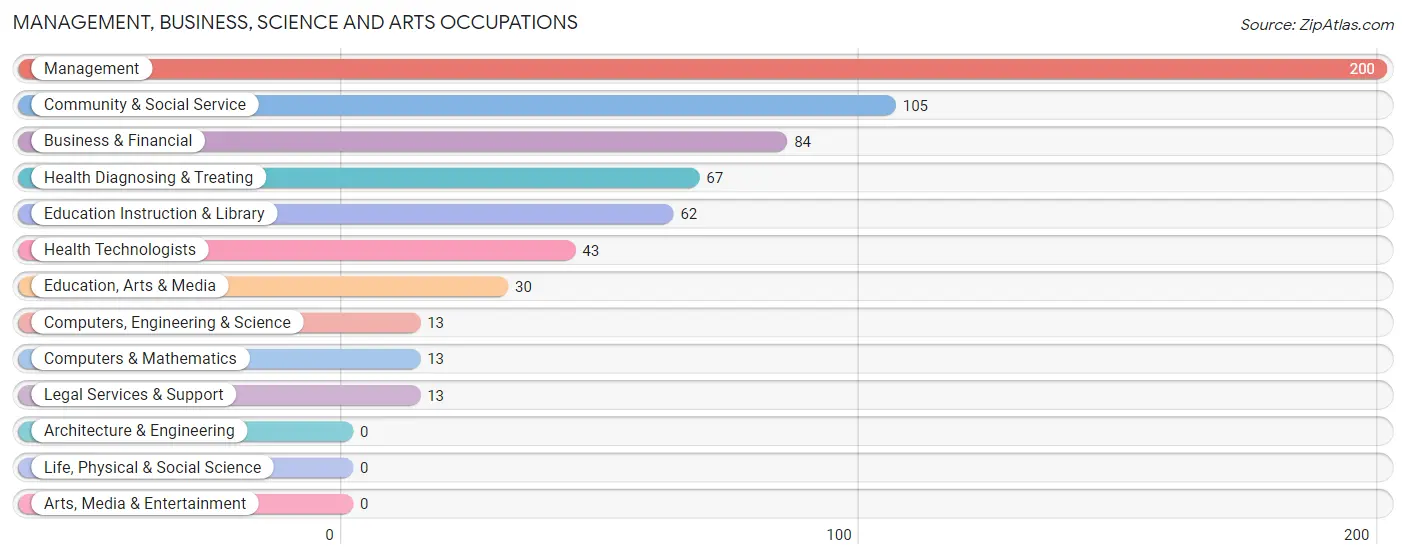
Management, Business, Science and Arts Occupations
The most common Management, Business, Science and Arts occupations in Fremont are Management (200 | 10.1%), Community & Social Service (105 | 5.3%), Business & Financial (84 | 4.2%), Health Diagnosing & Treating (67 | 3.4%), and Education Instruction & Library (62 | 3.1%).
Management, Business, Science and Arts Occupations by Sex
Within the Management, Business, Science and Arts occupations in Fremont, the most male-oriented occupations are Computers, Engineering & Science (100.0%), Computers & Mathematics (100.0%), and Business & Financial (72.6%), while the most female-oriented occupations are Legal Services & Support (100.0%), Health Diagnosing & Treating (70.2%), and Community & Social Service (58.1%).
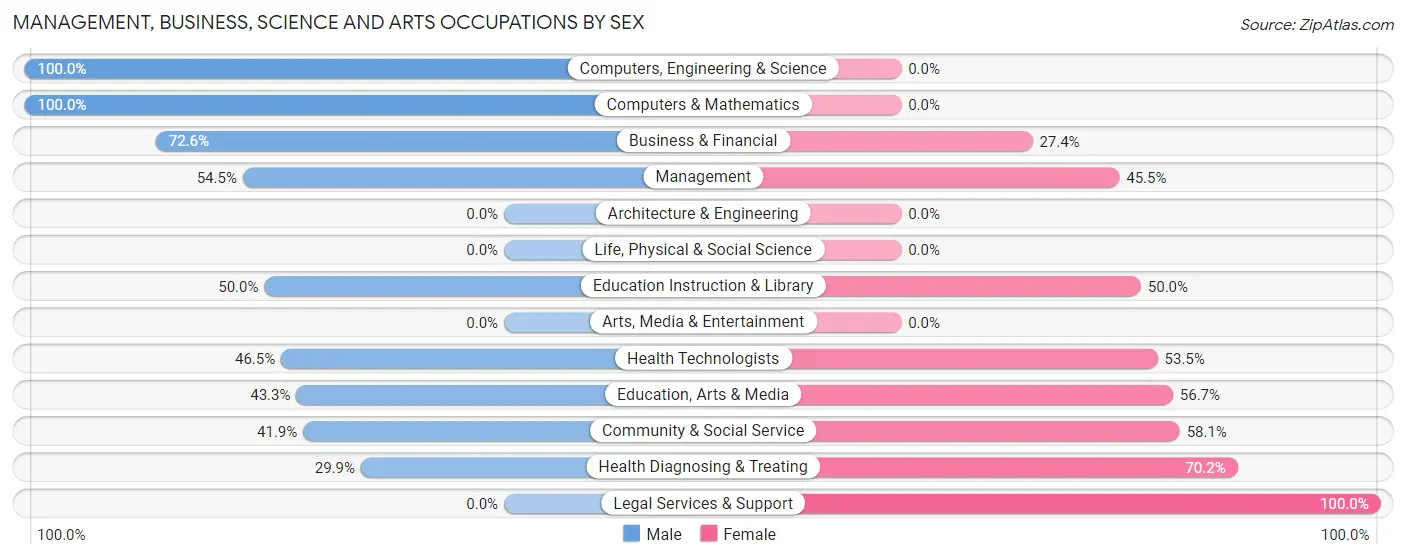
| Occupation | Male | Female |
| Management | 109 (54.5%) | 91 (45.5%) |
| Business & Financial | 61 (72.6%) | 23 (27.4%) |
| Computers, Engineering & Science | 13 (100.0%) | 0 (0.0%) |
| Computers & Mathematics | 13 (100.0%) | 0 (0.0%) |
| Architecture & Engineering | 0 (0.0%) | 0 (0.0%) |
| Life, Physical & Social Science | 0 (0.0%) | 0 (0.0%) |
| Community & Social Service | 44 (41.9%) | 61 (58.1%) |
| Education, Arts & Media | 13 (43.3%) | 17 (56.7%) |
| Legal Services & Support | 0 (0.0%) | 13 (100.0%) |
| Education Instruction & Library | 31 (50.0%) | 31 (50.0%) |
| Arts, Media & Entertainment | 0 (0.0%) | 0 (0.0%) |
| Health Diagnosing & Treating | 20 (29.8%) | 47 (70.2%) |
| Health Technologists | 20 (46.5%) | 23 (53.5%) |
| Total (Category) | 247 (52.7%) | 222 (47.3%) |
| Total (Overall) | 872 (43.9%) | 1,114 (56.1%) |
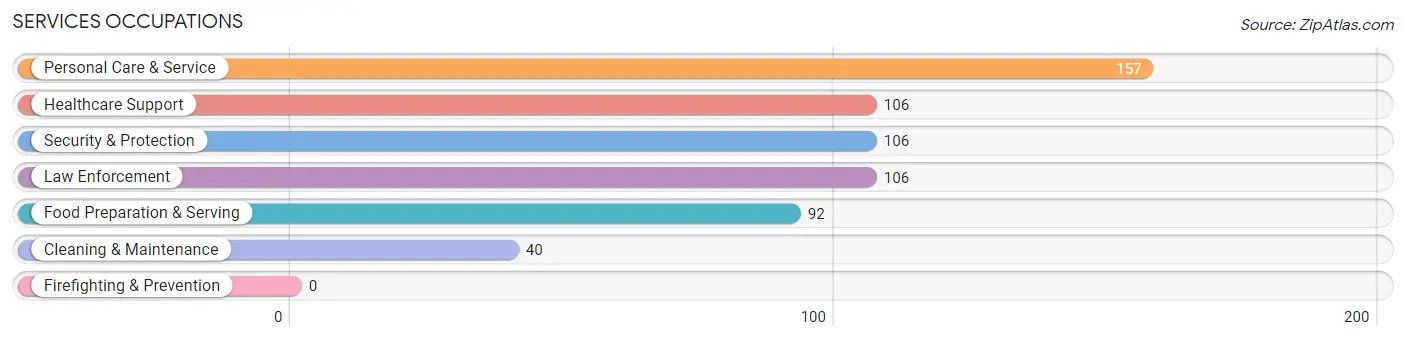
Services Occupations
The most common Services occupations in Fremont are Personal Care & Service (157 | 7.9%), Healthcare Support (106 | 5.3%), Security & Protection (106 | 5.3%), Law Enforcement (106 | 5.3%), and Food Preparation & Serving (92 | 4.6%).
Services Occupations by Sex
Within the Services occupations in Fremont, the most male-oriented occupations are Security & Protection (100.0%), Law Enforcement (100.0%), and Food Preparation & Serving (65.2%), while the most female-oriented occupations are Healthcare Support (100.0%), Personal Care & Service (84.1%), and Cleaning & Maintenance (62.5%).
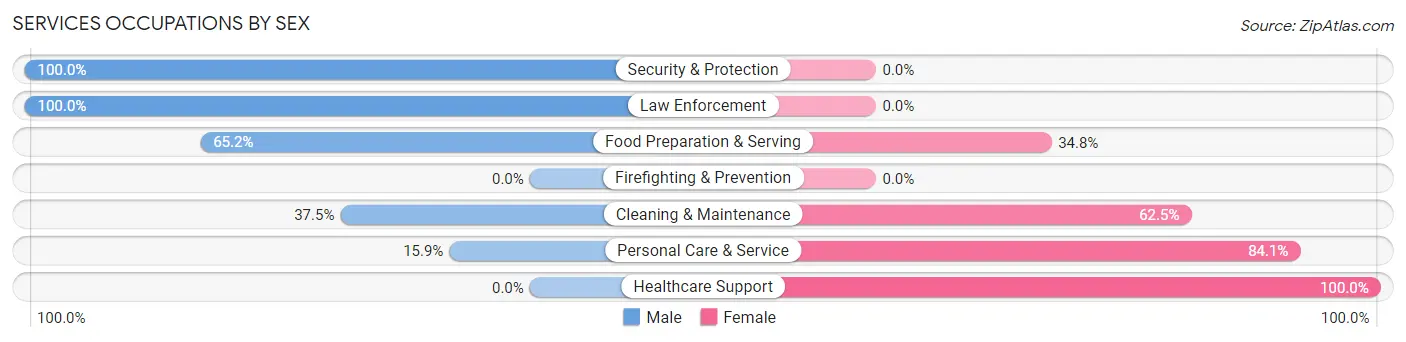
| Occupation | Male | Female |
| Healthcare Support | 0 (0.0%) | 106 (100.0%) |
| Security & Protection | 106 (100.0%) | 0 (0.0%) |
| Firefighting & Prevention | 0 (0.0%) | 0 (0.0%) |
| Law Enforcement | 106 (100.0%) | 0 (0.0%) |
| Food Preparation & Serving | 60 (65.2%) | 32 (34.8%) |
| Cleaning & Maintenance | 15 (37.5%) | 25 (62.5%) |
| Personal Care & Service | 25 (15.9%) | 132 (84.1%) |
| Total (Category) | 206 (41.1%) | 295 (58.9%) |
| Total (Overall) | 872 (43.9%) | 1,114 (56.1%) |
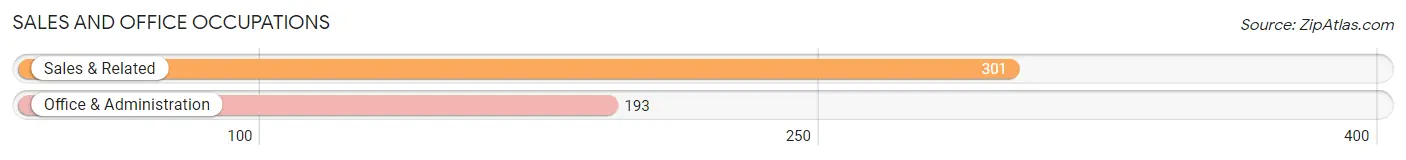
Sales and Office Occupations
The most common Sales and Office occupations in Fremont are Sales & Related (301 | 15.2%), and Office & Administration (193 | 9.7%).
Sales and Office Occupations by Sex
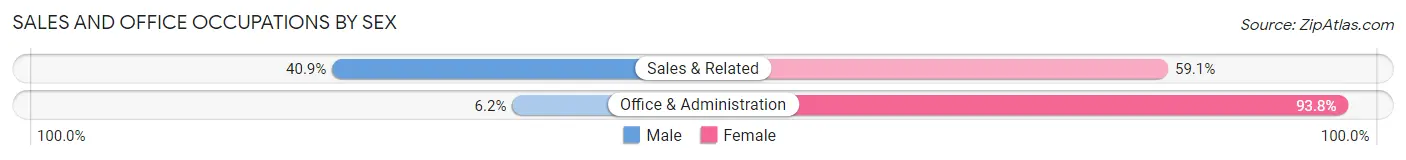
| Occupation | Male | Female |
| Sales & Related | 123 (40.9%) | 178 (59.1%) |
| Office & Administration | 12 (6.2%) | 181 (93.8%) |
| Total (Category) | 135 (27.3%) | 359 (72.7%) |
| Total (Overall) | 872 (43.9%) | 1,114 (56.1%) |
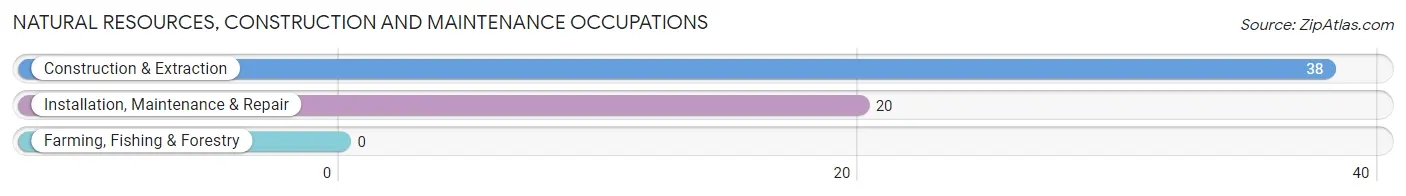
Natural Resources, Construction and Maintenance Occupations
The most common Natural Resources, Construction and Maintenance occupations in Fremont are Construction & Extraction (38 | 1.9%), and Installation, Maintenance & Repair (20 | 1.0%).
Natural Resources, Construction and Maintenance Occupations by Sex
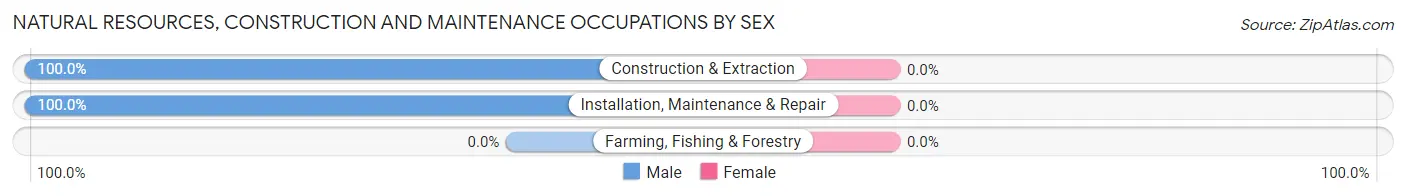
| Occupation | Male | Female |
| Farming, Fishing & Forestry | 0 (0.0%) | 0 (0.0%) |
| Construction & Extraction | 38 (100.0%) | 0 (0.0%) |
| Installation, Maintenance & Repair | 20 (100.0%) | 0 (0.0%) |
| Total (Category) | 58 (100.0%) | 0 (0.0%) |
| Total (Overall) | 872 (43.9%) | 1,114 (56.1%) |
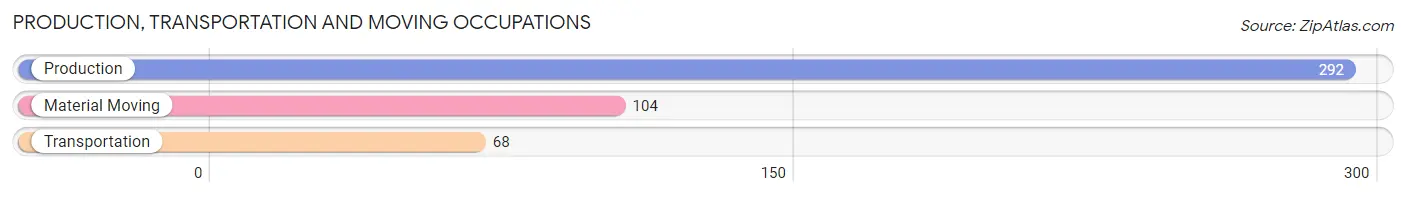
Production, Transportation and Moving Occupations
The most common Production, Transportation and Moving occupations in Fremont are Production (292 | 14.7%), Material Moving (104 | 5.2%), and Transportation (68 | 3.4%).
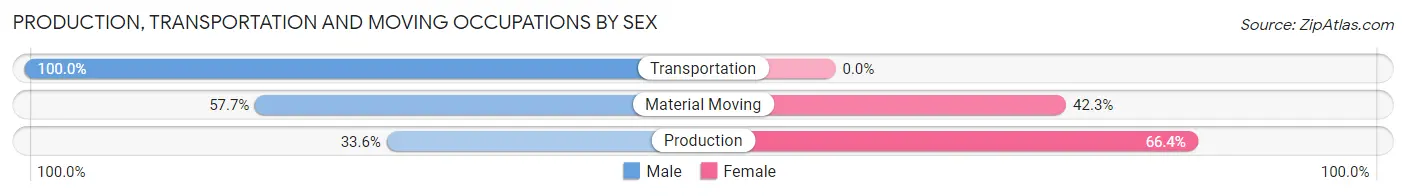
Production, Transportation and Moving Occupations by Sex
| Occupation | Male | Female |
| Production | 98 (33.6%) | 194 (66.4%) |
| Transportation | 68 (100.0%) | 0 (0.0%) |
| Material Moving | 60 (57.7%) | 44 (42.3%) |
| Total (Category) | 226 (48.7%) | 238 (51.3%) |
| Total (Overall) | 872 (43.9%) | 1,114 (56.1%) |
Employment Industries by Sex in Fremont
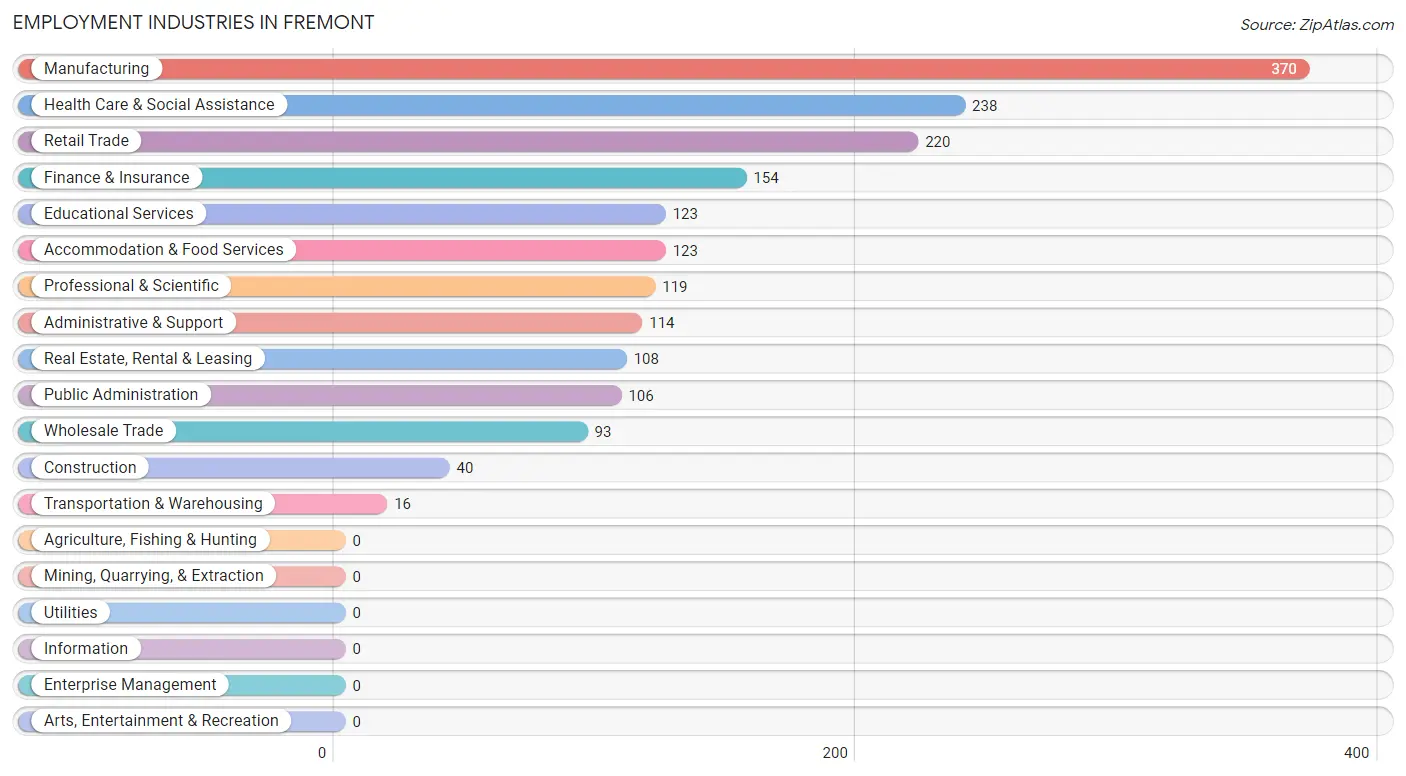
Employment Industries in Fremont
The major employment industries in Fremont include Manufacturing (370 | 18.6%), Health Care & Social Assistance (238 | 12.0%), Retail Trade (220 | 11.1%), Finance & Insurance (154 | 7.7%), and Educational Services (123 | 6.2%).
Employment Industries by Sex in Fremont
The Fremont industries that see more men than women are Construction (100.0%), Wholesale Trade (100.0%), and Transportation & Warehousing (100.0%), whereas the industries that tend to have a higher number of women are Real Estate, Rental & Leasing (100.0%), Health Care & Social Assistance (79.8%), and Professional & Scientific (76.5%).
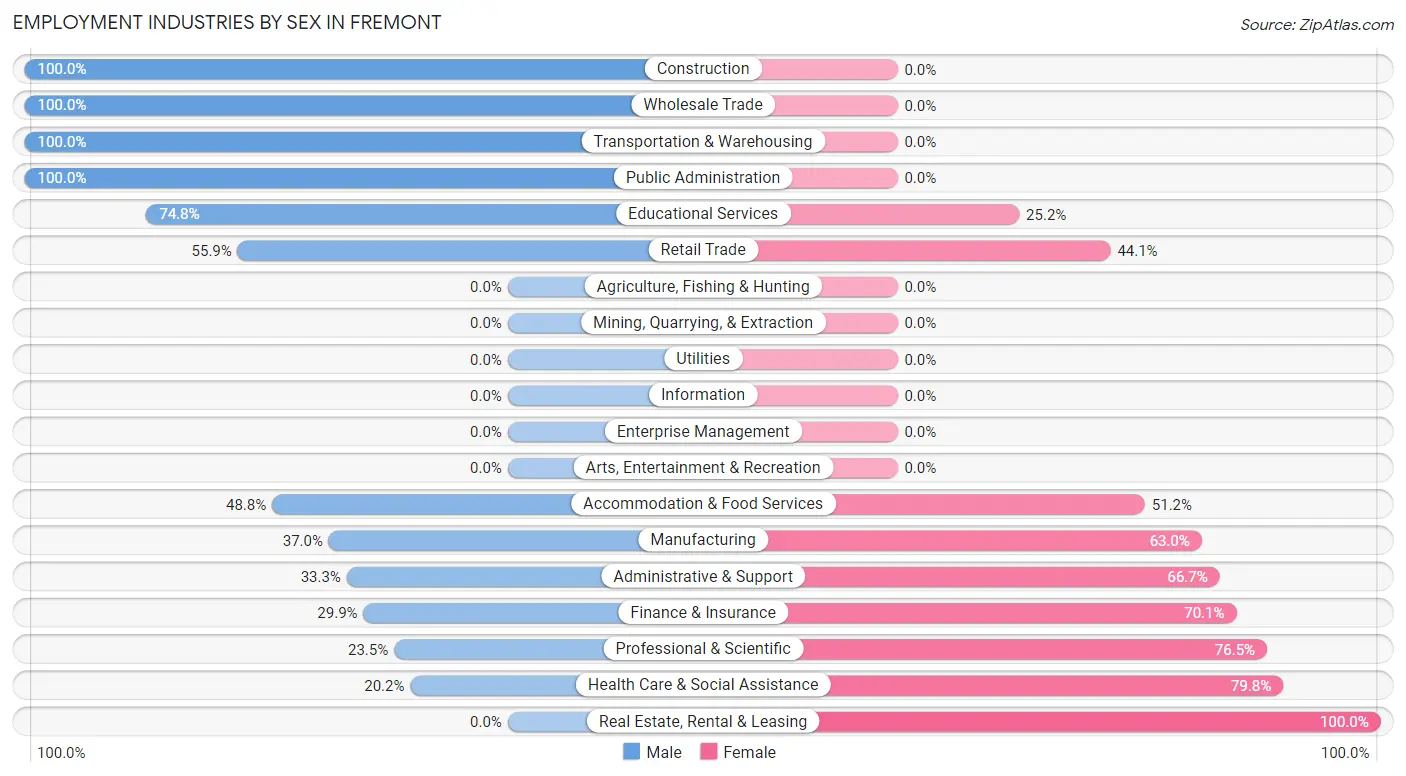
| Industry | Male | Female |
| Agriculture, Fishing & Hunting | 0 (0.0%) | 0 (0.0%) |
| Mining, Quarrying, & Extraction | 0 (0.0%) | 0 (0.0%) |
| Construction | 40 (100.0%) | 0 (0.0%) |
| Manufacturing | 137 (37.0%) | 233 (63.0%) |
| Wholesale Trade | 93 (100.0%) | 0 (0.0%) |
| Retail Trade | 123 (55.9%) | 97 (44.1%) |
| Transportation & Warehousing | 16 (100.0%) | 0 (0.0%) |
| Utilities | 0 (0.0%) | 0 (0.0%) |
| Information | 0 (0.0%) | 0 (0.0%) |
| Finance & Insurance | 46 (29.9%) | 108 (70.1%) |
| Real Estate, Rental & Leasing | 0 (0.0%) | 108 (100.0%) |
| Professional & Scientific | 28 (23.5%) | 91 (76.5%) |
| Enterprise Management | 0 (0.0%) | 0 (0.0%) |
| Administrative & Support | 38 (33.3%) | 76 (66.7%) |
| Educational Services | 92 (74.8%) | 31 (25.2%) |
| Health Care & Social Assistance | 48 (20.2%) | 190 (79.8%) |
| Arts, Entertainment & Recreation | 0 (0.0%) | 0 (0.0%) |
| Accommodation & Food Services | 60 (48.8%) | 63 (51.2%) |
| Public Administration | 106 (100.0%) | 0 (0.0%) |
| Total | 872 (43.9%) | 1,114 (56.1%) |
Education in Fremont
School Enrollment in Fremont
The most common levels of schooling among the 1,211 students in Fremont are middle school (531 | 43.9%), high school (176 | 14.5%), and elementary school (168 | 13.9%).
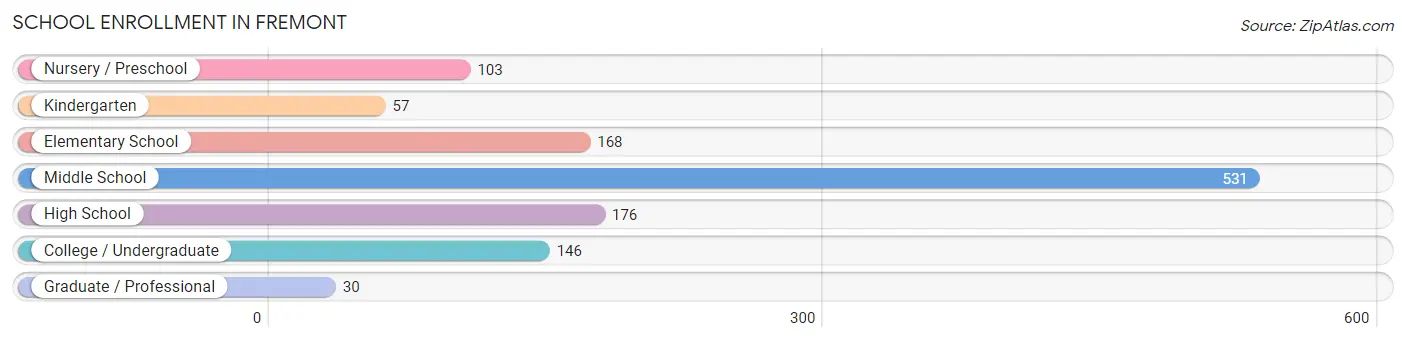
| School Level | # Students | % Students |
| Nursery / Preschool | 103 | 8.5% |
| Kindergarten | 57 | 4.7% |
| Elementary School | 168 | 13.9% |
| Middle School | 531 | 43.9% |
| High School | 176 | 14.5% |
| College / Undergraduate | 146 | 12.1% |
| Graduate / Professional | 30 | 2.5% |
| Total | 1,211 | 100.0% |
School Enrollment by Age by Funding Source in Fremont
Out of a total of 1,211 students who are enrolled in schools in Fremont, 120 (9.9%) attend a private institution, while the remaining 1,091 (90.1%) are enrolled in public schools. The age group of 35 years and over has the highest likelihood of being enrolled in private schools, with 96 (71.1% in the age bracket) enrolled. Conversely, the age group of 3 to 4 year olds has the lowest likelihood of being enrolled in a private school, with 68 (100.0% in the age bracket) attending a public institution.
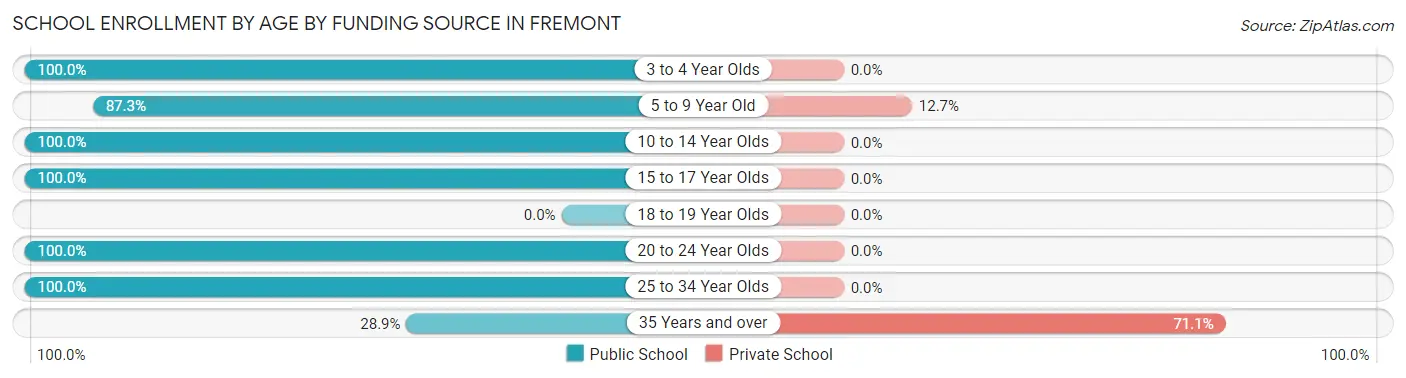
| Age Bracket | Public School | Private School |
| 3 to 4 Year Olds | 68 (100.0%) | 0 (0.0%) |
| 5 to 9 Year Old | 165 (87.3%) | 24 (12.7%) |
| 10 to 14 Year Olds | 591 (100.0%) | 0 (0.0%) |
| 15 to 17 Year Olds | 187 (100.0%) | 0 (0.0%) |
| 18 to 19 Year Olds | 0 (0.0%) | 0 (0.0%) |
| 20 to 24 Year Olds | 20 (100.0%) | 0 (0.0%) |
| 25 to 34 Year Olds | 21 (100.0%) | 0 (0.0%) |
| 35 Years and over | 39 (28.9%) | 96 (71.1%) |
| Total | 1,091 (90.1%) | 120 (9.9%) |
Educational Attainment by Field of Study in Fremont
Arts & humanities (170 | 17.4%), business (160 | 16.4%), science & technology (135 | 13.9%), education (126 | 12.9%), and engineering (78 | 8.0%) are the most common fields of study among 975 individuals in Fremont who have obtained a bachelor's degree or higher.
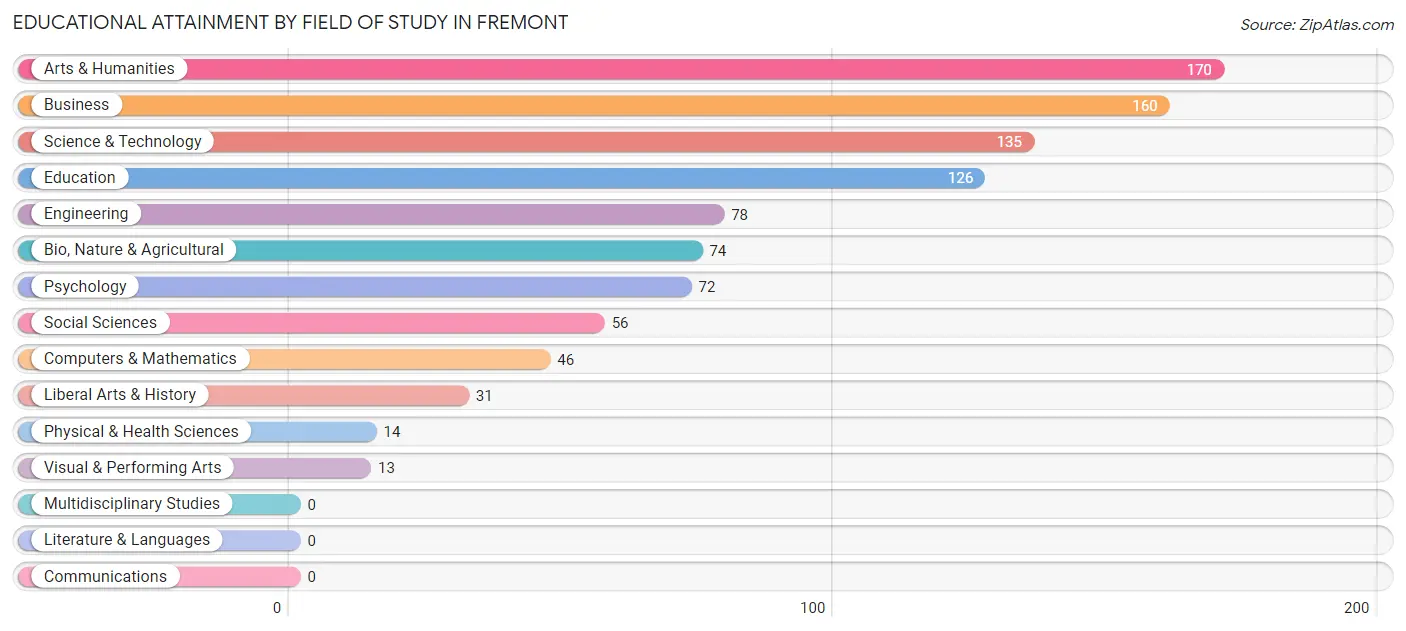
| Field of Study | # Graduates | % Graduates |
| Computers & Mathematics | 46 | 4.7% |
| Bio, Nature & Agricultural | 74 | 7.6% |
| Physical & Health Sciences | 14 | 1.4% |
| Psychology | 72 | 7.4% |
| Social Sciences | 56 | 5.7% |
| Engineering | 78 | 8.0% |
| Multidisciplinary Studies | 0 | 0.0% |
| Science & Technology | 135 | 13.9% |
| Business | 160 | 16.4% |
| Education | 126 | 12.9% |
| Literature & Languages | 0 | 0.0% |
| Liberal Arts & History | 31 | 3.2% |
| Visual & Performing Arts | 13 | 1.3% |
| Communications | 0 | 0.0% |
| Arts & Humanities | 170 | 17.4% |
| Total | 975 | 100.0% |
Transportation & Commute in Fremont
Vehicle Availability by Sex in Fremont
The most prevalent vehicle ownership categories in Fremont are males with 2 vehicles (644, accounting for 74.0%) and females with 2 vehicles (517, making up 57.8%).
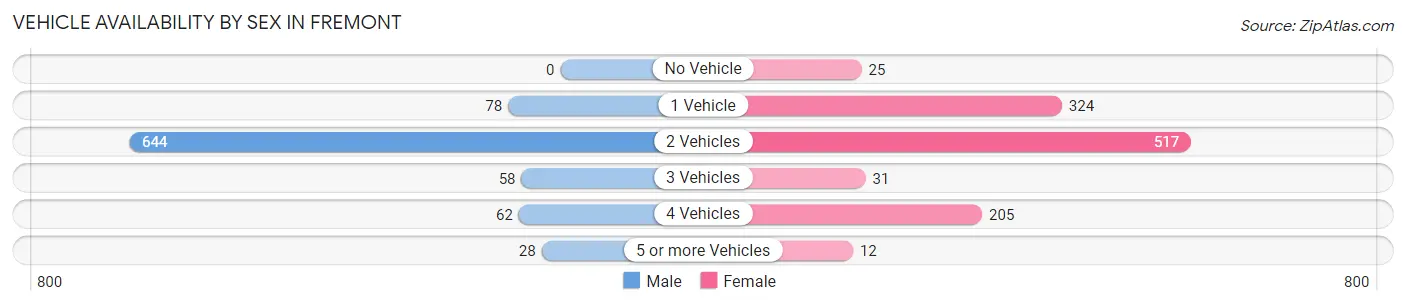
| Vehicles Available | Male | Female |
| No Vehicle | 0 (0.0%) | 25 (2.2%) |
| 1 Vehicle | 78 (9.0%) | 324 (29.1%) |
| 2 Vehicles | 644 (74.0%) | 517 (46.4%) |
| 3 Vehicles | 58 (6.7%) | 31 (2.8%) |
| 4 Vehicles | 62 (7.1%) | 205 (18.4%) |
| 5 or more Vehicles | 28 (3.2%) | 12 (1.1%) |
| Total | 870 (100.0%) | 1,114 (100.0%) |
Commute Time in Fremont
The most frequently occuring commute durations in Fremont are 5 to 9 minutes (679 commuters, 36.1%), less than 5 minutes (261 commuters, 13.9%), and 10 to 14 minutes (226 commuters, 12.0%).
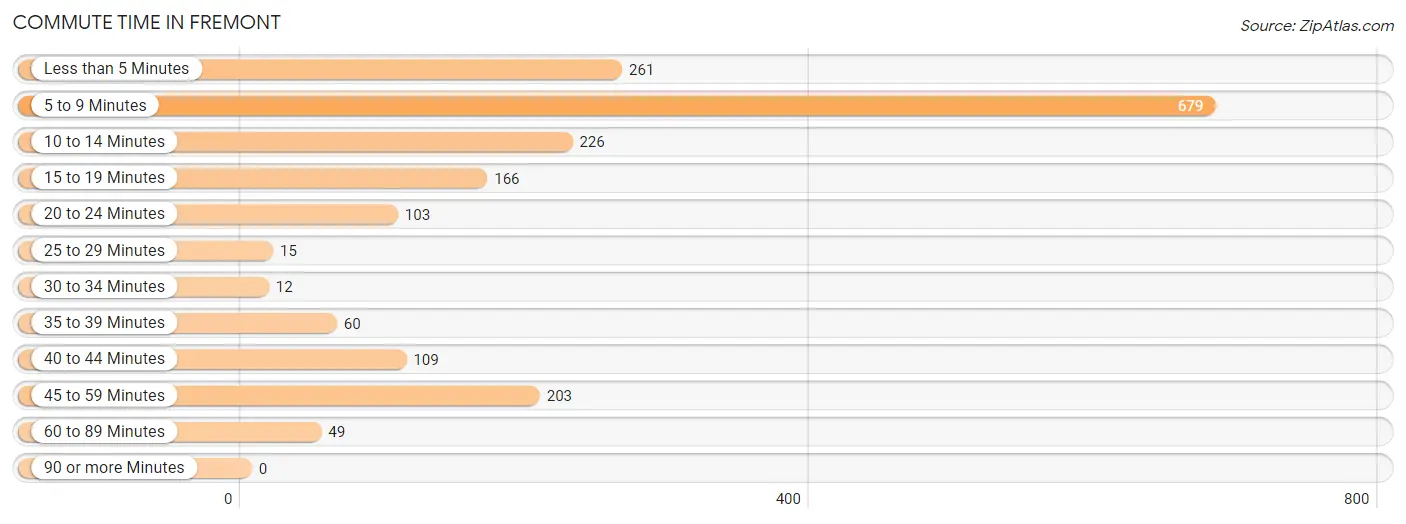
| Commute Time | # Commuters | % Commuters |
| Less than 5 Minutes | 261 | 13.9% |
| 5 to 9 Minutes | 679 | 36.1% |
| 10 to 14 Minutes | 226 | 12.0% |
| 15 to 19 Minutes | 166 | 8.8% |
| 20 to 24 Minutes | 103 | 5.5% |
| 25 to 29 Minutes | 15 | 0.8% |
| 30 to 34 Minutes | 12 | 0.6% |
| 35 to 39 Minutes | 60 | 3.2% |
| 40 to 44 Minutes | 109 | 5.8% |
| 45 to 59 Minutes | 203 | 10.8% |
| 60 to 89 Minutes | 49 | 2.6% |
| 90 or more Minutes | 0 | 0.0% |
Commute Time by Sex in Fremont
The most common commute times in Fremont are 5 to 9 minutes (288 commuters, 36.7%) for males and 5 to 9 minutes (391 commuters, 35.6%) for females.
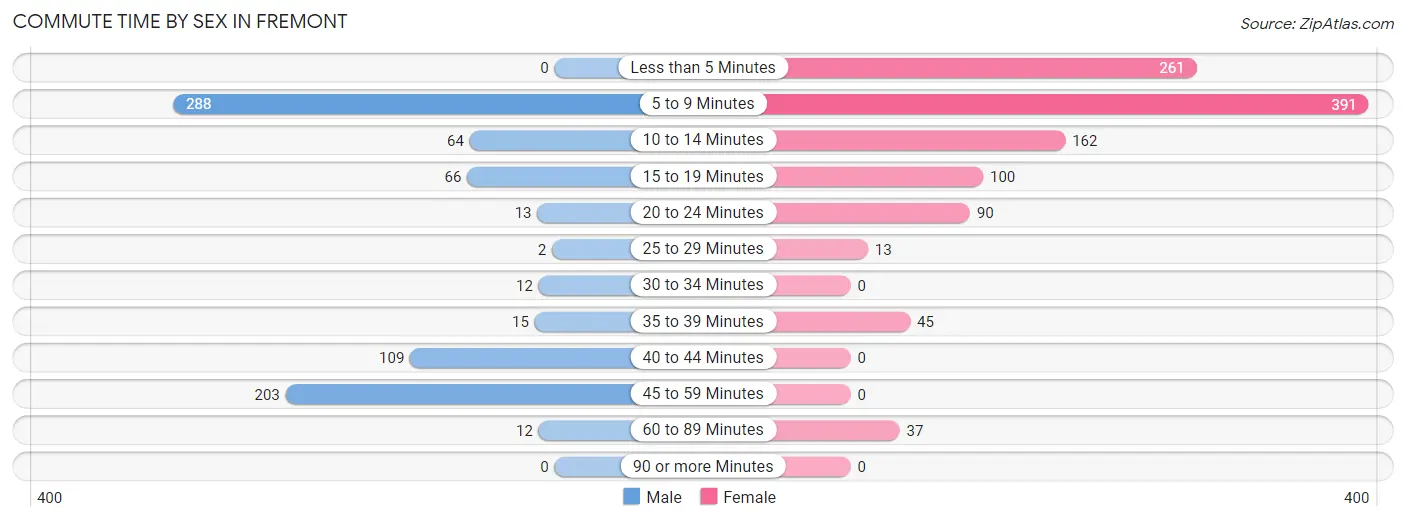
| Commute Time | Male | Female |
| Less than 5 Minutes | 0 (0.0%) | 261 (23.7%) |
| 5 to 9 Minutes | 288 (36.7%) | 391 (35.6%) |
| 10 to 14 Minutes | 64 (8.2%) | 162 (14.7%) |
| 15 to 19 Minutes | 66 (8.4%) | 100 (9.1%) |
| 20 to 24 Minutes | 13 (1.7%) | 90 (8.2%) |
| 25 to 29 Minutes | 2 (0.3%) | 13 (1.2%) |
| 30 to 34 Minutes | 12 (1.5%) | 0 (0.0%) |
| 35 to 39 Minutes | 15 (1.9%) | 45 (4.1%) |
| 40 to 44 Minutes | 109 (13.9%) | 0 (0.0%) |
| 45 to 59 Minutes | 203 (25.9%) | 0 (0.0%) |
| 60 to 89 Minutes | 12 (1.5%) | 37 (3.4%) |
| 90 or more Minutes | 0 (0.0%) | 0 (0.0%) |
Time of Departure to Work by Sex in Fremont
The most frequent times of departure to work in Fremont are 7:00 AM to 7:29 AM (166, 21.2%) for males and 7:30 AM to 7:59 AM (304, 27.7%) for females.
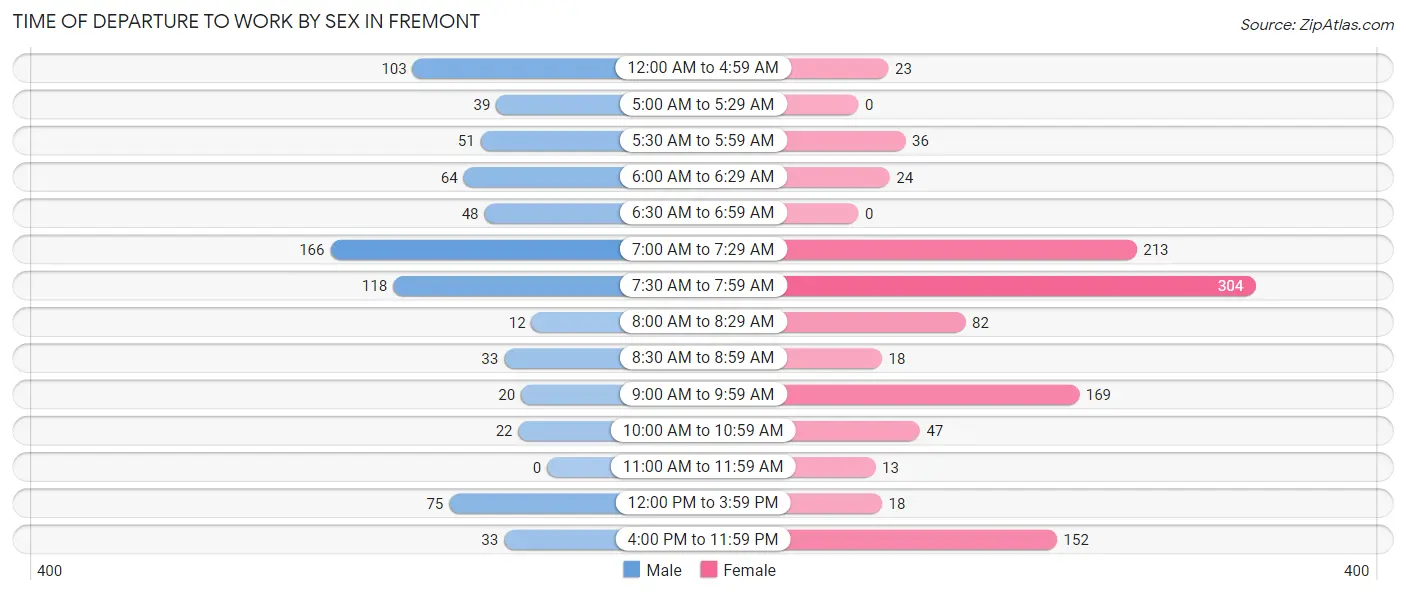
| Time of Departure | Male | Female |
| 12:00 AM to 4:59 AM | 103 (13.1%) | 23 (2.1%) |
| 5:00 AM to 5:29 AM | 39 (5.0%) | 0 (0.0%) |
| 5:30 AM to 5:59 AM | 51 (6.5%) | 36 (3.3%) |
| 6:00 AM to 6:29 AM | 64 (8.2%) | 24 (2.2%) |
| 6:30 AM to 6:59 AM | 48 (6.1%) | 0 (0.0%) |
| 7:00 AM to 7:29 AM | 166 (21.2%) | 213 (19.4%) |
| 7:30 AM to 7:59 AM | 118 (15.0%) | 304 (27.7%) |
| 8:00 AM to 8:29 AM | 12 (1.5%) | 82 (7.5%) |
| 8:30 AM to 8:59 AM | 33 (4.2%) | 18 (1.6%) |
| 9:00 AM to 9:59 AM | 20 (2.5%) | 169 (15.4%) |
| 10:00 AM to 10:59 AM | 22 (2.8%) | 47 (4.3%) |
| 11:00 AM to 11:59 AM | 0 (0.0%) | 13 (1.2%) |
| 12:00 PM to 3:59 PM | 75 (9.6%) | 18 (1.6%) |
| 4:00 PM to 11:59 PM | 33 (4.2%) | 152 (13.8%) |
| Total | 784 (100.0%) | 1,099 (100.0%) |
Housing Occupancy in Fremont
Occupancy by Ownership in Fremont
Of the total 1,783 dwellings in Fremont, owner-occupied units account for 1,226 (68.8%), while renter-occupied units make up 557 (31.2%).
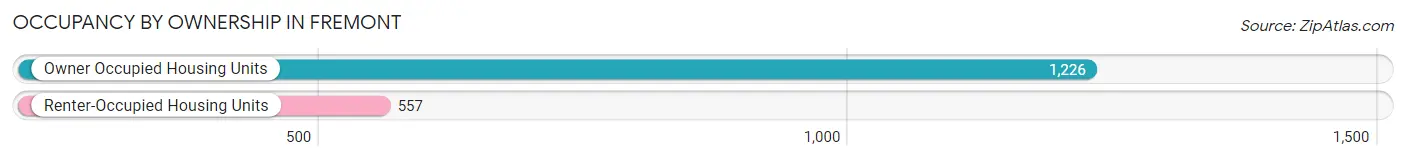
| Occupancy | # Housing Units | % Housing Units |
| Owner Occupied Housing Units | 1,226 | 68.8% |
| Renter-Occupied Housing Units | 557 | 31.2% |
| Total Occupied Housing Units | 1,783 | 100.0% |
Occupancy by Household Size in Fremont
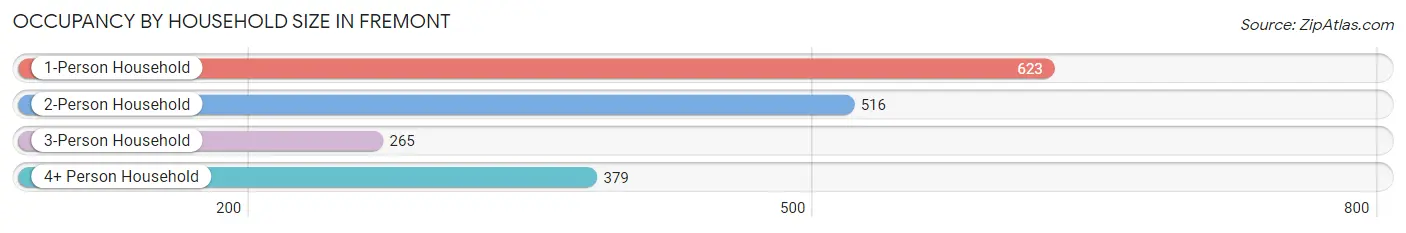
| Household Size | # Housing Units | % Housing Units |
| 1-Person Household | 623 | 34.9% |
| 2-Person Household | 516 | 28.9% |
| 3-Person Household | 265 | 14.9% |
| 4+ Person Household | 379 | 21.3% |
| Total Housing Units | 1,783 | 100.0% |
Occupancy by Ownership by Household Size in Fremont
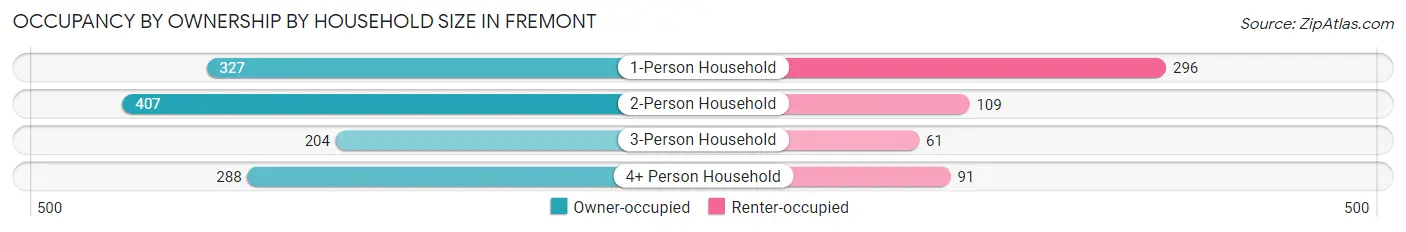
| Household Size | Owner-occupied | Renter-occupied |
| 1-Person Household | 327 (52.5%) | 296 (47.5%) |
| 2-Person Household | 407 (78.9%) | 109 (21.1%) |
| 3-Person Household | 204 (77.0%) | 61 (23.0%) |
| 4+ Person Household | 288 (76.0%) | 91 (24.0%) |
| Total Housing Units | 1,226 (68.8%) | 557 (31.2%) |
Occupancy by Educational Attainment in Fremont
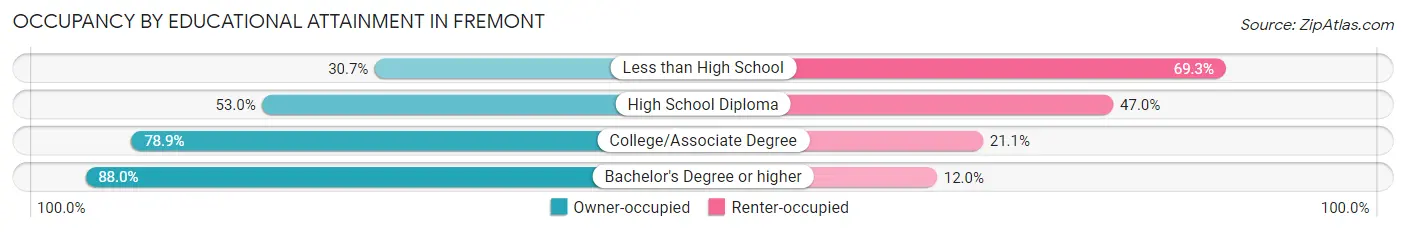
| Household Size | Owner-occupied | Renter-occupied |
| Less than High School | 58 (30.7%) | 131 (69.3%) |
| High School Diploma | 290 (53.0%) | 257 (47.0%) |
| College/Associate Degree | 373 (78.9%) | 100 (21.1%) |
| Bachelor's Degree or higher | 505 (88.0%) | 69 (12.0%) |
Occupancy by Age of Householder in Fremont
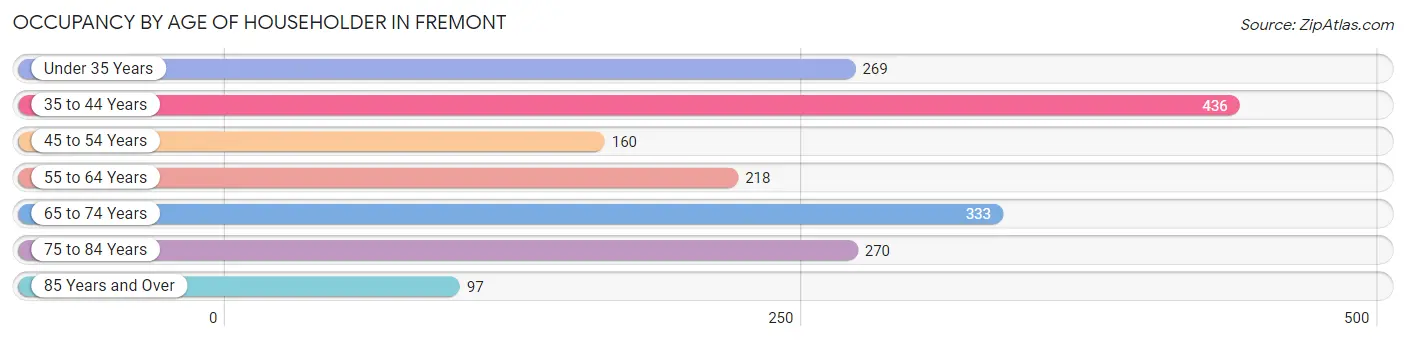
| Age Bracket | # Households | % Households |
| Under 35 Years | 269 | 15.1% |
| 35 to 44 Years | 436 | 24.4% |
| 45 to 54 Years | 160 | 9.0% |
| 55 to 64 Years | 218 | 12.2% |
| 65 to 74 Years | 333 | 18.7% |
| 75 to 84 Years | 270 | 15.1% |
| 85 Years and Over | 97 | 5.4% |
| Total | 1,783 | 100.0% |
Housing Finances in Fremont
Median Income by Occupancy in Fremont
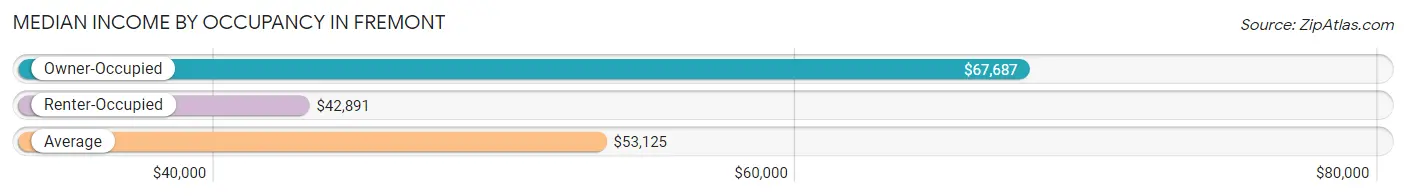
| Occupancy Type | # Households | Median Income |
| Owner-Occupied | 1,226 (68.8%) | $67,687 |
| Renter-Occupied | 557 (31.2%) | $42,891 |
| Average | 1,783 (100.0%) | $53,125 |
Occupancy by Householder Income Bracket in Fremont
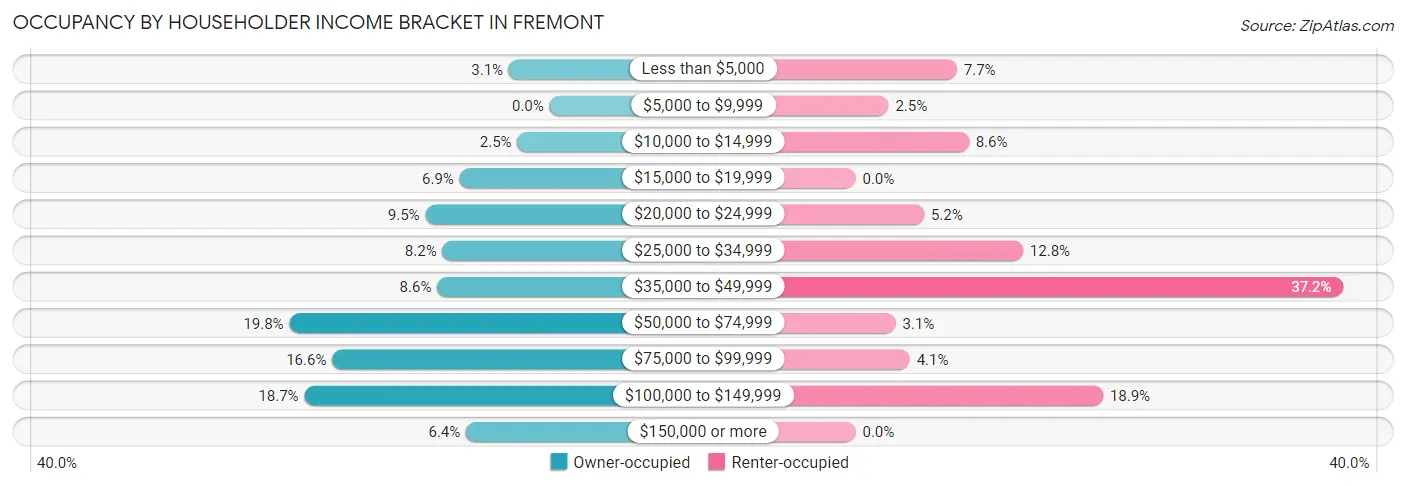
| Income Bracket | Owner-occupied | Renter-occupied |
| Less than $5,000 | 38 (3.1%) | 43 (7.7%) |
| $5,000 to $9,999 | 0 (0.0%) | 14 (2.5%) |
| $10,000 to $14,999 | 30 (2.5%) | 48 (8.6%) |
| $15,000 to $19,999 | 84 (6.9%) | 0 (0.0%) |
| $20,000 to $24,999 | 116 (9.5%) | 29 (5.2%) |
| $25,000 to $34,999 | 100 (8.2%) | 71 (12.8%) |
| $35,000 to $49,999 | 105 (8.6%) | 207 (37.2%) |
| $50,000 to $74,999 | 243 (19.8%) | 17 (3.0%) |
| $75,000 to $99,999 | 203 (16.6%) | 23 (4.1%) |
| $100,000 to $149,999 | 229 (18.7%) | 105 (18.9%) |
| $150,000 or more | 78 (6.4%) | 0 (0.0%) |
| Total | 1,226 (100.0%) | 557 (100.0%) |
Monthly Housing Cost Tiers in Fremont
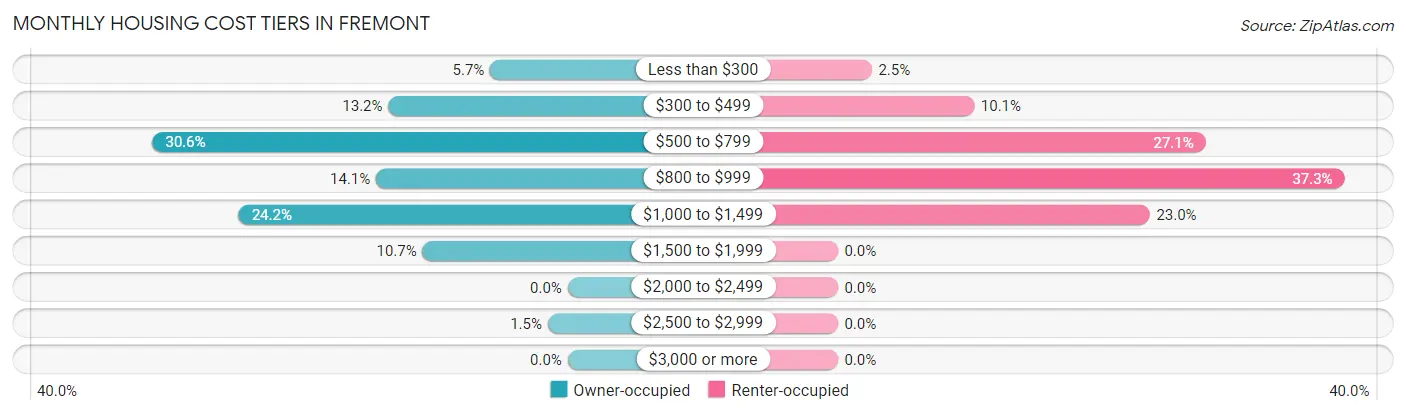
| Monthly Cost | Owner-occupied | Renter-occupied |
| Less than $300 | 70 (5.7%) | 14 (2.5%) |
| $300 to $499 | 162 (13.2%) | 56 (10.1%) |
| $500 to $799 | 375 (30.6%) | 151 (27.1%) |
| $800 to $999 | 173 (14.1%) | 208 (37.3%) |
| $1,000 to $1,499 | 297 (24.2%) | 128 (23.0%) |
| $1,500 to $1,999 | 131 (10.7%) | 0 (0.0%) |
| $2,000 to $2,499 | 0 (0.0%) | 0 (0.0%) |
| $2,500 to $2,999 | 18 (1.5%) | 0 (0.0%) |
| $3,000 or more | 0 (0.0%) | 0 (0.0%) |
| Total | 1,226 (100.0%) | 557 (100.0%) |
Physical Housing Characteristics in Fremont
Housing Structures in Fremont
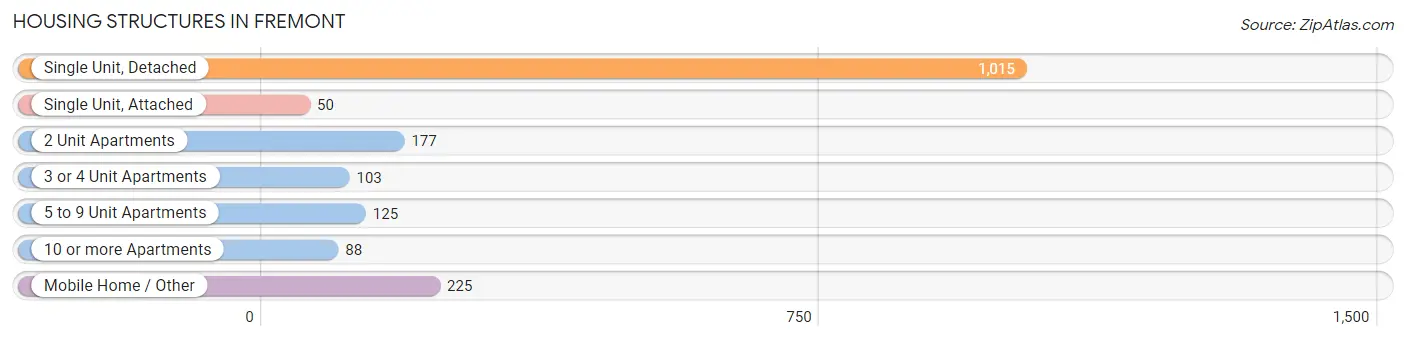
| Structure Type | # Housing Units | % Housing Units |
| Single Unit, Detached | 1,015 | 56.9% |
| Single Unit, Attached | 50 | 2.8% |
| 2 Unit Apartments | 177 | 9.9% |
| 3 or 4 Unit Apartments | 103 | 5.8% |
| 5 to 9 Unit Apartments | 125 | 7.0% |
| 10 or more Apartments | 88 | 4.9% |
| Mobile Home / Other | 225 | 12.6% |
| Total | 1,783 | 100.0% |
Housing Structures by Occupancy in Fremont
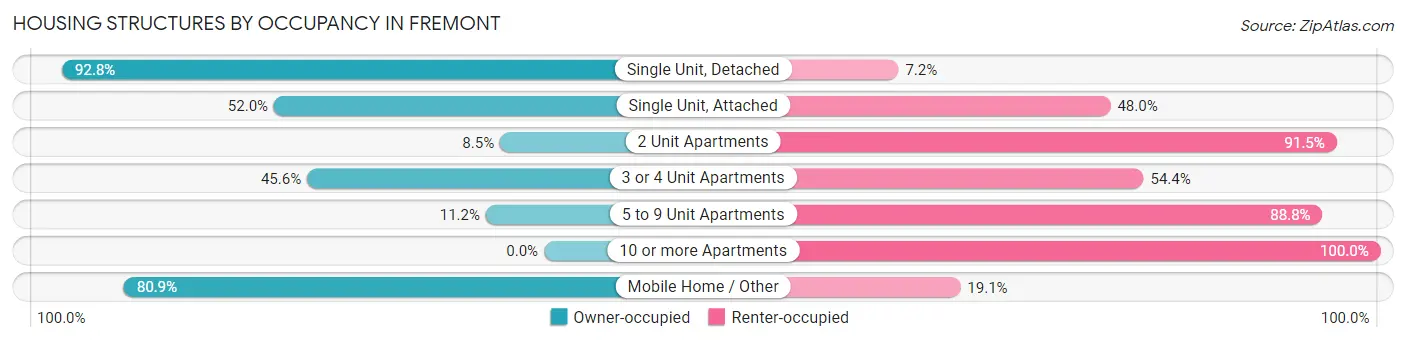
| Structure Type | Owner-occupied | Renter-occupied |
| Single Unit, Detached | 942 (92.8%) | 73 (7.2%) |
| Single Unit, Attached | 26 (52.0%) | 24 (48.0%) |
| 2 Unit Apartments | 15 (8.5%) | 162 (91.5%) |
| 3 or 4 Unit Apartments | 47 (45.6%) | 56 (54.4%) |
| 5 to 9 Unit Apartments | 14 (11.2%) | 111 (88.8%) |
| 10 or more Apartments | 0 (0.0%) | 88 (100.0%) |
| Mobile Home / Other | 182 (80.9%) | 43 (19.1%) |
| Total | 1,226 (68.8%) | 557 (31.2%) |
Housing Structures by Number of Rooms in Fremont
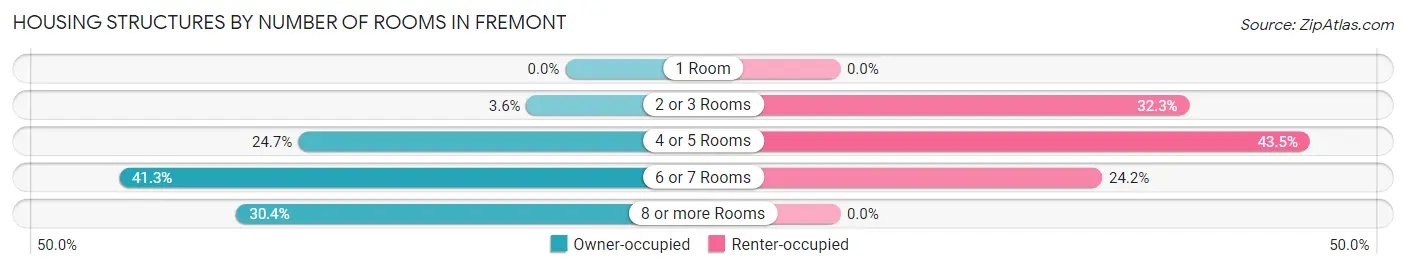
| Number of Rooms | Owner-occupied | Renter-occupied |
| 1 Room | 0 (0.0%) | 0 (0.0%) |
| 2 or 3 Rooms | 44 (3.6%) | 180 (32.3%) |
| 4 or 5 Rooms | 303 (24.7%) | 242 (43.4%) |
| 6 or 7 Rooms | 506 (41.3%) | 135 (24.2%) |
| 8 or more Rooms | 373 (30.4%) | 0 (0.0%) |
| Total | 1,226 (100.0%) | 557 (100.0%) |
Housing Structure by Heating Type in Fremont
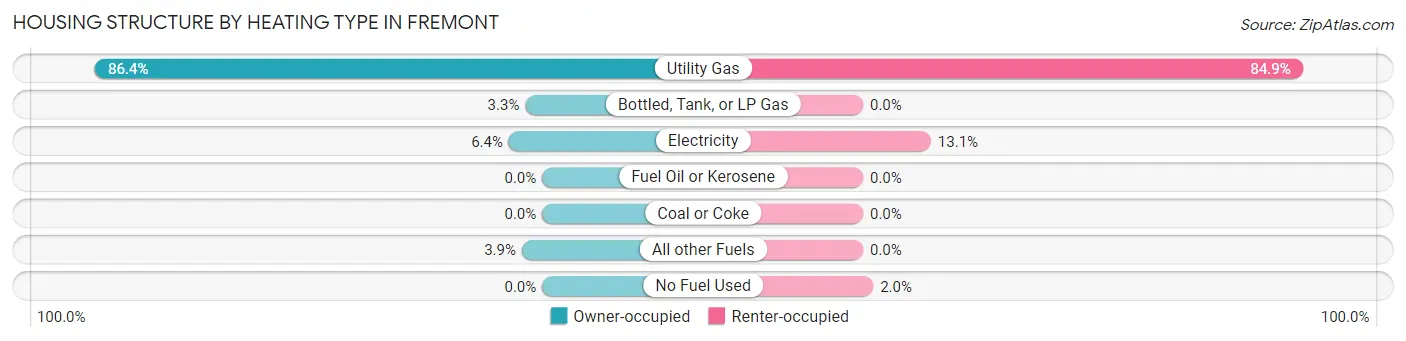
| Heating Type | Owner-occupied | Renter-occupied |
| Utility Gas | 1,059 (86.4%) | 473 (84.9%) |
| Bottled, Tank, or LP Gas | 40 (3.3%) | 0 (0.0%) |
| Electricity | 79 (6.4%) | 73 (13.1%) |
| Fuel Oil or Kerosene | 0 (0.0%) | 0 (0.0%) |
| Coal or Coke | 0 (0.0%) | 0 (0.0%) |
| All other Fuels | 48 (3.9%) | 0 (0.0%) |
| No Fuel Used | 0 (0.0%) | 11 (2.0%) |
| Total | 1,226 (100.0%) | 557 (100.0%) |
Household Vehicle Usage in Fremont
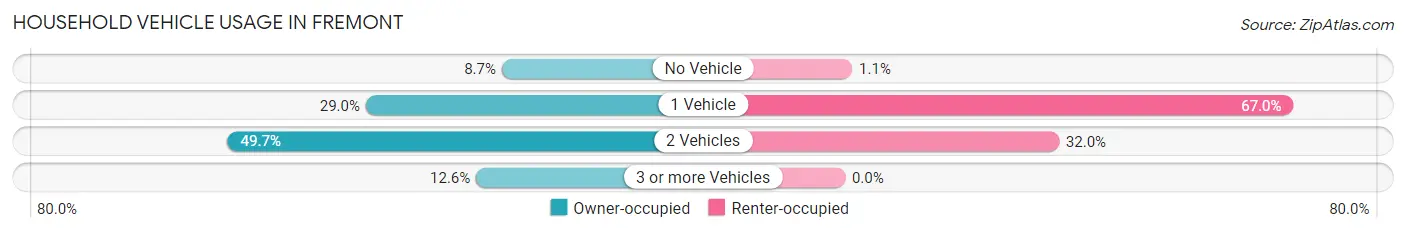
| Vehicles per Household | Owner-occupied | Renter-occupied |
| No Vehicle | 107 (8.7%) | 6 (1.1%) |
| 1 Vehicle | 356 (29.0%) | 373 (67.0%) |
| 2 Vehicles | 609 (49.7%) | 178 (32.0%) |
| 3 or more Vehicles | 154 (12.6%) | 0 (0.0%) |
| Total | 1,226 (100.0%) | 557 (100.0%) |
Real Estate & Mortgages in Fremont
Real Estate and Mortgage Overview in Fremont
| Characteristic | Without Mortgage | With Mortgage |
| Housing Units | 550 | 676 |
| Median Property Value | $151,100 | $164,000 |
| Median Household Income | $54,904 | $50 |
| Monthly Housing Costs | $553 | $0 |
| Real Estate Taxes | $2,496 | $20 |
Property Value by Mortgage Status in Fremont
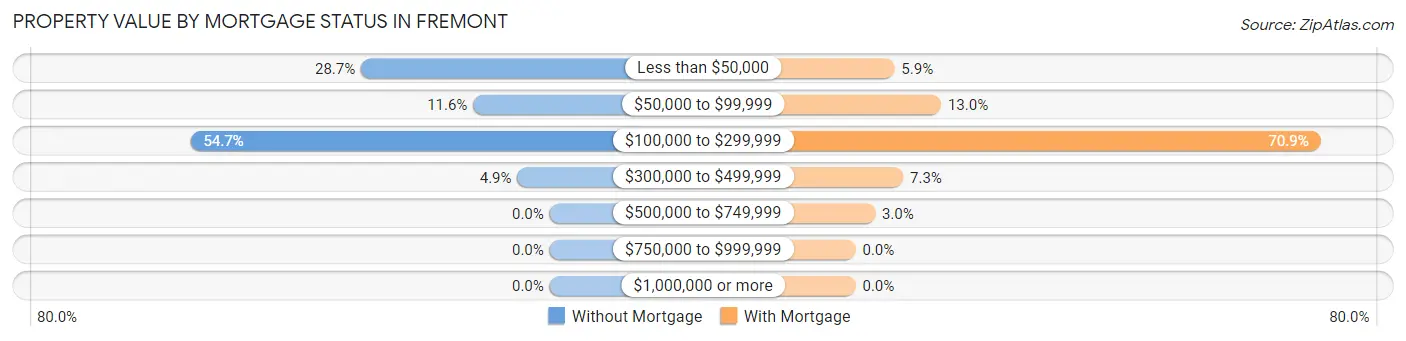
| Property Value | Without Mortgage | With Mortgage |
| Less than $50,000 | 158 (28.7%) | 40 (5.9%) |
| $50,000 to $99,999 | 64 (11.6%) | 88 (13.0%) |
| $100,000 to $299,999 | 301 (54.7%) | 479 (70.9%) |
| $300,000 to $499,999 | 27 (4.9%) | 49 (7.2%) |
| $500,000 to $749,999 | 0 (0.0%) | 20 (3.0%) |
| $750,000 to $999,999 | 0 (0.0%) | 0 (0.0%) |
| $1,000,000 or more | 0 (0.0%) | 0 (0.0%) |
| Total | 550 (100.0%) | 676 (100.0%) |
Household Income by Mortgage Status in Fremont
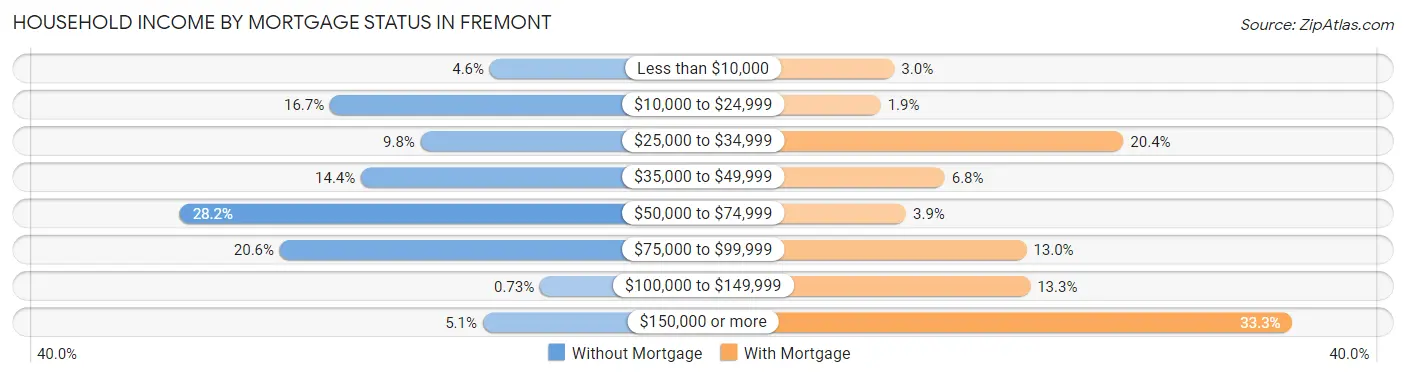
| Household Income | Without Mortgage | With Mortgage |
| Less than $10,000 | 25 (4.5%) | 20 (3.0%) |
| $10,000 to $24,999 | 92 (16.7%) | 13 (1.9%) |
| $25,000 to $34,999 | 54 (9.8%) | 138 (20.4%) |
| $35,000 to $49,999 | 79 (14.4%) | 46 (6.8%) |
| $50,000 to $74,999 | 155 (28.2%) | 26 (3.8%) |
| $75,000 to $99,999 | 113 (20.5%) | 88 (13.0%) |
| $100,000 to $149,999 | 4 (0.7%) | 90 (13.3%) |
| $150,000 or more | 28 (5.1%) | 225 (33.3%) |
| Total | 550 (100.0%) | 676 (100.0%) |
Property Value to Household Income Ratio in Fremont
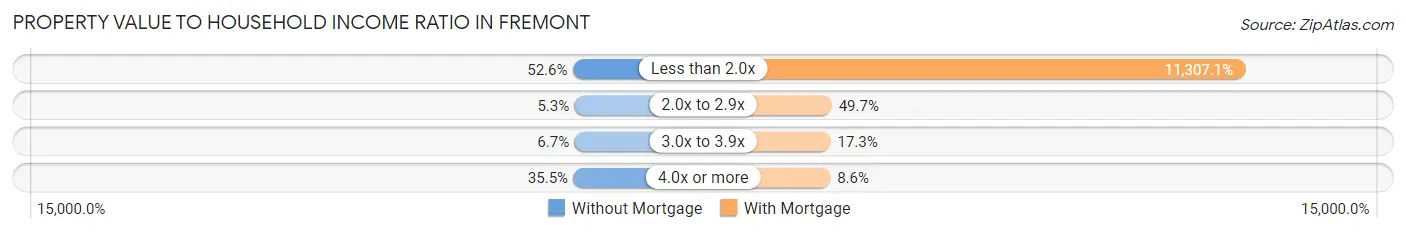
| Value-to-Income Ratio | Without Mortgage | With Mortgage |
| Less than 2.0x | 289 (52.5%) | 76,436 (11,307.1%) |
| 2.0x to 2.9x | 29 (5.3%) | 336 (49.7%) |
| 3.0x to 3.9x | 37 (6.7%) | 117 (17.3%) |
| 4.0x or more | 195 (35.4%) | 58 (8.6%) |
| Total | 550 (100.0%) | 676 (100.0%) |
Real Estate Taxes by Mortgage Status in Fremont
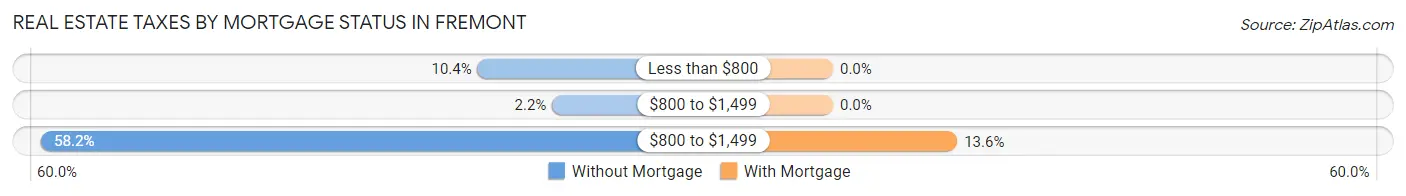
| Property Taxes | Without Mortgage | With Mortgage |
| Less than $800 | 57 (10.4%) | 0 (0.0%) |
| $800 to $1,499 | 12 (2.2%) | 0 (0.0%) |
| $800 to $1,499 | 320 (58.2%) | 92 (13.6%) |
| Total | 550 (100.0%) | 676 (100.0%) |
Health & Disability in Fremont
Health Insurance Coverage by Age in Fremont
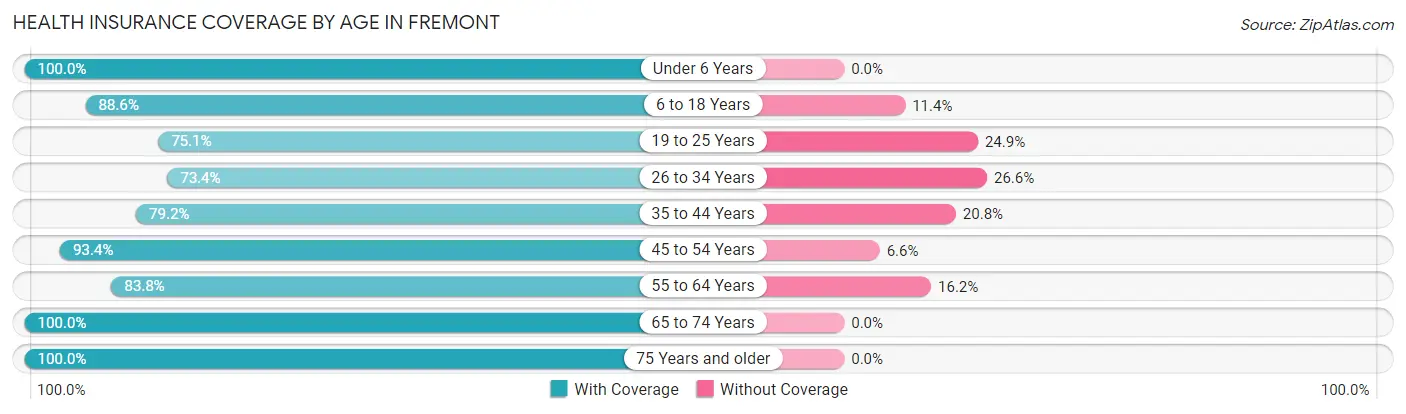
| Age Bracket | With Coverage | Without Coverage |
| Under 6 Years | 406 (100.0%) | 0 (0.0%) |
| 6 to 18 Years | 819 (88.6%) | 105 (11.4%) |
| 19 to 25 Years | 253 (75.1%) | 84 (24.9%) |
| 26 to 34 Years | 215 (73.4%) | 78 (26.6%) |
| 35 to 44 Years | 628 (79.2%) | 165 (20.8%) |
| 45 to 54 Years | 382 (93.4%) | 27 (6.6%) |
| 55 to 64 Years | 233 (83.8%) | 45 (16.2%) |
| 65 to 74 Years | 526 (100.0%) | 0 (0.0%) |
| 75 Years and older | 515 (100.0%) | 0 (0.0%) |
| Total | 3,977 (88.7%) | 504 (11.3%) |
Health Insurance Coverage by Citizenship Status in Fremont
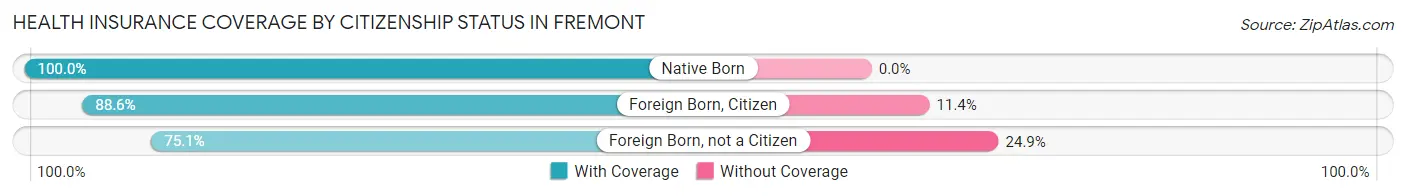
| Citizenship Status | With Coverage | Without Coverage |
| Native Born | 406 (100.0%) | 0 (0.0%) |
| Foreign Born, Citizen | 819 (88.6%) | 105 (11.4%) |
| Foreign Born, not a Citizen | 253 (75.1%) | 84 (24.9%) |
Health Insurance Coverage by Household Income in Fremont
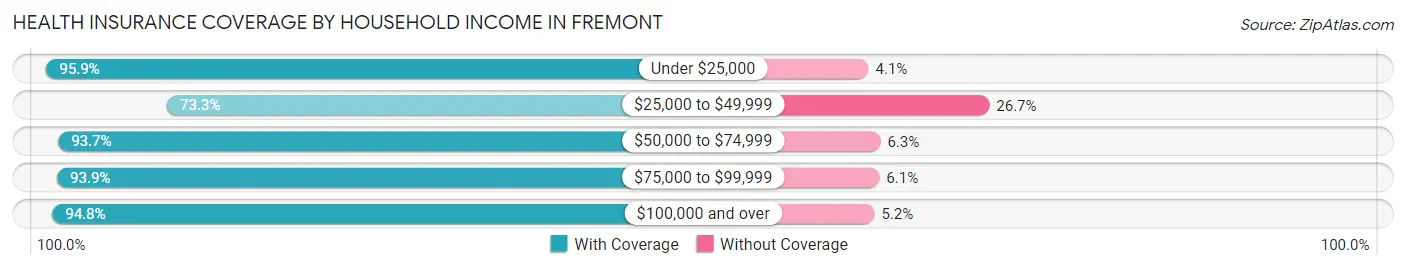
| Household Income | With Coverage | Without Coverage |
| Under $25,000 | 539 (95.9%) | 23 (4.1%) |
| $25,000 to $49,999 | 900 (73.3%) | 328 (26.7%) |
| $50,000 to $74,999 | 579 (93.7%) | 39 (6.3%) |
| $75,000 to $99,999 | 630 (93.9%) | 41 (6.1%) |
| $100,000 and over | 1,316 (94.8%) | 72 (5.2%) |
Public vs Private Health Insurance Coverage by Age in Fremont
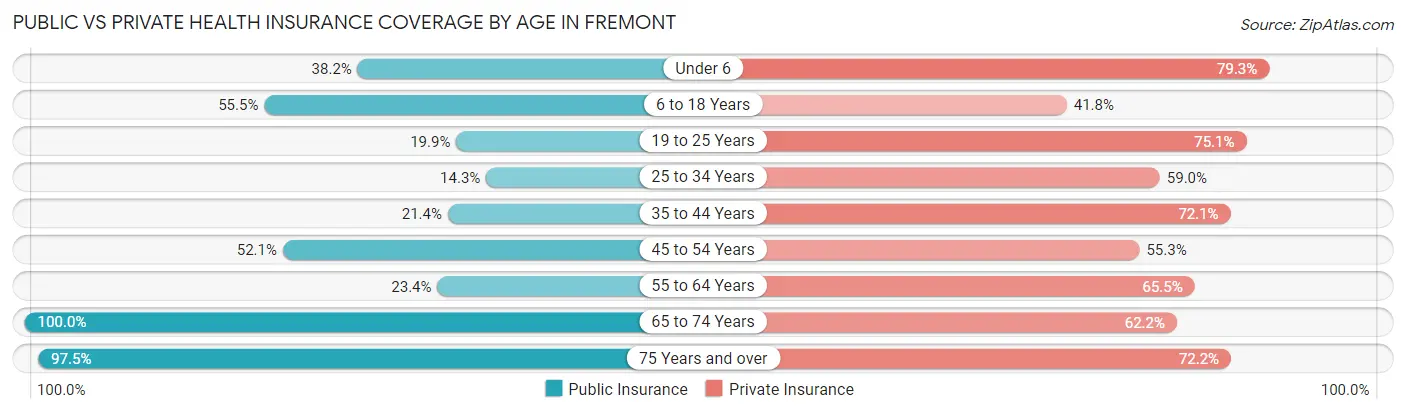
| Age Bracket | Public Insurance | Private Insurance |
| Under 6 | 155 (38.2%) | 322 (79.3%) |
| 6 to 18 Years | 513 (55.5%) | 386 (41.8%) |
| 19 to 25 Years | 67 (19.9%) | 253 (75.1%) |
| 25 to 34 Years | 42 (14.3%) | 173 (59.0%) |
| 35 to 44 Years | 170 (21.4%) | 572 (72.1%) |
| 45 to 54 Years | 213 (52.1%) | 226 (55.3%) |
| 55 to 64 Years | 65 (23.4%) | 182 (65.5%) |
| 65 to 74 Years | 526 (100.0%) | 327 (62.2%) |
| 75 Years and over | 502 (97.5%) | 372 (72.2%) |
| Total | 2,253 (50.3%) | 2,813 (62.8%) |
Disability Status by Sex by Age in Fremont
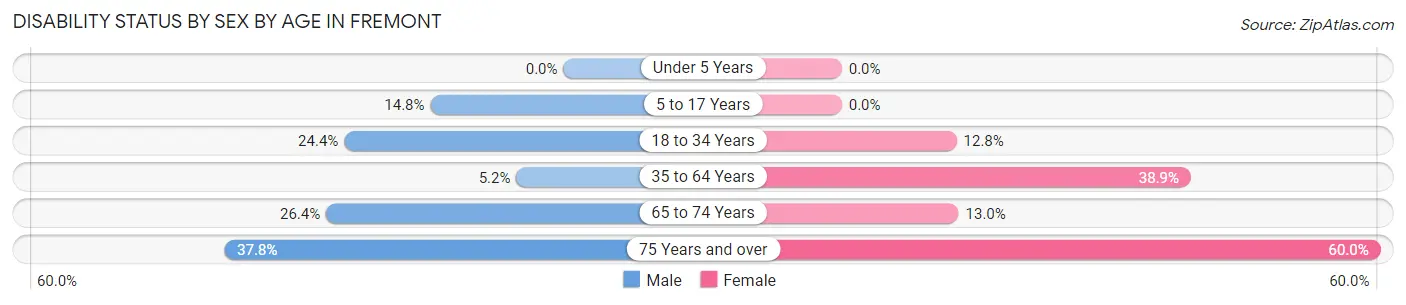
| Age Bracket | Male | Female |
| Under 5 Years | 0 (0.0%) | 0 (0.0%) |
| 5 to 17 Years | 60 (14.8%) | 0 (0.0%) |
| 18 to 34 Years | 52 (24.4%) | 56 (12.8%) |
| 35 to 64 Years | 34 (5.2%) | 323 (38.9%) |
| 65 to 74 Years | 74 (26.4%) | 32 (13.0%) |
| 75 Years and over | 68 (37.8%) | 201 (60.0%) |
Disability Class by Sex by Age in Fremont
Disability Class: Hearing Difficulty
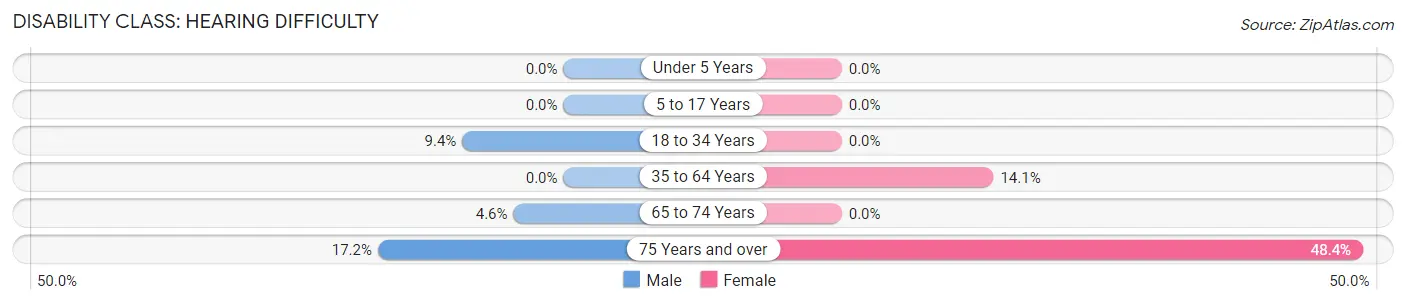
| Age Bracket | Male | Female |
| Under 5 Years | 0 (0.0%) | 0 (0.0%) |
| 5 to 17 Years | 0 (0.0%) | 0 (0.0%) |
| 18 to 34 Years | 20 (9.4%) | 0 (0.0%) |
| 35 to 64 Years | 0 (0.0%) | 117 (14.1%) |
| 65 to 74 Years | 13 (4.6%) | 0 (0.0%) |
| 75 Years and over | 31 (17.2%) | 162 (48.4%) |
Disability Class: Vision Difficulty
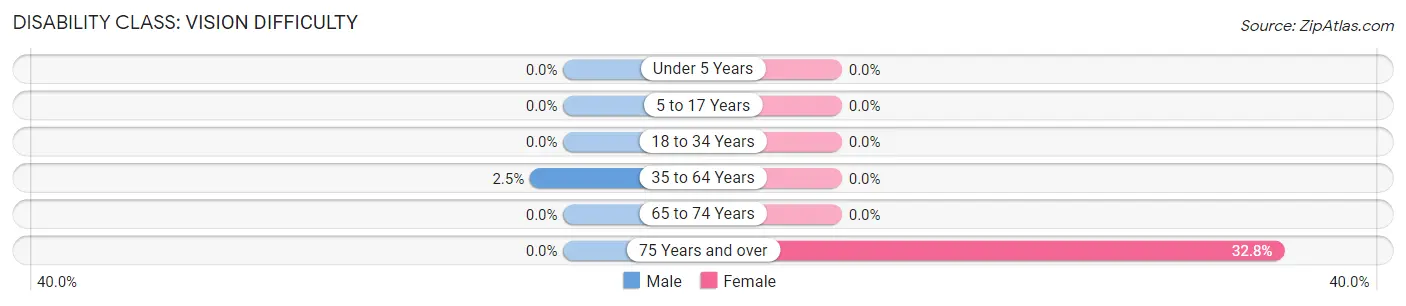
| Age Bracket | Male | Female |
| Under 5 Years | 0 (0.0%) | 0 (0.0%) |
| 5 to 17 Years | 0 (0.0%) | 0 (0.0%) |
| 18 to 34 Years | 0 (0.0%) | 0 (0.0%) |
| 35 to 64 Years | 16 (2.5%) | 0 (0.0%) |
| 65 to 74 Years | 0 (0.0%) | 0 (0.0%) |
| 75 Years and over | 0 (0.0%) | 110 (32.8%) |
Disability Class: Cognitive Difficulty
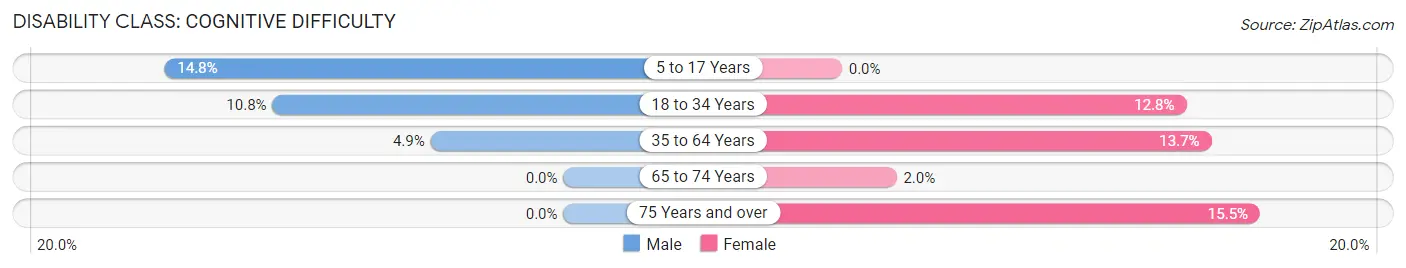
| Age Bracket | Male | Female |
| 5 to 17 Years | 60 (14.8%) | 0 (0.0%) |
| 18 to 34 Years | 23 (10.8%) | 56 (12.8%) |
| 35 to 64 Years | 32 (4.9%) | 114 (13.7%) |
| 65 to 74 Years | 0 (0.0%) | 5 (2.0%) |
| 75 Years and over | 0 (0.0%) | 52 (15.5%) |
Disability Class: Ambulatory Difficulty
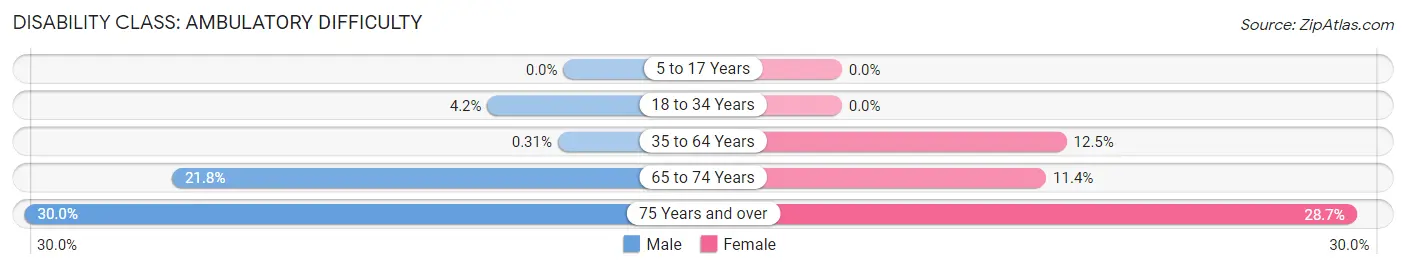
| Age Bracket | Male | Female |
| 5 to 17 Years | 0 (0.0%) | 0 (0.0%) |
| 18 to 34 Years | 9 (4.2%) | 0 (0.0%) |
| 35 to 64 Years | 2 (0.3%) | 104 (12.5%) |
| 65 to 74 Years | 61 (21.8%) | 28 (11.4%) |
| 75 Years and over | 54 (30.0%) | 96 (28.7%) |
Disability Class: Self-Care Difficulty
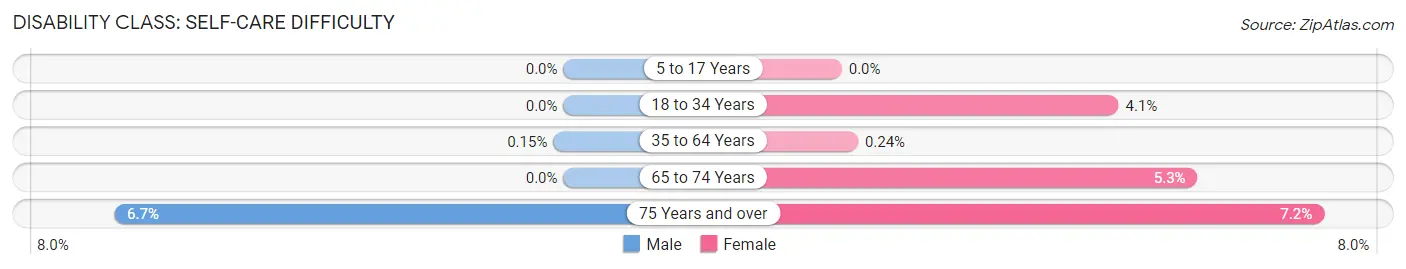
| Age Bracket | Male | Female |
| 5 to 17 Years | 0 (0.0%) | 0 (0.0%) |
| 18 to 34 Years | 0 (0.0%) | 18 (4.1%) |
| 35 to 64 Years | 1 (0.2%) | 2 (0.2%) |
| 65 to 74 Years | 0 (0.0%) | 13 (5.3%) |
| 75 Years and over | 12 (6.7%) | 24 (7.2%) |
Technology Access in Fremont
Computing Device Access in Fremont
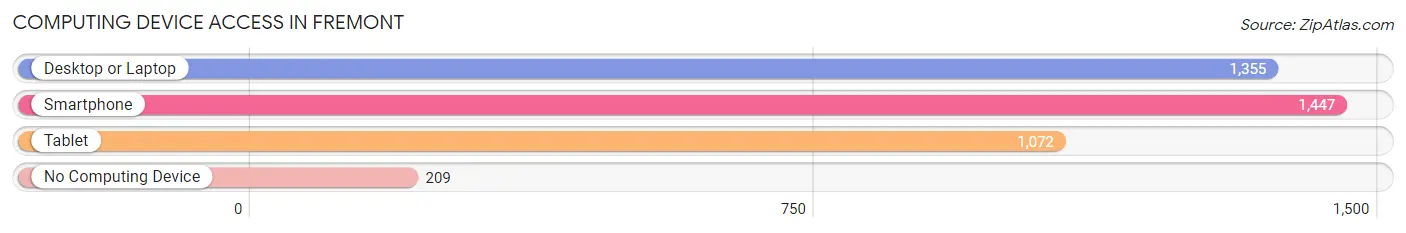
| Device Type | # Households | % Households |
| Desktop or Laptop | 1,355 | 76.0% |
| Smartphone | 1,447 | 81.2% |
| Tablet | 1,072 | 60.1% |
| No Computing Device | 209 | 11.7% |
| Total | 1,783 | 100.0% |
Internet Access in Fremont
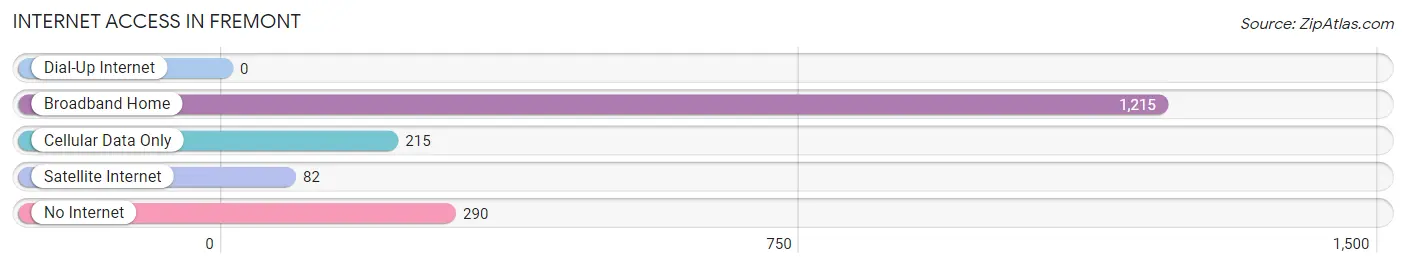
| Internet Type | # Households | % Households |
| Dial-Up Internet | 0 | 0.0% |
| Broadband Home | 1,215 | 68.1% |
| Cellular Data Only | 215 | 12.1% |
| Satellite Internet | 82 | 4.6% |
| No Internet | 290 | 16.3% |
| Total | 1,783 | 100.0% |
Fremont Summary
Fremont, Michigan is a small city located in the northwestern corner of the state, in Newaygo County. It is situated on the banks of the White River, and is surrounded by rolling hills and forests. The city has a population of 4,084, according to the 2010 census, and is the county seat of Newaygo County.
History
Fremont was first settled in 1837 by a group of settlers from New York. The town was originally called White River, but was later changed to Fremont in 1854, in honor of John C. Fremont, a famous explorer and politician. The town was incorporated in 1867, and the first mayor was elected in 1868.
Fremont was an important stop on the Grand Rapids and Indiana Railroad, which ran through the city from 1867 to 1971. The railroad brought many new people to the area, and the population of Fremont grew rapidly. The city was also home to several factories, including a paper mill, a furniture factory, and a canning factory.
Geography
Fremont is located in the northwestern corner of Michigan, in Newaygo County. It is situated on the banks of the White River, and is surrounded by rolling hills and forests. The city has a total area of 4.2 square miles, all of which is land.
The climate in Fremont is classified as humid continental, with warm summers and cold winters. The average temperature in the summer is around 75 degrees Fahrenheit, and the average temperature in the winter is around 25 degrees Fahrenheit.
Economy
Fremont’s economy is largely based on agriculture and manufacturing. The city is home to several factories, including a paper mill, a furniture factory, and a canning factory. The city also has a large tourism industry, with many visitors coming to the area to enjoy the natural beauty of the White River and the surrounding hills and forests.
Demographics
According to the 2010 census, Fremont has a population of 4,084. The racial makeup of the city is 94.3% White, 1.2% African American, 0.7% Native American, 0.4% Asian, 0.1% Pacific Islander, 1.2% from other races, and 2.1% from two or more races. The median household income in Fremont is $37,917, and the median family income is $45,938. The per capita income in Fremont is $19,845.
Common Questions
What is Per Capita Income in Fremont?
Per Capita income in Fremont is $27,475.
What is the Median Family Income in Fremont?
Median Family Income in Fremont is $69,403.
What is the Median Household income in Fremont?
Median Household Income in Fremont is $53,125.
What is Income or Wage Gap in Fremont?
Income or Wage Gap in Fremont is 53.1%.
Women in Fremont earn 46.9 cents for every dollar earned by a man.
What is Inequality or Gini Index in Fremont?
Inequality or Gini Index in Fremont is 0.40.
What is the Total Population of Fremont?
Total Population of Fremont is 4,510.
What is the Total Male Population of Fremont?
Total Male Population of Fremont is 1,891.
What is the Total Female Population of Fremont?
Total Female Population of Fremont is 2,619.
What is the Ratio of Males per 100 Females in Fremont?
There are 72.20 Males per 100 Females in Fremont.
What is the Ratio of Females per 100 Males in Fremont?
There are 138.50 Females per 100 Males in Fremont.
What is the Median Population Age in Fremont?
Median Population Age in Fremont is 37.9 Years.
What is the Average Family Size in Fremont
Average Family Size in Fremont is 3.4 People.
What is the Average Household Size in Fremont
Average Household Size in Fremont is 2.5 People.
How Large is the Labor Force in Fremont?
There are 2,050 People in the Labor Forcein in Fremont.
What is the Percentage of People in the Labor Force in Fremont?
62.3% of People are in the Labor Force in Fremont.
What is the Unemployment Rate in Fremont?
Unemployment Rate in Fremont is 3.2%.