Zip Codes with the Highest Percentage of Population Employed in Security & Protection in Pontiac, MI
RELATED REPORTS & OPTIONS
Security & Protection
Pontiac
Compare Zip Codes
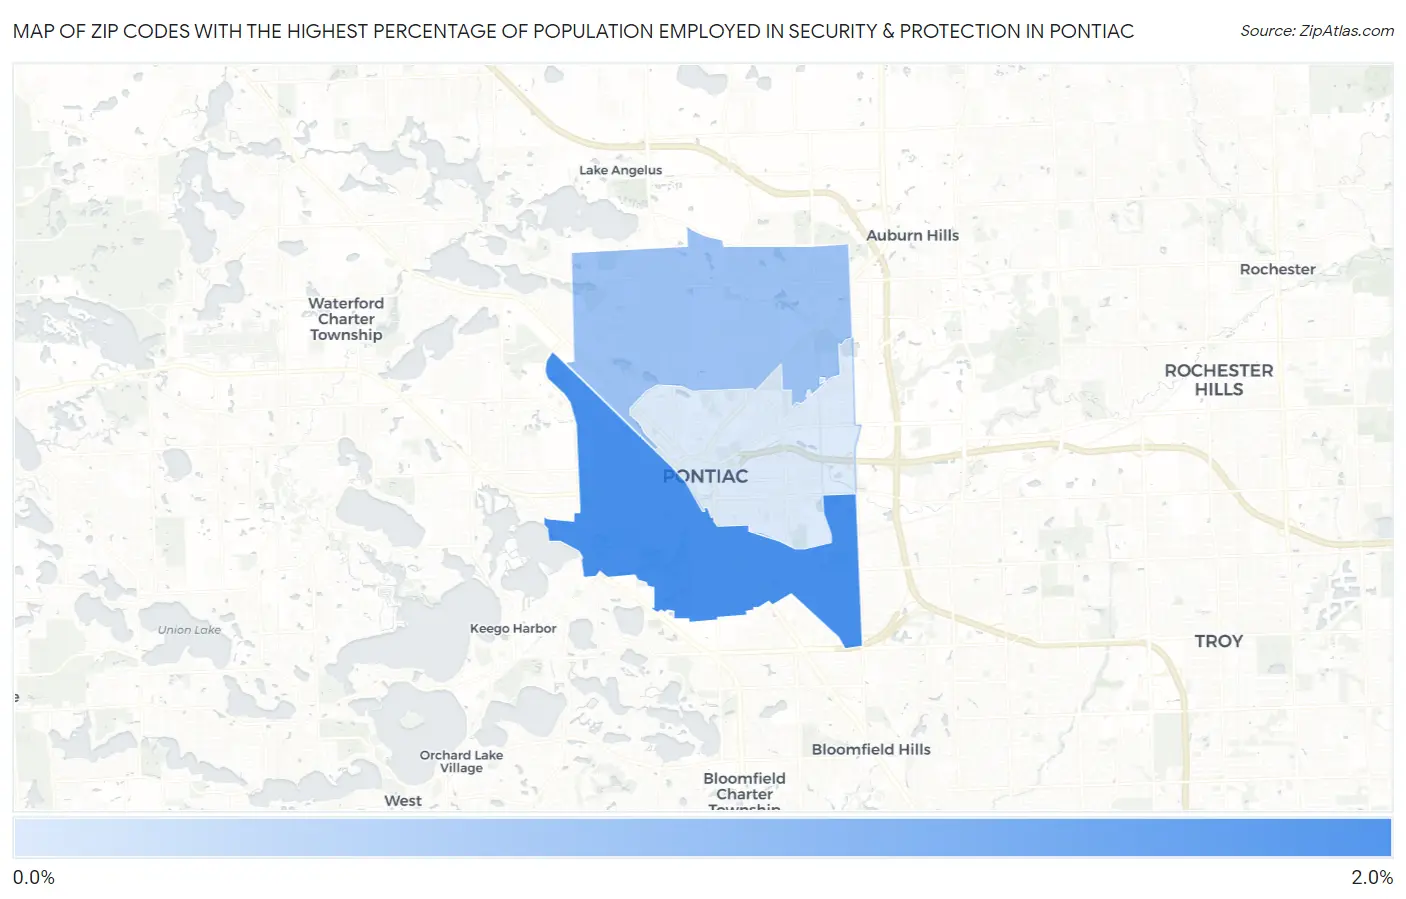
Map of Zip Codes with the Highest Percentage of Population Employed in Security & Protection in Pontiac
0.76%
1.7%
Zip Codes with the Highest Percentage of Population Employed in Security & Protection in Pontiac, MI
| Zip Code | % Employed | vs State | vs National | |
| 1. | 48341 | 1.7% | 1.6%(+0.097)#373 | 2.1%(-0.410)#14,401 |
| 2. | 48340 | 1.2% | 1.6%(-0.459)#556 | 2.1%(-0.966)#18,650 |
| 3. | 48342 | 0.76% | 1.6%(-0.877)#691 | 2.1%(-1.38)#21,635 |
1
Common Questions
What are the Top Zip Codes with the Highest Percentage of Population Employed in Security & Protection in Pontiac, MI?
Top Zip Codes with the Highest Percentage of Population Employed in Security & Protection in Pontiac, MI are:
What zip code has the Highest Percentage of Population Employed in Security & Protection in Pontiac, MI?
48341 has the Highest Percentage of Population Employed in Security & Protection in Pontiac, MI with 1.7%.
What is the Percentage of Population Employed in Security & Protection in Pontiac, MI?
Percentage of Population Employed in Security & Protection in Pontiac is 1.2%.
What is the Percentage of Population Employed in Security & Protection in Michigan?
Percentage of Population Employed in Security & Protection in Michigan is 1.6%.
What is the Percentage of Population Employed in Security & Protection in the United States?
Percentage of Population Employed in Security & Protection in the United States is 2.1%.