Zip Codes with the Highest Percentage of Population Employed in Security & Protection in Grosse Pointe, MI
RELATED REPORTS & OPTIONS
Security & Protection
Grosse Pointe
Compare Zip Codes
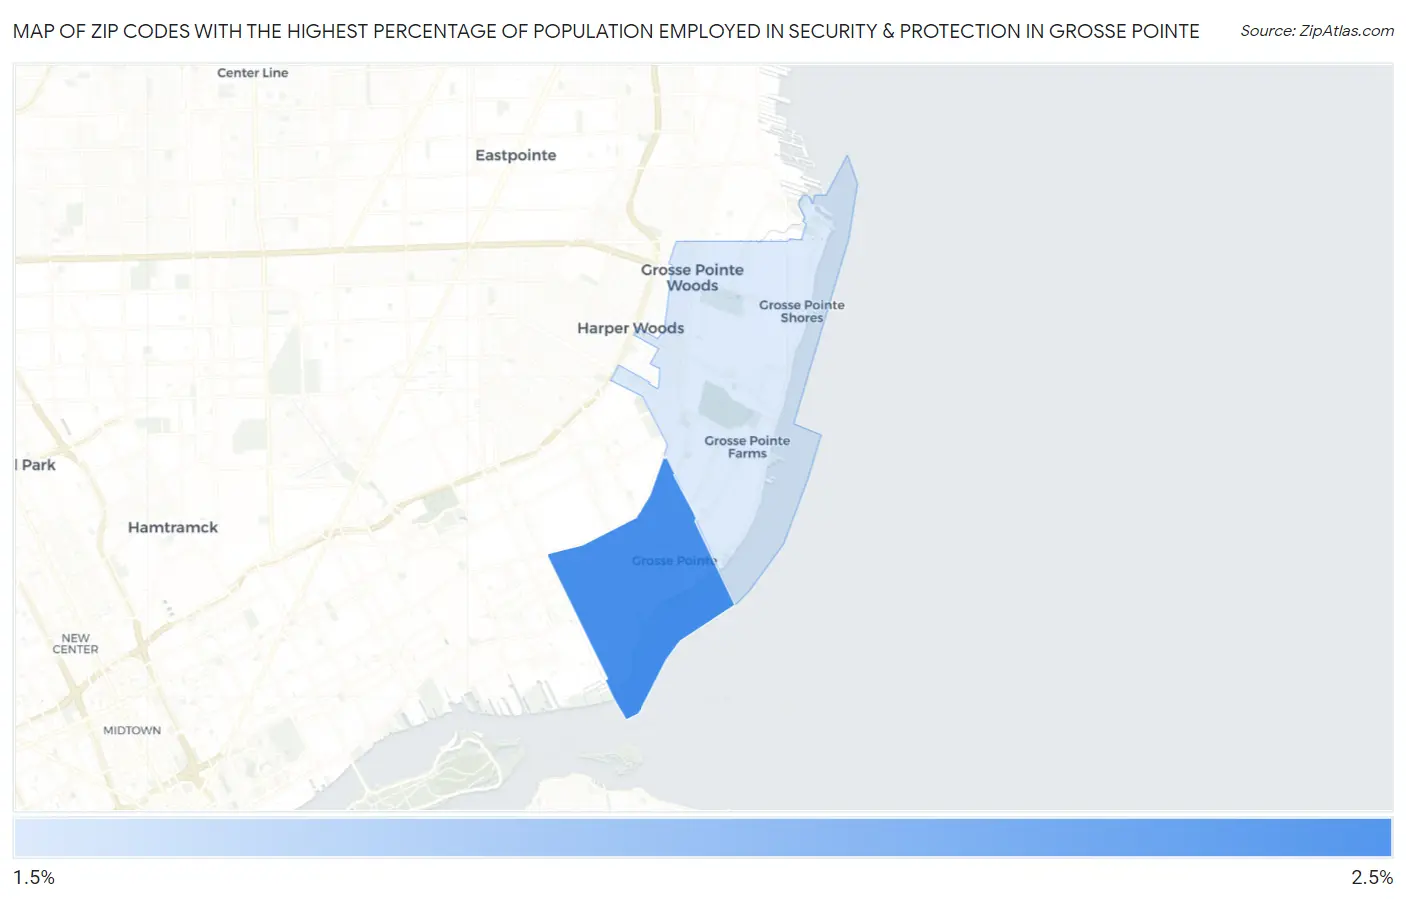
Map of Zip Codes with the Highest Percentage of Population Employed in Security & Protection in Grosse Pointe
1.7%
2.1%
Zip Codes with the Highest Percentage of Population Employed in Security & Protection in Grosse Pointe, MI
| Zip Code | % Employed | vs State | vs National | |
| 1. | 48230 | 2.1% | 1.6%(+0.463)#265 | 2.1%(-0.044)#11,875 |
| 2. | 48236 | 1.7% | 1.6%(+0.080)#378 | 2.1%(-0.427)#14,520 |
1
Common Questions
What are the Top Zip Codes with the Highest Percentage of Population Employed in Security & Protection in Grosse Pointe, MI?
Top Zip Codes with the Highest Percentage of Population Employed in Security & Protection in Grosse Pointe, MI are:
What zip code has the Highest Percentage of Population Employed in Security & Protection in Grosse Pointe, MI?
48230 has the Highest Percentage of Population Employed in Security & Protection in Grosse Pointe, MI with 2.1%.
What is the Percentage of Population Employed in Security & Protection in Grosse Pointe, MI?
Percentage of Population Employed in Security & Protection in Grosse Pointe is 1.6%.
What is the Percentage of Population Employed in Security & Protection in Michigan?
Percentage of Population Employed in Security & Protection in Michigan is 1.6%.
What is the Percentage of Population Employed in Security & Protection in the United States?
Percentage of Population Employed in Security & Protection in the United States is 2.1%.