Trowbridge Park, MI Map & Demographics
Trowbridge Park Map
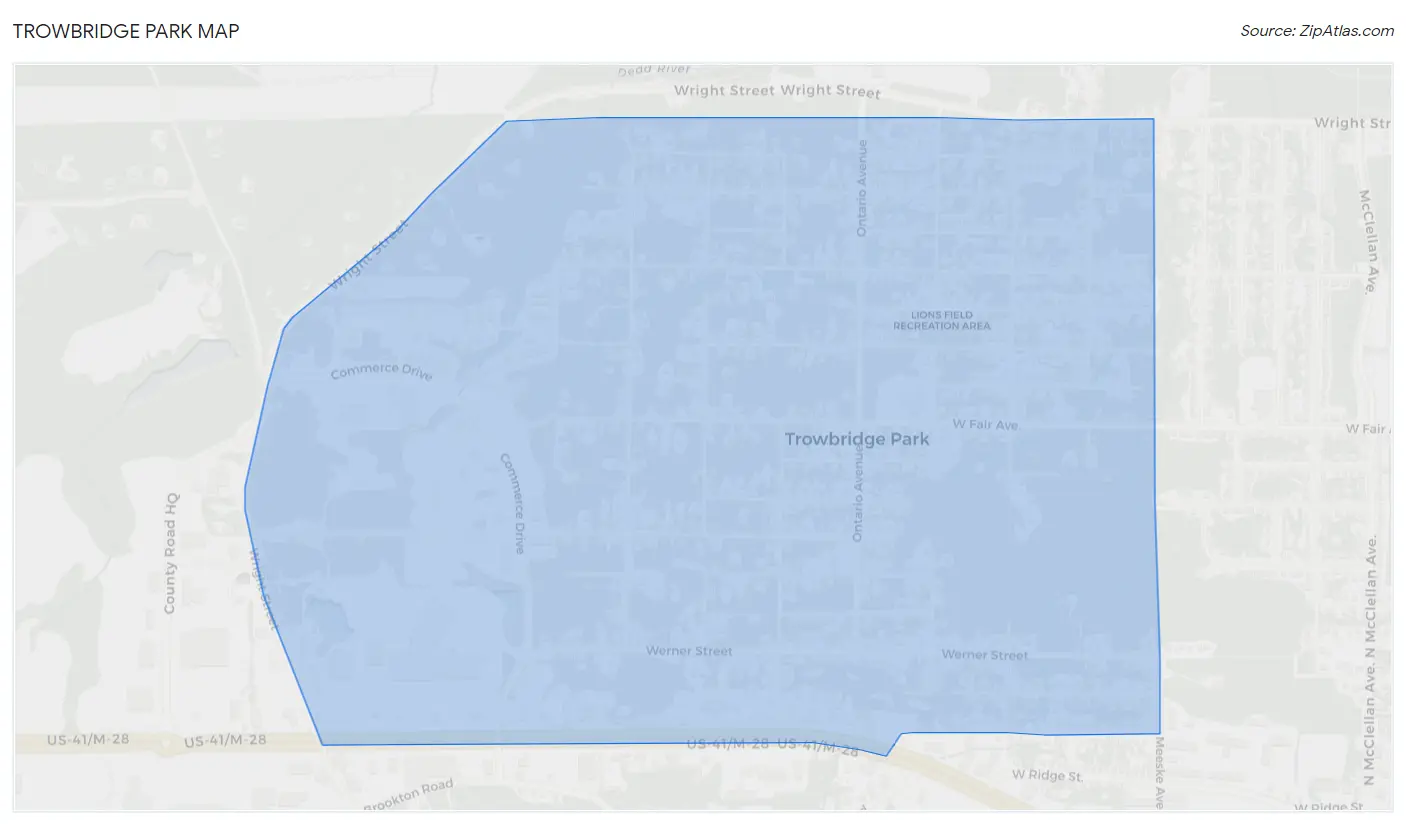
Trowbridge Park Overview
$33,185
PER CAPITA INCOME
$76,348
AVG FAMILY INCOME
$63,138
AVG HOUSEHOLD INCOME
57.7%
WAGE / INCOME GAP [ % ]
42.3¢/ $1
WAGE / INCOME GAP [ $ ]
0.38
INEQUALITY / GINI INDEX
2,153
TOTAL POPULATION
1,125
MALE POPULATION
1,028
FEMALE POPULATION
109.44
MALES / 100 FEMALES
91.38
FEMALES / 100 MALES
46.7
MEDIAN AGE
2.6
AVG FAMILY SIZE
2.1
AVG HOUSEHOLD SIZE
1,041
LABOR FORCE [ PEOPLE ]
52.9%
PERCENT IN LABOR FORCE
5.1%
UNEMPLOYMENT RATE
Income in Trowbridge Park
Income Overview in Trowbridge Park
Per Capita Income in Trowbridge Park is $33,185, while median incomes of families and households are $76,348 and $63,138 respectively.
| Characteristic | Number | Measure |
| Per Capita Income | 2,153 | $33,185 |
| Median Family Income | 569 | $76,348 |
| Mean Family Income | 569 | $85,906 |
| Median Household Income | 1,034 | $63,138 |
| Mean Household Income | 1,034 | $66,292 |
| Income Deficit | 569 | $0 |
| Wage / Income Gap (%) | 2,153 | 57.75% |
| Wage / Income Gap ($) | 2,153 | 42.25¢ per $1 |
| Gini / Inequality Index | 2,153 | 0.38 |
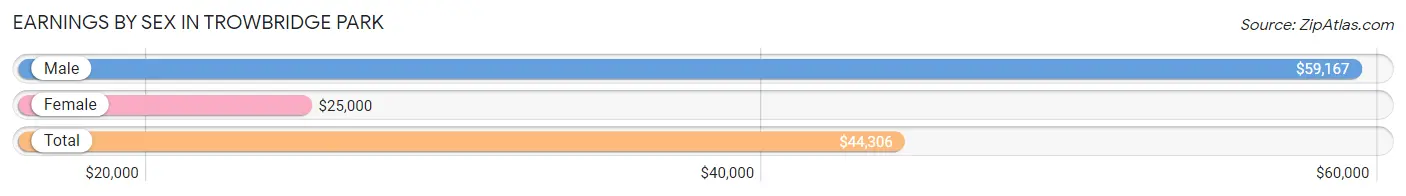
Earnings by Sex in Trowbridge Park
Average Earnings in Trowbridge Park are $44,306, $59,167 for men and $25,000 for women, a difference of 57.8%.
| Sex | Number | Average Earnings |
| Male | 554 (51.6%) | $59,167 |
| Female | 520 (48.4%) | $25,000 |
| Total | 1,074 (100.0%) | $44,306 |
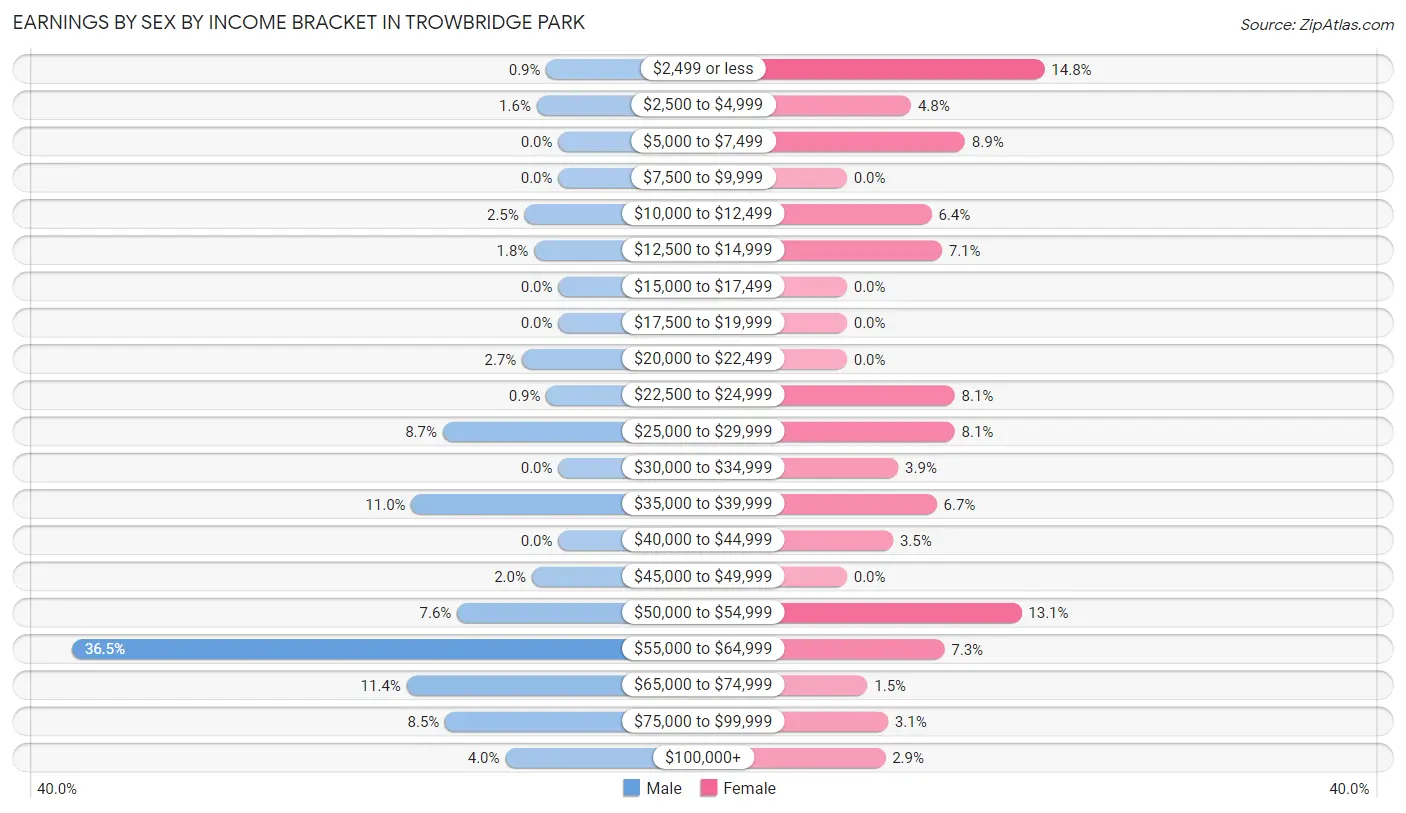
Earnings by Sex by Income Bracket in Trowbridge Park
The most common earnings brackets in Trowbridge Park are $55,000 to $64,999 for men (202 | 36.5%) and $2,499 or less for women (77 | 14.8%).
| Income | Male | Female |
| $2,499 or less | 5 (0.9%) | 77 (14.8%) |
| $2,500 to $4,999 | 9 (1.6%) | 25 (4.8%) |
| $5,000 to $7,499 | 0 (0.0%) | 46 (8.8%) |
| $7,500 to $9,999 | 0 (0.0%) | 0 (0.0%) |
| $10,000 to $12,499 | 14 (2.5%) | 33 (6.4%) |
| $12,500 to $14,999 | 10 (1.8%) | 37 (7.1%) |
| $15,000 to $17,499 | 0 (0.0%) | 0 (0.0%) |
| $17,500 to $19,999 | 0 (0.0%) | 0 (0.0%) |
| $20,000 to $22,499 | 15 (2.7%) | 0 (0.0%) |
| $22,500 to $24,999 | 5 (0.9%) | 42 (8.1%) |
| $25,000 to $29,999 | 48 (8.7%) | 42 (8.1%) |
| $30,000 to $34,999 | 0 (0.0%) | 20 (3.8%) |
| $35,000 to $39,999 | 61 (11.0%) | 35 (6.7%) |
| $40,000 to $44,999 | 0 (0.0%) | 18 (3.5%) |
| $45,000 to $49,999 | 11 (2.0%) | 0 (0.0%) |
| $50,000 to $54,999 | 42 (7.6%) | 68 (13.1%) |
| $55,000 to $64,999 | 202 (36.5%) | 38 (7.3%) |
| $65,000 to $74,999 | 63 (11.4%) | 8 (1.5%) |
| $75,000 to $99,999 | 47 (8.5%) | 16 (3.1%) |
| $100,000+ | 22 (4.0%) | 15 (2.9%) |
| Total | 554 (100.0%) | 520 (100.0%) |
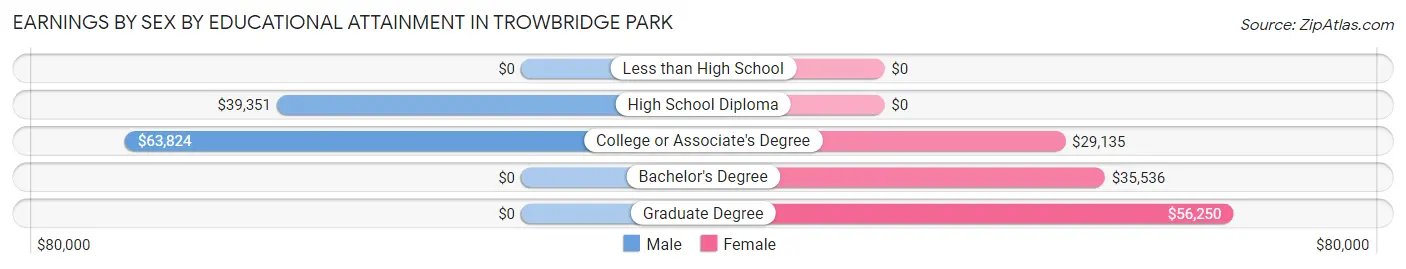
Earnings by Sex by Educational Attainment in Trowbridge Park
Average earnings in Trowbridge Park are $52,348 for men and $38,864 for women, a difference of 25.8%. Men with an educational attainment of college or associate's degree enjoy the highest average annual earnings of $63,824, while those with high school diploma education earn the least with $39,351. Women with an educational attainment of graduate degree earn the most with the average annual earnings of $56,250, while those with college or associate's degree education have the smallest earnings of $29,135.
| Educational Attainment | Male Income | Female Income |
| Less than High School | - | - |
| High School Diploma | $39,351 | $0 |
| College or Associate's Degree | $63,824 | $29,135 |
| Bachelor's Degree | - | - |
| Graduate Degree | - | - |
| Total | $52,348 | $38,864 |
Family Income in Trowbridge Park
Family Income Brackets in Trowbridge Park
According to the Trowbridge Park family income data, there are 175 families falling into the $50,000 to $74,999 income range, which is the most common income bracket and makes up 30.8% of all families.
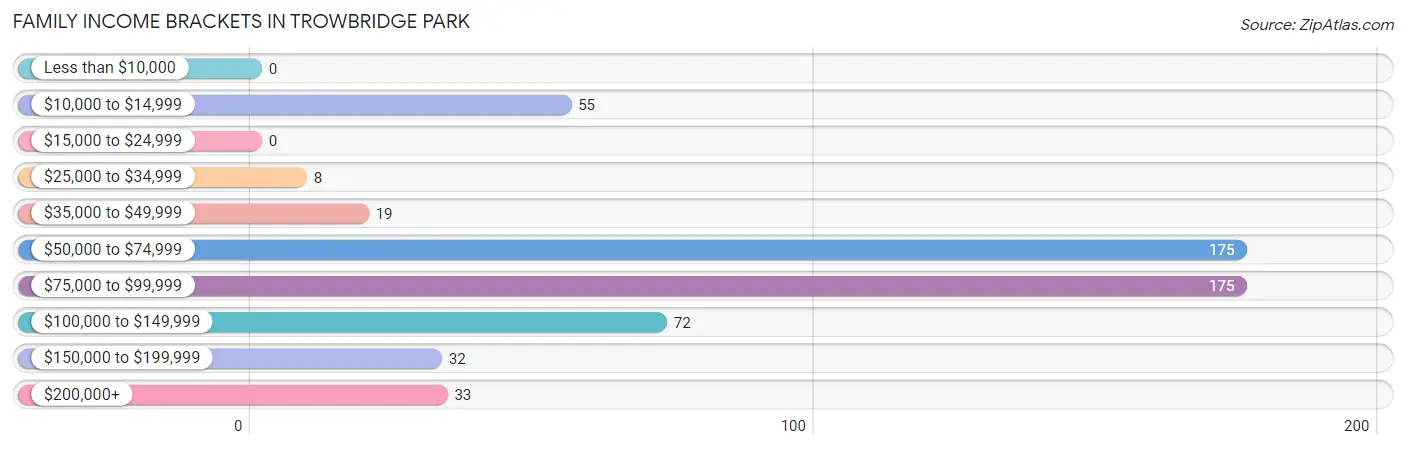
| Income Bracket | # Families | % Families |
| Less than $10,000 | 0 | 0.0% |
| $10,000 to $14,999 | 55 | 9.7% |
| $15,000 to $24,999 | 0 | 0.0% |
| $25,000 to $34,999 | 8 | 1.4% |
| $35,000 to $49,999 | 19 | 3.3% |
| $50,000 to $74,999 | 175 | 30.8% |
| $75,000 to $99,999 | 175 | 30.8% |
| $100,000 to $149,999 | 72 | 12.7% |
| $150,000 to $199,999 | 32 | 5.6% |
| $200,000+ | 33 | 5.8% |
Family Income by Famaliy Size in Trowbridge Park
2-person families (371 | 65.2%) account for the highest median family income in Trowbridge Park with $79,542 per family, while 2-person families (371 | 65.2%) have the highest median income of $39,771 per family member.
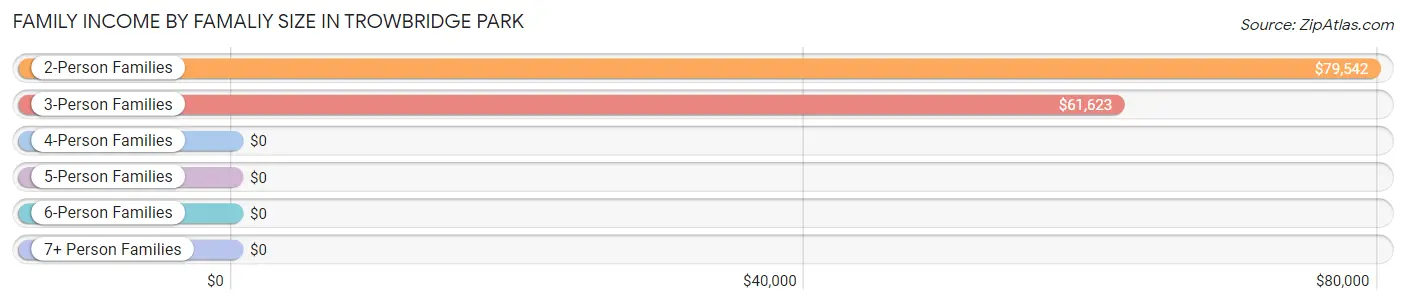
| Income Bracket | # Families | Median Income |
| 2-Person Families | 371 (65.2%) | $79,542 |
| 3-Person Families | 174 (30.6%) | $61,623 |
| 4-Person Families | 16 (2.8%) | $0 |
| 5-Person Families | 0 (0.0%) | $0 |
| 6-Person Families | 8 (1.4%) | $0 |
| 7+ Person Families | 0 (0.0%) | $0 |
| Total | 569 (100.0%) | $76,348 |
Family Income by Number of Earners in Trowbridge Park
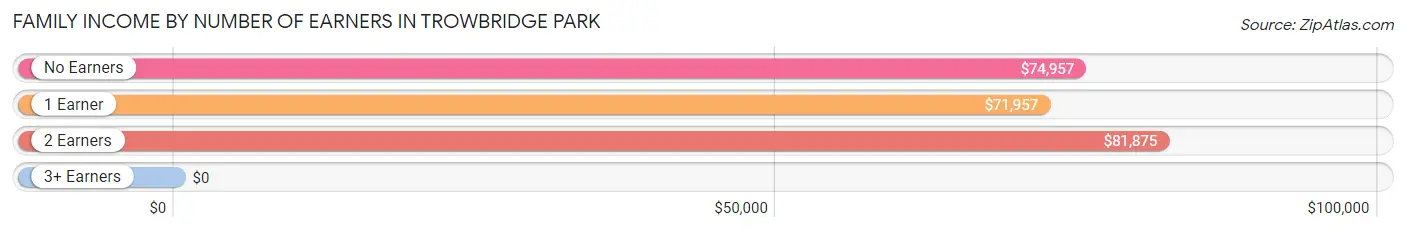
| Number of Earners | # Families | Median Income |
| No Earners | 189 (33.2%) | $74,957 |
| 1 Earner | 148 (26.0%) | $71,957 |
| 2 Earners | 216 (38.0%) | $81,875 |
| 3+ Earners | 16 (2.8%) | $0 |
| Total | 569 (100.0%) | $76,348 |
Household Income in Trowbridge Park
Household Income Brackets in Trowbridge Park
With 263 households falling in the category, the $15,000 to $24,999 income range is the most frequent in Trowbridge Park, accounting for 25.4% of all households. In contrast, only 16 households (1.5%) fall into the less than $10,000 income bracket, making it the least populous group.
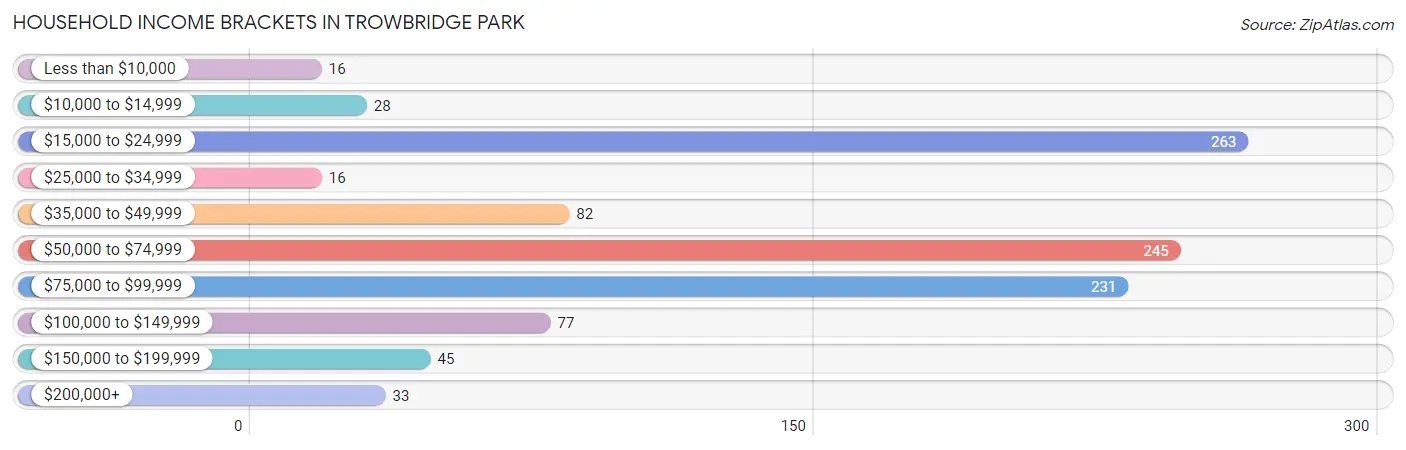
| Income Bracket | # Households | % Households |
| Less than $10,000 | 16 | 1.5% |
| $10,000 to $14,999 | 28 | 2.7% |
| $15,000 to $24,999 | 263 | 25.4% |
| $25,000 to $34,999 | 16 | 1.5% |
| $35,000 to $49,999 | 82 | 7.9% |
| $50,000 to $74,999 | 245 | 23.7% |
| $75,000 to $99,999 | 231 | 22.3% |
| $100,000 to $149,999 | 77 | 7.4% |
| $150,000 to $199,999 | 45 | 4.4% |
| $200,000+ | 33 | 3.2% |
Household Income by Householder Age in Trowbridge Park
The median household income in Trowbridge Park is $63,138, with the highest median household income of $76,530 found in the 45 to 64 years age bracket for the primary householder. A total of 326 households (31.5%) fall into this category. Meanwhile, the 15 to 24 years age bracket for the primary householder has the lowest median household income of $0, with 107 households (10.3%) in this group.
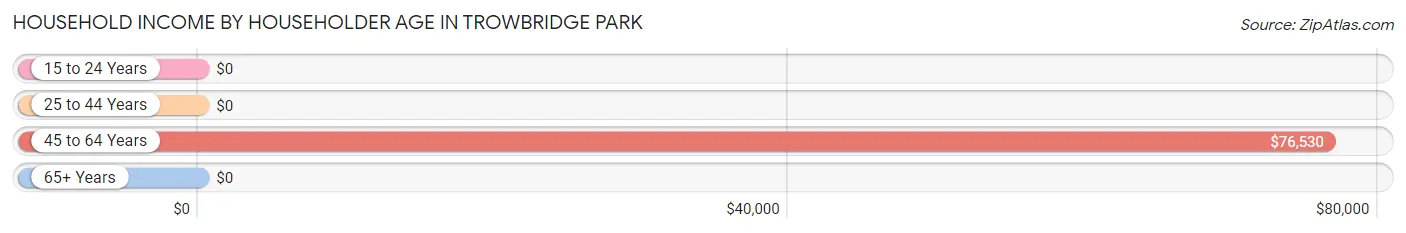
| Income Bracket | # Households | Median Income |
| 15 to 24 Years | 107 (10.3%) | $0 |
| 25 to 44 Years | 173 (16.7%) | $0 |
| 45 to 64 Years | 326 (31.5%) | $76,530 |
| 65+ Years | 428 (41.4%) | $0 |
| Total | 1,034 (100.0%) | $63,138 |
Poverty in Trowbridge Park
Income Below Poverty by Sex and Age in Trowbridge Park
With 13.6% poverty level for males and 14.2% for females among the residents of Trowbridge Park, 25 to 34 year old males and 18 to 24 year old females are the most vulnerable to poverty, with 65 males (36.7%) and 70 females (33.0%) in their respective age groups living below the poverty level.
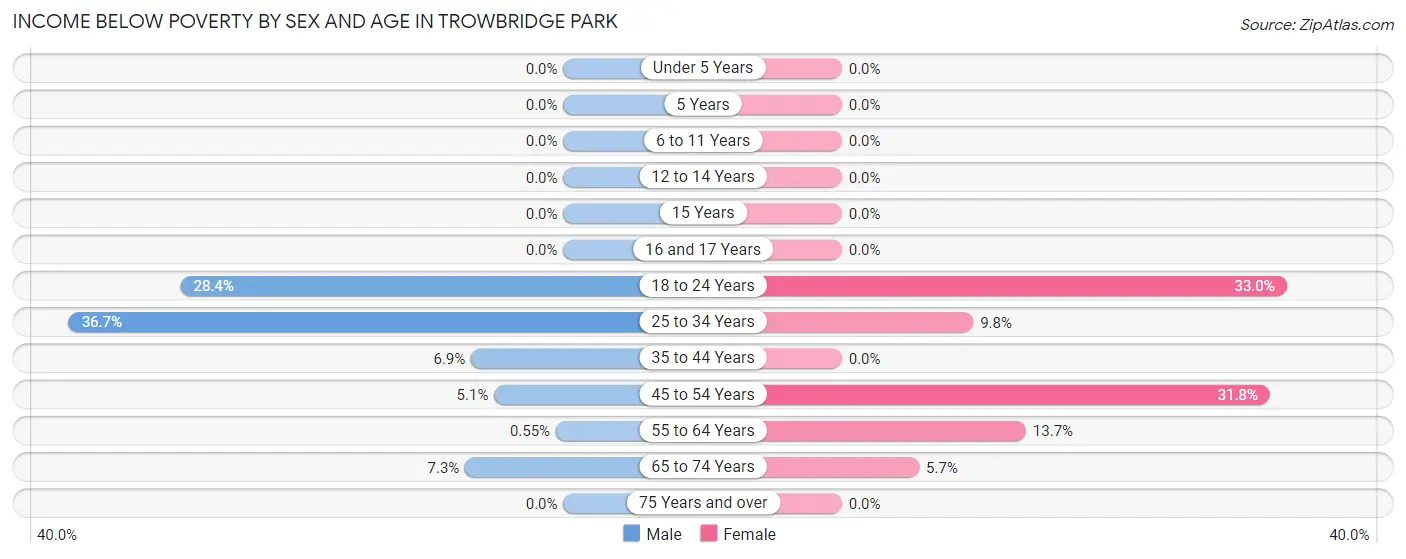
| Age Bracket | Male | Female |
| Under 5 Years | 0 (0.0%) | 0 (0.0%) |
| 5 Years | 0 (0.0%) | 0 (0.0%) |
| 6 to 11 Years | 0 (0.0%) | 0 (0.0%) |
| 12 to 14 Years | 0 (0.0%) | 0 (0.0%) |
| 15 Years | 0 (0.0%) | 0 (0.0%) |
| 16 and 17 Years | 0 (0.0%) | 0 (0.0%) |
| 18 to 24 Years | 54 (28.4%) | 70 (33.0%) |
| 25 to 34 Years | 65 (36.7%) | 16 (9.8%) |
| 35 to 44 Years | 5 (6.9%) | 0 (0.0%) |
| 45 to 54 Years | 4 (5.1%) | 34 (31.8%) |
| 55 to 64 Years | 1 (0.5%) | 19 (13.7%) |
| 65 to 74 Years | 24 (7.3%) | 7 (5.7%) |
| 75 Years and over | 0 (0.0%) | 0 (0.0%) |
| Total | 153 (13.6%) | 146 (14.2%) |
Income Above Poverty by Sex and Age in Trowbridge Park
According to the poverty statistics in Trowbridge Park, males aged 6 to 11 years and females aged under 5 years are the age groups that are most secure financially, with 100.0% of males and 100.0% of females in these age groups living above the poverty line.
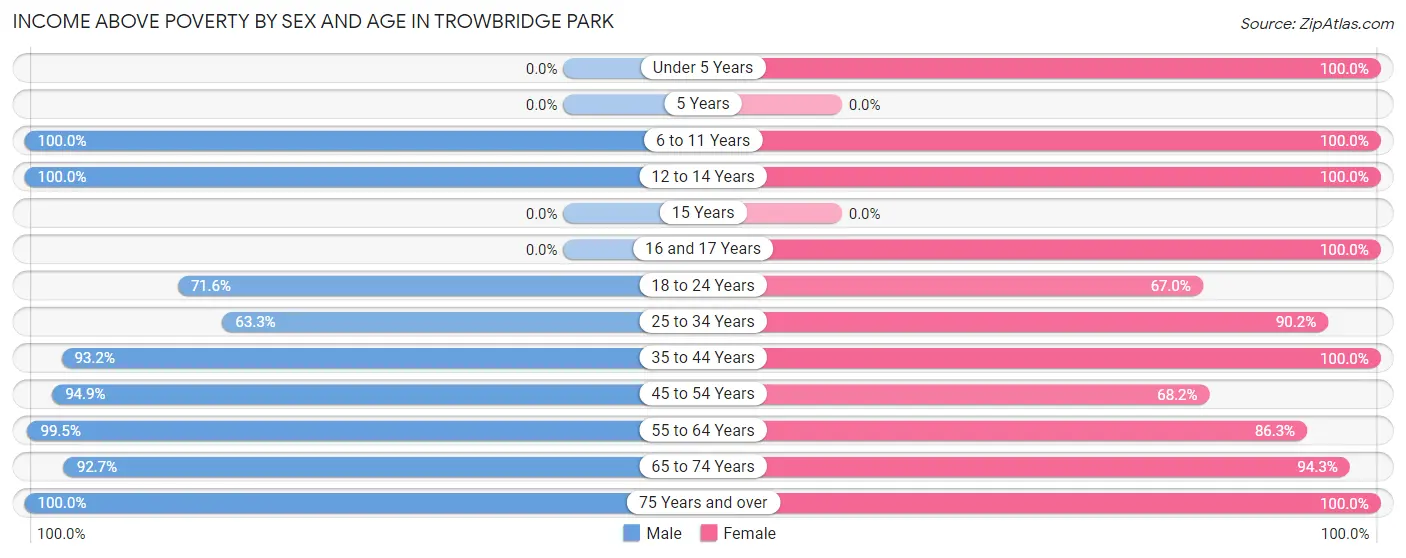
| Age Bracket | Male | Female |
| Under 5 Years | 0 (0.0%) | 54 (100.0%) |
| 5 Years | 0 (0.0%) | 0 (0.0%) |
| 6 to 11 Years | 20 (100.0%) | 72 (100.0%) |
| 12 to 14 Years | 10 (100.0%) | 30 (100.0%) |
| 15 Years | 0 (0.0%) | 0 (0.0%) |
| 16 and 17 Years | 0 (0.0%) | 10 (100.0%) |
| 18 to 24 Years | 136 (71.6%) | 142 (67.0%) |
| 25 to 34 Years | 112 (63.3%) | 148 (90.2%) |
| 35 to 44 Years | 68 (93.1%) | 24 (100.0%) |
| 45 to 54 Years | 74 (94.9%) | 73 (68.2%) |
| 55 to 64 Years | 182 (99.5%) | 120 (86.3%) |
| 65 to 74 Years | 305 (92.7%) | 115 (94.3%) |
| 75 Years and over | 65 (100.0%) | 92 (100.0%) |
| Total | 972 (86.4%) | 880 (85.8%) |
Income Below Poverty Among Married-Couple Families in Trowbridge Park
The poverty statistics for married-couple families in Trowbridge Park show that 5.1% or 21 of the total 415 families live below the poverty line. Families with no children have the highest poverty rate of 6.7%, comprising of 21 families. On the other hand, families with 1 or 2 children have the lowest poverty rate of 0.0%, which includes 0 families.
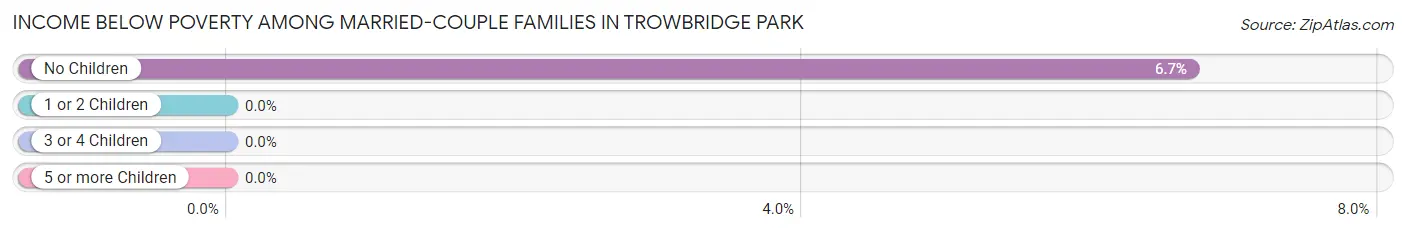
| Children | Above Poverty | Below Poverty |
| No Children | 293 (93.3%) | 21 (6.7%) |
| 1 or 2 Children | 101 (100.0%) | 0 (0.0%) |
| 3 or 4 Children | 0 (0.0%) | 0 (0.0%) |
| 5 or more Children | 0 (0.0%) | 0 (0.0%) |
| Total | 394 (94.9%) | 21 (5.1%) |
Income Below Poverty Among Single-Parent Households in Trowbridge Park
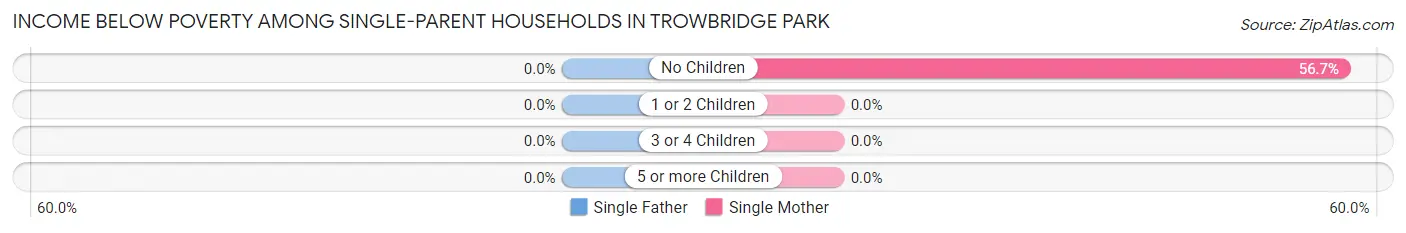
| Children | Single Father | Single Mother |
| No Children | 0 (0.0%) | 34 (56.7%) |
| 1 or 2 Children | 0 (0.0%) | 0 (0.0%) |
| 3 or 4 Children | 0 (0.0%) | 0 (0.0%) |
| 5 or more Children | 0 (0.0%) | 0 (0.0%) |
| Total | 0 (0.0%) | 34 (39.1%) |
Income Below Poverty Among Married-Couple vs Single-Parent Households in Trowbridge Park
The poverty data for Trowbridge Park shows that 21 of the married-couple family households (5.1%) and 34 of the single-parent households (22.1%) are living below the poverty level. Within the married-couple family households, those with no children have the highest poverty rate, with 21 households (6.7%) falling below the poverty line. Among the single-parent households, those with no children have the highest poverty rate, with 34 household (32.7%) living below poverty.
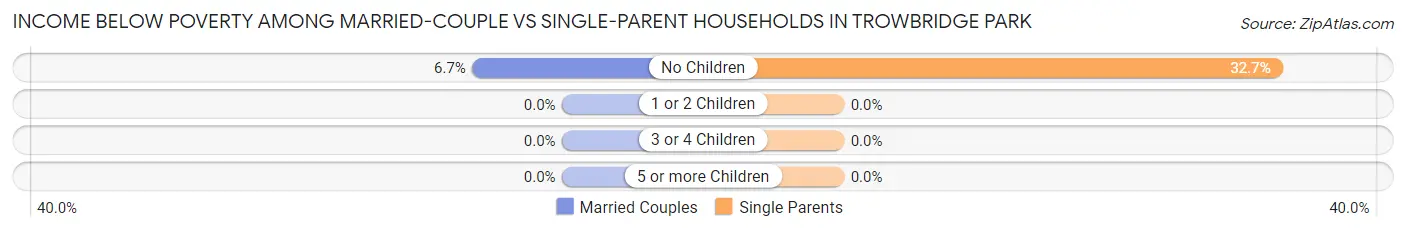
| Children | Married-Couple Families | Single-Parent Households |
| No Children | 21 (6.7%) | 34 (32.7%) |
| 1 or 2 Children | 0 (0.0%) | 0 (0.0%) |
| 3 or 4 Children | 0 (0.0%) | 0 (0.0%) |
| 5 or more Children | 0 (0.0%) | 0 (0.0%) |
| Total | 21 (5.1%) | 34 (22.1%) |
Race in Trowbridge Park
The most populous races in Trowbridge Park are White / Caucasian (2,105 | 97.8%), Black / African American (36 | 1.7%), and Native / Alaskan (12 | 0.6%).
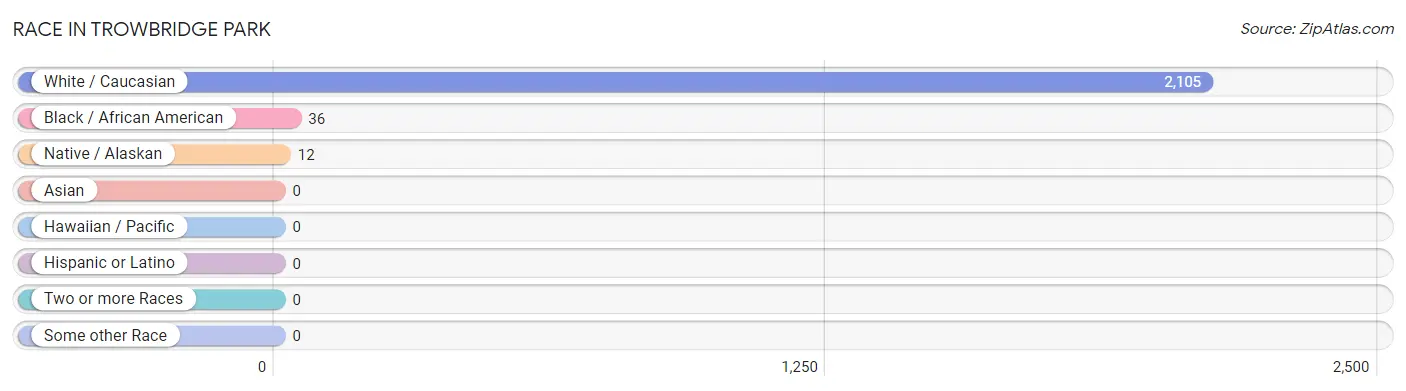
| Race | # Population | % Population |
| Asian | 0 | 0.0% |
| Black / African American | 36 | 1.7% |
| Hawaiian / Pacific | 0 | 0.0% |
| Hispanic or Latino | 0 | 0.0% |
| Native / Alaskan | 12 | 0.6% |
| White / Caucasian | 2,105 | 97.8% |
| Two or more Races | 0 | 0.0% |
| Some other Race | 0 | 0.0% |
| Total | 2,153 | 100.0% |
Ancestry in Trowbridge Park
The most populous ancestries reported in Trowbridge Park are Finnish (532 | 24.7%), English (522 | 24.2%), German (438 | 20.3%), French (253 | 11.7%), and Swedish (183 | 8.5%), together accounting for 89.5% of all Trowbridge Park residents.
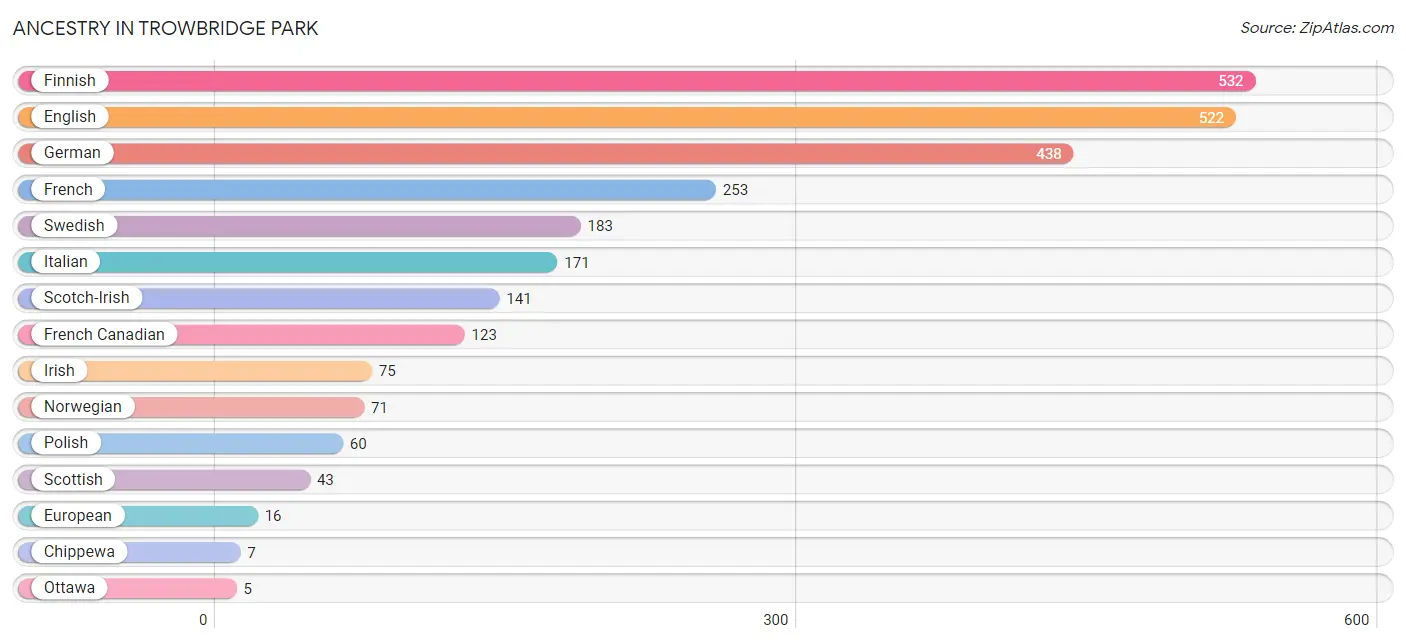
| Ancestry | # Population | % Population |
| Chippewa | 7 | 0.3% |
| Dutch | 4 | 0.2% |
| English | 522 | 24.2% |
| European | 16 | 0.7% |
| Finnish | 532 | 24.7% |
| French | 253 | 11.7% |
| French Canadian | 123 | 5.7% |
| German | 438 | 20.3% |
| Irish | 75 | 3.5% |
| Italian | 171 | 7.9% |
| Norwegian | 71 | 3.3% |
| Ottawa | 5 | 0.2% |
| Polish | 60 | 2.8% |
| Scotch-Irish | 141 | 6.6% |
| Scottish | 43 | 2.0% |
| Swedish | 183 | 8.5% | View All 16 Rows |
Immigrants in Trowbridge Park

| Immigration Origin | # Population | % Population | View All 0 Rows |
Sex and Age in Trowbridge Park
Sex and Age in Trowbridge Park
The most populous age groups in Trowbridge Park are 65 to 69 Years (263 | 23.4%) for men and 20 to 24 Years (189 | 18.4%) for women.
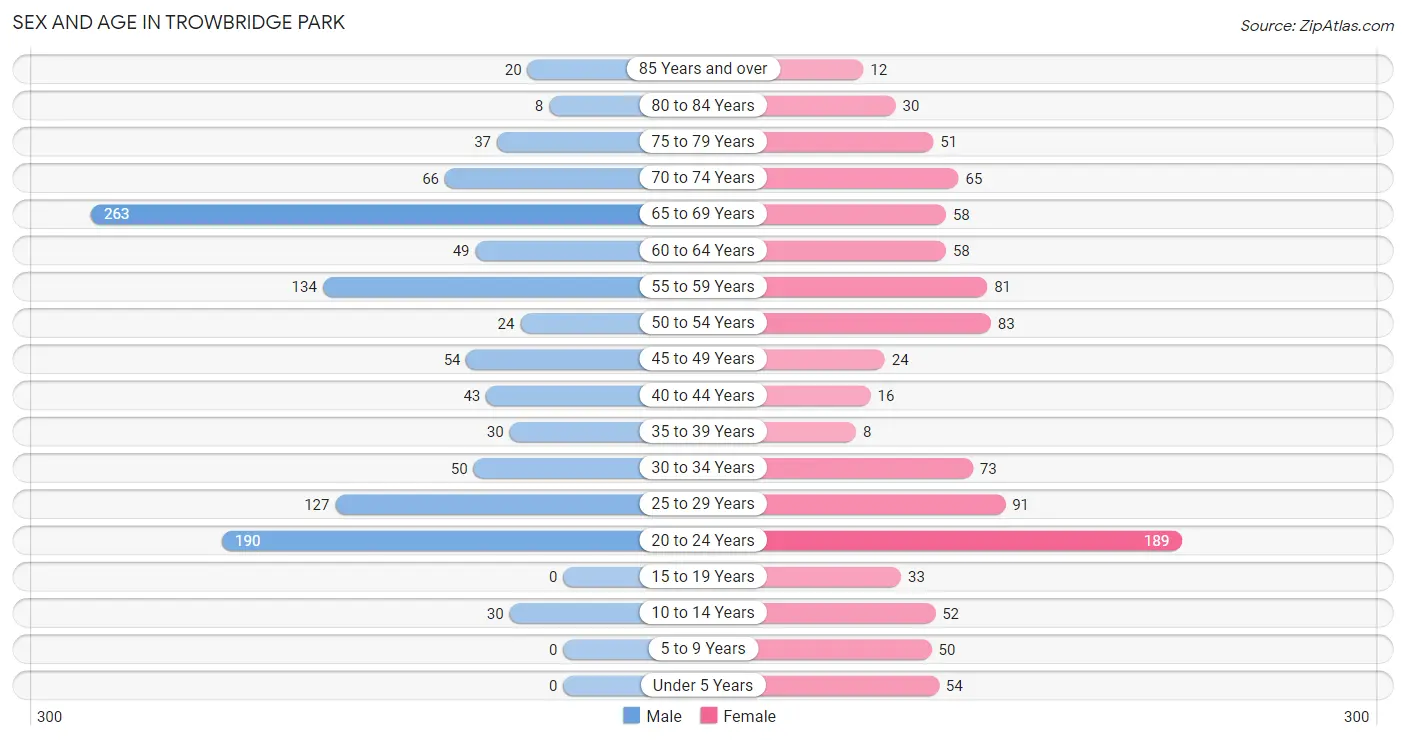
| Age Bracket | Male | Female |
| Under 5 Years | 0 (0.0%) | 54 (5.2%) |
| 5 to 9 Years | 0 (0.0%) | 50 (4.9%) |
| 10 to 14 Years | 30 (2.7%) | 52 (5.1%) |
| 15 to 19 Years | 0 (0.0%) | 33 (3.2%) |
| 20 to 24 Years | 190 (16.9%) | 189 (18.4%) |
| 25 to 29 Years | 127 (11.3%) | 91 (8.8%) |
| 30 to 34 Years | 50 (4.4%) | 73 (7.1%) |
| 35 to 39 Years | 30 (2.7%) | 8 (0.8%) |
| 40 to 44 Years | 43 (3.8%) | 16 (1.6%) |
| 45 to 49 Years | 54 (4.8%) | 24 (2.3%) |
| 50 to 54 Years | 24 (2.1%) | 83 (8.1%) |
| 55 to 59 Years | 134 (11.9%) | 81 (7.9%) |
| 60 to 64 Years | 49 (4.4%) | 58 (5.6%) |
| 65 to 69 Years | 263 (23.4%) | 58 (5.6%) |
| 70 to 74 Years | 66 (5.9%) | 65 (6.3%) |
| 75 to 79 Years | 37 (3.3%) | 51 (5.0%) |
| 80 to 84 Years | 8 (0.7%) | 30 (2.9%) |
| 85 Years and over | 20 (1.8%) | 12 (1.2%) |
| Total | 1,125 (100.0%) | 1,028 (100.0%) |
Families and Households in Trowbridge Park
Median Family Size in Trowbridge Park
The median family size in Trowbridge Park is 2.61 persons per family, with single female/mother families (87 | 15.3%) accounting for the largest median family size of 3.34 persons per family. On the other hand, married-couple families (415 | 72.9%) represent the smallest median family size with 2.45 persons per family.
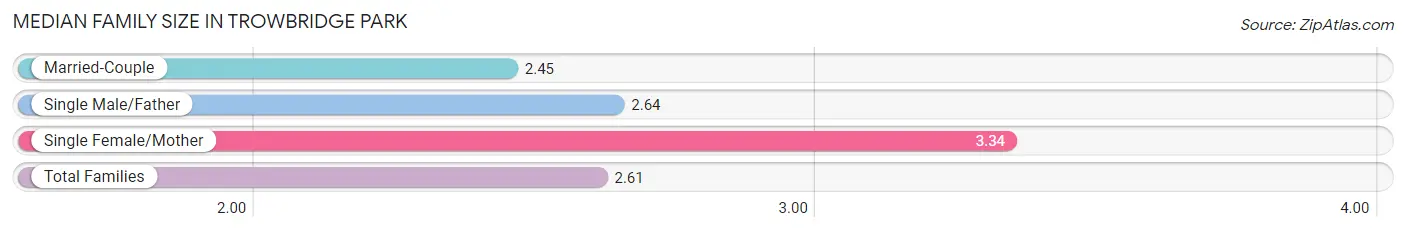
| Family Type | # Families | Family Size |
| Married-Couple | 415 (72.9%) | 2.45 |
| Single Male/Father | 67 (11.8%) | 2.64 |
| Single Female/Mother | 87 (15.3%) | 3.34 |
| Total Families | 569 (100.0%) | 2.61 |
Median Household Size in Trowbridge Park
The median household size in Trowbridge Park is 2.06 persons per household, with single female/mother households (87 | 8.4%) accounting for the largest median household size of 3.97 persons per household. non-family households (465 | 45.0%) represent the smallest median household size with 1.24 persons per household.
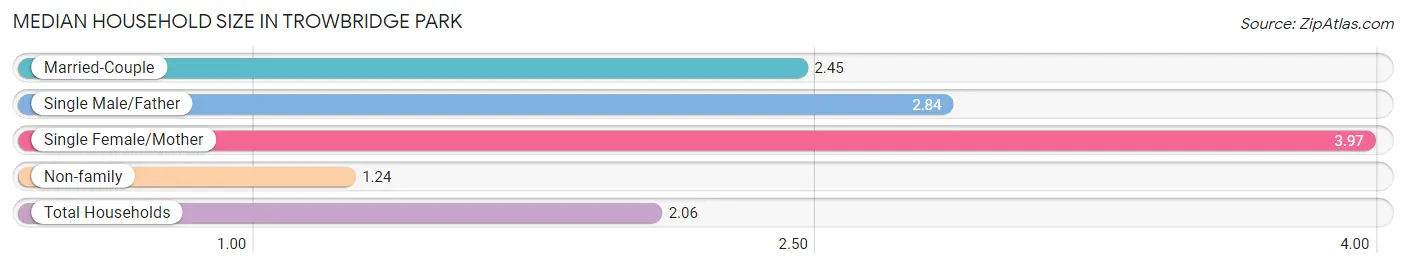
| Household Type | # Households | Household Size |
| Married-Couple | 415 (40.1%) | 2.45 |
| Single Male/Father | 67 (6.5%) | 2.84 |
| Single Female/Mother | 87 (8.4%) | 3.97 |
| Non-family | 465 (45.0%) | 1.24 |
| Total Households | 1,034 (100.0%) | 2.06 |
Household Size by Marriage Status in Trowbridge Park
Out of a total of 1,034 households in Trowbridge Park, 569 (55.0%) are family households, while 465 (45.0%) are nonfamily households. The most numerous type of family households are 2-person households, comprising 358, and the most common type of nonfamily households are 1-person households, comprising 381.
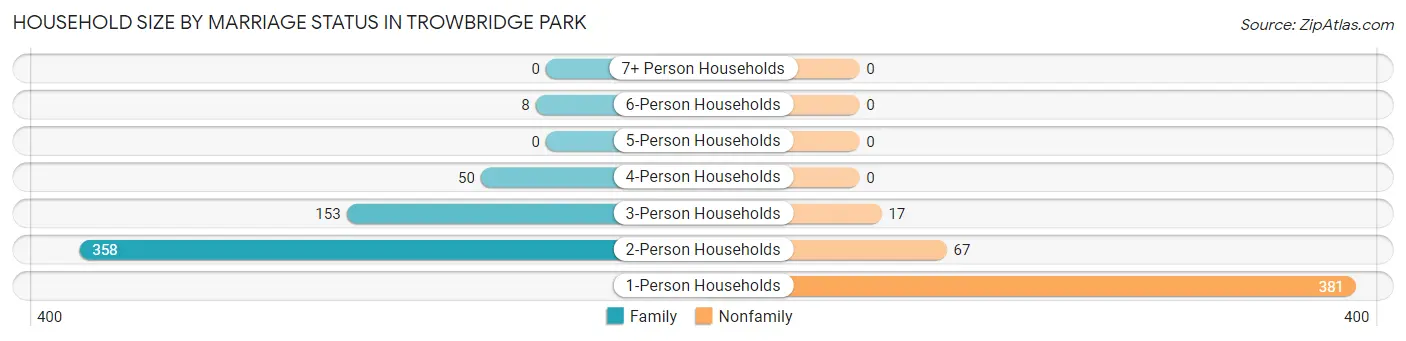
| Household Size | Family Households | Nonfamily Households |
| 1-Person Households | - | 381 (36.8%) |
| 2-Person Households | 358 (34.6%) | 67 (6.5%) |
| 3-Person Households | 153 (14.8%) | 17 (1.6%) |
| 4-Person Households | 50 (4.8%) | 0 (0.0%) |
| 5-Person Households | 0 (0.0%) | 0 (0.0%) |
| 6-Person Households | 8 (0.8%) | 0 (0.0%) |
| 7+ Person Households | 0 (0.0%) | 0 (0.0%) |
| Total | 569 (55.0%) | 465 (45.0%) |
Female Fertility in Trowbridge Park
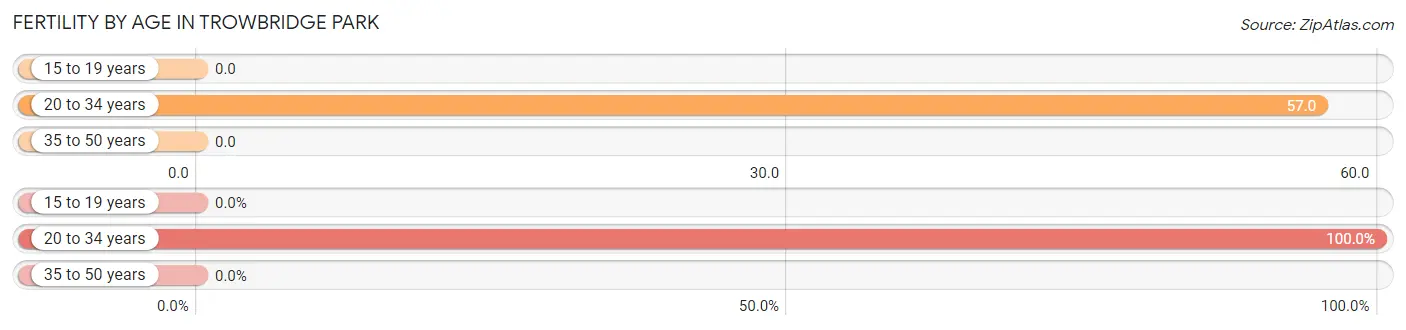
Fertility by Age in Trowbridge Park
Average fertility rate in Trowbridge Park is 45.0 births per 1,000 women. Women in the age bracket of 20 to 34 years have the highest fertility rate with 57.0 births per 1,000 women. Women in the age bracket of 20 to 34 years acount for 100.0% of all women with births.
| Age Bracket | Women with Births | Births / 1,000 Women |
| 15 to 19 years | 0 (0.0%) | 0.0 |
| 20 to 34 years | 20 (100.0%) | 57.0 |
| 35 to 50 years | 0 (0.0%) | 0.0 |
| Total | 20 (100.0%) | 45.0 |
Fertility by Age by Marriage Status in Trowbridge Park
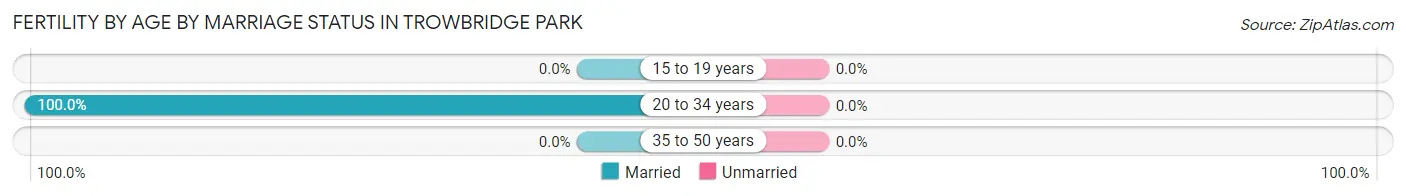
| Age Bracket | Married | Unmarried |
| 15 to 19 years | 0 (0.0%) | 0 (0.0%) |
| 20 to 34 years | 20 (100.0%) | 0 (0.0%) |
| 35 to 50 years | 0 (0.0%) | 0 (0.0%) |
| Total | 20 (100.0%) | 0 (0.0%) |
Fertility by Education in Trowbridge Park
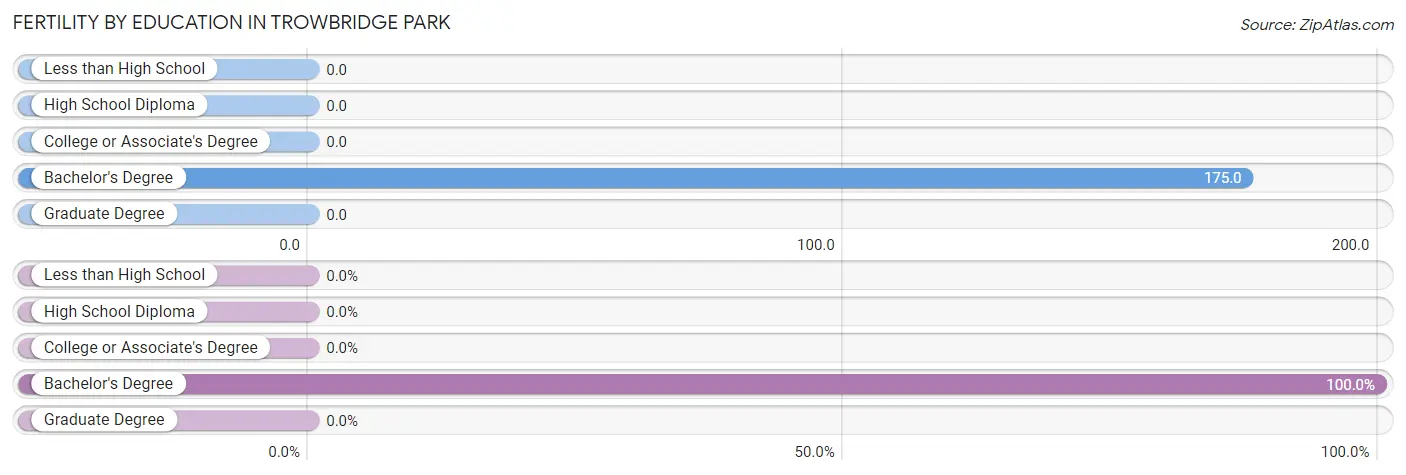
| Educational Attainment | Women with Births | Births / 1,000 Women |
| Less than High School | 0 (0.0%) | 0.0 |
| High School Diploma | 0 (0.0%) | 0.0 |
| College or Associate's Degree | 0 (0.0%) | 0.0 |
| Bachelor's Degree | 20 (100.0%) | 175.0 |
| Graduate Degree | 0 (0.0%) | 0.0 |
| Total | 20 (100.0%) | 45.0 |
Fertility by Education by Marriage Status in Trowbridge Park
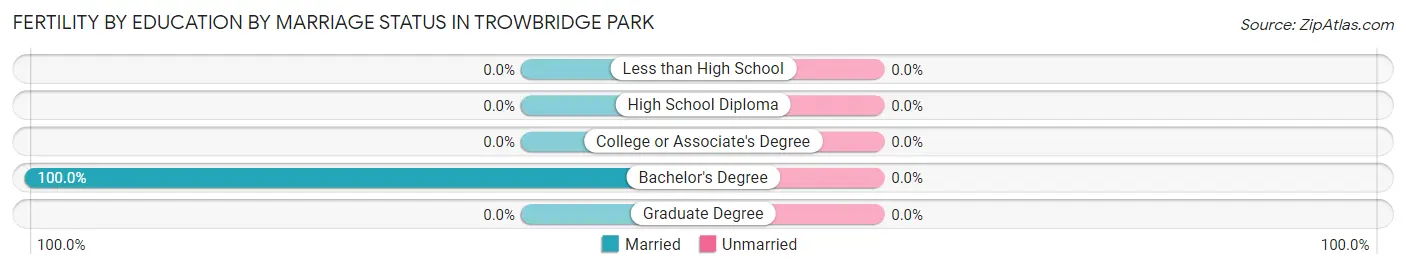
| Educational Attainment | Married | Unmarried |
| Less than High School | 0 (0.0%) | 0 (0.0%) |
| High School Diploma | 0 (0.0%) | 0 (0.0%) |
| College or Associate's Degree | 0 (0.0%) | 0 (0.0%) |
| Bachelor's Degree | 20 (100.0%) | 0 (0.0%) |
| Graduate Degree | 0 (0.0%) | 0 (0.0%) |
| Total | 20 (100.0%) | 0 (0.0%) |
Employment Characteristics in Trowbridge Park
Employment by Class of Employer in Trowbridge Park
Among the 954 employed individuals in Trowbridge Park, private company employees (761 | 79.8%), state government employees (103 | 10.8%), and local government employees (31 | 3.3%) make up the most common classes of employment.
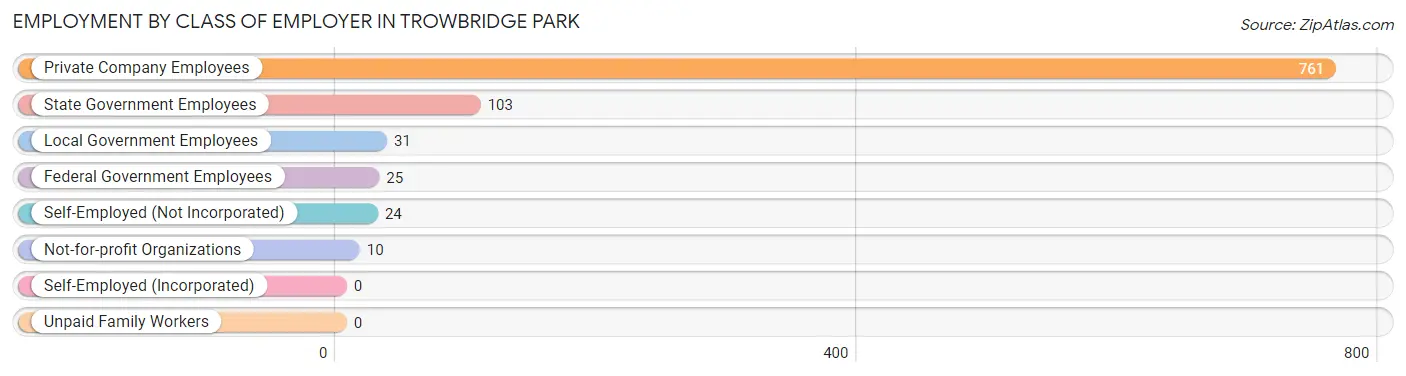
| Employer Class | # Employees | % Employees |
| Private Company Employees | 761 | 79.8% |
| Self-Employed (Incorporated) | 0 | 0.0% |
| Self-Employed (Not Incorporated) | 24 | 2.5% |
| Not-for-profit Organizations | 10 | 1.1% |
| Local Government Employees | 31 | 3.3% |
| State Government Employees | 103 | 10.8% |
| Federal Government Employees | 25 | 2.6% |
| Unpaid Family Workers | 0 | 0.0% |
| Total | 954 | 100.0% |
Employment Status by Age in Trowbridge Park
According to the labor force statistics for Trowbridge Park, out of the total population over 16 years of age (1,967), 52.9% or 1,041 individuals are in the labor force, with 5.1% or 53 of them unemployed. The age group with the highest labor force participation rate is 30 to 34 years, with 100.0% or 123 individuals in the labor force. Within the labor force, the 55 to 59 years age range has the highest percentage of unemployed individuals, with 31.2% or 48 of them being unemployed.
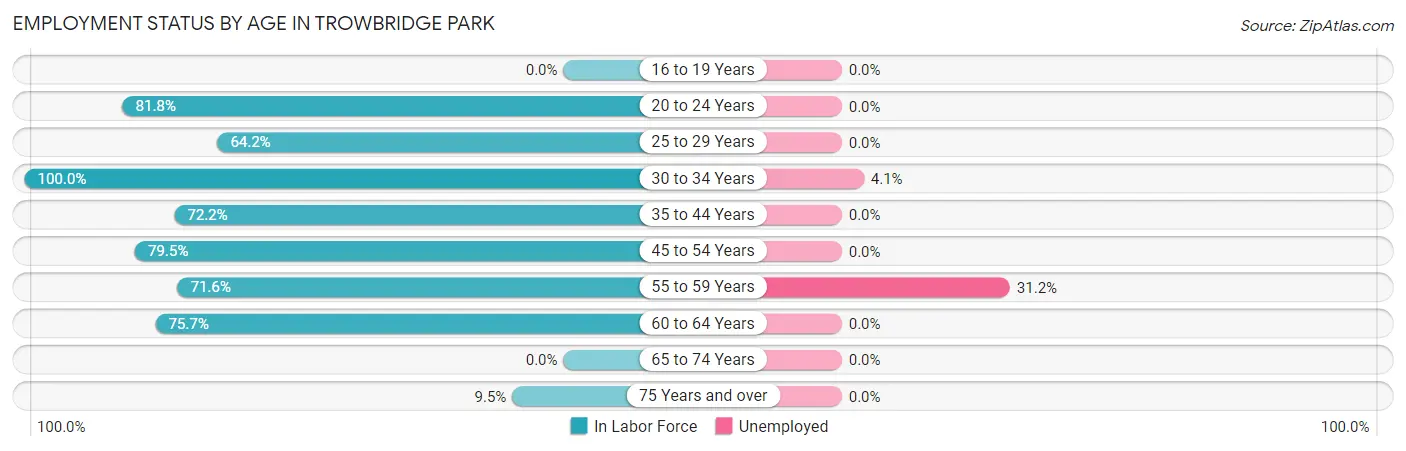
| Age Bracket | In Labor Force | Unemployed |
| 16 to 19 Years | 0 (0.0%) | 0 (0.0%) |
| 20 to 24 Years | 310 (81.8%) | 0 (0.0%) |
| 25 to 29 Years | 140 (64.2%) | 0 (0.0%) |
| 30 to 34 Years | 123 (100.0%) | 5 (4.1%) |
| 35 to 44 Years | 70 (72.2%) | 0 (0.0%) |
| 45 to 54 Years | 147 (79.5%) | 0 (0.0%) |
| 55 to 59 Years | 154 (71.6%) | 48 (31.2%) |
| 60 to 64 Years | 81 (75.7%) | 0 (0.0%) |
| 65 to 74 Years | 0 (0.0%) | 0 (0.0%) |
| 75 Years and over | 15 (9.5%) | 0 (0.0%) |
| Total | 1,041 (52.9%) | 53 (5.1%) |
Employment Status by Educational Attainment in Trowbridge Park
According to labor force statistics for Trowbridge Park, 75.7% of individuals (715) out of the total population between 25 and 64 years of age (945) are in the labor force, with 7.4% or 53 of them being unemployed. The group with the highest labor force participation rate are those with the educational attainment of bachelor's degree or higher, with 95.2% or 259 individuals in the labor force. Within the labor force, individuals with college / associate degree education have the highest percentage of unemployment, with 17.6% or 38 of them being unemployed.
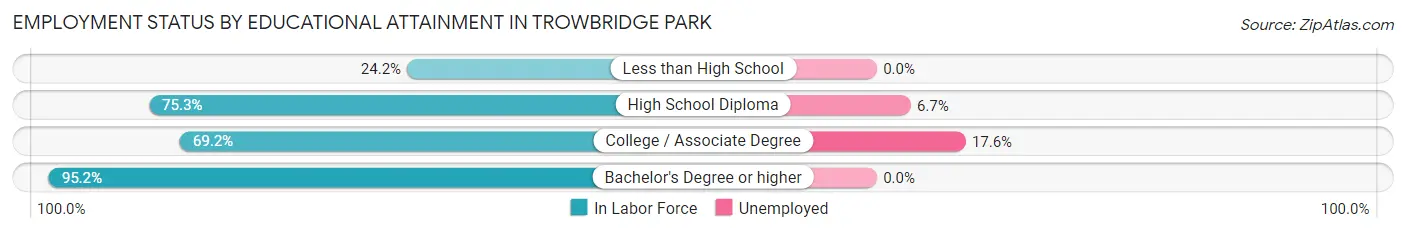
| Educational Attainment | In Labor Force | Unemployed |
| Less than High School | 15 (24.2%) | 0 (0.0%) |
| High School Diploma | 225 (75.3%) | 20 (6.7%) |
| College / Associate Degree | 216 (69.2%) | 55 (17.6%) |
| Bachelor's Degree or higher | 259 (95.2%) | 0 (0.0%) |
| Total | 715 (75.7%) | 70 (7.4%) |
Employment Occupations by Sex in Trowbridge Park
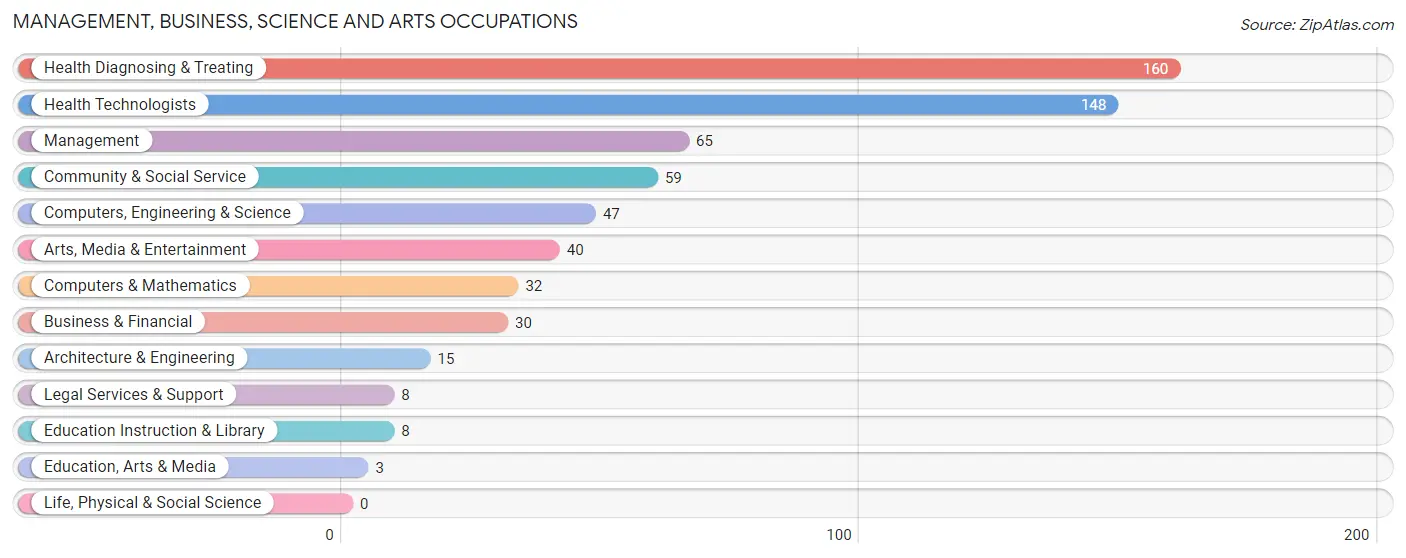
Management, Business, Science and Arts Occupations
The most common Management, Business, Science and Arts occupations in Trowbridge Park are Health Diagnosing & Treating (160 | 16.2%), Health Technologists (148 | 15.0%), Management (65 | 6.6%), Community & Social Service (59 | 6.0%), and Computers, Engineering & Science (47 | 4.8%).
Management, Business, Science and Arts Occupations by Sex
Within the Management, Business, Science and Arts occupations in Trowbridge Park, the most male-oriented occupations are Business & Financial (100.0%), Architecture & Engineering (100.0%), and Education, Arts & Media (100.0%), while the most female-oriented occupations are Computers & Mathematics (100.0%), Education Instruction & Library (100.0%), and Computers, Engineering & Science (68.1%).
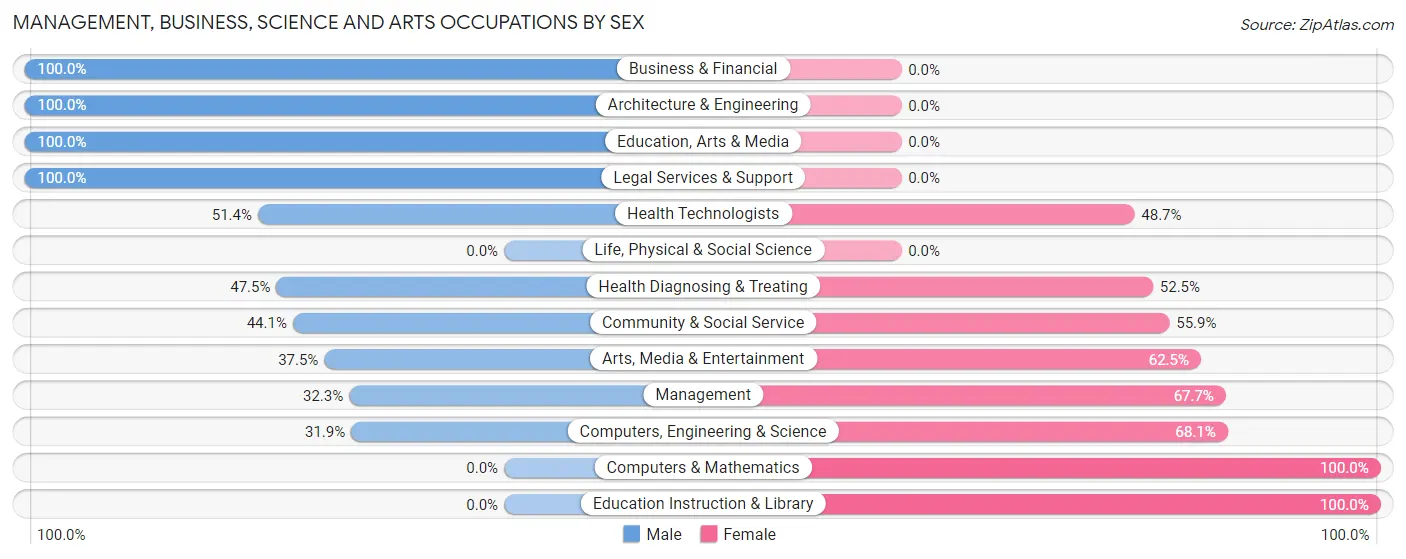
| Occupation | Male | Female |
| Management | 21 (32.3%) | 44 (67.7%) |
| Business & Financial | 30 (100.0%) | 0 (0.0%) |
| Computers, Engineering & Science | 15 (31.9%) | 32 (68.1%) |
| Computers & Mathematics | 0 (0.0%) | 32 (100.0%) |
| Architecture & Engineering | 15 (100.0%) | 0 (0.0%) |
| Life, Physical & Social Science | 0 (0.0%) | 0 (0.0%) |
| Community & Social Service | 26 (44.1%) | 33 (55.9%) |
| Education, Arts & Media | 3 (100.0%) | 0 (0.0%) |
| Legal Services & Support | 8 (100.0%) | 0 (0.0%) |
| Education Instruction & Library | 0 (0.0%) | 8 (100.0%) |
| Arts, Media & Entertainment | 15 (37.5%) | 25 (62.5%) |
| Health Diagnosing & Treating | 76 (47.5%) | 84 (52.5%) |
| Health Technologists | 76 (51.3%) | 72 (48.6%) |
| Total (Category) | 168 (46.5%) | 193 (53.5%) |
| Total (Overall) | 477 (48.3%) | 510 (51.7%) |
Services Occupations
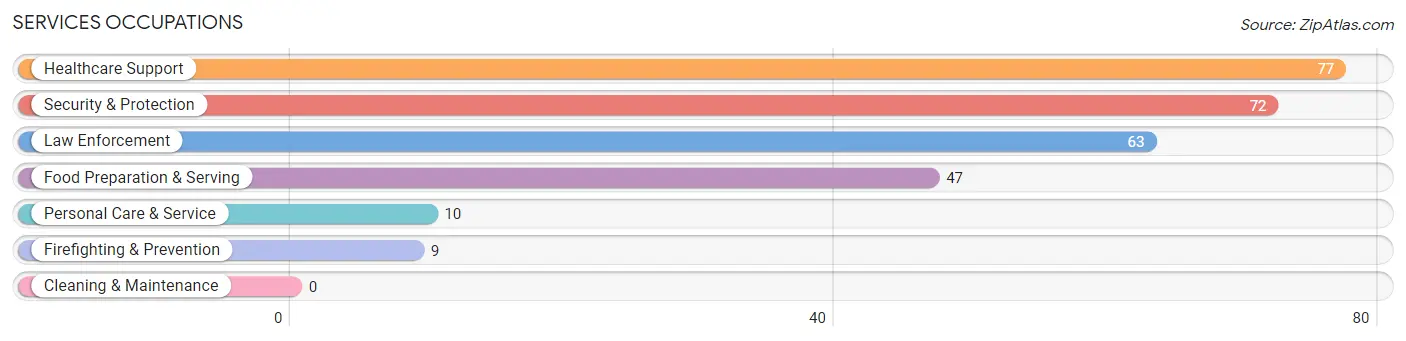
The most common Services occupations in Trowbridge Park are Healthcare Support (77 | 7.8%), Security & Protection (72 | 7.3%), Law Enforcement (63 | 6.4%), Food Preparation & Serving (47 | 4.8%), and Personal Care & Service (10 | 1.0%).
Services Occupations by Sex
Within the Services occupations in Trowbridge Park, the most male-oriented occupations are Security & Protection (100.0%), Firefighting & Prevention (100.0%), and Law Enforcement (100.0%), while the most female-oriented occupations are Personal Care & Service (100.0%), Healthcare Support (88.3%), and Food Preparation & Serving (70.2%).
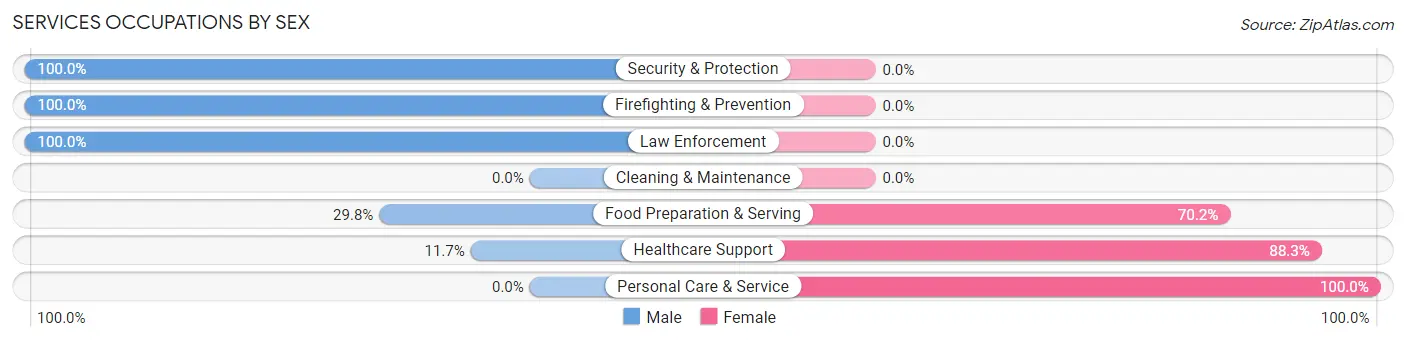
| Occupation | Male | Female |
| Healthcare Support | 9 (11.7%) | 68 (88.3%) |
| Security & Protection | 72 (100.0%) | 0 (0.0%) |
| Firefighting & Prevention | 9 (100.0%) | 0 (0.0%) |
| Law Enforcement | 63 (100.0%) | 0 (0.0%) |
| Food Preparation & Serving | 14 (29.8%) | 33 (70.2%) |
| Cleaning & Maintenance | 0 (0.0%) | 0 (0.0%) |
| Personal Care & Service | 0 (0.0%) | 10 (100.0%) |
| Total (Category) | 95 (46.1%) | 111 (53.9%) |
| Total (Overall) | 477 (48.3%) | 510 (51.7%) |
Sales and Office Occupations
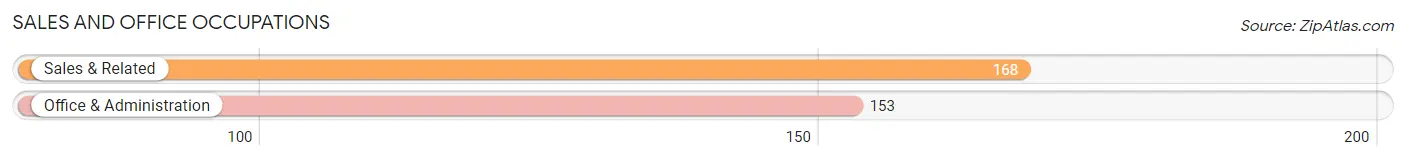
The most common Sales and Office occupations in Trowbridge Park are Sales & Related (168 | 17.0%), and Office & Administration (153 | 15.5%).
Sales and Office Occupations by Sex
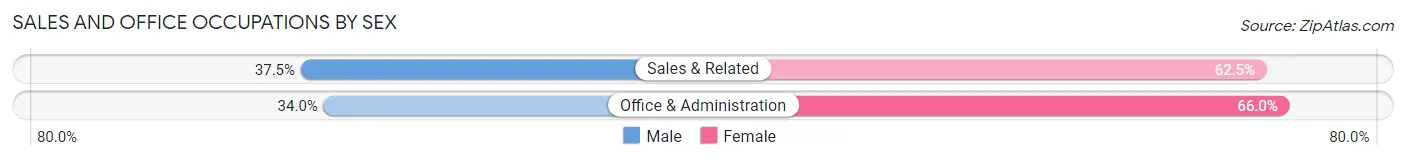
| Occupation | Male | Female |
| Sales & Related | 63 (37.5%) | 105 (62.5%) |
| Office & Administration | 52 (34.0%) | 101 (66.0%) |
| Total (Category) | 115 (35.8%) | 206 (64.2%) |
| Total (Overall) | 477 (48.3%) | 510 (51.7%) |
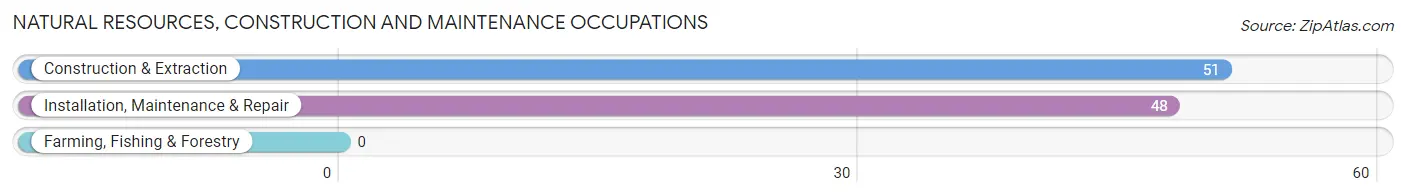
Natural Resources, Construction and Maintenance Occupations
The most common Natural Resources, Construction and Maintenance occupations in Trowbridge Park are Construction & Extraction (51 | 5.2%), and Installation, Maintenance & Repair (48 | 4.9%).
Natural Resources, Construction and Maintenance Occupations by Sex
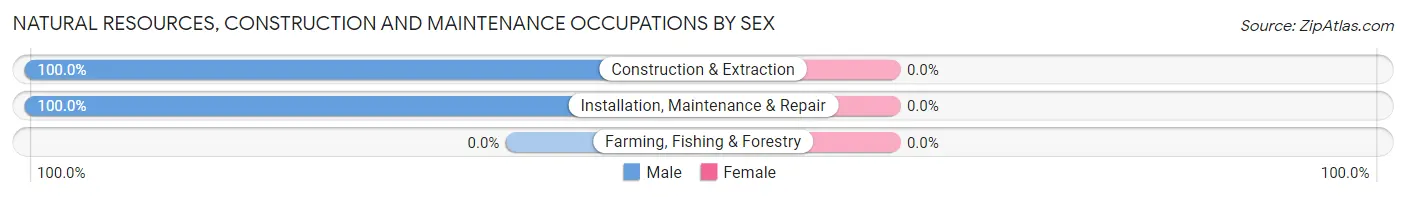
| Occupation | Male | Female |
| Farming, Fishing & Forestry | 0 (0.0%) | 0 (0.0%) |
| Construction & Extraction | 51 (100.0%) | 0 (0.0%) |
| Installation, Maintenance & Repair | 48 (100.0%) | 0 (0.0%) |
| Total (Category) | 99 (100.0%) | 0 (0.0%) |
| Total (Overall) | 477 (48.3%) | 510 (51.7%) |
Production, Transportation and Moving Occupations
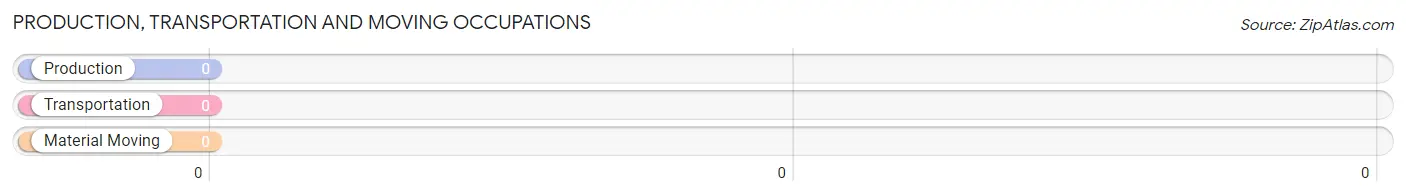
Production, Transportation and Moving Occupations by Sex
| Occupation | Male | Female |
| Production | 0 (0.0%) | 0 (0.0%) |
| Transportation | 0 (0.0%) | 0 (0.0%) |
| Material Moving | 0 (0.0%) | 0 (0.0%) |
| Total (Category) | 0 (0.0%) | 0 (0.0%) |
| Total (Overall) | 477 (48.3%) | 510 (51.7%) |
Employment Industries by Sex in Trowbridge Park
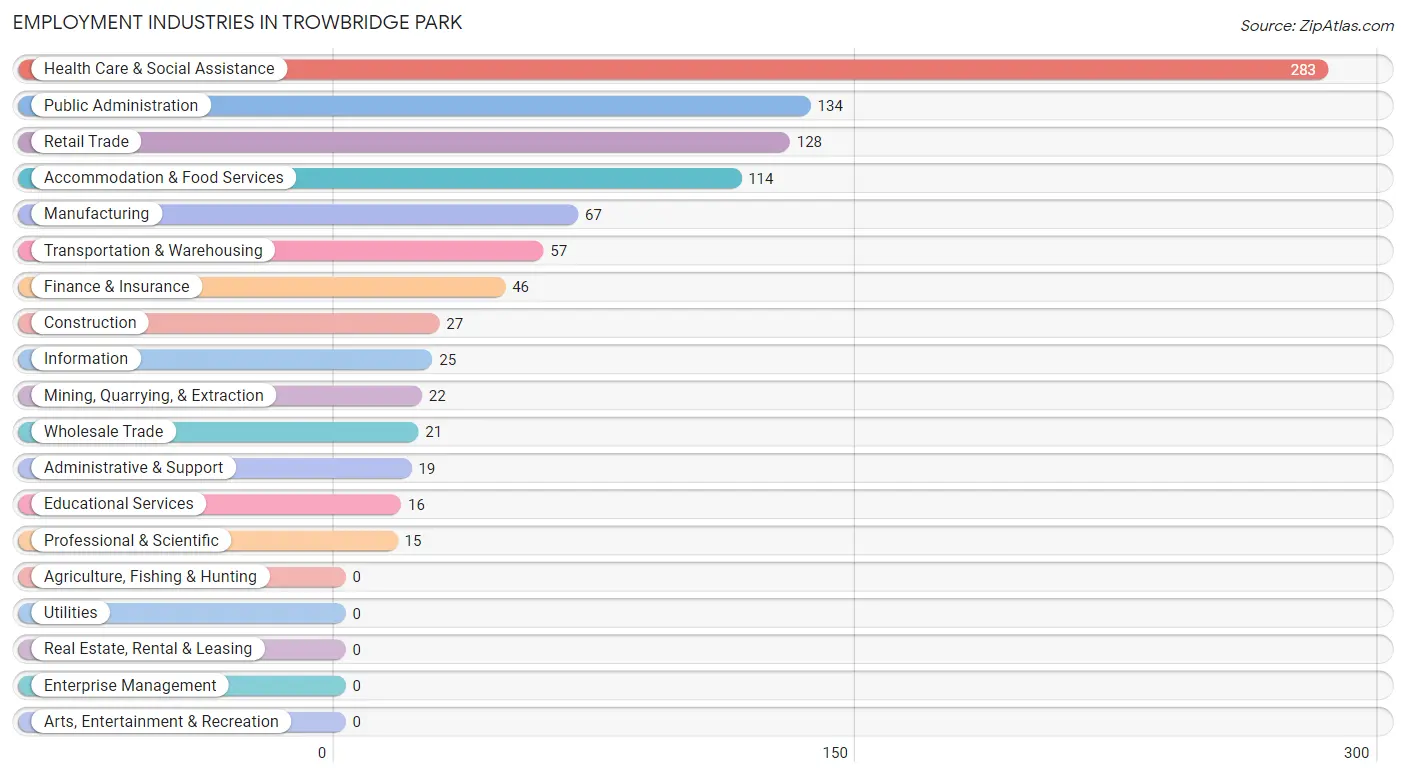
Employment Industries in Trowbridge Park
The major employment industries in Trowbridge Park include Health Care & Social Assistance (283 | 28.7%), Public Administration (134 | 13.6%), Retail Trade (128 | 13.0%), Accommodation & Food Services (114 | 11.6%), and Manufacturing (67 | 6.8%).
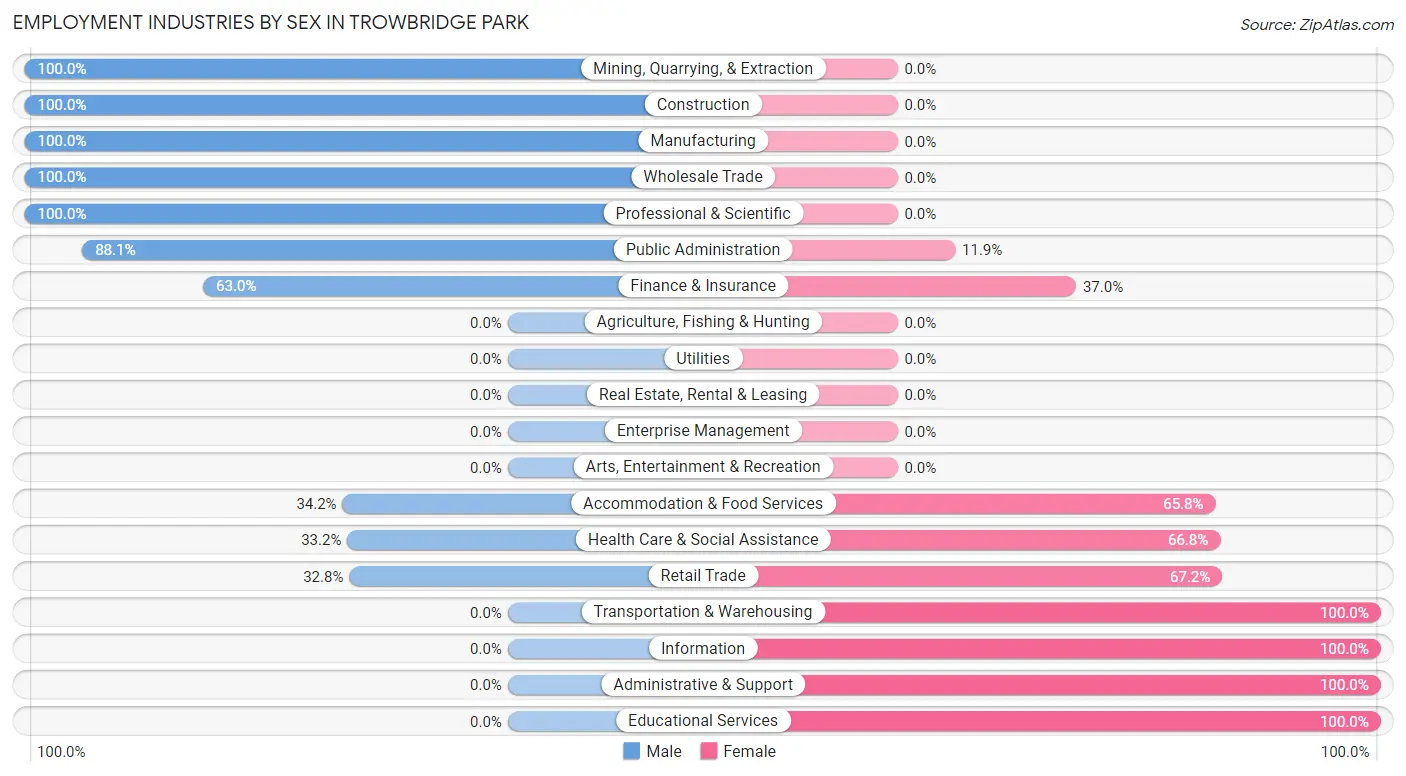
Employment Industries by Sex in Trowbridge Park
The Trowbridge Park industries that see more men than women are Mining, Quarrying, & Extraction (100.0%), Construction (100.0%), and Manufacturing (100.0%), whereas the industries that tend to have a higher number of women are Transportation & Warehousing (100.0%), Information (100.0%), and Administrative & Support (100.0%).
| Industry | Male | Female |
| Agriculture, Fishing & Hunting | 0 (0.0%) | 0 (0.0%) |
| Mining, Quarrying, & Extraction | 22 (100.0%) | 0 (0.0%) |
| Construction | 27 (100.0%) | 0 (0.0%) |
| Manufacturing | 67 (100.0%) | 0 (0.0%) |
| Wholesale Trade | 21 (100.0%) | 0 (0.0%) |
| Retail Trade | 42 (32.8%) | 86 (67.2%) |
| Transportation & Warehousing | 0 (0.0%) | 57 (100.0%) |
| Utilities | 0 (0.0%) | 0 (0.0%) |
| Information | 0 (0.0%) | 25 (100.0%) |
| Finance & Insurance | 29 (63.0%) | 17 (37.0%) |
| Real Estate, Rental & Leasing | 0 (0.0%) | 0 (0.0%) |
| Professional & Scientific | 15 (100.0%) | 0 (0.0%) |
| Enterprise Management | 0 (0.0%) | 0 (0.0%) |
| Administrative & Support | 0 (0.0%) | 19 (100.0%) |
| Educational Services | 0 (0.0%) | 16 (100.0%) |
| Health Care & Social Assistance | 94 (33.2%) | 189 (66.8%) |
| Arts, Entertainment & Recreation | 0 (0.0%) | 0 (0.0%) |
| Accommodation & Food Services | 39 (34.2%) | 75 (65.8%) |
| Public Administration | 118 (88.1%) | 16 (11.9%) |
| Total | 477 (48.3%) | 510 (51.7%) |
Education in Trowbridge Park
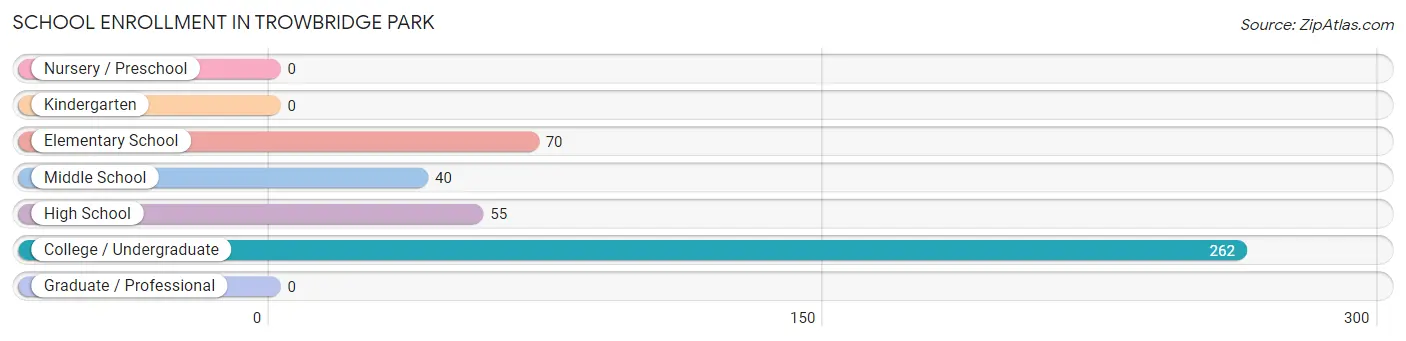
School Enrollment in Trowbridge Park
The most common levels of schooling among the 427 students in Trowbridge Park are college / undergraduate (262 | 61.4%), elementary school (70 | 16.4%), and high school (55 | 12.9%).
| School Level | # Students | % Students |
| Nursery / Preschool | 0 | 0.0% |
| Kindergarten | 0 | 0.0% |
| Elementary School | 70 | 16.4% |
| Middle School | 40 | 9.4% |
| High School | 55 | 12.9% |
| College / Undergraduate | 262 | 61.4% |
| Graduate / Professional | 0 | 0.0% |
| Total | 427 | 100.0% |
School Enrollment by Age by Funding Source in Trowbridge Park
Out of a total of 427 students who are enrolled in schools in Trowbridge Park, 54 (12.6%) attend a private institution, while the remaining 373 (87.4%) are enrolled in public schools. The age group of 20 to 24 year olds has the highest likelihood of being enrolled in private schools, with 54 (24.2% in the age bracket) enrolled. Conversely, the age group of 5 to 9 year old has the lowest likelihood of being enrolled in a private school, with 50 (100.0% in the age bracket) attending a public institution.
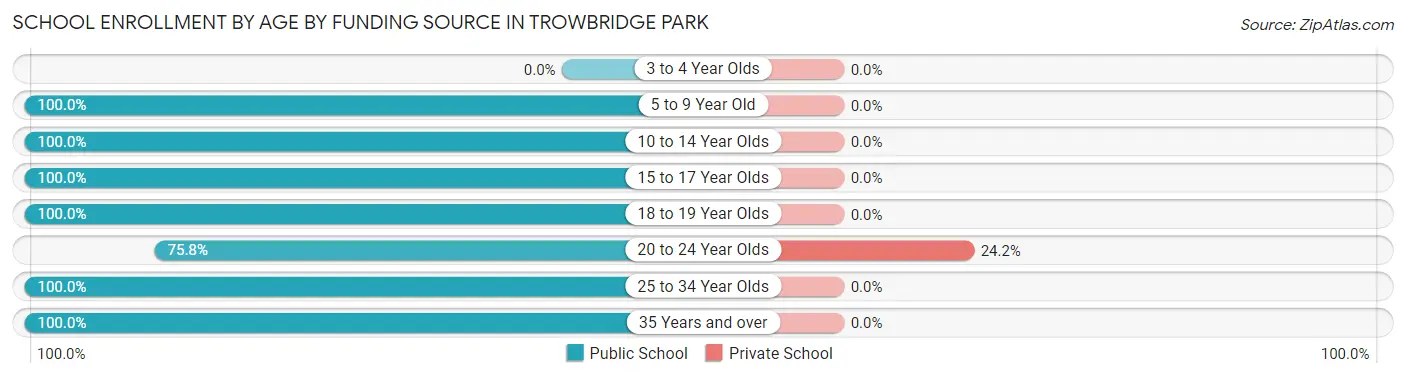
| Age Bracket | Public School | Private School |
| 3 to 4 Year Olds | 0 (0.0%) | 0 (0.0%) |
| 5 to 9 Year Old | 50 (100.0%) | 0 (0.0%) |
| 10 to 14 Year Olds | 82 (100.0%) | 0 (0.0%) |
| 15 to 17 Year Olds | 10 (100.0%) | 0 (0.0%) |
| 18 to 19 Year Olds | 23 (100.0%) | 0 (0.0%) |
| 20 to 24 Year Olds | 169 (75.8%) | 54 (24.2%) |
| 25 to 34 Year Olds | 22 (100.0%) | 0 (0.0%) |
| 35 Years and over | 17 (100.0%) | 0 (0.0%) |
| Total | 373 (87.4%) | 54 (12.6%) |
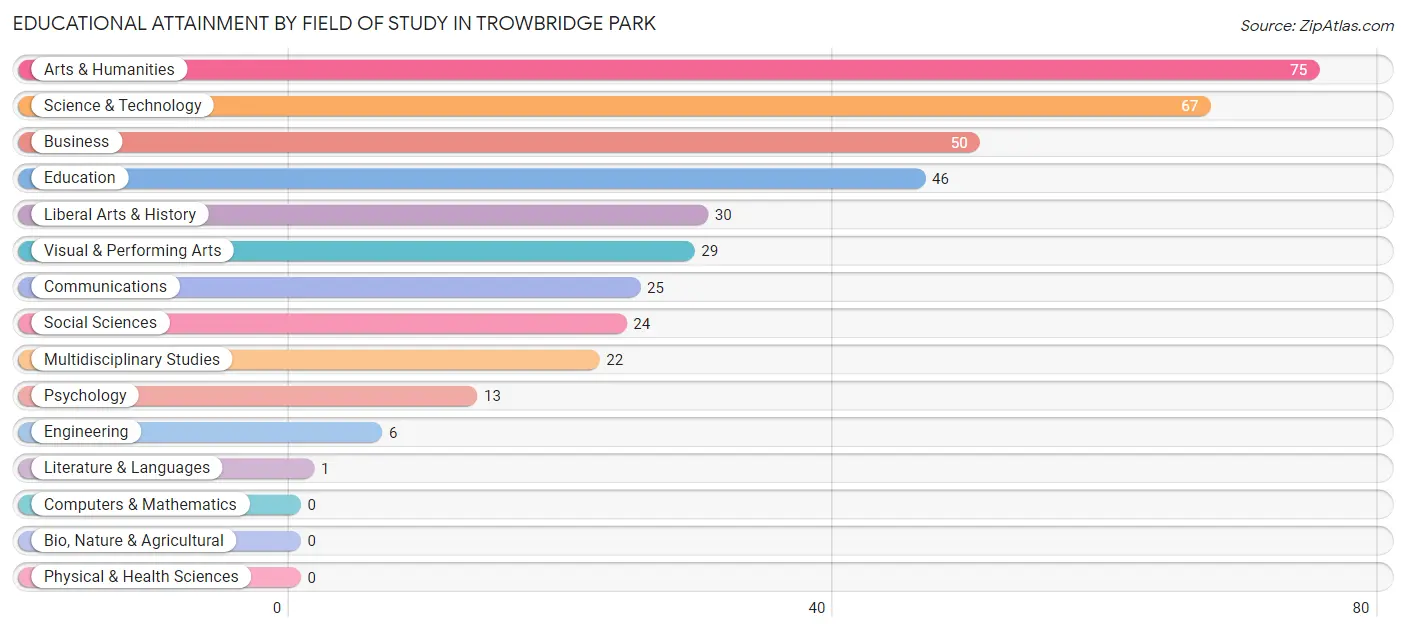
Educational Attainment by Field of Study in Trowbridge Park
Arts & humanities (75 | 19.3%), science & technology (67 | 17.3%), business (50 | 12.9%), education (46 | 11.9%), and liberal arts & history (30 | 7.7%) are the most common fields of study among 388 individuals in Trowbridge Park who have obtained a bachelor's degree or higher.
| Field of Study | # Graduates | % Graduates |
| Computers & Mathematics | 0 | 0.0% |
| Bio, Nature & Agricultural | 0 | 0.0% |
| Physical & Health Sciences | 0 | 0.0% |
| Psychology | 13 | 3.4% |
| Social Sciences | 24 | 6.2% |
| Engineering | 6 | 1.5% |
| Multidisciplinary Studies | 22 | 5.7% |
| Science & Technology | 67 | 17.3% |
| Business | 50 | 12.9% |
| Education | 46 | 11.9% |
| Literature & Languages | 1 | 0.3% |
| Liberal Arts & History | 30 | 7.7% |
| Visual & Performing Arts | 29 | 7.5% |
| Communications | 25 | 6.4% |
| Arts & Humanities | 75 | 19.3% |
| Total | 388 | 100.0% |
Transportation & Commute in Trowbridge Park
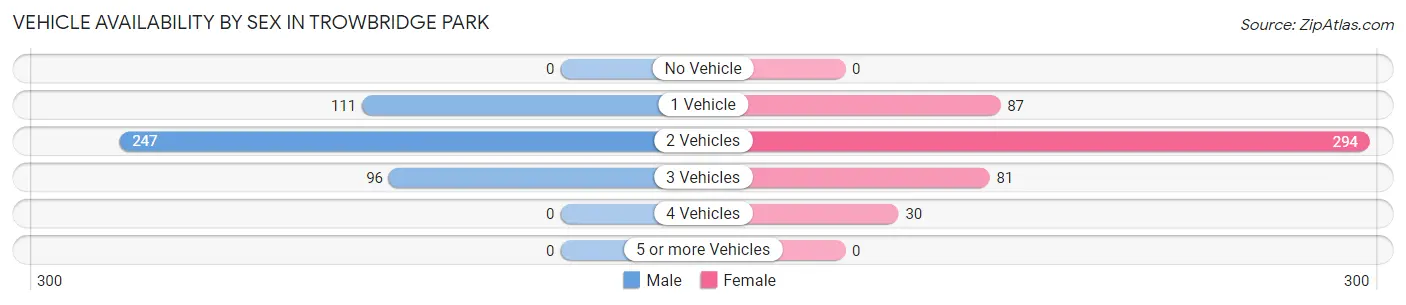
Vehicle Availability by Sex in Trowbridge Park
The most prevalent vehicle ownership categories in Trowbridge Park are males with 2 vehicles (247, accounting for 54.4%) and females with 2 vehicles (294, making up 50.2%).
| Vehicles Available | Male | Female |
| No Vehicle | 0 (0.0%) | 0 (0.0%) |
| 1 Vehicle | 111 (24.4%) | 87 (17.7%) |
| 2 Vehicles | 247 (54.4%) | 294 (59.8%) |
| 3 Vehicles | 96 (21.1%) | 81 (16.5%) |
| 4 Vehicles | 0 (0.0%) | 30 (6.1%) |
| 5 or more Vehicles | 0 (0.0%) | 0 (0.0%) |
| Total | 454 (100.0%) | 492 (100.0%) |
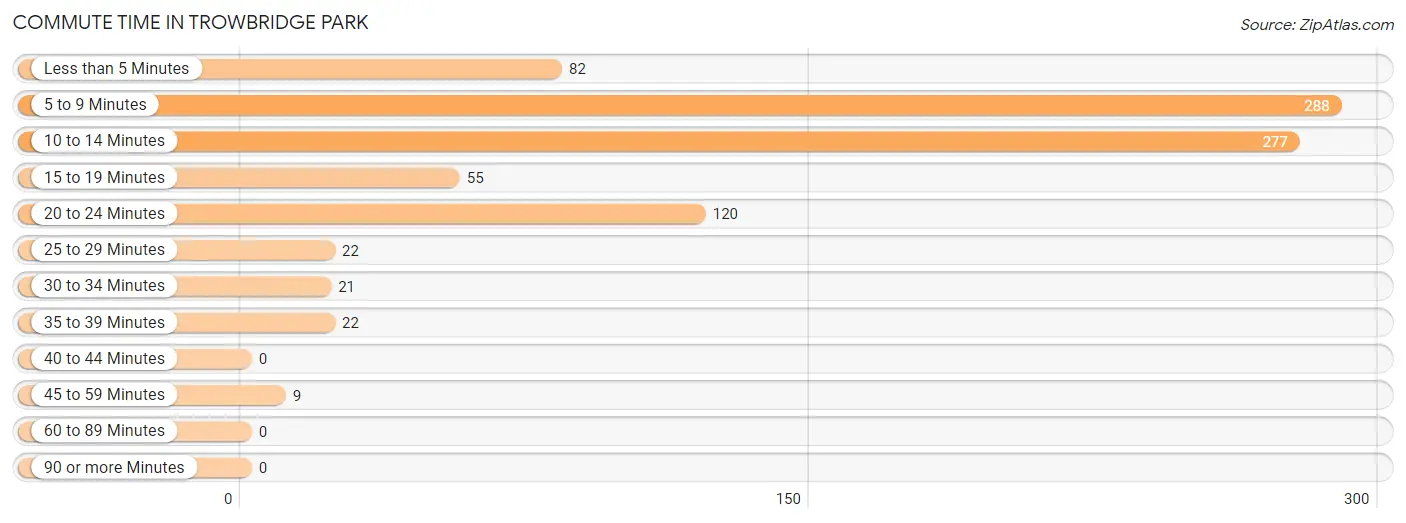
Commute Time in Trowbridge Park
The most frequently occuring commute durations in Trowbridge Park are 5 to 9 minutes (288 commuters, 32.1%), 10 to 14 minutes (277 commuters, 30.9%), and 20 to 24 minutes (120 commuters, 13.4%).
| Commute Time | # Commuters | % Commuters |
| Less than 5 Minutes | 82 | 9.1% |
| 5 to 9 Minutes | 288 | 32.1% |
| 10 to 14 Minutes | 277 | 30.9% |
| 15 to 19 Minutes | 55 | 6.1% |
| 20 to 24 Minutes | 120 | 13.4% |
| 25 to 29 Minutes | 22 | 2.5% |
| 30 to 34 Minutes | 21 | 2.3% |
| 35 to 39 Minutes | 22 | 2.5% |
| 40 to 44 Minutes | 0 | 0.0% |
| 45 to 59 Minutes | 9 | 1.0% |
| 60 to 89 Minutes | 0 | 0.0% |
| 90 or more Minutes | 0 | 0.0% |
Commute Time by Sex in Trowbridge Park
The most common commute times in Trowbridge Park are 10 to 14 minutes (92 commuters, 22.8%) for males and 5 to 9 minutes (204 commuters, 41.5%) for females.
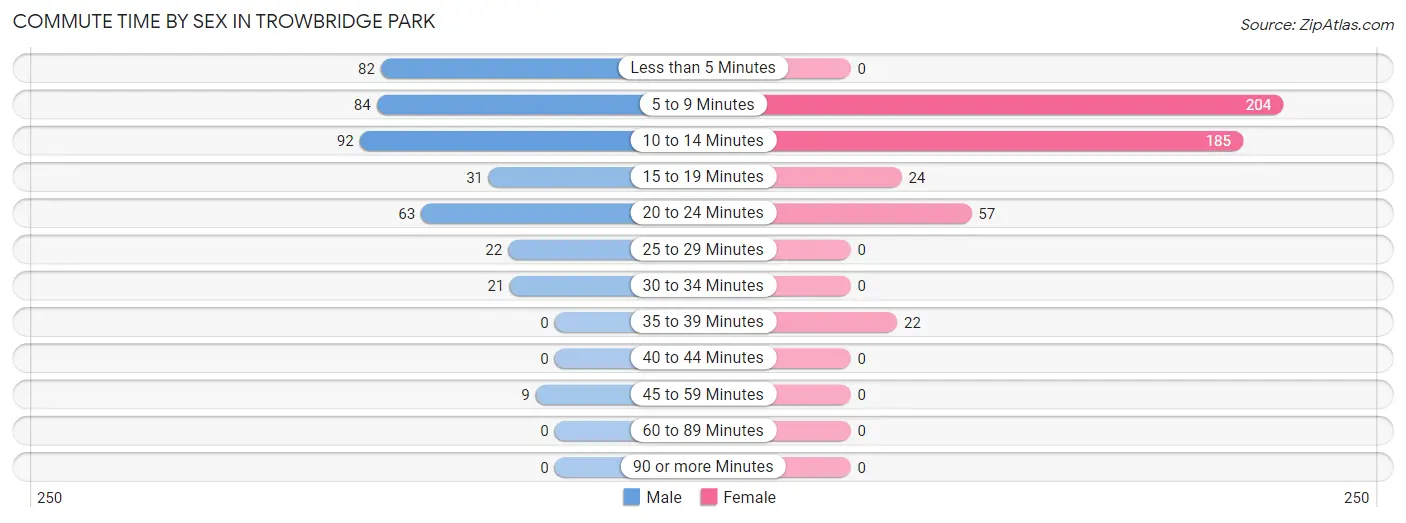
| Commute Time | Male | Female |
| Less than 5 Minutes | 82 (20.3%) | 0 (0.0%) |
| 5 to 9 Minutes | 84 (20.8%) | 204 (41.5%) |
| 10 to 14 Minutes | 92 (22.8%) | 185 (37.6%) |
| 15 to 19 Minutes | 31 (7.7%) | 24 (4.9%) |
| 20 to 24 Minutes | 63 (15.6%) | 57 (11.6%) |
| 25 to 29 Minutes | 22 (5.4%) | 0 (0.0%) |
| 30 to 34 Minutes | 21 (5.2%) | 0 (0.0%) |
| 35 to 39 Minutes | 0 (0.0%) | 22 (4.5%) |
| 40 to 44 Minutes | 0 (0.0%) | 0 (0.0%) |
| 45 to 59 Minutes | 9 (2.2%) | 0 (0.0%) |
| 60 to 89 Minutes | 0 (0.0%) | 0 (0.0%) |
| 90 or more Minutes | 0 (0.0%) | 0 (0.0%) |
Time of Departure to Work by Sex in Trowbridge Park
The most frequent times of departure to work in Trowbridge Park are 8:00 AM to 8:29 AM (139, 34.4%) for males and 7:30 AM to 7:59 AM (128, 26.0%) for females.
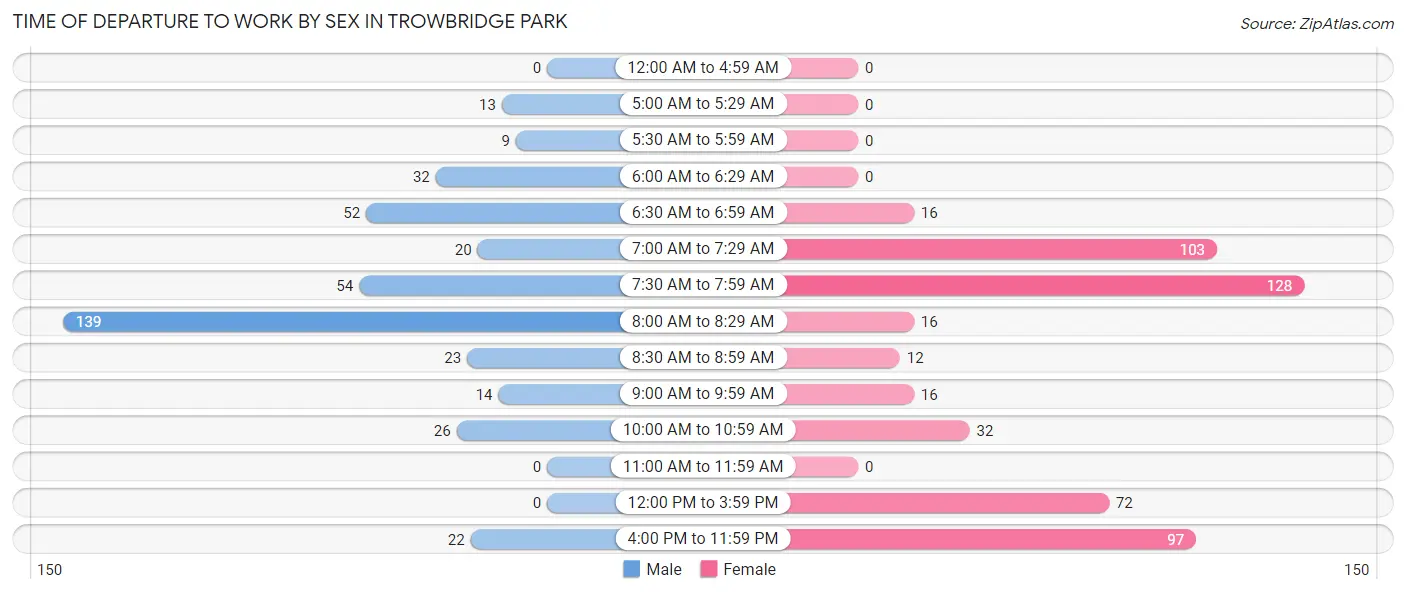
| Time of Departure | Male | Female |
| 12:00 AM to 4:59 AM | 0 (0.0%) | 0 (0.0%) |
| 5:00 AM to 5:29 AM | 13 (3.2%) | 0 (0.0%) |
| 5:30 AM to 5:59 AM | 9 (2.2%) | 0 (0.0%) |
| 6:00 AM to 6:29 AM | 32 (7.9%) | 0 (0.0%) |
| 6:30 AM to 6:59 AM | 52 (12.9%) | 16 (3.3%) |
| 7:00 AM to 7:29 AM | 20 (5.0%) | 103 (20.9%) |
| 7:30 AM to 7:59 AM | 54 (13.4%) | 128 (26.0%) |
| 8:00 AM to 8:29 AM | 139 (34.4%) | 16 (3.3%) |
| 8:30 AM to 8:59 AM | 23 (5.7%) | 12 (2.4%) |
| 9:00 AM to 9:59 AM | 14 (3.5%) | 16 (3.3%) |
| 10:00 AM to 10:59 AM | 26 (6.4%) | 32 (6.5%) |
| 11:00 AM to 11:59 AM | 0 (0.0%) | 0 (0.0%) |
| 12:00 PM to 3:59 PM | 0 (0.0%) | 72 (14.6%) |
| 4:00 PM to 11:59 PM | 22 (5.4%) | 97 (19.7%) |
| Total | 404 (100.0%) | 492 (100.0%) |
Housing Occupancy in Trowbridge Park
Occupancy by Ownership in Trowbridge Park
Of the total 1,034 dwellings in Trowbridge Park, owner-occupied units account for 579 (56.0%), while renter-occupied units make up 455 (44.0%).
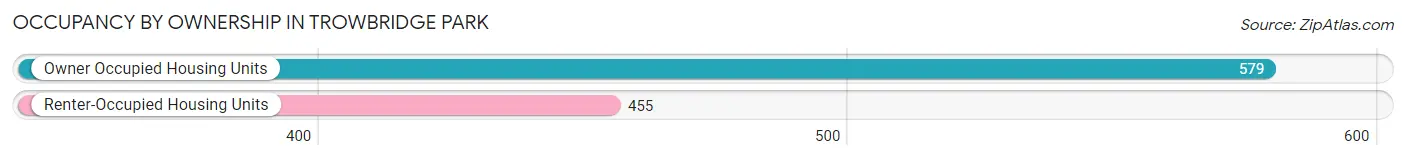
| Occupancy | # Housing Units | % Housing Units |
| Owner Occupied Housing Units | 579 | 56.0% |
| Renter-Occupied Housing Units | 455 | 44.0% |
| Total Occupied Housing Units | 1,034 | 100.0% |
Occupancy by Household Size in Trowbridge Park
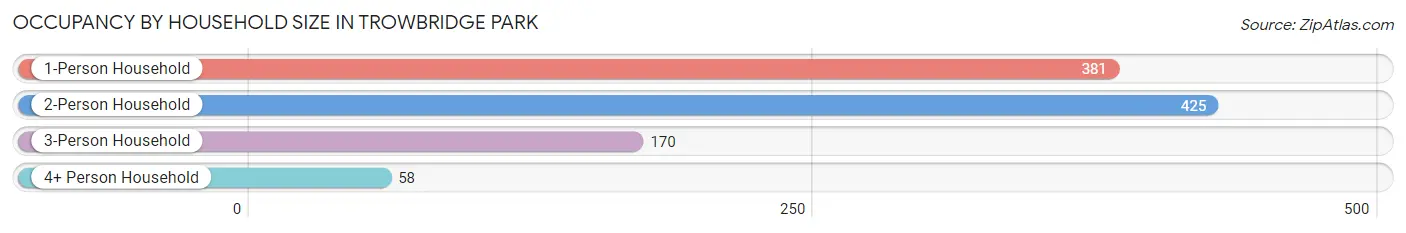
| Household Size | # Housing Units | % Housing Units |
| 1-Person Household | 381 | 36.8% |
| 2-Person Household | 425 | 41.1% |
| 3-Person Household | 170 | 16.4% |
| 4+ Person Household | 58 | 5.6% |
| Total Housing Units | 1,034 | 100.0% |
Occupancy by Ownership by Household Size in Trowbridge Park
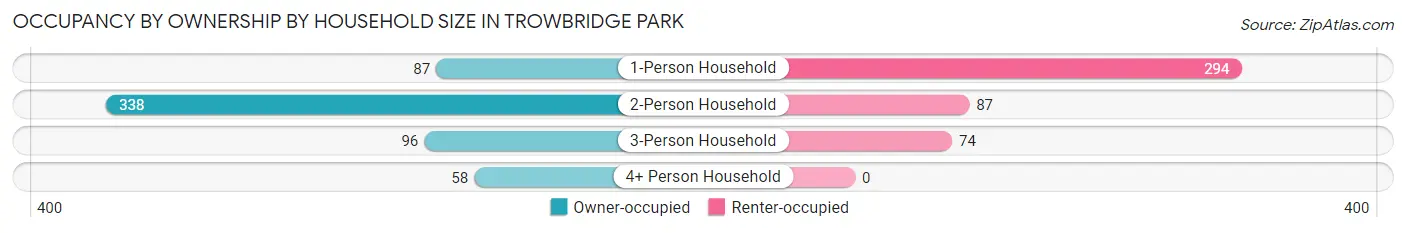
| Household Size | Owner-occupied | Renter-occupied |
| 1-Person Household | 87 (22.8%) | 294 (77.2%) |
| 2-Person Household | 338 (79.5%) | 87 (20.5%) |
| 3-Person Household | 96 (56.5%) | 74 (43.5%) |
| 4+ Person Household | 58 (100.0%) | 0 (0.0%) |
| Total Housing Units | 579 (56.0%) | 455 (44.0%) |
Occupancy by Educational Attainment in Trowbridge Park
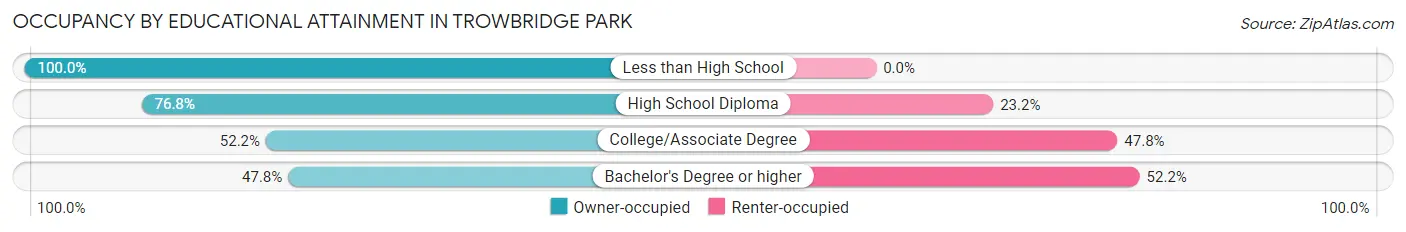
| Household Size | Owner-occupied | Renter-occupied |
| Less than High School | 21 (100.0%) | 0 (0.0%) |
| High School Diploma | 129 (76.8%) | 39 (23.2%) |
| College/Associate Degree | 301 (52.2%) | 276 (47.8%) |
| Bachelor's Degree or higher | 128 (47.8%) | 140 (52.2%) |
Occupancy by Age of Householder in Trowbridge Park
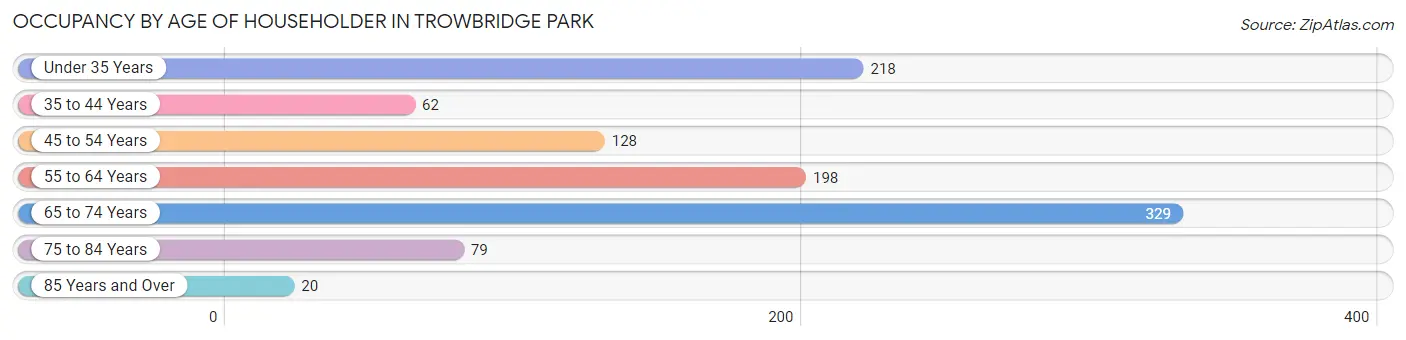
| Age Bracket | # Households | % Households |
| Under 35 Years | 218 | 21.1% |
| 35 to 44 Years | 62 | 6.0% |
| 45 to 54 Years | 128 | 12.4% |
| 55 to 64 Years | 198 | 19.2% |
| 65 to 74 Years | 329 | 31.8% |
| 75 to 84 Years | 79 | 7.6% |
| 85 Years and Over | 20 | 1.9% |
| Total | 1,034 | 100.0% |
Housing Finances in Trowbridge Park
Median Income by Occupancy in Trowbridge Park
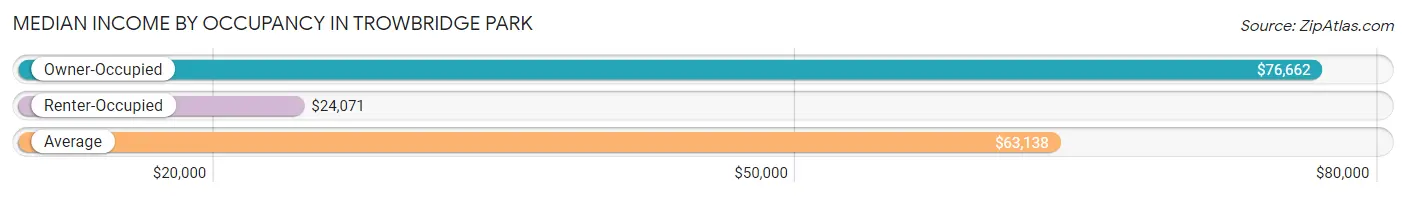
| Occupancy Type | # Households | Median Income |
| Owner-Occupied | 579 (56.0%) | $76,662 |
| Renter-Occupied | 455 (44.0%) | $24,071 |
| Average | 1,034 (100.0%) | $63,138 |
Occupancy by Householder Income Bracket in Trowbridge Park
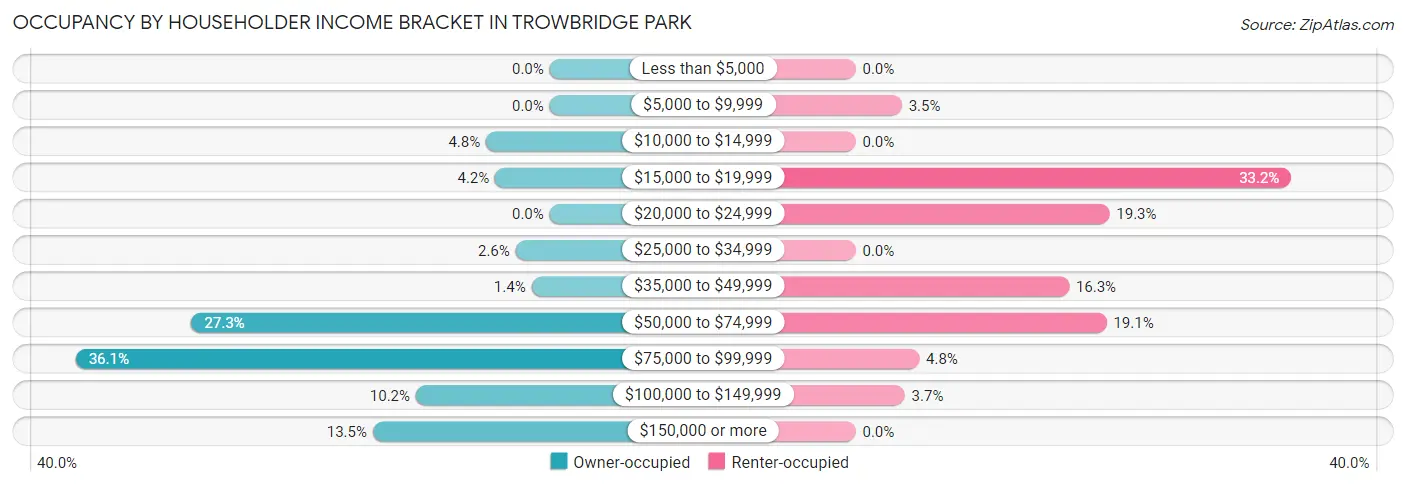
| Income Bracket | Owner-occupied | Renter-occupied |
| Less than $5,000 | 0 (0.0%) | 0 (0.0%) |
| $5,000 to $9,999 | 0 (0.0%) | 16 (3.5%) |
| $10,000 to $14,999 | 28 (4.8%) | 0 (0.0%) |
| $15,000 to $19,999 | 24 (4.2%) | 151 (33.2%) |
| $20,000 to $24,999 | 0 (0.0%) | 88 (19.3%) |
| $25,000 to $34,999 | 15 (2.6%) | 0 (0.0%) |
| $35,000 to $49,999 | 8 (1.4%) | 74 (16.3%) |
| $50,000 to $74,999 | 158 (27.3%) | 87 (19.1%) |
| $75,000 to $99,999 | 209 (36.1%) | 22 (4.8%) |
| $100,000 to $149,999 | 59 (10.2%) | 17 (3.7%) |
| $150,000 or more | 78 (13.5%) | 0 (0.0%) |
| Total | 579 (100.0%) | 455 (100.0%) |
Monthly Housing Cost Tiers in Trowbridge Park
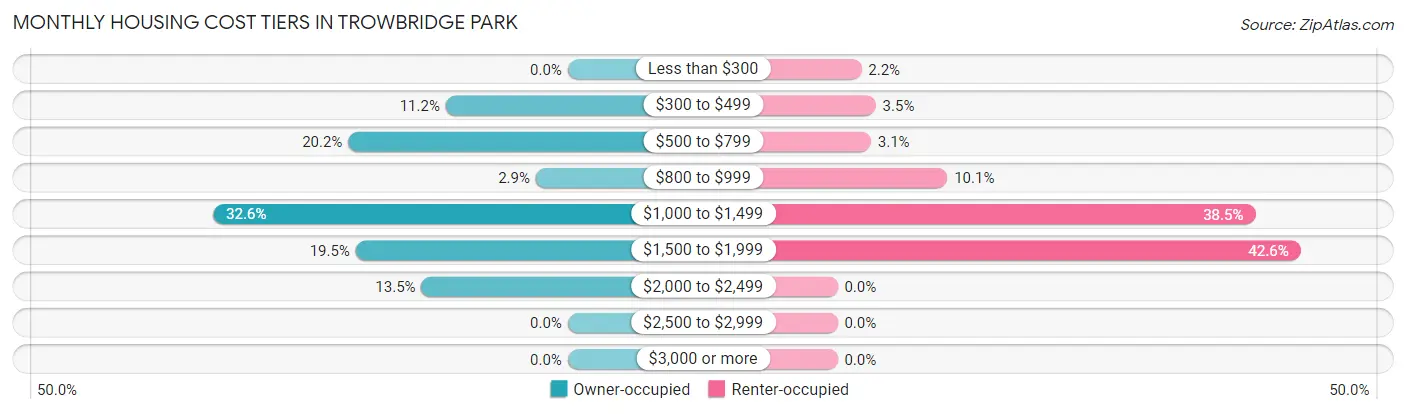
| Monthly Cost | Owner-occupied | Renter-occupied |
| Less than $300 | 0 (0.0%) | 10 (2.2%) |
| $300 to $499 | 65 (11.2%) | 16 (3.5%) |
| $500 to $799 | 117 (20.2%) | 14 (3.1%) |
| $800 to $999 | 17 (2.9%) | 46 (10.1%) |
| $1,000 to $1,499 | 189 (32.6%) | 175 (38.5%) |
| $1,500 to $1,999 | 113 (19.5%) | 194 (42.6%) |
| $2,000 to $2,499 | 78 (13.5%) | 0 (0.0%) |
| $2,500 to $2,999 | 0 (0.0%) | 0 (0.0%) |
| $3,000 or more | 0 (0.0%) | 0 (0.0%) |
| Total | 579 (100.0%) | 455 (100.0%) |
Physical Housing Characteristics in Trowbridge Park
Housing Structures in Trowbridge Park
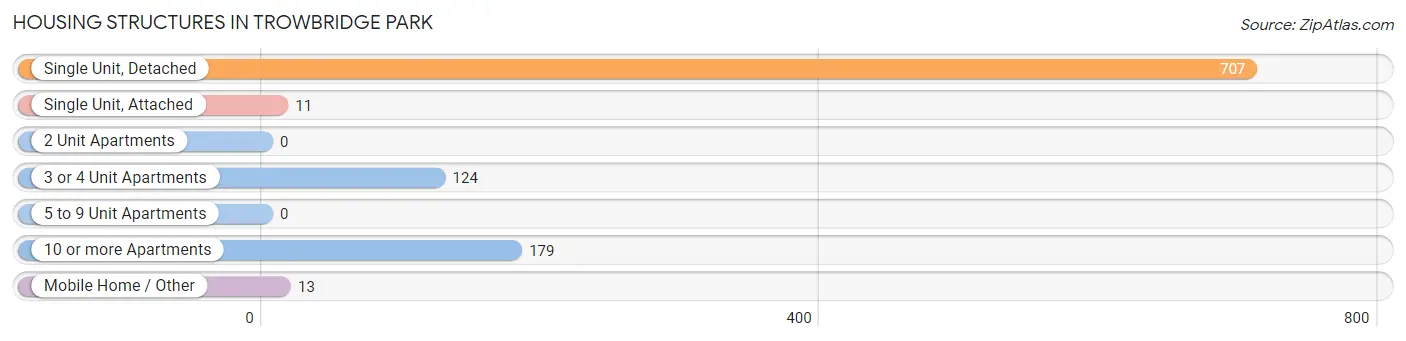
| Structure Type | # Housing Units | % Housing Units |
| Single Unit, Detached | 707 | 68.4% |
| Single Unit, Attached | 11 | 1.1% |
| 2 Unit Apartments | 0 | 0.0% |
| 3 or 4 Unit Apartments | 124 | 12.0% |
| 5 to 9 Unit Apartments | 0 | 0.0% |
| 10 or more Apartments | 179 | 17.3% |
| Mobile Home / Other | 13 | 1.3% |
| Total | 1,034 | 100.0% |
Housing Structures by Occupancy in Trowbridge Park
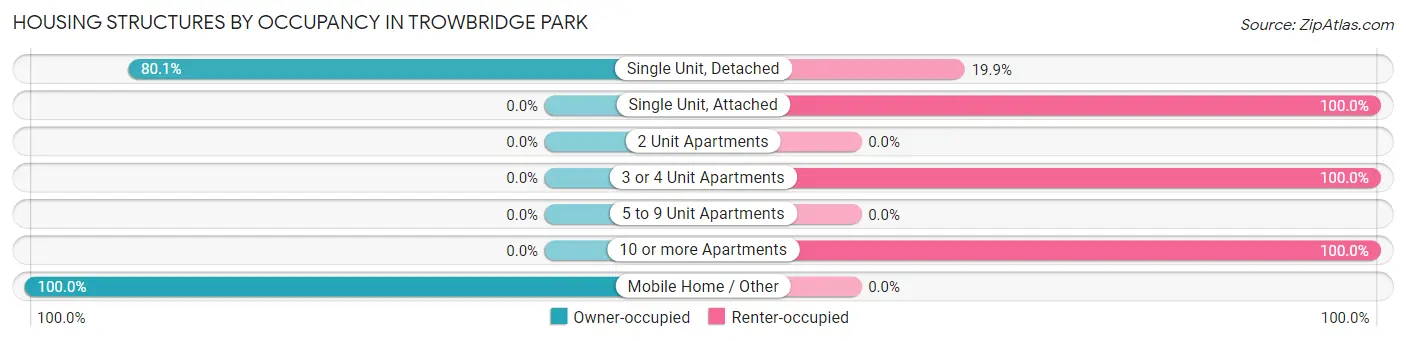
| Structure Type | Owner-occupied | Renter-occupied |
| Single Unit, Detached | 566 (80.1%) | 141 (19.9%) |
| Single Unit, Attached | 0 (0.0%) | 11 (100.0%) |
| 2 Unit Apartments | 0 (0.0%) | 0 (0.0%) |
| 3 or 4 Unit Apartments | 0 (0.0%) | 124 (100.0%) |
| 5 to 9 Unit Apartments | 0 (0.0%) | 0 (0.0%) |
| 10 or more Apartments | 0 (0.0%) | 179 (100.0%) |
| Mobile Home / Other | 13 (100.0%) | 0 (0.0%) |
| Total | 579 (56.0%) | 455 (44.0%) |
Housing Structures by Number of Rooms in Trowbridge Park
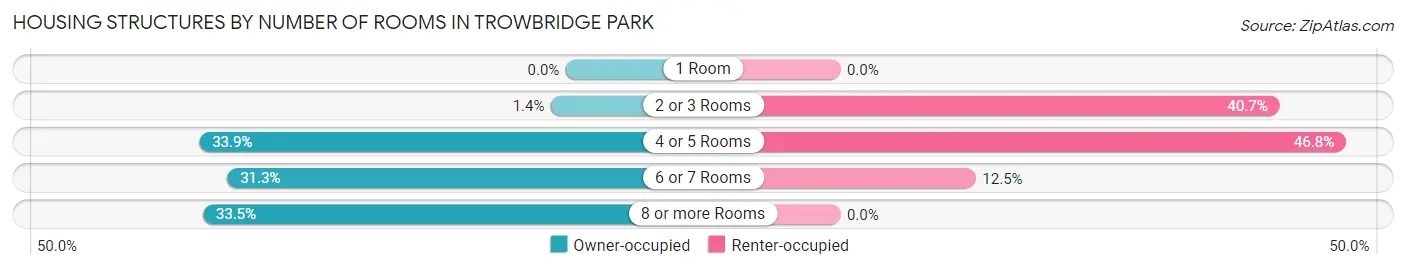
| Number of Rooms | Owner-occupied | Renter-occupied |
| 1 Room | 0 (0.0%) | 0 (0.0%) |
| 2 or 3 Rooms | 8 (1.4%) | 185 (40.7%) |
| 4 or 5 Rooms | 196 (33.9%) | 213 (46.8%) |
| 6 or 7 Rooms | 181 (31.3%) | 57 (12.5%) |
| 8 or more Rooms | 194 (33.5%) | 0 (0.0%) |
| Total | 579 (100.0%) | 455 (100.0%) |
Housing Structure by Heating Type in Trowbridge Park
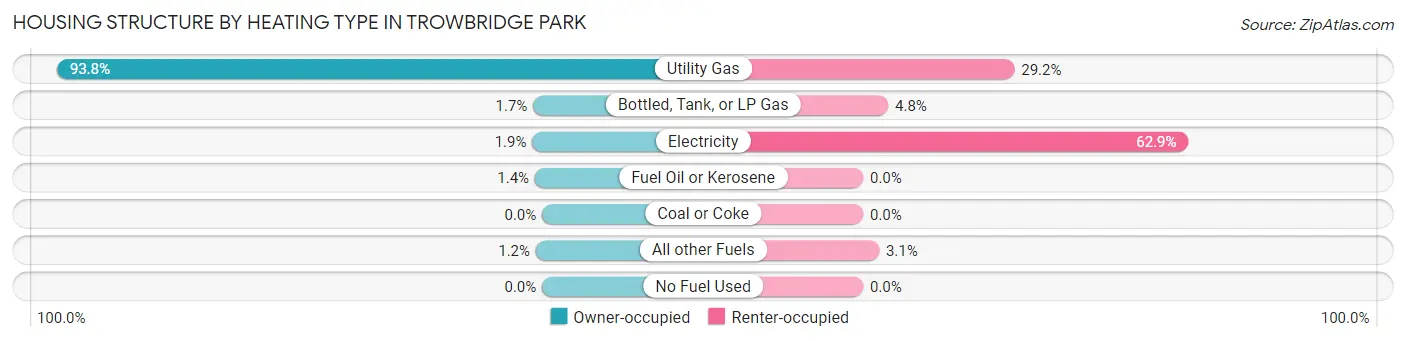
| Heating Type | Owner-occupied | Renter-occupied |
| Utility Gas | 543 (93.8%) | 133 (29.2%) |
| Bottled, Tank, or LP Gas | 10 (1.7%) | 22 (4.8%) |
| Electricity | 11 (1.9%) | 286 (62.9%) |
| Fuel Oil or Kerosene | 8 (1.4%) | 0 (0.0%) |
| Coal or Coke | 0 (0.0%) | 0 (0.0%) |
| All other Fuels | 7 (1.2%) | 14 (3.1%) |
| No Fuel Used | 0 (0.0%) | 0 (0.0%) |
| Total | 579 (100.0%) | 455 (100.0%) |
Household Vehicle Usage in Trowbridge Park
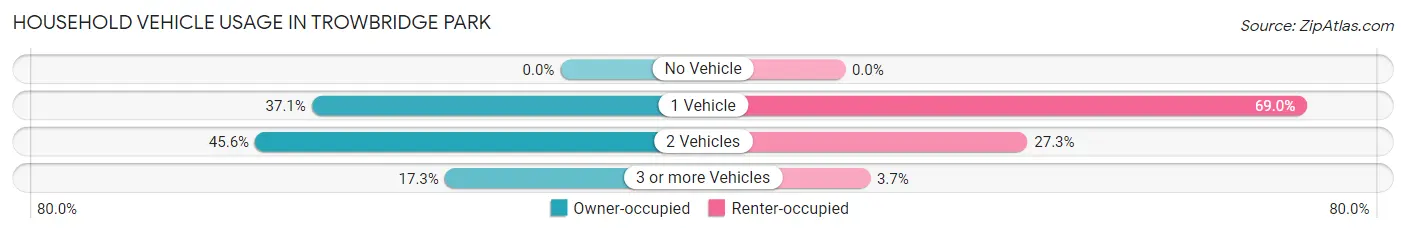
| Vehicles per Household | Owner-occupied | Renter-occupied |
| No Vehicle | 0 (0.0%) | 0 (0.0%) |
| 1 Vehicle | 215 (37.1%) | 314 (69.0%) |
| 2 Vehicles | 264 (45.6%) | 124 (27.3%) |
| 3 or more Vehicles | 100 (17.3%) | 17 (3.7%) |
| Total | 579 (100.0%) | 455 (100.0%) |
Real Estate & Mortgages in Trowbridge Park
Real Estate and Mortgage Overview in Trowbridge Park
| Characteristic | Without Mortgage | With Mortgage |
| Housing Units | 168 | 411 |
| Median Property Value | $182,900 | $236,900 |
| Median Household Income | $76,268 | $78 |
| Monthly Housing Costs | $531 | $0 |
| Real Estate Taxes | $2,042 | $30 |
Property Value by Mortgage Status in Trowbridge Park
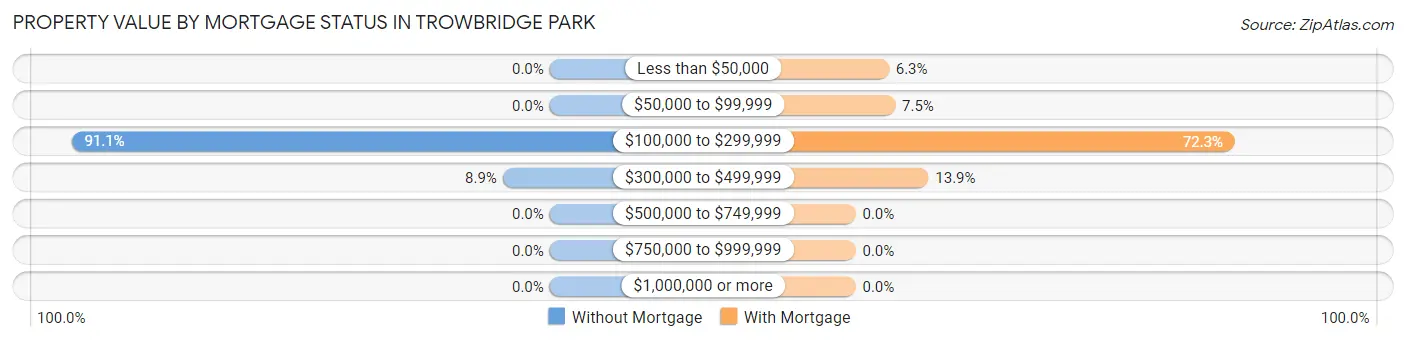
| Property Value | Without Mortgage | With Mortgage |
| Less than $50,000 | 0 (0.0%) | 26 (6.3%) |
| $50,000 to $99,999 | 0 (0.0%) | 31 (7.5%) |
| $100,000 to $299,999 | 153 (91.1%) | 297 (72.3%) |
| $300,000 to $499,999 | 15 (8.9%) | 57 (13.9%) |
| $500,000 to $749,999 | 0 (0.0%) | 0 (0.0%) |
| $750,000 to $999,999 | 0 (0.0%) | 0 (0.0%) |
| $1,000,000 or more | 0 (0.0%) | 0 (0.0%) |
| Total | 168 (100.0%) | 411 (100.0%) |
Household Income by Mortgage Status in Trowbridge Park
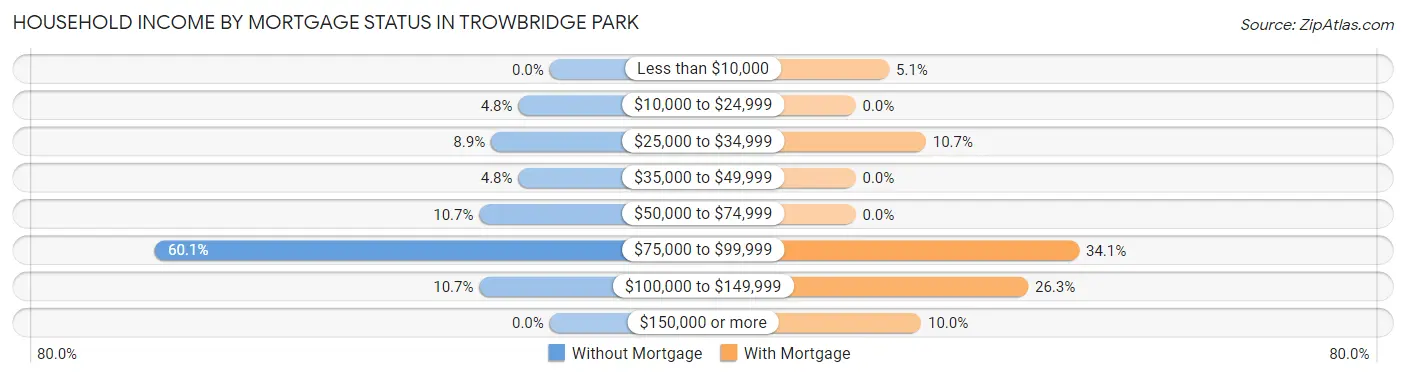
| Household Income | Without Mortgage | With Mortgage |
| Less than $10,000 | 0 (0.0%) | 21 (5.1%) |
| $10,000 to $24,999 | 8 (4.8%) | 0 (0.0%) |
| $25,000 to $34,999 | 15 (8.9%) | 44 (10.7%) |
| $35,000 to $49,999 | 8 (4.8%) | 0 (0.0%) |
| $50,000 to $74,999 | 18 (10.7%) | 0 (0.0%) |
| $75,000 to $99,999 | 101 (60.1%) | 140 (34.1%) |
| $100,000 to $149,999 | 18 (10.7%) | 108 (26.3%) |
| $150,000 or more | 0 (0.0%) | 41 (10.0%) |
| Total | 168 (100.0%) | 411 (100.0%) |
Property Value to Household Income Ratio in Trowbridge Park
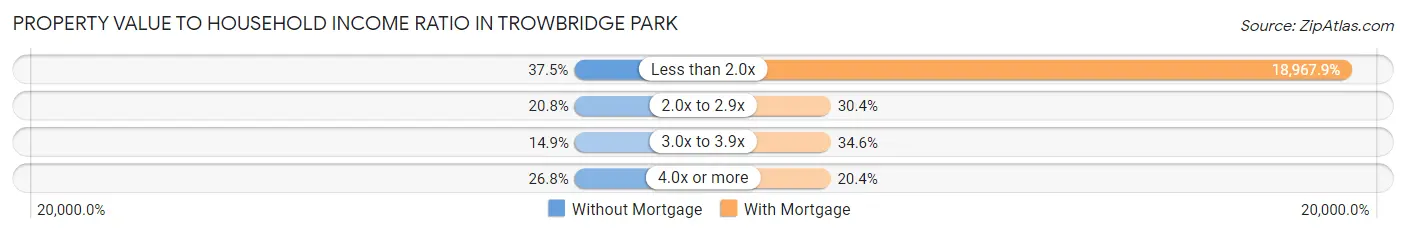
| Value-to-Income Ratio | Without Mortgage | With Mortgage |
| Less than 2.0x | 63 (37.5%) | 77,958 (18,967.9%) |
| 2.0x to 2.9x | 35 (20.8%) | 125 (30.4%) |
| 3.0x to 3.9x | 25 (14.9%) | 142 (34.5%) |
| 4.0x or more | 45 (26.8%) | 84 (20.4%) |
| Total | 168 (100.0%) | 411 (100.0%) |
Real Estate Taxes by Mortgage Status in Trowbridge Park
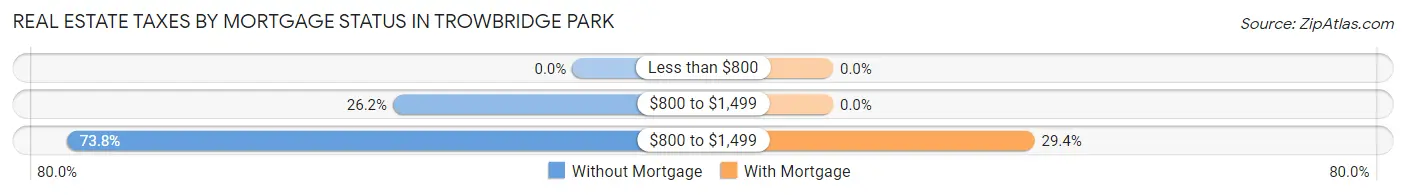
| Property Taxes | Without Mortgage | With Mortgage |
| Less than $800 | 0 (0.0%) | 0 (0.0%) |
| $800 to $1,499 | 44 (26.2%) | 0 (0.0%) |
| $800 to $1,499 | 124 (73.8%) | 121 (29.4%) |
| Total | 168 (100.0%) | 411 (100.0%) |
Health & Disability in Trowbridge Park
Health Insurance Coverage by Age in Trowbridge Park
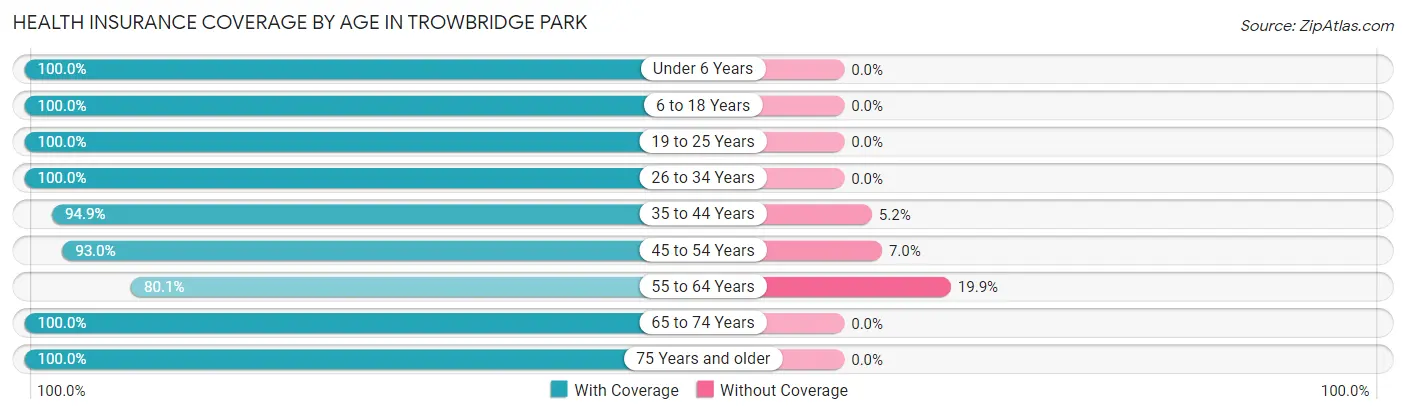
| Age Bracket | With Coverage | Without Coverage |
| Under 6 Years | 54 (100.0%) | 0 (0.0%) |
| 6 to 18 Years | 165 (100.0%) | 0 (0.0%) |
| 19 to 25 Years | 413 (100.0%) | 0 (0.0%) |
| 26 to 34 Years | 307 (100.0%) | 0 (0.0%) |
| 35 to 44 Years | 92 (94.9%) | 5 (5.1%) |
| 45 to 54 Years | 172 (93.0%) | 13 (7.0%) |
| 55 to 64 Years | 258 (80.1%) | 64 (19.9%) |
| 65 to 74 Years | 451 (100.0%) | 0 (0.0%) |
| 75 Years and older | 157 (100.0%) | 0 (0.0%) |
| Total | 2,069 (96.2%) | 82 (3.8%) |
Health Insurance Coverage by Citizenship Status in Trowbridge Park
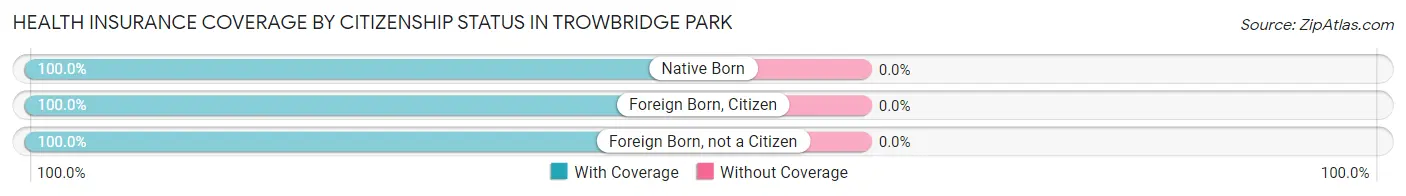
| Citizenship Status | With Coverage | Without Coverage |
| Native Born | 54 (100.0%) | 0 (0.0%) |
| Foreign Born, Citizen | 165 (100.0%) | 0 (0.0%) |
| Foreign Born, not a Citizen | 413 (100.0%) | 0 (0.0%) |
Health Insurance Coverage by Household Income in Trowbridge Park
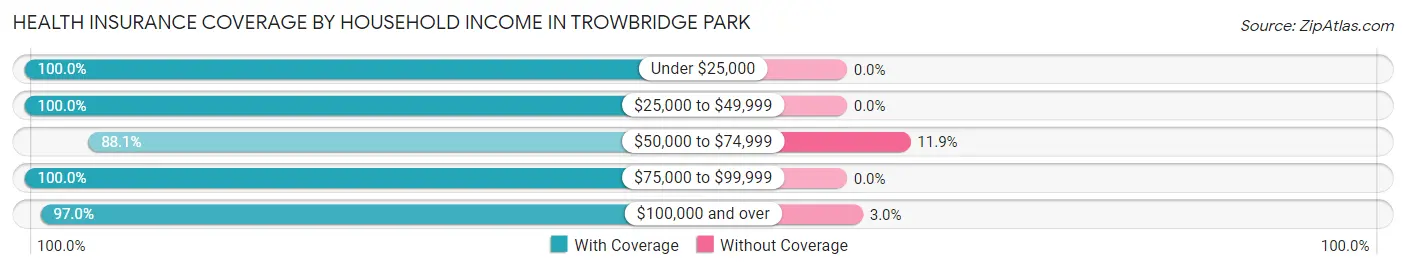
| Household Income | With Coverage | Without Coverage |
| Under $25,000 | 363 (100.0%) | 0 (0.0%) |
| $25,000 to $49,999 | 137 (100.0%) | 0 (0.0%) |
| $50,000 to $74,999 | 473 (88.1%) | 64 (11.9%) |
| $75,000 to $99,999 | 655 (100.0%) | 0 (0.0%) |
| $100,000 and over | 420 (97.0%) | 13 (3.0%) |
Public vs Private Health Insurance Coverage by Age in Trowbridge Park
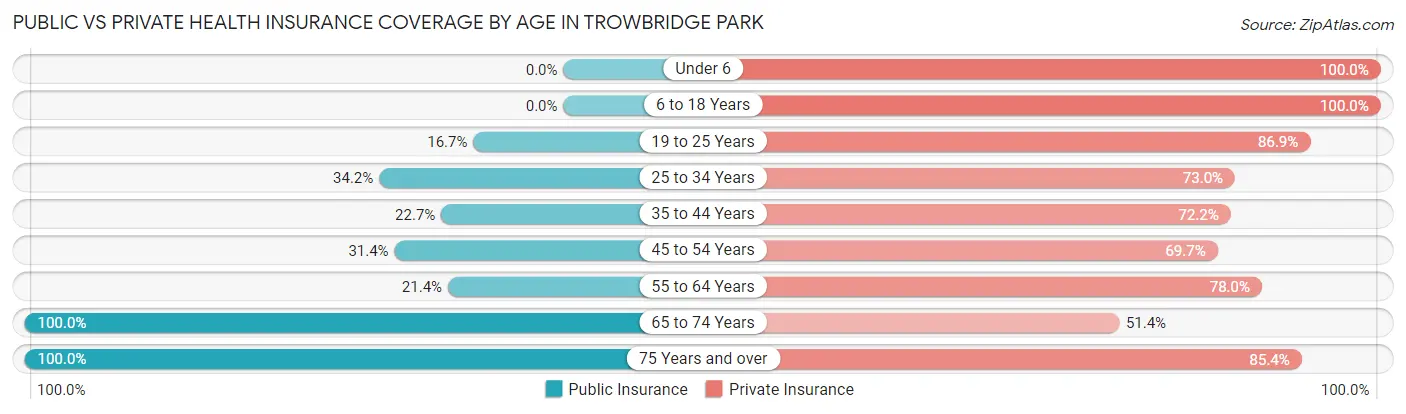
| Age Bracket | Public Insurance | Private Insurance |
| Under 6 | 0 (0.0%) | 54 (100.0%) |
| 6 to 18 Years | 0 (0.0%) | 165 (100.0%) |
| 19 to 25 Years | 69 (16.7%) | 359 (86.9%) |
| 25 to 34 Years | 105 (34.2%) | 224 (73.0%) |
| 35 to 44 Years | 22 (22.7%) | 70 (72.2%) |
| 45 to 54 Years | 58 (31.4%) | 129 (69.7%) |
| 55 to 64 Years | 69 (21.4%) | 251 (77.9%) |
| 65 to 74 Years | 451 (100.0%) | 232 (51.4%) |
| 75 Years and over | 157 (100.0%) | 134 (85.4%) |
| Total | 931 (43.3%) | 1,618 (75.2%) |
Disability Status by Sex by Age in Trowbridge Park
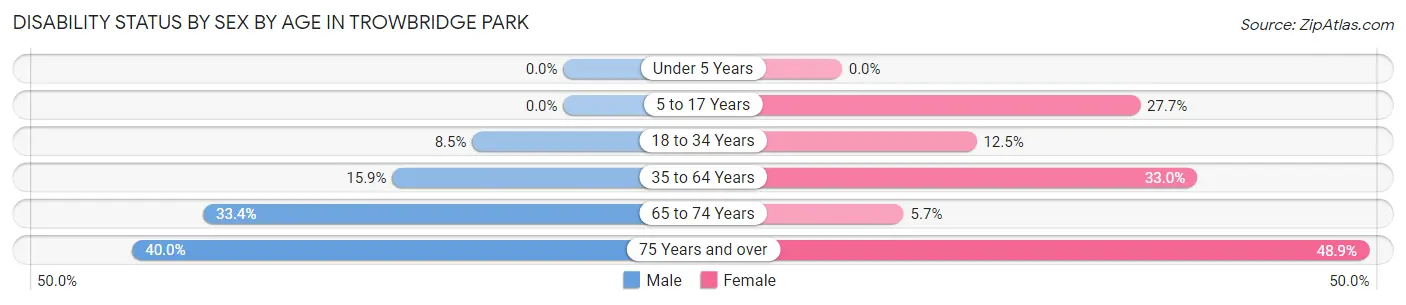
| Age Bracket | Male | Female |
| Under 5 Years | 0 (0.0%) | 0 (0.0%) |
| 5 to 17 Years | 0 (0.0%) | 31 (27.7%) |
| 18 to 34 Years | 31 (8.5%) | 47 (12.5%) |
| 35 to 64 Years | 53 (15.9%) | 89 (33.0%) |
| 65 to 74 Years | 110 (33.4%) | 7 (5.7%) |
| 75 Years and over | 26 (40.0%) | 45 (48.9%) |
Disability Class by Sex by Age in Trowbridge Park
Disability Class: Hearing Difficulty
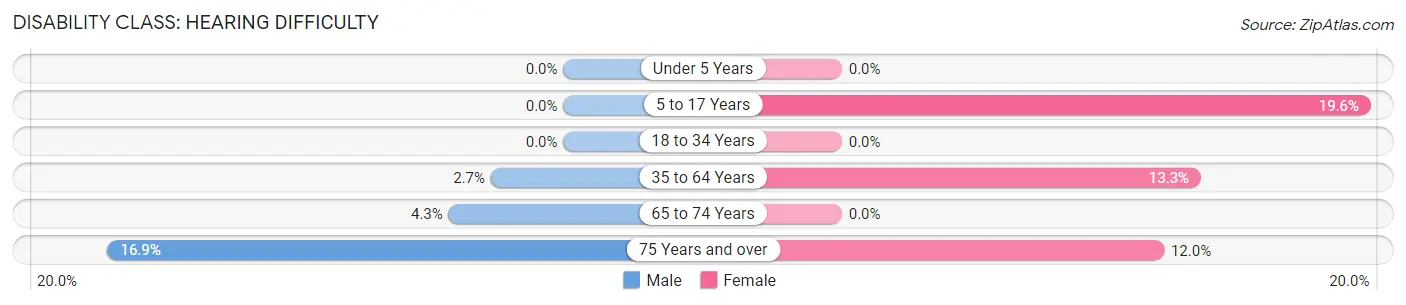
| Age Bracket | Male | Female |
| Under 5 Years | 0 (0.0%) | 0 (0.0%) |
| 5 to 17 Years | 0 (0.0%) | 22 (19.6%) |
| 18 to 34 Years | 0 (0.0%) | 0 (0.0%) |
| 35 to 64 Years | 9 (2.7%) | 36 (13.3%) |
| 65 to 74 Years | 14 (4.3%) | 0 (0.0%) |
| 75 Years and over | 11 (16.9%) | 11 (12.0%) |
Disability Class: Vision Difficulty
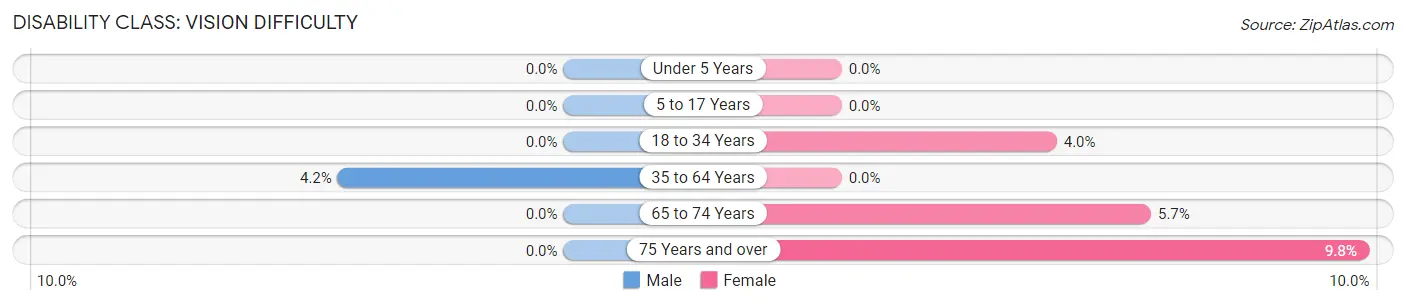
| Age Bracket | Male | Female |
| Under 5 Years | 0 (0.0%) | 0 (0.0%) |
| 5 to 17 Years | 0 (0.0%) | 0 (0.0%) |
| 18 to 34 Years | 0 (0.0%) | 15 (4.0%) |
| 35 to 64 Years | 14 (4.2%) | 0 (0.0%) |
| 65 to 74 Years | 0 (0.0%) | 7 (5.7%) |
| 75 Years and over | 0 (0.0%) | 9 (9.8%) |
Disability Class: Cognitive Difficulty
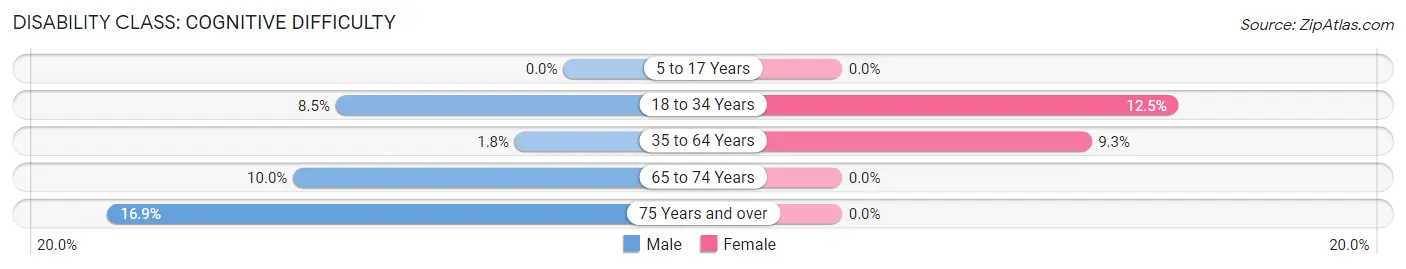
| Age Bracket | Male | Female |
| 5 to 17 Years | 0 (0.0%) | 0 (0.0%) |
| 18 to 34 Years | 31 (8.5%) | 47 (12.5%) |
| 35 to 64 Years | 6 (1.8%) | 25 (9.3%) |
| 65 to 74 Years | 33 (10.0%) | 0 (0.0%) |
| 75 Years and over | 11 (16.9%) | 0 (0.0%) |
Disability Class: Ambulatory Difficulty
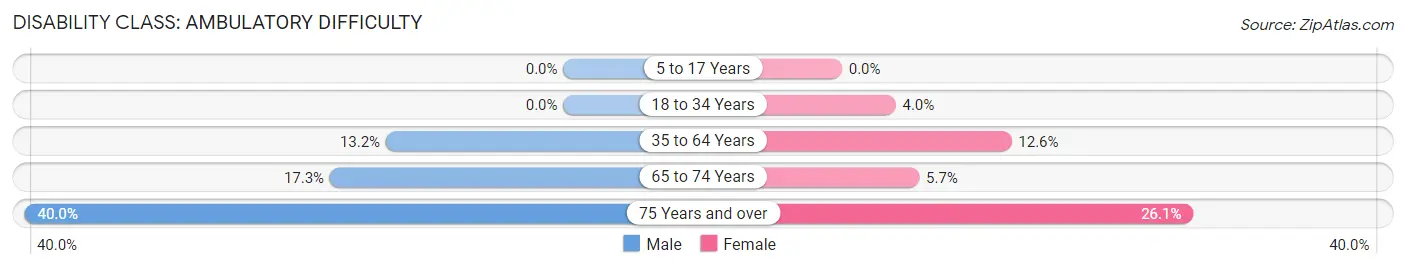
| Age Bracket | Male | Female |
| 5 to 17 Years | 0 (0.0%) | 0 (0.0%) |
| 18 to 34 Years | 0 (0.0%) | 15 (4.0%) |
| 35 to 64 Years | 44 (13.2%) | 34 (12.6%) |
| 65 to 74 Years | 57 (17.3%) | 7 (5.7%) |
| 75 Years and over | 26 (40.0%) | 24 (26.1%) |
Disability Class: Self-Care Difficulty
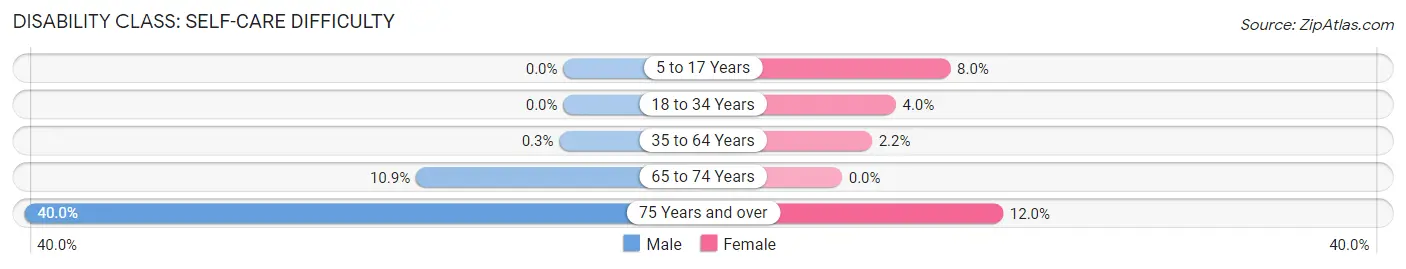
| Age Bracket | Male | Female |
| 5 to 17 Years | 0 (0.0%) | 9 (8.0%) |
| 18 to 34 Years | 0 (0.0%) | 15 (4.0%) |
| 35 to 64 Years | 1 (0.3%) | 6 (2.2%) |
| 65 to 74 Years | 36 (10.9%) | 0 (0.0%) |
| 75 Years and over | 26 (40.0%) | 11 (12.0%) |
Technology Access in Trowbridge Park
Computing Device Access in Trowbridge Park
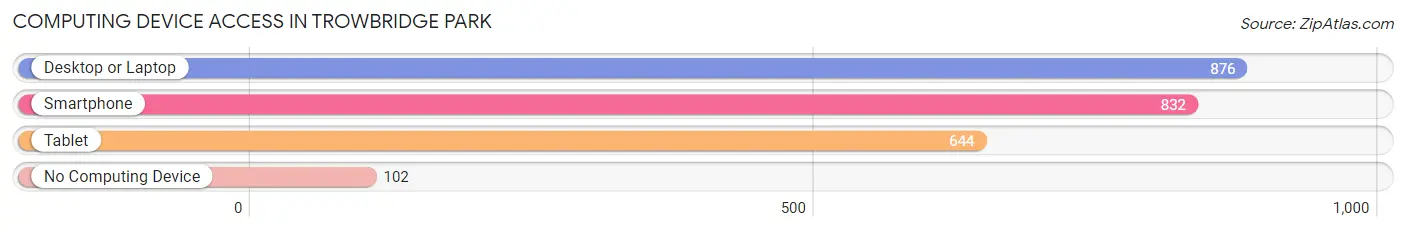
| Device Type | # Households | % Households |
| Desktop or Laptop | 876 | 84.7% |
| Smartphone | 832 | 80.5% |
| Tablet | 644 | 62.3% |
| No Computing Device | 102 | 9.9% |
| Total | 1,034 | 100.0% |
Internet Access in Trowbridge Park
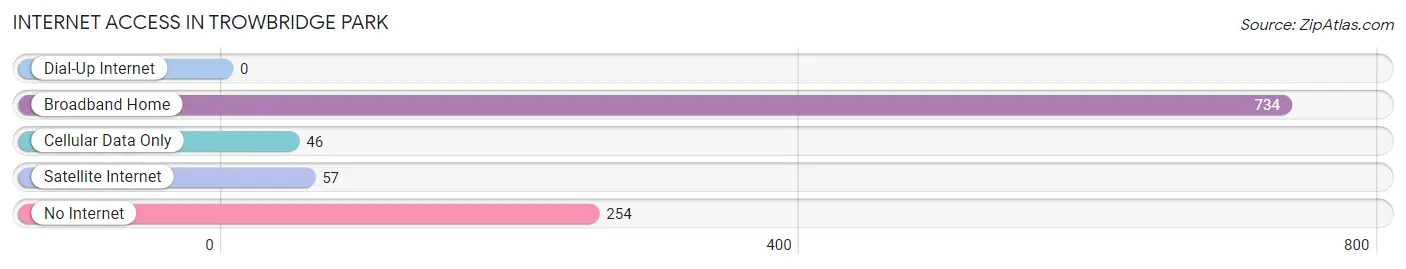
| Internet Type | # Households | % Households |
| Dial-Up Internet | 0 | 0.0% |
| Broadband Home | 734 | 71.0% |
| Cellular Data Only | 46 | 4.4% |
| Satellite Internet | 57 | 5.5% |
| No Internet | 254 | 24.6% |
| Total | 1,034 | 100.0% |
Trowbridge Park Summary
Trowbridge Park is a small unincorporated community located in the Upper Peninsula of Michigan. It is situated in the western part of the state, in the county of Menominee. The population of Trowbridge Park was estimated to be around 200 people in 2020.
History
Trowbridge Park was founded in 1887 by William Trowbridge, a lumberman from Wisconsin. He purchased a large tract of land in the area and began to develop it into a small community. The town was named after him and was originally known as Trowbridgeville. The first post office was established in 1891 and the first school was built in 1895.
The town grew slowly but steadily over the years, and by the early 1900s it had become a thriving community. It was home to several businesses, including a general store, a blacksmith shop, a sawmill, and a grist mill. The town also had a hotel, a bank, and a newspaper.
In the 1920s, the lumber industry began to decline in the area, and many of the businesses in Trowbridge Park closed. The population began to decline as well, and by the 1950s the town had become a virtual ghost town.
In the late 1970s, the town began to experience a revival. Several new businesses opened, and the population began to grow again. Today, Trowbridge Park is a small but vibrant community.
Geography
Trowbridge Park is located in the western part of the Upper Peninsula of Michigan. It is situated in Menominee County, about 25 miles east of the city of Escanaba. The town is located on the banks of the Menominee River, which flows through the area.
The terrain in the area is mostly flat, with some rolling hills. The climate is generally mild, with cold winters and warm summers. The average annual temperature is around 40 degrees Fahrenheit.
Economy
The economy of Trowbridge Park is largely based on tourism. The town is home to several small businesses, including a general store, a restaurant, and a bed and breakfast. There are also several small farms in the area, which produce a variety of crops.
The town is also home to a small sawmill, which produces lumber for the local market. The lumber is used to build homes, furniture, and other items.
Demographics
The population of Trowbridge Park was estimated to be around 200 people in 2020. The majority of the population is white, with a small percentage of African Americans and Native Americans. The median age of the population is around 40 years old.
The median household income in Trowbridge Park is around $40,000 per year. The unemployment rate is around 5%, which is slightly lower than the national average.
Conclusion
Trowbridge Park is a small unincorporated community located in the Upper Peninsula of Michigan. It was founded in 1887 by William Trowbridge and has since grown into a small but vibrant community. The economy of the town is largely based on tourism, and the population is estimated to be around 200 people. The median household income is around $40,000 per year, and the unemployment rate is around 5%.
Common Questions
What is Per Capita Income in Trowbridge Park?
Per Capita income in Trowbridge Park is $33,185.
What is the Median Family Income in Trowbridge Park?
Median Family Income in Trowbridge Park is $76,348.
What is the Median Household income in Trowbridge Park?
Median Household Income in Trowbridge Park is $63,138.
What is Income or Wage Gap in Trowbridge Park?
Income or Wage Gap in Trowbridge Park is 57.7%.
Women in Trowbridge Park earn 42.3 cents for every dollar earned by a man.
What is Inequality or Gini Index in Trowbridge Park?
Inequality or Gini Index in Trowbridge Park is 0.38.
What is the Total Population of Trowbridge Park?
Total Population of Trowbridge Park is 2,153.
What is the Total Male Population of Trowbridge Park?
Total Male Population of Trowbridge Park is 1,125.
What is the Total Female Population of Trowbridge Park?
Total Female Population of Trowbridge Park is 1,028.
What is the Ratio of Males per 100 Females in Trowbridge Park?
There are 109.44 Males per 100 Females in Trowbridge Park.
What is the Ratio of Females per 100 Males in Trowbridge Park?
There are 91.38 Females per 100 Males in Trowbridge Park.
What is the Median Population Age in Trowbridge Park?
Median Population Age in Trowbridge Park is 46.7 Years.
What is the Average Family Size in Trowbridge Park
Average Family Size in Trowbridge Park is 2.6 People.
What is the Average Household Size in Trowbridge Park
Average Household Size in Trowbridge Park is 2.1 People.
How Large is the Labor Force in Trowbridge Park?
There are 1,041 People in the Labor Forcein in Trowbridge Park.
What is the Percentage of People in the Labor Force in Trowbridge Park?
52.9% of People are in the Labor Force in Trowbridge Park.
What is the Unemployment Rate in Trowbridge Park?
Unemployment Rate in Trowbridge Park is 5.1%.