Vineyard Lake, MI Map & Demographics
Vineyard Lake Map
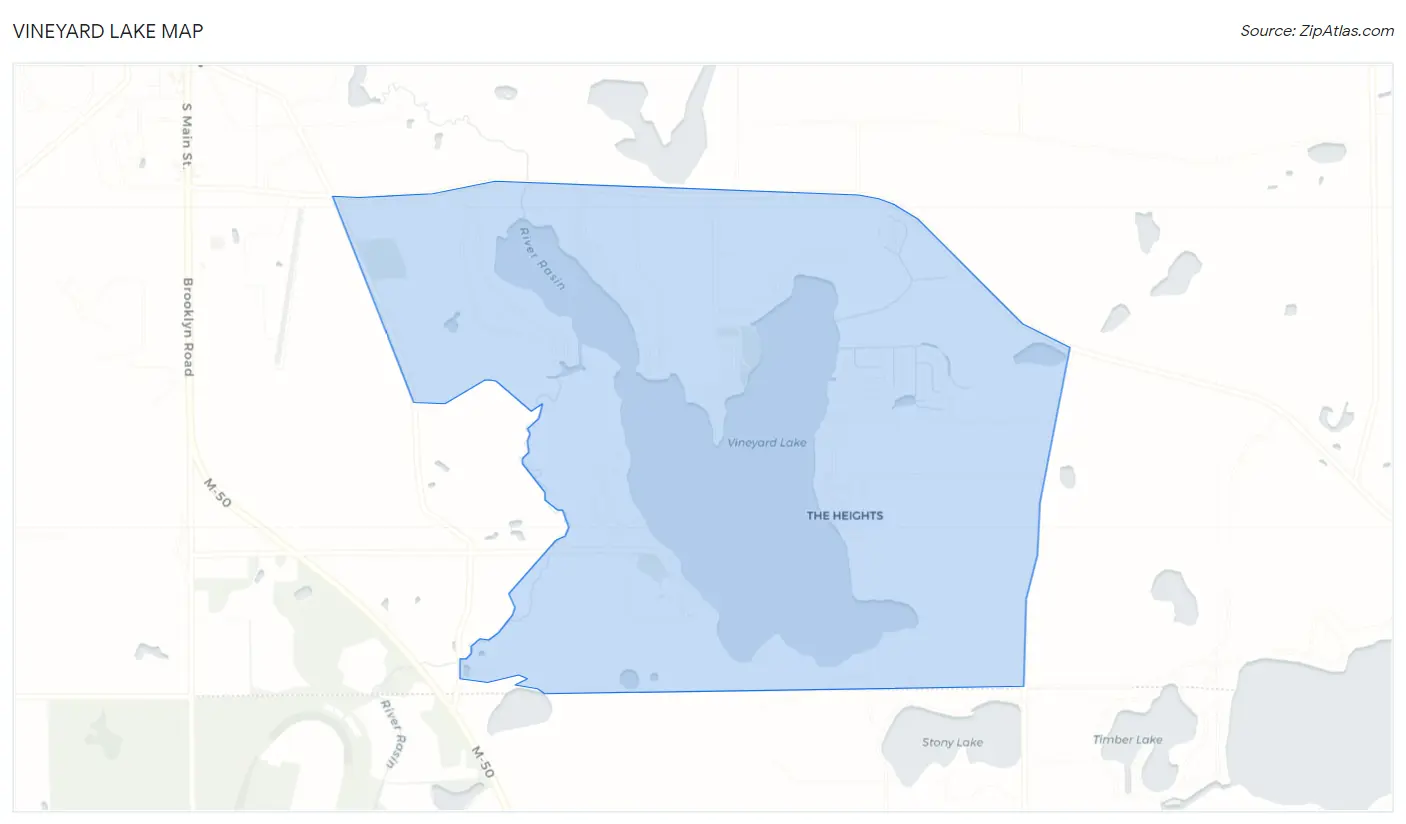
Vineyard Lake Overview
$95,443
PER CAPITA INCOME
$93,472
AVG HOUSEHOLD INCOME
0.52
INEQUALITY / GINI INDEX
918
TOTAL POPULATION
466
MALE POPULATION
452
FEMALE POPULATION
103.10
MALES / 100 FEMALES
97.00
FEMALES / 100 MALES
54.8
MEDIAN AGE
2.4
AVG FAMILY SIZE
2.1
AVG HOUSEHOLD SIZE
614
LABOR FORCE [ PEOPLE ]
69.6%
PERCENT IN LABOR FORCE
Income in Vineyard Lake
Income Overview in Vineyard Lake
| Characteristic | Number | Measure |
| Per Capita Income | 918 | $95,443 |
| Median Family Income | 317 | $0 |
| Mean Family Income | 317 | $246,254 |
| Median Household Income | 431 | $93,472 |
| Mean Household Income | 431 | $193,510 |
| Income Deficit | 317 | $0 |
| Wage / Income Gap (%) | 918 | 0.00% |
| Wage / Income Gap ($) | 918 | 100.00¢ per $1 |
| Gini / Inequality Index | 918 | 0.52 |
Earnings by Sex in Vineyard Lake
| Sex | Number | Average Earnings |
| Male | 309 (49.4%) | $0 |
| Female | 317 (50.6%) | $0 |
| Total | 626 (100.0%) | $0 |
Earnings by Sex by Income Bracket in Vineyard Lake
The most common earnings brackets in Vineyard Lake are $100,000+ for men (121 | 39.2%) and $100,000+ for women (150 | 47.3%).
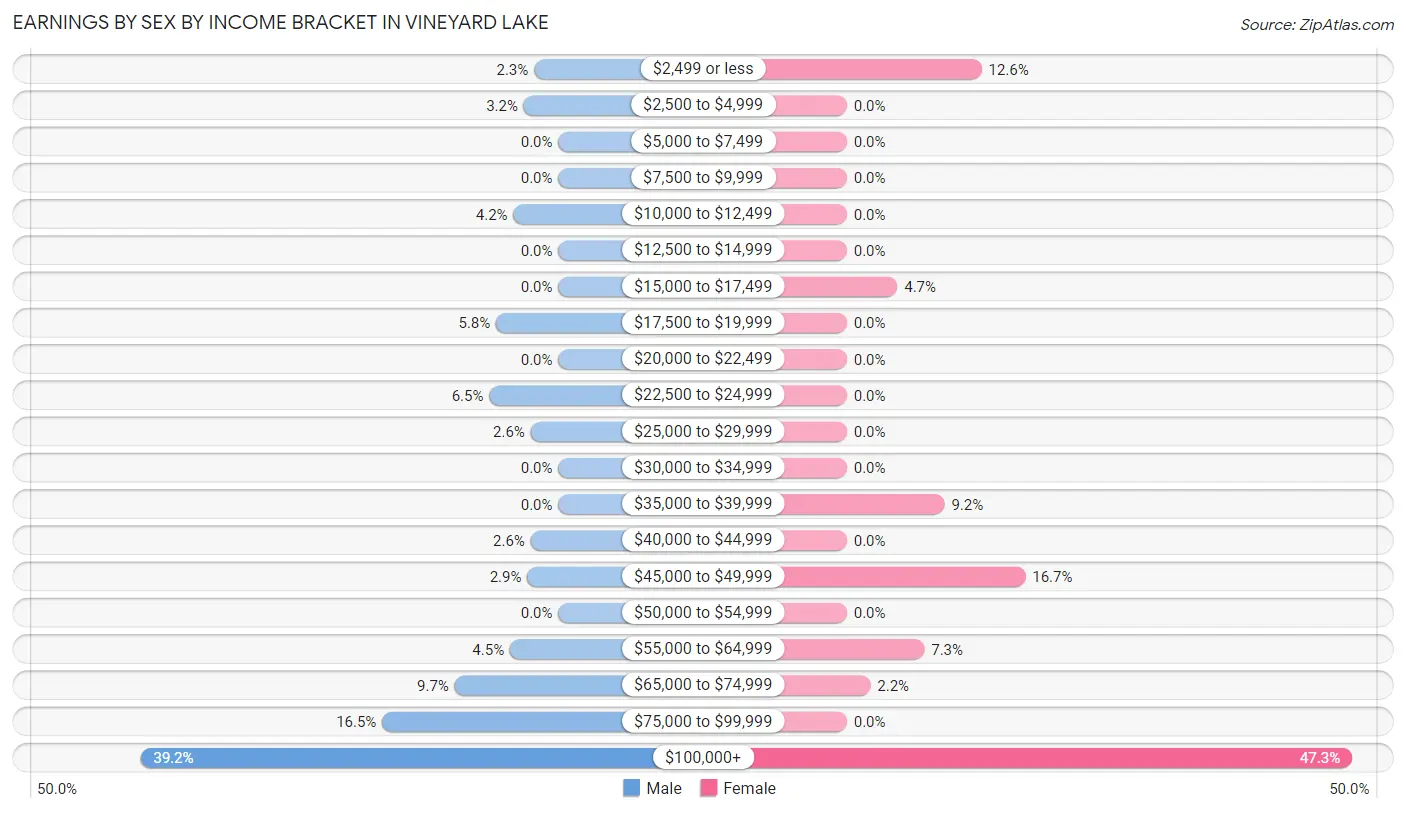
| Income | Male | Female |
| $2,499 or less | 7 (2.3%) | 40 (12.6%) |
| $2,500 to $4,999 | 10 (3.2%) | 0 (0.0%) |
| $5,000 to $7,499 | 0 (0.0%) | 0 (0.0%) |
| $7,500 to $9,999 | 0 (0.0%) | 0 (0.0%) |
| $10,000 to $12,499 | 13 (4.2%) | 0 (0.0%) |
| $12,500 to $14,999 | 0 (0.0%) | 0 (0.0%) |
| $15,000 to $17,499 | 0 (0.0%) | 15 (4.7%) |
| $17,500 to $19,999 | 18 (5.8%) | 0 (0.0%) |
| $20,000 to $22,499 | 0 (0.0%) | 0 (0.0%) |
| $22,500 to $24,999 | 20 (6.5%) | 0 (0.0%) |
| $25,000 to $29,999 | 8 (2.6%) | 0 (0.0%) |
| $30,000 to $34,999 | 0 (0.0%) | 0 (0.0%) |
| $35,000 to $39,999 | 0 (0.0%) | 29 (9.1%) |
| $40,000 to $44,999 | 8 (2.6%) | 0 (0.0%) |
| $45,000 to $49,999 | 9 (2.9%) | 53 (16.7%) |
| $50,000 to $54,999 | 0 (0.0%) | 0 (0.0%) |
| $55,000 to $64,999 | 14 (4.5%) | 23 (7.3%) |
| $65,000 to $74,999 | 30 (9.7%) | 7 (2.2%) |
| $75,000 to $99,999 | 51 (16.5%) | 0 (0.0%) |
| $100,000+ | 121 (39.2%) | 150 (47.3%) |
| Total | 309 (100.0%) | 317 (100.0%) |
Earnings by Sex by Educational Attainment in Vineyard Lake
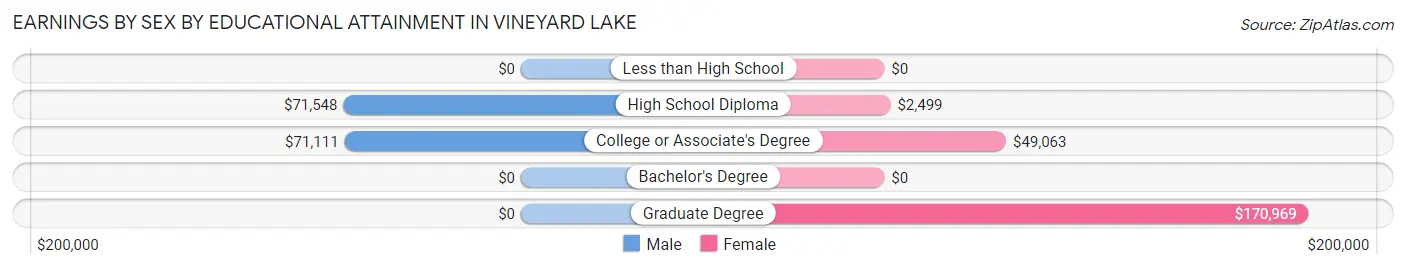
| Educational Attainment | Male Income | Female Income |
| Less than High School | - | - |
| High School Diploma | $71,548 | $2,499 |
| College or Associate's Degree | $71,111 | $49,063 |
| Bachelor's Degree | - | - |
| Graduate Degree | - | - |
| Total | - | - |
Family Income in Vineyard Lake
Family Income Brackets in Vineyard Lake
According to the Vineyard Lake family income data, there are 134 families falling into the $200,000+ income range, which is the most common income bracket and makes up 42.3% of all families.
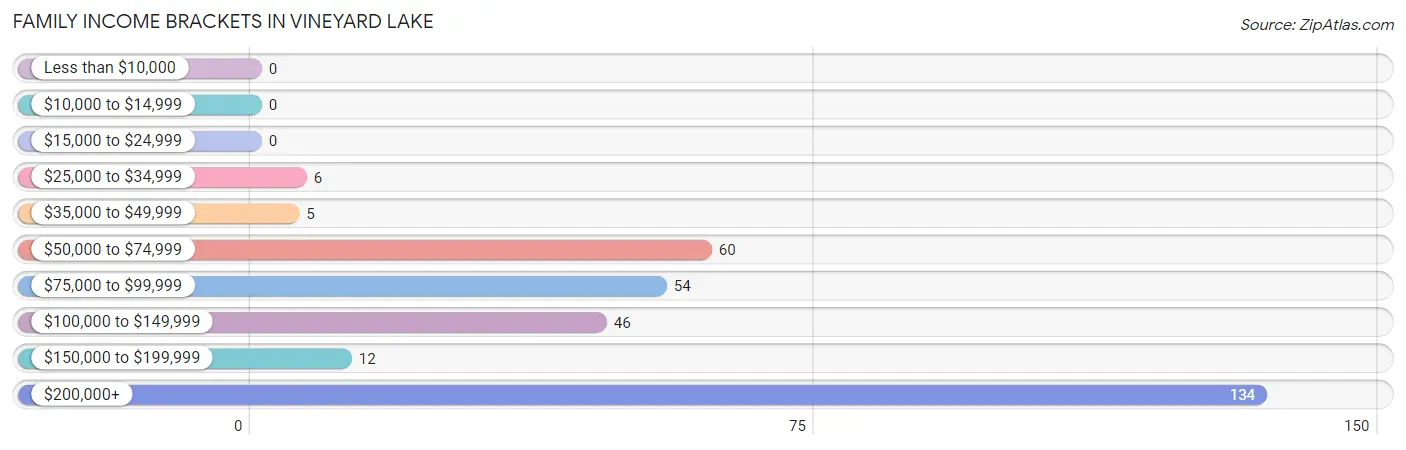
| Income Bracket | # Families | % Families |
| Less than $10,000 | 0 | 0.0% |
| $10,000 to $14,999 | 0 | 0.0% |
| $15,000 to $24,999 | 0 | 0.0% |
| $25,000 to $34,999 | 6 | 1.9% |
| $35,000 to $49,999 | 5 | 1.6% |
| $50,000 to $74,999 | 60 | 18.9% |
| $75,000 to $99,999 | 54 | 17.0% |
| $100,000 to $149,999 | 46 | 14.5% |
| $150,000 to $199,999 | 12 | 3.8% |
| $200,000+ | 134 | 42.3% |
Family Income by Famaliy Size in Vineyard Lake
| Income Bracket | # Families | Median Income |
| 2-Person Families | 269 (84.9%) | $0 |
| 3-Person Families | 40 (12.6%) | $0 |
| 4-Person Families | 8 (2.5%) | $0 |
| 5-Person Families | 0 (0.0%) | $0 |
| 6-Person Families | 0 (0.0%) | $0 |
| 7+ Person Families | 0 (0.0%) | $0 |
| Total | 317 (100.0%) | $0 |
Family Income by Number of Earners in Vineyard Lake
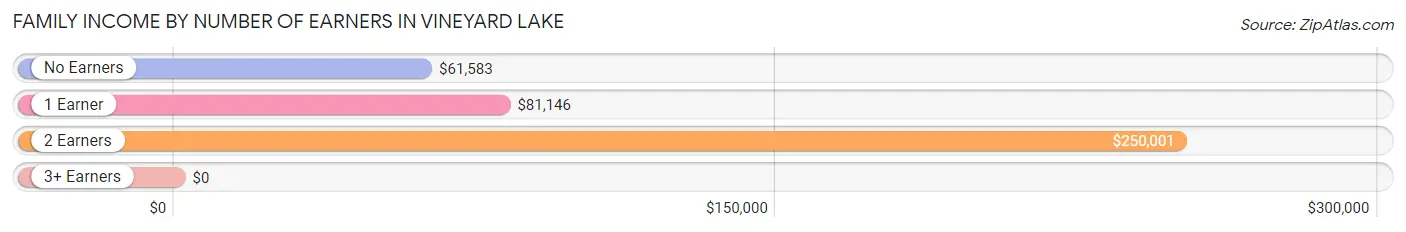
| Number of Earners | # Families | Median Income |
| No Earners | 45 (14.2%) | $61,583 |
| 1 Earner | 69 (21.8%) | $81,146 |
| 2 Earners | 195 (61.5%) | $250,001 |
| 3+ Earners | 8 (2.5%) | $0 |
| Total | 317 (100.0%) | $0 |
Household Income in Vineyard Lake
Household Income Brackets in Vineyard Lake
With 141 households falling in the category, the $200,000+ income range is the most frequent in Vineyard Lake, accounting for 32.7% of all households.
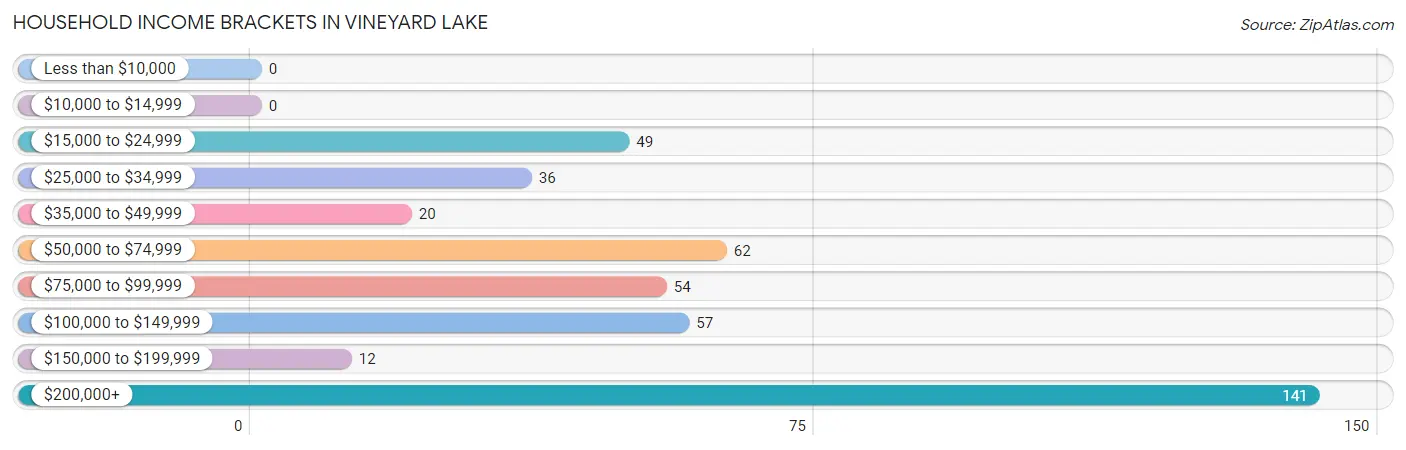
| Income Bracket | # Households | % Households |
| Less than $10,000 | 0 | 0.0% |
| $10,000 to $14,999 | 0 | 0.0% |
| $15,000 to $24,999 | 49 | 11.4% |
| $25,000 to $34,999 | 36 | 8.4% |
| $35,000 to $49,999 | 20 | 4.6% |
| $50,000 to $74,999 | 62 | 14.4% |
| $75,000 to $99,999 | 54 | 12.5% |
| $100,000 to $149,999 | 57 | 13.2% |
| $150,000 to $199,999 | 12 | 2.8% |
| $200,000+ | 141 | 32.7% |
Household Income by Householder Age in Vineyard Lake
The median household income in Vineyard Lake is $93,472, with the highest median household income of $54,643 found in the 65+ years age bracket for the primary householder. A total of 64 households (14.8%) fall into this category. Meanwhile, the 15 to 24 years age bracket for the primary householder has the lowest median household income of $0, with 13 households (3.0%) in this group.
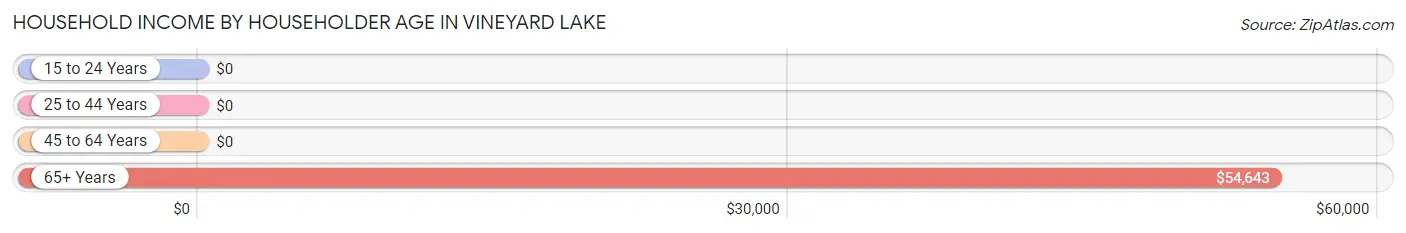
| Income Bracket | # Households | Median Income |
| 15 to 24 Years | 13 (3.0%) | $0 |
| 25 to 44 Years | 43 (10.0%) | $0 |
| 45 to 64 Years | 311 (72.2%) | $0 |
| 65+ Years | 64 (14.8%) | $54,643 |
| Total | 431 (100.0%) | $93,472 |
Poverty in Vineyard Lake
Income Below Poverty by Sex and Age in Vineyard Lake
With 3.2% poverty level for males and 0.2% for females among the residents of Vineyard Lake, 18 to 24 year old males and 65 to 74 year old females are the most vulnerable to poverty, with 13 males (30.2%) and 1 females (6.2%) in their respective age groups living below the poverty level.
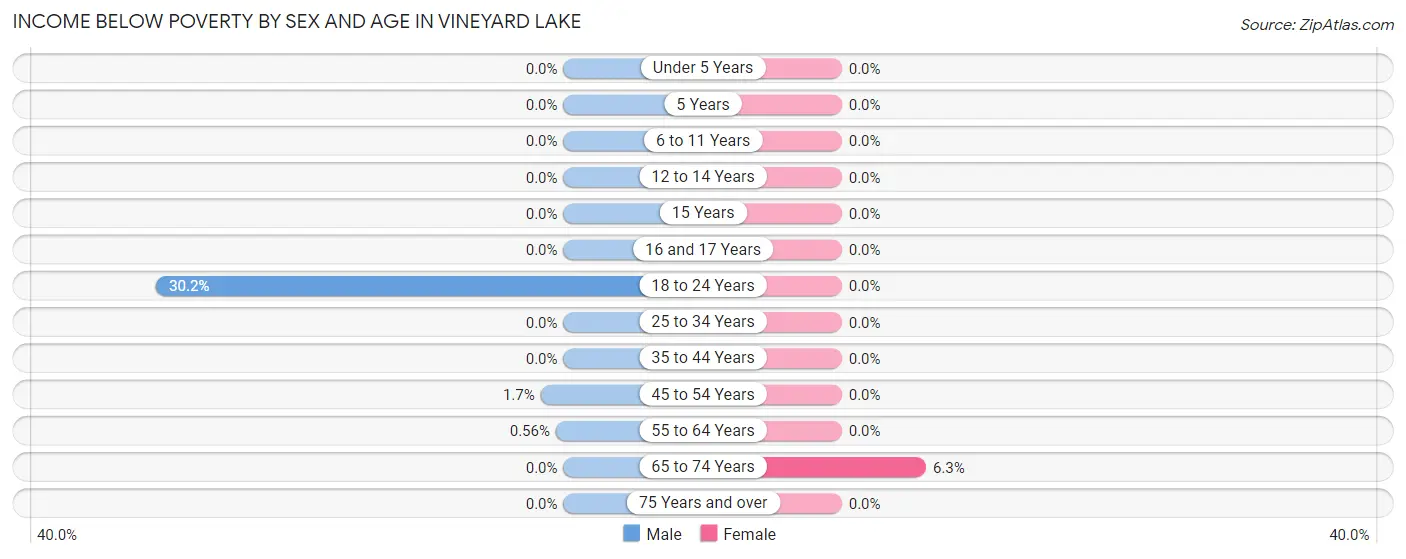
| Age Bracket | Male | Female |
| Under 5 Years | 0 (0.0%) | 0 (0.0%) |
| 5 Years | 0 (0.0%) | 0 (0.0%) |
| 6 to 11 Years | 0 (0.0%) | 0 (0.0%) |
| 12 to 14 Years | 0 (0.0%) | 0 (0.0%) |
| 15 Years | 0 (0.0%) | 0 (0.0%) |
| 16 and 17 Years | 0 (0.0%) | 0 (0.0%) |
| 18 to 24 Years | 13 (30.2%) | 0 (0.0%) |
| 25 to 34 Years | 0 (0.0%) | 0 (0.0%) |
| 35 to 44 Years | 0 (0.0%) | 0 (0.0%) |
| 45 to 54 Years | 1 (1.7%) | 0 (0.0%) |
| 55 to 64 Years | 1 (0.6%) | 0 (0.0%) |
| 65 to 74 Years | 0 (0.0%) | 1 (6.2%) |
| 75 Years and over | 0 (0.0%) | 0 (0.0%) |
| Total | 15 (3.2%) | 1 (0.2%) |
Income Above Poverty by Sex and Age in Vineyard Lake
According to the poverty statistics in Vineyard Lake, males aged 6 to 11 years and females aged 12 to 14 years are the age groups that are most secure financially, with 100.0% of males and 100.0% of females in these age groups living above the poverty line.
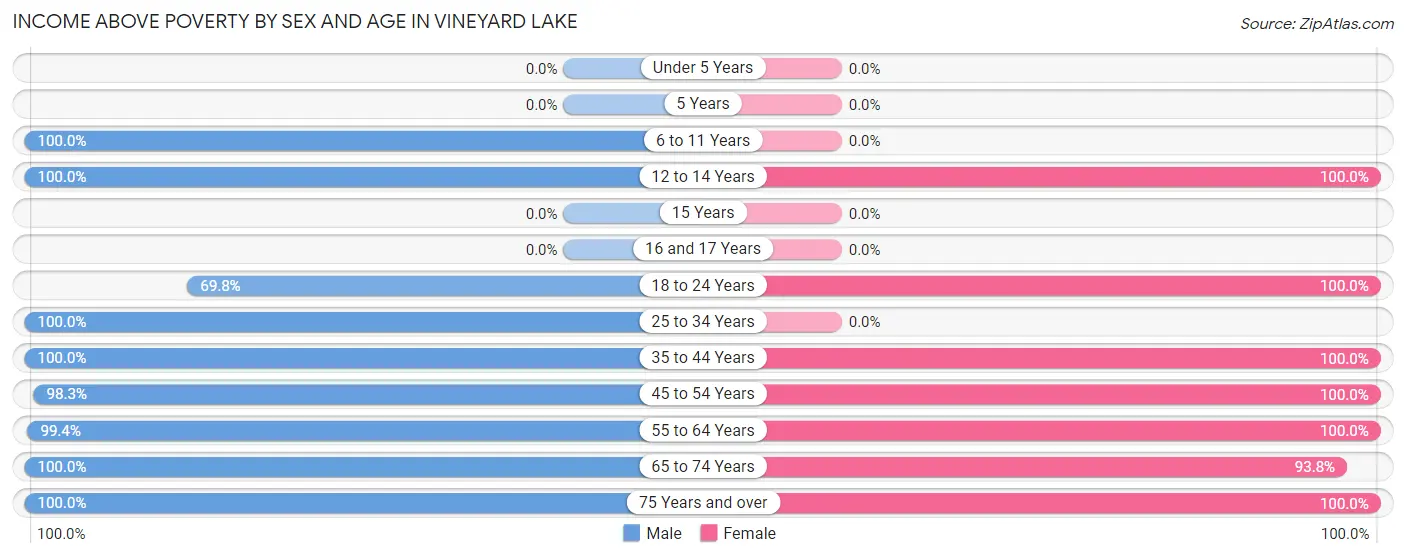
| Age Bracket | Male | Female |
| Under 5 Years | 0 (0.0%) | 0 (0.0%) |
| 5 Years | 0 (0.0%) | 0 (0.0%) |
| 6 to 11 Years | 9 (100.0%) | 0 (0.0%) |
| 12 to 14 Years | 19 (100.0%) | 8 (100.0%) |
| 15 Years | 0 (0.0%) | 0 (0.0%) |
| 16 and 17 Years | 0 (0.0%) | 0 (0.0%) |
| 18 to 24 Years | 30 (69.8%) | 51 (100.0%) |
| 25 to 34 Years | 54 (100.0%) | 0 (0.0%) |
| 35 to 44 Years | 26 (100.0%) | 15 (100.0%) |
| 45 to 54 Years | 58 (98.3%) | 203 (100.0%) |
| 55 to 64 Years | 179 (99.4%) | 128 (100.0%) |
| 65 to 74 Years | 38 (100.0%) | 15 (93.8%) |
| 75 Years and over | 38 (100.0%) | 31 (100.0%) |
| Total | 451 (96.8%) | 451 (99.8%) |
Income Below Poverty Among Married-Couple Families in Vineyard Lake
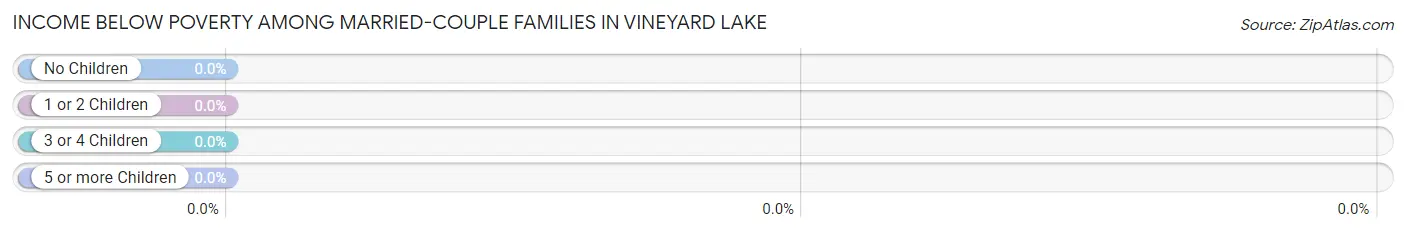
| Children | Above Poverty | Below Poverty |
| No Children | 251 (100.0%) | 0 (0.0%) |
| 1 or 2 Children | 16 (100.0%) | 0 (0.0%) |
| 3 or 4 Children | 0 (0.0%) | 0 (0.0%) |
| 5 or more Children | 0 (0.0%) | 0 (0.0%) |
| Total | 267 (100.0%) | 0 (0.0%) |
Income Below Poverty Among Single-Parent Households in Vineyard Lake
| Children | Single Father | Single Mother |
| No Children | 0 (0.0%) | 0 (0.0%) |
| 1 or 2 Children | 0 (0.0%) | 0 (0.0%) |
| 3 or 4 Children | 0 (0.0%) | 0 (0.0%) |
| 5 or more Children | 0 (0.0%) | 0 (0.0%) |
| Total | 0 (0.0%) | 0 (0.0%) |
Income Below Poverty Among Married-Couple vs Single-Parent Households in Vineyard Lake
| Children | Married-Couple Families | Single-Parent Households |
| No Children | 0 (0.0%) | 0 (0.0%) |
| 1 or 2 Children | 0 (0.0%) | 0 (0.0%) |
| 3 or 4 Children | 0 (0.0%) | 0 (0.0%) |
| 5 or more Children | 0 (0.0%) | 0 (0.0%) |
| Total | 0 (0.0%) | 0 (0.0%) |
Race in Vineyard Lake
The most populous races in Vineyard Lake are White / Caucasian (887 | 96.6%), Two or more Races (29 | 3.2%), and Black / African American (2 | 0.2%).
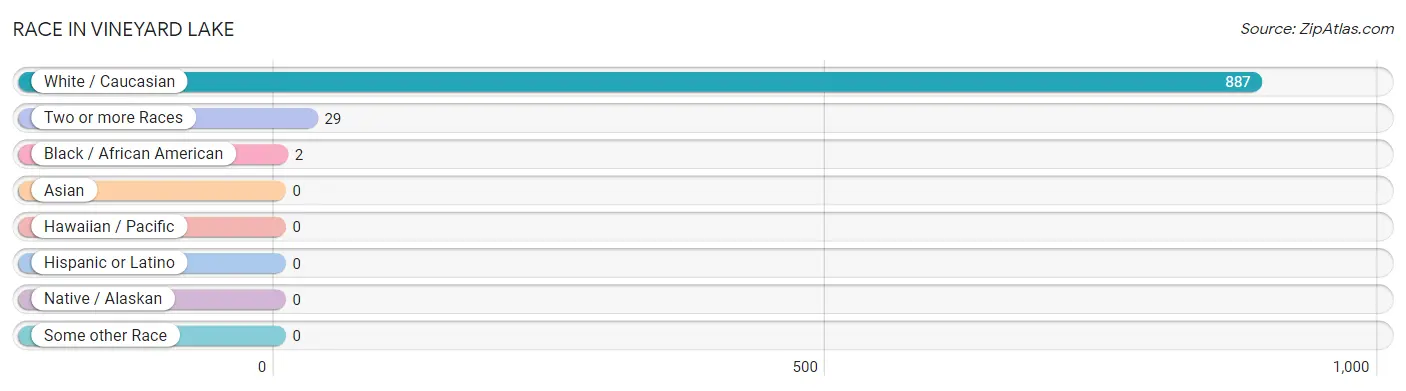
| Race | # Population | % Population |
| Asian | 0 | 0.0% |
| Black / African American | 2 | 0.2% |
| Hawaiian / Pacific | 0 | 0.0% |
| Hispanic or Latino | 0 | 0.0% |
| Native / Alaskan | 0 | 0.0% |
| White / Caucasian | 887 | 96.6% |
| Two or more Races | 29 | 3.2% |
| Some other Race | 0 | 0.0% |
| Total | 918 | 100.0% |
Ancestry in Vineyard Lake
The most populous ancestries reported in Vineyard Lake are German (447 | 48.7%), English (218 | 23.7%), Polish (76 | 8.3%), Irish (51 | 5.6%), and American (42 | 4.6%), together accounting for 90.9% of all Vineyard Lake residents.
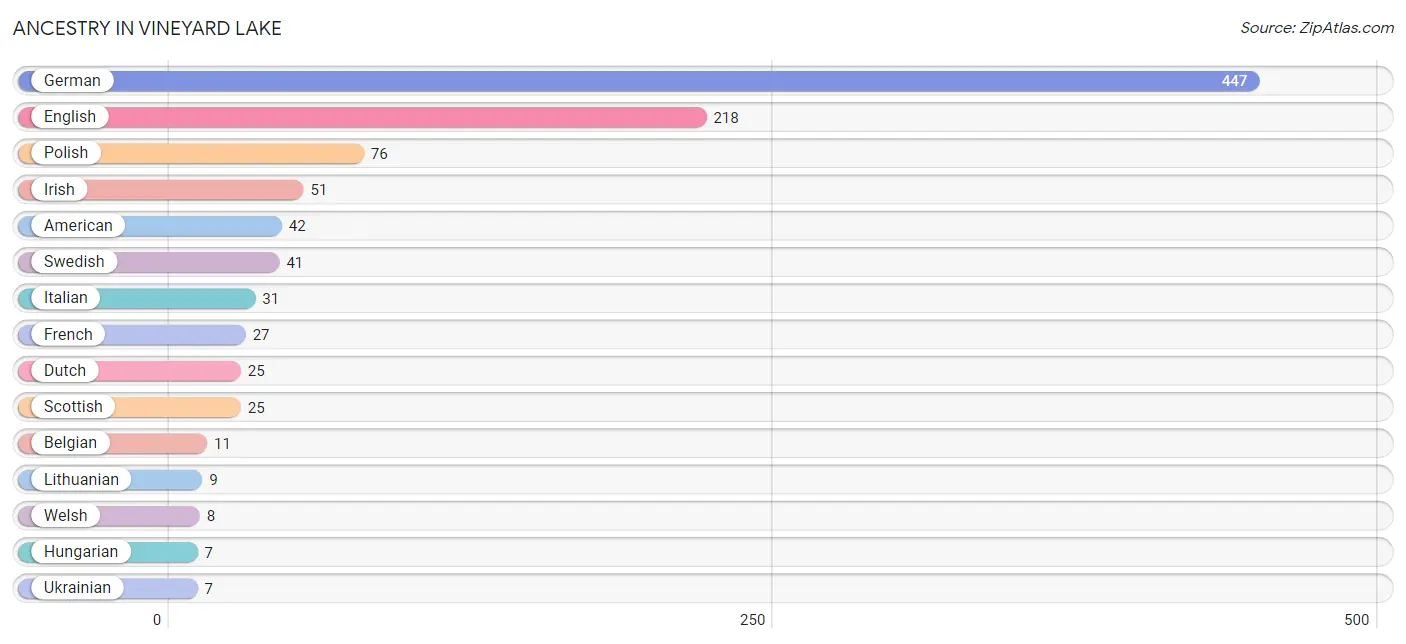
| Ancestry | # Population | % Population |
| American | 42 | 4.6% |
| Belgian | 11 | 1.2% |
| Dutch | 25 | 2.7% |
| Eastern European | 6 | 0.6% |
| English | 218 | 23.7% |
| French | 27 | 2.9% |
| German | 447 | 48.7% |
| Hungarian | 7 | 0.8% |
| Irish | 51 | 5.6% |
| Italian | 31 | 3.4% |
| Lithuanian | 9 | 1.0% |
| Polish | 76 | 8.3% |
| Scottish | 25 | 2.7% |
| Swedish | 41 | 4.5% |
| Ukrainian | 7 | 0.8% |
| Welsh | 8 | 0.9% | View All 16 Rows |
Immigrants in Vineyard Lake

| Immigration Origin | # Population | % Population | View All 0 Rows |
Sex and Age in Vineyard Lake
Sex and Age in Vineyard Lake
The most populous age groups in Vineyard Lake are 55 to 59 Years (150 | 32.2%) for men and 50 to 54 Years (158 | 35.0%) for women.
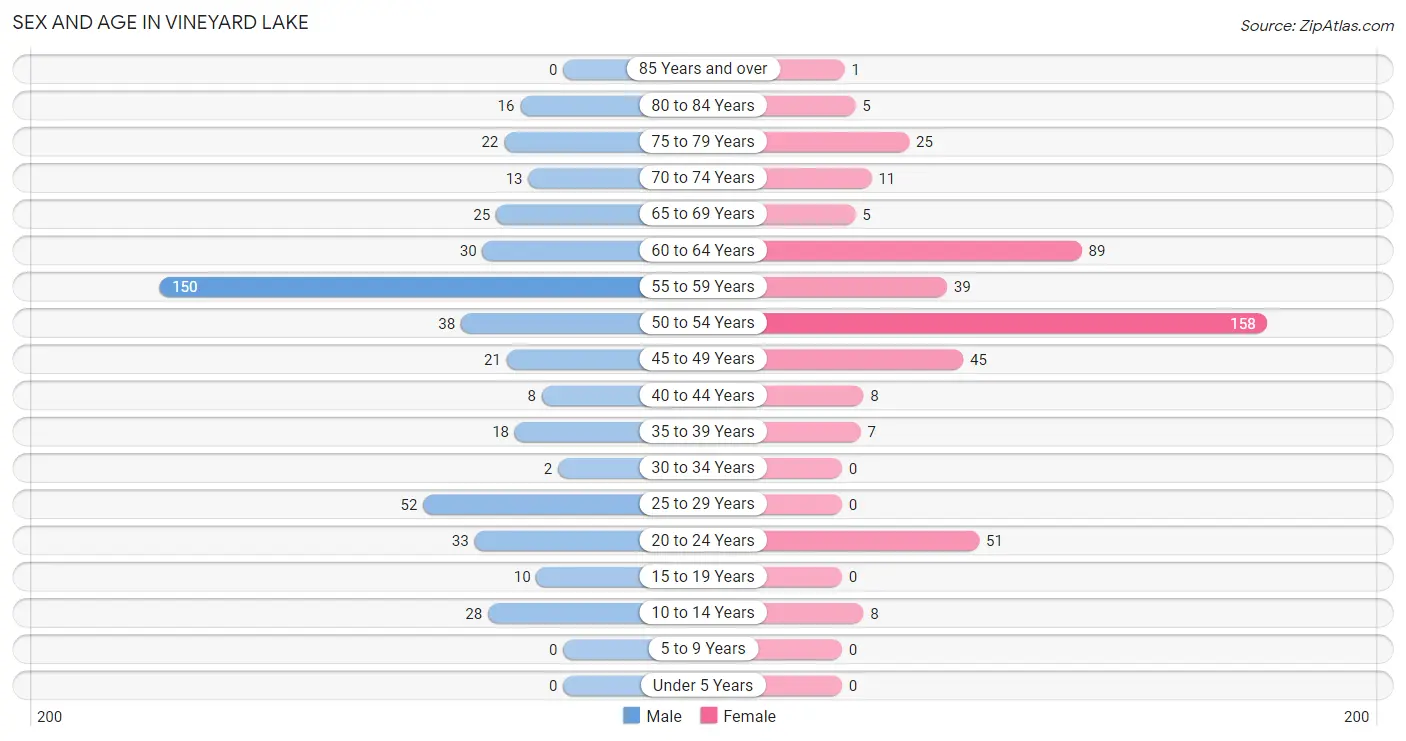
| Age Bracket | Male | Female |
| Under 5 Years | 0 (0.0%) | 0 (0.0%) |
| 5 to 9 Years | 0 (0.0%) | 0 (0.0%) |
| 10 to 14 Years | 28 (6.0%) | 8 (1.8%) |
| 15 to 19 Years | 10 (2.1%) | 0 (0.0%) |
| 20 to 24 Years | 33 (7.1%) | 51 (11.3%) |
| 25 to 29 Years | 52 (11.2%) | 0 (0.0%) |
| 30 to 34 Years | 2 (0.4%) | 0 (0.0%) |
| 35 to 39 Years | 18 (3.9%) | 7 (1.5%) |
| 40 to 44 Years | 8 (1.7%) | 8 (1.8%) |
| 45 to 49 Years | 21 (4.5%) | 45 (10.0%) |
| 50 to 54 Years | 38 (8.2%) | 158 (35.0%) |
| 55 to 59 Years | 150 (32.2%) | 39 (8.6%) |
| 60 to 64 Years | 30 (6.4%) | 89 (19.7%) |
| 65 to 69 Years | 25 (5.4%) | 5 (1.1%) |
| 70 to 74 Years | 13 (2.8%) | 11 (2.4%) |
| 75 to 79 Years | 22 (4.7%) | 25 (5.5%) |
| 80 to 84 Years | 16 (3.4%) | 5 (1.1%) |
| 85 Years and over | 0 (0.0%) | 1 (0.2%) |
| Total | 466 (100.0%) | 452 (100.0%) |
Families and Households in Vineyard Lake
Median Family Size in Vineyard Lake
The median family size in Vineyard Lake is 2.43 persons per family, with single female/mother families (43 | 13.6%) accounting for the largest median family size of 3.74 persons per family. On the other hand, married-couple families (267 | 84.2%) represent the smallest median family size with 2.22 persons per family.
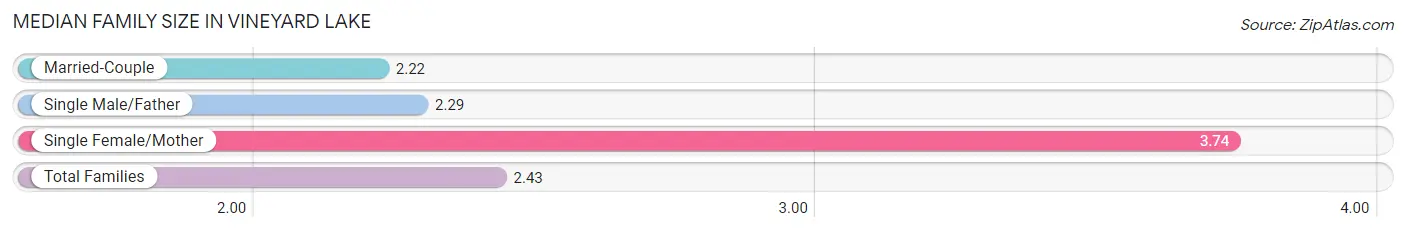
| Family Type | # Families | Family Size |
| Married-Couple | 267 (84.2%) | 2.22 |
| Single Male/Father | 7 (2.2%) | 2.29 |
| Single Female/Mother | 43 (13.6%) | 3.74 |
| Total Families | 317 (100.0%) | 2.43 |
Median Household Size in Vineyard Lake
The median household size in Vineyard Lake is 2.12 persons per household, with single female/mother households (43 | 10.0%) accounting for the largest median household size of 3.74 persons per household. non-family households (114 | 26.5%) represent the smallest median household size with 1.25 persons per household.
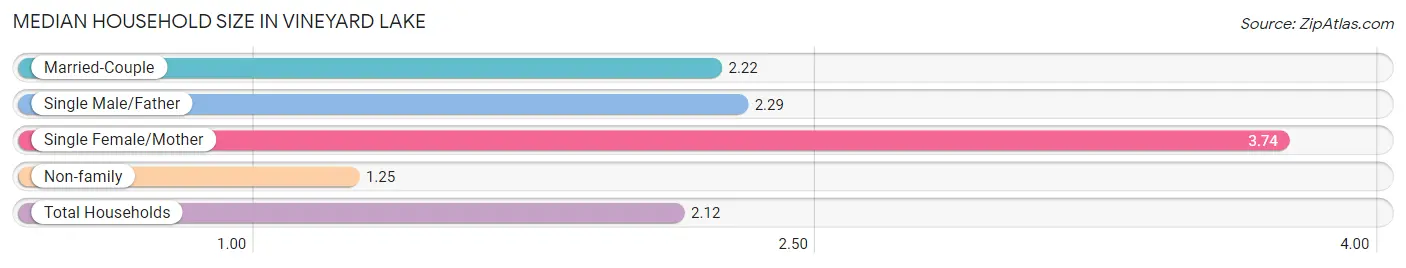
| Household Type | # Households | Household Size |
| Married-Couple | 267 (62.0%) | 2.22 |
| Single Male/Father | 7 (1.6%) | 2.29 |
| Single Female/Mother | 43 (10.0%) | 3.74 |
| Non-family | 114 (26.5%) | 1.25 |
| Total Households | 431 (100.0%) | 2.12 |
Household Size by Marriage Status in Vineyard Lake
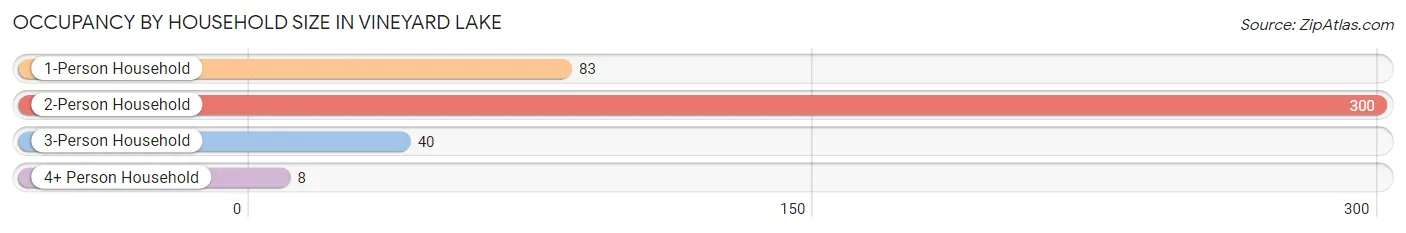
Out of a total of 431 households in Vineyard Lake, 317 (73.6%) are family households, while 114 (26.5%) are nonfamily households. The most numerous type of family households are 2-person households, comprising 269, and the most common type of nonfamily households are 1-person households, comprising 83.
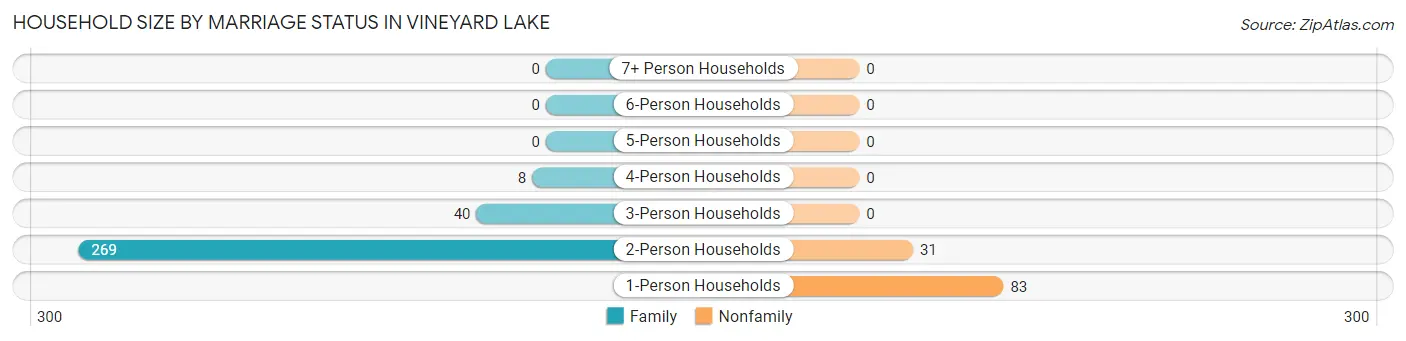
| Household Size | Family Households | Nonfamily Households |
| 1-Person Households | - | 83 (19.3%) |
| 2-Person Households | 269 (62.4%) | 31 (7.2%) |
| 3-Person Households | 40 (9.3%) | 0 (0.0%) |
| 4-Person Households | 8 (1.9%) | 0 (0.0%) |
| 5-Person Households | 0 (0.0%) | 0 (0.0%) |
| 6-Person Households | 0 (0.0%) | 0 (0.0%) |
| 7+ Person Households | 0 (0.0%) | 0 (0.0%) |
| Total | 317 (73.6%) | 114 (26.5%) |
Female Fertility in Vineyard Lake
Fertility by Age in Vineyard Lake
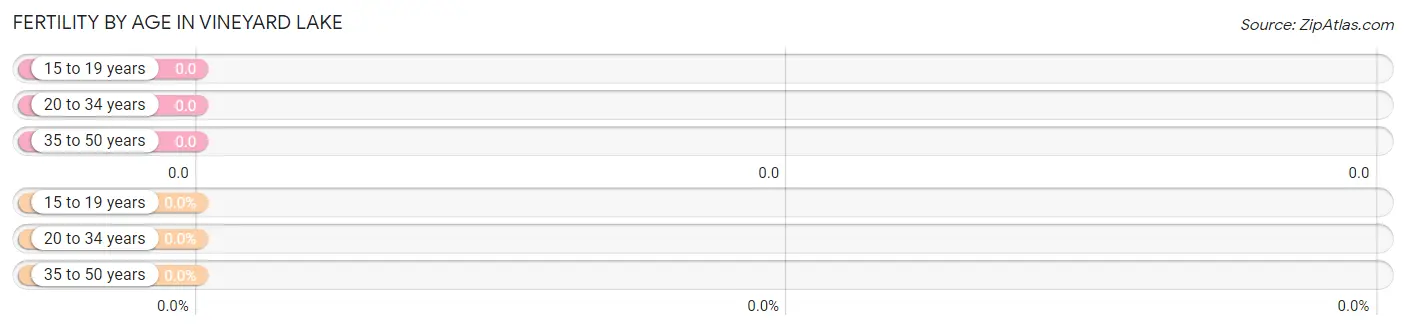
| Age Bracket | Women with Births | Births / 1,000 Women |
| 15 to 19 years | 0 (0.0%) | 0.0 |
| 20 to 34 years | 0 (0.0%) | 0.0 |
| 35 to 50 years | 0 (0.0%) | 0.0 |
| Total | 0 (0.0%) | 0.0 |
Fertility by Age by Marriage Status in Vineyard Lake
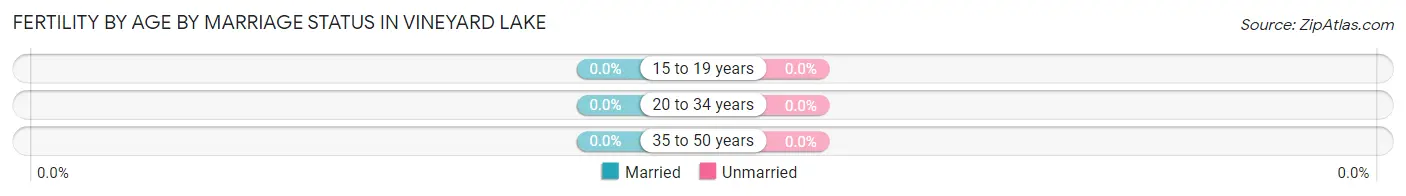
| Age Bracket | Married | Unmarried |
| 15 to 19 years | 0 (0.0%) | 0 (0.0%) |
| 20 to 34 years | 0 (0.0%) | 0 (0.0%) |
| 35 to 50 years | 0 (0.0%) | 0 (0.0%) |
| Total | 0 (0.0%) | 0 (0.0%) |
Fertility by Education in Vineyard Lake
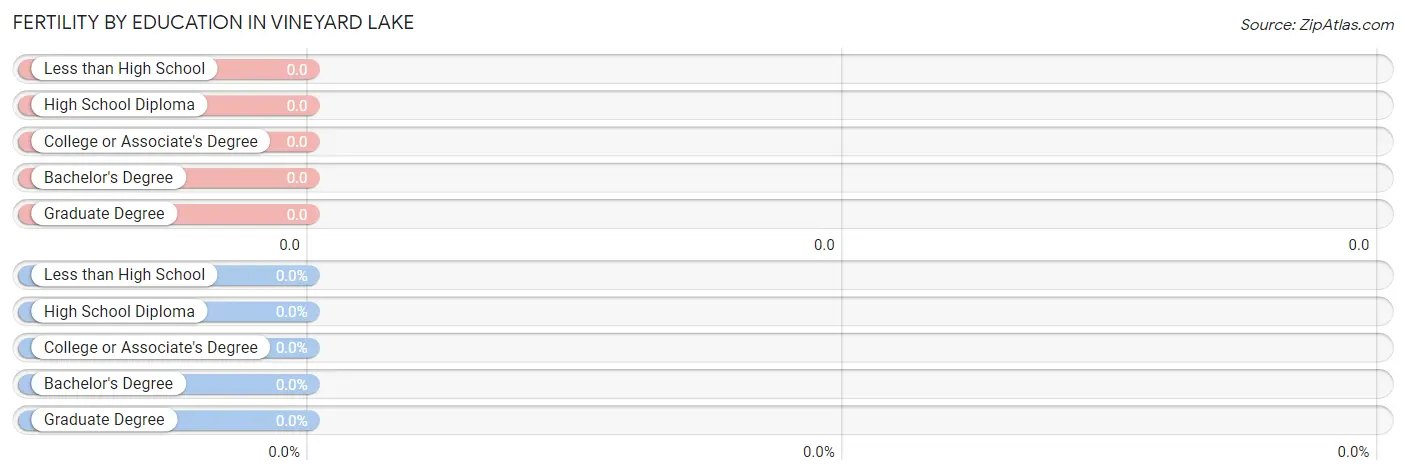
| Educational Attainment | Women with Births | Births / 1,000 Women |
| Less than High School | 0 (0.0%) | 0.0 |
| High School Diploma | 0 (0.0%) | 0.0 |
| College or Associate's Degree | 0 (0.0%) | 0.0 |
| Bachelor's Degree | 0 (0.0%) | 0.0 |
| Graduate Degree | 0 (0.0%) | 0.0 |
| Total | 0 (0.0%) | 0.0 |
Fertility by Education by Marriage Status in Vineyard Lake
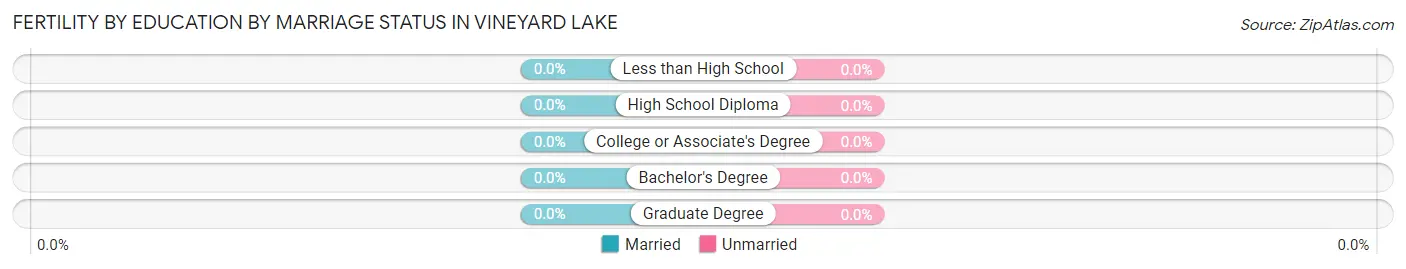
| Educational Attainment | Married | Unmarried |
| Less than High School | 0 (0.0%) | 0 (0.0%) |
| High School Diploma | 0 (0.0%) | 0 (0.0%) |
| College or Associate's Degree | 0 (0.0%) | 0 (0.0%) |
| Bachelor's Degree | 0 (0.0%) | 0 (0.0%) |
| Graduate Degree | 0 (0.0%) | 0 (0.0%) |
| Total | 0 (0.0%) | 0 (0.0%) |
Employment Characteristics in Vineyard Lake
Employment by Class of Employer in Vineyard Lake
Among the 606 employed individuals in Vineyard Lake, private company employees (315 | 52.0%), not-for-profit organizations (162 | 26.7%), and self-employed (not incorporated) (49 | 8.1%) make up the most common classes of employment.
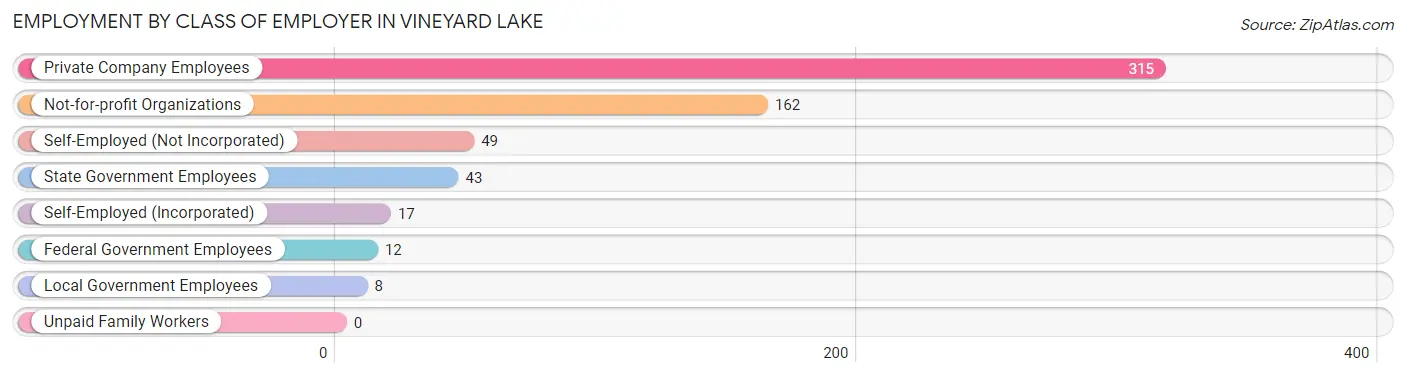
| Employer Class | # Employees | % Employees |
| Private Company Employees | 315 | 52.0% |
| Self-Employed (Incorporated) | 17 | 2.8% |
| Self-Employed (Not Incorporated) | 49 | 8.1% |
| Not-for-profit Organizations | 162 | 26.7% |
| Local Government Employees | 8 | 1.3% |
| State Government Employees | 43 | 7.1% |
| Federal Government Employees | 12 | 2.0% |
| Unpaid Family Workers | 0 | 0.0% |
| Total | 606 | 100.0% |
Employment Status by Age in Vineyard Lake
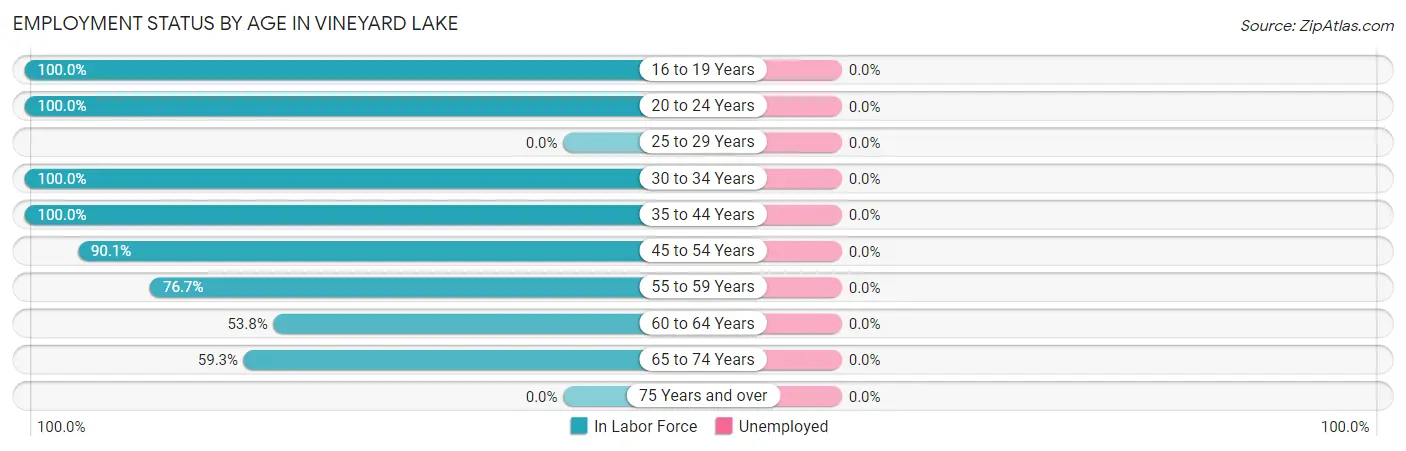
| Age Bracket | In Labor Force | Unemployed |
| 16 to 19 Years | 10 (100.0%) | 0 (0.0%) |
| 20 to 24 Years | 84 (100.0%) | 0 (0.0%) |
| 25 to 29 Years | 0 (0.0%) | 0 (0.0%) |
| 30 to 34 Years | 2 (100.0%) | 0 (0.0%) |
| 35 to 44 Years | 41 (100.0%) | 0 (0.0%) |
| 45 to 54 Years | 236 (90.1%) | 0 (0.0%) |
| 55 to 59 Years | 145 (76.7%) | 0 (0.0%) |
| 60 to 64 Years | 64 (53.8%) | 0 (0.0%) |
| 65 to 74 Years | 32 (59.3%) | 0 (0.0%) |
| 75 Years and over | 0 (0.0%) | 0 (0.0%) |
| Total | 614 (69.6%) | 0 (0.0%) |
Employment Status by Educational Attainment in Vineyard Lake
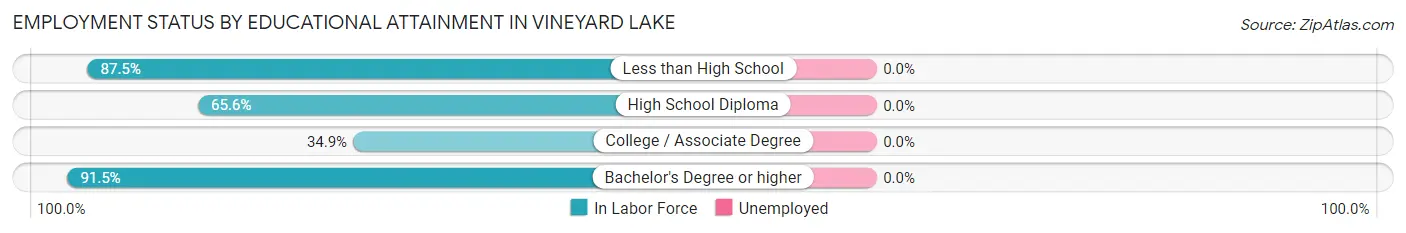
| Educational Attainment | In Labor Force | Unemployed |
| Less than High School | 14 (87.5%) | 0 (0.0%) |
| High School Diploma | 118 (65.6%) | 0 (0.0%) |
| College / Associate Degree | 45 (34.9%) | 0 (0.0%) |
| Bachelor's Degree or higher | 311 (91.5%) | 0 (0.0%) |
| Total | 488 (73.4%) | 0 (0.0%) |
Employment Occupations by Sex in Vineyard Lake
Management, Business, Science and Arts Occupations
The most common Management, Business, Science and Arts occupations in Vineyard Lake are Business & Financial (143 | 23.7%), Management (135 | 22.4%), Health Diagnosing & Treating (21 | 3.5%), Health Technologists (21 | 3.5%), and Community & Social Service (8 | 1.3%).
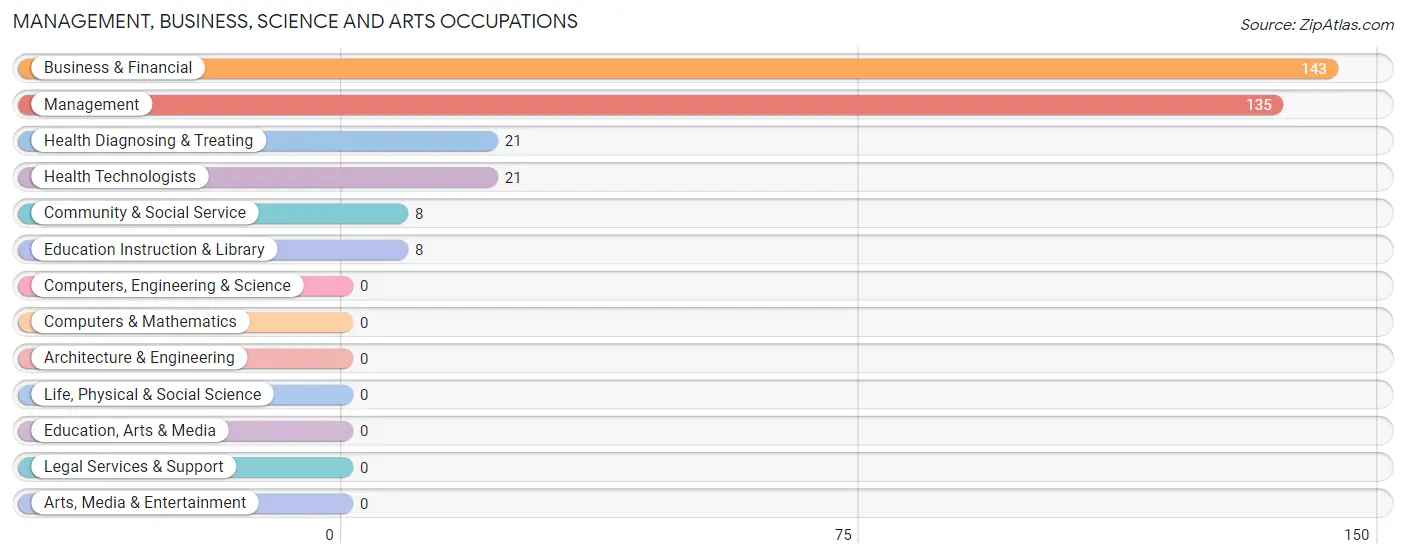
Management, Business, Science and Arts Occupations by Sex
Within the Management, Business, Science and Arts occupations in Vineyard Lake, the most male-oriented occupations are Management (94.8%), and Business & Financial (4.9%), while the most female-oriented occupations are Community & Social Service (100.0%), Education Instruction & Library (100.0%), and Health Diagnosing & Treating (100.0%).
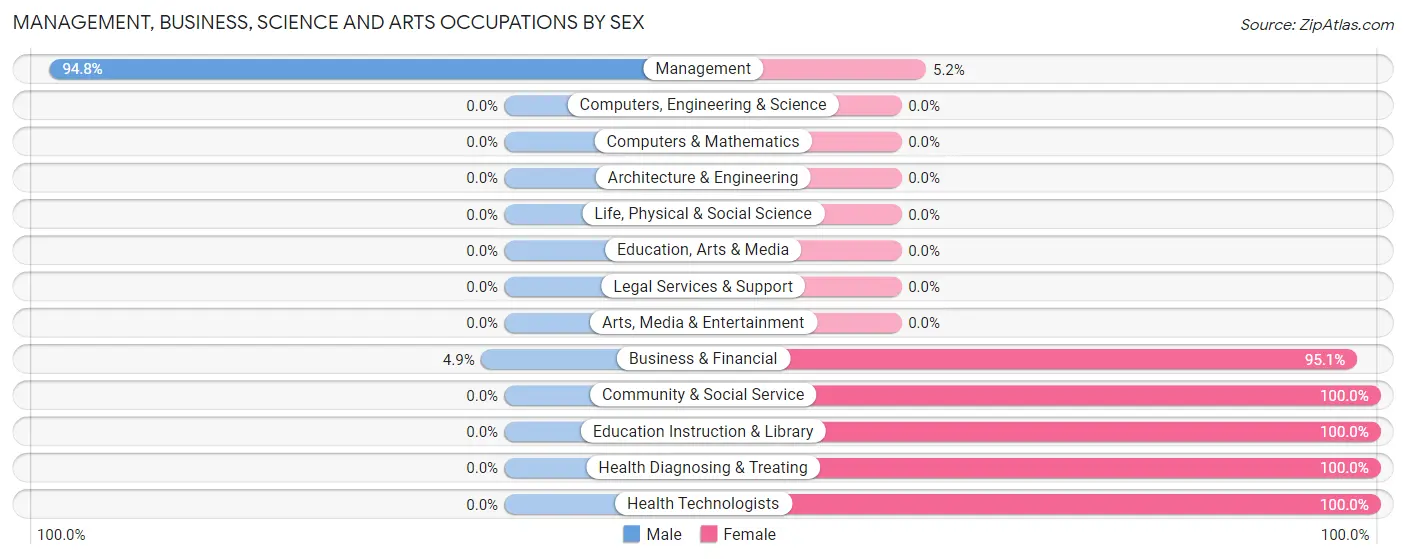
| Occupation | Male | Female |
| Management | 128 (94.8%) | 7 (5.2%) |
| Business & Financial | 7 (4.9%) | 136 (95.1%) |
| Computers, Engineering & Science | 0 (0.0%) | 0 (0.0%) |
| Computers & Mathematics | 0 (0.0%) | 0 (0.0%) |
| Architecture & Engineering | 0 (0.0%) | 0 (0.0%) |
| Life, Physical & Social Science | 0 (0.0%) | 0 (0.0%) |
| Community & Social Service | 0 (0.0%) | 8 (100.0%) |
| Education, Arts & Media | 0 (0.0%) | 0 (0.0%) |
| Legal Services & Support | 0 (0.0%) | 0 (0.0%) |
| Education Instruction & Library | 0 (0.0%) | 8 (100.0%) |
| Arts, Media & Entertainment | 0 (0.0%) | 0 (0.0%) |
| Health Diagnosing & Treating | 0 (0.0%) | 21 (100.0%) |
| Health Technologists | 0 (0.0%) | 21 (100.0%) |
| Total (Category) | 135 (44.0%) | 172 (56.0%) |
| Total (Overall) | 297 (49.3%) | 305 (50.7%) |
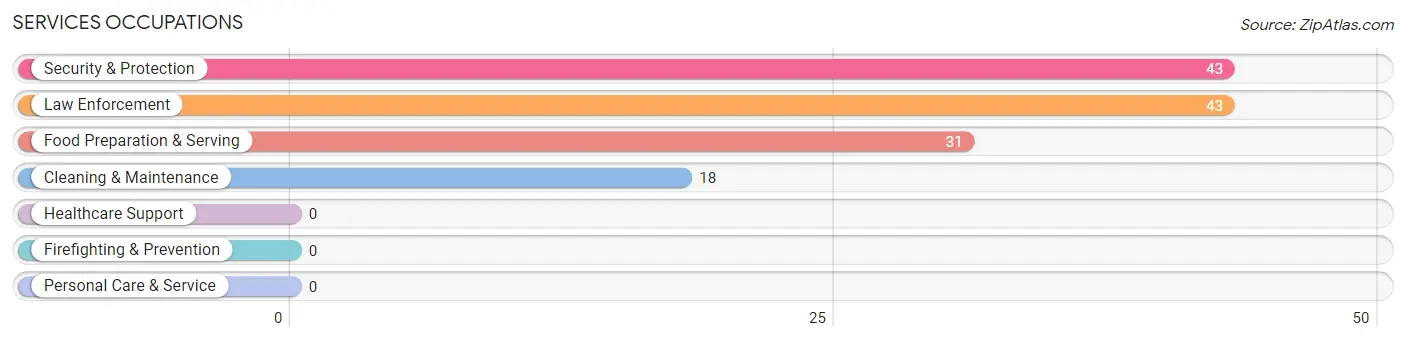
Services Occupations
The most common Services occupations in Vineyard Lake are Security & Protection (43 | 7.1%), Law Enforcement (43 | 7.1%), Food Preparation & Serving (31 | 5.1%), and Cleaning & Maintenance (18 | 3.0%).
Services Occupations by Sex
Within the Services occupations in Vineyard Lake, the most male-oriented occupations are Cleaning & Maintenance (100.0%), Food Preparation & Serving (74.2%), and Security & Protection (4.6%), while the most female-oriented occupations are Security & Protection (95.4%), Law Enforcement (95.4%), and Food Preparation & Serving (25.8%).
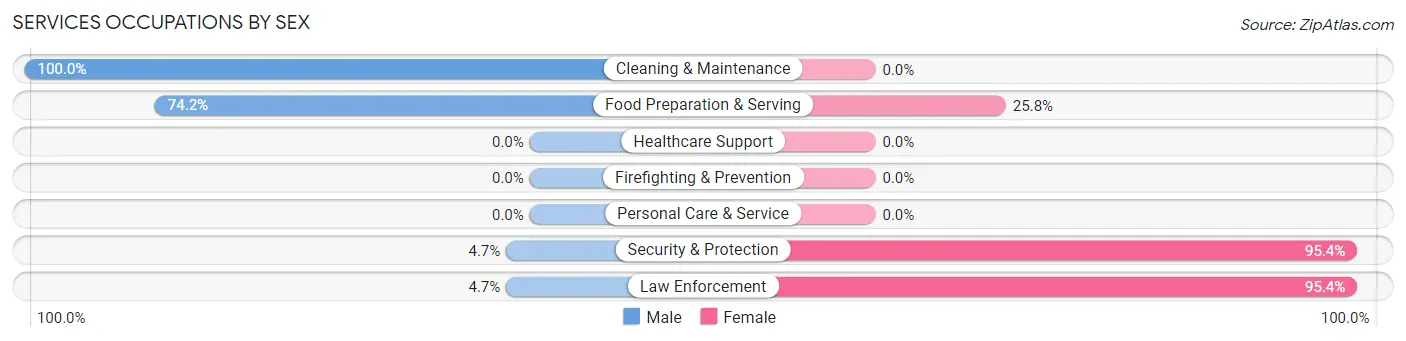
| Occupation | Male | Female |
| Healthcare Support | 0 (0.0%) | 0 (0.0%) |
| Security & Protection | 2 (4.6%) | 41 (95.4%) |
| Firefighting & Prevention | 0 (0.0%) | 0 (0.0%) |
| Law Enforcement | 2 (4.6%) | 41 (95.4%) |
| Food Preparation & Serving | 23 (74.2%) | 8 (25.8%) |
| Cleaning & Maintenance | 18 (100.0%) | 0 (0.0%) |
| Personal Care & Service | 0 (0.0%) | 0 (0.0%) |
| Total (Category) | 43 (46.7%) | 49 (53.3%) |
| Total (Overall) | 297 (49.3%) | 305 (50.7%) |
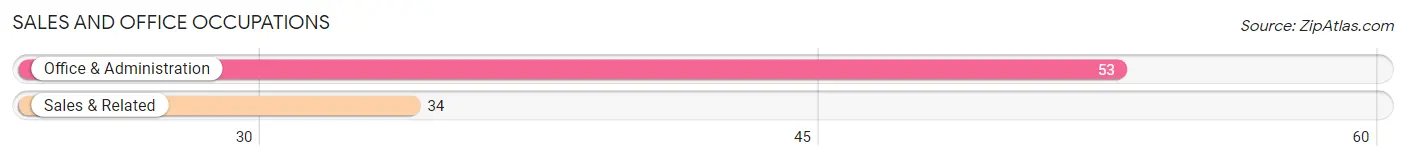
Sales and Office Occupations
The most common Sales and Office occupations in Vineyard Lake are Office & Administration (53 | 8.8%), and Sales & Related (34 | 5.7%).
Sales and Office Occupations by Sex
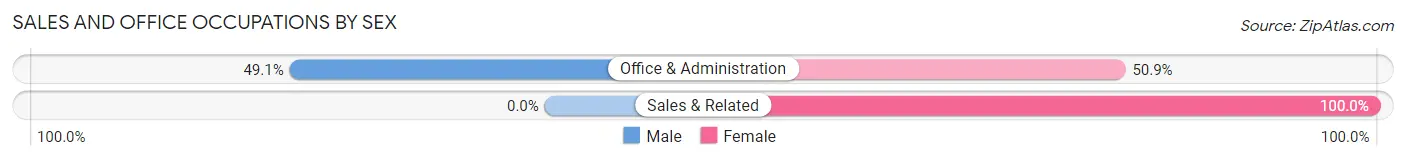
| Occupation | Male | Female |
| Sales & Related | 0 (0.0%) | 34 (100.0%) |
| Office & Administration | 26 (49.1%) | 27 (50.9%) |
| Total (Category) | 26 (29.9%) | 61 (70.1%) |
| Total (Overall) | 297 (49.3%) | 305 (50.7%) |
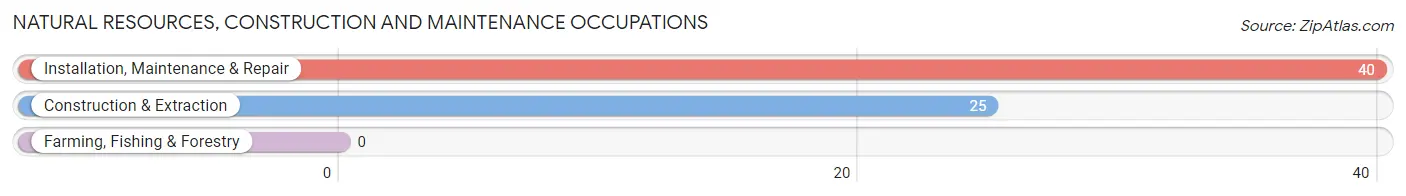
Natural Resources, Construction and Maintenance Occupations
The most common Natural Resources, Construction and Maintenance occupations in Vineyard Lake are Installation, Maintenance & Repair (40 | 6.6%), and Construction & Extraction (25 | 4.2%).
Natural Resources, Construction and Maintenance Occupations by Sex
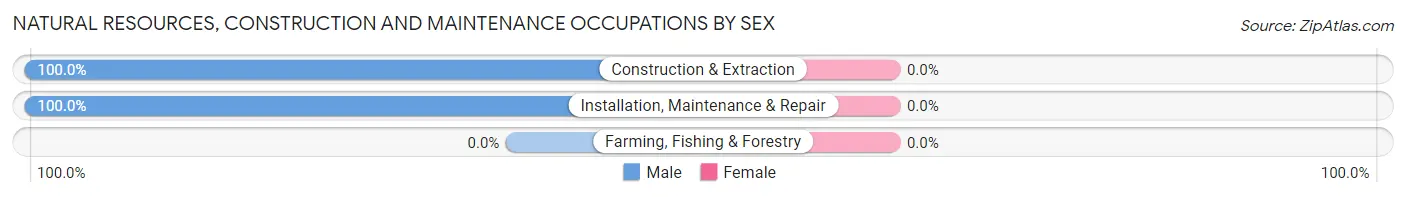
| Occupation | Male | Female |
| Farming, Fishing & Forestry | 0 (0.0%) | 0 (0.0%) |
| Construction & Extraction | 25 (100.0%) | 0 (0.0%) |
| Installation, Maintenance & Repair | 40 (100.0%) | 0 (0.0%) |
| Total (Category) | 65 (100.0%) | 0 (0.0%) |
| Total (Overall) | 297 (49.3%) | 305 (50.7%) |
Production, Transportation and Moving Occupations
The most common Production, Transportation and Moving occupations in Vineyard Lake are Transportation (36 | 6.0%), and Production (15 | 2.5%).
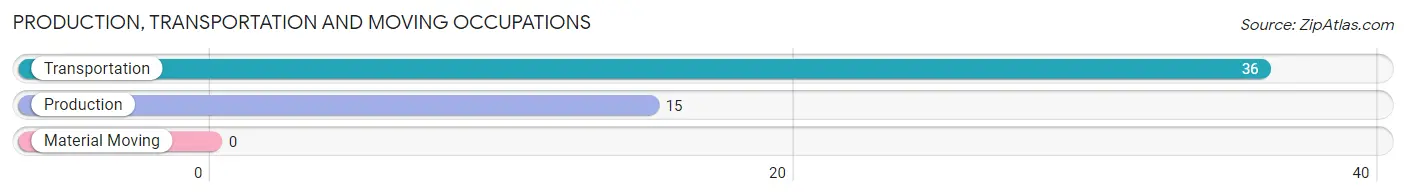
Production, Transportation and Moving Occupations by Sex
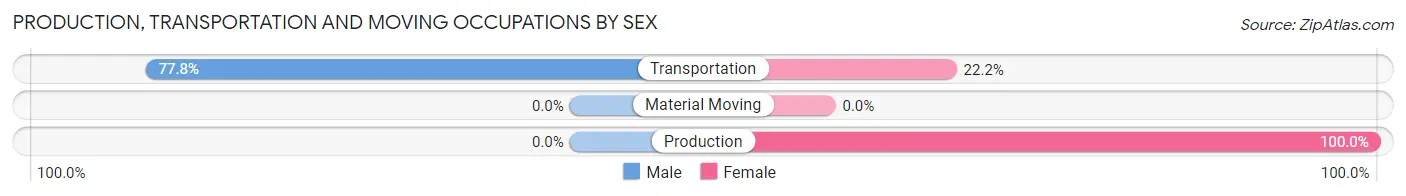
| Occupation | Male | Female |
| Production | 0 (0.0%) | 15 (100.0%) |
| Transportation | 28 (77.8%) | 8 (22.2%) |
| Material Moving | 0 (0.0%) | 0 (0.0%) |
| Total (Category) | 28 (54.9%) | 23 (45.1%) |
| Total (Overall) | 297 (49.3%) | 305 (50.7%) |
Employment Industries by Sex in Vineyard Lake
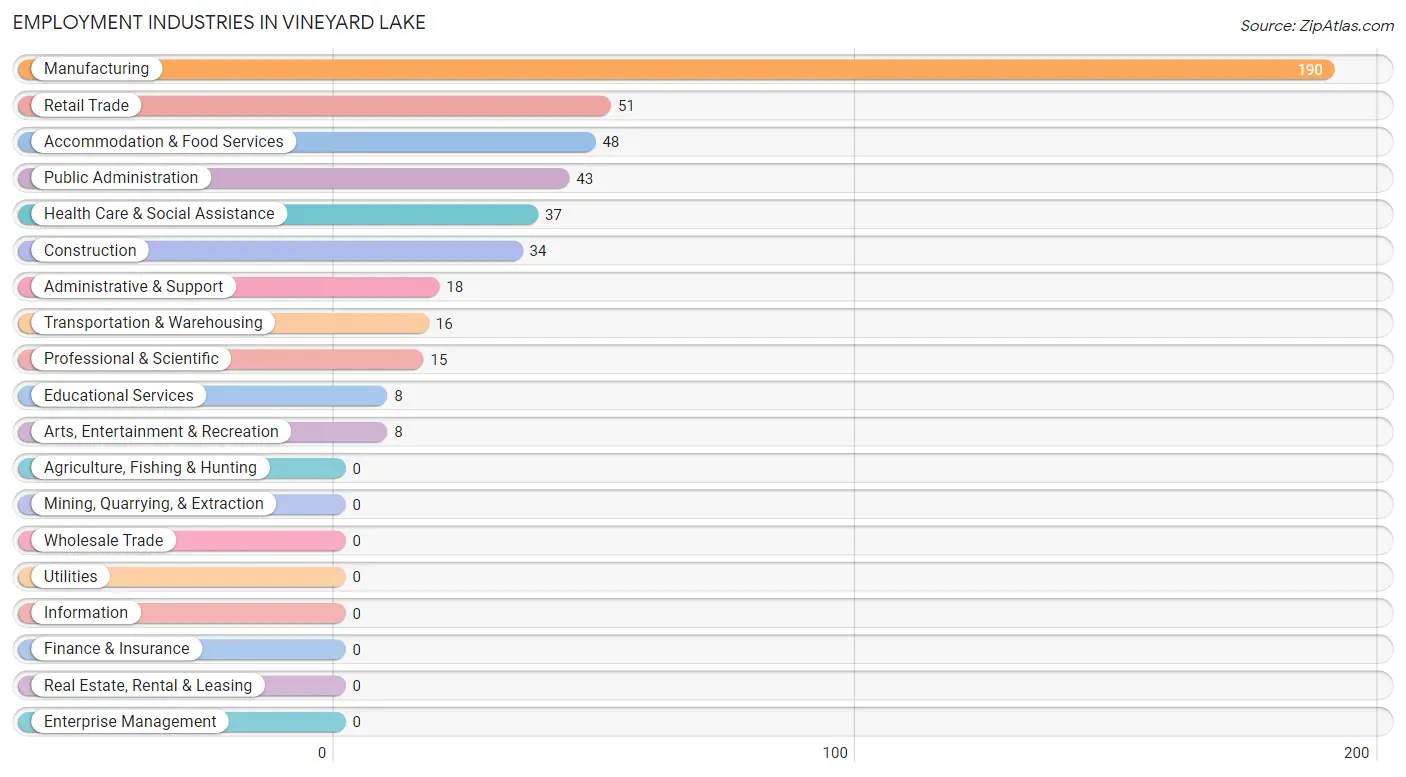
Employment Industries in Vineyard Lake
The major employment industries in Vineyard Lake include Manufacturing (190 | 31.6%), Retail Trade (51 | 8.5%), Accommodation & Food Services (48 | 8.0%), Public Administration (43 | 7.1%), and Health Care & Social Assistance (37 | 6.1%).
Employment Industries by Sex in Vineyard Lake
The Vineyard Lake industries that see more men than women are Construction (100.0%), Transportation & Warehousing (100.0%), and Professional & Scientific (100.0%), whereas the industries that tend to have a higher number of women are Educational Services (100.0%), Arts, Entertainment & Recreation (100.0%), and Public Administration (95.4%).
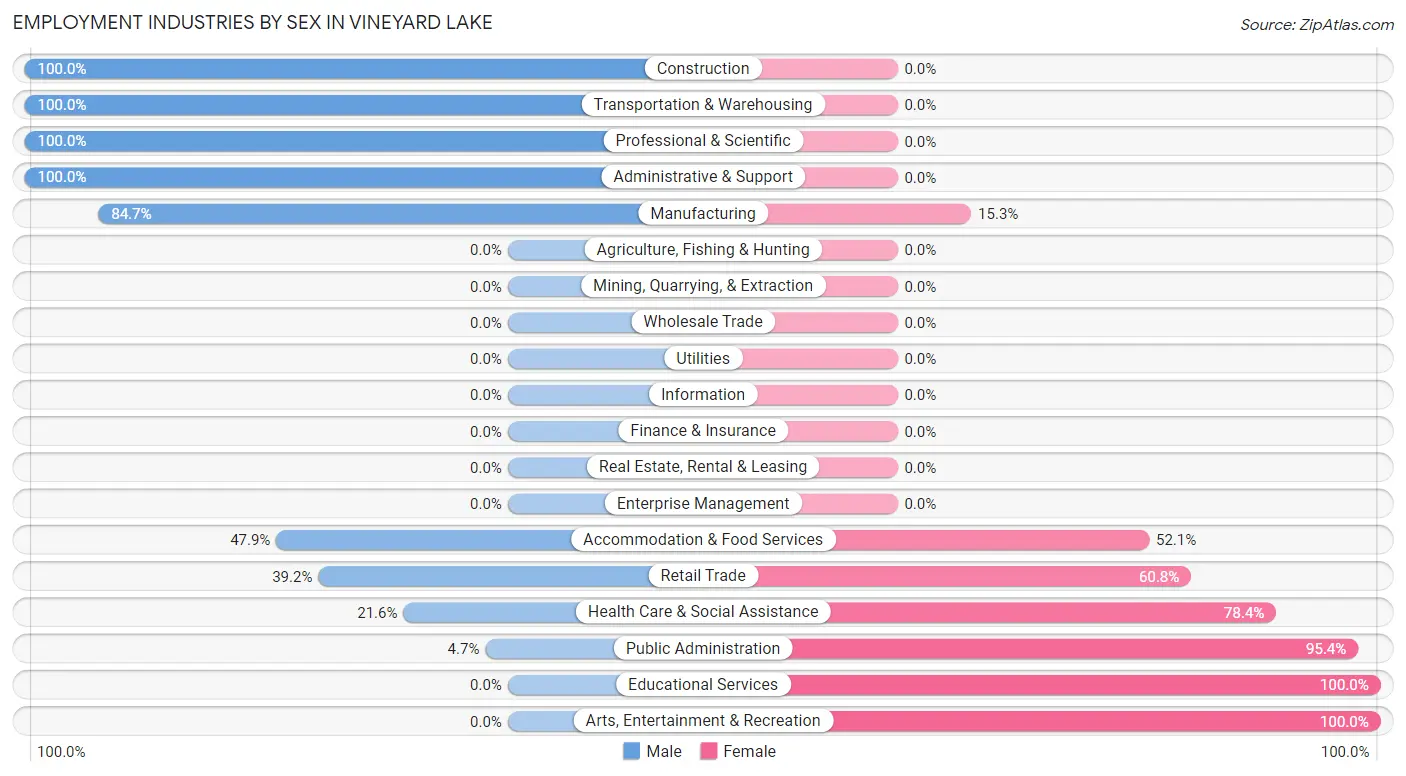
| Industry | Male | Female |
| Agriculture, Fishing & Hunting | 0 (0.0%) | 0 (0.0%) |
| Mining, Quarrying, & Extraction | 0 (0.0%) | 0 (0.0%) |
| Construction | 34 (100.0%) | 0 (0.0%) |
| Manufacturing | 161 (84.7%) | 29 (15.3%) |
| Wholesale Trade | 0 (0.0%) | 0 (0.0%) |
| Retail Trade | 20 (39.2%) | 31 (60.8%) |
| Transportation & Warehousing | 16 (100.0%) | 0 (0.0%) |
| Utilities | 0 (0.0%) | 0 (0.0%) |
| Information | 0 (0.0%) | 0 (0.0%) |
| Finance & Insurance | 0 (0.0%) | 0 (0.0%) |
| Real Estate, Rental & Leasing | 0 (0.0%) | 0 (0.0%) |
| Professional & Scientific | 15 (100.0%) | 0 (0.0%) |
| Enterprise Management | 0 (0.0%) | 0 (0.0%) |
| Administrative & Support | 18 (100.0%) | 0 (0.0%) |
| Educational Services | 0 (0.0%) | 8 (100.0%) |
| Health Care & Social Assistance | 8 (21.6%) | 29 (78.4%) |
| Arts, Entertainment & Recreation | 0 (0.0%) | 8 (100.0%) |
| Accommodation & Food Services | 23 (47.9%) | 25 (52.1%) |
| Public Administration | 2 (4.6%) | 41 (95.4%) |
| Total | 297 (49.3%) | 305 (50.7%) |
Education in Vineyard Lake
School Enrollment in Vineyard Lake
The most common levels of schooling among the 46 students in Vineyard Lake are middle school (36 | 78.3%), and high school (10 | 21.7%).
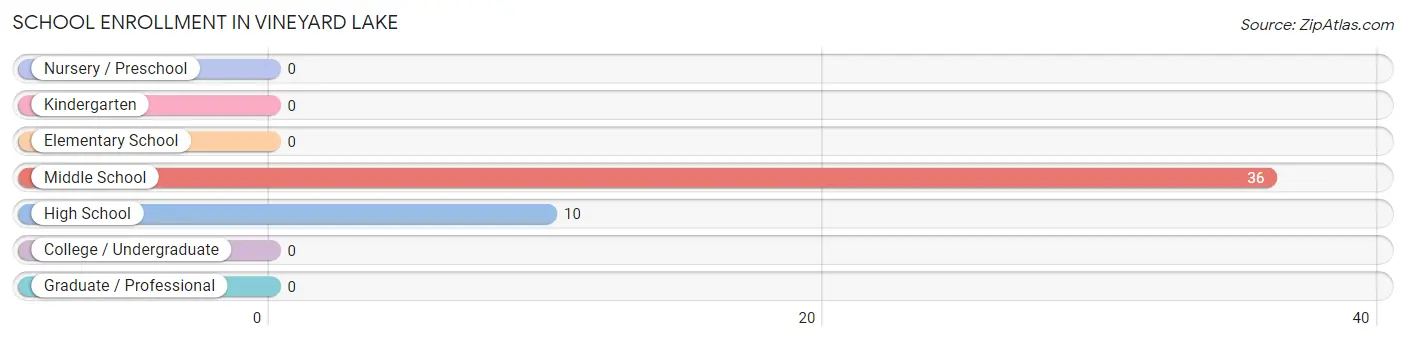
| School Level | # Students | % Students |
| Nursery / Preschool | 0 | 0.0% |
| Kindergarten | 0 | 0.0% |
| Elementary School | 0 | 0.0% |
| Middle School | 36 | 78.3% |
| High School | 10 | 21.7% |
| College / Undergraduate | 0 | 0.0% |
| Graduate / Professional | 0 | 0.0% |
| Total | 46 | 100.0% |
School Enrollment by Age by Funding Source in Vineyard Lake
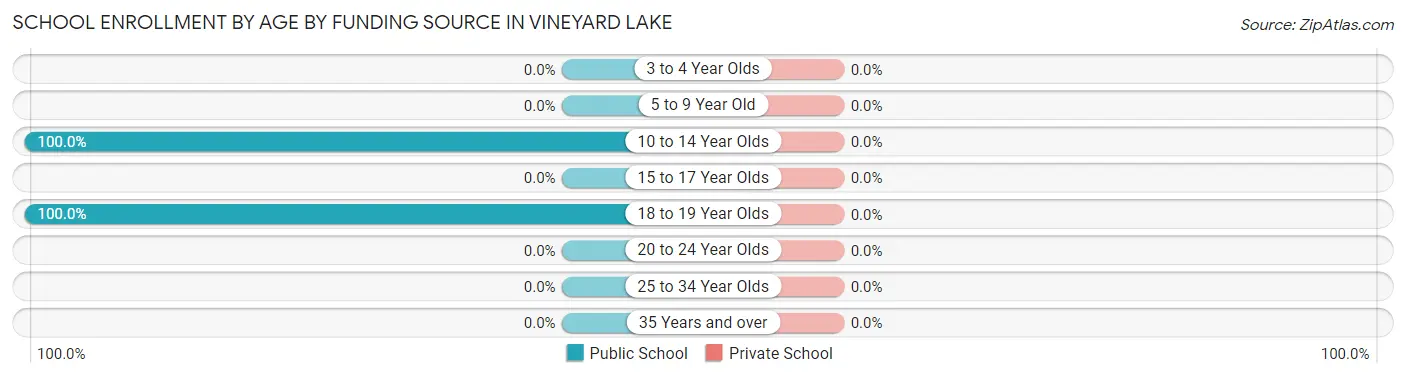
| Age Bracket | Public School | Private School |
| 3 to 4 Year Olds | 0 (0.0%) | 0 (0.0%) |
| 5 to 9 Year Old | 0 (0.0%) | 0 (0.0%) |
| 10 to 14 Year Olds | 36 (100.0%) | 0 (0.0%) |
| 15 to 17 Year Olds | 0 (0.0%) | 0 (0.0%) |
| 18 to 19 Year Olds | 10 (100.0%) | 0 (0.0%) |
| 20 to 24 Year Olds | 0 (0.0%) | 0 (0.0%) |
| 25 to 34 Year Olds | 0 (0.0%) | 0 (0.0%) |
| 35 Years and over | 0 (0.0%) | 0 (0.0%) |
| Total | 46 (100.0%) | 0 (0.0%) |
Educational Attainment by Field of Study in Vineyard Lake
Business (272 | 76.4%), science & technology (29 | 8.2%), education (16 | 4.5%), engineering (12 | 3.4%), and arts & humanities (10 | 2.8%) are the most common fields of study among 356 individuals in Vineyard Lake who have obtained a bachelor's degree or higher.
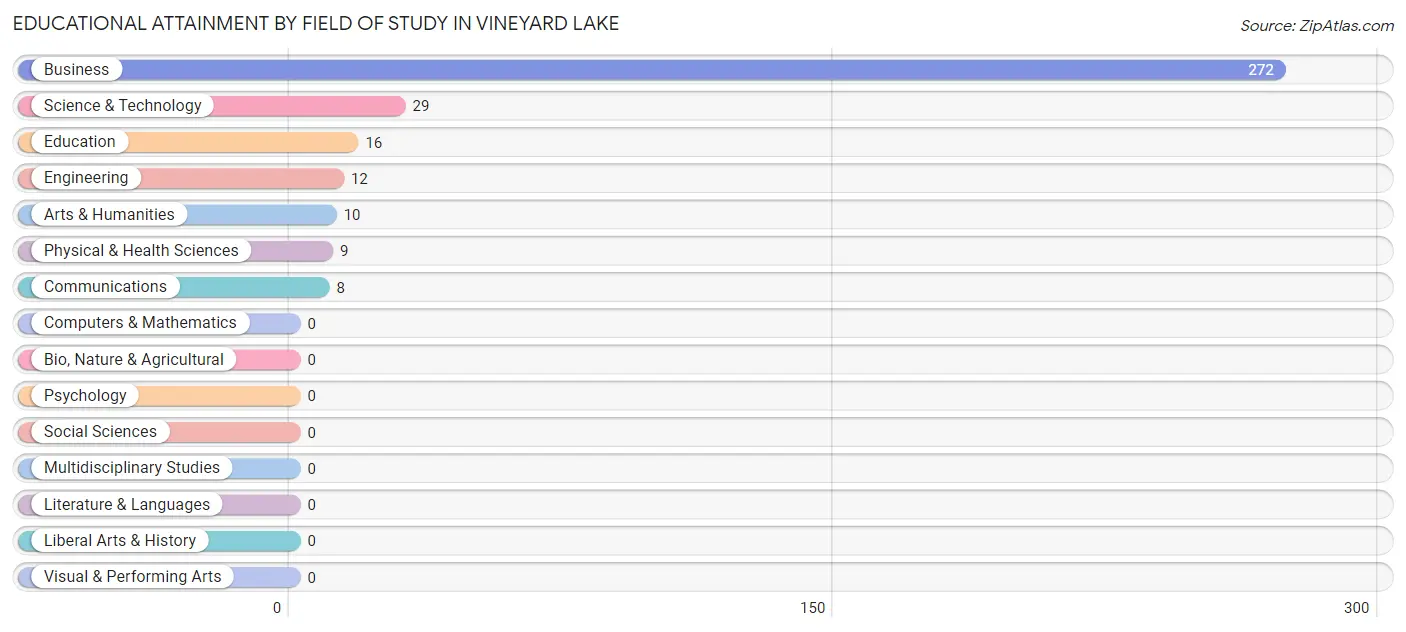
| Field of Study | # Graduates | % Graduates |
| Computers & Mathematics | 0 | 0.0% |
| Bio, Nature & Agricultural | 0 | 0.0% |
| Physical & Health Sciences | 9 | 2.5% |
| Psychology | 0 | 0.0% |
| Social Sciences | 0 | 0.0% |
| Engineering | 12 | 3.4% |
| Multidisciplinary Studies | 0 | 0.0% |
| Science & Technology | 29 | 8.2% |
| Business | 272 | 76.4% |
| Education | 16 | 4.5% |
| Literature & Languages | 0 | 0.0% |
| Liberal Arts & History | 0 | 0.0% |
| Visual & Performing Arts | 0 | 0.0% |
| Communications | 8 | 2.2% |
| Arts & Humanities | 10 | 2.8% |
| Total | 356 | 100.0% |
Transportation & Commute in Vineyard Lake
Vehicle Availability by Sex in Vineyard Lake
The most prevalent vehicle ownership categories in Vineyard Lake are males with 3 vehicles (160, accounting for 51.8%) and females with 3 vehicles (166, making up 53.9%).
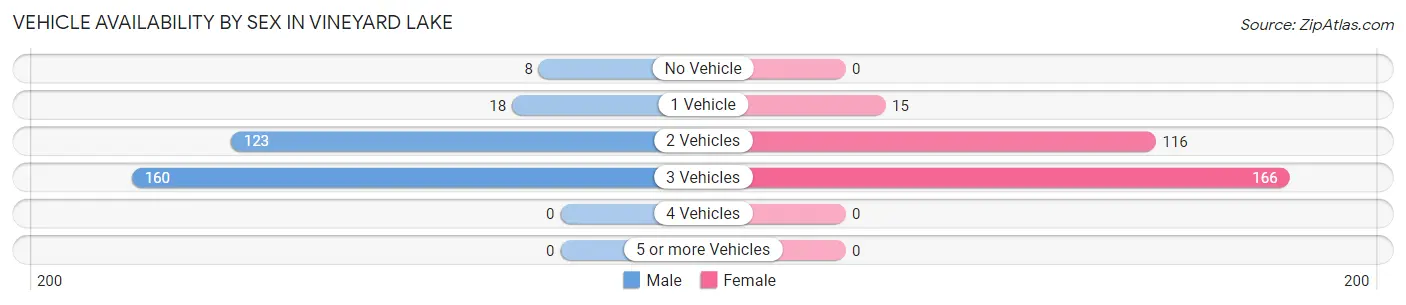
| Vehicles Available | Male | Female |
| No Vehicle | 8 (2.6%) | 0 (0.0%) |
| 1 Vehicle | 18 (5.8%) | 15 (5.1%) |
| 2 Vehicles | 123 (39.8%) | 116 (39.1%) |
| 3 Vehicles | 160 (51.8%) | 166 (55.9%) |
| 4 Vehicles | 0 (0.0%) | 0 (0.0%) |
| 5 or more Vehicles | 0 (0.0%) | 0 (0.0%) |
| Total | 309 (100.0%) | 297 (100.0%) |
Commute Time in Vineyard Lake
The most frequently occuring commute durations in Vineyard Lake are 90 or more minutes (131 commuters, 28.8%), 5 to 9 minutes (69 commuters, 15.2%), and 25 to 29 minutes (68 commuters, 14.9%).
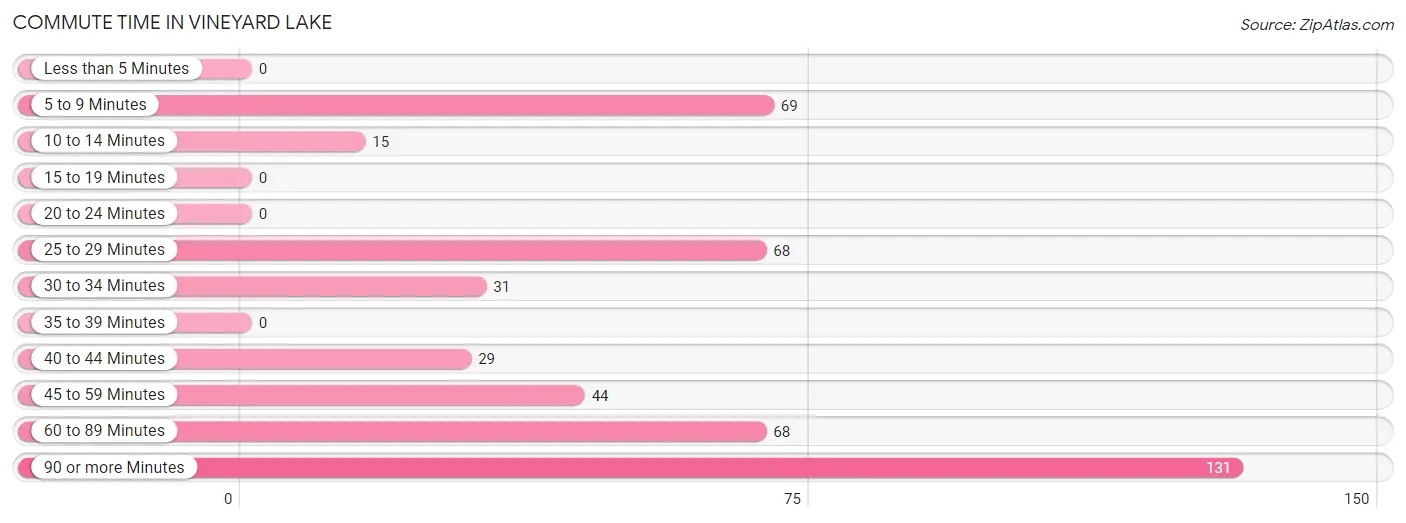
| Commute Time | # Commuters | % Commuters |
| Less than 5 Minutes | 0 | 0.0% |
| 5 to 9 Minutes | 69 | 15.2% |
| 10 to 14 Minutes | 15 | 3.3% |
| 15 to 19 Minutes | 0 | 0.0% |
| 20 to 24 Minutes | 0 | 0.0% |
| 25 to 29 Minutes | 68 | 14.9% |
| 30 to 34 Minutes | 31 | 6.8% |
| 35 to 39 Minutes | 0 | 0.0% |
| 40 to 44 Minutes | 29 | 6.4% |
| 45 to 59 Minutes | 44 | 9.7% |
| 60 to 89 Minutes | 68 | 14.9% |
| 90 or more Minutes | 131 | 28.8% |
Commute Time by Sex in Vineyard Lake
The most common commute times in Vineyard Lake are 90 or more minutes (131 commuters, 43.4%) for males and 5 to 9 minutes (56 commuters, 36.6%) for females.
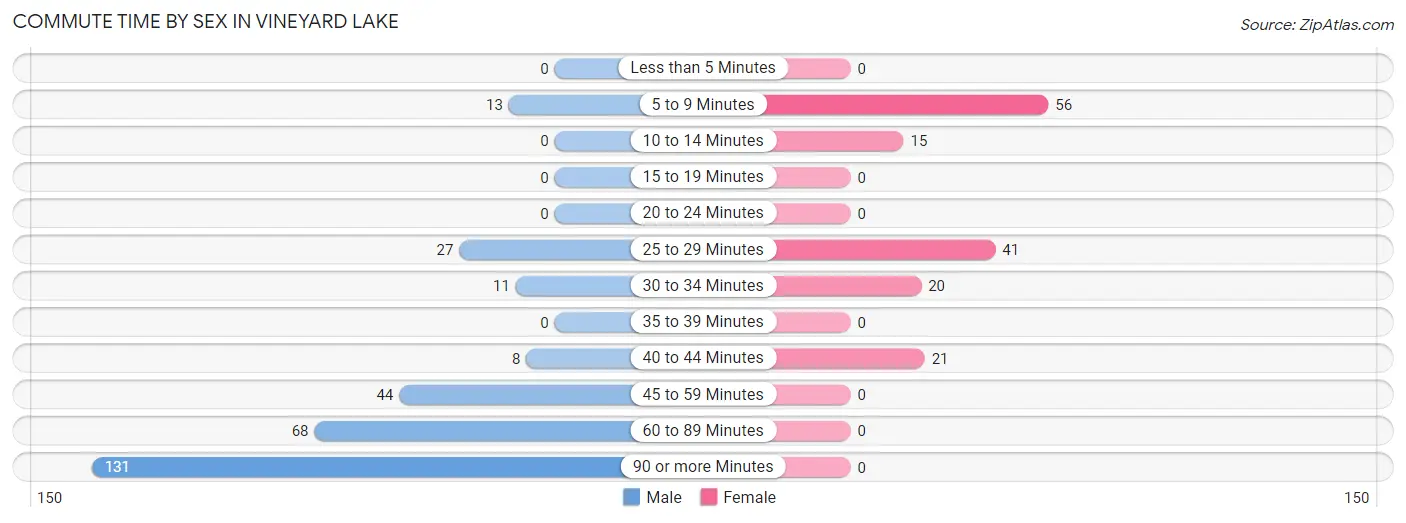
| Commute Time | Male | Female |
| Less than 5 Minutes | 0 (0.0%) | 0 (0.0%) |
| 5 to 9 Minutes | 13 (4.3%) | 56 (36.6%) |
| 10 to 14 Minutes | 0 (0.0%) | 15 (9.8%) |
| 15 to 19 Minutes | 0 (0.0%) | 0 (0.0%) |
| 20 to 24 Minutes | 0 (0.0%) | 0 (0.0%) |
| 25 to 29 Minutes | 27 (8.9%) | 41 (26.8%) |
| 30 to 34 Minutes | 11 (3.6%) | 20 (13.1%) |
| 35 to 39 Minutes | 0 (0.0%) | 0 (0.0%) |
| 40 to 44 Minutes | 8 (2.6%) | 21 (13.7%) |
| 45 to 59 Minutes | 44 (14.6%) | 0 (0.0%) |
| 60 to 89 Minutes | 68 (22.5%) | 0 (0.0%) |
| 90 or more Minutes | 131 (43.4%) | 0 (0.0%) |
Time of Departure to Work by Sex in Vineyard Lake
The most frequent times of departure to work in Vineyard Lake are 6:00 AM to 6:29 AM (125, 41.4%) for males and 6:30 AM to 6:59 AM (41, 26.8%) for females.
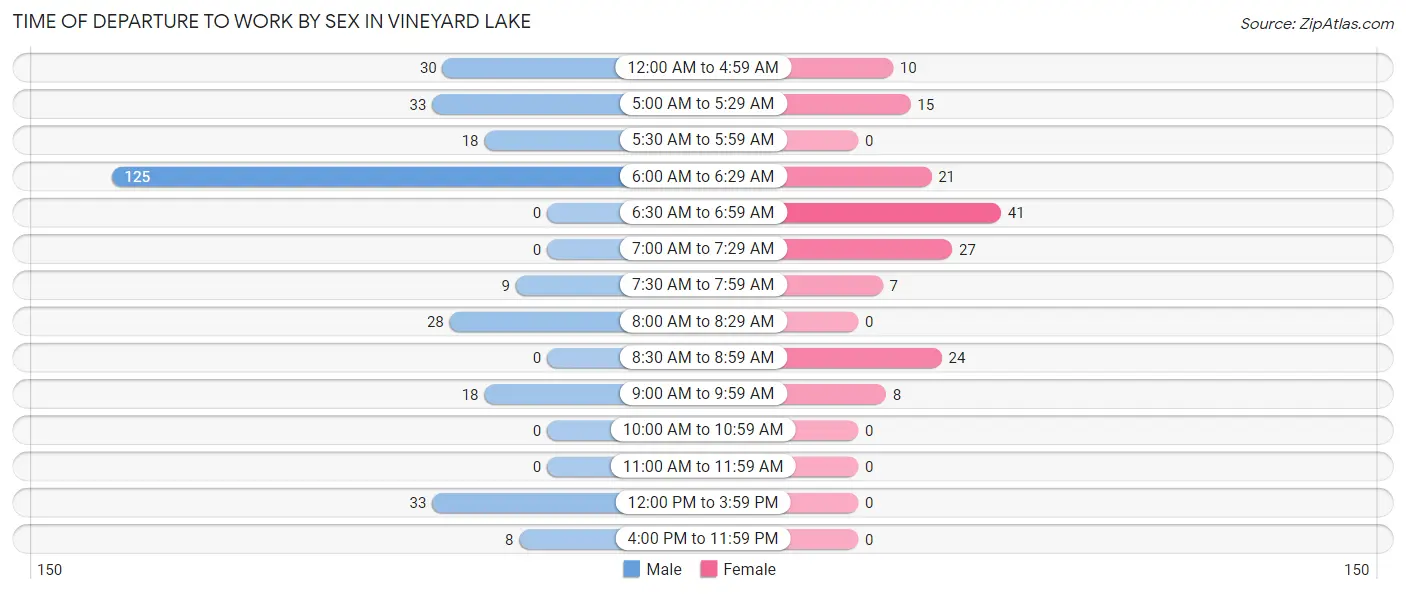
| Time of Departure | Male | Female |
| 12:00 AM to 4:59 AM | 30 (9.9%) | 10 (6.5%) |
| 5:00 AM to 5:29 AM | 33 (10.9%) | 15 (9.8%) |
| 5:30 AM to 5:59 AM | 18 (6.0%) | 0 (0.0%) |
| 6:00 AM to 6:29 AM | 125 (41.4%) | 21 (13.7%) |
| 6:30 AM to 6:59 AM | 0 (0.0%) | 41 (26.8%) |
| 7:00 AM to 7:29 AM | 0 (0.0%) | 27 (17.6%) |
| 7:30 AM to 7:59 AM | 9 (3.0%) | 7 (4.6%) |
| 8:00 AM to 8:29 AM | 28 (9.3%) | 0 (0.0%) |
| 8:30 AM to 8:59 AM | 0 (0.0%) | 24 (15.7%) |
| 9:00 AM to 9:59 AM | 18 (6.0%) | 8 (5.2%) |
| 10:00 AM to 10:59 AM | 0 (0.0%) | 0 (0.0%) |
| 11:00 AM to 11:59 AM | 0 (0.0%) | 0 (0.0%) |
| 12:00 PM to 3:59 PM | 33 (10.9%) | 0 (0.0%) |
| 4:00 PM to 11:59 PM | 8 (2.6%) | 0 (0.0%) |
| Total | 302 (100.0%) | 153 (100.0%) |
Housing Occupancy in Vineyard Lake
Occupancy by Ownership in Vineyard Lake
Of the total 431 dwellings in Vineyard Lake, owner-occupied units account for 417 (96.8%), while renter-occupied units make up 14 (3.3%).
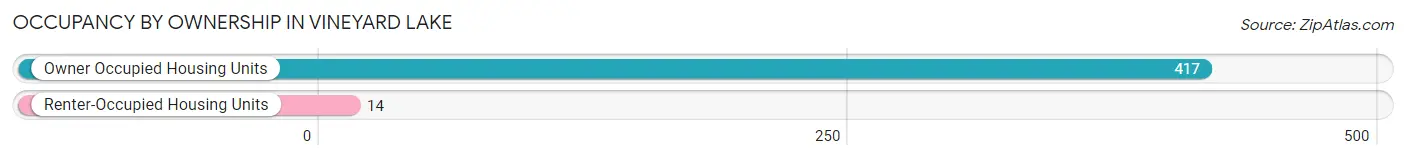
| Occupancy | # Housing Units | % Housing Units |
| Owner Occupied Housing Units | 417 | 96.8% |
| Renter-Occupied Housing Units | 14 | 3.3% |
| Total Occupied Housing Units | 431 | 100.0% |
Occupancy by Household Size in Vineyard Lake
| Household Size | # Housing Units | % Housing Units |
| 1-Person Household | 83 | 19.3% |
| 2-Person Household | 300 | 69.6% |
| 3-Person Household | 40 | 9.3% |
| 4+ Person Household | 8 | 1.9% |
| Total Housing Units | 431 | 100.0% |
Occupancy by Ownership by Household Size in Vineyard Lake
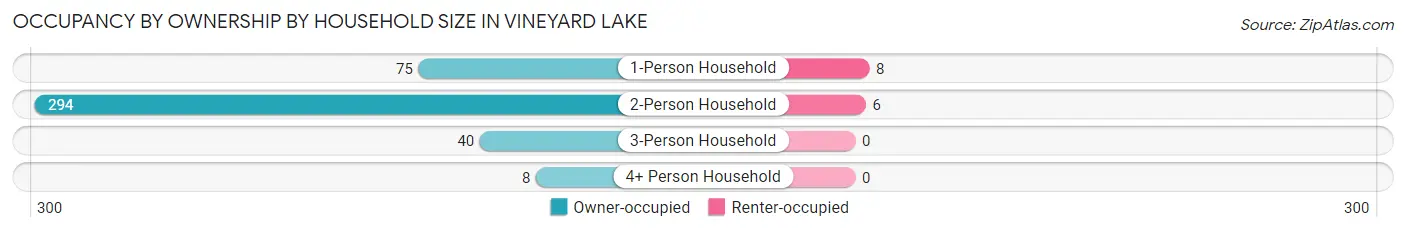
| Household Size | Owner-occupied | Renter-occupied |
| 1-Person Household | 75 (90.4%) | 8 (9.6%) |
| 2-Person Household | 294 (98.0%) | 6 (2.0%) |
| 3-Person Household | 40 (100.0%) | 0 (0.0%) |
| 4+ Person Household | 8 (100.0%) | 0 (0.0%) |
| Total Housing Units | 417 (96.8%) | 14 (3.3%) |
Occupancy by Educational Attainment in Vineyard Lake
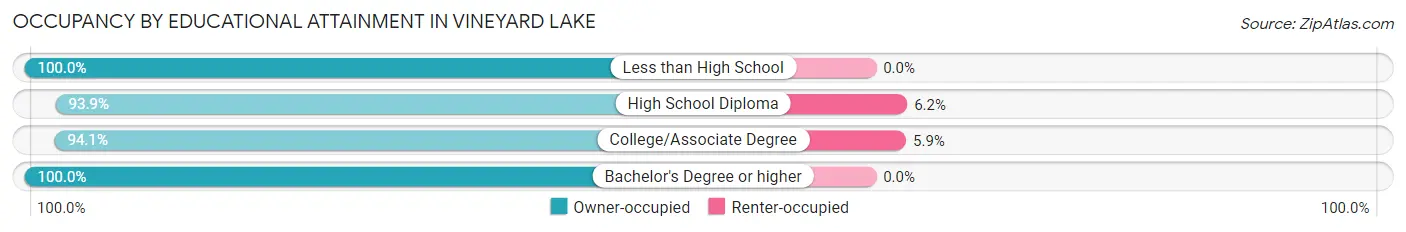
| Household Size | Owner-occupied | Renter-occupied |
| Less than High School | 35 (100.0%) | 0 (0.0%) |
| High School Diploma | 122 (93.9%) | 8 (6.1%) |
| College/Associate Degree | 95 (94.1%) | 6 (5.9%) |
| Bachelor's Degree or higher | 165 (100.0%) | 0 (0.0%) |
Occupancy by Age of Householder in Vineyard Lake
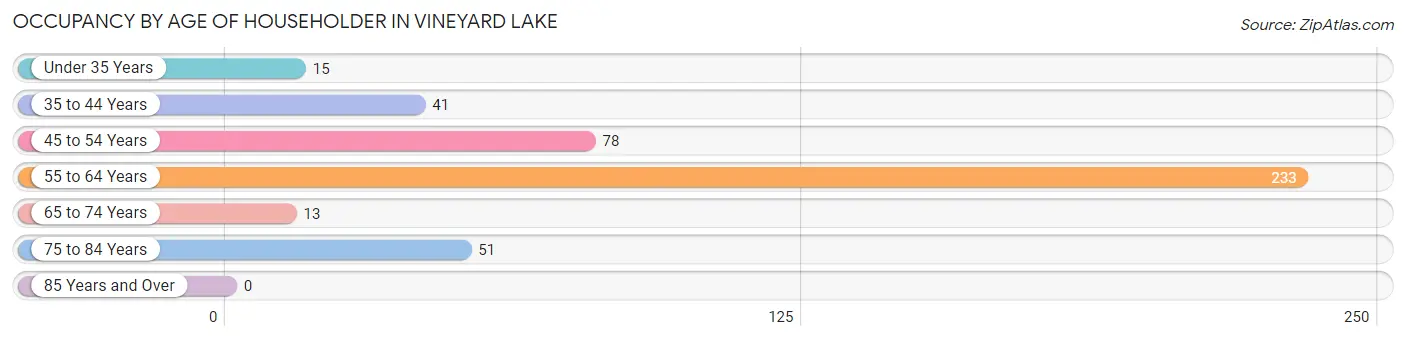
| Age Bracket | # Households | % Households |
| Under 35 Years | 15 | 3.5% |
| 35 to 44 Years | 41 | 9.5% |
| 45 to 54 Years | 78 | 18.1% |
| 55 to 64 Years | 233 | 54.1% |
| 65 to 74 Years | 13 | 3.0% |
| 75 to 84 Years | 51 | 11.8% |
| 85 Years and Over | 0 | 0.0% |
| Total | 431 | 100.0% |
Housing Finances in Vineyard Lake
Median Income by Occupancy in Vineyard Lake
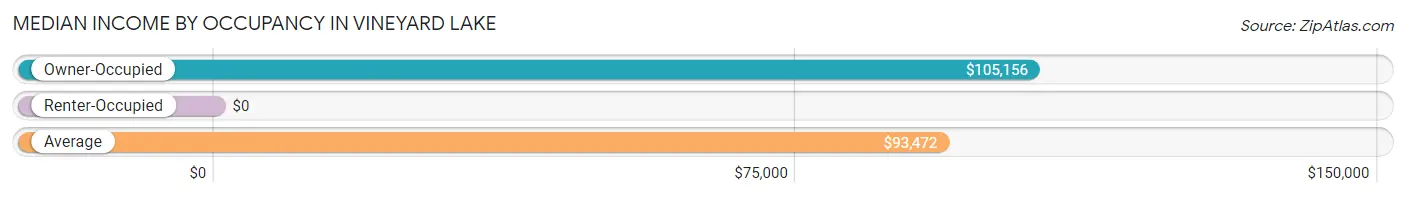
| Occupancy Type | # Households | Median Income |
| Owner-Occupied | 417 (96.8%) | $105,156 |
| Renter-Occupied | 14 (3.3%) | $0 |
| Average | 431 (100.0%) | $93,472 |
Occupancy by Householder Income Bracket in Vineyard Lake
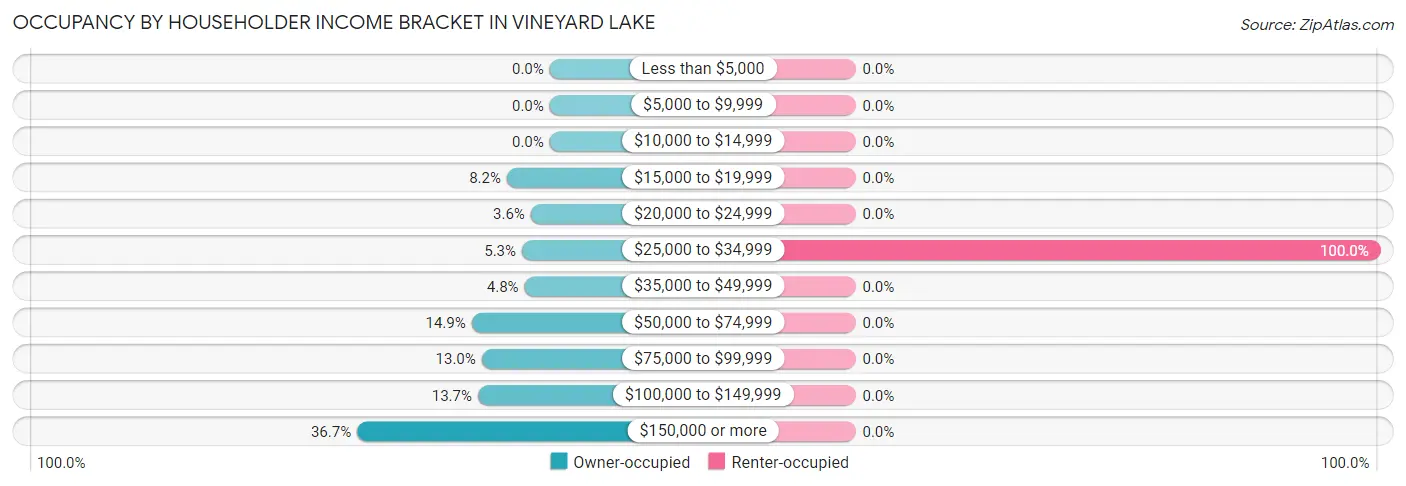
| Income Bracket | Owner-occupied | Renter-occupied |
| Less than $5,000 | 0 (0.0%) | 0 (0.0%) |
| $5,000 to $9,999 | 0 (0.0%) | 0 (0.0%) |
| $10,000 to $14,999 | 0 (0.0%) | 0 (0.0%) |
| $15,000 to $19,999 | 34 (8.2%) | 0 (0.0%) |
| $20,000 to $24,999 | 15 (3.6%) | 0 (0.0%) |
| $25,000 to $34,999 | 22 (5.3%) | 14 (100.0%) |
| $35,000 to $49,999 | 20 (4.8%) | 0 (0.0%) |
| $50,000 to $74,999 | 62 (14.9%) | 0 (0.0%) |
| $75,000 to $99,999 | 54 (13.0%) | 0 (0.0%) |
| $100,000 to $149,999 | 57 (13.7%) | 0 (0.0%) |
| $150,000 or more | 153 (36.7%) | 0 (0.0%) |
| Total | 417 (100.0%) | 14 (100.0%) |
Monthly Housing Cost Tiers in Vineyard Lake
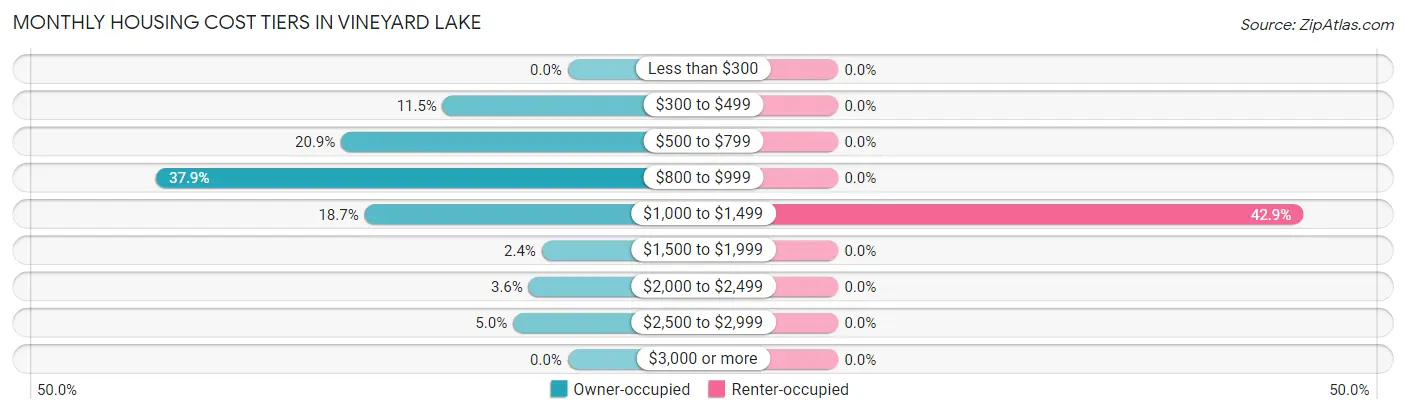
| Monthly Cost | Owner-occupied | Renter-occupied |
| Less than $300 | 0 (0.0%) | 0 (0.0%) |
| $300 to $499 | 48 (11.5%) | 0 (0.0%) |
| $500 to $799 | 87 (20.9%) | 0 (0.0%) |
| $800 to $999 | 158 (37.9%) | 0 (0.0%) |
| $1,000 to $1,499 | 78 (18.7%) | 6 (42.9%) |
| $1,500 to $1,999 | 10 (2.4%) | 0 (0.0%) |
| $2,000 to $2,499 | 15 (3.6%) | 0 (0.0%) |
| $2,500 to $2,999 | 21 (5.0%) | 0 (0.0%) |
| $3,000 or more | 0 (0.0%) | 0 (0.0%) |
| Total | 417 (100.0%) | 14 (100.0%) |
Physical Housing Characteristics in Vineyard Lake
Housing Structures in Vineyard Lake
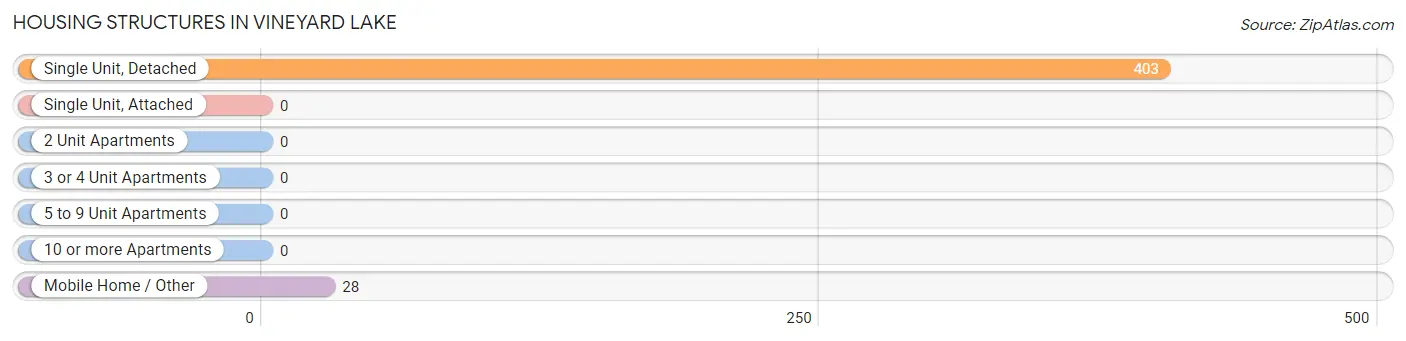
| Structure Type | # Housing Units | % Housing Units |
| Single Unit, Detached | 403 | 93.5% |
| Single Unit, Attached | 0 | 0.0% |
| 2 Unit Apartments | 0 | 0.0% |
| 3 or 4 Unit Apartments | 0 | 0.0% |
| 5 to 9 Unit Apartments | 0 | 0.0% |
| 10 or more Apartments | 0 | 0.0% |
| Mobile Home / Other | 28 | 6.5% |
| Total | 431 | 100.0% |
Housing Structures by Occupancy in Vineyard Lake
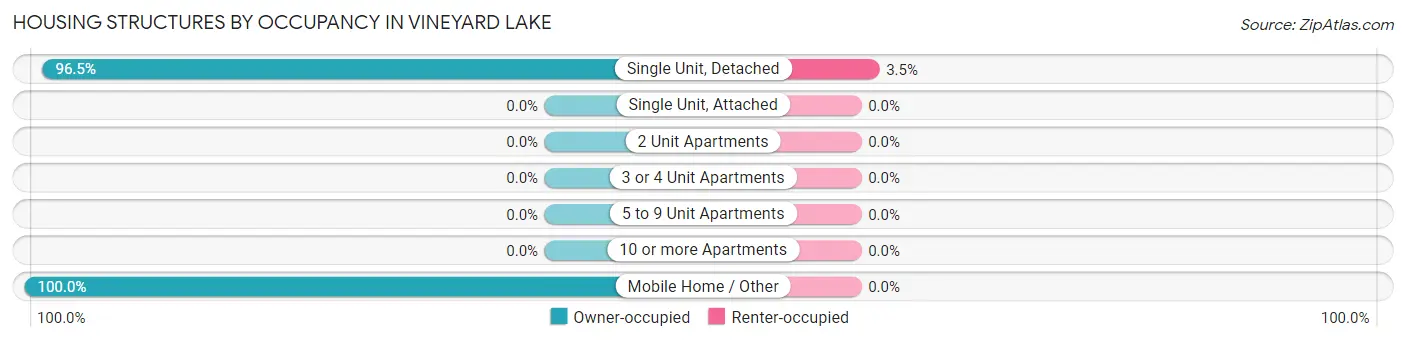
| Structure Type | Owner-occupied | Renter-occupied |
| Single Unit, Detached | 389 (96.5%) | 14 (3.5%) |
| Single Unit, Attached | 0 (0.0%) | 0 (0.0%) |
| 2 Unit Apartments | 0 (0.0%) | 0 (0.0%) |
| 3 or 4 Unit Apartments | 0 (0.0%) | 0 (0.0%) |
| 5 to 9 Unit Apartments | 0 (0.0%) | 0 (0.0%) |
| 10 or more Apartments | 0 (0.0%) | 0 (0.0%) |
| Mobile Home / Other | 28 (100.0%) | 0 (0.0%) |
| Total | 417 (96.8%) | 14 (3.3%) |
Housing Structures by Number of Rooms in Vineyard Lake
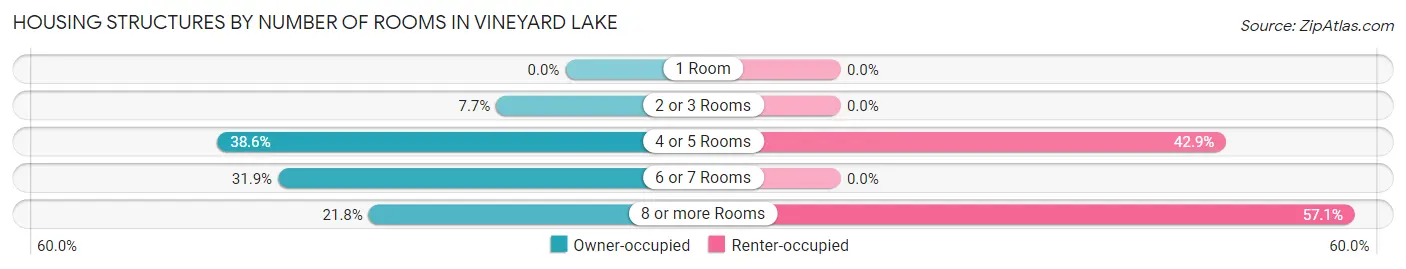
| Number of Rooms | Owner-occupied | Renter-occupied |
| 1 Room | 0 (0.0%) | 0 (0.0%) |
| 2 or 3 Rooms | 32 (7.7%) | 0 (0.0%) |
| 4 or 5 Rooms | 161 (38.6%) | 6 (42.9%) |
| 6 or 7 Rooms | 133 (31.9%) | 0 (0.0%) |
| 8 or more Rooms | 91 (21.8%) | 8 (57.1%) |
| Total | 417 (100.0%) | 14 (100.0%) |
Housing Structure by Heating Type in Vineyard Lake
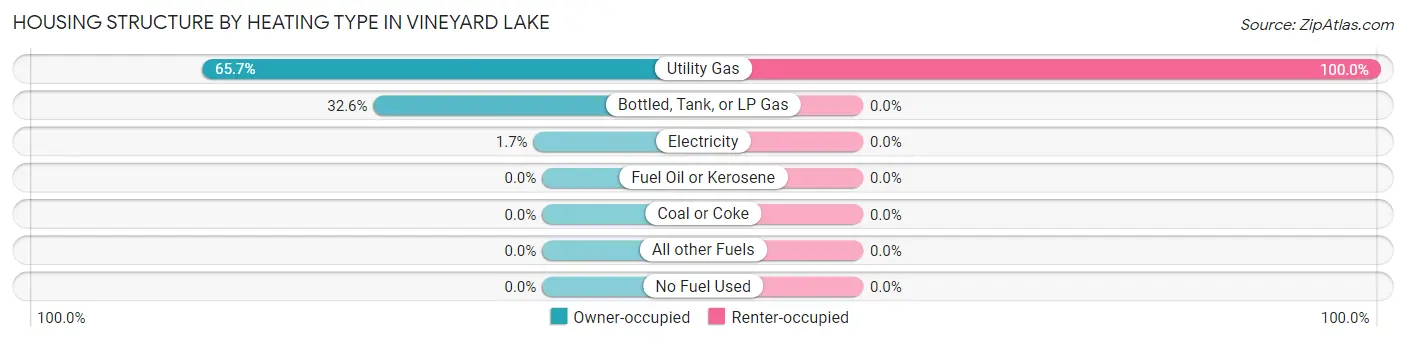
| Heating Type | Owner-occupied | Renter-occupied |
| Utility Gas | 274 (65.7%) | 14 (100.0%) |
| Bottled, Tank, or LP Gas | 136 (32.6%) | 0 (0.0%) |
| Electricity | 7 (1.7%) | 0 (0.0%) |
| Fuel Oil or Kerosene | 0 (0.0%) | 0 (0.0%) |
| Coal or Coke | 0 (0.0%) | 0 (0.0%) |
| All other Fuels | 0 (0.0%) | 0 (0.0%) |
| No Fuel Used | 0 (0.0%) | 0 (0.0%) |
| Total | 417 (100.0%) | 14 (100.0%) |
Household Vehicle Usage in Vineyard Lake
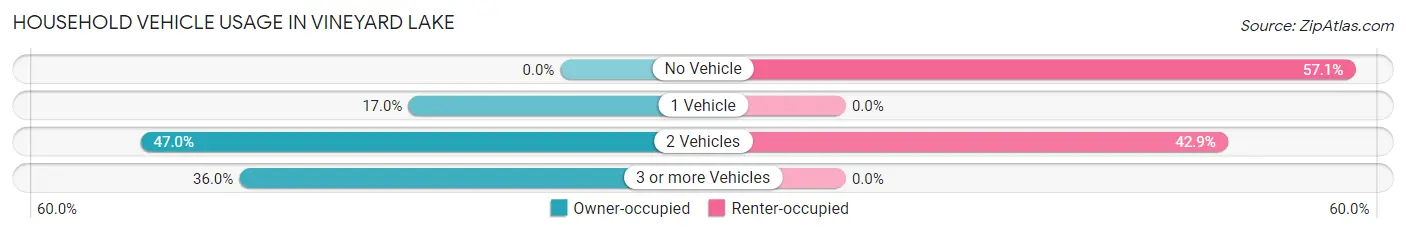
| Vehicles per Household | Owner-occupied | Renter-occupied |
| No Vehicle | 0 (0.0%) | 8 (57.1%) |
| 1 Vehicle | 71 (17.0%) | 0 (0.0%) |
| 2 Vehicles | 196 (47.0%) | 6 (42.9%) |
| 3 or more Vehicles | 150 (36.0%) | 0 (0.0%) |
| Total | 417 (100.0%) | 14 (100.0%) |
Real Estate & Mortgages in Vineyard Lake
Real Estate and Mortgage Overview in Vineyard Lake
| Characteristic | Without Mortgage | With Mortgage |
| Housing Units | 259 | 158 |
| Median Property Value | - | - |
| Median Household Income | - | - |
| Monthly Housing Costs | $896 | $0 |
| Real Estate Taxes | $4,537 | $0 |
Property Value by Mortgage Status in Vineyard Lake
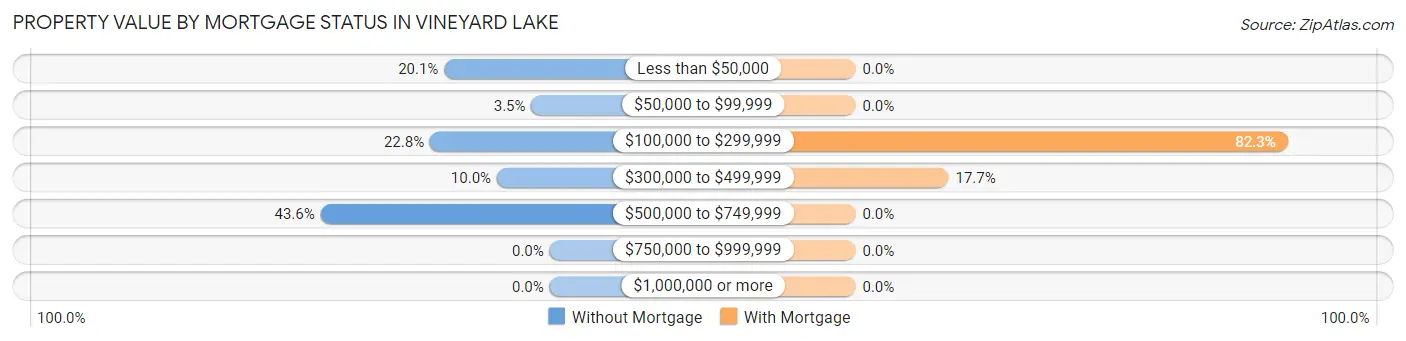
| Property Value | Without Mortgage | With Mortgage |
| Less than $50,000 | 52 (20.1%) | 0 (0.0%) |
| $50,000 to $99,999 | 9 (3.5%) | 0 (0.0%) |
| $100,000 to $299,999 | 59 (22.8%) | 130 (82.3%) |
| $300,000 to $499,999 | 26 (10.0%) | 28 (17.7%) |
| $500,000 to $749,999 | 113 (43.6%) | 0 (0.0%) |
| $750,000 to $999,999 | 0 (0.0%) | 0 (0.0%) |
| $1,000,000 or more | 0 (0.0%) | 0 (0.0%) |
| Total | 259 (100.0%) | 158 (100.0%) |
Household Income by Mortgage Status in Vineyard Lake
| Household Income | Without Mortgage | With Mortgage |
| Less than $10,000 | 0 (0.0%) | 0 (0.0%) |
| $10,000 to $24,999 | 23 (8.9%) | 0 (0.0%) |
| $25,000 to $34,999 | 13 (5.0%) | 26 (16.5%) |
| $35,000 to $49,999 | 20 (7.7%) | 9 (5.7%) |
| $50,000 to $74,999 | 45 (17.4%) | 0 (0.0%) |
| $75,000 to $99,999 | 18 (7.0%) | 17 (10.8%) |
| $100,000 to $149,999 | 15 (5.8%) | 36 (22.8%) |
| $150,000 or more | 125 (48.3%) | 42 (26.6%) |
| Total | 259 (100.0%) | 158 (100.0%) |
Property Value to Household Income Ratio in Vineyard Lake
| Value-to-Income Ratio | Without Mortgage | With Mortgage |
| Less than 2.0x | 196 (75.7%) | 80,625 (51,028.5%) |
| 2.0x to 2.9x | 19 (7.3%) | 34 (21.5%) |
| 3.0x to 3.9x | 7 (2.7%) | 48 (30.4%) |
| 4.0x or more | 37 (14.3%) | 33 (20.9%) |
| Total | 259 (100.0%) | 158 (100.0%) |
Real Estate Taxes by Mortgage Status in Vineyard Lake
| Property Taxes | Without Mortgage | With Mortgage |
| Less than $800 | 20 (7.7%) | 0 (0.0%) |
| $800 to $1,499 | 9 (3.5%) | 0 (0.0%) |
| $800 to $1,499 | 222 (85.7%) | 17 (10.8%) |
| Total | 259 (100.0%) | 158 (100.0%) |
Health & Disability in Vineyard Lake
Health Insurance Coverage by Age in Vineyard Lake
| Age Bracket | With Coverage | Without Coverage |
| Under 6 Years | 0 (0.0%) | 0 (0.0%) |
| 6 to 18 Years | 46 (100.0%) | 0 (0.0%) |
| 19 to 25 Years | 64 (76.2%) | 20 (23.8%) |
| 26 to 34 Years | 54 (100.0%) | 0 (0.0%) |
| 35 to 44 Years | 41 (100.0%) | 0 (0.0%) |
| 45 to 54 Years | 248 (94.7%) | 14 (5.3%) |
| 55 to 64 Years | 296 (100.0%) | 0 (0.0%) |
| 65 to 74 Years | 54 (100.0%) | 0 (0.0%) |
| 75 Years and older | 69 (100.0%) | 0 (0.0%) |
| Total | 872 (96.3%) | 34 (3.7%) |
Health Insurance Coverage by Citizenship Status in Vineyard Lake
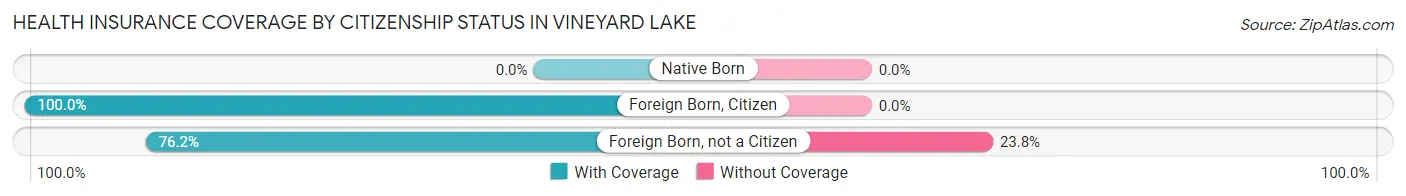
| Citizenship Status | With Coverage | Without Coverage |
| Native Born | 0 (0.0%) | 0 (0.0%) |
| Foreign Born, Citizen | 46 (100.0%) | 0 (0.0%) |
| Foreign Born, not a Citizen | 64 (76.2%) | 20 (23.8%) |
Health Insurance Coverage by Household Income in Vineyard Lake
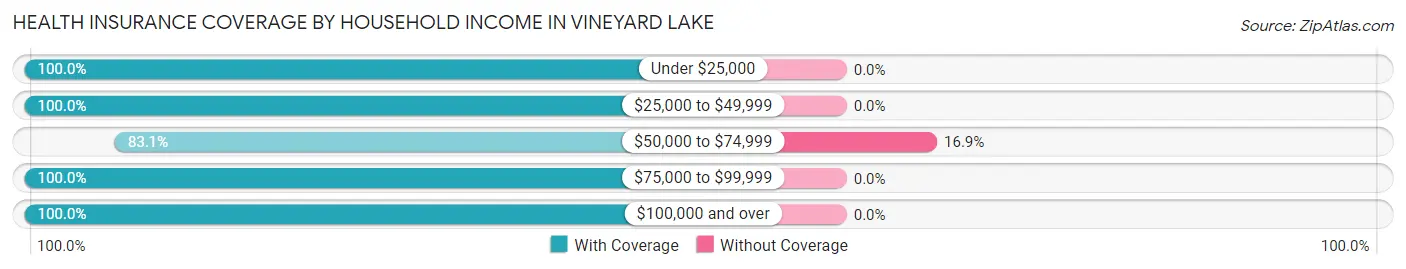
| Household Income | With Coverage | Without Coverage |
| Under $25,000 | 49 (100.0%) | 0 (0.0%) |
| $25,000 to $49,999 | 76 (100.0%) | 0 (0.0%) |
| $50,000 to $74,999 | 167 (83.1%) | 34 (16.9%) |
| $75,000 to $99,999 | 99 (100.0%) | 0 (0.0%) |
| $100,000 and over | 476 (100.0%) | 0 (0.0%) |
Public vs Private Health Insurance Coverage by Age in Vineyard Lake
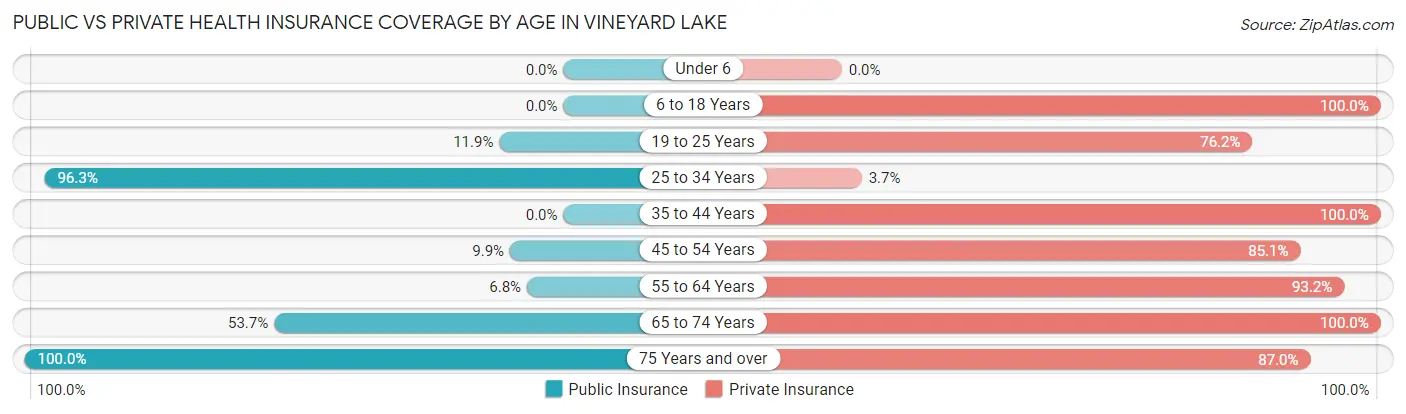
| Age Bracket | Public Insurance | Private Insurance |
| Under 6 | 0 (0.0%) | 0 (0.0%) |
| 6 to 18 Years | 0 (0.0%) | 46 (100.0%) |
| 19 to 25 Years | 10 (11.9%) | 64 (76.2%) |
| 25 to 34 Years | 52 (96.3%) | 2 (3.7%) |
| 35 to 44 Years | 0 (0.0%) | 41 (100.0%) |
| 45 to 54 Years | 26 (9.9%) | 223 (85.1%) |
| 55 to 64 Years | 20 (6.8%) | 276 (93.2%) |
| 65 to 74 Years | 29 (53.7%) | 54 (100.0%) |
| 75 Years and over | 69 (100.0%) | 60 (87.0%) |
| Total | 206 (22.7%) | 766 (84.6%) |
Disability Status by Sex by Age in Vineyard Lake
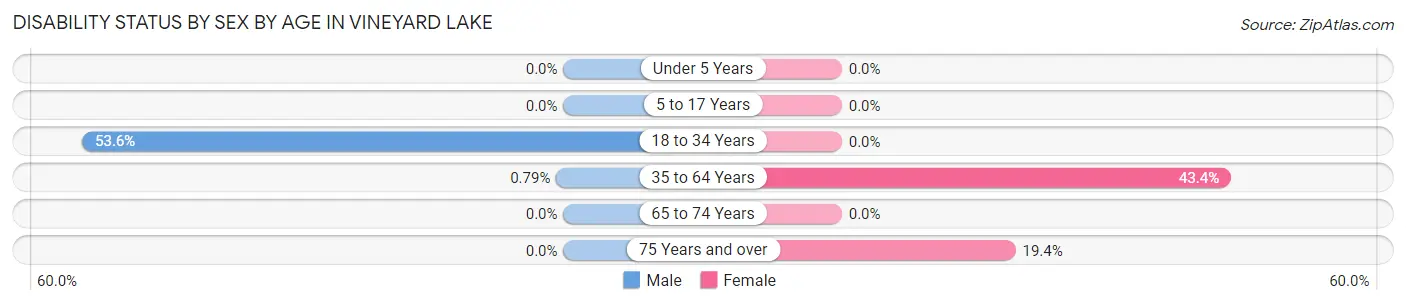
| Age Bracket | Male | Female |
| Under 5 Years | 0 (0.0%) | 0 (0.0%) |
| 5 to 17 Years | 0 (0.0%) | 0 (0.0%) |
| 18 to 34 Years | 52 (53.6%) | 0 (0.0%) |
| 35 to 64 Years | 2 (0.8%) | 150 (43.3%) |
| 65 to 74 Years | 0 (0.0%) | 0 (0.0%) |
| 75 Years and over | 0 (0.0%) | 6 (19.4%) |
Disability Class by Sex by Age in Vineyard Lake
Disability Class: Hearing Difficulty
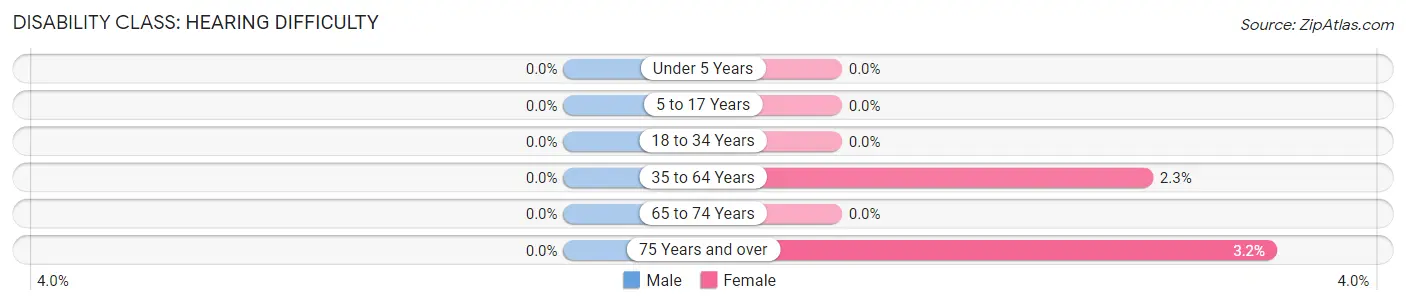
| Age Bracket | Male | Female |
| Under 5 Years | 0 (0.0%) | 0 (0.0%) |
| 5 to 17 Years | 0 (0.0%) | 0 (0.0%) |
| 18 to 34 Years | 0 (0.0%) | 0 (0.0%) |
| 35 to 64 Years | 0 (0.0%) | 8 (2.3%) |
| 65 to 74 Years | 0 (0.0%) | 0 (0.0%) |
| 75 Years and over | 0 (0.0%) | 1 (3.2%) |
Disability Class: Vision Difficulty
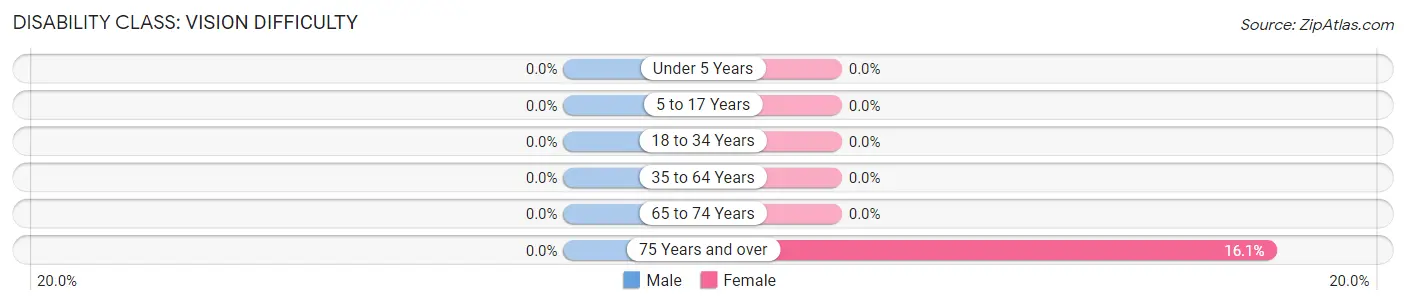
| Age Bracket | Male | Female |
| Under 5 Years | 0 (0.0%) | 0 (0.0%) |
| 5 to 17 Years | 0 (0.0%) | 0 (0.0%) |
| 18 to 34 Years | 0 (0.0%) | 0 (0.0%) |
| 35 to 64 Years | 0 (0.0%) | 0 (0.0%) |
| 65 to 74 Years | 0 (0.0%) | 0 (0.0%) |
| 75 Years and over | 0 (0.0%) | 5 (16.1%) |
Disability Class: Cognitive Difficulty
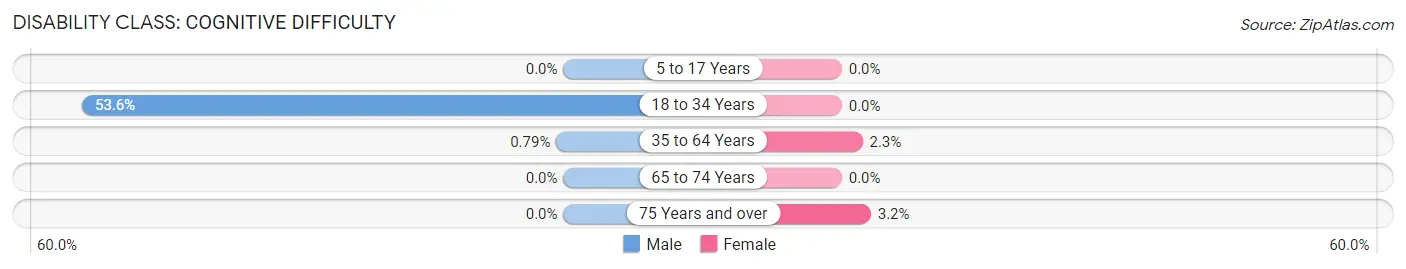
| Age Bracket | Male | Female |
| 5 to 17 Years | 0 (0.0%) | 0 (0.0%) |
| 18 to 34 Years | 52 (53.6%) | 0 (0.0%) |
| 35 to 64 Years | 2 (0.8%) | 8 (2.3%) |
| 65 to 74 Years | 0 (0.0%) | 0 (0.0%) |
| 75 Years and over | 0 (0.0%) | 1 (3.2%) |
Disability Class: Ambulatory Difficulty
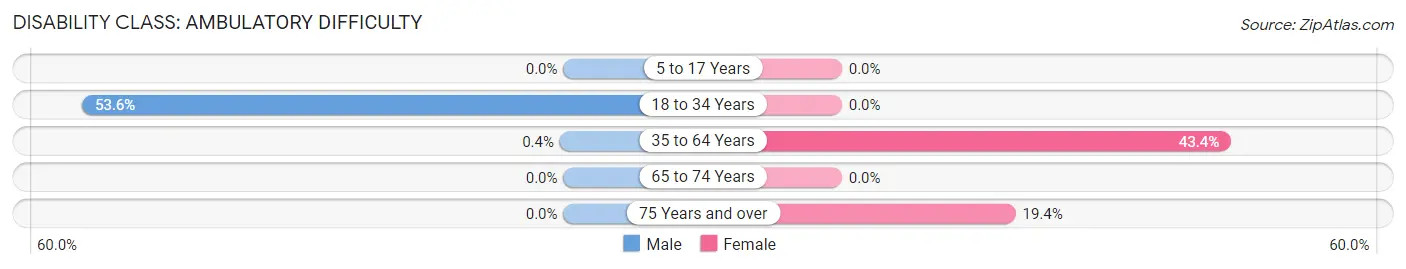
| Age Bracket | Male | Female |
| 5 to 17 Years | 0 (0.0%) | 0 (0.0%) |
| 18 to 34 Years | 52 (53.6%) | 0 (0.0%) |
| 35 to 64 Years | 1 (0.4%) | 150 (43.3%) |
| 65 to 74 Years | 0 (0.0%) | 0 (0.0%) |
| 75 Years and over | 0 (0.0%) | 6 (19.4%) |
Disability Class: Self-Care Difficulty
| Age Bracket | Male | Female |
| 5 to 17 Years | 0 (0.0%) | 0 (0.0%) |
| 18 to 34 Years | 0 (0.0%) | 0 (0.0%) |
| 35 to 64 Years | 1 (0.4%) | 129 (37.3%) |
| 65 to 74 Years | 0 (0.0%) | 0 (0.0%) |
| 75 Years and over | 0 (0.0%) | 1 (3.2%) |
Technology Access in Vineyard Lake
Computing Device Access in Vineyard Lake
| Device Type | # Households | % Households |
| Desktop or Laptop | 342 | 79.3% |
| Smartphone | 393 | 91.2% |
| Tablet | 288 | 66.8% |
| No Computing Device | 30 | 7.0% |
| Total | 431 | 100.0% |
Internet Access in Vineyard Lake
| Internet Type | # Households | % Households |
| Dial-Up Internet | 0 | 0.0% |
| Broadband Home | 213 | 49.4% |
| Cellular Data Only | 65 | 15.1% |
| Satellite Internet | 113 | 26.2% |
| No Internet | 40 | 9.3% |
| Total | 431 | 100.0% |
Vineyard Lake Summary
Vineyard Lake is a small unincorporated community located in the Upper Peninsula of Michigan, in the United States. It is situated in the western part of the state, in the county of Chippewa. The community is located on the shores of Lake Superior, and is surrounded by the Huron National Forest.
History
Vineyard Lake was first settled in the late 1800s by a group of Finnish immigrants. The immigrants were drawn to the area by the abundance of natural resources, including the lake and the surrounding forests. The settlers built a small village, which they named after the lake. The village was home to a small fishing industry, as well as a few small farms.
In the early 1900s, the village was home to a sawmill, which provided lumber for the surrounding area. The sawmill was eventually replaced by a paper mill, which operated until the late 1970s. The paper mill provided employment for many of the residents of Vineyard Lake.
In the late 1970s, the paper mill closed and the village began to decline. Many of the residents moved away, leaving the village largely abandoned. In the early 2000s, the village was revitalized by a group of local entrepreneurs, who opened a number of small businesses in the area. These businesses included a restaurant, a bed and breakfast, and a small grocery store.
Geography
Vineyard Lake is located in the western part of the Upper Peninsula of Michigan, in the county of Chippewa. The community is situated on the shores of Lake Superior, and is surrounded by the Huron National Forest. The lake is approximately two miles long and one mile wide, and is fed by several small streams. The lake is a popular destination for fishing, boating, and swimming.
The village of Vineyard Lake is located on the eastern shore of the lake. The village is home to a number of small businesses, including a restaurant, a bed and breakfast, and a small grocery store. The village is also home to a small marina, which provides access to the lake for boaters.
Economy
The economy of Vineyard Lake is largely based on tourism. The village is a popular destination for fishing, boating, and swimming. The marina provides access to the lake for boaters, and the surrounding forests provide opportunities for hunting and camping. The village is also home to a number of small businesses, including a restaurant, a bed and breakfast, and a small grocery store.
Demographics
As of the 2010 census, the population of Vineyard Lake was 545. The population is largely composed of white individuals, with a small percentage of African Americans and Native Americans. The median household income in the village is $37,500, and the median age is 44. The village is home to a number of small businesses, including a restaurant, a bed and breakfast, and a small grocery store.
Common Questions
What is Per Capita Income in Vineyard Lake?
Per Capita income in Vineyard Lake is $95,443.
What is the Median Household income in Vineyard Lake?
Median Household Income in Vineyard Lake is $93,472.
What is Inequality or Gini Index in Vineyard Lake?
Inequality or Gini Index in Vineyard Lake is 0.52.
What is the Total Population of Vineyard Lake?
Total Population of Vineyard Lake is 918.
What is the Total Male Population of Vineyard Lake?
Total Male Population of Vineyard Lake is 466.
What is the Total Female Population of Vineyard Lake?
Total Female Population of Vineyard Lake is 452.
What is the Ratio of Males per 100 Females in Vineyard Lake?
There are 103.10 Males per 100 Females in Vineyard Lake.
What is the Ratio of Females per 100 Males in Vineyard Lake?
There are 97.00 Females per 100 Males in Vineyard Lake.
What is the Median Population Age in Vineyard Lake?
Median Population Age in Vineyard Lake is 54.8 Years.
What is the Average Family Size in Vineyard Lake
Average Family Size in Vineyard Lake is 2.4 People.
What is the Average Household Size in Vineyard Lake
Average Household Size in Vineyard Lake is 2.1 People.
How Large is the Labor Force in Vineyard Lake?
There are 614 People in the Labor Forcein in Vineyard Lake.
What is the Percentage of People in the Labor Force in Vineyard Lake?
69.6% of People are in the Labor Force in Vineyard Lake.