Sault Ste Marie, MI Map & Demographics
Sault Ste Marie Map
Sault Ste Marie Overview
$28,488
PER CAPITA INCOME
$73,854
AVG FAMILY INCOME
$50,284
AVG HOUSEHOLD INCOME
18.0%
WAGE / INCOME GAP [ % ]
82.0¢/ $1
WAGE / INCOME GAP [ $ ]
$13,110
FAMILY INCOME DEFICIT
0.43
INEQUALITY / GINI INDEX
13,409
TOTAL POPULATION
6,500
MALE POPULATION
6,909
FEMALE POPULATION
94.08
MALES / 100 FEMALES
106.29
FEMALES / 100 MALES
35.3
MEDIAN AGE
3.0
AVG FAMILY SIZE
2.1
AVG HOUSEHOLD SIZE
7,081
LABOR FORCE [ PEOPLE ]
63.7%
PERCENT IN LABOR FORCE
7.5%
UNEMPLOYMENT RATE
Income in Sault Ste Marie
Income Overview in Sault Ste Marie
Per Capita Income in Sault Ste Marie is $28,488, while median incomes of families and households are $73,854 and $50,284 respectively.
| Characteristic | Number | Measure |
| Per Capita Income | 13,409 | $28,488 |
| Median Family Income | 2,709 | $73,854 |
| Mean Family Income | 2,709 | $84,717 |
| Median Household Income | 5,787 | $50,284 |
| Mean Household Income | 5,787 | $61,804 |
| Income Deficit | 2,709 | $13,110 |
| Wage / Income Gap (%) | 13,409 | 18.05% |
| Wage / Income Gap ($) | 13,409 | 81.95¢ per $1 |
| Gini / Inequality Index | 13,409 | 0.43 |
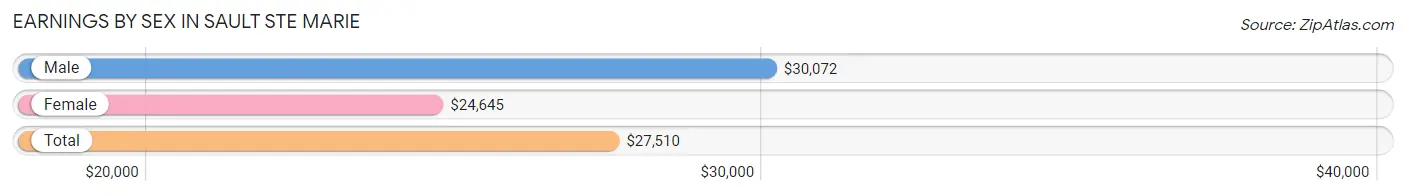
Earnings by Sex in Sault Ste Marie
Average Earnings in Sault Ste Marie are $27,510, $30,072 for men and $24,645 for women, a difference of 18.0%.
| Sex | Number | Average Earnings |
| Male | 3,930 (51.2%) | $30,072 |
| Female | 3,748 (48.8%) | $24,645 |
| Total | 7,678 (100.0%) | $27,510 |
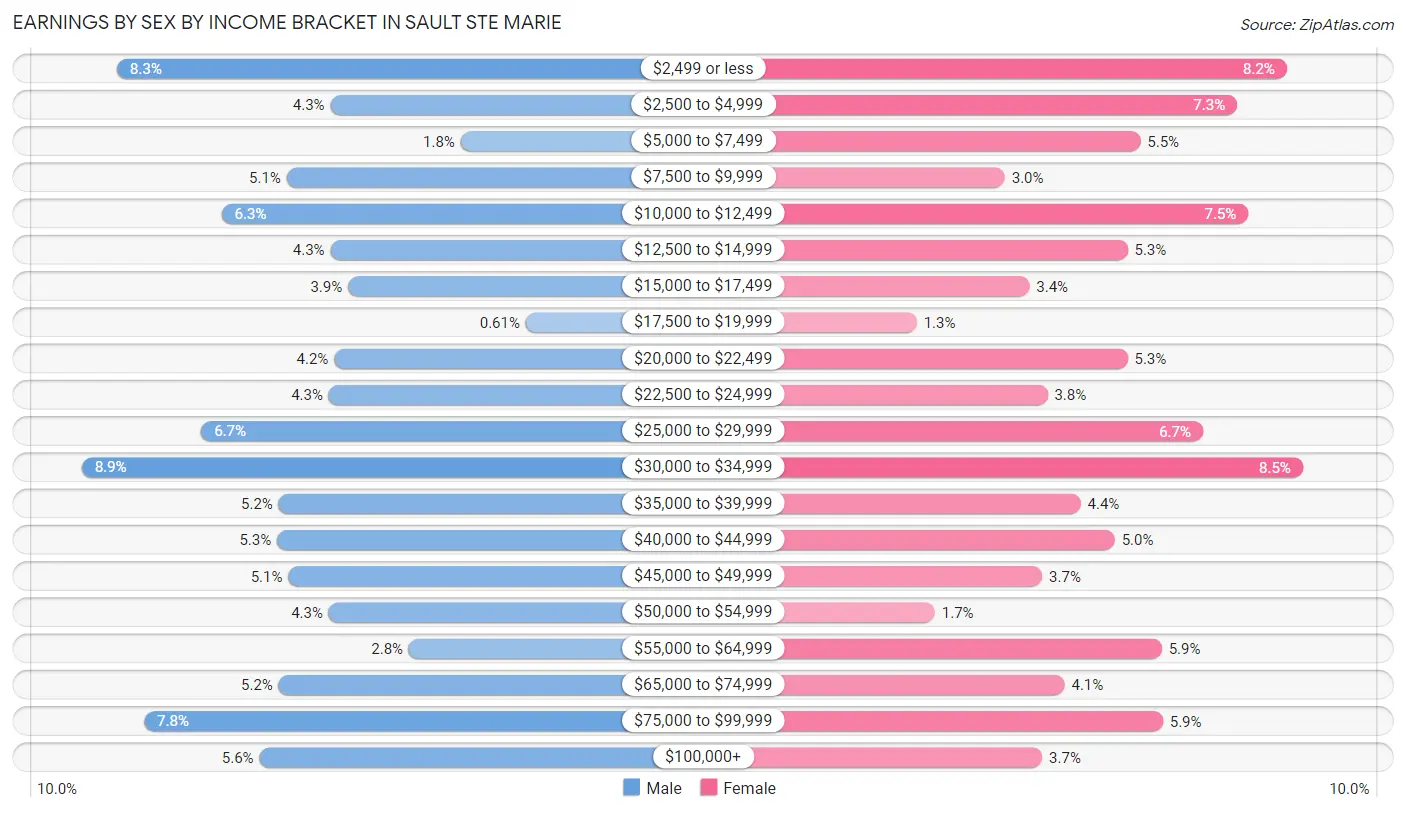
Earnings by Sex by Income Bracket in Sault Ste Marie
The most common earnings brackets in Sault Ste Marie are $30,000 to $34,999 for men (351 | 8.9%) and $30,000 to $34,999 for women (320 | 8.5%).
| Income | Male | Female |
| $2,499 or less | 325 (8.3%) | 309 (8.2%) |
| $2,500 to $4,999 | 168 (4.3%) | 274 (7.3%) |
| $5,000 to $7,499 | 72 (1.8%) | 206 (5.5%) |
| $7,500 to $9,999 | 200 (5.1%) | 111 (3.0%) |
| $10,000 to $12,499 | 248 (6.3%) | 282 (7.5%) |
| $12,500 to $14,999 | 168 (4.3%) | 197 (5.3%) |
| $15,000 to $17,499 | 155 (3.9%) | 128 (3.4%) |
| $17,500 to $19,999 | 24 (0.6%) | 49 (1.3%) |
| $20,000 to $22,499 | 165 (4.2%) | 197 (5.3%) |
| $22,500 to $24,999 | 169 (4.3%) | 141 (3.8%) |
| $25,000 to $29,999 | 263 (6.7%) | 250 (6.7%) |
| $30,000 to $34,999 | 351 (8.9%) | 320 (8.5%) |
| $35,000 to $39,999 | 206 (5.2%) | 164 (4.4%) |
| $40,000 to $44,999 | 207 (5.3%) | 188 (5.0%) |
| $45,000 to $49,999 | 199 (5.1%) | 137 (3.7%) |
| $50,000 to $54,999 | 169 (4.3%) | 62 (1.7%) |
| $55,000 to $64,999 | 110 (2.8%) | 221 (5.9%) |
| $65,000 to $74,999 | 206 (5.2%) | 153 (4.1%) |
| $75,000 to $99,999 | 305 (7.8%) | 222 (5.9%) |
| $100,000+ | 220 (5.6%) | 137 (3.7%) |
| Total | 3,930 (100.0%) | 3,748 (100.0%) |
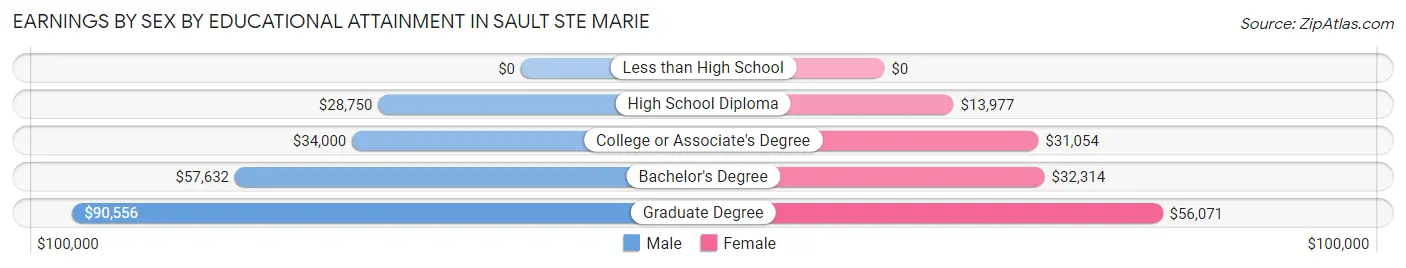
Earnings by Sex by Educational Attainment in Sault Ste Marie
Average earnings in Sault Ste Marie are $36,543 for men and $31,443 for women, a difference of 14.0%. Men with an educational attainment of graduate degree enjoy the highest average annual earnings of $90,556, while those with high school diploma education earn the least with $28,750. Women with an educational attainment of graduate degree earn the most with the average annual earnings of $56,071, while those with high school diploma education have the smallest earnings of $13,977.
| Educational Attainment | Male Income | Female Income |
| Less than High School | - | - |
| High School Diploma | $28,750 | $13,977 |
| College or Associate's Degree | $34,000 | $31,054 |
| Bachelor's Degree | $57,632 | $32,314 |
| Graduate Degree | $90,556 | $56,071 |
| Total | $36,543 | $31,443 |
Family Income in Sault Ste Marie
Family Income Brackets in Sault Ste Marie
According to the Sault Ste Marie family income data, there are 588 families falling into the $75,000 to $99,999 income range, which is the most common income bracket and makes up 21.7% of all families. Conversely, the $10,000 to $14,999 income bracket is the least frequent group with only 106 families (3.9%) belonging to this category.
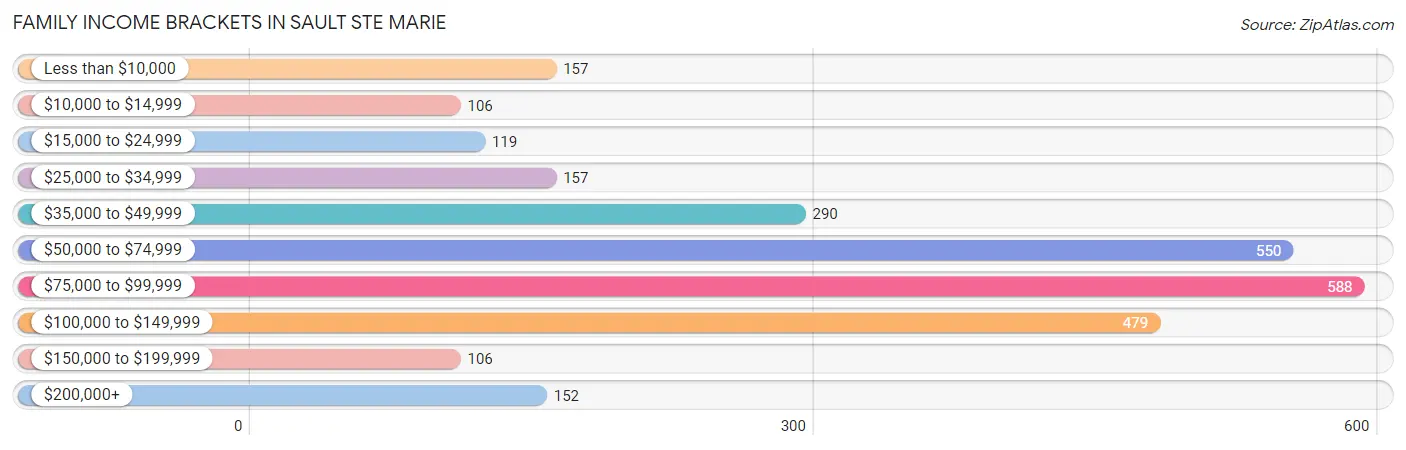
| Income Bracket | # Families | % Families |
| Less than $10,000 | 157 | 5.8% |
| $10,000 to $14,999 | 106 | 3.9% |
| $15,000 to $24,999 | 119 | 4.4% |
| $25,000 to $34,999 | 157 | 5.8% |
| $35,000 to $49,999 | 290 | 10.7% |
| $50,000 to $74,999 | 550 | 20.3% |
| $75,000 to $99,999 | 588 | 21.7% |
| $100,000 to $149,999 | 479 | 17.7% |
| $150,000 to $199,999 | 106 | 3.9% |
| $200,000+ | 152 | 5.6% |
Family Income by Famaliy Size in Sault Ste Marie
5-person families (166 | 6.1%) account for the highest median family income in Sault Ste Marie with $97,768 per family, while 2-person families (1,356 | 50.1%) have the highest median income of $32,972 per family member.
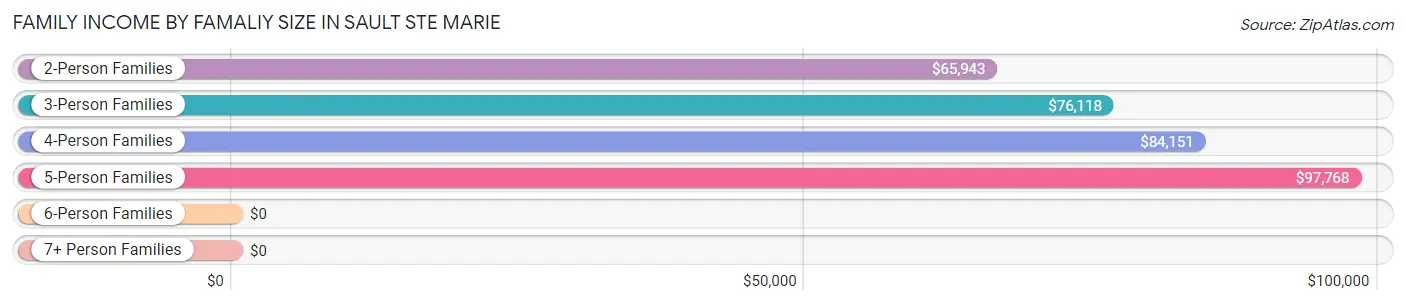
| Income Bracket | # Families | Median Income |
| 2-Person Families | 1,356 (50.1%) | $65,943 |
| 3-Person Families | 641 (23.7%) | $76,118 |
| 4-Person Families | 466 (17.2%) | $84,151 |
| 5-Person Families | 166 (6.1%) | $97,768 |
| 6-Person Families | 32 (1.2%) | $0 |
| 7+ Person Families | 48 (1.8%) | $0 |
| Total | 2,709 (100.0%) | $73,854 |
Family Income by Number of Earners in Sault Ste Marie
The median family income in Sault Ste Marie is $73,854, with families comprising 3+ earners (205) having the highest median family income of $114,219, while families with 1 earner (854) have the lowest median family income of $54,200, accounting for 7.6% and 31.5% of families, respectively.
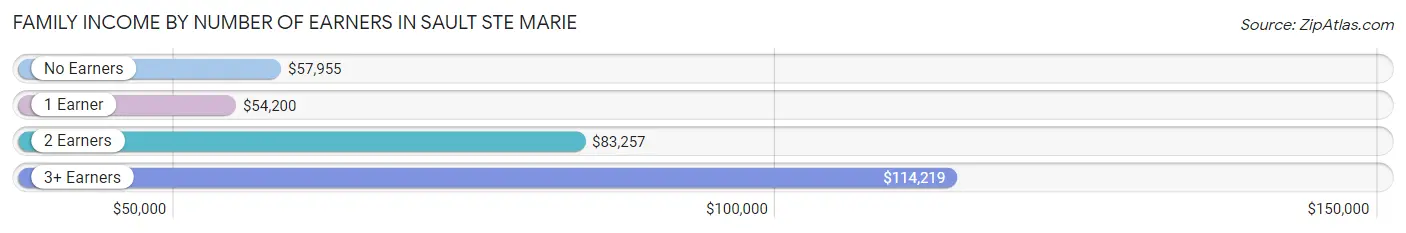
| Number of Earners | # Families | Median Income |
| No Earners | 318 (11.7%) | $57,955 |
| 1 Earner | 854 (31.5%) | $54,200 |
| 2 Earners | 1,332 (49.2%) | $83,257 |
| 3+ Earners | 205 (7.6%) | $114,219 |
| Total | 2,709 (100.0%) | $73,854 |
Household Income in Sault Ste Marie
Household Income Brackets in Sault Ste Marie
With 1,198 households falling in the category, the $50,000 to $74,999 income range is the most frequent in Sault Ste Marie, accounting for 20.7% of all households. In contrast, only 104 households (1.8%) fall into the $150,000 to $199,999 income bracket, making it the least populous group.
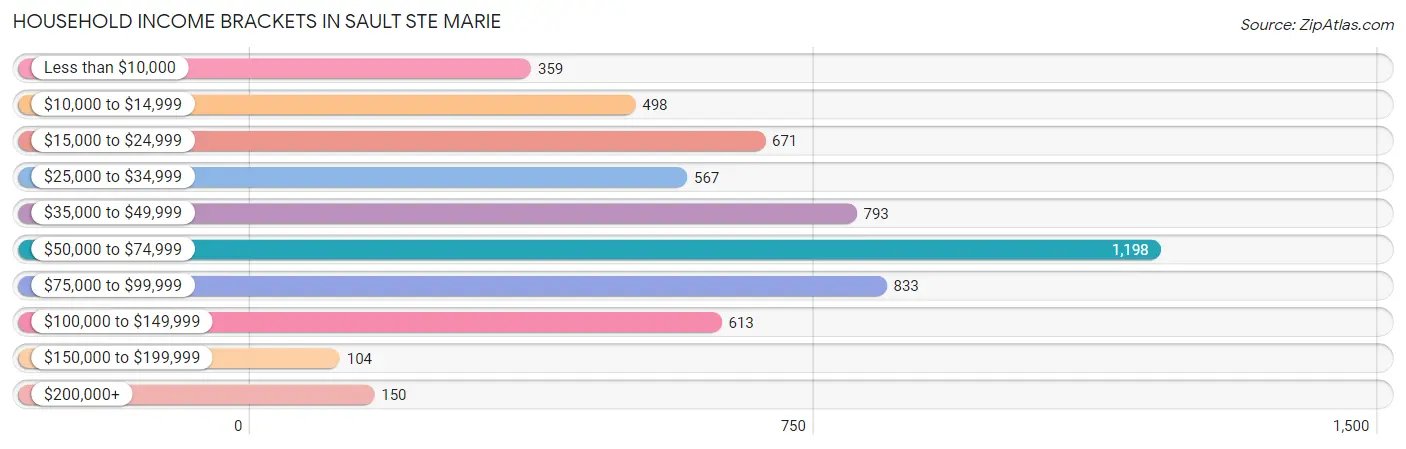
| Income Bracket | # Households | % Households |
| Less than $10,000 | 359 | 6.2% |
| $10,000 to $14,999 | 498 | 8.6% |
| $15,000 to $24,999 | 671 | 11.6% |
| $25,000 to $34,999 | 567 | 9.8% |
| $35,000 to $49,999 | 793 | 13.7% |
| $50,000 to $74,999 | 1,198 | 20.7% |
| $75,000 to $99,999 | 833 | 14.4% |
| $100,000 to $149,999 | 613 | 10.6% |
| $150,000 to $199,999 | 104 | 1.8% |
| $200,000+ | 150 | 2.6% |
Household Income by Householder Age in Sault Ste Marie
The median household income in Sault Ste Marie is $50,284, with the highest median household income of $67,179 found in the 25 to 44 years age bracket for the primary householder. A total of 1,767 households (30.5%) fall into this category. Meanwhile, the 15 to 24 years age bracket for the primary householder has the lowest median household income of $22,170, with 374 households (6.5%) in this group.
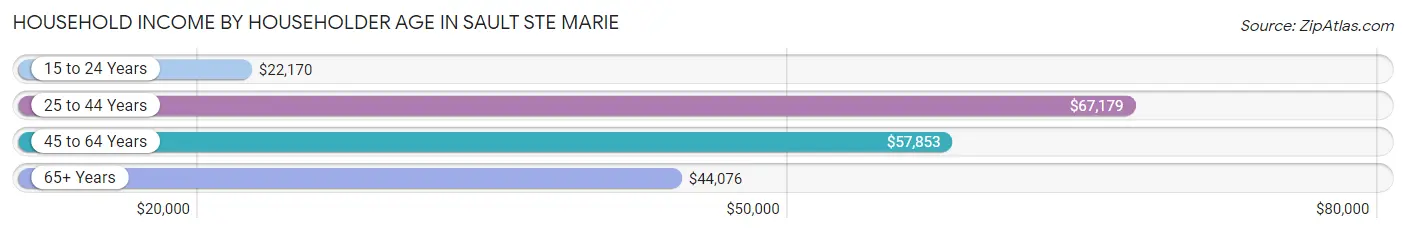
| Income Bracket | # Households | Median Income |
| 15 to 24 Years | 374 (6.5%) | $22,170 |
| 25 to 44 Years | 1,767 (30.5%) | $67,179 |
| 45 to 64 Years | 1,799 (31.1%) | $57,853 |
| 65+ Years | 1,847 (31.9%) | $44,076 |
| Total | 5,787 (100.0%) | $50,284 |
Poverty in Sault Ste Marie
Income Below Poverty by Sex and Age in Sault Ste Marie
With 19.0% poverty level for males and 22.6% for females among the residents of Sault Ste Marie, 5 year old males and 16 and 17 year old females are the most vulnerable to poverty, with 26 males (68.4%) and 51 females (47.7%) in their respective age groups living below the poverty level.
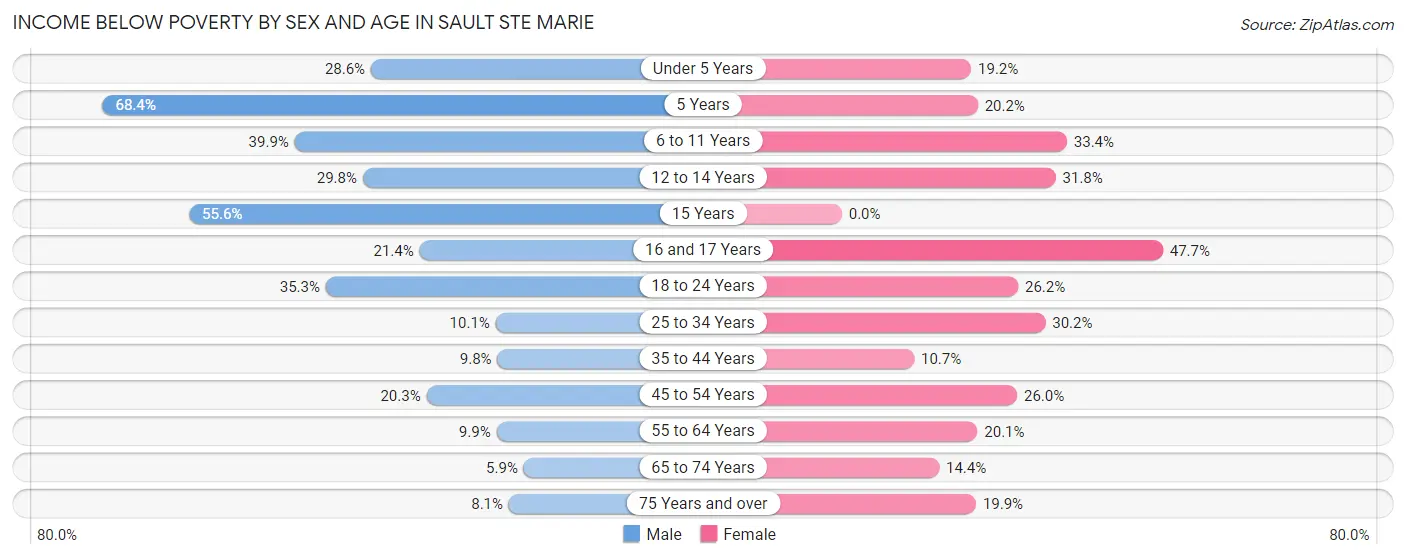
| Age Bracket | Male | Female |
| Under 5 Years | 110 (28.6%) | 62 (19.2%) |
| 5 Years | 26 (68.4%) | 22 (20.2%) |
| 6 to 11 Years | 168 (39.9%) | 133 (33.4%) |
| 12 to 14 Years | 95 (29.8%) | 67 (31.8%) |
| 15 Years | 10 (55.6%) | 0 (0.0%) |
| 16 and 17 Years | 22 (21.4%) | 51 (47.7%) |
| 18 to 24 Years | 296 (35.3%) | 162 (26.2%) |
| 25 to 34 Years | 109 (10.1%) | 269 (30.2%) |
| 35 to 44 Years | 70 (9.8%) | 66 (10.7%) |
| 45 to 54 Years | 115 (20.3%) | 172 (26.0%) |
| 55 to 64 Years | 69 (9.9%) | 192 (20.1%) |
| 65 to 74 Years | 33 (5.9%) | 104 (14.4%) |
| 75 Years and over | 25 (8.1%) | 151 (19.9%) |
| Total | 1,148 (19.0%) | 1,451 (22.6%) |
Income Above Poverty by Sex and Age in Sault Ste Marie
According to the poverty statistics in Sault Ste Marie, males aged 65 to 74 years and females aged 15 years are the age groups that are most secure financially, with 94.1% of males and 100.0% of females in these age groups living above the poverty line.
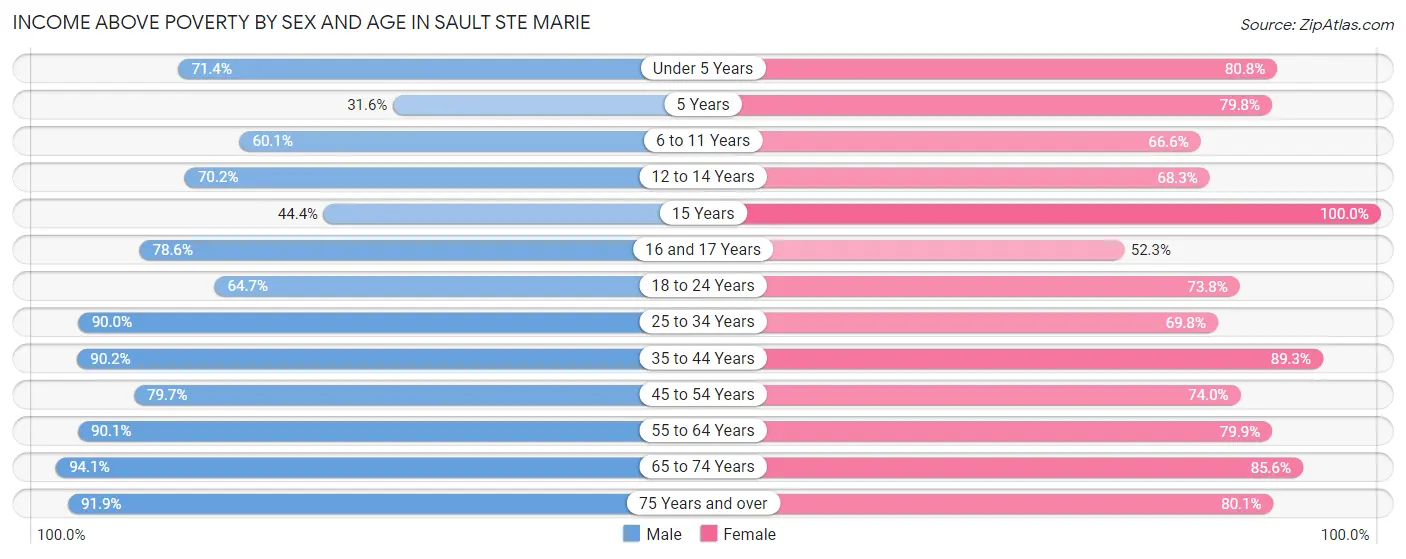
| Age Bracket | Male | Female |
| Under 5 Years | 275 (71.4%) | 261 (80.8%) |
| 5 Years | 12 (31.6%) | 87 (79.8%) |
| 6 to 11 Years | 253 (60.1%) | 265 (66.6%) |
| 12 to 14 Years | 224 (70.2%) | 144 (68.2%) |
| 15 Years | 8 (44.4%) | 71 (100.0%) |
| 16 and 17 Years | 81 (78.6%) | 56 (52.3%) |
| 18 to 24 Years | 543 (64.7%) | 457 (73.8%) |
| 25 to 34 Years | 976 (89.9%) | 621 (69.8%) |
| 35 to 44 Years | 645 (90.2%) | 549 (89.3%) |
| 45 to 54 Years | 451 (79.7%) | 489 (74.0%) |
| 55 to 64 Years | 626 (90.1%) | 762 (79.9%) |
| 65 to 74 Years | 528 (94.1%) | 616 (85.6%) |
| 75 Years and over | 284 (91.9%) | 607 (80.1%) |
| Total | 4,906 (81.0%) | 4,985 (77.4%) |
Income Below Poverty Among Married-Couple Families in Sault Ste Marie
The poverty statistics for married-couple families in Sault Ste Marie show that 2.6% or 49 of the total 1,865 families live below the poverty line. Families with 1 or 2 children have the highest poverty rate of 3.6%, comprising of 25 families. On the other hand, families with 3 or 4 children have the lowest poverty rate of 0.0%, which includes 0 families.
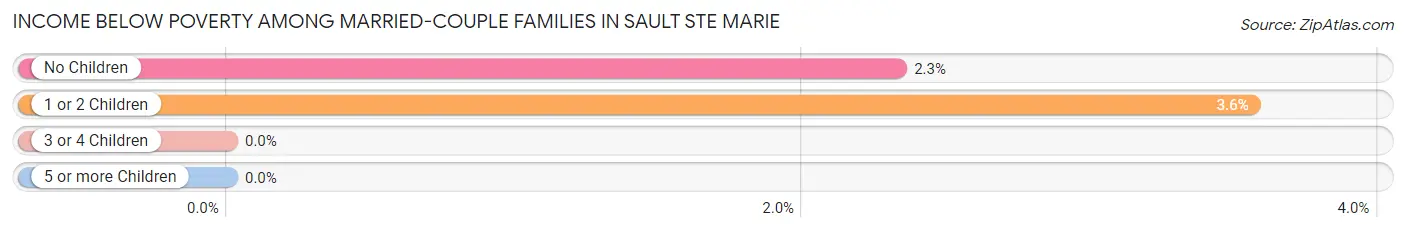
| Children | Above Poverty | Below Poverty |
| No Children | 1,007 (97.7%) | 24 (2.3%) |
| 1 or 2 Children | 677 (96.4%) | 25 (3.6%) |
| 3 or 4 Children | 109 (100.0%) | 0 (0.0%) |
| 5 or more Children | 23 (100.0%) | 0 (0.0%) |
| Total | 1,816 (97.4%) | 49 (2.6%) |
Income Below Poverty Among Single-Parent Households in Sault Ste Marie
According to the poverty data in Sault Ste Marie, 30.9% or 72 single-father households and 37.8% or 231 single-mother households are living below the poverty line. Among single-father households, those with 3 or 4 children have the highest poverty rate, with 44 households (73.3%) experiencing poverty. Likewise, among single-mother households, those with 5 or more children have the highest poverty rate, with 25 households (100.0%) falling below the poverty line.
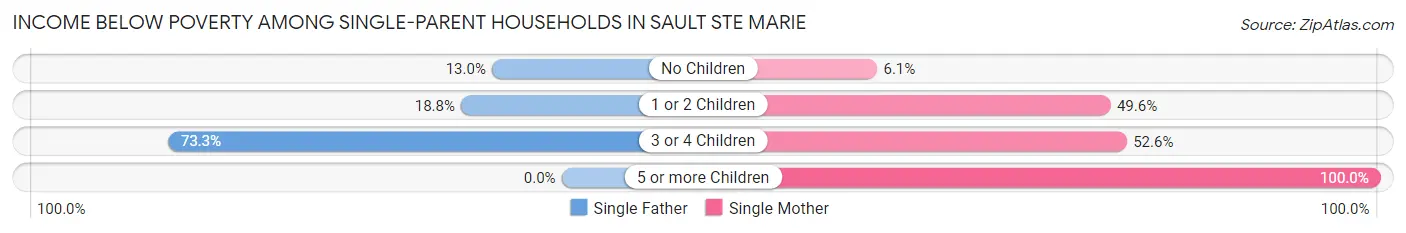
| Children | Single Father | Single Mother |
| No Children | 10 (13.0%) | 12 (6.1%) |
| 1 or 2 Children | 18 (18.8%) | 184 (49.6%) |
| 3 or 4 Children | 44 (73.3%) | 10 (52.6%) |
| 5 or more Children | 0 (0.0%) | 25 (100.0%) |
| Total | 72 (30.9%) | 231 (37.8%) |
Income Below Poverty Among Married-Couple vs Single-Parent Households in Sault Ste Marie
The poverty data for Sault Ste Marie shows that 49 of the married-couple family households (2.6%) and 303 of the single-parent households (35.9%) are living below the poverty level. Within the married-couple family households, those with 1 or 2 children have the highest poverty rate, with 25 households (3.6%) falling below the poverty line. Among the single-parent households, those with 5 or more children have the highest poverty rate, with 25 household (100.0%) living below poverty.
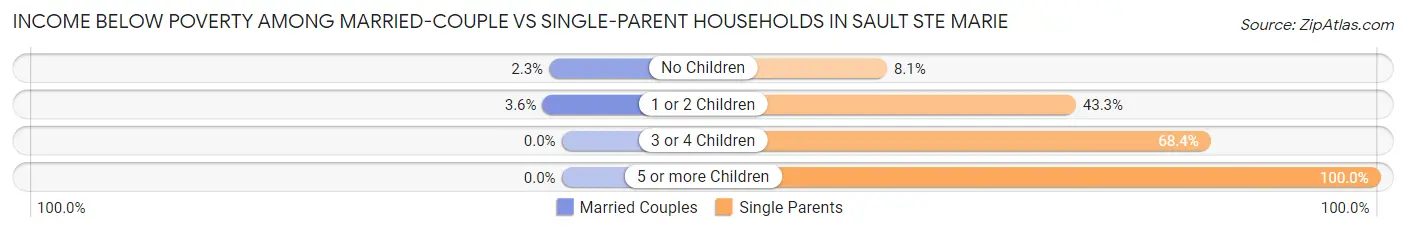
| Children | Married-Couple Families | Single-Parent Households |
| No Children | 24 (2.3%) | 22 (8.1%) |
| 1 or 2 Children | 25 (3.6%) | 202 (43.2%) |
| 3 or 4 Children | 0 (0.0%) | 54 (68.3%) |
| 5 or more Children | 0 (0.0%) | 25 (100.0%) |
| Total | 49 (2.6%) | 303 (35.9%) |
Race in Sault Ste Marie
The most populous races in Sault Ste Marie are White / Caucasian (9,336 | 69.6%), Native / Alaskan (1,857 | 13.9%), and Two or more Races (1,746 | 13.0%).
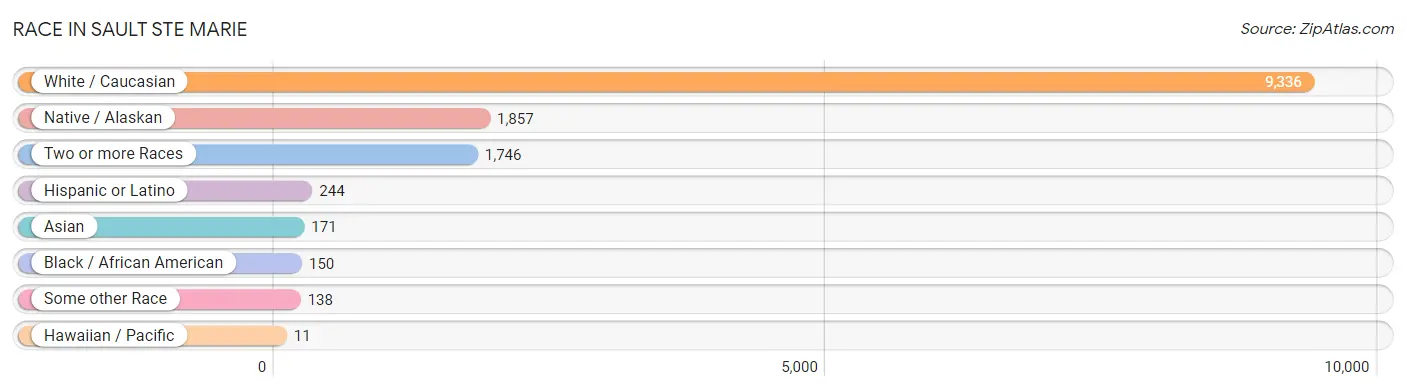
| Race | # Population | % Population |
| Asian | 171 | 1.3% |
| Black / African American | 150 | 1.1% |
| Hawaiian / Pacific | 11 | 0.1% |
| Hispanic or Latino | 244 | 1.8% |
| Native / Alaskan | 1,857 | 13.9% |
| White / Caucasian | 9,336 | 69.6% |
| Two or more Races | 1,746 | 13.0% |
| Some other Race | 138 | 1.0% |
| Total | 13,409 | 100.0% |
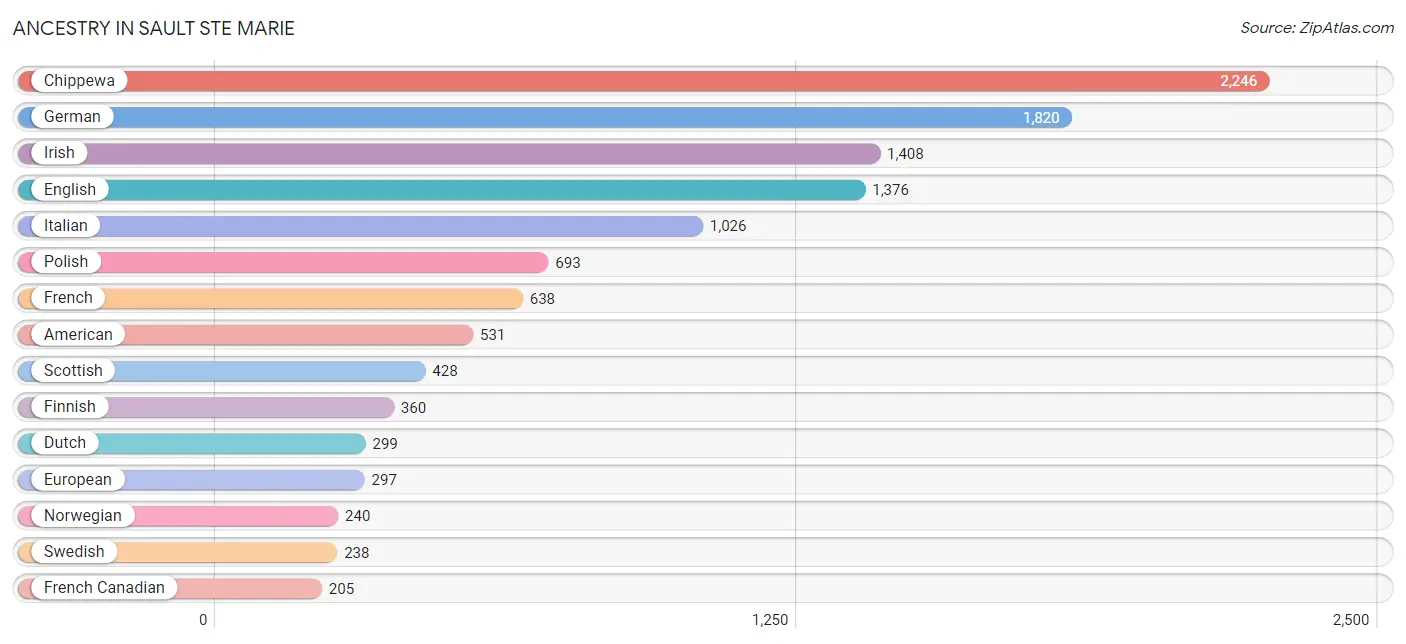
Ancestry in Sault Ste Marie
The most populous ancestries reported in Sault Ste Marie are Chippewa (2,246 | 16.8%), German (1,820 | 13.6%), Irish (1,408 | 10.5%), English (1,376 | 10.3%), and Italian (1,026 | 7.6%), together accounting for 58.7% of all Sault Ste Marie residents.
| Ancestry | # Population | % Population |
| African | 44 | 0.3% |
| American | 531 | 4.0% |
| Arab | 27 | 0.2% |
| Belgian | 34 | 0.3% |
| Bhutanese | 7 | 0.1% |
| Blackfeet | 28 | 0.2% |
| British | 53 | 0.4% |
| Canadian | 101 | 0.7% |
| Central American | 79 | 0.6% |
| Cherokee | 105 | 0.8% |
| Chippewa | 2,246 | 16.8% |
| Choctaw | 23 | 0.2% |
| Costa Rican | 78 | 0.6% |
| Cuban | 6 | 0.0% |
| Czech | 16 | 0.1% |
| Dutch | 299 | 2.2% |
| Eastern European | 42 | 0.3% |
| English | 1,376 | 10.3% |
| European | 297 | 2.2% |
| Finnish | 360 | 2.7% |
| French | 638 | 4.8% |
| French American Indian | 69 | 0.5% |
| French Canadian | 205 | 1.5% |
| German | 1,820 | 13.6% |
| Greek | 88 | 0.7% |
| Guatemalan | 1 | 0.0% |
| Hungarian | 80 | 0.6% |
| Indian (Asian) | 106 | 0.8% |
| Iraqi | 19 | 0.1% |
| Irish | 1,408 | 10.5% |
| Iroquois | 5 | 0.0% |
| Italian | 1,026 | 7.6% |
| Jamaican | 23 | 0.2% |
| Japanese | 1 | 0.0% |
| Korean | 106 | 0.8% |
| Latvian | 10 | 0.1% |
| Lebanese | 8 | 0.1% |
| Lithuanian | 9 | 0.1% |
| Mexican | 148 | 1.1% |
| Native Hawaiian | 120 | 0.9% |
| Northern European | 48 | 0.4% |
| Norwegian | 240 | 1.8% |
| Ottawa | 62 | 0.5% |
| Pennsylvania German | 24 | 0.2% |
| Polish | 693 | 5.2% |
| Potawatomi | 78 | 0.6% |
| Puerto Rican | 11 | 0.1% |
| Russian | 51 | 0.4% |
| Scandinavian | 8 | 0.1% |
| Scotch-Irish | 149 | 1.1% |
| Scottish | 428 | 3.2% |
| Sioux | 139 | 1.0% |
| Sri Lankan | 71 | 0.5% |
| Subsaharan African | 44 | 0.3% |
| Swedish | 238 | 1.8% |
| Swiss | 13 | 0.1% |
| Thai | 19 | 0.1% |
| Ukrainian | 49 | 0.4% |
| Welsh | 8 | 0.1% |
| West Indian | 19 | 0.1% | View All 60 Rows |
Immigrants in Sault Ste Marie
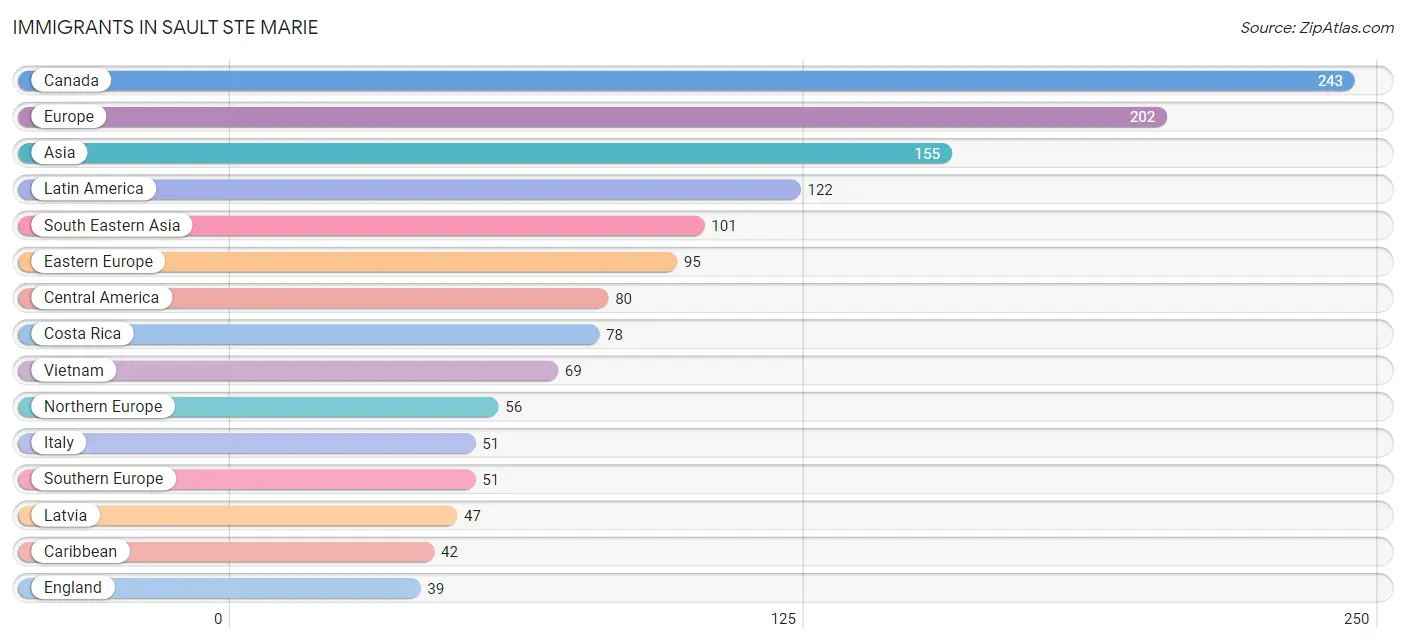
The most numerous immigrant groups reported in Sault Ste Marie came from Canada (243 | 1.8%), Europe (202 | 1.5%), Asia (155 | 1.2%), Latin America (122 | 0.9%), and South Eastern Asia (101 | 0.7%), together accounting for 6.1% of all Sault Ste Marie residents.
| Immigration Origin | # Population | % Population |
| Africa | 1 | 0.0% |
| Asia | 155 | 1.2% |
| Cambodia | 1 | 0.0% |
| Canada | 243 | 1.8% |
| Caribbean | 42 | 0.3% |
| Central America | 80 | 0.6% |
| China | 21 | 0.2% |
| Costa Rica | 78 | 0.6% |
| Eastern Africa | 1 | 0.0% |
| Eastern Asia | 30 | 0.2% |
| Eastern Europe | 95 | 0.7% |
| England | 39 | 0.3% |
| Ethiopia | 1 | 0.0% |
| Europe | 202 | 1.5% |
| Italy | 51 | 0.4% |
| Jamaica | 23 | 0.2% |
| Korea | 9 | 0.1% |
| Latin America | 122 | 0.9% |
| Latvia | 47 | 0.4% |
| Mexico | 2 | 0.0% |
| Northern Europe | 56 | 0.4% |
| Pakistan | 5 | 0.0% |
| Philippines | 31 | 0.2% |
| Poland | 16 | 0.1% |
| Russia | 9 | 0.1% |
| Scotland | 11 | 0.1% |
| South Central Asia | 5 | 0.0% |
| South Eastern Asia | 101 | 0.7% |
| Southern Europe | 51 | 0.4% |
| Sweden | 6 | 0.0% |
| Trinidad and Tobago | 19 | 0.1% |
| Ukraine | 21 | 0.2% |
| Vietnam | 69 | 0.5% | View All 33 Rows |
Sex and Age in Sault Ste Marie
Sex and Age in Sault Ste Marie
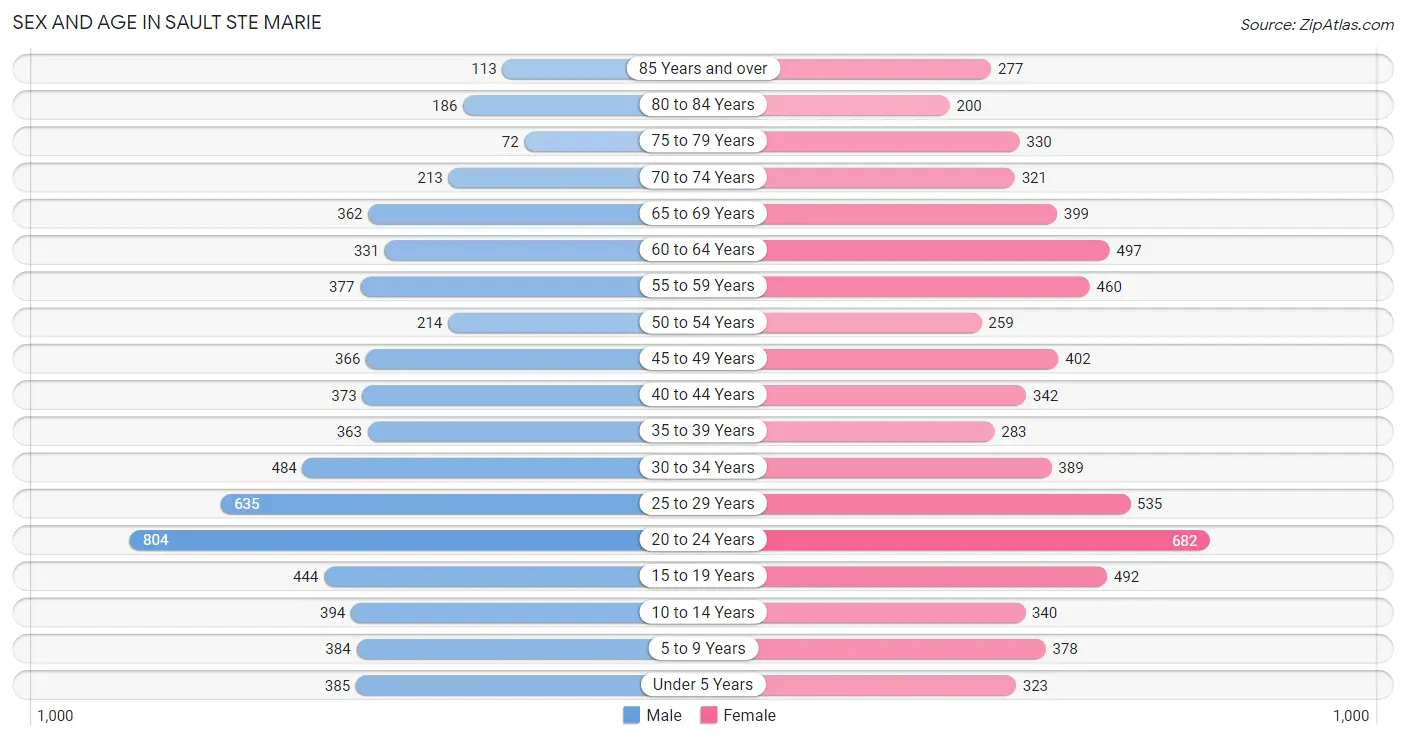
The most populous age groups in Sault Ste Marie are 20 to 24 Years (804 | 12.4%) for men and 20 to 24 Years (682 | 9.9%) for women.
| Age Bracket | Male | Female |
| Under 5 Years | 385 (5.9%) | 323 (4.7%) |
| 5 to 9 Years | 384 (5.9%) | 378 (5.5%) |
| 10 to 14 Years | 394 (6.1%) | 340 (4.9%) |
| 15 to 19 Years | 444 (6.8%) | 492 (7.1%) |
| 20 to 24 Years | 804 (12.4%) | 682 (9.9%) |
| 25 to 29 Years | 635 (9.8%) | 535 (7.7%) |
| 30 to 34 Years | 484 (7.4%) | 389 (5.6%) |
| 35 to 39 Years | 363 (5.6%) | 283 (4.1%) |
| 40 to 44 Years | 373 (5.7%) | 342 (5.0%) |
| 45 to 49 Years | 366 (5.6%) | 402 (5.8%) |
| 50 to 54 Years | 214 (3.3%) | 259 (3.7%) |
| 55 to 59 Years | 377 (5.8%) | 460 (6.7%) |
| 60 to 64 Years | 331 (5.1%) | 497 (7.2%) |
| 65 to 69 Years | 362 (5.6%) | 399 (5.8%) |
| 70 to 74 Years | 213 (3.3%) | 321 (4.6%) |
| 75 to 79 Years | 72 (1.1%) | 330 (4.8%) |
| 80 to 84 Years | 186 (2.9%) | 200 (2.9%) |
| 85 Years and over | 113 (1.7%) | 277 (4.0%) |
| Total | 6,500 (100.0%) | 6,909 (100.0%) |
Families and Households in Sault Ste Marie
Median Family Size in Sault Ste Marie
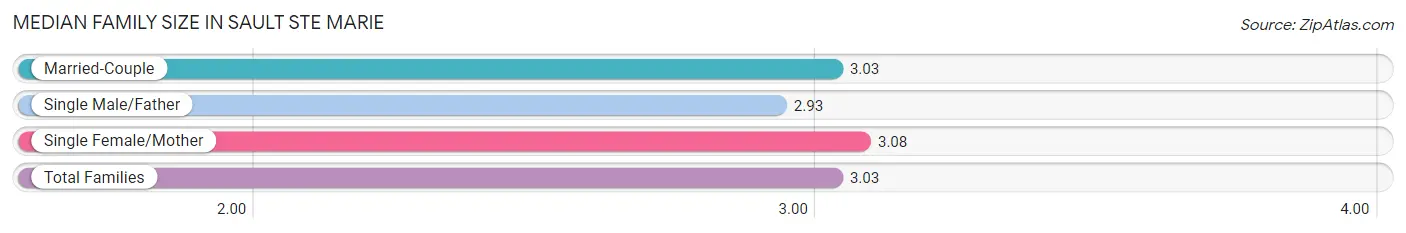
The median family size in Sault Ste Marie is 3.03 persons per family, with single female/mother families (611 | 22.6%) accounting for the largest median family size of 3.08 persons per family. On the other hand, single male/father families (233 | 8.6%) represent the smallest median family size with 2.93 persons per family.
| Family Type | # Families | Family Size |
| Married-Couple | 1,865 (68.8%) | 3.03 |
| Single Male/Father | 233 (8.6%) | 2.93 |
| Single Female/Mother | 611 (22.6%) | 3.08 |
| Total Families | 2,709 (100.0%) | 3.03 |
Median Household Size in Sault Ste Marie
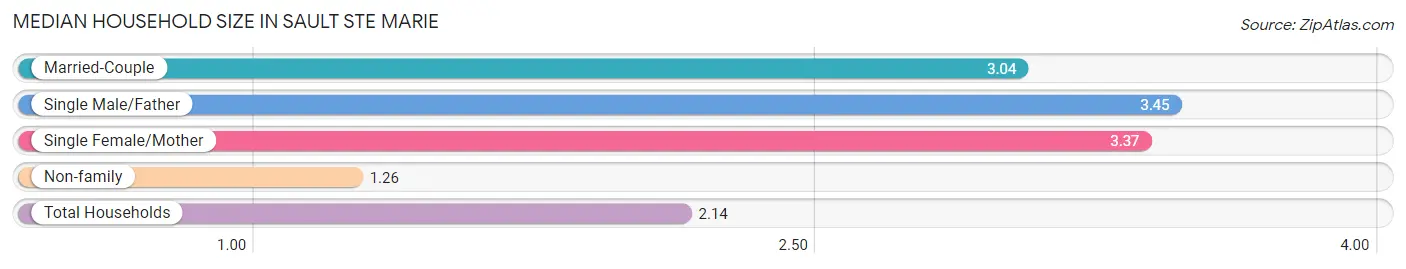
The median household size in Sault Ste Marie is 2.14 persons per household, with single male/father households (233 | 4.0%) accounting for the largest median household size of 3.45 persons per household. non-family households (3,078 | 53.2%) represent the smallest median household size with 1.26 persons per household.
| Household Type | # Households | Household Size |
| Married-Couple | 1,865 (32.2%) | 3.04 |
| Single Male/Father | 233 (4.0%) | 3.45 |
| Single Female/Mother | 611 (10.6%) | 3.37 |
| Non-family | 3,078 (53.2%) | 1.26 |
| Total Households | 5,787 (100.0%) | 2.14 |
Household Size by Marriage Status in Sault Ste Marie
Out of a total of 5,787 households in Sault Ste Marie, 2,709 (46.8%) are family households, while 3,078 (53.2%) are nonfamily households. The most numerous type of family households are 2-person households, comprising 1,213, and the most common type of nonfamily households are 1-person households, comprising 2,573.
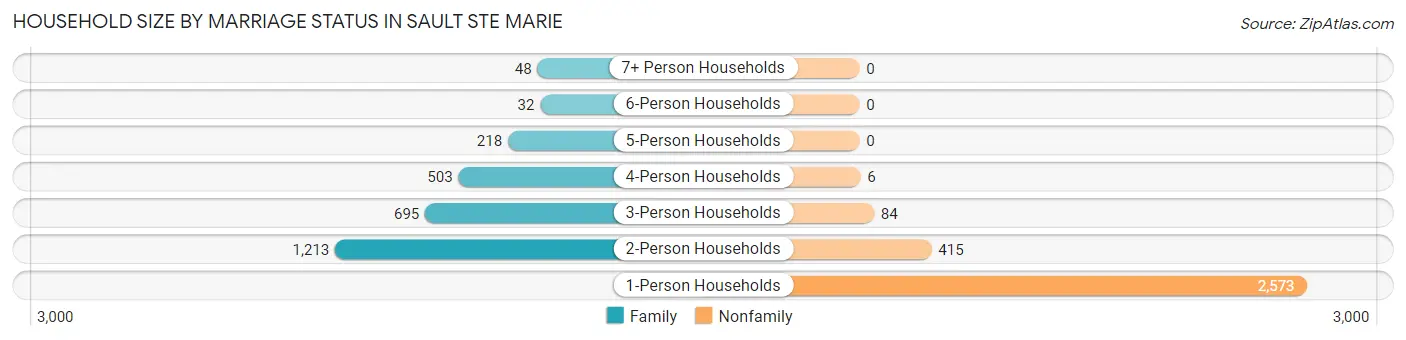
| Household Size | Family Households | Nonfamily Households |
| 1-Person Households | - | 2,573 (44.5%) |
| 2-Person Households | 1,213 (21.0%) | 415 (7.2%) |
| 3-Person Households | 695 (12.0%) | 84 (1.5%) |
| 4-Person Households | 503 (8.7%) | 6 (0.1%) |
| 5-Person Households | 218 (3.8%) | 0 (0.0%) |
| 6-Person Households | 32 (0.5%) | 0 (0.0%) |
| 7+ Person Households | 48 (0.8%) | 0 (0.0%) |
| Total | 2,709 (46.8%) | 3,078 (53.2%) |
Female Fertility in Sault Ste Marie
Fertility by Age in Sault Ste Marie
Average fertility rate in Sault Ste Marie is 58.0 births per 1,000 women. Women in the age bracket of 20 to 34 years have the highest fertility rate with 101.0 births per 1,000 women. Women in the age bracket of 20 to 34 years acount for 88.1% of all women with births.
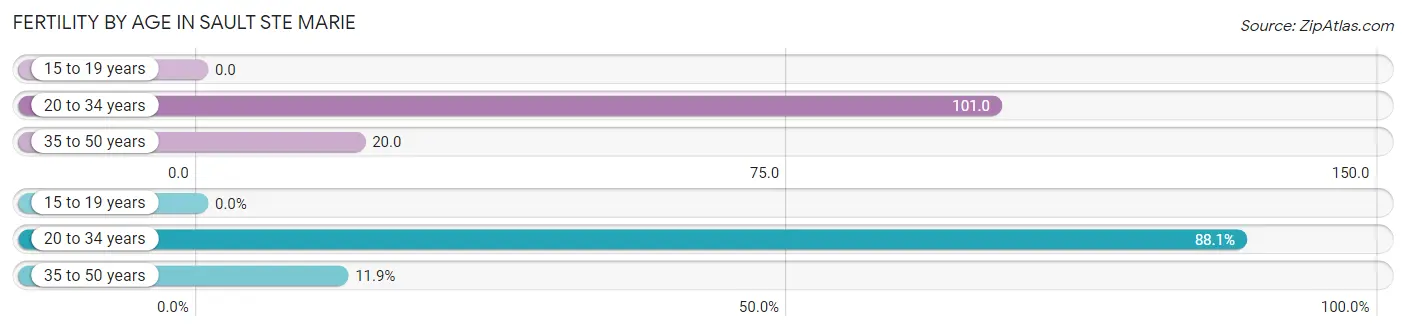
| Age Bracket | Women with Births | Births / 1,000 Women |
| 15 to 19 years | 0 (0.0%) | 0.0 |
| 20 to 34 years | 163 (88.1%) | 101.0 |
| 35 to 50 years | 22 (11.9%) | 20.0 |
| Total | 185 (100.0%) | 58.0 |
Fertility by Age by Marriage Status in Sault Ste Marie
83.2% of women with births (185) in Sault Ste Marie are married. The highest percentage of unmarried women with births falls into 35 to 50 years age bracket with 54.5% of them unmarried at the time of birth, while the lowest percentage of unmarried women with births belong to 20 to 34 years age bracket with 11.7% of them unmarried.
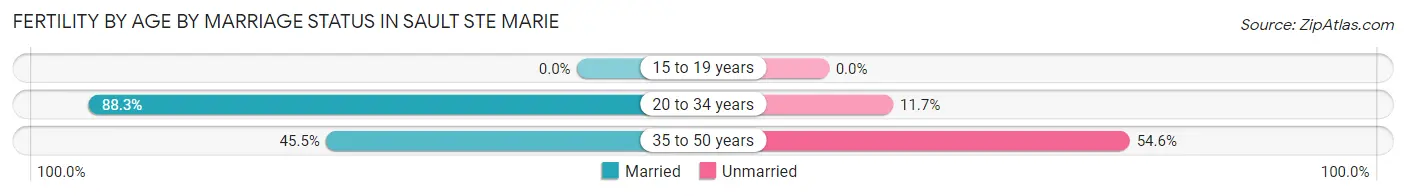
| Age Bracket | Married | Unmarried |
| 15 to 19 years | 0 (0.0%) | 0 (0.0%) |
| 20 to 34 years | 144 (88.3%) | 19 (11.7%) |
| 35 to 50 years | 10 (45.5%) | 12 (54.5%) |
| Total | 154 (83.2%) | 31 (16.8%) |
Fertility by Education in Sault Ste Marie
Average fertility rate in Sault Ste Marie is 58.0 births per 1,000 women. Women with the education attainment of less than high school have the highest fertility rate of 97.0 births per 1,000 women, while women with the education attainment of high school diploma have the lowest fertility at 12.0 births per 1,000 women. Women with the education attainment of college or associate's degree represent 53.0% of all women with births.
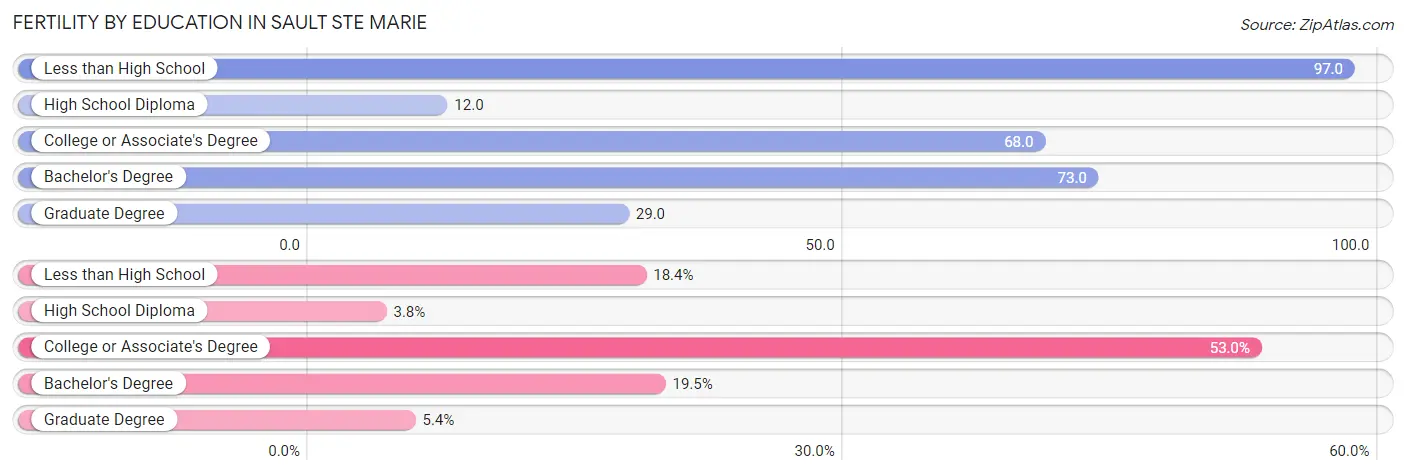
| Educational Attainment | Women with Births | Births / 1,000 Women |
| Less than High School | 34 (18.4%) | 97.0 |
| High School Diploma | 7 (3.8%) | 12.0 |
| College or Associate's Degree | 98 (53.0%) | 68.0 |
| Bachelor's Degree | 36 (19.5%) | 73.0 |
| Graduate Degree | 10 (5.4%) | 29.0 |
| Total | 185 (100.0%) | 58.0 |
Fertility by Education by Marriage Status in Sault Ste Marie
16.8% of women with births in Sault Ste Marie are unmarried. Women with the educational attainment of less than high school are most likely to be married with 100.0% of them married at childbirth, while women with the educational attainment of high school diploma are least likely to be married with 100.0% of them unmarried at childbirth.
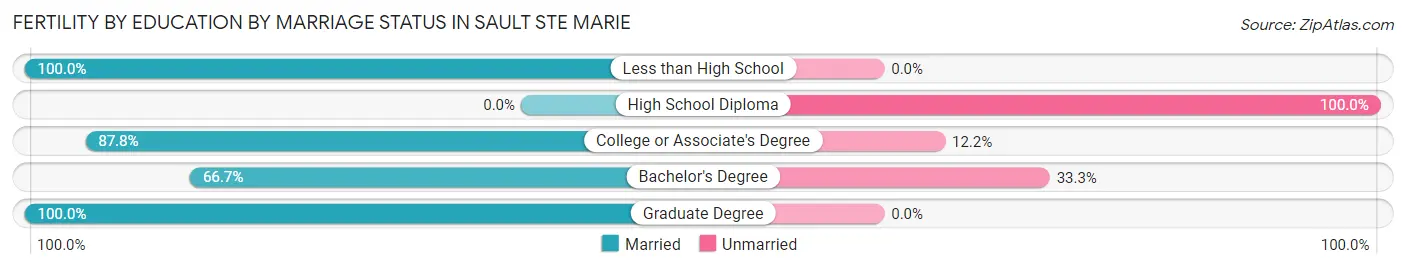
| Educational Attainment | Married | Unmarried |
| Less than High School | 34 (100.0%) | 0 (0.0%) |
| High School Diploma | 0 (0.0%) | 7 (100.0%) |
| College or Associate's Degree | 86 (87.8%) | 12 (12.2%) |
| Bachelor's Degree | 24 (66.7%) | 12 (33.3%) |
| Graduate Degree | 10 (100.0%) | 0 (0.0%) |
| Total | 154 (83.2%) | 31 (16.8%) |
Employment Characteristics in Sault Ste Marie
Employment by Class of Employer in Sault Ste Marie
Among the 6,442 employed individuals in Sault Ste Marie, private company employees (3,824 | 59.4%), state government employees (753 | 11.7%), and not-for-profit organizations (576 | 8.9%) make up the most common classes of employment.
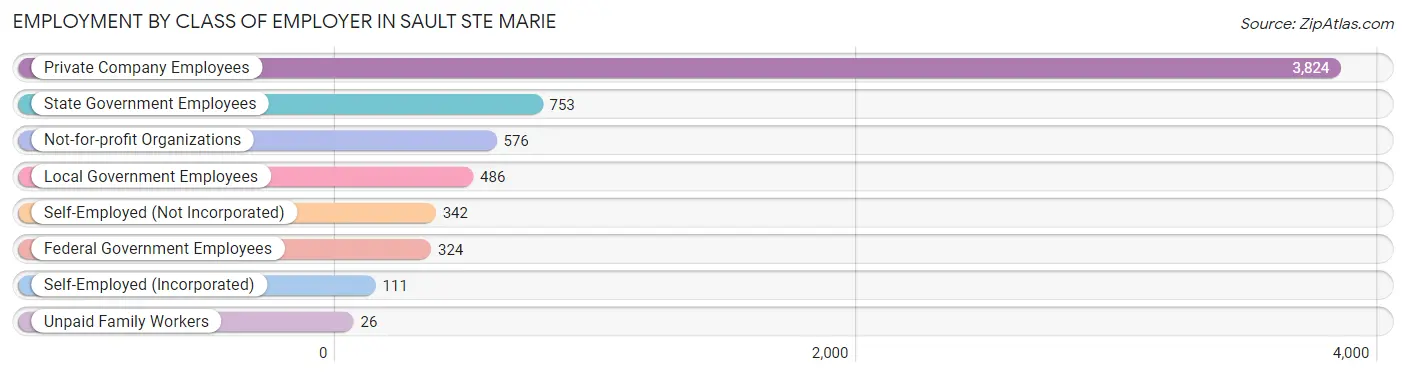
| Employer Class | # Employees | % Employees |
| Private Company Employees | 3,824 | 59.4% |
| Self-Employed (Incorporated) | 111 | 1.7% |
| Self-Employed (Not Incorporated) | 342 | 5.3% |
| Not-for-profit Organizations | 576 | 8.9% |
| Local Government Employees | 486 | 7.5% |
| State Government Employees | 753 | 11.7% |
| Federal Government Employees | 324 | 5.0% |
| Unpaid Family Workers | 26 | 0.4% |
| Total | 6,442 | 100.0% |
Employment Status by Age in Sault Ste Marie
According to the labor force statistics for Sault Ste Marie, out of the total population over 16 years of age (11,116), 63.7% or 7,081 individuals are in the labor force, with 7.5% or 531 of them unemployed. The age group with the highest labor force participation rate is 35 to 44 years, with 87.6% or 1,192 individuals in the labor force. Within the labor force, the 20 to 24 years age range has the highest percentage of unemployed individuals, with 15.2% or 161 of them being unemployed.
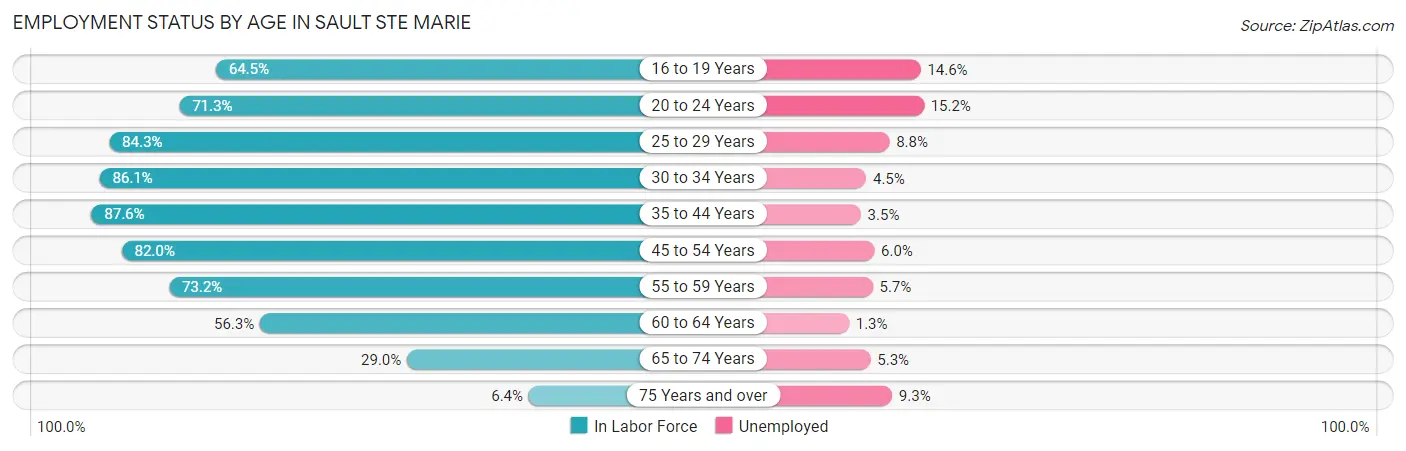
| Age Bracket | In Labor Force | Unemployed |
| 16 to 19 Years | 546 (64.5%) | 80 (14.6%) |
| 20 to 24 Years | 1,060 (71.3%) | 161 (15.2%) |
| 25 to 29 Years | 986 (84.3%) | 87 (8.8%) |
| 30 to 34 Years | 752 (86.1%) | 34 (4.5%) |
| 35 to 44 Years | 1,192 (87.6%) | 42 (3.5%) |
| 45 to 54 Years | 1,018 (82.0%) | 61 (6.0%) |
| 55 to 59 Years | 613 (73.2%) | 35 (5.7%) |
| 60 to 64 Years | 466 (56.3%) | 6 (1.3%) |
| 65 to 74 Years | 376 (29.0%) | 20 (5.3%) |
| 75 Years and over | 75 (6.4%) | 7 (9.3%) |
| Total | 7,081 (63.7%) | 531 (7.5%) |
Employment Status by Educational Attainment in Sault Ste Marie
According to labor force statistics for Sault Ste Marie, 79.7% of individuals (5,029) out of the total population between 25 and 64 years of age (6,310) are in the labor force, with 5.3% or 267 of them being unemployed. The group with the highest labor force participation rate are those with the educational attainment of bachelor's degree or higher, with 87.2% or 1,523 individuals in the labor force. Within the labor force, individuals with less than high school education have the highest percentage of unemployment, with 11.7% or 21 of them being unemployed.
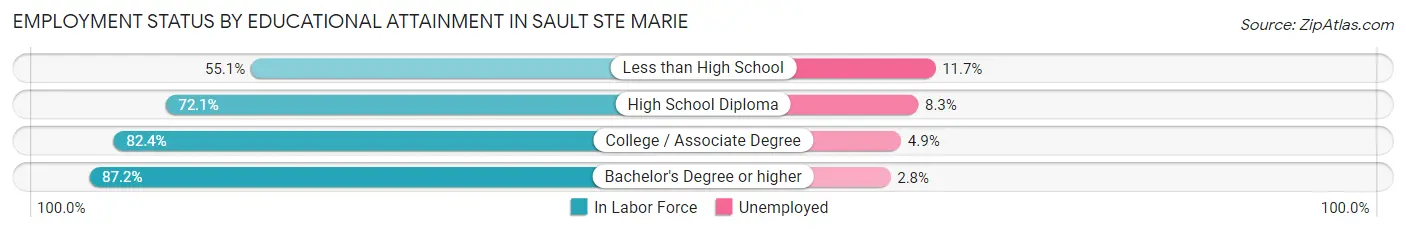
| Educational Attainment | In Labor Force | Unemployed |
| Less than High School | 179 (55.1%) | 38 (11.7%) |
| High School Diploma | 1,164 (72.1%) | 134 (8.3%) |
| College / Associate Degree | 2,162 (82.4%) | 129 (4.9%) |
| Bachelor's Degree or higher | 1,523 (87.2%) | 49 (2.8%) |
| Total | 5,029 (79.7%) | 334 (5.3%) |
Employment Occupations by Sex in Sault Ste Marie
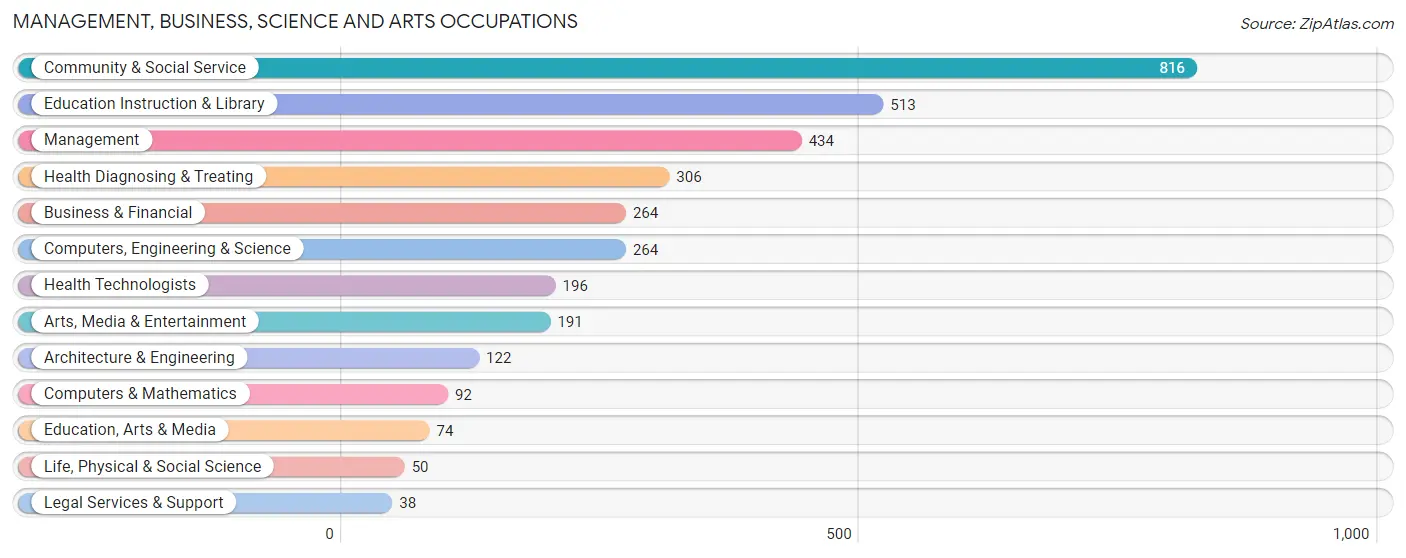
Management, Business, Science and Arts Occupations
The most common Management, Business, Science and Arts occupations in Sault Ste Marie are Community & Social Service (816 | 12.7%), Education Instruction & Library (513 | 8.0%), Management (434 | 6.7%), Health Diagnosing & Treating (306 | 4.7%), and Business & Financial (264 | 4.1%).
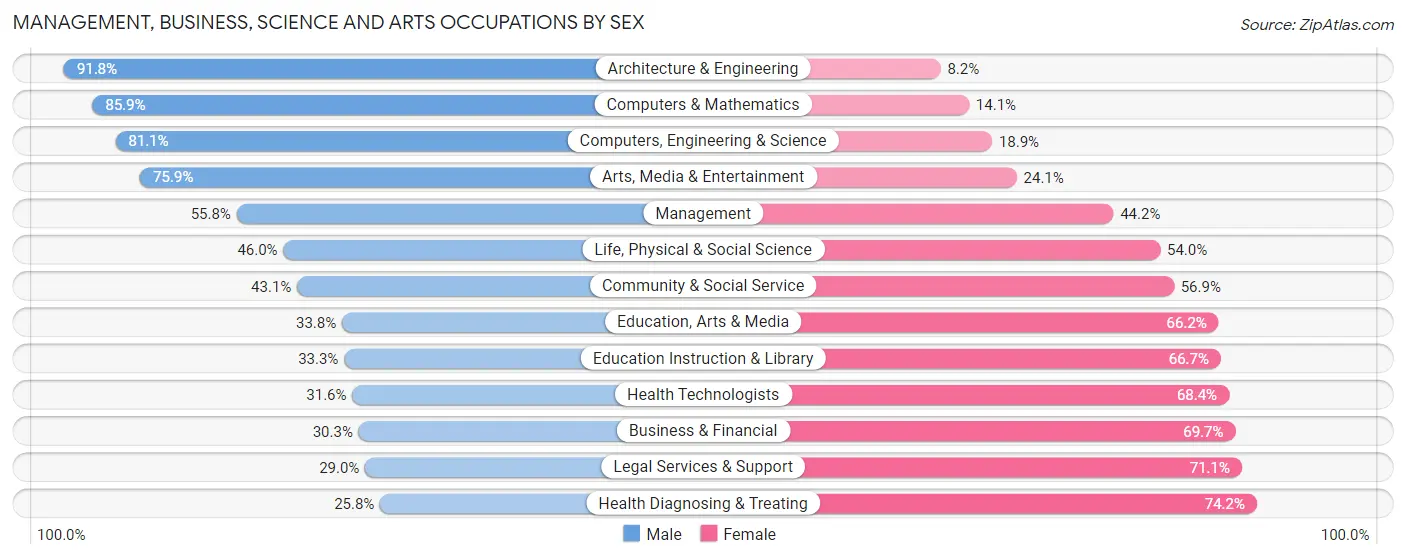
Management, Business, Science and Arts Occupations by Sex
Within the Management, Business, Science and Arts occupations in Sault Ste Marie, the most male-oriented occupations are Architecture & Engineering (91.8%), Computers & Mathematics (85.9%), and Computers, Engineering & Science (81.1%), while the most female-oriented occupations are Health Diagnosing & Treating (74.2%), Legal Services & Support (71.1%), and Business & Financial (69.7%).
| Occupation | Male | Female |
| Management | 242 (55.8%) | 192 (44.2%) |
| Business & Financial | 80 (30.3%) | 184 (69.7%) |
| Computers, Engineering & Science | 214 (81.1%) | 50 (18.9%) |
| Computers & Mathematics | 79 (85.9%) | 13 (14.1%) |
| Architecture & Engineering | 112 (91.8%) | 10 (8.2%) |
| Life, Physical & Social Science | 23 (46.0%) | 27 (54.0%) |
| Community & Social Service | 352 (43.1%) | 464 (56.9%) |
| Education, Arts & Media | 25 (33.8%) | 49 (66.2%) |
| Legal Services & Support | 11 (28.9%) | 27 (71.1%) |
| Education Instruction & Library | 171 (33.3%) | 342 (66.7%) |
| Arts, Media & Entertainment | 145 (75.9%) | 46 (24.1%) |
| Health Diagnosing & Treating | 79 (25.8%) | 227 (74.2%) |
| Health Technologists | 62 (31.6%) | 134 (68.4%) |
| Total (Category) | 967 (46.4%) | 1,117 (53.6%) |
| Total (Overall) | 3,354 (52.0%) | 3,097 (48.0%) |
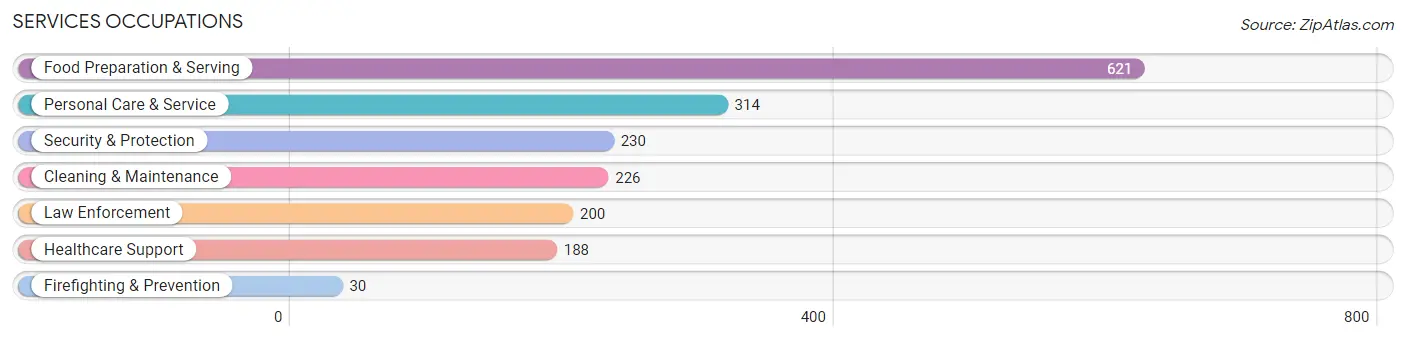
Services Occupations
The most common Services occupations in Sault Ste Marie are Food Preparation & Serving (621 | 9.6%), Personal Care & Service (314 | 4.9%), Security & Protection (230 | 3.6%), Cleaning & Maintenance (226 | 3.5%), and Law Enforcement (200 | 3.1%).
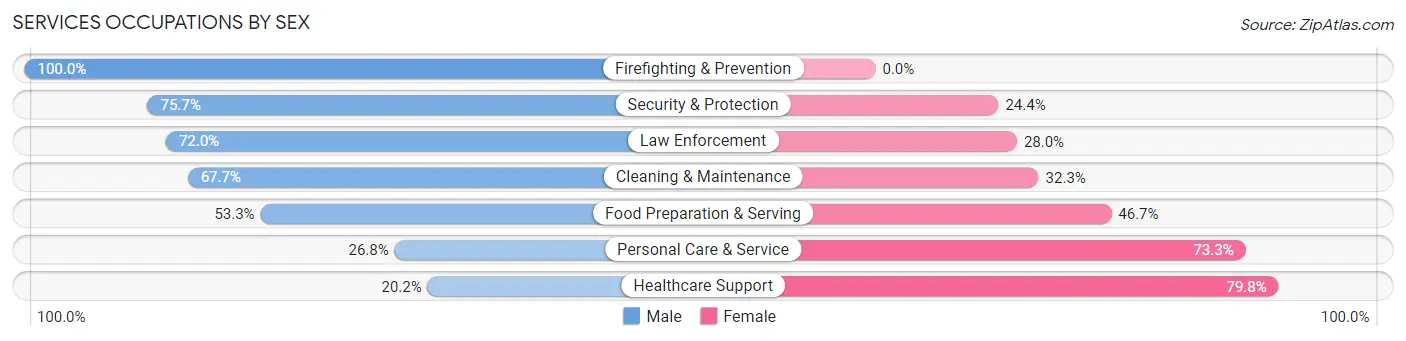
Services Occupations by Sex
Within the Services occupations in Sault Ste Marie, the most male-oriented occupations are Firefighting & Prevention (100.0%), Security & Protection (75.6%), and Law Enforcement (72.0%), while the most female-oriented occupations are Healthcare Support (79.8%), Personal Care & Service (73.3%), and Food Preparation & Serving (46.7%).
| Occupation | Male | Female |
| Healthcare Support | 38 (20.2%) | 150 (79.8%) |
| Security & Protection | 174 (75.6%) | 56 (24.3%) |
| Firefighting & Prevention | 30 (100.0%) | 0 (0.0%) |
| Law Enforcement | 144 (72.0%) | 56 (28.0%) |
| Food Preparation & Serving | 331 (53.3%) | 290 (46.7%) |
| Cleaning & Maintenance | 153 (67.7%) | 73 (32.3%) |
| Personal Care & Service | 84 (26.8%) | 230 (73.3%) |
| Total (Category) | 780 (49.4%) | 799 (50.6%) |
| Total (Overall) | 3,354 (52.0%) | 3,097 (48.0%) |
Sales and Office Occupations
The most common Sales and Office occupations in Sault Ste Marie are Office & Administration (1,010 | 15.7%), and Sales & Related (597 | 9.2%).

Sales and Office Occupations by Sex
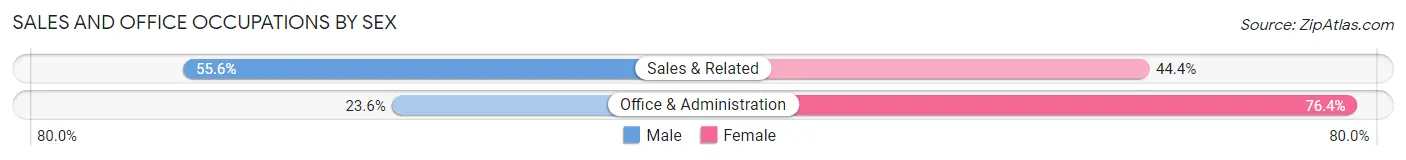
| Occupation | Male | Female |
| Sales & Related | 332 (55.6%) | 265 (44.4%) |
| Office & Administration | 238 (23.6%) | 772 (76.4%) |
| Total (Category) | 570 (35.5%) | 1,037 (64.5%) |
| Total (Overall) | 3,354 (52.0%) | 3,097 (48.0%) |
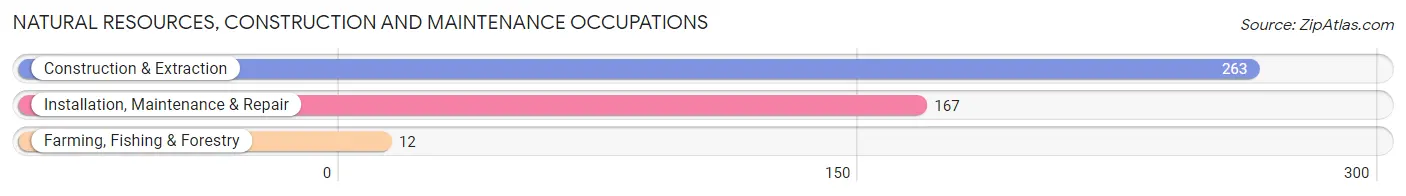
Natural Resources, Construction and Maintenance Occupations
The most common Natural Resources, Construction and Maintenance occupations in Sault Ste Marie are Construction & Extraction (263 | 4.1%), Installation, Maintenance & Repair (167 | 2.6%), and Farming, Fishing & Forestry (12 | 0.2%).
Natural Resources, Construction and Maintenance Occupations by Sex
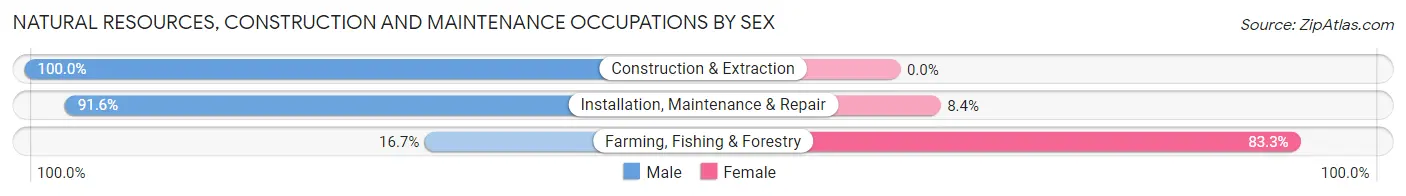
| Occupation | Male | Female |
| Farming, Fishing & Forestry | 2 (16.7%) | 10 (83.3%) |
| Construction & Extraction | 263 (100.0%) | 0 (0.0%) |
| Installation, Maintenance & Repair | 153 (91.6%) | 14 (8.4%) |
| Total (Category) | 418 (94.6%) | 24 (5.4%) |
| Total (Overall) | 3,354 (52.0%) | 3,097 (48.0%) |
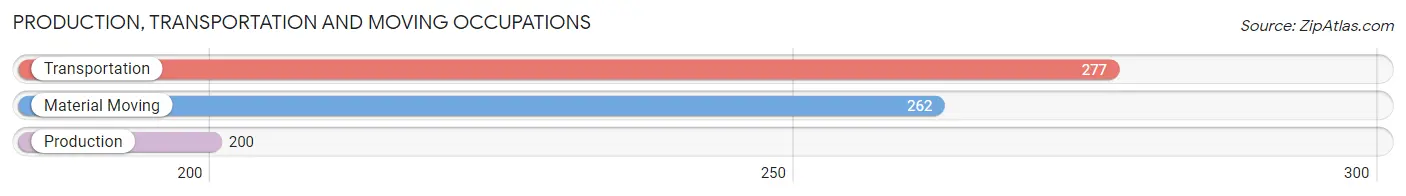
Production, Transportation and Moving Occupations
The most common Production, Transportation and Moving occupations in Sault Ste Marie are Transportation (277 | 4.3%), Material Moving (262 | 4.1%), and Production (200 | 3.1%).
Production, Transportation and Moving Occupations by Sex
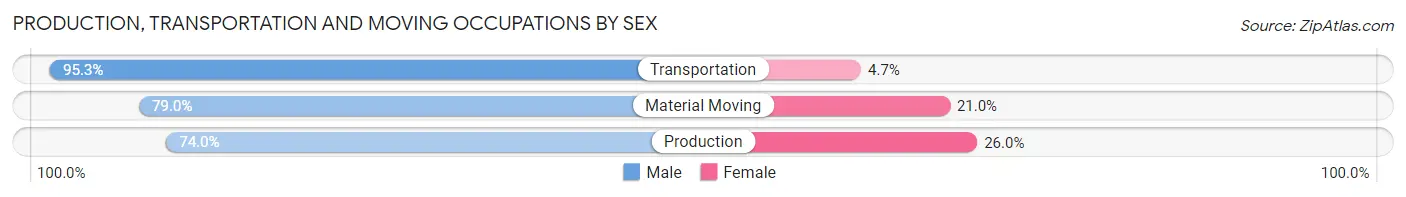
| Occupation | Male | Female |
| Production | 148 (74.0%) | 52 (26.0%) |
| Transportation | 264 (95.3%) | 13 (4.7%) |
| Material Moving | 207 (79.0%) | 55 (21.0%) |
| Total (Category) | 619 (83.8%) | 120 (16.2%) |
| Total (Overall) | 3,354 (52.0%) | 3,097 (48.0%) |
Employment Industries by Sex in Sault Ste Marie
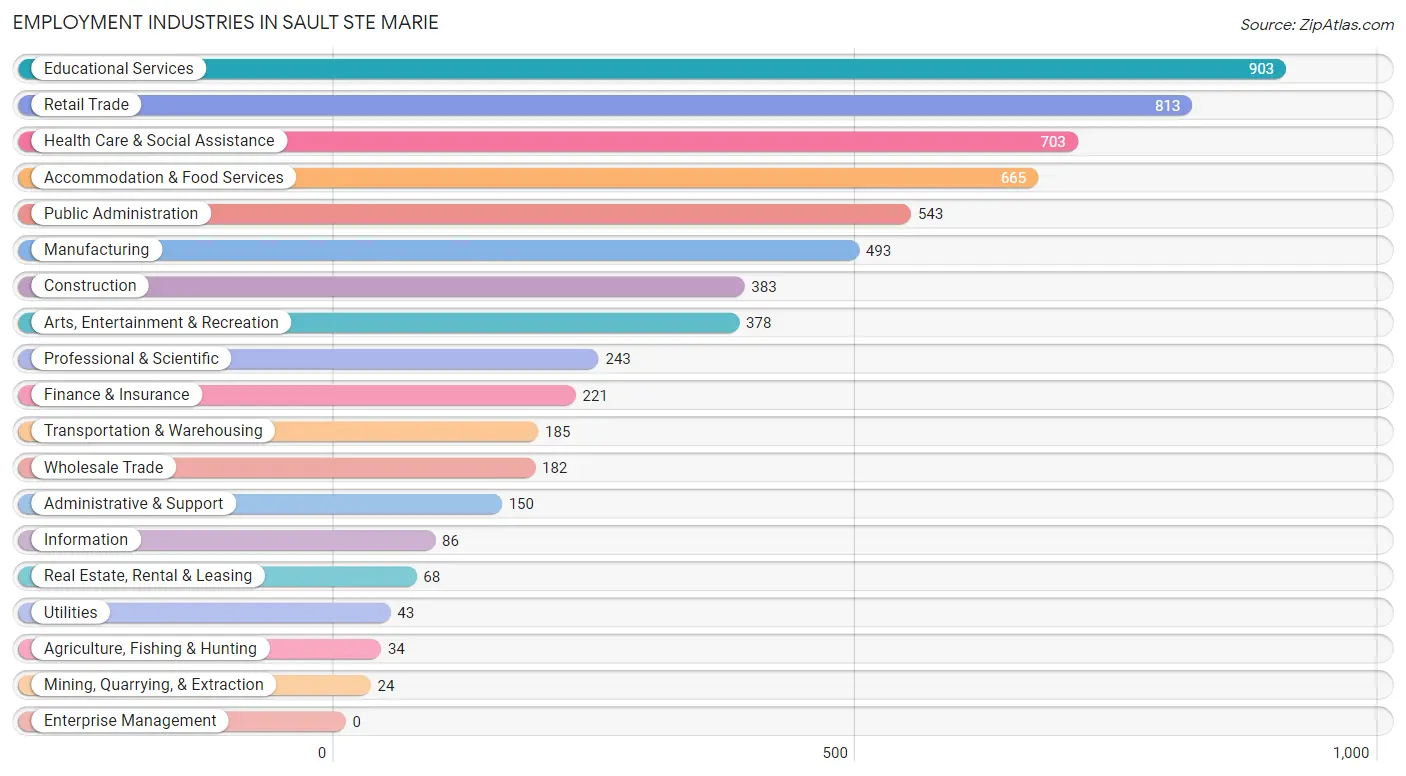
Employment Industries in Sault Ste Marie
The major employment industries in Sault Ste Marie include Educational Services (903 | 14.0%), Retail Trade (813 | 12.6%), Health Care & Social Assistance (703 | 10.9%), Accommodation & Food Services (665 | 10.3%), and Public Administration (543 | 8.4%).
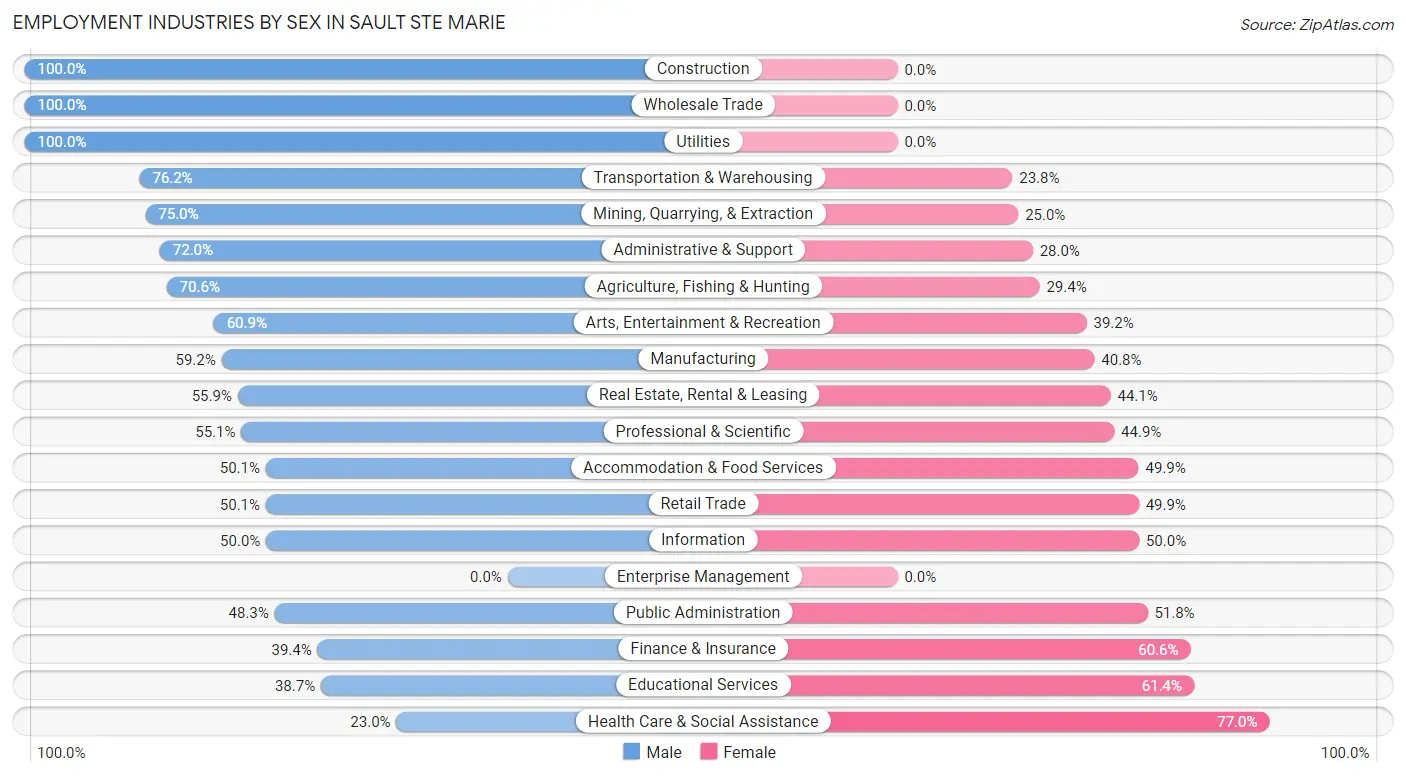
Employment Industries by Sex in Sault Ste Marie
The Sault Ste Marie industries that see more men than women are Construction (100.0%), Wholesale Trade (100.0%), and Utilities (100.0%), whereas the industries that tend to have a higher number of women are Health Care & Social Assistance (77.0%), Educational Services (61.4%), and Finance & Insurance (60.6%).
| Industry | Male | Female |
| Agriculture, Fishing & Hunting | 24 (70.6%) | 10 (29.4%) |
| Mining, Quarrying, & Extraction | 18 (75.0%) | 6 (25.0%) |
| Construction | 383 (100.0%) | 0 (0.0%) |
| Manufacturing | 292 (59.2%) | 201 (40.8%) |
| Wholesale Trade | 182 (100.0%) | 0 (0.0%) |
| Retail Trade | 407 (50.1%) | 406 (49.9%) |
| Transportation & Warehousing | 141 (76.2%) | 44 (23.8%) |
| Utilities | 43 (100.0%) | 0 (0.0%) |
| Information | 43 (50.0%) | 43 (50.0%) |
| Finance & Insurance | 87 (39.4%) | 134 (60.6%) |
| Real Estate, Rental & Leasing | 38 (55.9%) | 30 (44.1%) |
| Professional & Scientific | 134 (55.1%) | 109 (44.9%) |
| Enterprise Management | 0 (0.0%) | 0 (0.0%) |
| Administrative & Support | 108 (72.0%) | 42 (28.0%) |
| Educational Services | 349 (38.7%) | 554 (61.4%) |
| Health Care & Social Assistance | 162 (23.0%) | 541 (77.0%) |
| Arts, Entertainment & Recreation | 230 (60.9%) | 148 (39.2%) |
| Accommodation & Food Services | 333 (50.1%) | 332 (49.9%) |
| Public Administration | 262 (48.2%) | 281 (51.7%) |
| Total | 3,354 (52.0%) | 3,097 (48.0%) |
Education in Sault Ste Marie
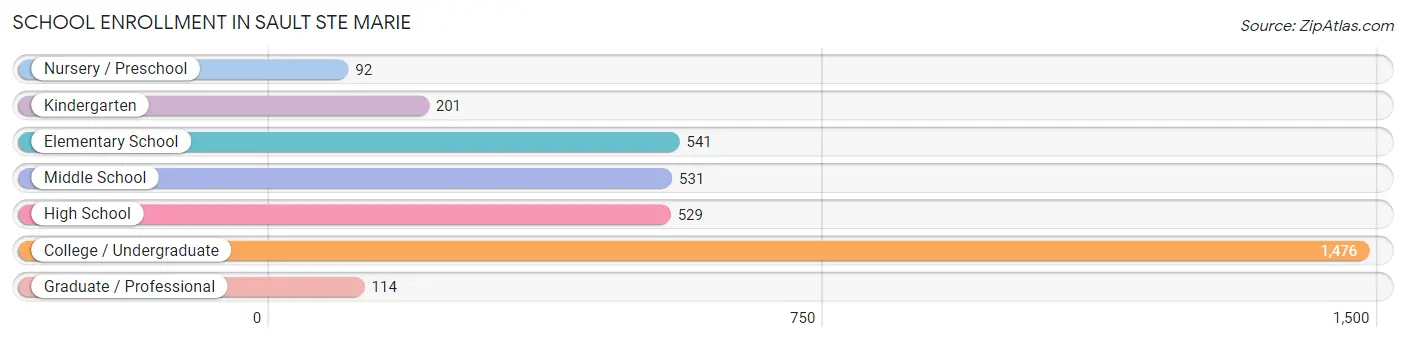
School Enrollment in Sault Ste Marie
The most common levels of schooling among the 3,484 students in Sault Ste Marie are college / undergraduate (1,476 | 42.4%), elementary school (541 | 15.5%), and middle school (531 | 15.2%).
| School Level | # Students | % Students |
| Nursery / Preschool | 92 | 2.6% |
| Kindergarten | 201 | 5.8% |
| Elementary School | 541 | 15.5% |
| Middle School | 531 | 15.2% |
| High School | 529 | 15.2% |
| College / Undergraduate | 1,476 | 42.4% |
| Graduate / Professional | 114 | 3.3% |
| Total | 3,484 | 100.0% |
School Enrollment by Age by Funding Source in Sault Ste Marie
Out of a total of 3,484 students who are enrolled in schools in Sault Ste Marie, 596 (17.1%) attend a private institution, while the remaining 2,888 (82.9%) are enrolled in public schools. The age group of 5 to 9 year old has the highest likelihood of being enrolled in private schools, with 277 (39.4% in the age bracket) enrolled. Conversely, the age group of 20 to 24 year olds has the lowest likelihood of being enrolled in a private school, with 685 (98.4% in the age bracket) attending a public institution.
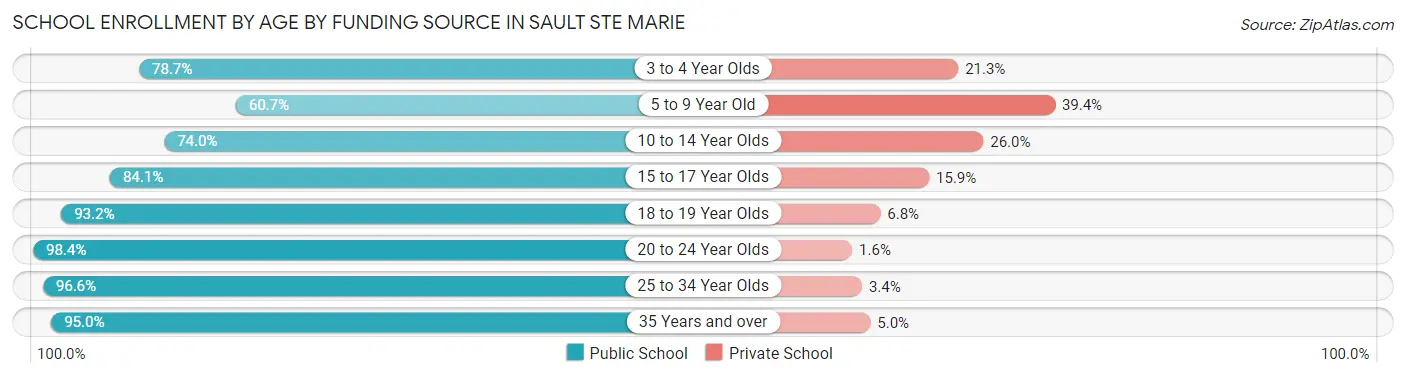
| Age Bracket | Public School | Private School |
| 3 to 4 Year Olds | 59 (78.7%) | 16 (21.3%) |
| 5 to 9 Year Old | 427 (60.7%) | 277 (39.4%) |
| 10 to 14 Year Olds | 529 (74.0%) | 186 (26.0%) |
| 15 to 17 Year Olds | 259 (84.1%) | 49 (15.9%) |
| 18 to 19 Year Olds | 559 (93.2%) | 41 (6.8%) |
| 20 to 24 Year Olds | 685 (98.4%) | 11 (1.6%) |
| 25 to 34 Year Olds | 198 (96.6%) | 7 (3.4%) |
| 35 Years and over | 172 (95.0%) | 9 (5.0%) |
| Total | 2,888 (82.9%) | 596 (17.1%) |
Educational Attainment by Field of Study in Sault Ste Marie
Business (425 | 16.9%), science & technology (325 | 12.9%), education (322 | 12.8%), engineering (246 | 9.8%), and bio, nature & agricultural (222 | 8.8%) are the most common fields of study among 2,517 individuals in Sault Ste Marie who have obtained a bachelor's degree or higher.
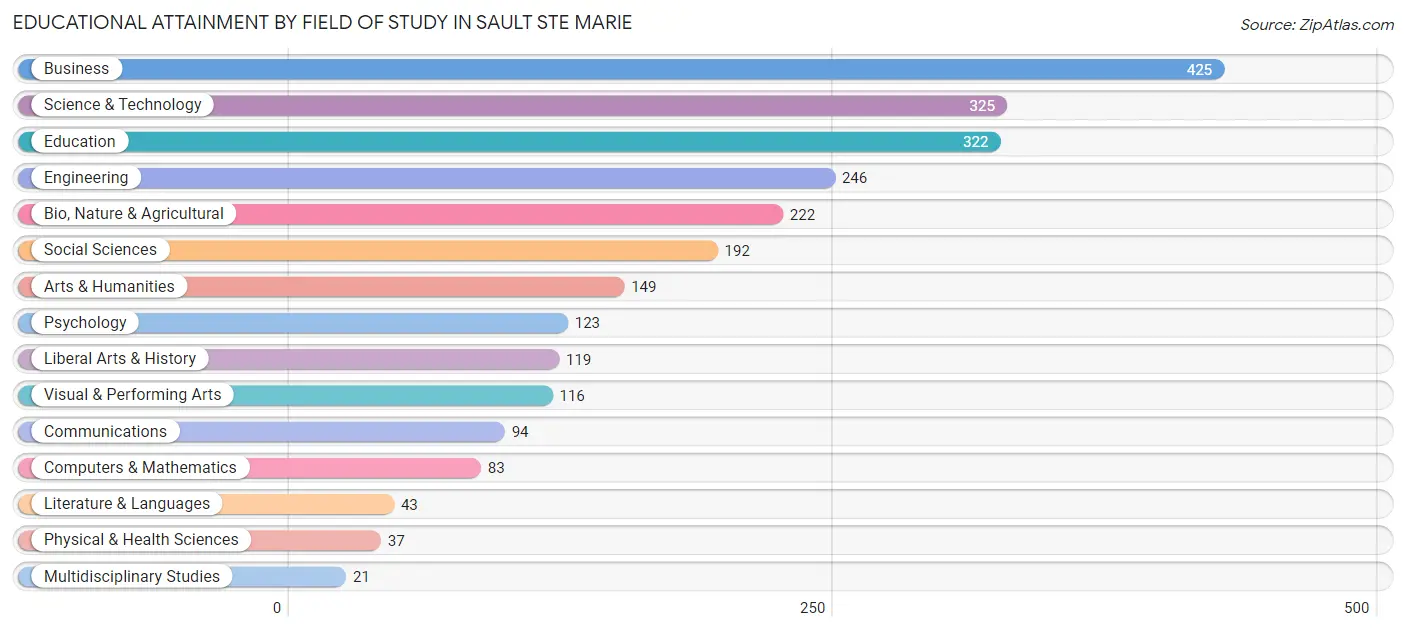
| Field of Study | # Graduates | % Graduates |
| Computers & Mathematics | 83 | 3.3% |
| Bio, Nature & Agricultural | 222 | 8.8% |
| Physical & Health Sciences | 37 | 1.5% |
| Psychology | 123 | 4.9% |
| Social Sciences | 192 | 7.6% |
| Engineering | 246 | 9.8% |
| Multidisciplinary Studies | 21 | 0.8% |
| Science & Technology | 325 | 12.9% |
| Business | 425 | 16.9% |
| Education | 322 | 12.8% |
| Literature & Languages | 43 | 1.7% |
| Liberal Arts & History | 119 | 4.7% |
| Visual & Performing Arts | 116 | 4.6% |
| Communications | 94 | 3.7% |
| Arts & Humanities | 149 | 5.9% |
| Total | 2,517 | 100.0% |
Transportation & Commute in Sault Ste Marie
Vehicle Availability by Sex in Sault Ste Marie
The most prevalent vehicle ownership categories in Sault Ste Marie are males with 2 vehicles (1,543, accounting for 48.0%) and females with 2 vehicles (1,322, making up 53.1%).
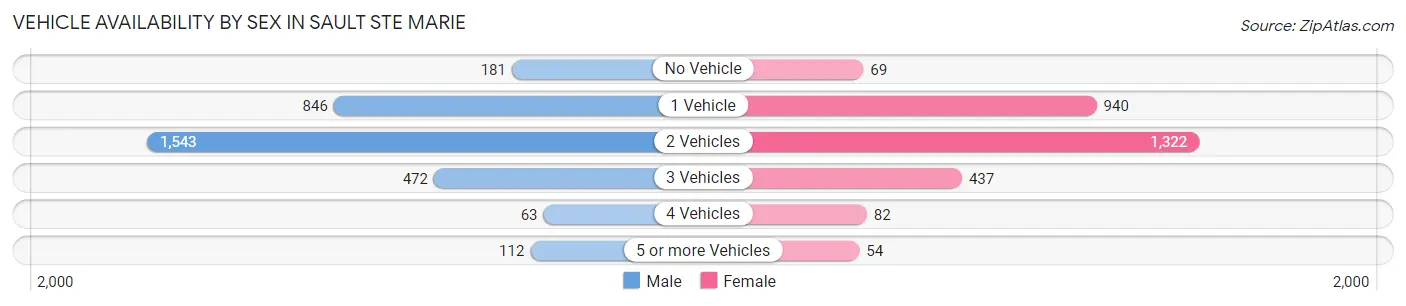
| Vehicles Available | Male | Female |
| No Vehicle | 181 (5.6%) | 69 (2.4%) |
| 1 Vehicle | 846 (26.3%) | 940 (32.4%) |
| 2 Vehicles | 1,543 (48.0%) | 1,322 (45.5%) |
| 3 Vehicles | 472 (14.7%) | 437 (15.0%) |
| 4 Vehicles | 63 (2.0%) | 82 (2.8%) |
| 5 or more Vehicles | 112 (3.5%) | 54 (1.9%) |
| Total | 3,217 (100.0%) | 2,904 (100.0%) |
Commute Time in Sault Ste Marie
The most frequently occuring commute durations in Sault Ste Marie are 5 to 9 minutes (2,314 commuters, 37.9%), 10 to 14 minutes (1,265 commuters, 20.7%), and 15 to 19 minutes (737 commuters, 12.1%).
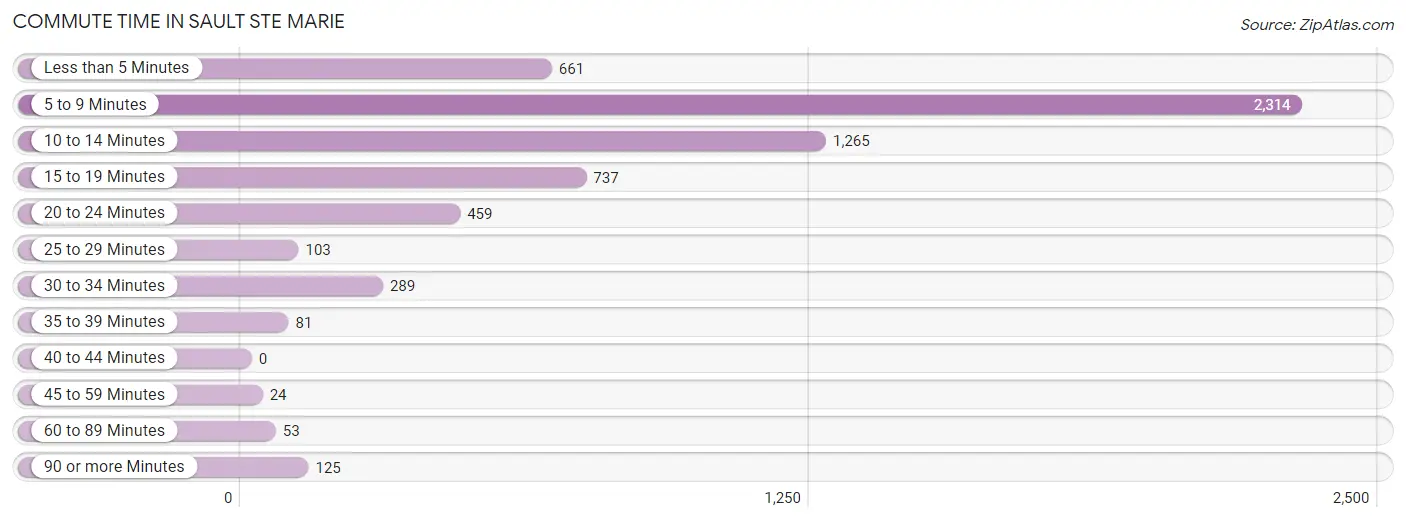
| Commute Time | # Commuters | % Commuters |
| Less than 5 Minutes | 661 | 10.8% |
| 5 to 9 Minutes | 2,314 | 37.9% |
| 10 to 14 Minutes | 1,265 | 20.7% |
| 15 to 19 Minutes | 737 | 12.1% |
| 20 to 24 Minutes | 459 | 7.5% |
| 25 to 29 Minutes | 103 | 1.7% |
| 30 to 34 Minutes | 289 | 4.7% |
| 35 to 39 Minutes | 81 | 1.3% |
| 40 to 44 Minutes | 0 | 0.0% |
| 45 to 59 Minutes | 24 | 0.4% |
| 60 to 89 Minutes | 53 | 0.9% |
| 90 or more Minutes | 125 | 2.1% |
Commute Time by Sex in Sault Ste Marie
The most common commute times in Sault Ste Marie are 5 to 9 minutes (1,102 commuters, 34.6%) for males and 5 to 9 minutes (1,212 commuters, 41.5%) for females.
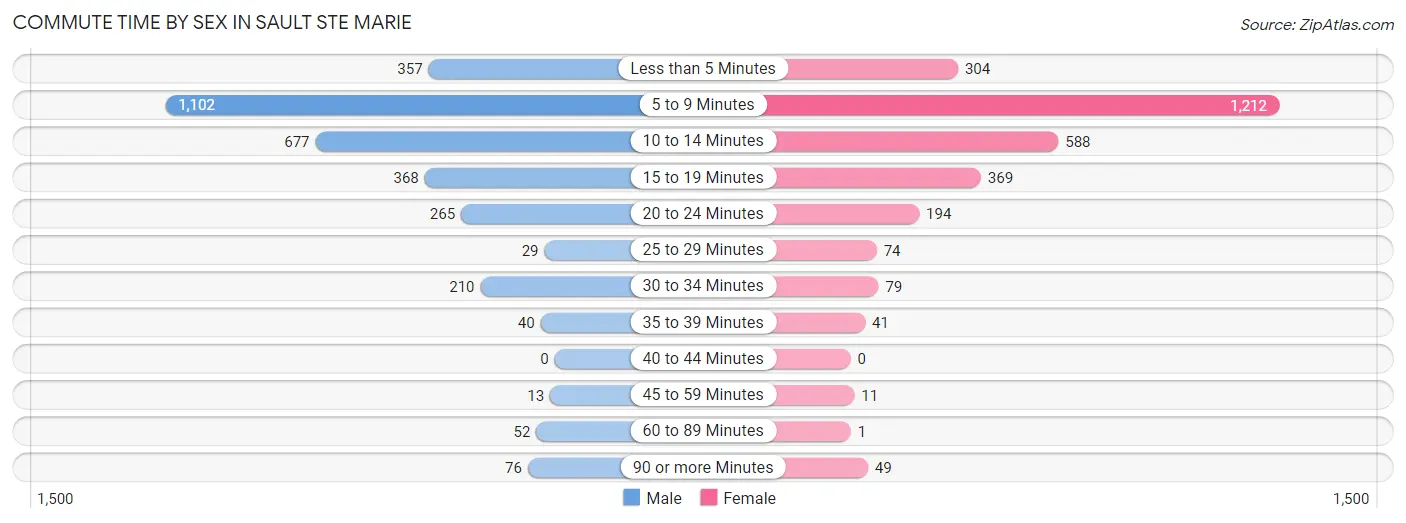
| Commute Time | Male | Female |
| Less than 5 Minutes | 357 (11.2%) | 304 (10.4%) |
| 5 to 9 Minutes | 1,102 (34.6%) | 1,212 (41.5%) |
| 10 to 14 Minutes | 677 (21.2%) | 588 (20.1%) |
| 15 to 19 Minutes | 368 (11.5%) | 369 (12.6%) |
| 20 to 24 Minutes | 265 (8.3%) | 194 (6.6%) |
| 25 to 29 Minutes | 29 (0.9%) | 74 (2.5%) |
| 30 to 34 Minutes | 210 (6.6%) | 79 (2.7%) |
| 35 to 39 Minutes | 40 (1.3%) | 41 (1.4%) |
| 40 to 44 Minutes | 0 (0.0%) | 0 (0.0%) |
| 45 to 59 Minutes | 13 (0.4%) | 11 (0.4%) |
| 60 to 89 Minutes | 52 (1.6%) | 1 (0.0%) |
| 90 or more Minutes | 76 (2.4%) | 49 (1.7%) |
Time of Departure to Work by Sex in Sault Ste Marie
The most frequent times of departure to work in Sault Ste Marie are 12:00 PM to 3:59 PM (516, 16.2%) for males and 7:30 AM to 7:59 AM (876, 30.0%) for females.
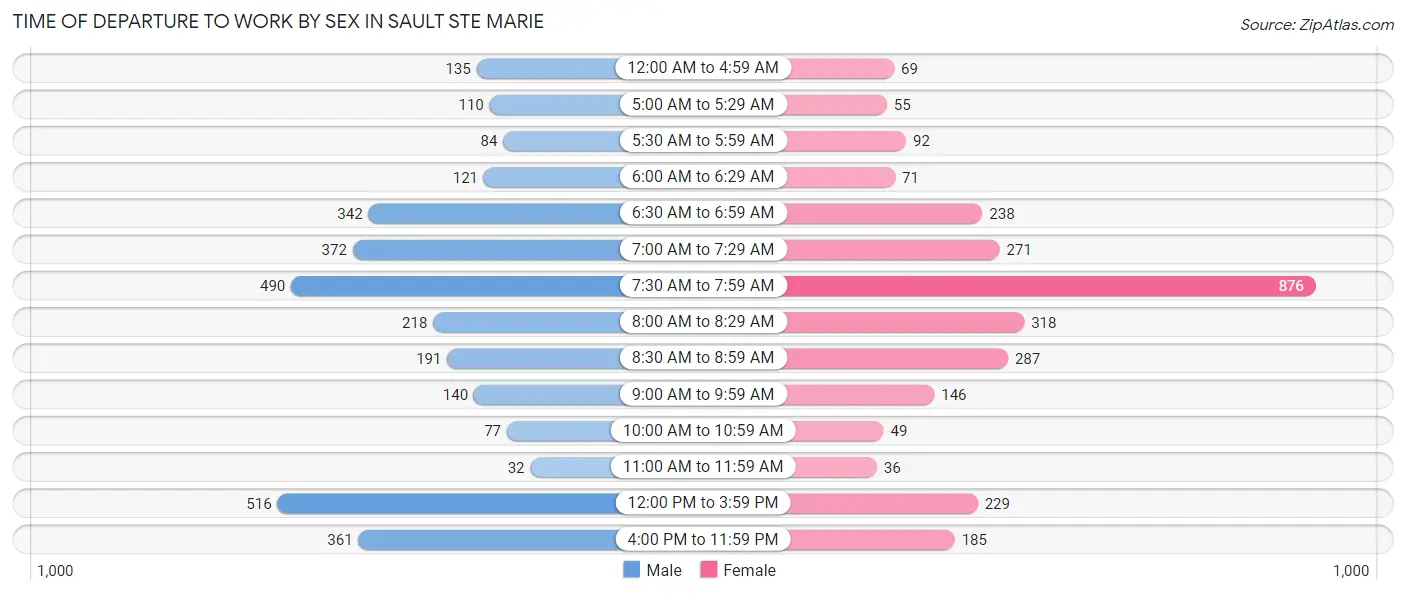
| Time of Departure | Male | Female |
| 12:00 AM to 4:59 AM | 135 (4.2%) | 69 (2.4%) |
| 5:00 AM to 5:29 AM | 110 (3.5%) | 55 (1.9%) |
| 5:30 AM to 5:59 AM | 84 (2.6%) | 92 (3.2%) |
| 6:00 AM to 6:29 AM | 121 (3.8%) | 71 (2.4%) |
| 6:30 AM to 6:59 AM | 342 (10.7%) | 238 (8.2%) |
| 7:00 AM to 7:29 AM | 372 (11.7%) | 271 (9.3%) |
| 7:30 AM to 7:59 AM | 490 (15.4%) | 876 (30.0%) |
| 8:00 AM to 8:29 AM | 218 (6.8%) | 318 (10.9%) |
| 8:30 AM to 8:59 AM | 191 (6.0%) | 287 (9.8%) |
| 9:00 AM to 9:59 AM | 140 (4.4%) | 146 (5.0%) |
| 10:00 AM to 10:59 AM | 77 (2.4%) | 49 (1.7%) |
| 11:00 AM to 11:59 AM | 32 (1.0%) | 36 (1.2%) |
| 12:00 PM to 3:59 PM | 516 (16.2%) | 229 (7.8%) |
| 4:00 PM to 11:59 PM | 361 (11.3%) | 185 (6.3%) |
| Total | 3,189 (100.0%) | 2,922 (100.0%) |
Housing Occupancy in Sault Ste Marie
Occupancy by Ownership in Sault Ste Marie
Of the total 5,787 dwellings in Sault Ste Marie, owner-occupied units account for 3,424 (59.2%), while renter-occupied units make up 2,363 (40.8%).
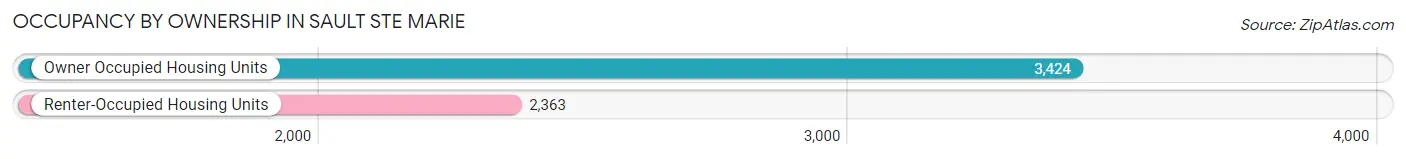
| Occupancy | # Housing Units | % Housing Units |
| Owner Occupied Housing Units | 3,424 | 59.2% |
| Renter-Occupied Housing Units | 2,363 | 40.8% |
| Total Occupied Housing Units | 5,787 | 100.0% |
Occupancy by Household Size in Sault Ste Marie
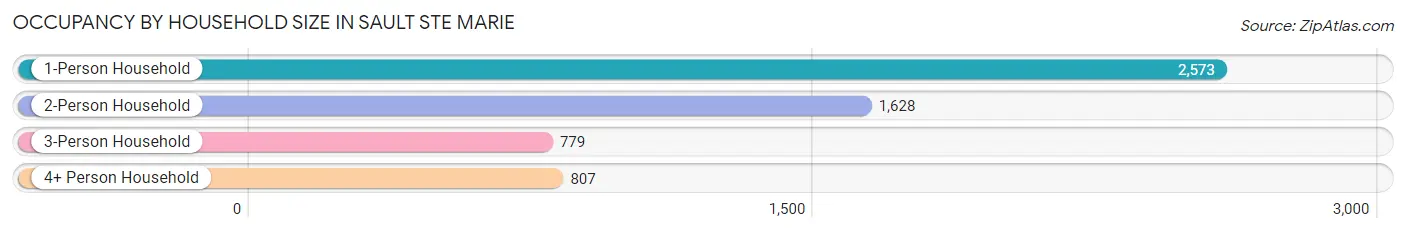
| Household Size | # Housing Units | % Housing Units |
| 1-Person Household | 2,573 | 44.5% |
| 2-Person Household | 1,628 | 28.1% |
| 3-Person Household | 779 | 13.5% |
| 4+ Person Household | 807 | 14.0% |
| Total Housing Units | 5,787 | 100.0% |
Occupancy by Ownership by Household Size in Sault Ste Marie
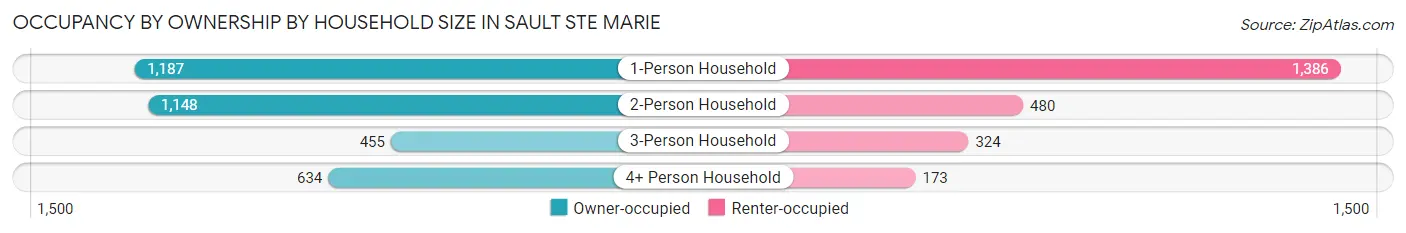
| Household Size | Owner-occupied | Renter-occupied |
| 1-Person Household | 1,187 (46.1%) | 1,386 (53.9%) |
| 2-Person Household | 1,148 (70.5%) | 480 (29.5%) |
| 3-Person Household | 455 (58.4%) | 324 (41.6%) |
| 4+ Person Household | 634 (78.6%) | 173 (21.4%) |
| Total Housing Units | 3,424 (59.2%) | 2,363 (40.8%) |
Occupancy by Educational Attainment in Sault Ste Marie
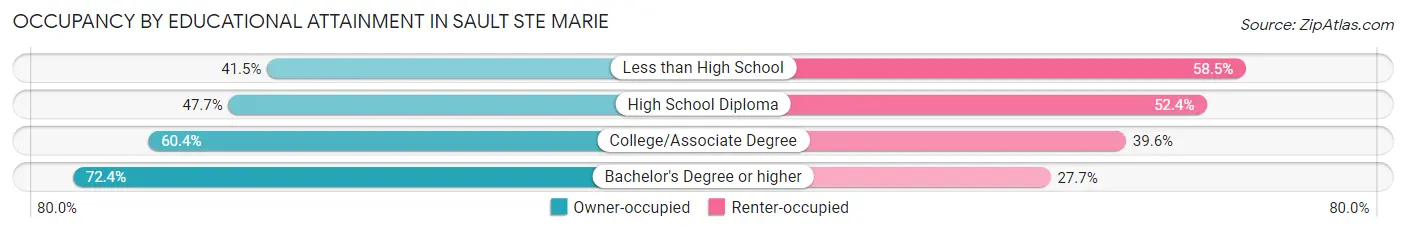
| Household Size | Owner-occupied | Renter-occupied |
| Less than High School | 127 (41.5%) | 179 (58.5%) |
| High School Diploma | 741 (47.6%) | 814 (52.3%) |
| College/Associate Degree | 1,436 (60.4%) | 942 (39.6%) |
| Bachelor's Degree or higher | 1,120 (72.4%) | 428 (27.7%) |
Occupancy by Age of Householder in Sault Ste Marie
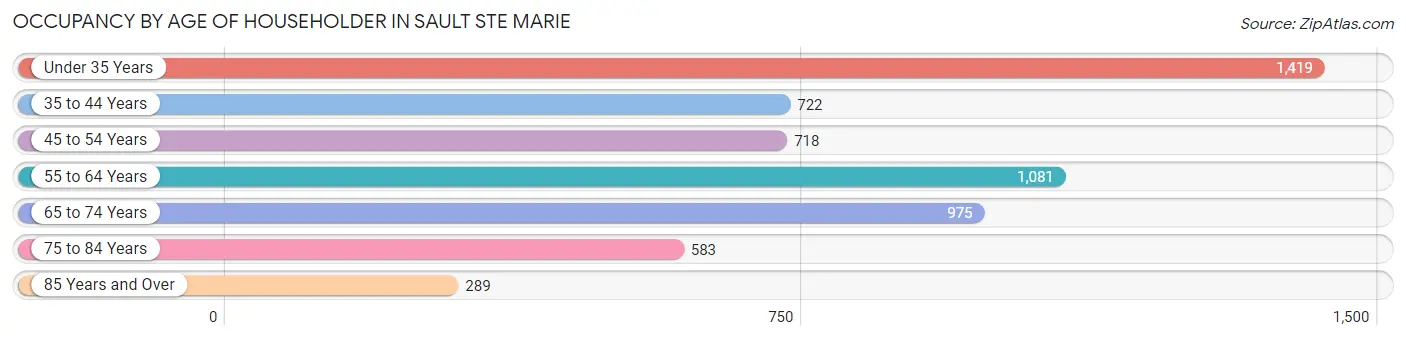
| Age Bracket | # Households | % Households |
| Under 35 Years | 1,419 | 24.5% |
| 35 to 44 Years | 722 | 12.5% |
| 45 to 54 Years | 718 | 12.4% |
| 55 to 64 Years | 1,081 | 18.7% |
| 65 to 74 Years | 975 | 16.9% |
| 75 to 84 Years | 583 | 10.1% |
| 85 Years and Over | 289 | 5.0% |
| Total | 5,787 | 100.0% |
Housing Finances in Sault Ste Marie
Median Income by Occupancy in Sault Ste Marie
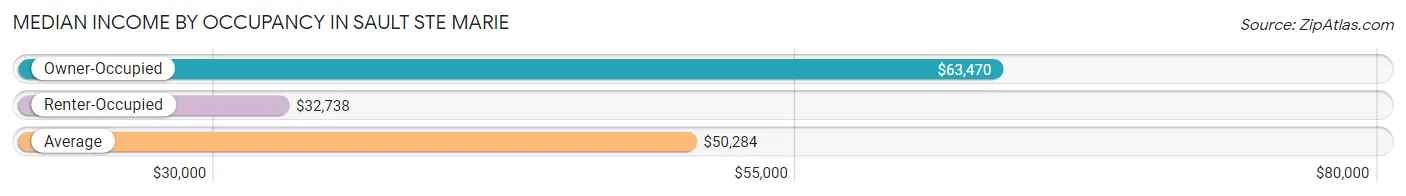
| Occupancy Type | # Households | Median Income |
| Owner-Occupied | 3,424 (59.2%) | $63,470 |
| Renter-Occupied | 2,363 (40.8%) | $32,738 |
| Average | 5,787 (100.0%) | $50,284 |
Occupancy by Householder Income Bracket in Sault Ste Marie
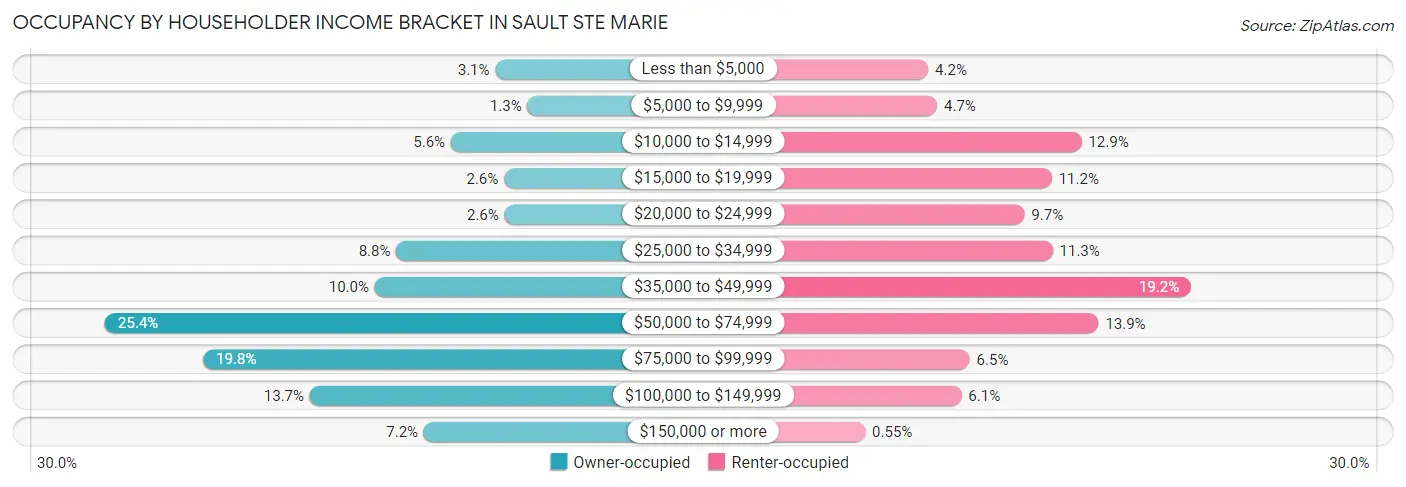
| Income Bracket | Owner-occupied | Renter-occupied |
| Less than $5,000 | 106 (3.1%) | 98 (4.2%) |
| $5,000 to $9,999 | 43 (1.3%) | 110 (4.7%) |
| $10,000 to $14,999 | 193 (5.6%) | 305 (12.9%) |
| $15,000 to $19,999 | 89 (2.6%) | 265 (11.2%) |
| $20,000 to $24,999 | 88 (2.6%) | 228 (9.7%) |
| $25,000 to $34,999 | 300 (8.8%) | 266 (11.3%) |
| $35,000 to $49,999 | 342 (10.0%) | 453 (19.2%) |
| $50,000 to $74,999 | 870 (25.4%) | 328 (13.9%) |
| $75,000 to $99,999 | 678 (19.8%) | 154 (6.5%) |
| $100,000 to $149,999 | 469 (13.7%) | 143 (6.0%) |
| $150,000 or more | 246 (7.2%) | 13 (0.5%) |
| Total | 3,424 (100.0%) | 2,363 (100.0%) |
Monthly Housing Cost Tiers in Sault Ste Marie
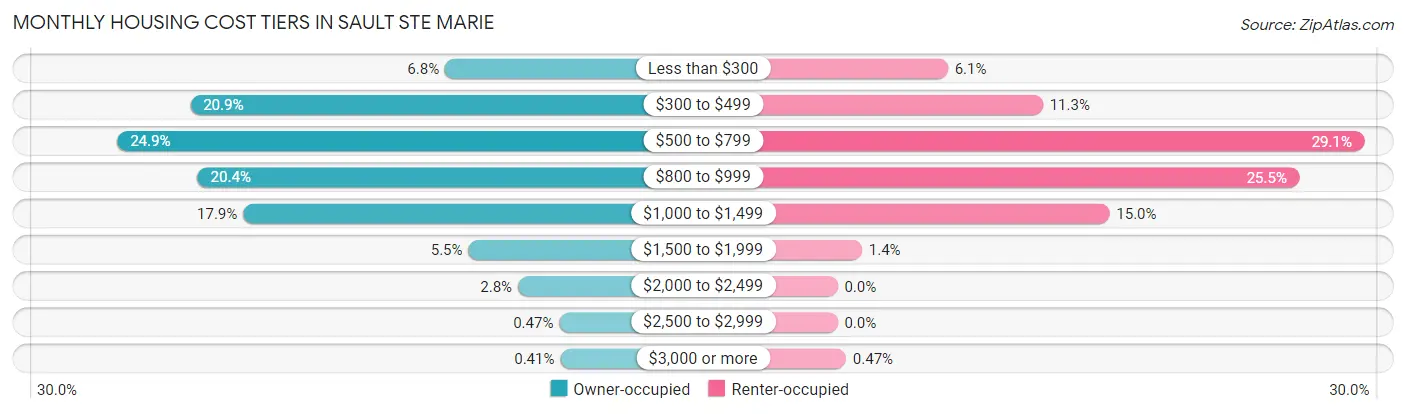
| Monthly Cost | Owner-occupied | Renter-occupied |
| Less than $300 | 232 (6.8%) | 144 (6.1%) |
| $300 to $499 | 714 (20.8%) | 268 (11.3%) |
| $500 to $799 | 852 (24.9%) | 687 (29.1%) |
| $800 to $999 | 700 (20.4%) | 602 (25.5%) |
| $1,000 to $1,499 | 614 (17.9%) | 355 (15.0%) |
| $1,500 to $1,999 | 188 (5.5%) | 32 (1.3%) |
| $2,000 to $2,499 | 94 (2.8%) | 0 (0.0%) |
| $2,500 to $2,999 | 16 (0.5%) | 0 (0.0%) |
| $3,000 or more | 14 (0.4%) | 11 (0.5%) |
| Total | 3,424 (100.0%) | 2,363 (100.0%) |
Physical Housing Characteristics in Sault Ste Marie
Housing Structures in Sault Ste Marie
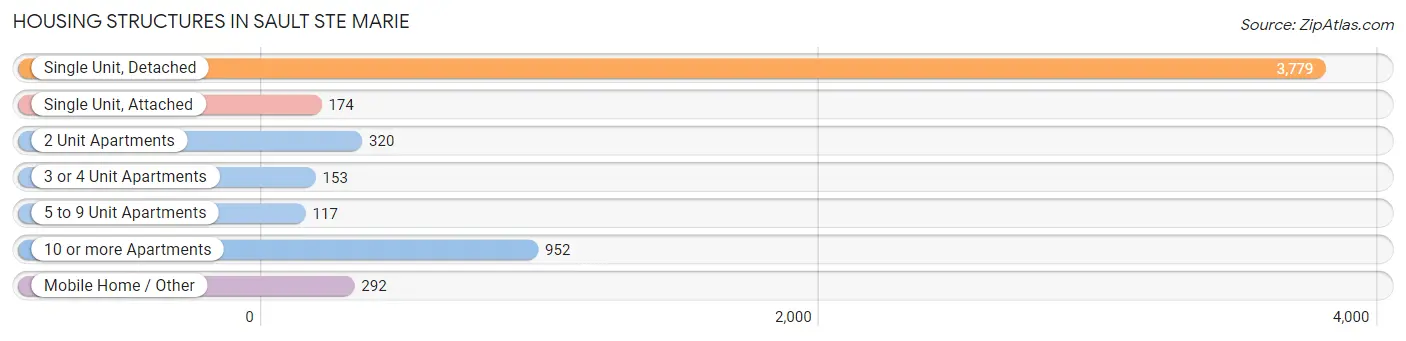
| Structure Type | # Housing Units | % Housing Units |
| Single Unit, Detached | 3,779 | 65.3% |
| Single Unit, Attached | 174 | 3.0% |
| 2 Unit Apartments | 320 | 5.5% |
| 3 or 4 Unit Apartments | 153 | 2.6% |
| 5 to 9 Unit Apartments | 117 | 2.0% |
| 10 or more Apartments | 952 | 16.5% |
| Mobile Home / Other | 292 | 5.1% |
| Total | 5,787 | 100.0% |
Housing Structures by Occupancy in Sault Ste Marie
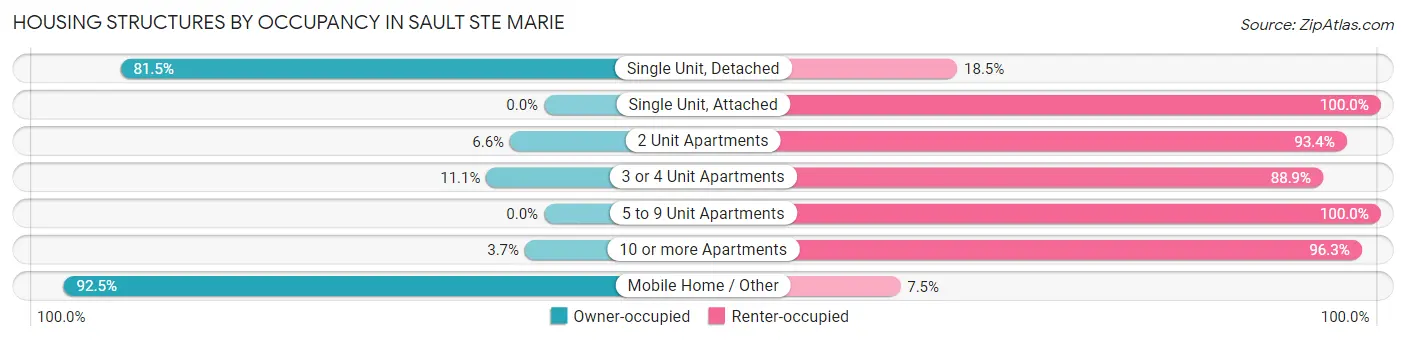
| Structure Type | Owner-occupied | Renter-occupied |
| Single Unit, Detached | 3,081 (81.5%) | 698 (18.5%) |
| Single Unit, Attached | 0 (0.0%) | 174 (100.0%) |
| 2 Unit Apartments | 21 (6.6%) | 299 (93.4%) |
| 3 or 4 Unit Apartments | 17 (11.1%) | 136 (88.9%) |
| 5 to 9 Unit Apartments | 0 (0.0%) | 117 (100.0%) |
| 10 or more Apartments | 35 (3.7%) | 917 (96.3%) |
| Mobile Home / Other | 270 (92.5%) | 22 (7.5%) |
| Total | 3,424 (59.2%) | 2,363 (40.8%) |
Housing Structures by Number of Rooms in Sault Ste Marie
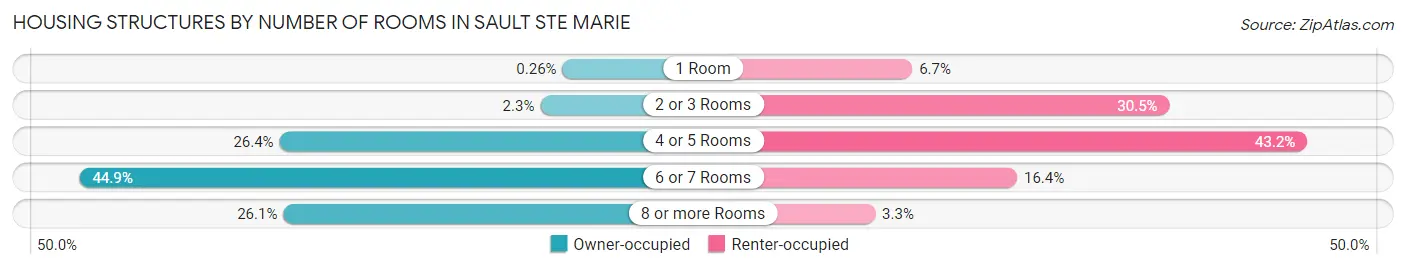
| Number of Rooms | Owner-occupied | Renter-occupied |
| 1 Room | 9 (0.3%) | 158 (6.7%) |
| 2 or 3 Rooms | 79 (2.3%) | 720 (30.5%) |
| 4 or 5 Rooms | 905 (26.4%) | 1,021 (43.2%) |
| 6 or 7 Rooms | 1,538 (44.9%) | 387 (16.4%) |
| 8 or more Rooms | 893 (26.1%) | 77 (3.3%) |
| Total | 3,424 (100.0%) | 2,363 (100.0%) |
Housing Structure by Heating Type in Sault Ste Marie
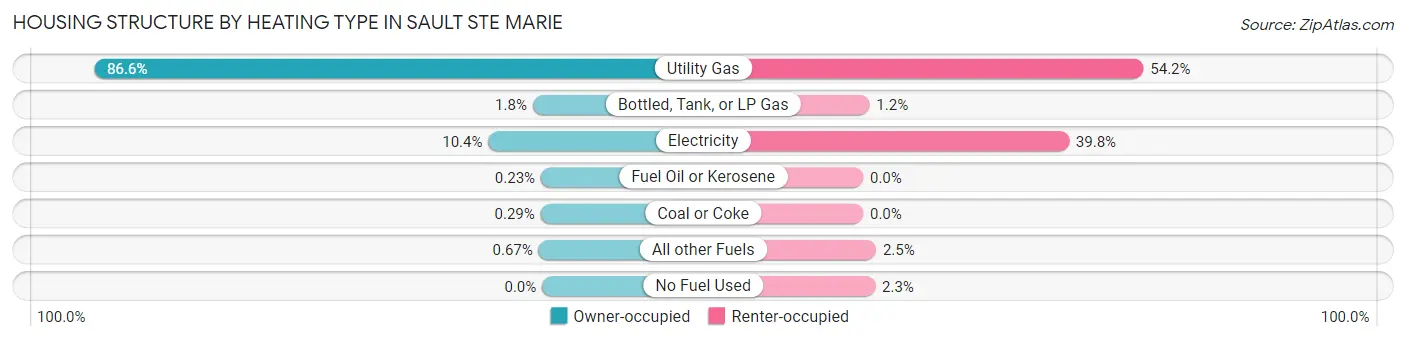
| Heating Type | Owner-occupied | Renter-occupied |
| Utility Gas | 2,965 (86.6%) | 1,280 (54.2%) |
| Bottled, Tank, or LP Gas | 62 (1.8%) | 29 (1.2%) |
| Electricity | 356 (10.4%) | 940 (39.8%) |
| Fuel Oil or Kerosene | 8 (0.2%) | 0 (0.0%) |
| Coal or Coke | 10 (0.3%) | 0 (0.0%) |
| All other Fuels | 23 (0.7%) | 59 (2.5%) |
| No Fuel Used | 0 (0.0%) | 55 (2.3%) |
| Total | 3,424 (100.0%) | 2,363 (100.0%) |
Household Vehicle Usage in Sault Ste Marie
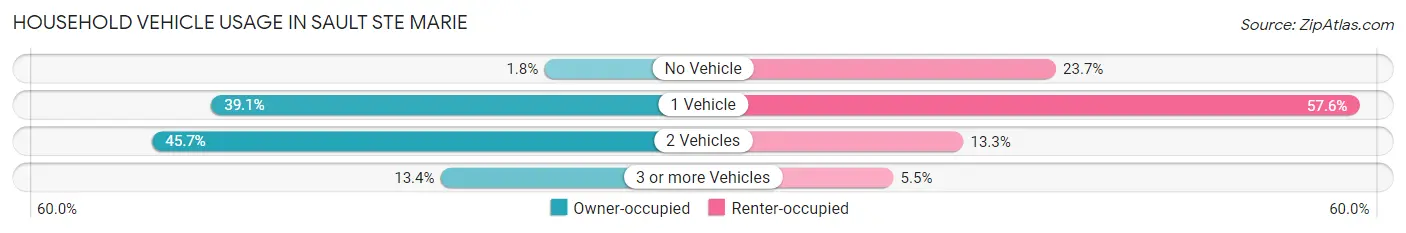
| Vehicles per Household | Owner-occupied | Renter-occupied |
| No Vehicle | 62 (1.8%) | 559 (23.7%) |
| 1 Vehicle | 1,338 (39.1%) | 1,361 (57.6%) |
| 2 Vehicles | 1,564 (45.7%) | 314 (13.3%) |
| 3 or more Vehicles | 460 (13.4%) | 129 (5.5%) |
| Total | 3,424 (100.0%) | 2,363 (100.0%) |
Real Estate & Mortgages in Sault Ste Marie
Real Estate and Mortgage Overview in Sault Ste Marie
| Characteristic | Without Mortgage | With Mortgage |
| Housing Units | 1,483 | 1,941 |
| Median Property Value | $102,800 | $120,200 |
| Median Household Income | $58,594 | $184 |
| Monthly Housing Costs | $450 | $14 |
| Real Estate Taxes | $2,173 | $139 |
Property Value by Mortgage Status in Sault Ste Marie
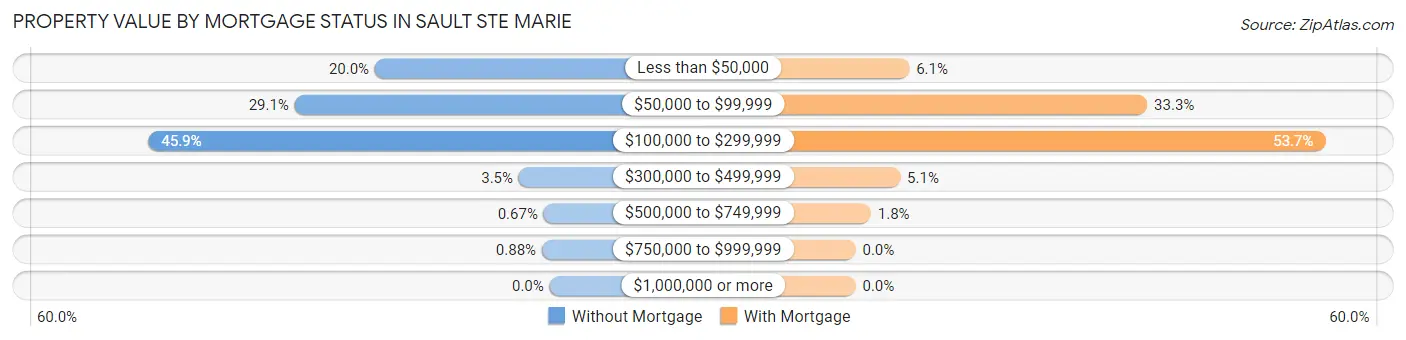
| Property Value | Without Mortgage | With Mortgage |
| Less than $50,000 | 296 (20.0%) | 119 (6.1%) |
| $50,000 to $99,999 | 432 (29.1%) | 647 (33.3%) |
| $100,000 to $299,999 | 680 (45.9%) | 1,042 (53.7%) |
| $300,000 to $499,999 | 52 (3.5%) | 99 (5.1%) |
| $500,000 to $749,999 | 10 (0.7%) | 34 (1.8%) |
| $750,000 to $999,999 | 13 (0.9%) | 0 (0.0%) |
| $1,000,000 or more | 0 (0.0%) | 0 (0.0%) |
| Total | 1,483 (100.0%) | 1,941 (100.0%) |
Household Income by Mortgage Status in Sault Ste Marie
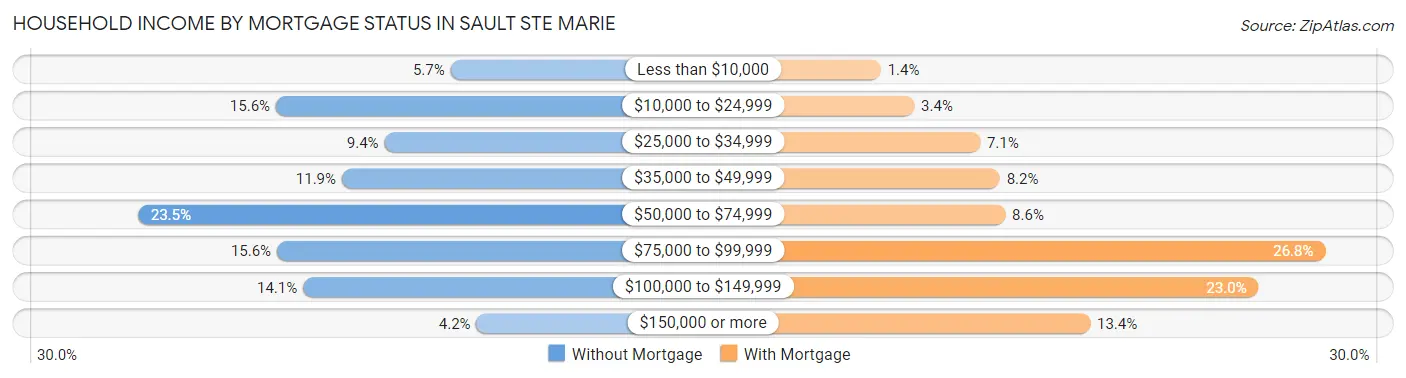
| Household Income | Without Mortgage | With Mortgage |
| Less than $10,000 | 84 (5.7%) | 28 (1.4%) |
| $10,000 to $24,999 | 232 (15.6%) | 65 (3.4%) |
| $25,000 to $34,999 | 140 (9.4%) | 138 (7.1%) |
| $35,000 to $49,999 | 176 (11.9%) | 160 (8.2%) |
| $50,000 to $74,999 | 349 (23.5%) | 166 (8.6%) |
| $75,000 to $99,999 | 231 (15.6%) | 521 (26.8%) |
| $100,000 to $149,999 | 209 (14.1%) | 447 (23.0%) |
| $150,000 or more | 62 (4.2%) | 260 (13.4%) |
| Total | 1,483 (100.0%) | 1,941 (100.0%) |
Property Value to Household Income Ratio in Sault Ste Marie
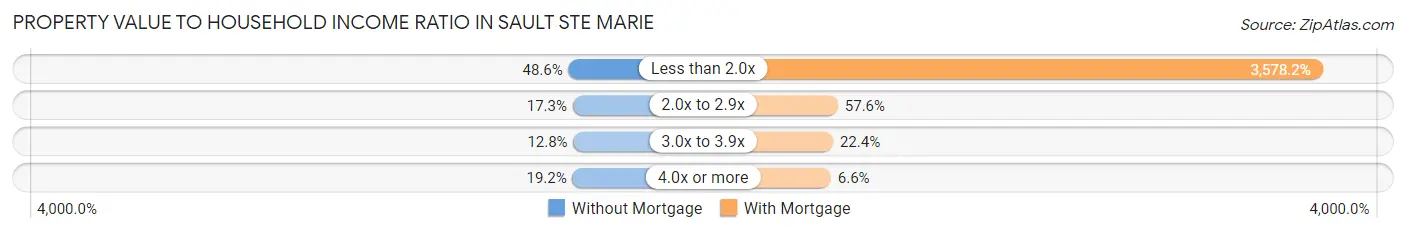
| Value-to-Income Ratio | Without Mortgage | With Mortgage |
| Less than 2.0x | 720 (48.5%) | 69,453 (3,578.2%) |
| 2.0x to 2.9x | 257 (17.3%) | 1,117 (57.6%) |
| 3.0x to 3.9x | 190 (12.8%) | 435 (22.4%) |
| 4.0x or more | 285 (19.2%) | 128 (6.6%) |
| Total | 1,483 (100.0%) | 1,941 (100.0%) |
Real Estate Taxes by Mortgage Status in Sault Ste Marie
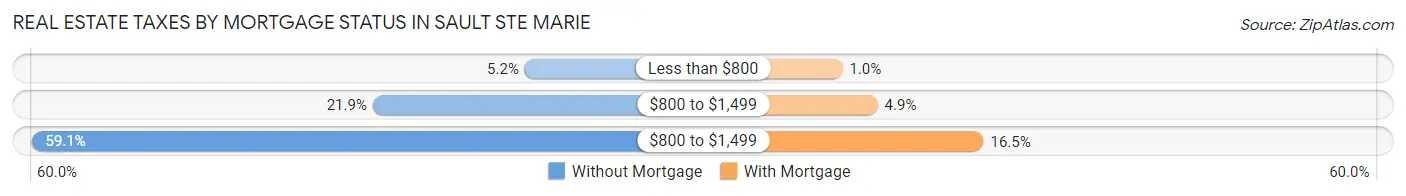
| Property Taxes | Without Mortgage | With Mortgage |
| Less than $800 | 77 (5.2%) | 20 (1.0%) |
| $800 to $1,499 | 324 (21.8%) | 95 (4.9%) |
| $800 to $1,499 | 877 (59.1%) | 320 (16.5%) |
| Total | 1,483 (100.0%) | 1,941 (100.0%) |
Health & Disability in Sault Ste Marie
Health Insurance Coverage by Age in Sault Ste Marie
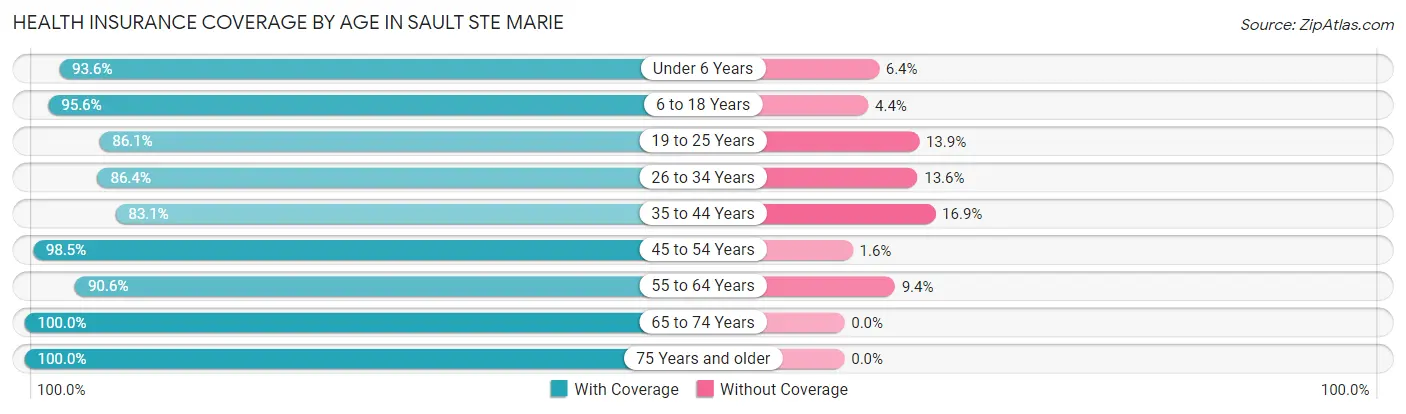
| Age Bracket | With Coverage | Without Coverage |
| Under 6 Years | 800 (93.6%) | 55 (6.4%) |
| 6 to 18 Years | 1,852 (95.6%) | 86 (4.4%) |
| 19 to 25 Years | 1,643 (86.1%) | 266 (13.9%) |
| 26 to 34 Years | 1,581 (86.4%) | 249 (13.6%) |
| 35 to 44 Years | 1,074 (83.1%) | 219 (16.9%) |
| 45 to 54 Years | 1,208 (98.5%) | 19 (1.5%) |
| 55 to 64 Years | 1,494 (90.6%) | 155 (9.4%) |
| 65 to 74 Years | 1,281 (100.0%) | 0 (0.0%) |
| 75 Years and older | 1,067 (100.0%) | 0 (0.0%) |
| Total | 12,000 (92.0%) | 1,049 (8.0%) |
Health Insurance Coverage by Citizenship Status in Sault Ste Marie
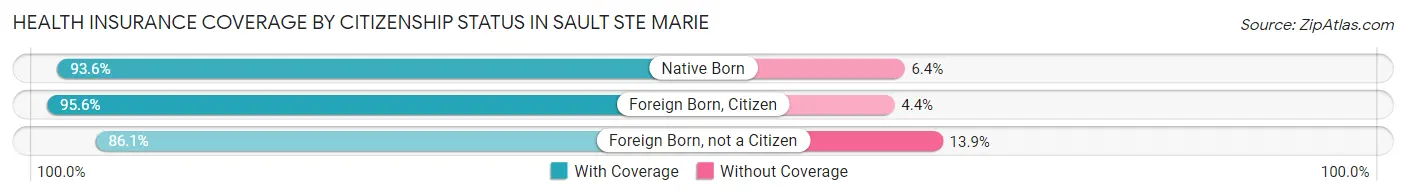
| Citizenship Status | With Coverage | Without Coverage |
| Native Born | 800 (93.6%) | 55 (6.4%) |
| Foreign Born, Citizen | 1,852 (95.6%) | 86 (4.4%) |
| Foreign Born, not a Citizen | 1,643 (86.1%) | 266 (13.9%) |
Health Insurance Coverage by Household Income in Sault Ste Marie
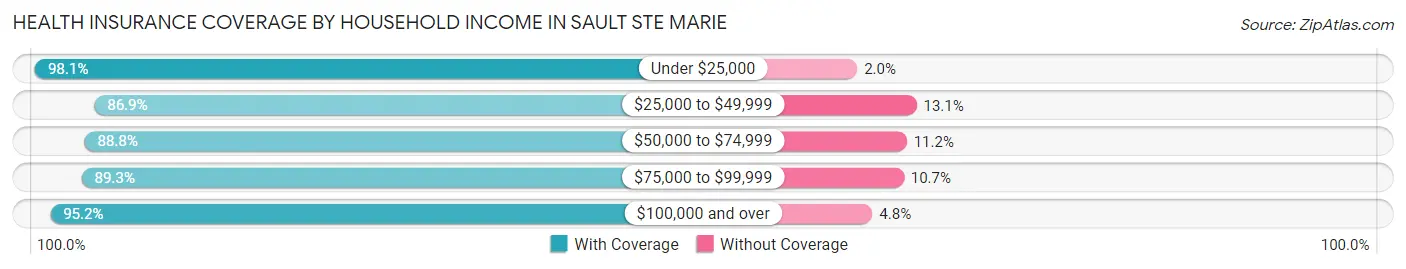
| Household Income | With Coverage | Without Coverage |
| Under $25,000 | 2,358 (98.1%) | 47 (1.9%) |
| $25,000 to $49,999 | 2,349 (86.9%) | 353 (13.1%) |
| $50,000 to $74,999 | 2,213 (88.8%) | 280 (11.2%) |
| $75,000 to $99,999 | 1,756 (89.3%) | 210 (10.7%) |
| $100,000 and over | 2,597 (95.2%) | 131 (4.8%) |
Public vs Private Health Insurance Coverage by Age in Sault Ste Marie
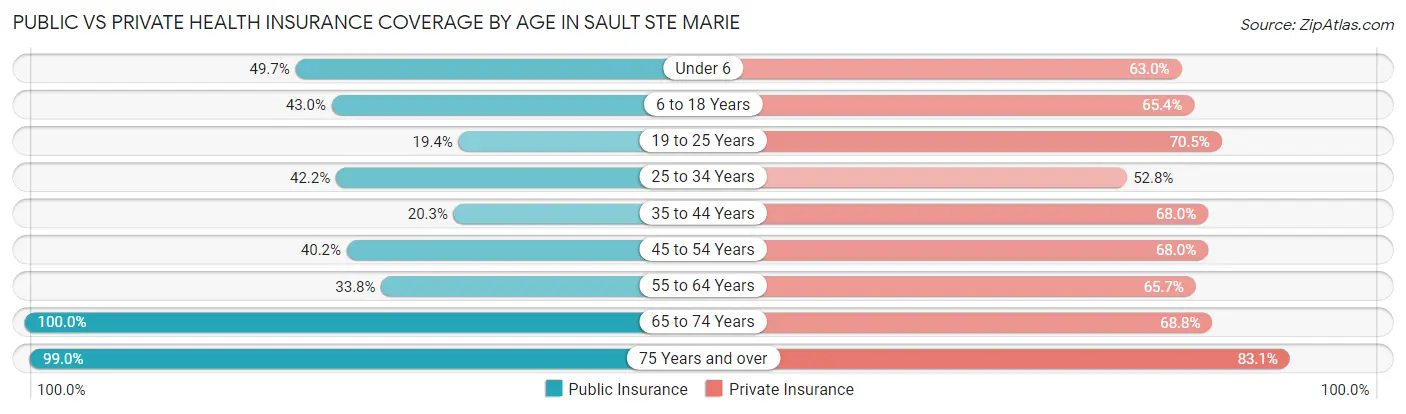
| Age Bracket | Public Insurance | Private Insurance |
| Under 6 | 425 (49.7%) | 539 (63.0%) |
| 6 to 18 Years | 833 (43.0%) | 1,268 (65.4%) |
| 19 to 25 Years | 371 (19.4%) | 1,346 (70.5%) |
| 25 to 34 Years | 772 (42.2%) | 966 (52.8%) |
| 35 to 44 Years | 263 (20.3%) | 879 (68.0%) |
| 45 to 54 Years | 493 (40.2%) | 834 (68.0%) |
| 55 to 64 Years | 557 (33.8%) | 1,083 (65.7%) |
| 65 to 74 Years | 1,281 (100.0%) | 881 (68.8%) |
| 75 Years and over | 1,056 (99.0%) | 887 (83.1%) |
| Total | 6,051 (46.4%) | 8,683 (66.5%) |
Disability Status by Sex by Age in Sault Ste Marie
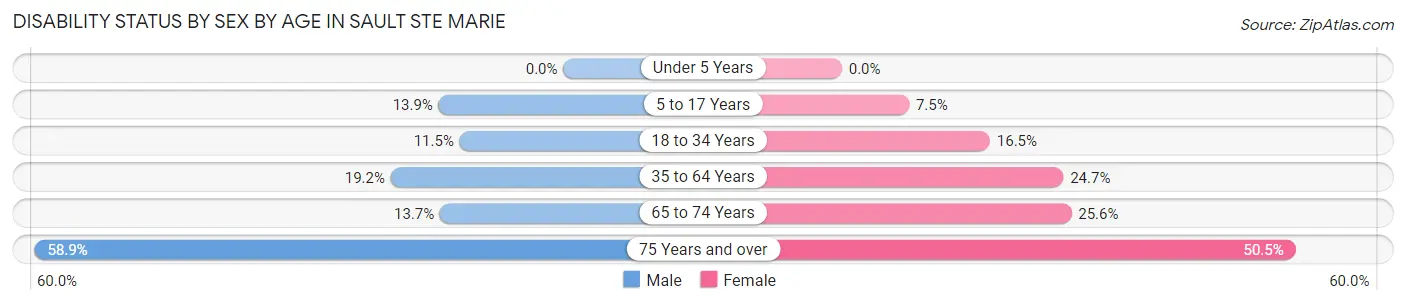
| Age Bracket | Male | Female |
| Under 5 Years | 0 (0.0%) | 0 (0.0%) |
| 5 to 17 Years | 126 (13.9%) | 67 (7.5%) |
| 18 to 34 Years | 249 (11.5%) | 307 (16.5%) |
| 35 to 64 Years | 378 (19.2%) | 543 (24.7%) |
| 65 to 74 Years | 77 (13.7%) | 184 (25.6%) |
| 75 Years and over | 182 (58.9%) | 383 (50.5%) |
Disability Class by Sex by Age in Sault Ste Marie
Disability Class: Hearing Difficulty
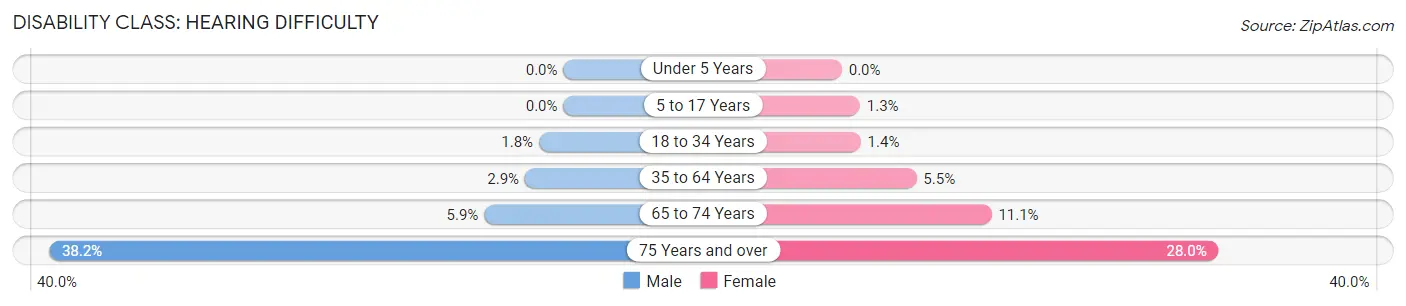
| Age Bracket | Male | Female |
| Under 5 Years | 0 (0.0%) | 0 (0.0%) |
| 5 to 17 Years | 0 (0.0%) | 12 (1.3%) |
| 18 to 34 Years | 39 (1.8%) | 26 (1.4%) |
| 35 to 64 Years | 56 (2.9%) | 122 (5.5%) |
| 65 to 74 Years | 33 (5.9%) | 80 (11.1%) |
| 75 Years and over | 118 (38.2%) | 212 (28.0%) |
Disability Class: Vision Difficulty
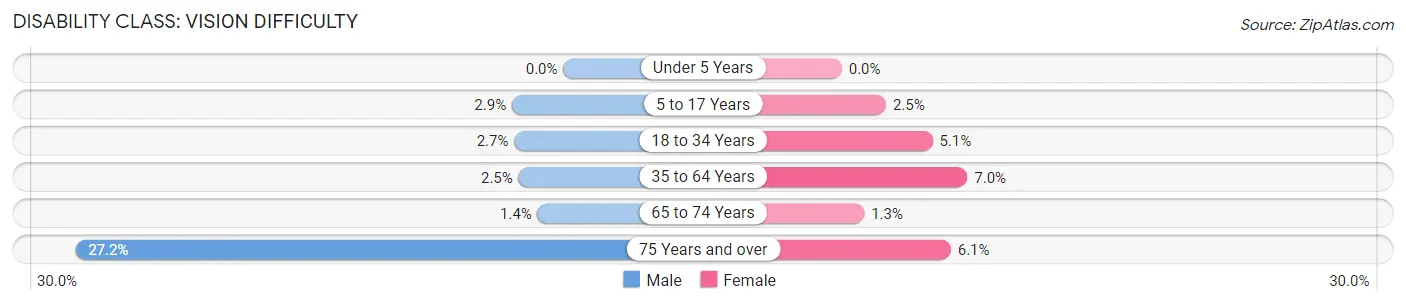
| Age Bracket | Male | Female |
| Under 5 Years | 0 (0.0%) | 0 (0.0%) |
| 5 to 17 Years | 26 (2.9%) | 22 (2.5%) |
| 18 to 34 Years | 59 (2.7%) | 94 (5.1%) |
| 35 to 64 Years | 49 (2.5%) | 154 (7.0%) |
| 65 to 74 Years | 8 (1.4%) | 9 (1.3%) |
| 75 Years and over | 84 (27.2%) | 46 (6.1%) |
Disability Class: Cognitive Difficulty
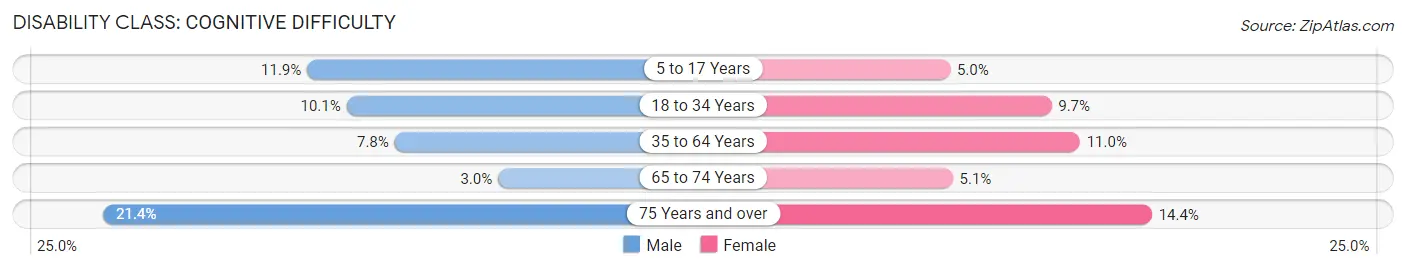
| Age Bracket | Male | Female |
| 5 to 17 Years | 108 (11.9%) | 45 (5.0%) |
| 18 to 34 Years | 217 (10.1%) | 181 (9.7%) |
| 35 to 64 Years | 154 (7.8%) | 243 (11.0%) |
| 65 to 74 Years | 17 (3.0%) | 37 (5.1%) |
| 75 Years and over | 66 (21.4%) | 109 (14.4%) |
Disability Class: Ambulatory Difficulty
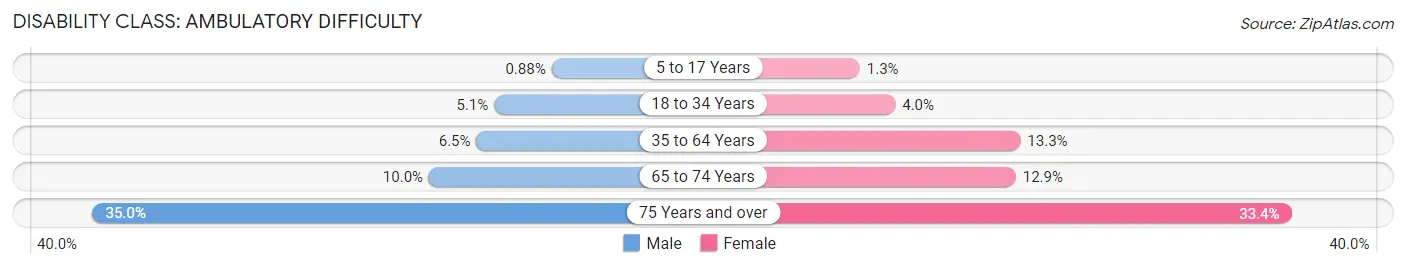
| Age Bracket | Male | Female |
| 5 to 17 Years | 8 (0.9%) | 12 (1.3%) |
| 18 to 34 Years | 111 (5.1%) | 74 (4.0%) |
| 35 to 64 Years | 127 (6.5%) | 292 (13.3%) |
| 65 to 74 Years | 56 (10.0%) | 93 (12.9%) |
| 75 Years and over | 108 (34.9%) | 253 (33.4%) |
Disability Class: Self-Care Difficulty
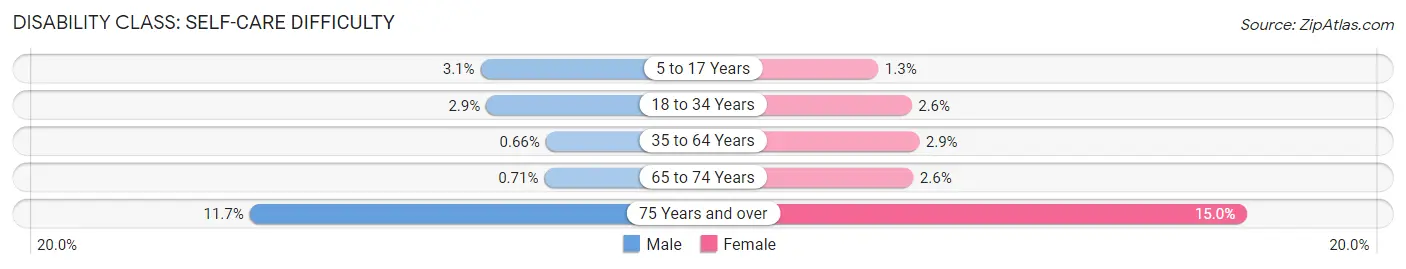
| Age Bracket | Male | Female |
| 5 to 17 Years | 28 (3.1%) | 12 (1.3%) |
| 18 to 34 Years | 62 (2.9%) | 48 (2.6%) |
| 35 to 64 Years | 13 (0.7%) | 63 (2.9%) |
| 65 to 74 Years | 4 (0.7%) | 19 (2.6%) |
| 75 Years and over | 36 (11.7%) | 114 (15.0%) |
Technology Access in Sault Ste Marie
Computing Device Access in Sault Ste Marie
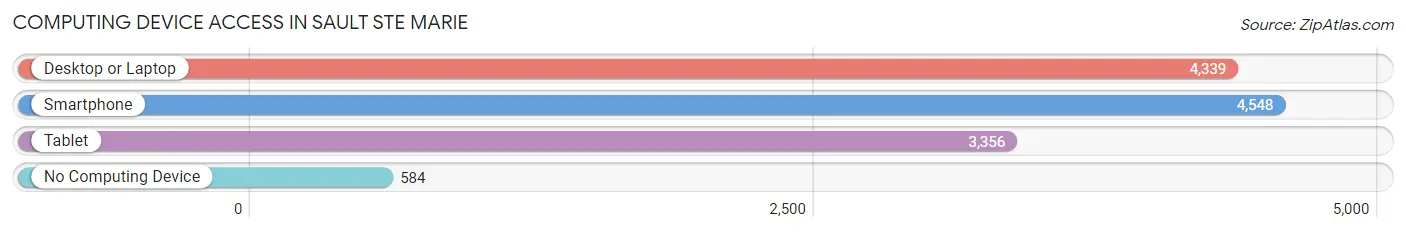
| Device Type | # Households | % Households |
| Desktop or Laptop | 4,339 | 75.0% |
| Smartphone | 4,548 | 78.6% |
| Tablet | 3,356 | 58.0% |
| No Computing Device | 584 | 10.1% |
| Total | 5,787 | 100.0% |
Internet Access in Sault Ste Marie
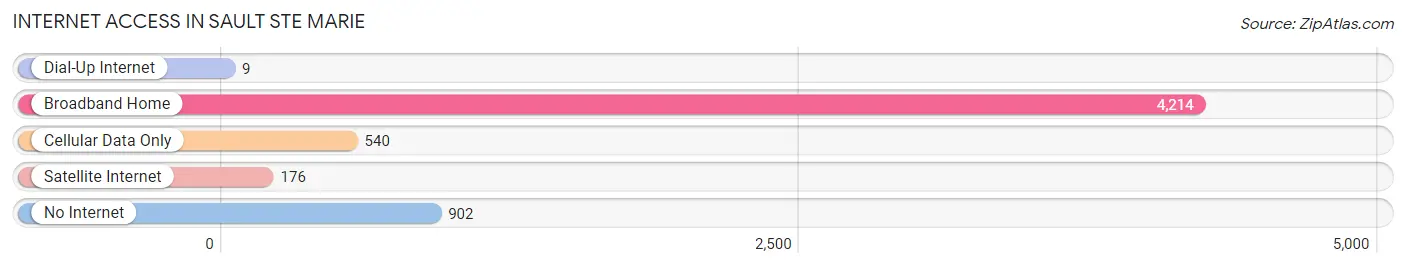
| Internet Type | # Households | % Households |
| Dial-Up Internet | 9 | 0.2% |
| Broadband Home | 4,214 | 72.8% |
| Cellular Data Only | 540 | 9.3% |
| Satellite Internet | 176 | 3.0% |
| No Internet | 902 | 15.6% |
| Total | 5,787 | 100.0% |
Sault Ste Marie Summary
Sault Ste. Marie, Michigan is a city located in the Upper Peninsula of Michigan, on the St. Marys River. It is the oldest city in the state of Michigan, having been founded in 1668 by French explorer, Father Jacques Marquette. The city is the county seat of Chippewa County and is home to a population of approximately 14,000 people.
History
Sault Ste. Marie was first established as a trading post by French explorer, Father Jacques Marquette in 1668. The city was named after the rapids of the St. Marys River, which were referred to as “The Sault” by the French. The city was originally a fur trading post, but it quickly grew to become a major port for the Great Lakes region. In 1701, the French built Fort de Buade, which was the first permanent settlement in the area. The fort was used to protect the fur trade and to provide a base for French exploration of the Great Lakes region.
In 1763, the British took control of the area and renamed it Sault Ste. Marie. The British built a fort and trading post in the area, which was used to control the fur trade. The British also built a canal to bypass the rapids of the St. Marys River, which allowed ships to travel between Lake Superior and Lake Huron.
In 1817, the United States took control of the area and the city was incorporated in 1822. The city quickly grew to become an important port for the Great Lakes region. In 1855, the first railroad bridge was built across the St. Marys River, connecting the city to the rest of the United States.
In the late 19th century, the city became an important industrial center. The city was home to several large factories, including a paper mill, a steel mill, and a foundry. The city also became an important center for shipping and transportation.
Geography
Sault Ste. Marie is located in the Upper Peninsula of Michigan, on the St. Marys River. The city is situated on the northern shore of Lake Superior, and is bordered by the Canadian province of Ontario to the north. The city is located at the eastern end of the Soo Locks, which connect Lake Superior to Lake Huron.
The city has a total area of 11.2 square miles, of which 10.9 square miles is land and 0.3 square miles is water. The city is located in a humid continental climate zone, with cold winters and warm summers. The average temperature in the winter is around 20 degrees Fahrenheit, and the average temperature in the summer is around 70 degrees Fahrenheit.
Economy
Sault Ste. Marie is an important economic center for the Upper Peninsula of Michigan. The city is home to several large industries, including a paper mill, a steel mill, and a foundry. The city is also home to several large shipping and transportation companies, including the Soo Locks, which connect Lake Superior to Lake Huron.
The city is also home to several large retail stores, including Walmart, Target, and Meijer. The city is also home to several large restaurants, including McDonald’s, Burger King, and Wendy’s.
Demographics
As of the 2010 census, the population of Sault Ste. Marie was 13,922. The city has a population density of 1,232 people per square mile. The median age of the population is 43.7 years, and the median household income is $37,945.
The racial makeup of the city is 87.3% White, 8.2% Native American, 1.2% Asian, 0.7% African American, and 2.6% from other races. The city is home to a large Native American population, with the largest tribe being the Chippewa.
The city is also home to a large French-Canadian population, with the largest group being the Metis. The city is also home to a large Italian-American population, with the largest group being the Sicilians. The city is also home to a large Polish-American population, with the largest group being the Kashubians.
Common Questions
What is Per Capita Income in Sault Ste Marie?
Per Capita income in Sault Ste Marie is $28,488.
What is the Median Family Income in Sault Ste Marie?
Median Family Income in Sault Ste Marie is $73,854.
What is the Median Household income in Sault Ste Marie?
Median Household Income in Sault Ste Marie is $50,284.
What is Income or Wage Gap in Sault Ste Marie?
Income or Wage Gap in Sault Ste Marie is 18.0%.
Women in Sault Ste Marie earn 82.0 cents for every dollar earned by a man.
What is Family Income Deficit in Sault Ste Marie?
Family Income Deficit in Sault Ste Marie is $13,110.
Families that are below poverty line in Sault Ste Marie earn $13,110 less on average than the poverty threshold level.
What is Inequality or Gini Index in Sault Ste Marie?
Inequality or Gini Index in Sault Ste Marie is 0.43.
What is the Total Population of Sault Ste Marie?
Total Population of Sault Ste Marie is 13,409.
What is the Total Male Population of Sault Ste Marie?
Total Male Population of Sault Ste Marie is 6,500.
What is the Total Female Population of Sault Ste Marie?
Total Female Population of Sault Ste Marie is 6,909.
What is the Ratio of Males per 100 Females in Sault Ste Marie?
There are 94.08 Males per 100 Females in Sault Ste Marie.
What is the Ratio of Females per 100 Males in Sault Ste Marie?
There are 106.29 Females per 100 Males in Sault Ste Marie.
What is the Median Population Age in Sault Ste Marie?
Median Population Age in Sault Ste Marie is 35.3 Years.
What is the Average Family Size in Sault Ste Marie
Average Family Size in Sault Ste Marie is 3.0 People.
What is the Average Household Size in Sault Ste Marie
Average Household Size in Sault Ste Marie is 2.1 People.
How Large is the Labor Force in Sault Ste Marie?
There are 7,081 People in the Labor Forcein in Sault Ste Marie.
What is the Percentage of People in the Labor Force in Sault Ste Marie?
63.7% of People are in the Labor Force in Sault Ste Marie.
What is the Unemployment Rate in Sault Ste Marie?
Unemployment Rate in Sault Ste Marie is 7.5%.