Glen Arbor, MI Map & Demographics
Glen Arbor Map
Glen Arbor Overview
$102,928
PER CAPITA INCOME
$120,156
AVG FAMILY INCOME
33.3%
WAGE / INCOME GAP [ % ]
66.7¢/ $1
WAGE / INCOME GAP [ $ ]
0.43
INEQUALITY / GINI INDEX
271
TOTAL POPULATION
163
MALE POPULATION
108
FEMALE POPULATION
150.93
MALES / 100 FEMALES
66.26
FEMALES / 100 MALES
68.3
MEDIAN AGE
2.7
AVG FAMILY SIZE
1.9
AVG HOUSEHOLD SIZE
113
LABOR FORCE [ PEOPLE ]
45.2%
PERCENT IN LABOR FORCE
Glen Arbor Zip Codes
Glen Arbor Area Codes
Income in Glen Arbor
Income Overview in Glen Arbor
| Characteristic | Number | Measure |
| Per Capita Income | 271 | $102,928 |
| Median Family Income | 67 | $120,156 |
| Mean Family Income | 67 | $133,381 |
| Median Household Income | 142 | $0 |
| Mean Household Income | 142 | $266,832 |
| Income Deficit | 67 | $0 |
| Wage / Income Gap (%) | 271 | 33.32% |
| Wage / Income Gap ($) | 271 | 66.68¢ per $1 |
| Gini / Inequality Index | 271 | 0.43 |
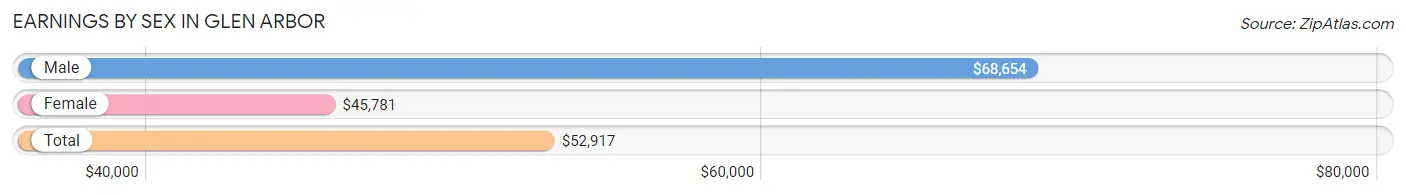
Earnings by Sex in Glen Arbor
Average Earnings in Glen Arbor are $52,917, $68,654 for men and $45,781 for women, a difference of 33.3%.
| Sex | Number | Average Earnings |
| Male | 74 (50.3%) | $68,654 |
| Female | 73 (49.7%) | $45,781 |
| Total | 147 (100.0%) | $52,917 |
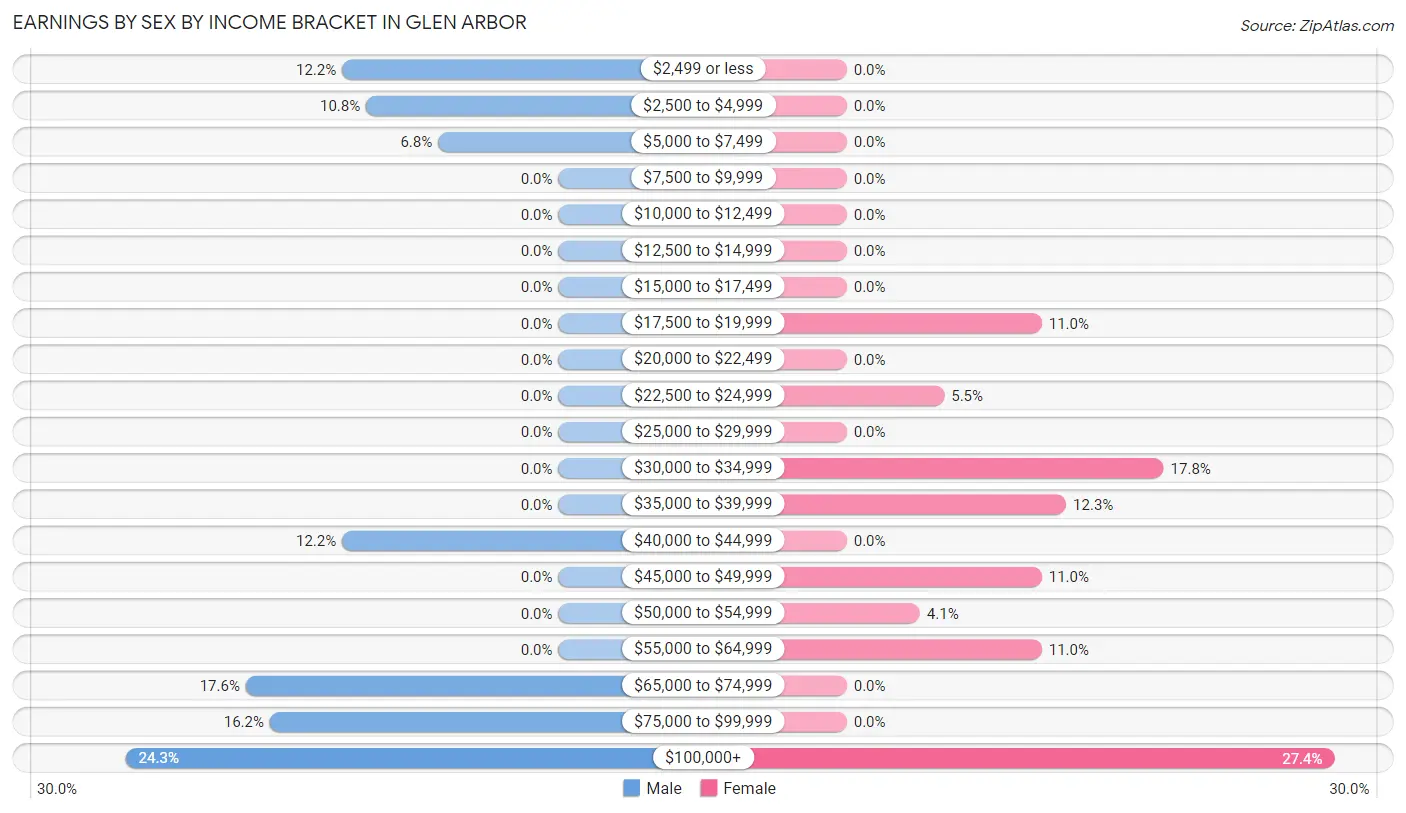
Earnings by Sex by Income Bracket in Glen Arbor
The most common earnings brackets in Glen Arbor are $100,000+ for men (18 | 24.3%) and $100,000+ for women (20 | 27.4%).
| Income | Male | Female |
| $2,499 or less | 9 (12.2%) | 0 (0.0%) |
| $2,500 to $4,999 | 8 (10.8%) | 0 (0.0%) |
| $5,000 to $7,499 | 5 (6.8%) | 0 (0.0%) |
| $7,500 to $9,999 | 0 (0.0%) | 0 (0.0%) |
| $10,000 to $12,499 | 0 (0.0%) | 0 (0.0%) |
| $12,500 to $14,999 | 0 (0.0%) | 0 (0.0%) |
| $15,000 to $17,499 | 0 (0.0%) | 0 (0.0%) |
| $17,500 to $19,999 | 0 (0.0%) | 8 (11.0%) |
| $20,000 to $22,499 | 0 (0.0%) | 0 (0.0%) |
| $22,500 to $24,999 | 0 (0.0%) | 4 (5.5%) |
| $25,000 to $29,999 | 0 (0.0%) | 0 (0.0%) |
| $30,000 to $34,999 | 0 (0.0%) | 13 (17.8%) |
| $35,000 to $39,999 | 0 (0.0%) | 9 (12.3%) |
| $40,000 to $44,999 | 9 (12.2%) | 0 (0.0%) |
| $45,000 to $49,999 | 0 (0.0%) | 8 (11.0%) |
| $50,000 to $54,999 | 0 (0.0%) | 3 (4.1%) |
| $55,000 to $64,999 | 0 (0.0%) | 8 (11.0%) |
| $65,000 to $74,999 | 13 (17.6%) | 0 (0.0%) |
| $75,000 to $99,999 | 12 (16.2%) | 0 (0.0%) |
| $100,000+ | 18 (24.3%) | 20 (27.4%) |
| Total | 74 (100.0%) | 73 (100.0%) |
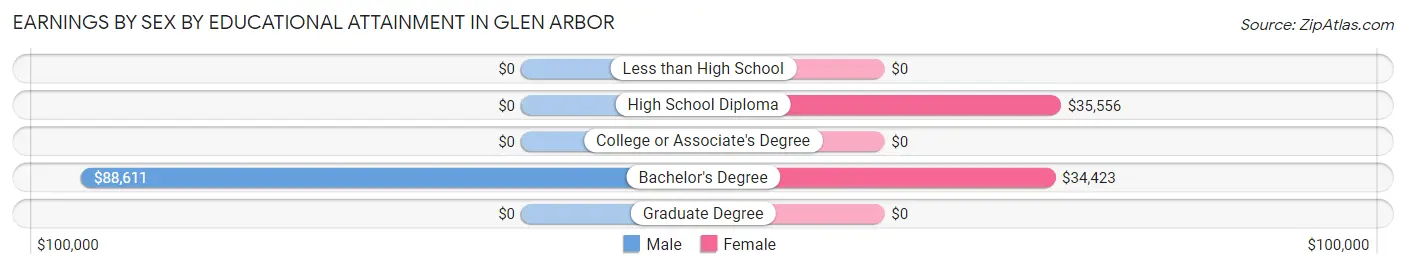
Earnings by Sex by Educational Attainment in Glen Arbor
Average earnings in Glen Arbor are $88,611 for men and $45,781 for women, a difference of 48.3%. Men with an educational attainment of bachelor's degree enjoy the highest average annual earnings of $88,611, while those with bachelor's degree education earn the least with $88,611. Women with an educational attainment of high school diploma earn the most with the average annual earnings of $35,556, while those with bachelor's degree education have the smallest earnings of $34,423.
| Educational Attainment | Male Income | Female Income |
| Less than High School | - | - |
| High School Diploma | - | - |
| College or Associate's Degree | - | - |
| Bachelor's Degree | $88,611 | $34,423 |
| Graduate Degree | - | - |
| Total | $88,611 | $45,781 |
Family Income in Glen Arbor
Family Income Brackets in Glen Arbor
According to the Glen Arbor family income data, there are 41 families falling into the $100,000 to $149,999 income range, which is the most common income bracket and makes up 61.2% of all families.
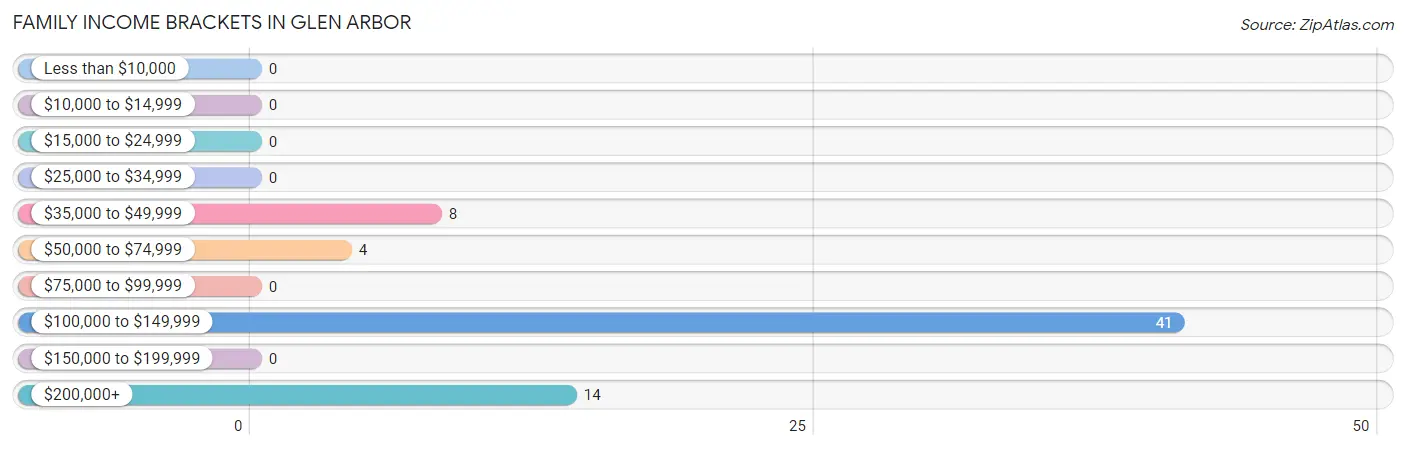
| Income Bracket | # Families | % Families |
| Less than $10,000 | 0 | 0.0% |
| $10,000 to $14,999 | 0 | 0.0% |
| $15,000 to $24,999 | 0 | 0.0% |
| $25,000 to $34,999 | 0 | 0.0% |
| $35,000 to $49,999 | 8 | 11.9% |
| $50,000 to $74,999 | 4 | 6.0% |
| $75,000 to $99,999 | 0 | 0.0% |
| $100,000 to $149,999 | 41 | 61.2% |
| $150,000 to $199,999 | 0 | 0.0% |
| $200,000+ | 14 | 20.9% |
Family Income by Famaliy Size in Glen Arbor
| Income Bracket | # Families | Median Income |
| 2-Person Families | 37 (55.2%) | $0 |
| 3-Person Families | 21 (31.3%) | $0 |
| 4-Person Families | 0 (0.0%) | $0 |
| 5-Person Families | 8 (11.9%) | $0 |
| 6-Person Families | 1 (1.5%) | $0 |
| 7+ Person Families | 0 (0.0%) | $0 |
| Total | 67 (100.0%) | $120,156 |
Family Income by Number of Earners in Glen Arbor
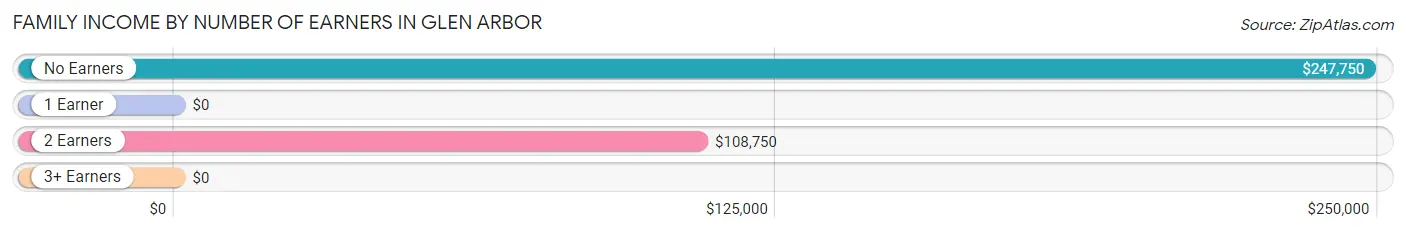
| Number of Earners | # Families | Median Income |
| No Earners | 24 (35.8%) | $247,750 |
| 1 Earner | 0 (0.0%) | $0 |
| 2 Earners | 34 (50.7%) | $108,750 |
| 3+ Earners | 9 (13.4%) | $0 |
| Total | 67 (100.0%) | $120,156 |
Household Income in Glen Arbor
Household Income Brackets in Glen Arbor
With 70 households falling in the category, the $200,000+ income range is the most frequent in Glen Arbor, accounting for 49.3% of all households.
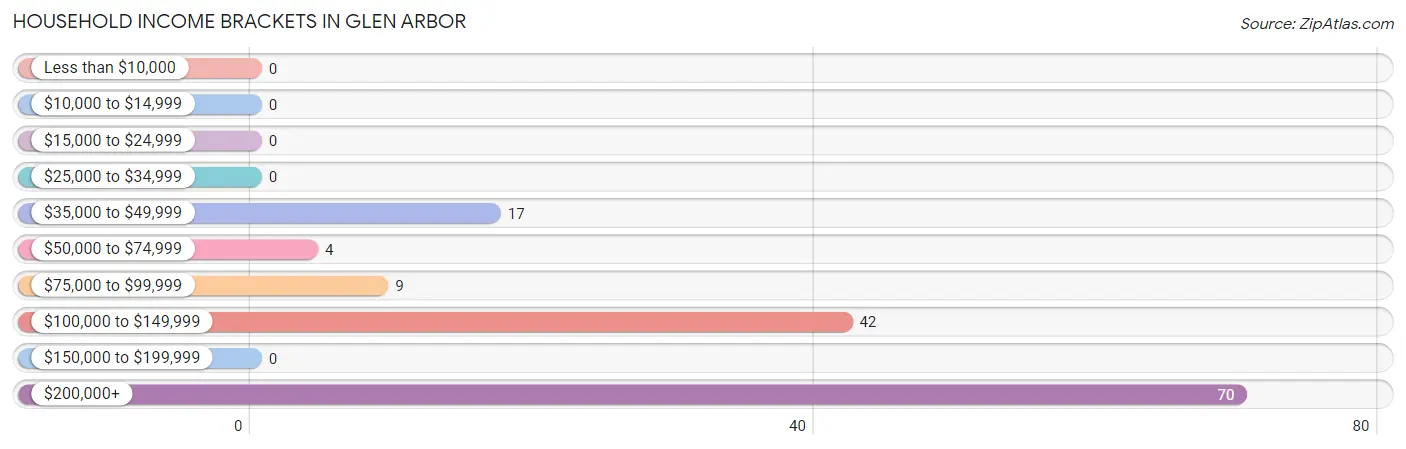
| Income Bracket | # Households | % Households |
| Less than $10,000 | 0 | 0.0% |
| $10,000 to $14,999 | 0 | 0.0% |
| $15,000 to $24,999 | 0 | 0.0% |
| $25,000 to $34,999 | 0 | 0.0% |
| $35,000 to $49,999 | 17 | 12.0% |
| $50,000 to $74,999 | 4 | 2.8% |
| $75,000 to $99,999 | 9 | 6.3% |
| $100,000 to $149,999 | 42 | 29.6% |
| $150,000 to $199,999 | 0 | 0.0% |
| $200,000+ | 70 | 49.3% |
Household Income by Householder Age in Glen Arbor
The median household income in Glen Arbor is $0, with the highest median household income of $250,001 found in the 65+ years age bracket for the primary householder. A total of 95 households (66.9%) fall into this category.
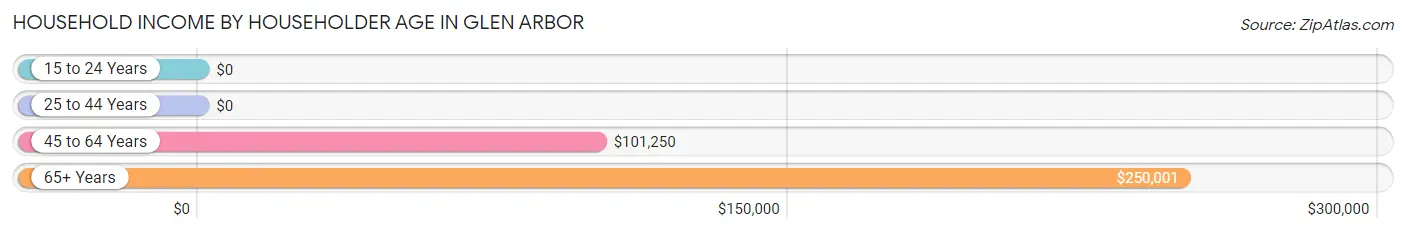
| Income Bracket | # Households | Median Income |
| 15 to 24 Years | 0 (0.0%) | $0 |
| 25 to 44 Years | 1 (0.7%) | $0 |
| 45 to 64 Years | 46 (32.4%) | $101,250 |
| 65+ Years | 95 (66.9%) | $250,001 |
| Total | 142 (100.0%) | $0 |
Poverty in Glen Arbor
Income Below Poverty by Sex and Age in Glen Arbor
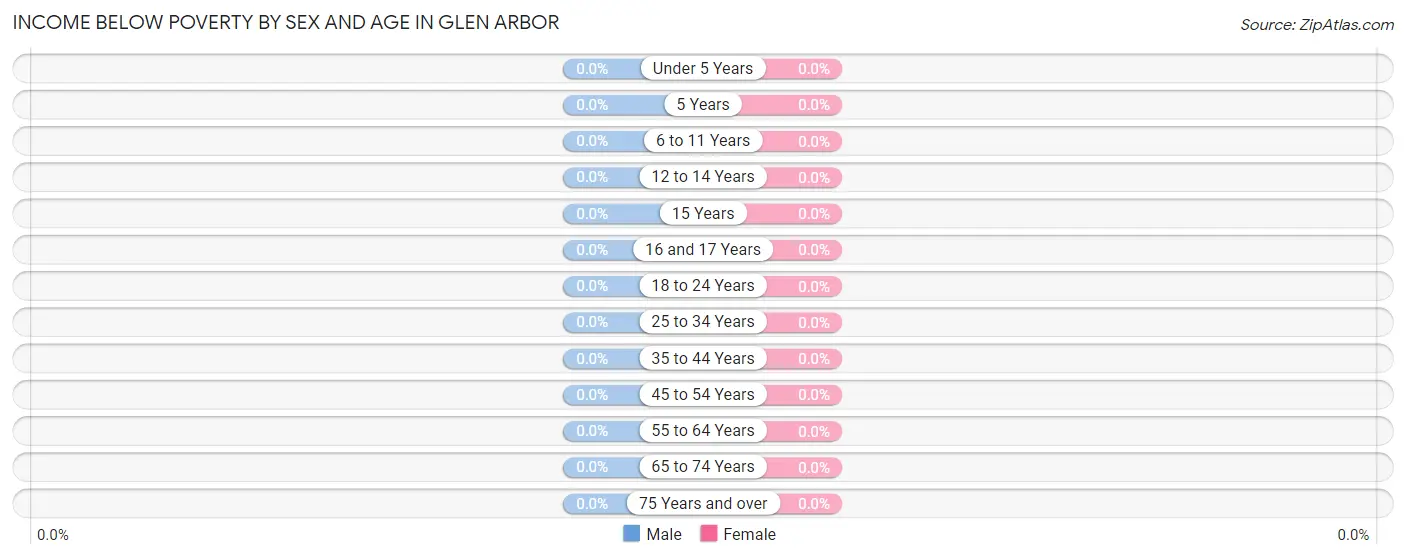
| Age Bracket | Male | Female |
| Under 5 Years | 0 (0.0%) | 0 (0.0%) |
| 5 Years | 0 (0.0%) | 0 (0.0%) |
| 6 to 11 Years | 0 (0.0%) | 0 (0.0%) |
| 12 to 14 Years | 0 (0.0%) | 0 (0.0%) |
| 15 Years | 0 (0.0%) | 0 (0.0%) |
| 16 and 17 Years | 0 (0.0%) | 0 (0.0%) |
| 18 to 24 Years | 0 (0.0%) | 0 (0.0%) |
| 25 to 34 Years | 0 (0.0%) | 0 (0.0%) |
| 35 to 44 Years | 0 (0.0%) | 0 (0.0%) |
| 45 to 54 Years | 0 (0.0%) | 0 (0.0%) |
| 55 to 64 Years | 0 (0.0%) | 0 (0.0%) |
| 65 to 74 Years | 0 (0.0%) | 0 (0.0%) |
| 75 Years and over | 0 (0.0%) | 0 (0.0%) |
| Total | 0 (0.0%) | 0 (0.0%) |
Income Above Poverty by Sex and Age in Glen Arbor
According to the poverty statistics in Glen Arbor, males aged 6 to 11 years and females aged 12 to 14 years are the age groups that are most secure financially, with 100.0% of males and 100.0% of females in these age groups living above the poverty line.
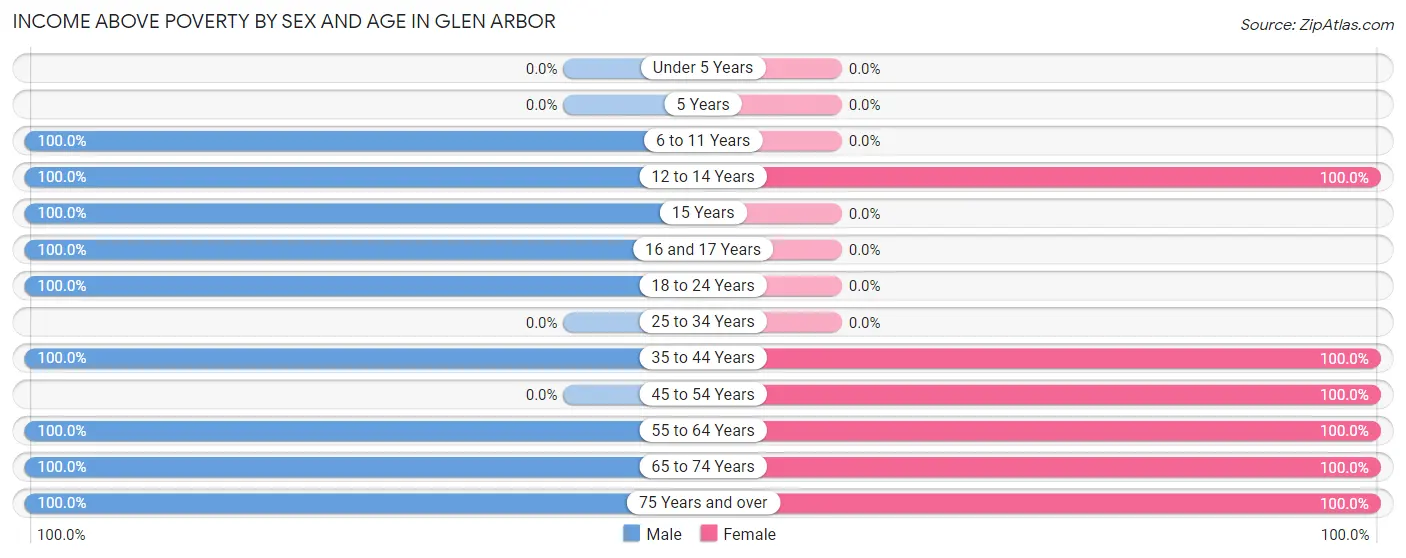
| Age Bracket | Male | Female |
| Under 5 Years | 0 (0.0%) | 0 (0.0%) |
| 5 Years | 0 (0.0%) | 0 (0.0%) |
| 6 to 11 Years | 1 (100.0%) | 0 (0.0%) |
| 12 to 14 Years | 11 (100.0%) | 1 (100.0%) |
| 15 Years | 8 (100.0%) | 0 (0.0%) |
| 16 and 17 Years | 9 (100.0%) | 0 (0.0%) |
| 18 to 24 Years | 19 (100.0%) | 0 (0.0%) |
| 25 to 34 Years | 0 (0.0%) | 0 (0.0%) |
| 35 to 44 Years | 1 (100.0%) | 1 (100.0%) |
| 45 to 54 Years | 0 (0.0%) | 22 (100.0%) |
| 55 to 64 Years | 24 (100.0%) | 22 (100.0%) |
| 65 to 74 Years | 82 (100.0%) | 52 (100.0%) |
| 75 Years and over | 8 (100.0%) | 10 (100.0%) |
| Total | 163 (100.0%) | 108 (100.0%) |
Income Below Poverty Among Married-Couple Families in Glen Arbor
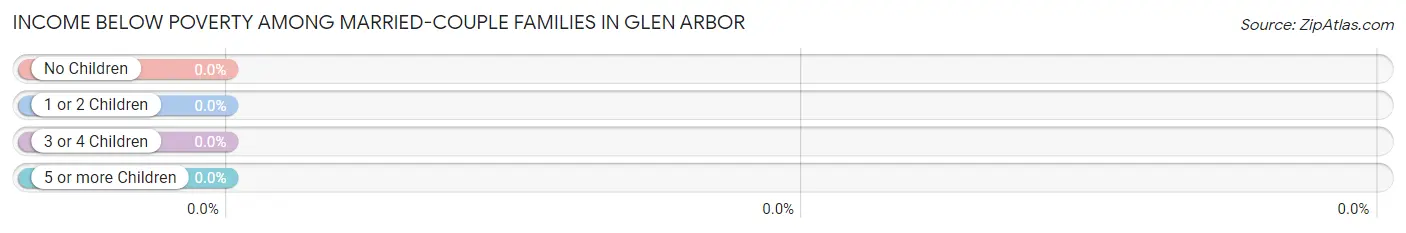
| Children | Above Poverty | Below Poverty |
| No Children | 45 (100.0%) | 0 (0.0%) |
| 1 or 2 Children | 21 (100.0%) | 0 (0.0%) |
| 3 or 4 Children | 1 (100.0%) | 0 (0.0%) |
| 5 or more Children | 0 (0.0%) | 0 (0.0%) |
| Total | 67 (100.0%) | 0 (0.0%) |
Income Below Poverty Among Single-Parent Households in Glen Arbor
| Children | Single Father | Single Mother |
| No Children | 0 (0.0%) | 0 (0.0%) |
| 1 or 2 Children | 0 (0.0%) | 0 (0.0%) |
| 3 or 4 Children | 0 (0.0%) | 0 (0.0%) |
| 5 or more Children | 0 (0.0%) | 0 (0.0%) |
| Total | 0 (0.0%) | 0 (0.0%) |
Income Below Poverty Among Married-Couple vs Single-Parent Households in Glen Arbor
| Children | Married-Couple Families | Single-Parent Households |
| No Children | 0 (0.0%) | 0 (0.0%) |
| 1 or 2 Children | 0 (0.0%) | 0 (0.0%) |
| 3 or 4 Children | 0 (0.0%) | 0 (0.0%) |
| 5 or more Children | 0 (0.0%) | 0 (0.0%) |
| Total | 0 (0.0%) | 0 (0.0%) |
Race in Glen Arbor
The most populous races in Glen Arbor are White / Caucasian (246 | 90.8%), Hispanic or Latino (25 | 9.2%), and Some other Race (16 | 5.9%).
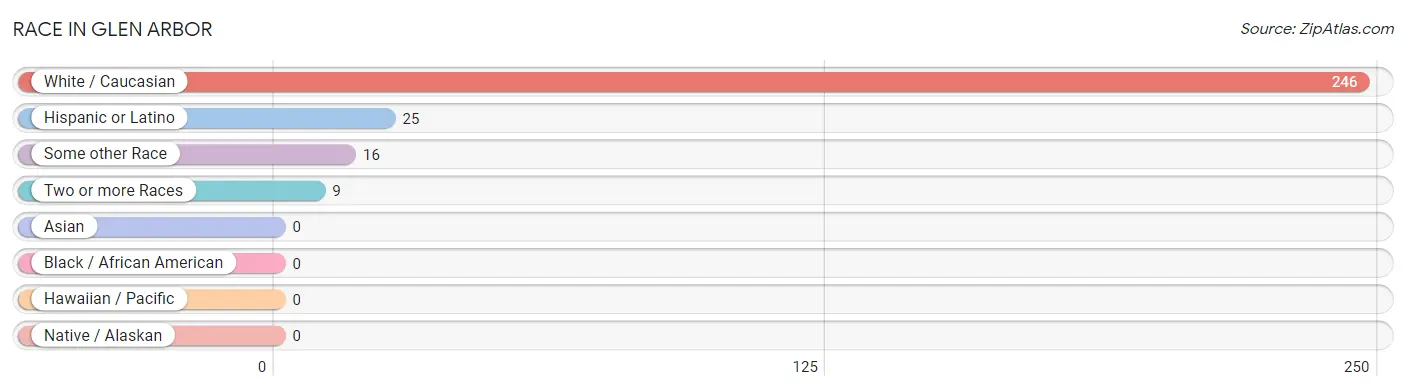
| Race | # Population | % Population |
| Asian | 0 | 0.0% |
| Black / African American | 0 | 0.0% |
| Hawaiian / Pacific | 0 | 0.0% |
| Hispanic or Latino | 25 | 9.2% |
| Native / Alaskan | 0 | 0.0% |
| White / Caucasian | 246 | 90.8% |
| Two or more Races | 9 | 3.3% |
| Some other Race | 16 | 5.9% |
| Total | 271 | 100.0% |
Ancestry in Glen Arbor
The most populous ancestries reported in Glen Arbor are Irish (129 | 47.6%), English (57 | 21.0%), German (48 | 17.7%), Mexican (25 | 9.2%), and Arab (13 | 4.8%), together accounting for 100.4% of all Glen Arbor residents.
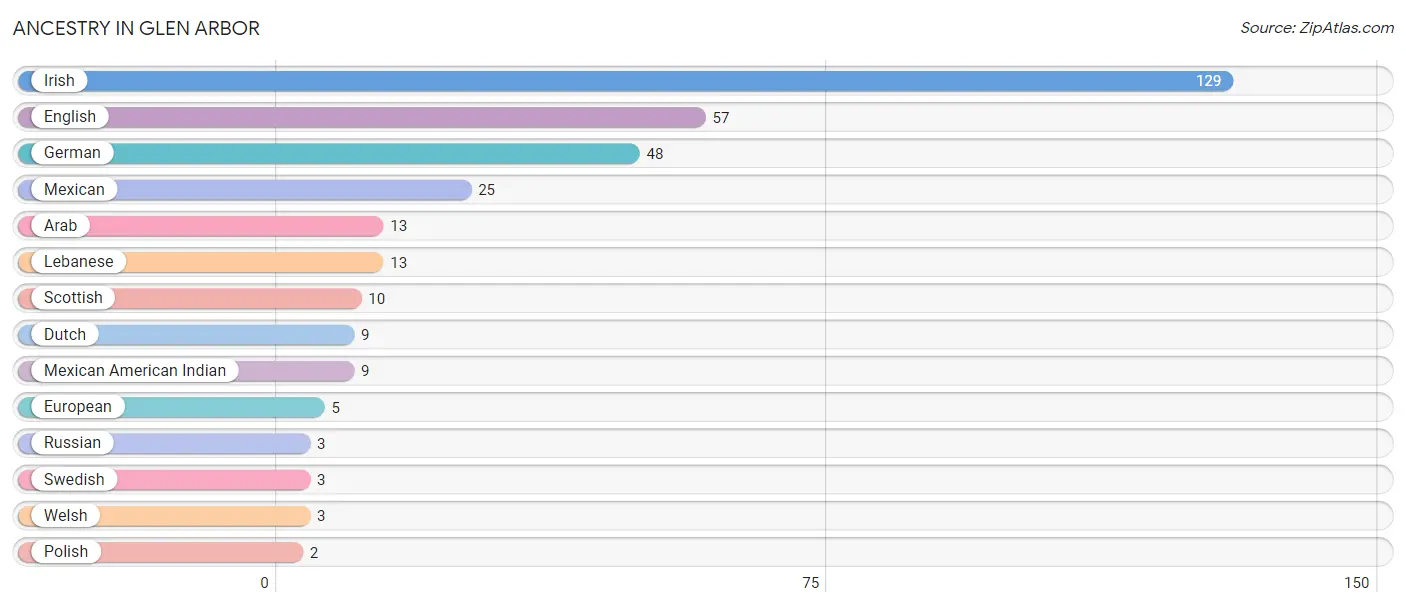
| Ancestry | # Population | % Population |
| Arab | 13 | 4.8% |
| Dutch | 9 | 3.3% |
| English | 57 | 21.0% |
| European | 5 | 1.8% |
| German | 48 | 17.7% |
| Irish | 129 | 47.6% |
| Lebanese | 13 | 4.8% |
| Mexican | 25 | 9.2% |
| Mexican American Indian | 9 | 3.3% |
| Polish | 2 | 0.7% |
| Russian | 3 | 1.1% |
| Scottish | 10 | 3.7% |
| Swedish | 3 | 1.1% |
| Welsh | 3 | 1.1% | View All 14 Rows |
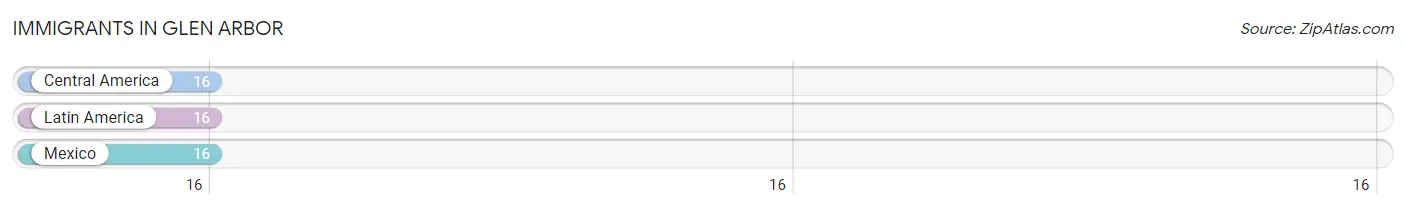
Immigrants in Glen Arbor
The most numerous immigrant groups reported in Glen Arbor came from Central America (16 | 5.9%), Latin America (16 | 5.9%), and Mexico (16 | 5.9%), together accounting for 17.7% of all Glen Arbor residents.
| Immigration Origin | # Population | % Population |
| Central America | 16 | 5.9% |
| Latin America | 16 | 5.9% |
| Mexico | 16 | 5.9% | View All 3 Rows |
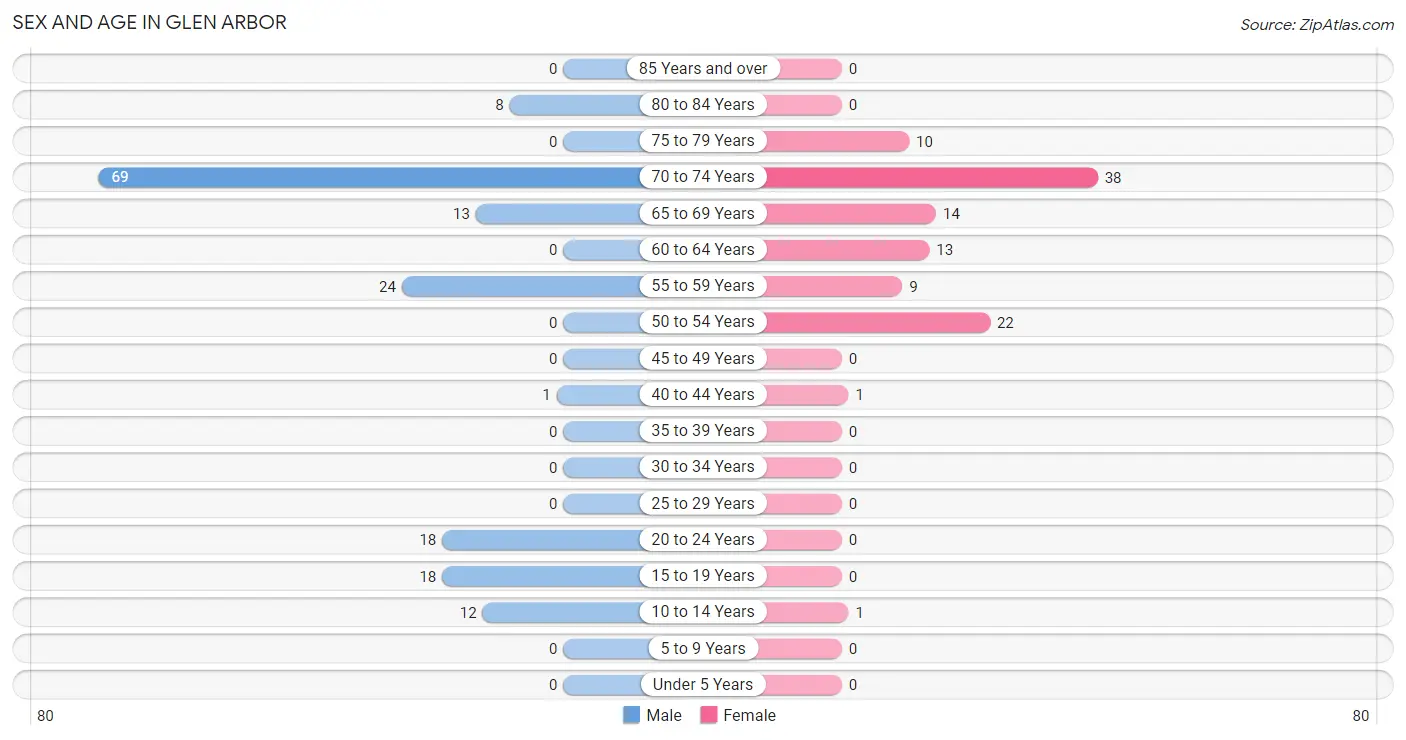
Sex and Age in Glen Arbor
Sex and Age in Glen Arbor
The most populous age groups in Glen Arbor are 70 to 74 Years (69 | 42.3%) for men and 70 to 74 Years (38 | 35.2%) for women.
| Age Bracket | Male | Female |
| Under 5 Years | 0 (0.0%) | 0 (0.0%) |
| 5 to 9 Years | 0 (0.0%) | 0 (0.0%) |
| 10 to 14 Years | 12 (7.4%) | 1 (0.9%) |
| 15 to 19 Years | 18 (11.0%) | 0 (0.0%) |
| 20 to 24 Years | 18 (11.0%) | 0 (0.0%) |
| 25 to 29 Years | 0 (0.0%) | 0 (0.0%) |
| 30 to 34 Years | 0 (0.0%) | 0 (0.0%) |
| 35 to 39 Years | 0 (0.0%) | 0 (0.0%) |
| 40 to 44 Years | 1 (0.6%) | 1 (0.9%) |
| 45 to 49 Years | 0 (0.0%) | 0 (0.0%) |
| 50 to 54 Years | 0 (0.0%) | 22 (20.4%) |
| 55 to 59 Years | 24 (14.7%) | 9 (8.3%) |
| 60 to 64 Years | 0 (0.0%) | 13 (12.0%) |
| 65 to 69 Years | 13 (8.0%) | 14 (13.0%) |
| 70 to 74 Years | 69 (42.3%) | 38 (35.2%) |
| 75 to 79 Years | 0 (0.0%) | 10 (9.3%) |
| 80 to 84 Years | 8 (4.9%) | 0 (0.0%) |
| 85 Years and over | 0 (0.0%) | 0 (0.0%) |
| Total | 163 (100.0%) | 108 (100.0%) |
Families and Households in Glen Arbor
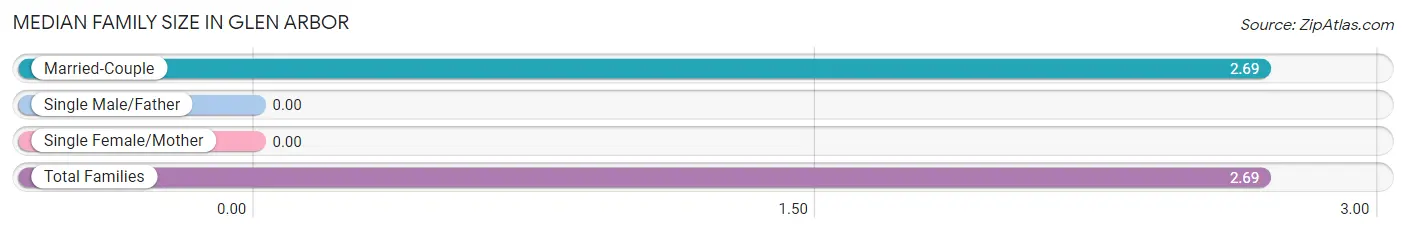
Median Family Size in Glen Arbor
| Family Type | # Families | Family Size |
| Married-Couple | 67 (100.0%) | 2.69 |
| Single Male/Father | 0 (0.0%) | - |
| Single Female/Mother | 0 (0.0%) | - |
| Total Families | 67 (100.0%) | 2.69 |
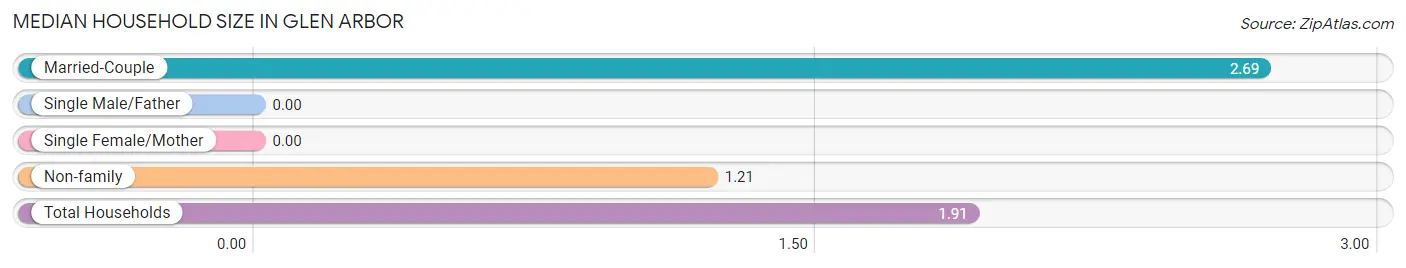
Median Household Size in Glen Arbor
| Household Type | # Households | Household Size |
| Married-Couple | 67 (47.2%) | 2.69 |
| Single Male/Father | 0 (0.0%) | - |
| Single Female/Mother | 0 (0.0%) | - |
| Non-family | 75 (52.8%) | 1.21 |
| Total Households | 142 (100.0%) | 1.91 |
Household Size by Marriage Status in Glen Arbor
Out of a total of 142 households in Glen Arbor, 67 (47.2%) are family households, while 75 (52.8%) are nonfamily households. The most numerous type of family households are 2-person households, comprising 37, and the most common type of nonfamily households are 1-person households, comprising 39.
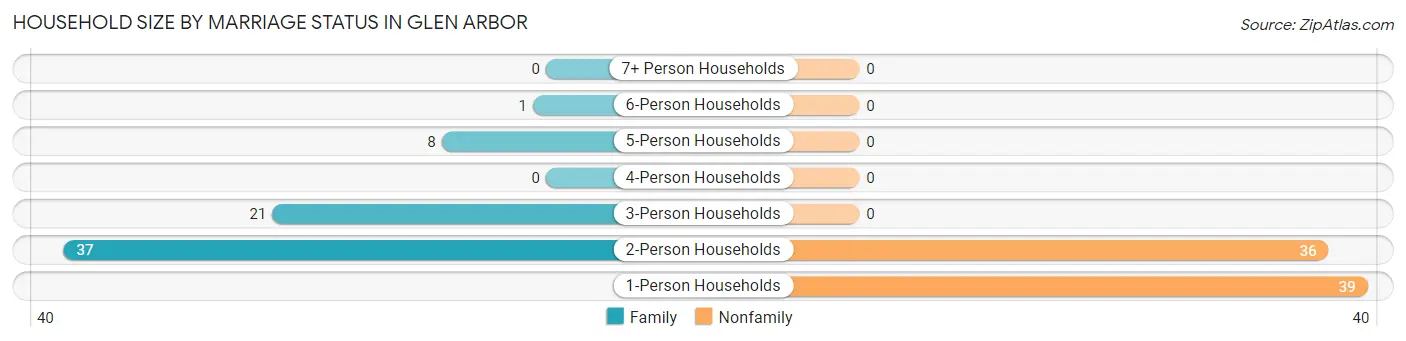
| Household Size | Family Households | Nonfamily Households |
| 1-Person Households | - | 39 (27.5%) |
| 2-Person Households | 37 (26.1%) | 36 (25.4%) |
| 3-Person Households | 21 (14.8%) | 0 (0.0%) |
| 4-Person Households | 0 (0.0%) | 0 (0.0%) |
| 5-Person Households | 8 (5.6%) | 0 (0.0%) |
| 6-Person Households | 1 (0.7%) | 0 (0.0%) |
| 7+ Person Households | 0 (0.0%) | 0 (0.0%) |
| Total | 67 (47.2%) | 75 (52.8%) |
Female Fertility in Glen Arbor
Fertility by Age in Glen Arbor
| Age Bracket | Women with Births | Births / 1,000 Women |
| 15 to 19 years | 0 (0.0%) | 0.0 |
| 20 to 34 years | 0 (0.0%) | 0.0 |
| 35 to 50 years | 0 (0.0%) | 0.0 |
| Total | 0 (0.0%) | 0.0 |
Fertility by Age by Marriage Status in Glen Arbor
| Age Bracket | Married | Unmarried |
| 15 to 19 years | 0 (0.0%) | 0 (0.0%) |
| 20 to 34 years | 0 (0.0%) | 0 (0.0%) |
| 35 to 50 years | 0 (0.0%) | 0 (0.0%) |
| Total | 0 (0.0%) | 0 (0.0%) |
Fertility by Education in Glen Arbor
| Educational Attainment | Women with Births | Births / 1,000 Women |
| Less than High School | 0 (0.0%) | 0.0 |
| High School Diploma | 0 (0.0%) | 0.0 |
| College or Associate's Degree | 0 (0.0%) | 0.0 |
| Bachelor's Degree | 0 (0.0%) | 0.0 |
| Graduate Degree | 0 (0.0%) | 0.0 |
| Total | 0 (0.0%) | 0.0 |
Fertility by Education by Marriage Status in Glen Arbor
| Educational Attainment | Married | Unmarried |
| Less than High School | 0 (0.0%) | 0 (0.0%) |
| High School Diploma | 0 (0.0%) | 0 (0.0%) |
| College or Associate's Degree | 0 (0.0%) | 0 (0.0%) |
| Bachelor's Degree | 0 (0.0%) | 0 (0.0%) |
| Graduate Degree | 0 (0.0%) | 0 (0.0%) |
| Total | 0 (0.0%) | 0 (0.0%) |
Employment Characteristics in Glen Arbor
Employment by Class of Employer in Glen Arbor
Among the 113 employed individuals in Glen Arbor, private company employees (37 | 32.7%), self-employed (not incorporated) (37 | 32.7%), and not-for-profit organizations (16 | 14.2%) make up the most common classes of employment.
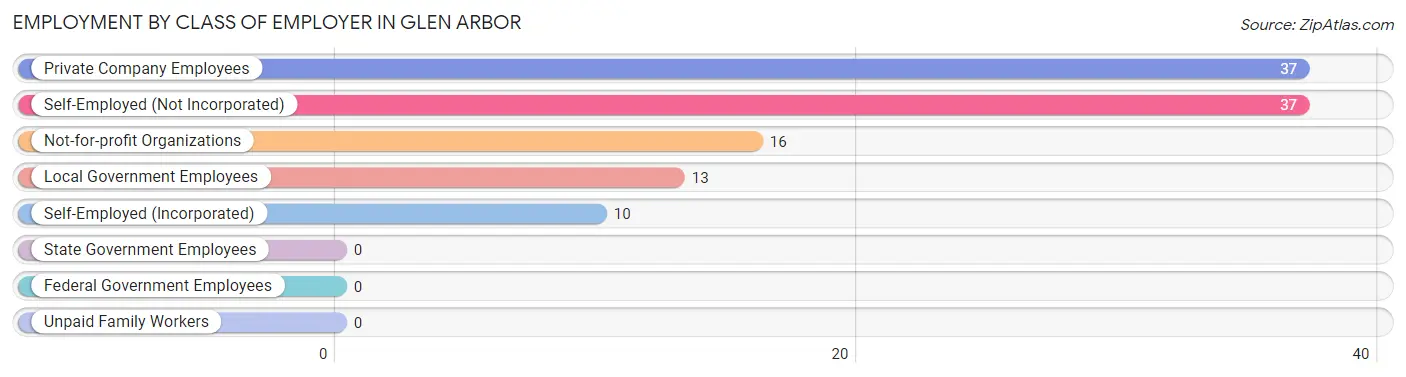
| Employer Class | # Employees | % Employees |
| Private Company Employees | 37 | 32.7% |
| Self-Employed (Incorporated) | 10 | 8.8% |
| Self-Employed (Not Incorporated) | 37 | 32.7% |
| Not-for-profit Organizations | 16 | 14.2% |
| Local Government Employees | 13 | 11.5% |
| State Government Employees | 0 | 0.0% |
| Federal Government Employees | 0 | 0.0% |
| Unpaid Family Workers | 0 | 0.0% |
| Total | 113 | 100.0% |
Employment Status by Age in Glen Arbor
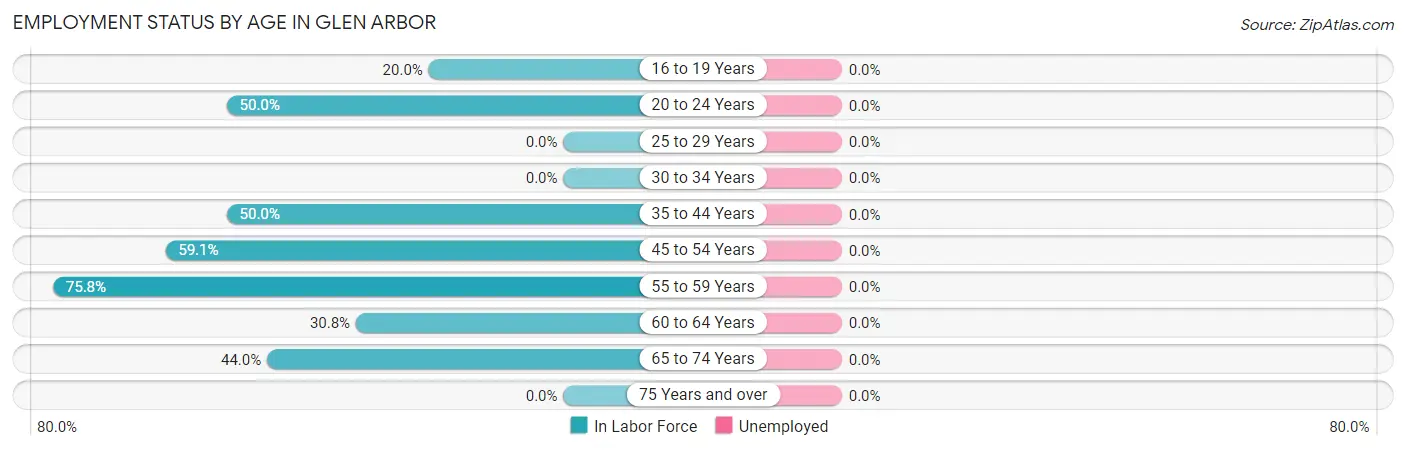
| Age Bracket | In Labor Force | Unemployed |
| 16 to 19 Years | 2 (20.0%) | 0 (0.0%) |
| 20 to 24 Years | 9 (50.0%) | 0 (0.0%) |
| 25 to 29 Years | 0 (0.0%) | 0 (0.0%) |
| 30 to 34 Years | 0 (0.0%) | 0 (0.0%) |
| 35 to 44 Years | 1 (50.0%) | 0 (0.0%) |
| 45 to 54 Years | 13 (59.1%) | 0 (0.0%) |
| 55 to 59 Years | 25 (75.8%) | 0 (0.0%) |
| 60 to 64 Years | 4 (30.8%) | 0 (0.0%) |
| 65 to 74 Years | 59 (44.0%) | 0 (0.0%) |
| 75 Years and over | 0 (0.0%) | 0 (0.0%) |
| Total | 113 (45.2%) | 0 (0.0%) |
Employment Status by Educational Attainment in Glen Arbor
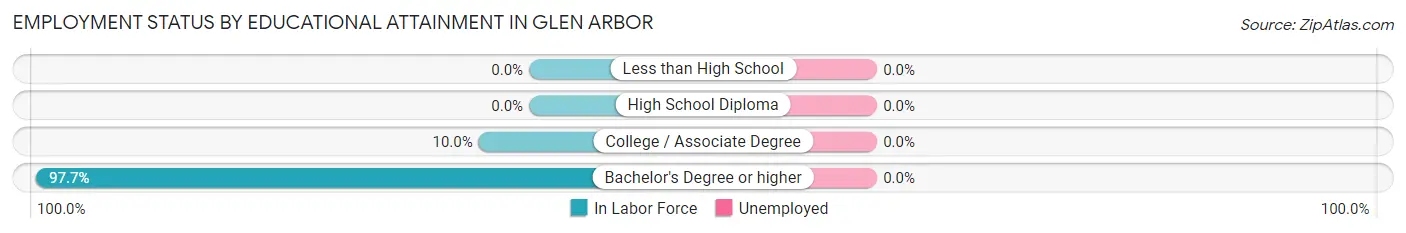
| Educational Attainment | In Labor Force | Unemployed |
| Less than High School | 0 (0.0%) | 0 (0.0%) |
| High School Diploma | 0 (0.0%) | 0 (0.0%) |
| College / Associate Degree | 1 (10.0%) | 0 (0.0%) |
| Bachelor's Degree or higher | 42 (97.7%) | 0 (0.0%) |
| Total | 43 (61.4%) | 0 (0.0%) |
Employment Occupations by Sex in Glen Arbor
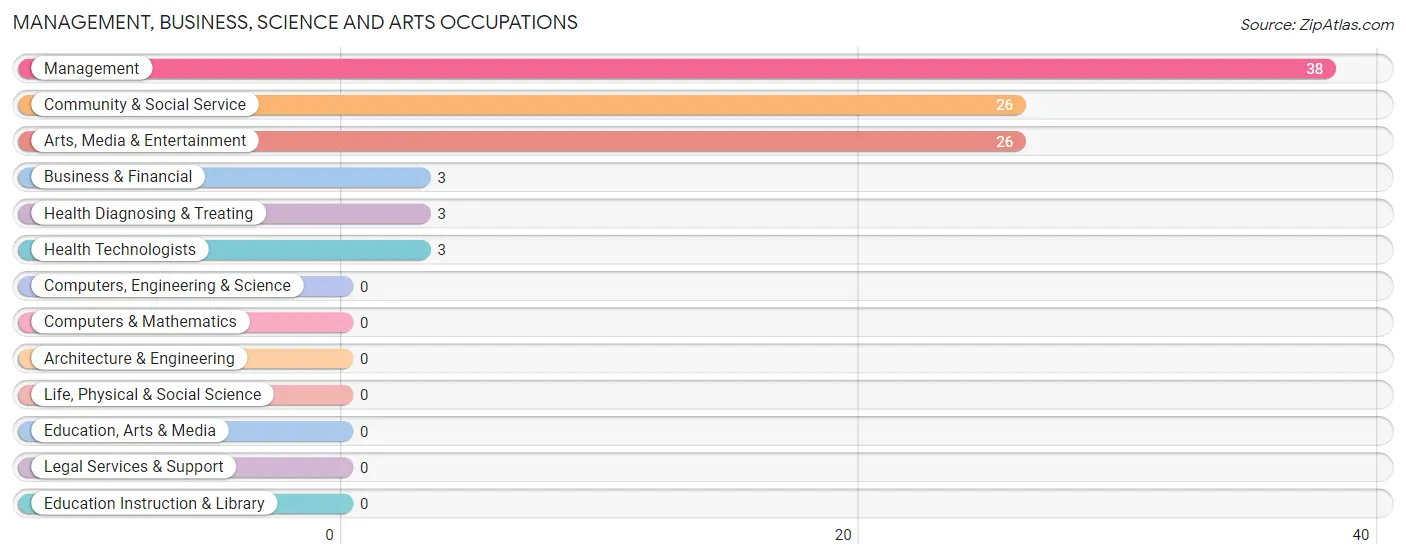
Management, Business, Science and Arts Occupations
The most common Management, Business, Science and Arts occupations in Glen Arbor are Management (38 | 33.6%), Community & Social Service (26 | 23.0%), Arts, Media & Entertainment (26 | 23.0%), Business & Financial (3 | 2.6%), and Health Diagnosing & Treating (3 | 2.6%).
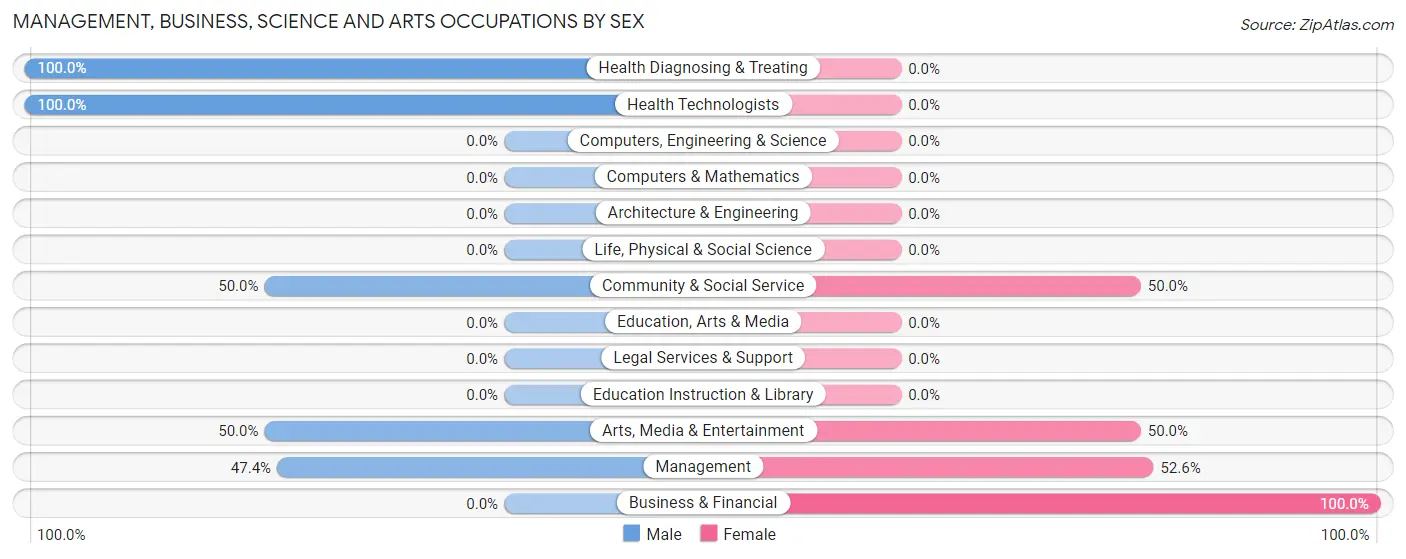
Management, Business, Science and Arts Occupations by Sex
Within the Management, Business, Science and Arts occupations in Glen Arbor, the most male-oriented occupations are Health Diagnosing & Treating (100.0%), Health Technologists (100.0%), and Community & Social Service (50.0%), while the most female-oriented occupations are Business & Financial (100.0%), Management (52.6%), and Community & Social Service (50.0%).
| Occupation | Male | Female |
| Management | 18 (47.4%) | 20 (52.6%) |
| Business & Financial | 0 (0.0%) | 3 (100.0%) |
| Computers, Engineering & Science | 0 (0.0%) | 0 (0.0%) |
| Computers & Mathematics | 0 (0.0%) | 0 (0.0%) |
| Architecture & Engineering | 0 (0.0%) | 0 (0.0%) |
| Life, Physical & Social Science | 0 (0.0%) | 0 (0.0%) |
| Community & Social Service | 13 (50.0%) | 13 (50.0%) |
| Education, Arts & Media | 0 (0.0%) | 0 (0.0%) |
| Legal Services & Support | 0 (0.0%) | 0 (0.0%) |
| Education Instruction & Library | 0 (0.0%) | 0 (0.0%) |
| Arts, Media & Entertainment | 13 (50.0%) | 13 (50.0%) |
| Health Diagnosing & Treating | 3 (100.0%) | 0 (0.0%) |
| Health Technologists | 3 (100.0%) | 0 (0.0%) |
| Total (Category) | 34 (48.6%) | 36 (51.4%) |
| Total (Overall) | 57 (50.4%) | 56 (49.6%) |
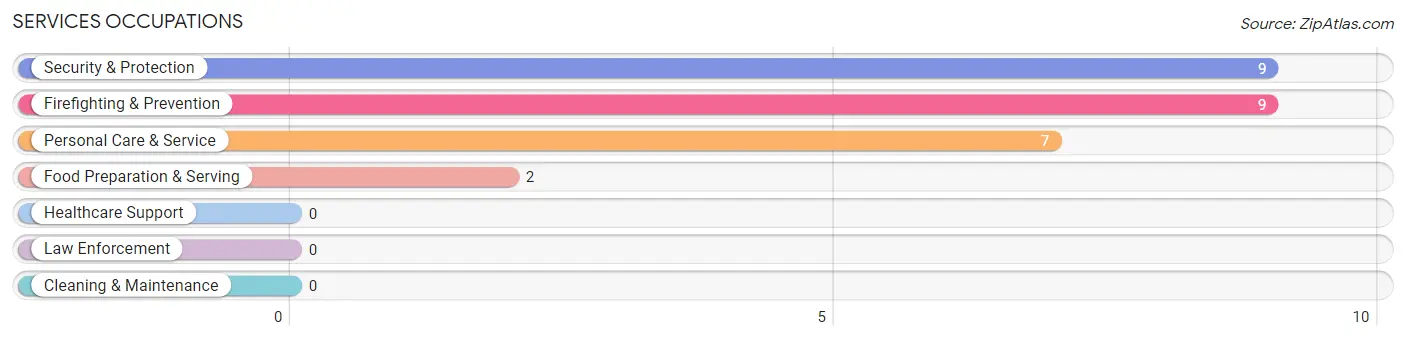
Services Occupations
The most common Services occupations in Glen Arbor are Security & Protection (9 | 8.0%), Firefighting & Prevention (9 | 8.0%), Personal Care & Service (7 | 6.2%), and Food Preparation & Serving (2 | 1.8%).
Services Occupations by Sex
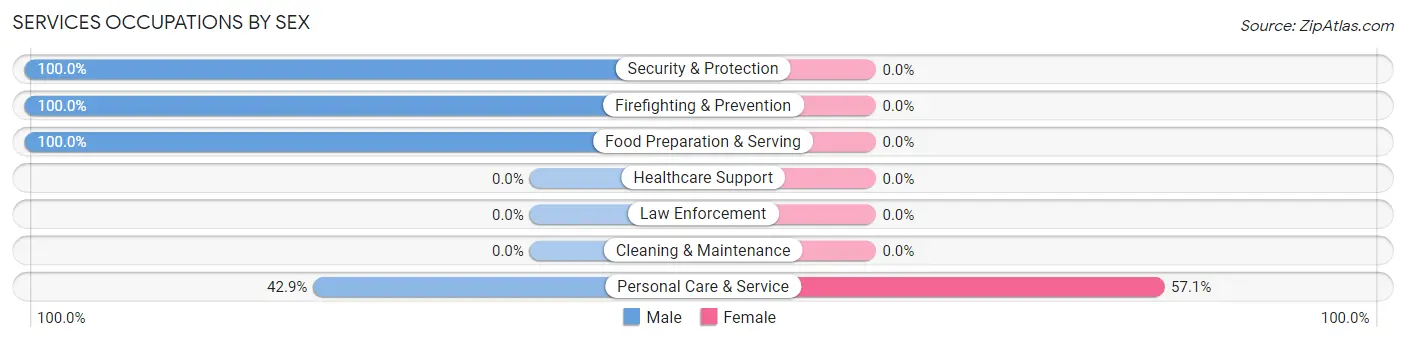
| Occupation | Male | Female |
| Healthcare Support | 0 (0.0%) | 0 (0.0%) |
| Security & Protection | 9 (100.0%) | 0 (0.0%) |
| Firefighting & Prevention | 9 (100.0%) | 0 (0.0%) |
| Law Enforcement | 0 (0.0%) | 0 (0.0%) |
| Food Preparation & Serving | 2 (100.0%) | 0 (0.0%) |
| Cleaning & Maintenance | 0 (0.0%) | 0 (0.0%) |
| Personal Care & Service | 3 (42.9%) | 4 (57.1%) |
| Total (Category) | 14 (77.8%) | 4 (22.2%) |
| Total (Overall) | 57 (50.4%) | 56 (49.6%) |
Sales and Office Occupations
The most common Sales and Office occupations in Glen Arbor are Sales & Related (8 | 7.1%), and Office & Administration (8 | 7.1%).
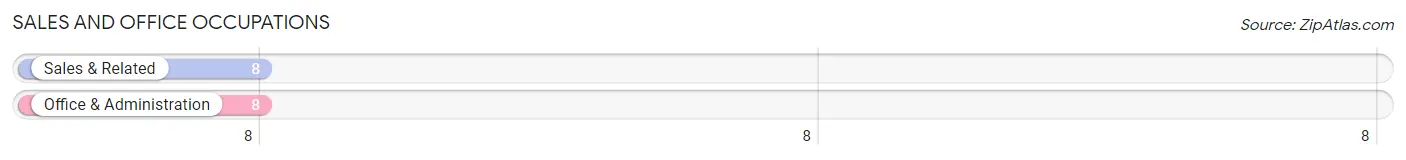
Sales and Office Occupations by Sex
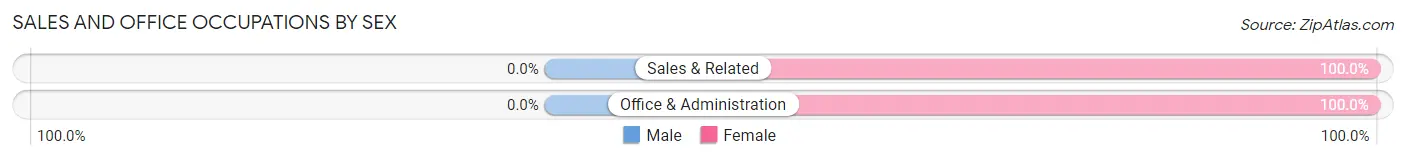
| Occupation | Male | Female |
| Sales & Related | 0 (0.0%) | 8 (100.0%) |
| Office & Administration | 0 (0.0%) | 8 (100.0%) |
| Total (Category) | 0 (0.0%) | 16 (100.0%) |
| Total (Overall) | 57 (50.4%) | 56 (49.6%) |
Natural Resources, Construction and Maintenance Occupations
The most common Natural Resources, Construction and Maintenance occupations in Glen Arbor are , and Construction & Extraction (9 | 8.0%).
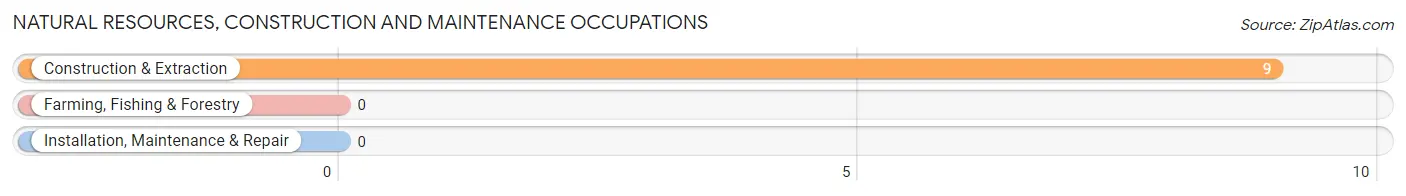
Natural Resources, Construction and Maintenance Occupations by Sex
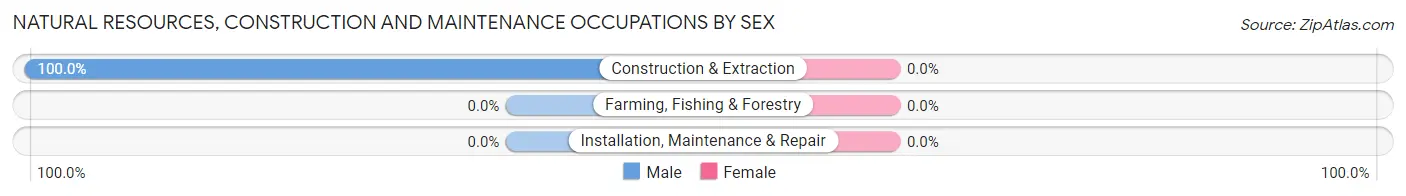
| Occupation | Male | Female |
| Farming, Fishing & Forestry | 0 (0.0%) | 0 (0.0%) |
| Construction & Extraction | 9 (100.0%) | 0 (0.0%) |
| Installation, Maintenance & Repair | 0 (0.0%) | 0 (0.0%) |
| Total (Category) | 9 (100.0%) | 0 (0.0%) |
| Total (Overall) | 57 (50.4%) | 56 (49.6%) |
Production, Transportation and Moving Occupations
Production, Transportation and Moving Occupations by Sex
| Occupation | Male | Female |
| Production | 0 (0.0%) | 0 (0.0%) |
| Transportation | 0 (0.0%) | 0 (0.0%) |
| Material Moving | 0 (0.0%) | 0 (0.0%) |
| Total (Category) | 0 (0.0%) | 0 (0.0%) |
| Total (Overall) | 57 (50.4%) | 56 (49.6%) |
Employment Industries by Sex in Glen Arbor
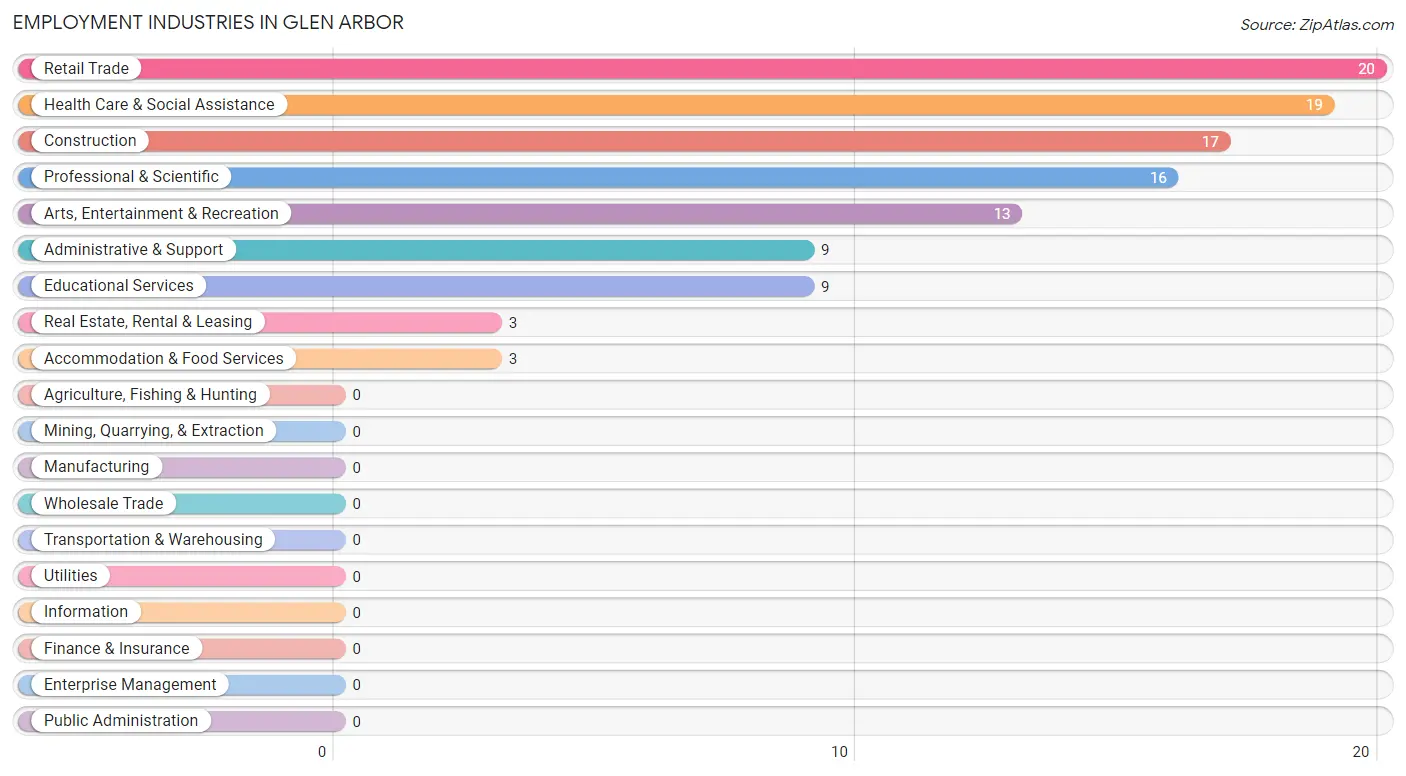
Employment Industries in Glen Arbor
The major employment industries in Glen Arbor include Retail Trade (20 | 17.7%), Health Care & Social Assistance (19 | 16.8%), Construction (17 | 15.0%), Professional & Scientific (16 | 14.2%), and Arts, Entertainment & Recreation (13 | 11.5%).
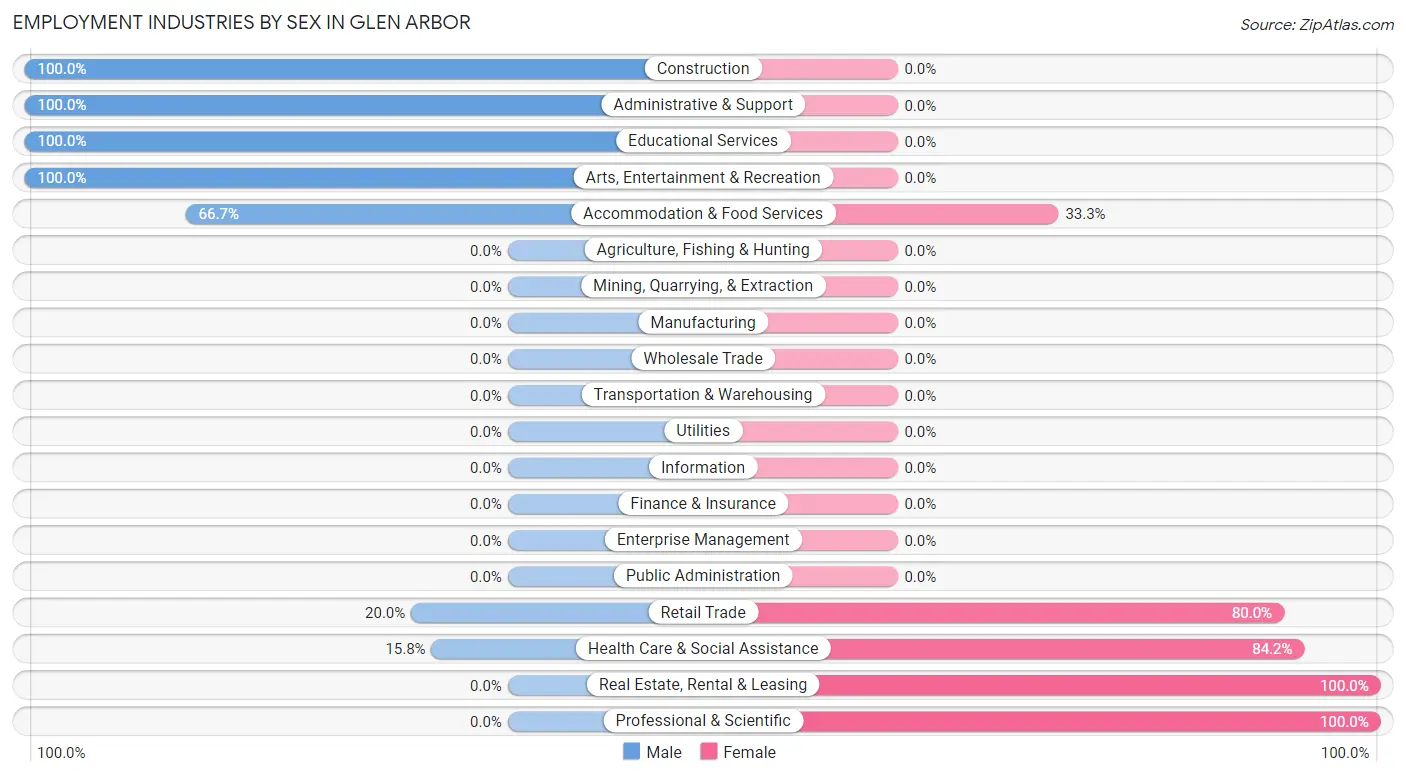
Employment Industries by Sex in Glen Arbor
The Glen Arbor industries that see more men than women are Construction (100.0%), Administrative & Support (100.0%), and Educational Services (100.0%), whereas the industries that tend to have a higher number of women are Real Estate, Rental & Leasing (100.0%), Professional & Scientific (100.0%), and Health Care & Social Assistance (84.2%).
| Industry | Male | Female |
| Agriculture, Fishing & Hunting | 0 (0.0%) | 0 (0.0%) |
| Mining, Quarrying, & Extraction | 0 (0.0%) | 0 (0.0%) |
| Construction | 17 (100.0%) | 0 (0.0%) |
| Manufacturing | 0 (0.0%) | 0 (0.0%) |
| Wholesale Trade | 0 (0.0%) | 0 (0.0%) |
| Retail Trade | 4 (20.0%) | 16 (80.0%) |
| Transportation & Warehousing | 0 (0.0%) | 0 (0.0%) |
| Utilities | 0 (0.0%) | 0 (0.0%) |
| Information | 0 (0.0%) | 0 (0.0%) |
| Finance & Insurance | 0 (0.0%) | 0 (0.0%) |
| Real Estate, Rental & Leasing | 0 (0.0%) | 3 (100.0%) |
| Professional & Scientific | 0 (0.0%) | 16 (100.0%) |
| Enterprise Management | 0 (0.0%) | 0 (0.0%) |
| Administrative & Support | 9 (100.0%) | 0 (0.0%) |
| Educational Services | 9 (100.0%) | 0 (0.0%) |
| Health Care & Social Assistance | 3 (15.8%) | 16 (84.2%) |
| Arts, Entertainment & Recreation | 13 (100.0%) | 0 (0.0%) |
| Accommodation & Food Services | 2 (66.7%) | 1 (33.3%) |
| Public Administration | 0 (0.0%) | 0 (0.0%) |
| Total | 57 (50.4%) | 56 (49.6%) |
Education in Glen Arbor
School Enrollment in Glen Arbor
The most common levels of schooling among the 40 students in Glen Arbor are high school (27 | 67.5%), middle school (12 | 30.0%), and elementary school (1 | 2.5%).
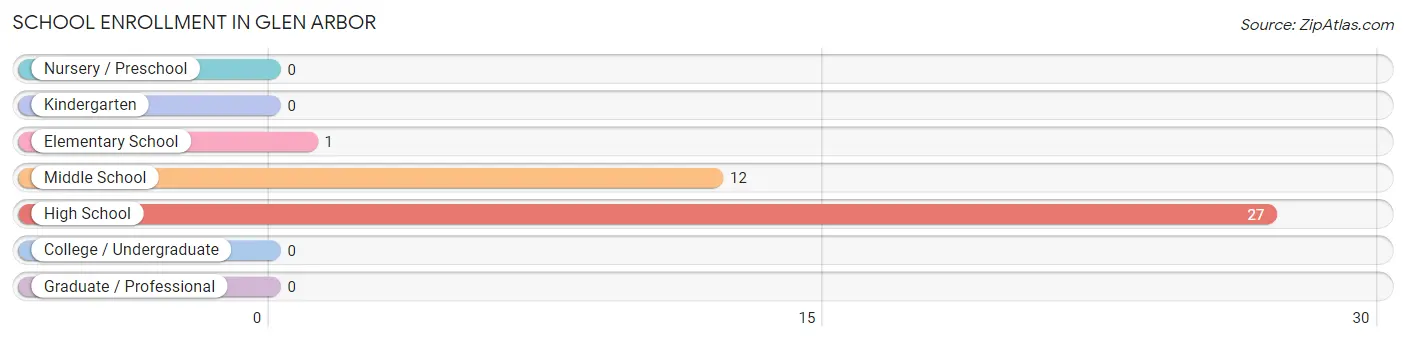
| School Level | # Students | % Students |
| Nursery / Preschool | 0 | 0.0% |
| Kindergarten | 0 | 0.0% |
| Elementary School | 1 | 2.5% |
| Middle School | 12 | 30.0% |
| High School | 27 | 67.5% |
| College / Undergraduate | 0 | 0.0% |
| Graduate / Professional | 0 | 0.0% |
| Total | 40 | 100.0% |
School Enrollment by Age by Funding Source in Glen Arbor
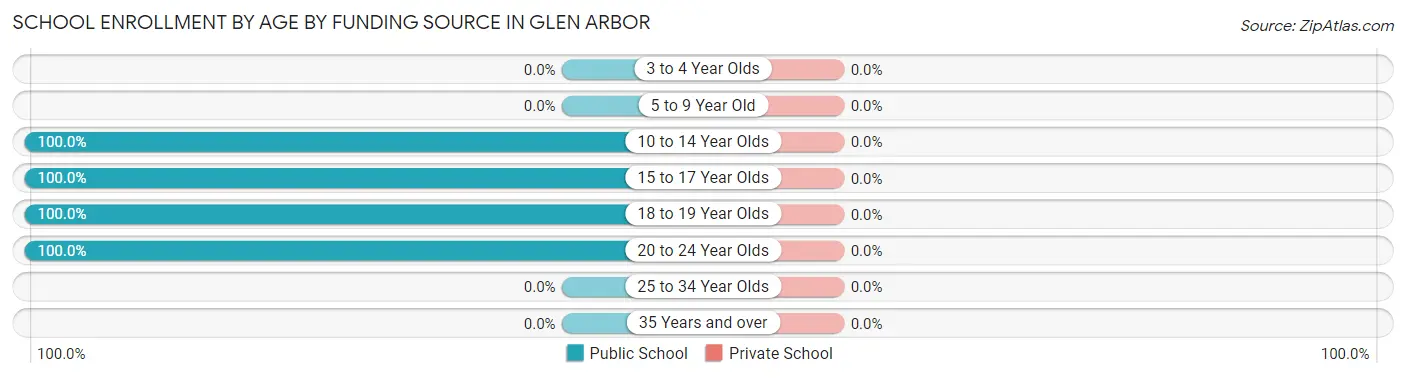
| Age Bracket | Public School | Private School |
| 3 to 4 Year Olds | 0 (0.0%) | 0 (0.0%) |
| 5 to 9 Year Old | 0 (0.0%) | 0 (0.0%) |
| 10 to 14 Year Olds | 13 (100.0%) | 0 (0.0%) |
| 15 to 17 Year Olds | 17 (100.0%) | 0 (0.0%) |
| 18 to 19 Year Olds | 1 (100.0%) | 0 (0.0%) |
| 20 to 24 Year Olds | 9 (100.0%) | 0 (0.0%) |
| 25 to 34 Year Olds | 0 (0.0%) | 0 (0.0%) |
| 35 Years and over | 0 (0.0%) | 0 (0.0%) |
| Total | 40 (100.0%) | 0 (0.0%) |
Educational Attainment by Field of Study in Glen Arbor
Communications (36 | 19.1%), business (31 | 16.4%), engineering (30 | 15.9%), education (25 | 13.2%), and psychology (16 | 8.5%) are the most common fields of study among 189 individuals in Glen Arbor who have obtained a bachelor's degree or higher.
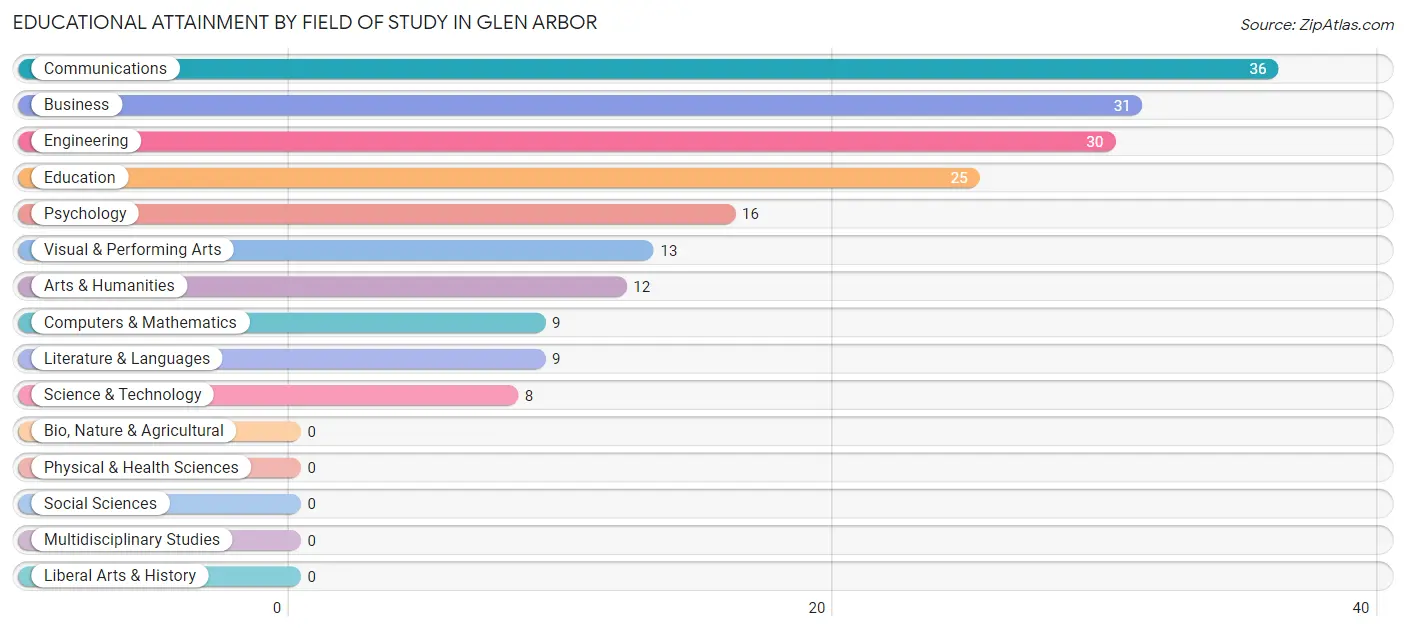
| Field of Study | # Graduates | % Graduates |
| Computers & Mathematics | 9 | 4.8% |
| Bio, Nature & Agricultural | 0 | 0.0% |
| Physical & Health Sciences | 0 | 0.0% |
| Psychology | 16 | 8.5% |
| Social Sciences | 0 | 0.0% |
| Engineering | 30 | 15.9% |
| Multidisciplinary Studies | 0 | 0.0% |
| Science & Technology | 8 | 4.2% |
| Business | 31 | 16.4% |
| Education | 25 | 13.2% |
| Literature & Languages | 9 | 4.8% |
| Liberal Arts & History | 0 | 0.0% |
| Visual & Performing Arts | 13 | 6.9% |
| Communications | 36 | 19.1% |
| Arts & Humanities | 12 | 6.4% |
| Total | 189 | 100.0% |
Transportation & Commute in Glen Arbor
Vehicle Availability by Sex in Glen Arbor
The most prevalent vehicle ownership categories in Glen Arbor are males with 2 vehicles (33, accounting for 57.9%) and females with 2 vehicles (44, making up 58.9%).
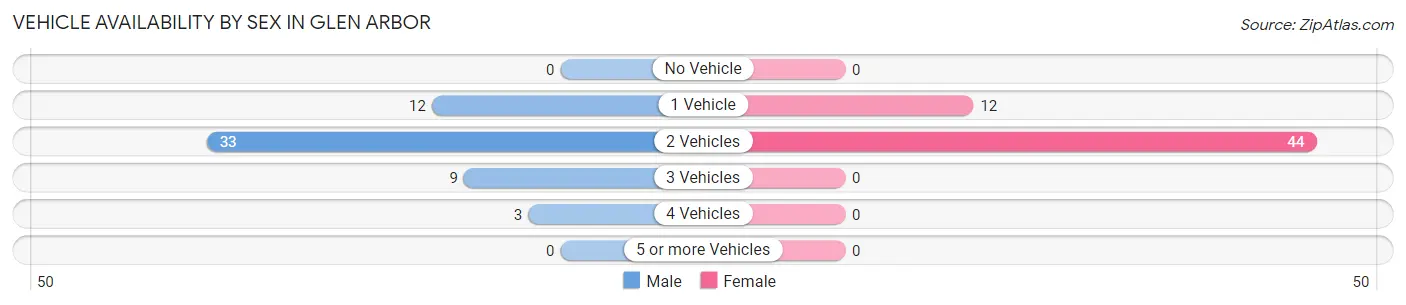
| Vehicles Available | Male | Female |
| No Vehicle | 0 (0.0%) | 0 (0.0%) |
| 1 Vehicle | 12 (21.0%) | 12 (21.4%) |
| 2 Vehicles | 33 (57.9%) | 44 (78.6%) |
| 3 Vehicles | 9 (15.8%) | 0 (0.0%) |
| 4 Vehicles | 3 (5.3%) | 0 (0.0%) |
| 5 or more Vehicles | 0 (0.0%) | 0 (0.0%) |
| Total | 57 (100.0%) | 56 (100.0%) |
Commute Time in Glen Arbor
The most frequently occuring commute durations in Glen Arbor are 5 to 9 minutes (20 commuters, 29.8%), 20 to 24 minutes (19 commuters, 28.4%), and less than 5 minutes (13 commuters, 19.4%).
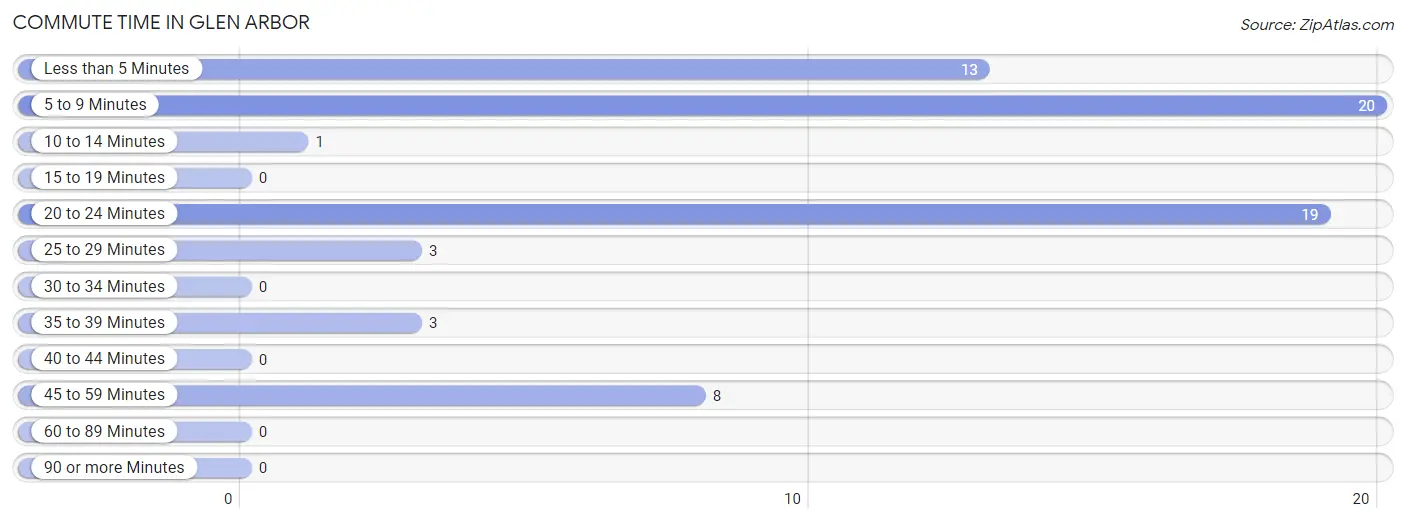
| Commute Time | # Commuters | % Commuters |
| Less than 5 Minutes | 13 | 19.4% |
| 5 to 9 Minutes | 20 | 29.8% |
| 10 to 14 Minutes | 1 | 1.5% |
| 15 to 19 Minutes | 0 | 0.0% |
| 20 to 24 Minutes | 19 | 28.4% |
| 25 to 29 Minutes | 3 | 4.5% |
| 30 to 34 Minutes | 0 | 0.0% |
| 35 to 39 Minutes | 3 | 4.5% |
| 40 to 44 Minutes | 0 | 0.0% |
| 45 to 59 Minutes | 8 | 11.9% |
| 60 to 89 Minutes | 0 | 0.0% |
| 90 or more Minutes | 0 | 0.0% |
Commute Time by Sex in Glen Arbor
The most common commute times in Glen Arbor are less than 5 minutes (13 commuters, 33.3%) for males and 20 to 24 minutes (16 commuters, 57.1%) for females.
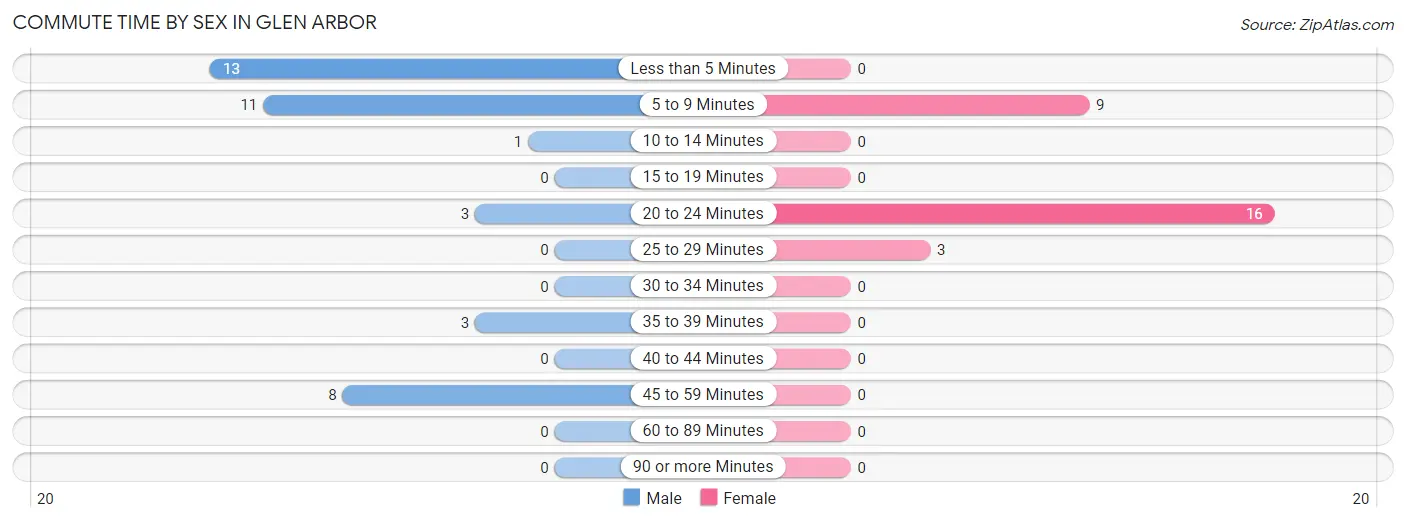
| Commute Time | Male | Female |
| Less than 5 Minutes | 13 (33.3%) | 0 (0.0%) |
| 5 to 9 Minutes | 11 (28.2%) | 9 (32.1%) |
| 10 to 14 Minutes | 1 (2.6%) | 0 (0.0%) |
| 15 to 19 Minutes | 0 (0.0%) | 0 (0.0%) |
| 20 to 24 Minutes | 3 (7.7%) | 16 (57.1%) |
| 25 to 29 Minutes | 0 (0.0%) | 3 (10.7%) |
| 30 to 34 Minutes | 0 (0.0%) | 0 (0.0%) |
| 35 to 39 Minutes | 3 (7.7%) | 0 (0.0%) |
| 40 to 44 Minutes | 0 (0.0%) | 0 (0.0%) |
| 45 to 59 Minutes | 8 (20.5%) | 0 (0.0%) |
| 60 to 89 Minutes | 0 (0.0%) | 0 (0.0%) |
| 90 or more Minutes | 0 (0.0%) | 0 (0.0%) |
Time of Departure to Work by Sex in Glen Arbor
The most frequent times of departure to work in Glen Arbor are 9:00 AM to 9:59 AM (13, 33.3%) for males and 8:00 AM to 8:29 AM (19, 67.9%) for females.
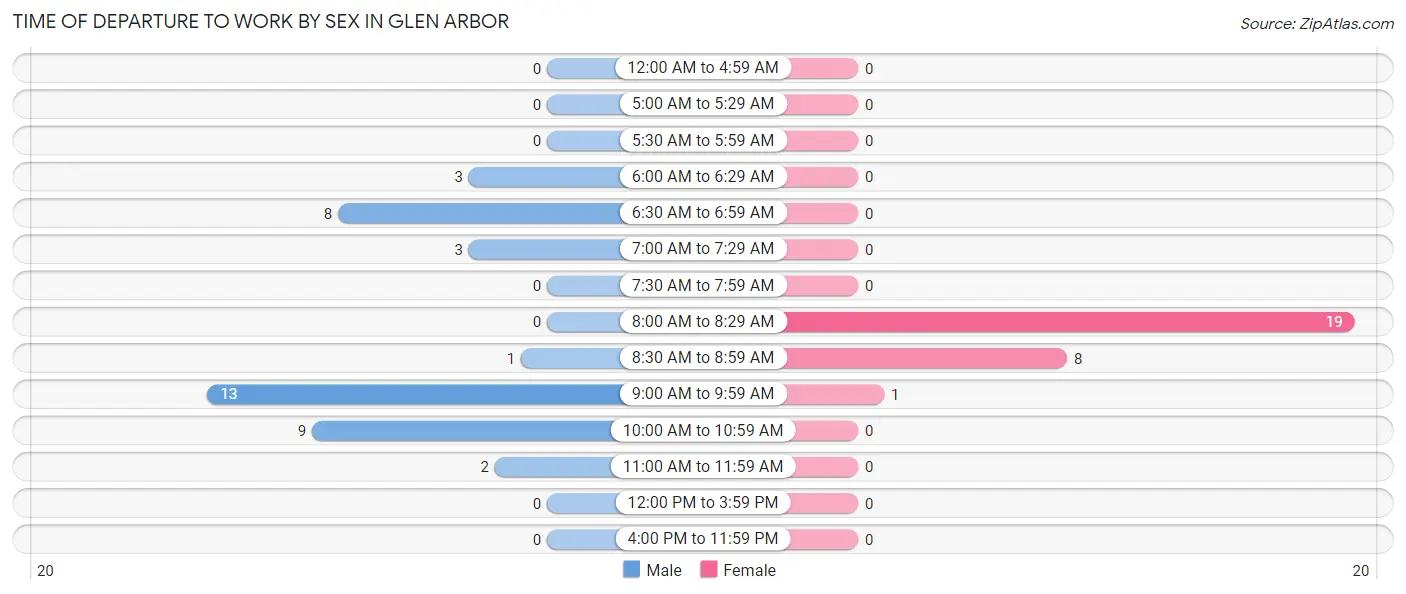
| Time of Departure | Male | Female |
| 12:00 AM to 4:59 AM | 0 (0.0%) | 0 (0.0%) |
| 5:00 AM to 5:29 AM | 0 (0.0%) | 0 (0.0%) |
| 5:30 AM to 5:59 AM | 0 (0.0%) | 0 (0.0%) |
| 6:00 AM to 6:29 AM | 3 (7.7%) | 0 (0.0%) |
| 6:30 AM to 6:59 AM | 8 (20.5%) | 0 (0.0%) |
| 7:00 AM to 7:29 AM | 3 (7.7%) | 0 (0.0%) |
| 7:30 AM to 7:59 AM | 0 (0.0%) | 0 (0.0%) |
| 8:00 AM to 8:29 AM | 0 (0.0%) | 19 (67.9%) |
| 8:30 AM to 8:59 AM | 1 (2.6%) | 8 (28.6%) |
| 9:00 AM to 9:59 AM | 13 (33.3%) | 1 (3.6%) |
| 10:00 AM to 10:59 AM | 9 (23.1%) | 0 (0.0%) |
| 11:00 AM to 11:59 AM | 2 (5.1%) | 0 (0.0%) |
| 12:00 PM to 3:59 PM | 0 (0.0%) | 0 (0.0%) |
| 4:00 PM to 11:59 PM | 0 (0.0%) | 0 (0.0%) |
| Total | 39 (100.0%) | 28 (100.0%) |
Housing Occupancy in Glen Arbor
Occupancy by Ownership in Glen Arbor
Of the total 142 dwellings in Glen Arbor, owner-occupied units account for 142 (100.0%), while renter-occupied units make up 0 (0.0%).
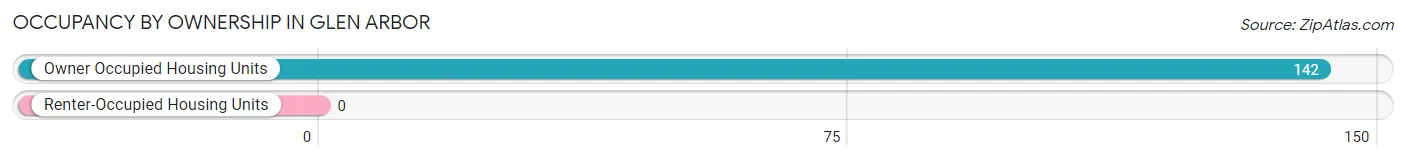
| Occupancy | # Housing Units | % Housing Units |
| Owner Occupied Housing Units | 142 | 100.0% |
| Renter-Occupied Housing Units | 0 | 0.0% |
| Total Occupied Housing Units | 142 | 100.0% |
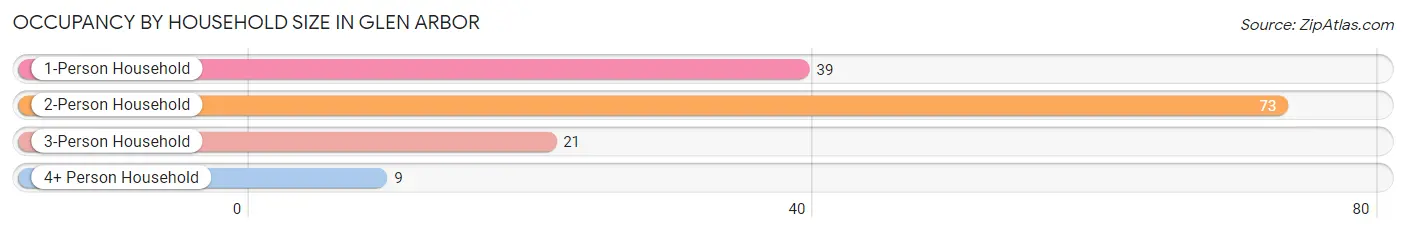
Occupancy by Household Size in Glen Arbor
| Household Size | # Housing Units | % Housing Units |
| 1-Person Household | 39 | 27.5% |
| 2-Person Household | 73 | 51.4% |
| 3-Person Household | 21 | 14.8% |
| 4+ Person Household | 9 | 6.3% |
| Total Housing Units | 142 | 100.0% |
Occupancy by Ownership by Household Size in Glen Arbor
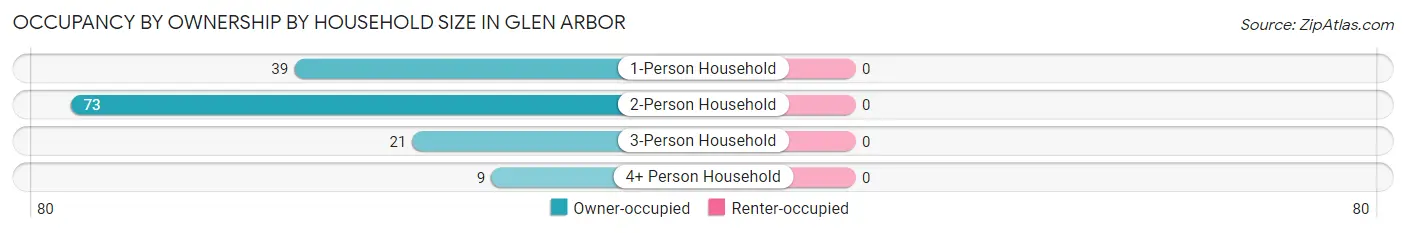
| Household Size | Owner-occupied | Renter-occupied |
| 1-Person Household | 39 (100.0%) | 0 (0.0%) |
| 2-Person Household | 73 (100.0%) | 0 (0.0%) |
| 3-Person Household | 21 (100.0%) | 0 (0.0%) |
| 4+ Person Household | 9 (100.0%) | 0 (0.0%) |
| Total Housing Units | 142 (100.0%) | 0 (0.0%) |
Occupancy by Educational Attainment in Glen Arbor
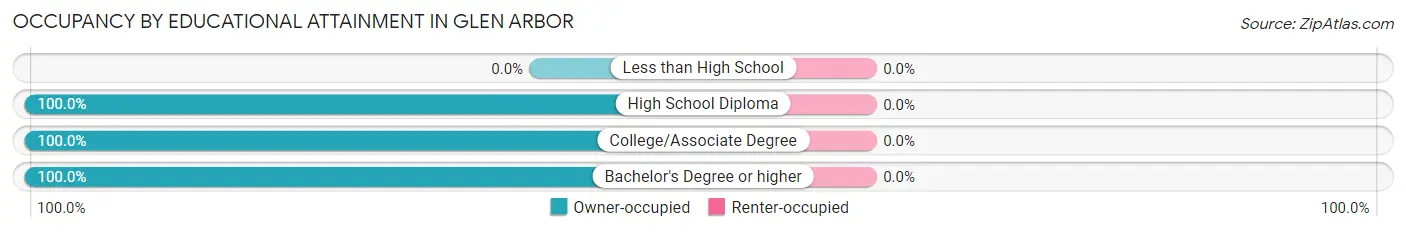
| Household Size | Owner-occupied | Renter-occupied |
| Less than High School | 0 (0.0%) | 0 (0.0%) |
| High School Diploma | 20 (100.0%) | 0 (0.0%) |
| College/Associate Degree | 9 (100.0%) | 0 (0.0%) |
| Bachelor's Degree or higher | 113 (100.0%) | 0 (0.0%) |
Occupancy by Age of Householder in Glen Arbor
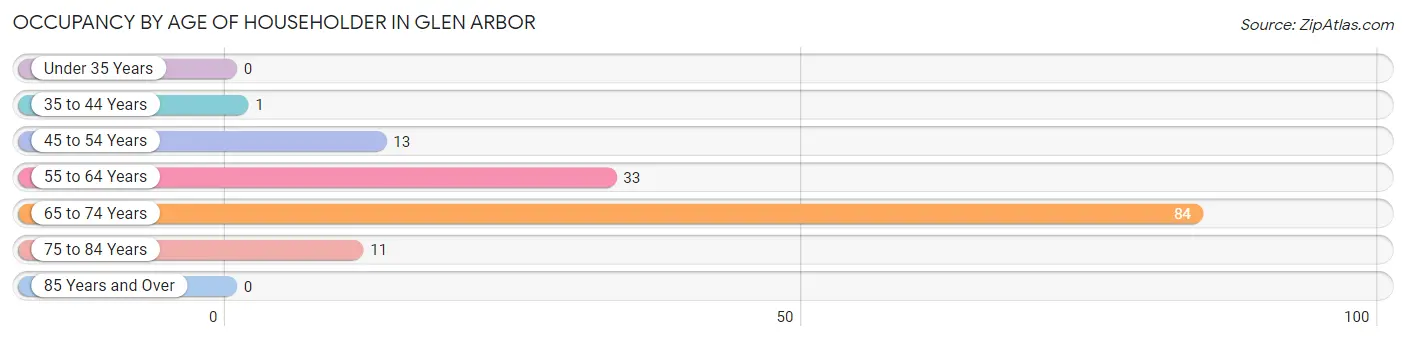
| Age Bracket | # Households | % Households |
| Under 35 Years | 0 | 0.0% |
| 35 to 44 Years | 1 | 0.7% |
| 45 to 54 Years | 13 | 9.1% |
| 55 to 64 Years | 33 | 23.2% |
| 65 to 74 Years | 84 | 59.2% |
| 75 to 84 Years | 11 | 7.7% |
| 85 Years and Over | 0 | 0.0% |
| Total | 142 | 100.0% |
Housing Finances in Glen Arbor
Median Income by Occupancy in Glen Arbor
| Occupancy Type | # Households | Median Income |
| Owner-Occupied | 142 (100.0%) | $0 |
| Renter-Occupied | 0 (0.0%) | $0 |
| Average | 142 (100.0%) | $0 |
Occupancy by Householder Income Bracket in Glen Arbor
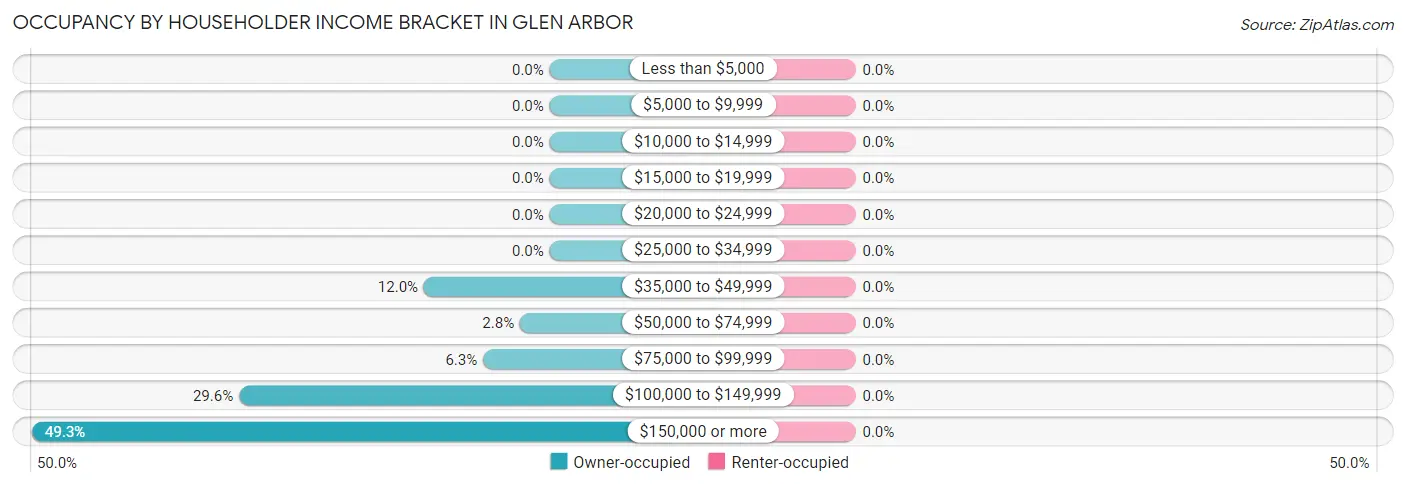
| Income Bracket | Owner-occupied | Renter-occupied |
| Less than $5,000 | 0 (0.0%) | 0 (0.0%) |
| $5,000 to $9,999 | 0 (0.0%) | 0 (0.0%) |
| $10,000 to $14,999 | 0 (0.0%) | 0 (0.0%) |
| $15,000 to $19,999 | 0 (0.0%) | 0 (0.0%) |
| $20,000 to $24,999 | 0 (0.0%) | 0 (0.0%) |
| $25,000 to $34,999 | 0 (0.0%) | 0 (0.0%) |
| $35,000 to $49,999 | 17 (12.0%) | 0 (0.0%) |
| $50,000 to $74,999 | 4 (2.8%) | 0 (0.0%) |
| $75,000 to $99,999 | 9 (6.3%) | 0 (0.0%) |
| $100,000 to $149,999 | 42 (29.6%) | 0 (0.0%) |
| $150,000 or more | 70 (49.3%) | 0 (0.0%) |
| Total | 142 (100.0%) | 0 (0.0%) |
Monthly Housing Cost Tiers in Glen Arbor
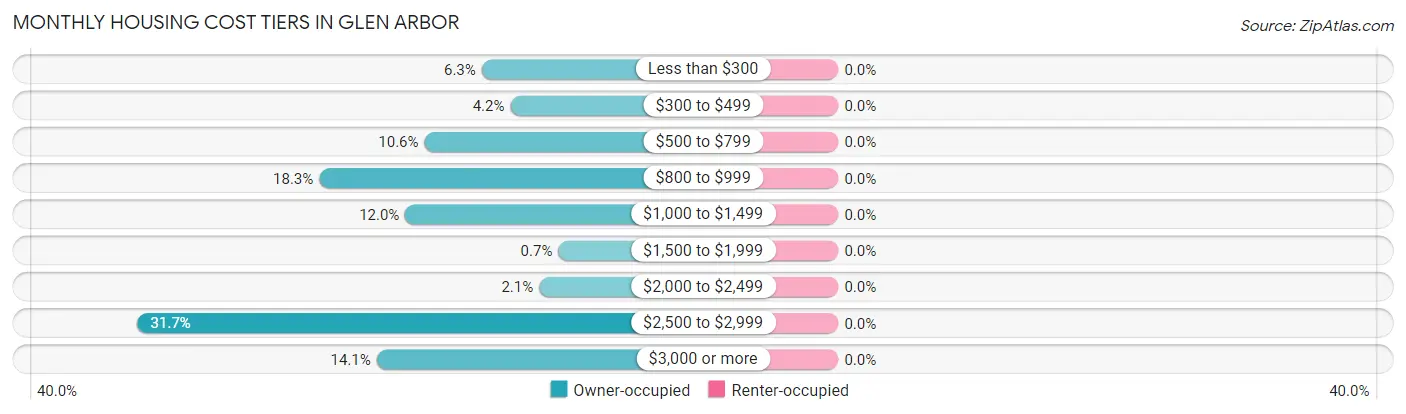
| Monthly Cost | Owner-occupied | Renter-occupied |
| Less than $300 | 9 (6.3%) | 0 (0.0%) |
| $300 to $499 | 6 (4.2%) | 0 (0.0%) |
| $500 to $799 | 15 (10.6%) | 0 (0.0%) |
| $800 to $999 | 26 (18.3%) | 0 (0.0%) |
| $1,000 to $1,499 | 17 (12.0%) | 0 (0.0%) |
| $1,500 to $1,999 | 1 (0.7%) | 0 (0.0%) |
| $2,000 to $2,499 | 3 (2.1%) | 0 (0.0%) |
| $2,500 to $2,999 | 45 (31.7%) | 0 (0.0%) |
| $3,000 or more | 20 (14.1%) | 0 (0.0%) |
| Total | 142 (100.0%) | 0 (0.0%) |
Physical Housing Characteristics in Glen Arbor
Housing Structures in Glen Arbor
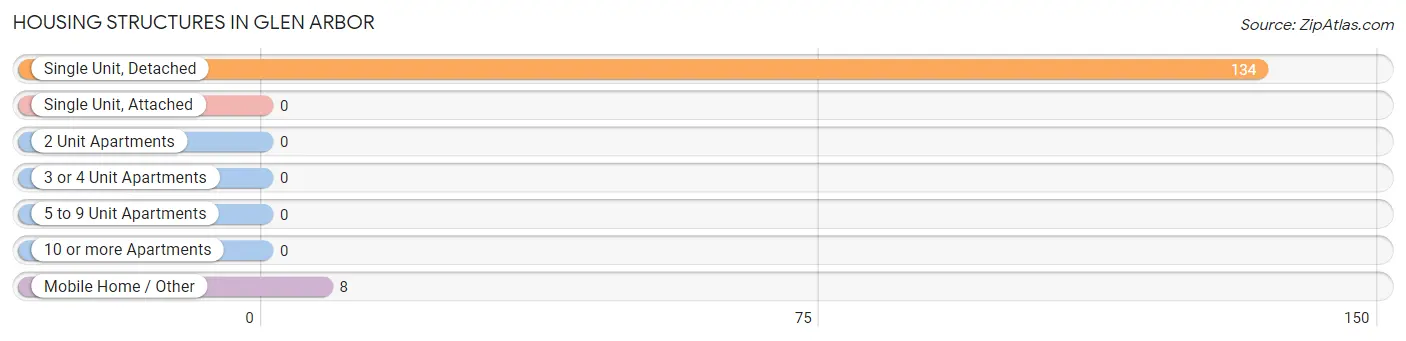
| Structure Type | # Housing Units | % Housing Units |
| Single Unit, Detached | 134 | 94.4% |
| Single Unit, Attached | 0 | 0.0% |
| 2 Unit Apartments | 0 | 0.0% |
| 3 or 4 Unit Apartments | 0 | 0.0% |
| 5 to 9 Unit Apartments | 0 | 0.0% |
| 10 or more Apartments | 0 | 0.0% |
| Mobile Home / Other | 8 | 5.6% |
| Total | 142 | 100.0% |
Housing Structures by Occupancy in Glen Arbor
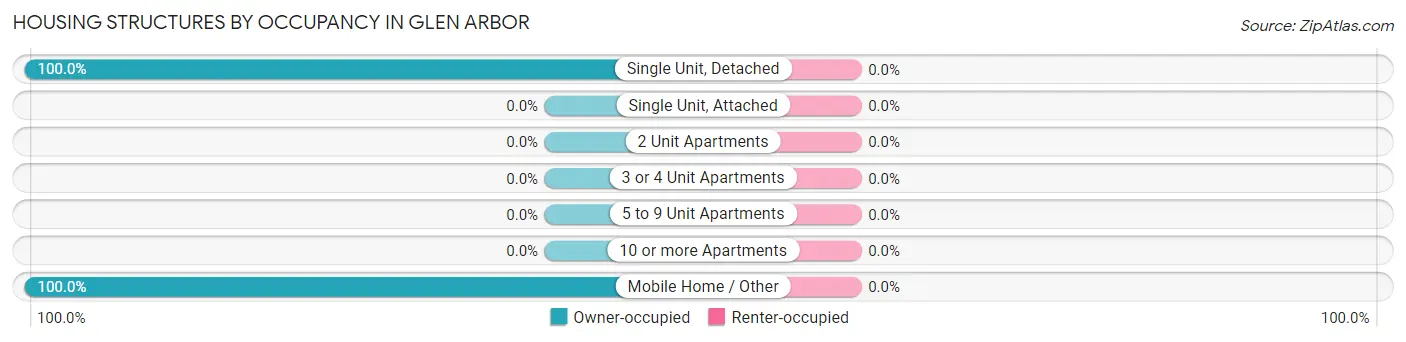
| Structure Type | Owner-occupied | Renter-occupied |
| Single Unit, Detached | 134 (100.0%) | 0 (0.0%) |
| Single Unit, Attached | 0 (0.0%) | 0 (0.0%) |
| 2 Unit Apartments | 0 (0.0%) | 0 (0.0%) |
| 3 or 4 Unit Apartments | 0 (0.0%) | 0 (0.0%) |
| 5 to 9 Unit Apartments | 0 (0.0%) | 0 (0.0%) |
| 10 or more Apartments | 0 (0.0%) | 0 (0.0%) |
| Mobile Home / Other | 8 (100.0%) | 0 (0.0%) |
| Total | 142 (100.0%) | 0 (0.0%) |
Housing Structures by Number of Rooms in Glen Arbor
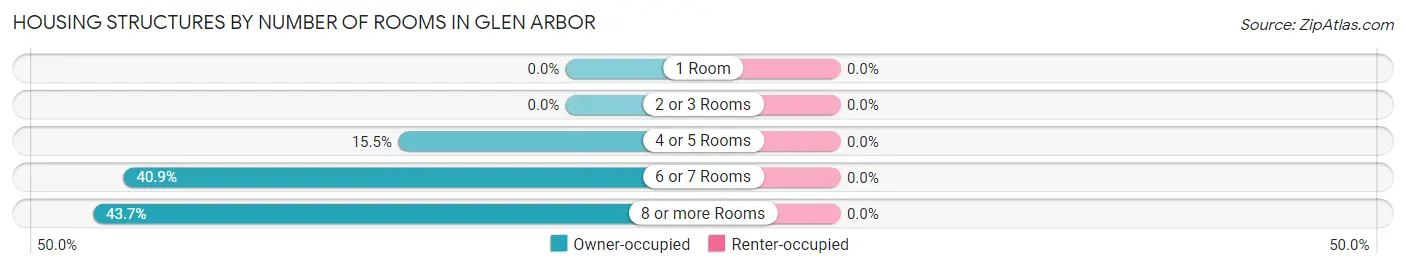
| Number of Rooms | Owner-occupied | Renter-occupied |
| 1 Room | 0 (0.0%) | 0 (0.0%) |
| 2 or 3 Rooms | 0 (0.0%) | 0 (0.0%) |
| 4 or 5 Rooms | 22 (15.5%) | 0 (0.0%) |
| 6 or 7 Rooms | 58 (40.8%) | 0 (0.0%) |
| 8 or more Rooms | 62 (43.7%) | 0 (0.0%) |
| Total | 142 (100.0%) | 0 (0.0%) |
Housing Structure by Heating Type in Glen Arbor
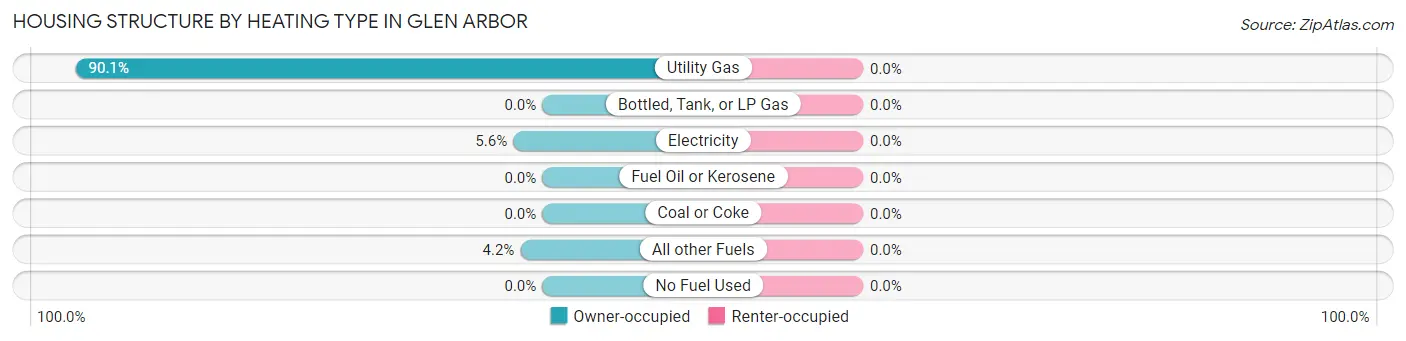
| Heating Type | Owner-occupied | Renter-occupied |
| Utility Gas | 128 (90.1%) | 0 (0.0%) |
| Bottled, Tank, or LP Gas | 0 (0.0%) | 0 (0.0%) |
| Electricity | 8 (5.6%) | 0 (0.0%) |
| Fuel Oil or Kerosene | 0 (0.0%) | 0 (0.0%) |
| Coal or Coke | 0 (0.0%) | 0 (0.0%) |
| All other Fuels | 6 (4.2%) | 0 (0.0%) |
| No Fuel Used | 0 (0.0%) | 0 (0.0%) |
| Total | 142 (100.0%) | 0 (0.0%) |
Household Vehicle Usage in Glen Arbor
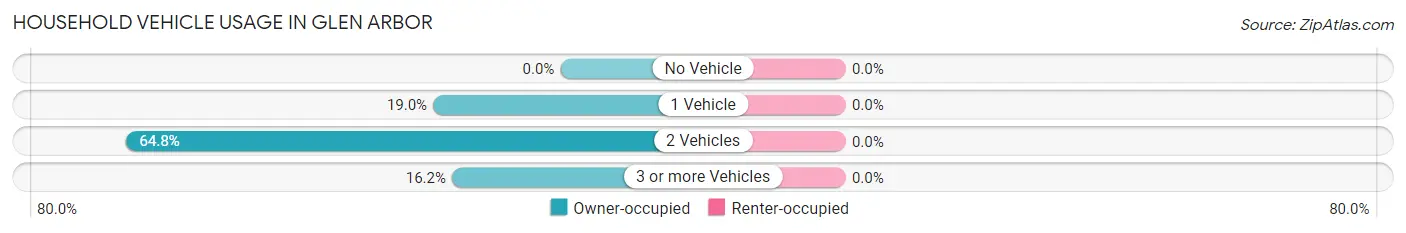
| Vehicles per Household | Owner-occupied | Renter-occupied |
| No Vehicle | 0 (0.0%) | 0 (0.0%) |
| 1 Vehicle | 27 (19.0%) | 0 (0.0%) |
| 2 Vehicles | 92 (64.8%) | 0 (0.0%) |
| 3 or more Vehicles | 23 (16.2%) | 0 (0.0%) |
| Total | 142 (100.0%) | 0 (0.0%) |
Real Estate & Mortgages in Glen Arbor
Real Estate and Mortgage Overview in Glen Arbor
| Characteristic | Without Mortgage | With Mortgage |
| Housing Units | 63 | 79 |
| Median Property Value | $722,800 | $621,700 |
| Median Household Income | $115,156 | $46 |
| Monthly Housing Costs | $834 | $20 |
| Real Estate Taxes | $4,119 | $0 |
Property Value by Mortgage Status in Glen Arbor
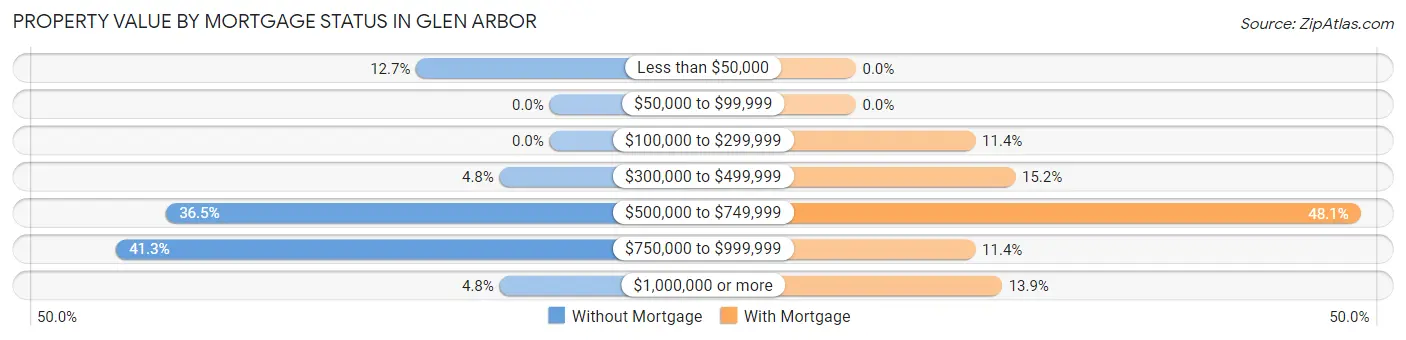
| Property Value | Without Mortgage | With Mortgage |
| Less than $50,000 | 8 (12.7%) | 0 (0.0%) |
| $50,000 to $99,999 | 0 (0.0%) | 0 (0.0%) |
| $100,000 to $299,999 | 0 (0.0%) | 9 (11.4%) |
| $300,000 to $499,999 | 3 (4.8%) | 12 (15.2%) |
| $500,000 to $749,999 | 23 (36.5%) | 38 (48.1%) |
| $750,000 to $999,999 | 26 (41.3%) | 9 (11.4%) |
| $1,000,000 or more | 3 (4.8%) | 11 (13.9%) |
| Total | 63 (100.0%) | 79 (100.0%) |
Household Income by Mortgage Status in Glen Arbor
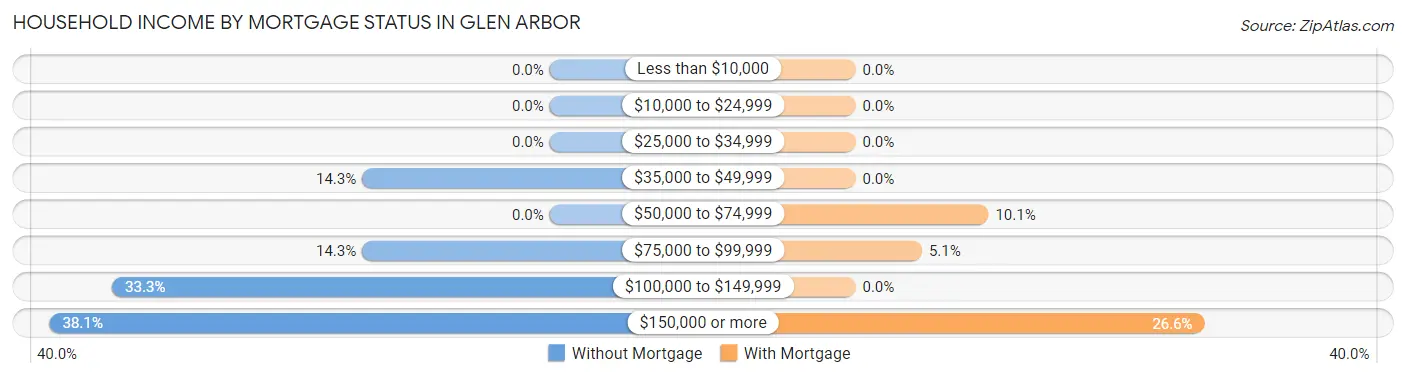
| Household Income | Without Mortgage | With Mortgage |
| Less than $10,000 | 0 (0.0%) | 0 (0.0%) |
| $10,000 to $24,999 | 0 (0.0%) | 0 (0.0%) |
| $25,000 to $34,999 | 0 (0.0%) | 0 (0.0%) |
| $35,000 to $49,999 | 9 (14.3%) | 0 (0.0%) |
| $50,000 to $74,999 | 0 (0.0%) | 8 (10.1%) |
| $75,000 to $99,999 | 9 (14.3%) | 4 (5.1%) |
| $100,000 to $149,999 | 21 (33.3%) | 0 (0.0%) |
| $150,000 or more | 24 (38.1%) | 21 (26.6%) |
| Total | 63 (100.0%) | 79 (100.0%) |
Property Value to Household Income Ratio in Glen Arbor
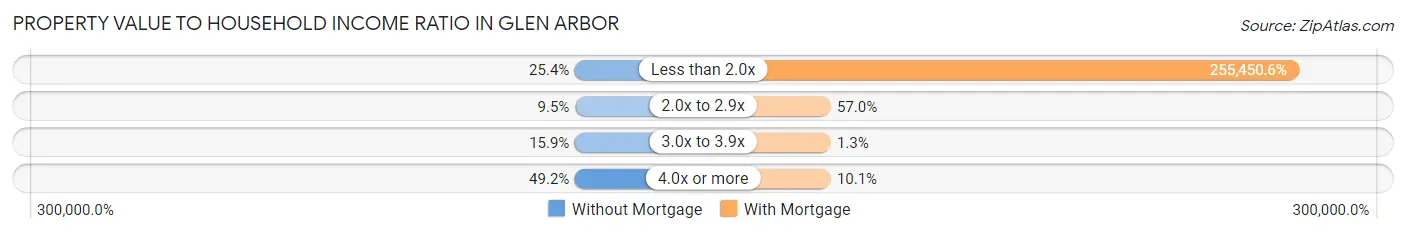
| Value-to-Income Ratio | Without Mortgage | With Mortgage |
| Less than 2.0x | 16 (25.4%) | 201,806 (255,450.6%) |
| 2.0x to 2.9x | 6 (9.5%) | 45 (57.0%) |
| 3.0x to 3.9x | 10 (15.9%) | 1 (1.3%) |
| 4.0x or more | 31 (49.2%) | 8 (10.1%) |
| Total | 63 (100.0%) | 79 (100.0%) |
Real Estate Taxes by Mortgage Status in Glen Arbor
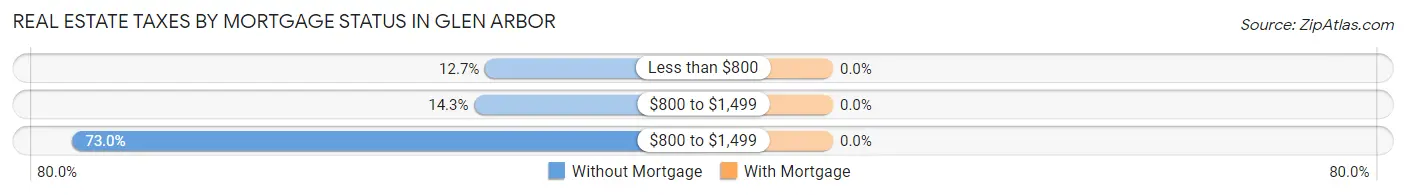
| Property Taxes | Without Mortgage | With Mortgage |
| Less than $800 | 8 (12.7%) | 0 (0.0%) |
| $800 to $1,499 | 9 (14.3%) | 0 (0.0%) |
| $800 to $1,499 | 46 (73.0%) | 0 (0.0%) |
| Total | 63 (100.0%) | 79 (100.0%) |
Health & Disability in Glen Arbor
Health Insurance Coverage by Age in Glen Arbor
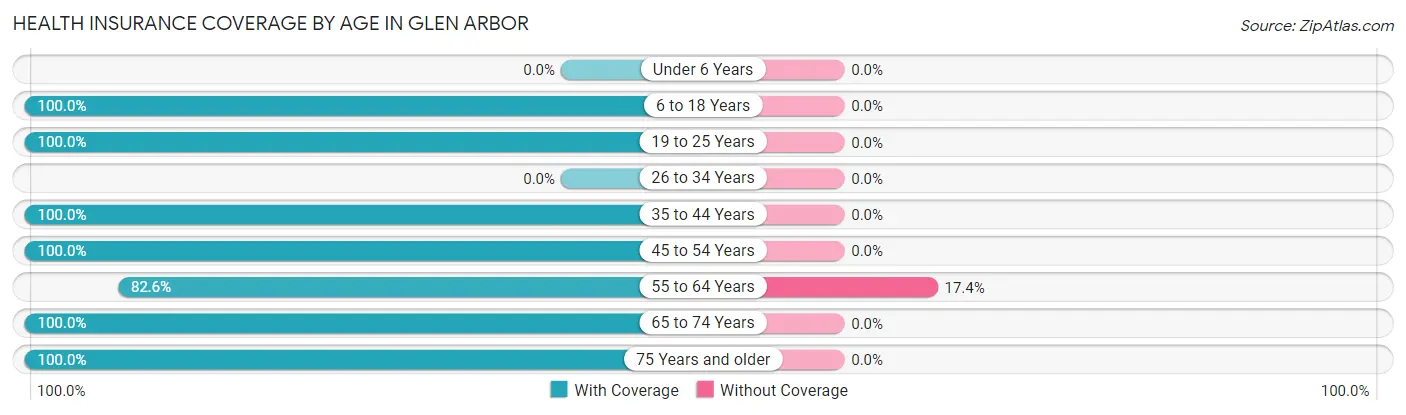
| Age Bracket | With Coverage | Without Coverage |
| Under 6 Years | 0 (0.0%) | 0 (0.0%) |
| 6 to 18 Years | 31 (100.0%) | 0 (0.0%) |
| 19 to 25 Years | 18 (100.0%) | 0 (0.0%) |
| 26 to 34 Years | 0 (0.0%) | 0 (0.0%) |
| 35 to 44 Years | 2 (100.0%) | 0 (0.0%) |
| 45 to 54 Years | 22 (100.0%) | 0 (0.0%) |
| 55 to 64 Years | 38 (82.6%) | 8 (17.4%) |
| 65 to 74 Years | 134 (100.0%) | 0 (0.0%) |
| 75 Years and older | 18 (100.0%) | 0 (0.0%) |
| Total | 263 (97.1%) | 8 (2.9%) |
Health Insurance Coverage by Citizenship Status in Glen Arbor
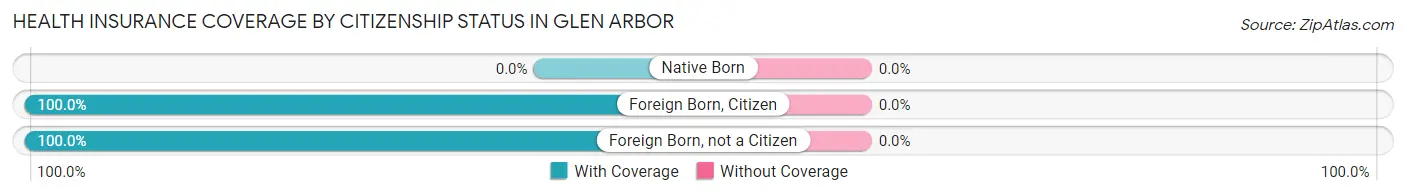
| Citizenship Status | With Coverage | Without Coverage |
| Native Born | 0 (0.0%) | 0 (0.0%) |
| Foreign Born, Citizen | 31 (100.0%) | 0 (0.0%) |
| Foreign Born, not a Citizen | 18 (100.0%) | 0 (0.0%) |
Health Insurance Coverage by Household Income in Glen Arbor
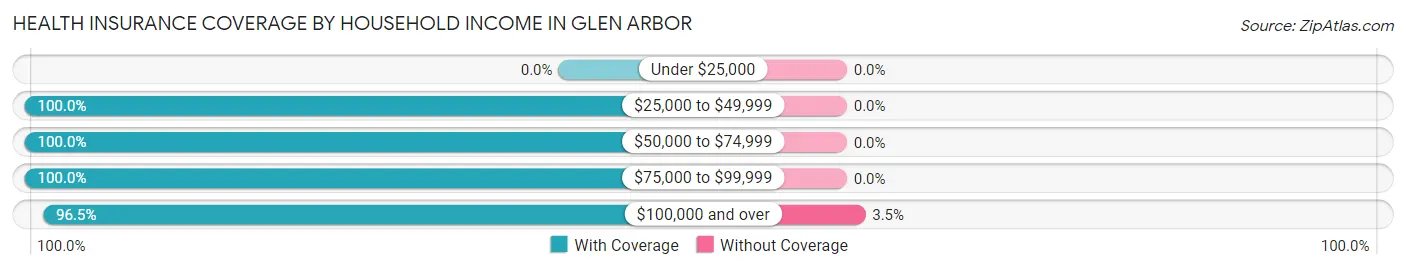
| Household Income | With Coverage | Without Coverage |
| Under $25,000 | 0 (0.0%) | 0 (0.0%) |
| $25,000 to $49,999 | 24 (100.0%) | 0 (0.0%) |
| $50,000 to $74,999 | 7 (100.0%) | 0 (0.0%) |
| $75,000 to $99,999 | 9 (100.0%) | 0 (0.0%) |
| $100,000 and over | 223 (96.5%) | 8 (3.5%) |
Public vs Private Health Insurance Coverage by Age in Glen Arbor
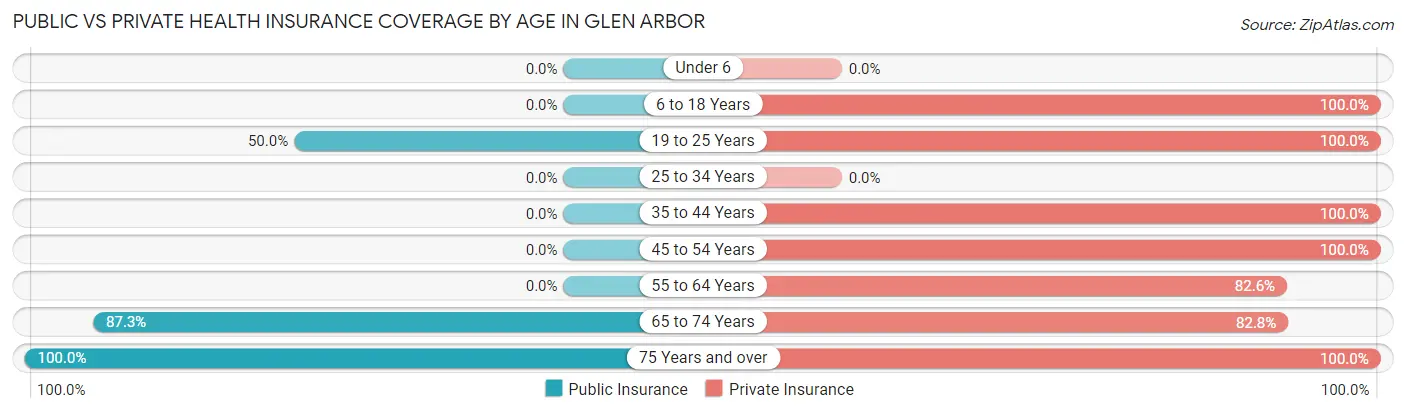
| Age Bracket | Public Insurance | Private Insurance |
| Under 6 | 0 (0.0%) | 0 (0.0%) |
| 6 to 18 Years | 0 (0.0%) | 31 (100.0%) |
| 19 to 25 Years | 9 (50.0%) | 18 (100.0%) |
| 25 to 34 Years | 0 (0.0%) | 0 (0.0%) |
| 35 to 44 Years | 0 (0.0%) | 2 (100.0%) |
| 45 to 54 Years | 0 (0.0%) | 22 (100.0%) |
| 55 to 64 Years | 0 (0.0%) | 38 (82.6%) |
| 65 to 74 Years | 117 (87.3%) | 111 (82.8%) |
| 75 Years and over | 18 (100.0%) | 18 (100.0%) |
| Total | 144 (53.1%) | 240 (88.6%) |
Disability Status by Sex by Age in Glen Arbor
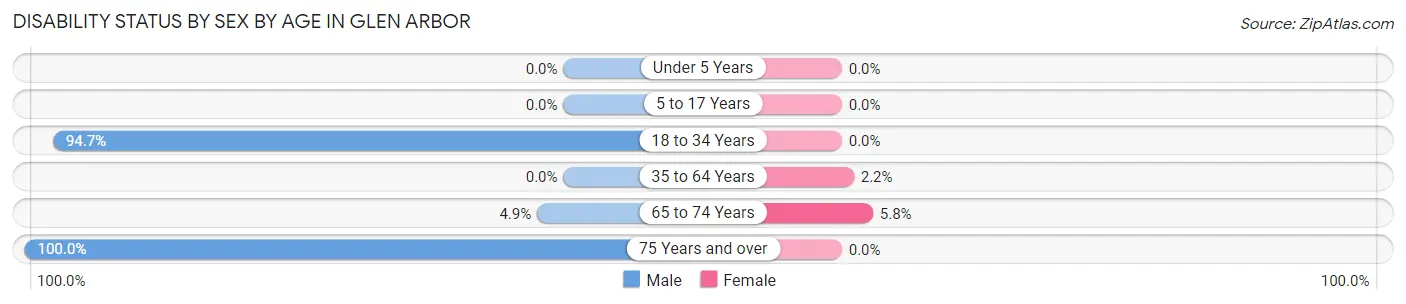
| Age Bracket | Male | Female |
| Under 5 Years | 0 (0.0%) | 0 (0.0%) |
| 5 to 17 Years | 0 (0.0%) | 0 (0.0%) |
| 18 to 34 Years | 18 (94.7%) | 0 (0.0%) |
| 35 to 64 Years | 0 (0.0%) | 1 (2.2%) |
| 65 to 74 Years | 4 (4.9%) | 3 (5.8%) |
| 75 Years and over | 8 (100.0%) | 0 (0.0%) |
Disability Class by Sex by Age in Glen Arbor
Disability Class: Hearing Difficulty
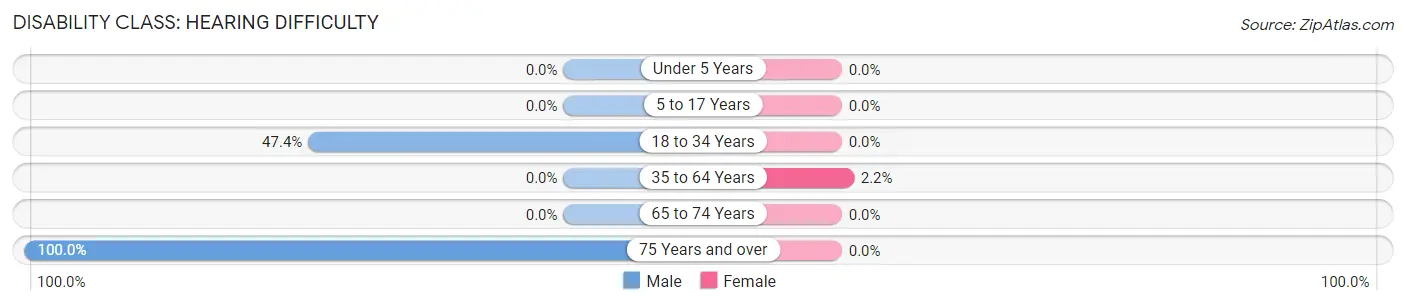
| Age Bracket | Male | Female |
| Under 5 Years | 0 (0.0%) | 0 (0.0%) |
| 5 to 17 Years | 0 (0.0%) | 0 (0.0%) |
| 18 to 34 Years | 9 (47.4%) | 0 (0.0%) |
| 35 to 64 Years | 0 (0.0%) | 1 (2.2%) |
| 65 to 74 Years | 0 (0.0%) | 0 (0.0%) |
| 75 Years and over | 8 (100.0%) | 0 (0.0%) |
Disability Class: Vision Difficulty
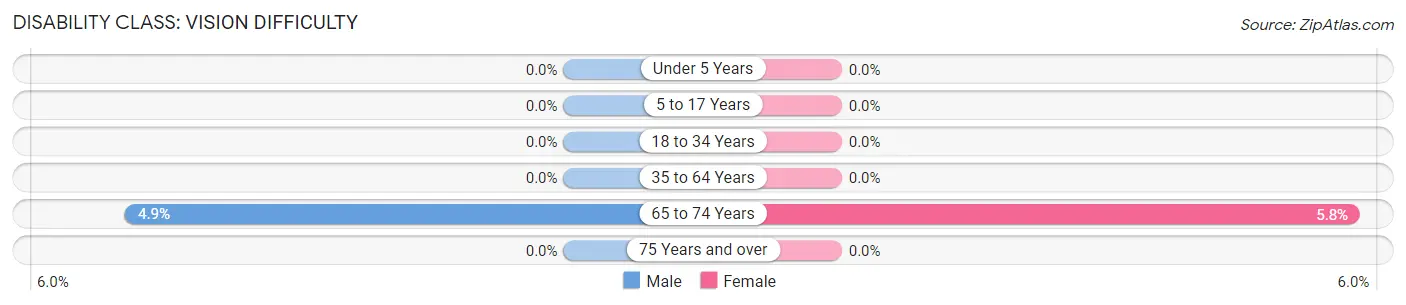
| Age Bracket | Male | Female |
| Under 5 Years | 0 (0.0%) | 0 (0.0%) |
| 5 to 17 Years | 0 (0.0%) | 0 (0.0%) |
| 18 to 34 Years | 0 (0.0%) | 0 (0.0%) |
| 35 to 64 Years | 0 (0.0%) | 0 (0.0%) |
| 65 to 74 Years | 4 (4.9%) | 3 (5.8%) |
| 75 Years and over | 0 (0.0%) | 0 (0.0%) |
Disability Class: Cognitive Difficulty

| Age Bracket | Male | Female |
| 5 to 17 Years | 0 (0.0%) | 0 (0.0%) |
| 18 to 34 Years | 18 (94.7%) | 0 (0.0%) |
| 35 to 64 Years | 0 (0.0%) | 0 (0.0%) |
| 65 to 74 Years | 0 (0.0%) | 0 (0.0%) |
| 75 Years and over | 0 (0.0%) | 0 (0.0%) |
Disability Class: Ambulatory Difficulty
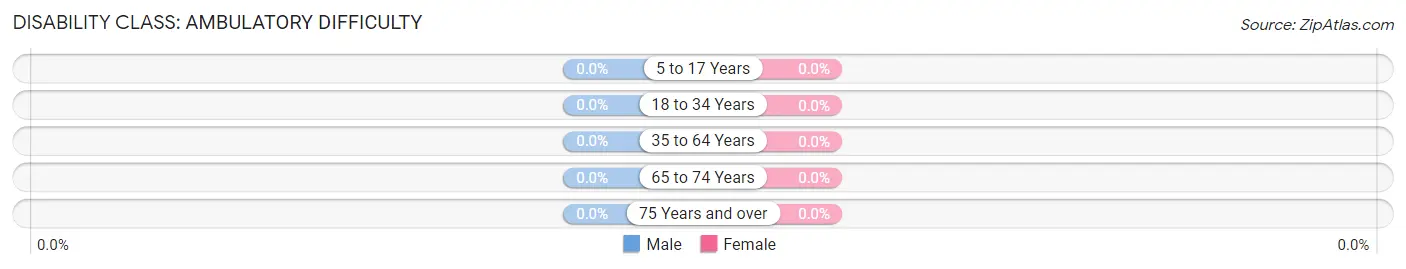
| Age Bracket | Male | Female |
| 5 to 17 Years | 0 (0.0%) | 0 (0.0%) |
| 18 to 34 Years | 0 (0.0%) | 0 (0.0%) |
| 35 to 64 Years | 0 (0.0%) | 0 (0.0%) |
| 65 to 74 Years | 0 (0.0%) | 0 (0.0%) |
| 75 Years and over | 0 (0.0%) | 0 (0.0%) |
Disability Class: Self-Care Difficulty
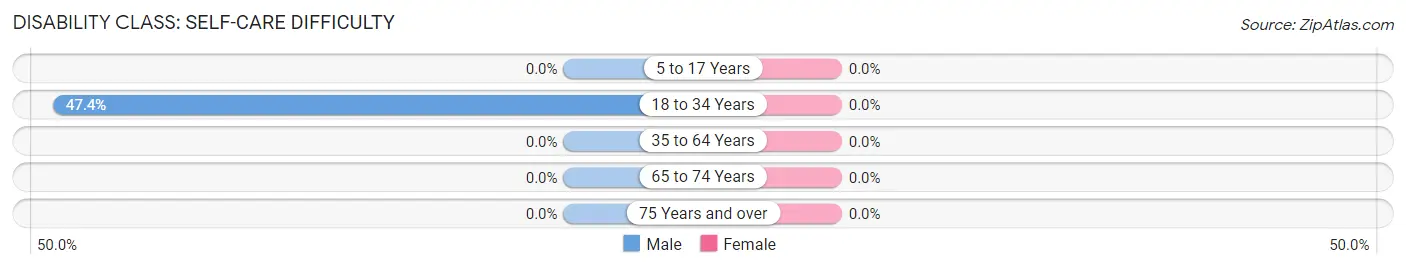
| Age Bracket | Male | Female |
| 5 to 17 Years | 0 (0.0%) | 0 (0.0%) |
| 18 to 34 Years | 9 (47.4%) | 0 (0.0%) |
| 35 to 64 Years | 0 (0.0%) | 0 (0.0%) |
| 65 to 74 Years | 0 (0.0%) | 0 (0.0%) |
| 75 Years and over | 0 (0.0%) | 0 (0.0%) |
Technology Access in Glen Arbor
Computing Device Access in Glen Arbor
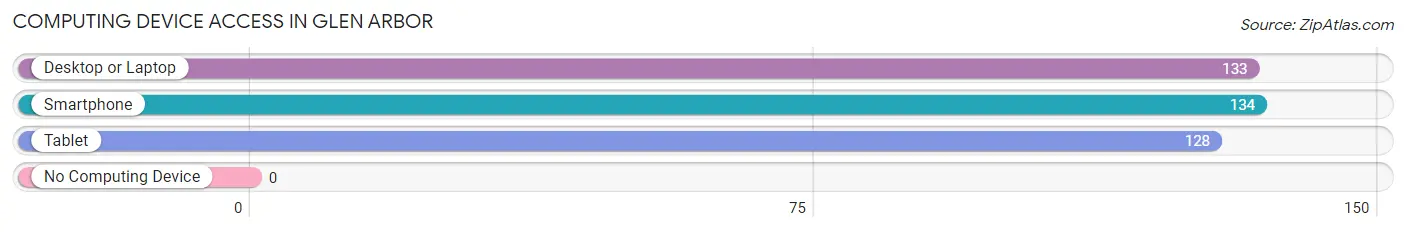
| Device Type | # Households | % Households |
| Desktop or Laptop | 133 | 93.7% |
| Smartphone | 134 | 94.4% |
| Tablet | 128 | 90.1% |
| No Computing Device | 0 | 0.0% |
| Total | 142 | 100.0% |
Internet Access in Glen Arbor
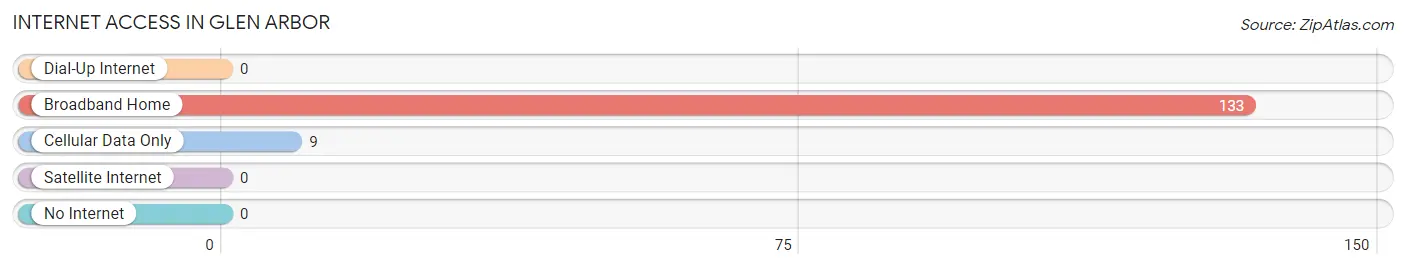
| Internet Type | # Households | % Households |
| Dial-Up Internet | 0 | 0.0% |
| Broadband Home | 133 | 93.7% |
| Cellular Data Only | 9 | 6.3% |
| Satellite Internet | 0 | 0.0% |
| No Internet | 0 | 0.0% |
| Total | 142 | 100.0% |
Glen Arbor Summary
Glen Arbor is a small unincorporated community located in Leelanau County, Michigan. It is situated on the shores of Lake Michigan, just south of Sleeping Bear Dunes National Lakeshore. The area is known for its natural beauty, outdoor recreation, and small-town charm.
History
Glen Arbor was first settled in the mid-1800s by a group of lumberjacks and farmers. The area was originally known as “The Glen” and was home to a sawmill and a few small farms. In 1871, the first post office was established and the name was changed to Glen Arbor.
The area began to grow in the late 1800s and early 1900s as more people moved to the area to take advantage of the natural resources. The lumber industry was the main source of income for the area, and the population grew to over 500 by the 1920s.
In the 1930s, the area began to attract tourists who were drawn to the area’s natural beauty and outdoor recreation opportunities. The area was also popular with artists and writers, who were inspired by the area’s stunning scenery.
In the 1950s, the area began to attract more permanent residents, and the population grew to over 1,000 by the 1960s. The area has continued to grow since then, and the population is now estimated to be around 1,500.
Geography
Glen Arbor is located in the northwest corner of Leelanau County, Michigan. It is situated on the shores of Lake Michigan, just south of Sleeping Bear Dunes National Lakeshore. The area is known for its natural beauty, outdoor recreation, and small-town charm.
The area is surrounded by rolling hills and forests, and is home to a variety of wildlife. The area is also known for its stunning sunsets over Lake Michigan.
Economy
The economy of Glen Arbor is largely based on tourism. The area is known for its natural beauty and outdoor recreation opportunities, and attracts visitors from all over the world. The area is also home to a variety of small businesses, including restaurants, shops, and galleries.
The area is also home to a number of wineries and vineyards, which attract visitors from all over the world. The area is also home to a number of fruit farms, which produce apples, cherries, and other fruits.
Demographics
As of the 2010 census, the population of Glen Arbor was 1,521. The racial makeup of the area was 97.3% White, 0.7% African American, 0.2% Native American, 0.3% Asian, 0.1% Pacific Islander, 0.3% from other races, and 1.2% from two or more races. Hispanic or Latino of any race were 1.2% of the population.
The median household income in Glen Arbor was $50,938, and the median family income was $60,938. The per capita income for the area was $27,938. About 8.3% of families and 11.2% of the population were below the poverty line, including 16.2% of those under age 18 and 5.2% of those age 65 or over.
Common Questions
What is Per Capita Income in Glen Arbor?
Per Capita income in Glen Arbor is $102,928.
What is the Median Family Income in Glen Arbor?
Median Family Income in Glen Arbor is $120,156.
What is Income or Wage Gap in Glen Arbor?
Income or Wage Gap in Glen Arbor is 33.3%.
Women in Glen Arbor earn 66.7 cents for every dollar earned by a man.
What is Inequality or Gini Index in Glen Arbor?
Inequality or Gini Index in Glen Arbor is 0.43.
What is the Total Population of Glen Arbor?
Total Population of Glen Arbor is 271.
What is the Total Male Population of Glen Arbor?
Total Male Population of Glen Arbor is 163.
What is the Total Female Population of Glen Arbor?
Total Female Population of Glen Arbor is 108.
What is the Ratio of Males per 100 Females in Glen Arbor?
There are 150.93 Males per 100 Females in Glen Arbor.
What is the Ratio of Females per 100 Males in Glen Arbor?
There are 66.26 Females per 100 Males in Glen Arbor.
What is the Median Population Age in Glen Arbor?
Median Population Age in Glen Arbor is 68.3 Years.
What is the Average Family Size in Glen Arbor
Average Family Size in Glen Arbor is 2.7 People.
What is the Average Household Size in Glen Arbor
Average Household Size in Glen Arbor is 1.9 People.
How Large is the Labor Force in Glen Arbor?
There are 113 People in the Labor Forcein in Glen Arbor.
What is the Percentage of People in the Labor Force in Glen Arbor?
45.2% of People are in the Labor Force in Glen Arbor.