Robin Glen Indiantown, MI Map & Demographics
Robin Glen Indiantown Map
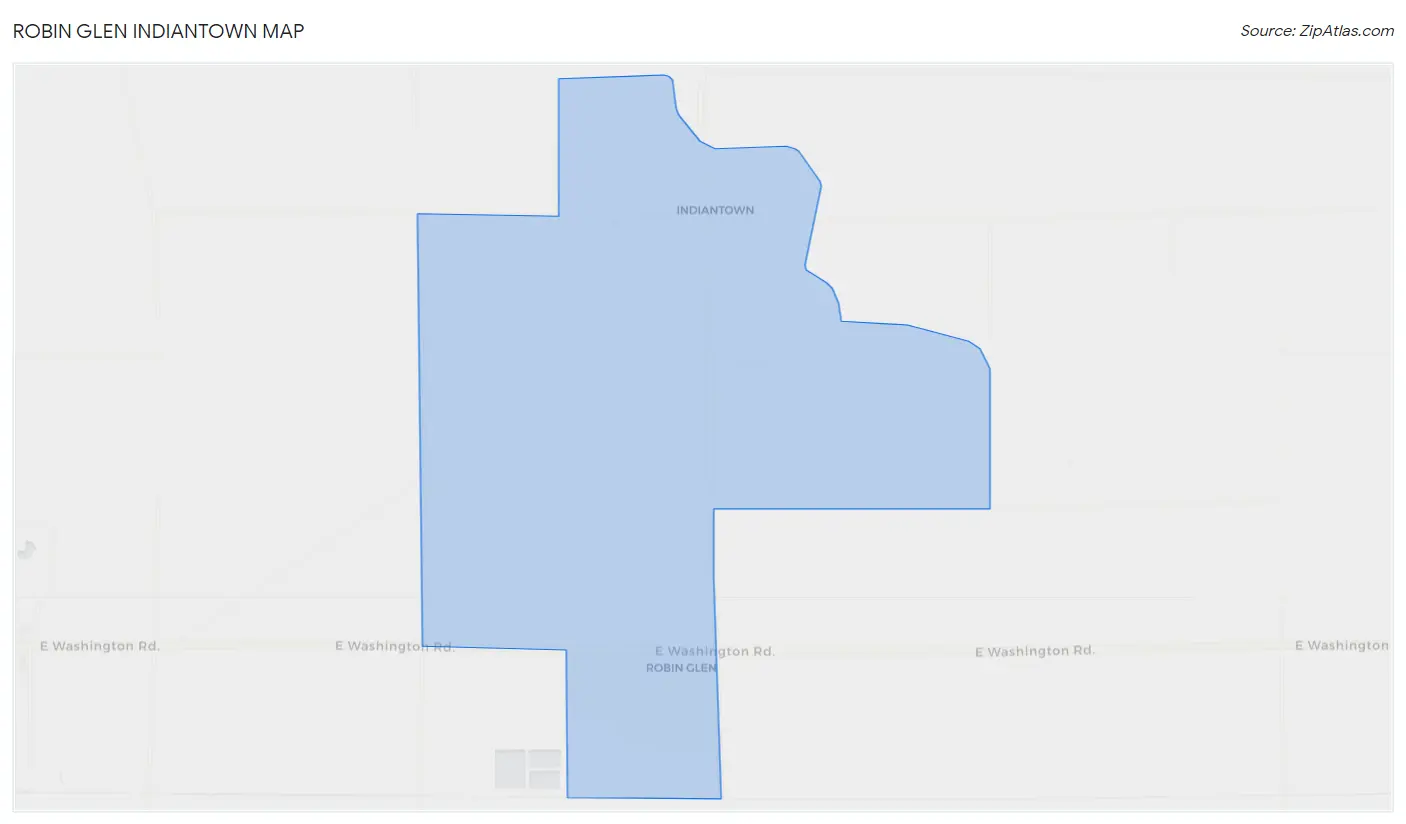
Robin Glen Indiantown Overview
$34,211
PER CAPITA INCOME
$66,458
AVG FAMILY INCOME
$59,471
AVG HOUSEHOLD INCOME
4.0%
WAGE / INCOME GAP [ % ]
96.0¢/ $1
WAGE / INCOME GAP [ $ ]
0.49
INEQUALITY / GINI INDEX
634
TOTAL POPULATION
308
MALE POPULATION
326
FEMALE POPULATION
94.48
MALES / 100 FEMALES
105.84
FEMALES / 100 MALES
35.0
MEDIAN AGE
2.8
AVG FAMILY SIZE
2.6
AVG HOUSEHOLD SIZE
282
LABOR FORCE [ PEOPLE ]
60.5%
PERCENT IN LABOR FORCE
6.0%
UNEMPLOYMENT RATE
Income in Robin Glen Indiantown
Income Overview in Robin Glen Indiantown
Per Capita Income in Robin Glen Indiantown is $34,211, while median incomes of families and households are $66,458 and $59,471 respectively.
| Characteristic | Number | Measure |
| Per Capita Income | 634 | $34,211 |
| Median Family Income | 181 | $66,458 |
| Mean Family Income | 181 | $74,239 |
| Median Household Income | 245 | $59,471 |
| Mean Household Income | 245 | $89,386 |
| Income Deficit | 181 | $0 |
| Wage / Income Gap (%) | 634 | 4.01% |
| Wage / Income Gap ($) | 634 | 95.99¢ per $1 |
| Gini / Inequality Index | 634 | 0.49 |
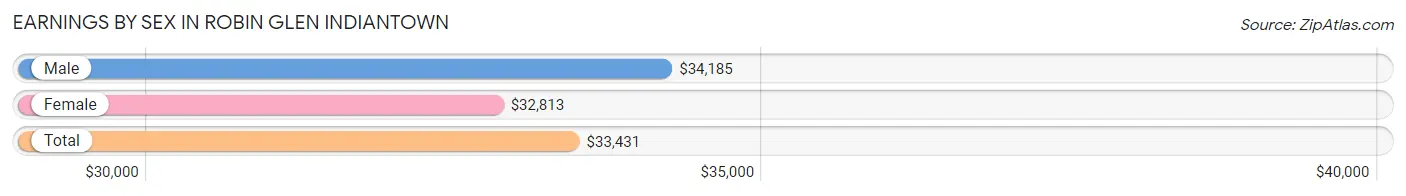
Earnings by Sex in Robin Glen Indiantown
Average Earnings in Robin Glen Indiantown are $33,431, $34,185 for men and $32,813 for women, a difference of 4.0%.
| Sex | Number | Average Earnings |
| Male | 143 (50.3%) | $34,185 |
| Female | 141 (49.6%) | $32,813 |
| Total | 284 (100.0%) | $33,431 |
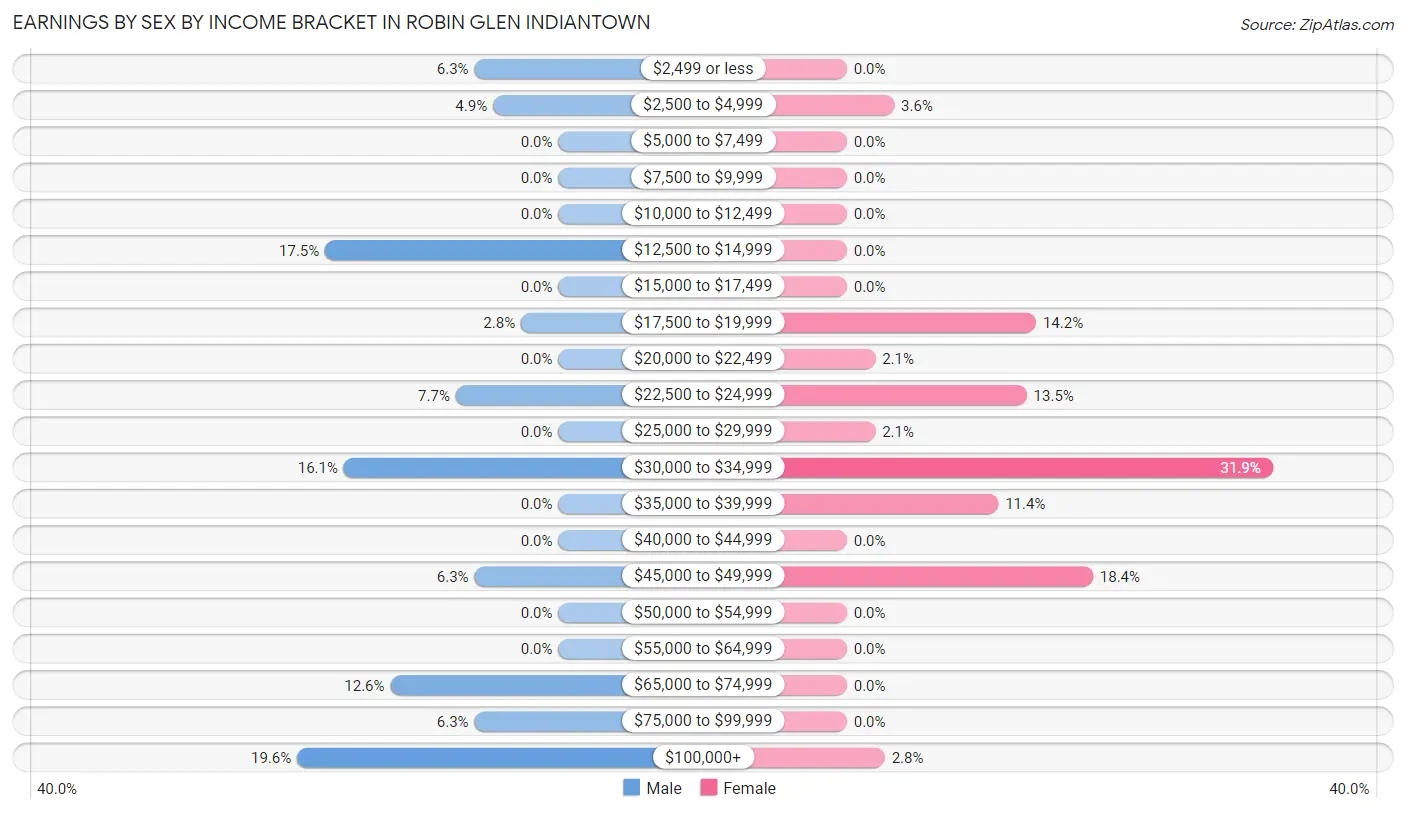
Earnings by Sex by Income Bracket in Robin Glen Indiantown
The most common earnings brackets in Robin Glen Indiantown are $100,000+ for men (28 | 19.6%) and $30,000 to $34,999 for women (45 | 31.9%).
| Income | Male | Female |
| $2,499 or less | 9 (6.3%) | 0 (0.0%) |
| $2,500 to $4,999 | 7 (4.9%) | 5 (3.5%) |
| $5,000 to $7,499 | 0 (0.0%) | 0 (0.0%) |
| $7,500 to $9,999 | 0 (0.0%) | 0 (0.0%) |
| $10,000 to $12,499 | 0 (0.0%) | 0 (0.0%) |
| $12,500 to $14,999 | 25 (17.5%) | 0 (0.0%) |
| $15,000 to $17,499 | 0 (0.0%) | 0 (0.0%) |
| $17,500 to $19,999 | 4 (2.8%) | 20 (14.2%) |
| $20,000 to $22,499 | 0 (0.0%) | 3 (2.1%) |
| $22,500 to $24,999 | 11 (7.7%) | 19 (13.5%) |
| $25,000 to $29,999 | 0 (0.0%) | 3 (2.1%) |
| $30,000 to $34,999 | 23 (16.1%) | 45 (31.9%) |
| $35,000 to $39,999 | 0 (0.0%) | 16 (11.4%) |
| $40,000 to $44,999 | 0 (0.0%) | 0 (0.0%) |
| $45,000 to $49,999 | 9 (6.3%) | 26 (18.4%) |
| $50,000 to $54,999 | 0 (0.0%) | 0 (0.0%) |
| $55,000 to $64,999 | 0 (0.0%) | 0 (0.0%) |
| $65,000 to $74,999 | 18 (12.6%) | 0 (0.0%) |
| $75,000 to $99,999 | 9 (6.3%) | 0 (0.0%) |
| $100,000+ | 28 (19.6%) | 4 (2.8%) |
| Total | 143 (100.0%) | 141 (100.0%) |
Earnings by Sex by Educational Attainment in Robin Glen Indiantown
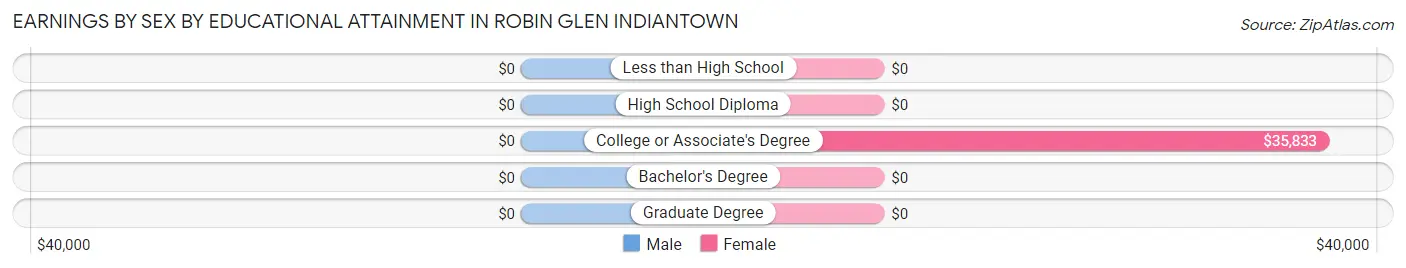
| Educational Attainment | Male Income | Female Income |
| Less than High School | - | - |
| High School Diploma | - | - |
| College or Associate's Degree | - | - |
| Bachelor's Degree | - | - |
| Graduate Degree | - | - |
| Total | - | - |
Family Income in Robin Glen Indiantown
Family Income Brackets in Robin Glen Indiantown
According to the Robin Glen Indiantown family income data, there are 47 families falling into the $25,000 to $34,999 income range, which is the most common income bracket and makes up 26.0% of all families.
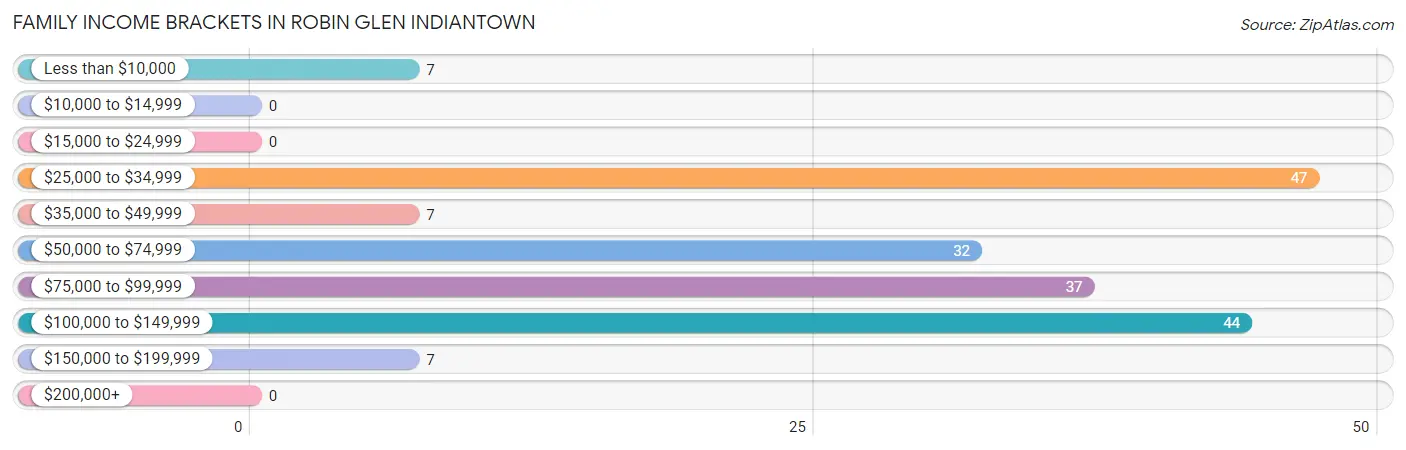
| Income Bracket | # Families | % Families |
| Less than $10,000 | 7 | 3.9% |
| $10,000 to $14,999 | 0 | 0.0% |
| $15,000 to $24,999 | 0 | 0.0% |
| $25,000 to $34,999 | 47 | 26.0% |
| $35,000 to $49,999 | 7 | 3.9% |
| $50,000 to $74,999 | 32 | 17.7% |
| $75,000 to $99,999 | 37 | 20.4% |
| $100,000 to $149,999 | 44 | 24.3% |
| $150,000 to $199,999 | 7 | 3.9% |
| $200,000+ | 0 | 0.0% |
Family Income by Famaliy Size in Robin Glen Indiantown
4-person families (22 | 12.1%) account for the highest median family income in Robin Glen Indiantown with $94,286 per family, while 2-person families (134 | 74.0%) have the highest median income of $29,327 per family member.
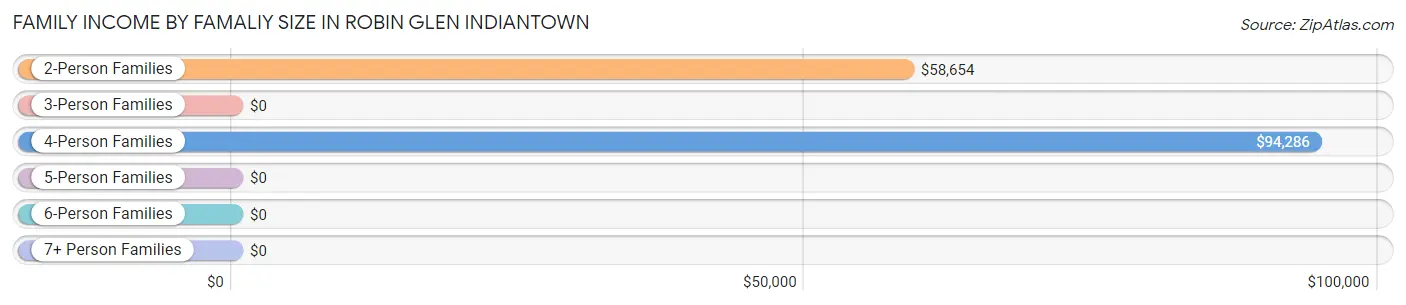
| Income Bracket | # Families | Median Income |
| 2-Person Families | 134 (74.0%) | $58,654 |
| 3-Person Families | 0 (0.0%) | $0 |
| 4-Person Families | 22 (12.1%) | $94,286 |
| 5-Person Families | 25 (13.8%) | $0 |
| 6-Person Families | 0 (0.0%) | $0 |
| 7+ Person Families | 0 (0.0%) | $0 |
| Total | 181 (100.0%) | $66,458 |
Family Income by Number of Earners in Robin Glen Indiantown
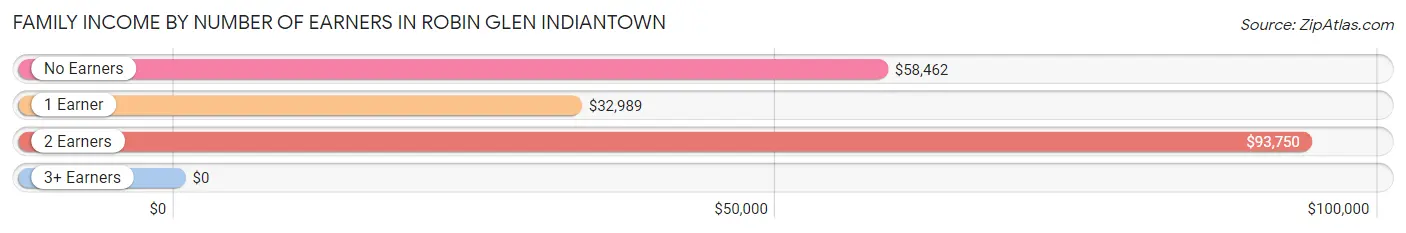
| Number of Earners | # Families | Median Income |
| No Earners | 48 (26.5%) | $58,462 |
| 1 Earner | 57 (31.5%) | $32,989 |
| 2 Earners | 67 (37.0%) | $93,750 |
| 3+ Earners | 9 (5.0%) | $0 |
| Total | 181 (100.0%) | $66,458 |
Household Income in Robin Glen Indiantown
Household Income Brackets in Robin Glen Indiantown
With 45 households falling in the category, the $25,000 to $34,999 income range is the most frequent in Robin Glen Indiantown, accounting for 18.4% of all households. In contrast, only 5 households (2.0%) fall into the $10,000 to $14,999 income bracket, making it the least populous group.
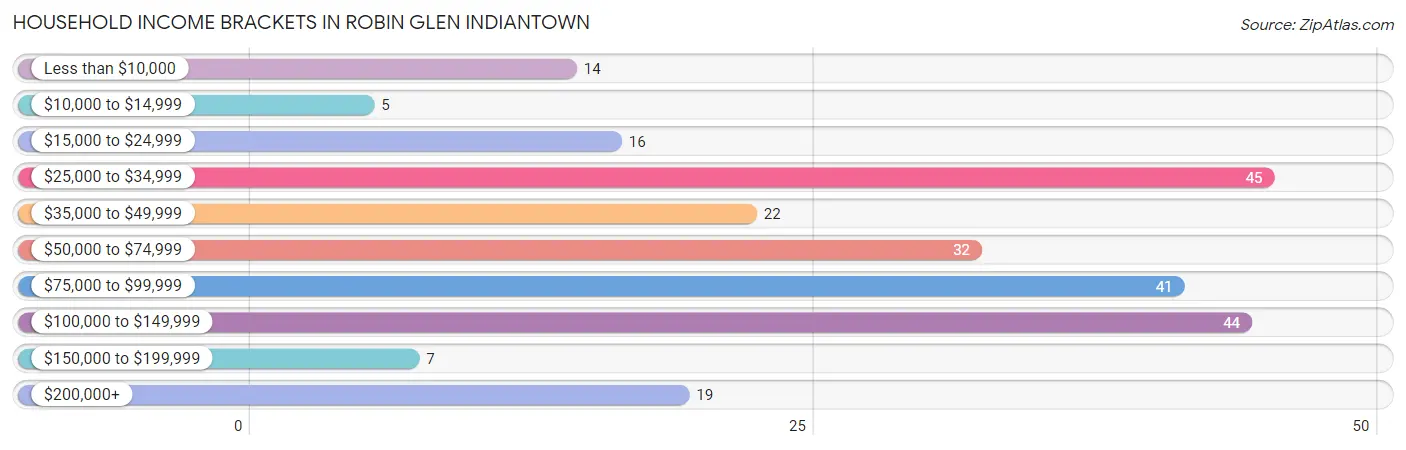
| Income Bracket | # Households | % Households |
| Less than $10,000 | 14 | 5.7% |
| $10,000 to $14,999 | 5 | 2.0% |
| $15,000 to $24,999 | 16 | 6.5% |
| $25,000 to $34,999 | 45 | 18.4% |
| $35,000 to $49,999 | 22 | 9.0% |
| $50,000 to $74,999 | 32 | 13.1% |
| $75,000 to $99,999 | 41 | 16.7% |
| $100,000 to $149,999 | 44 | 18.0% |
| $150,000 to $199,999 | 7 | 2.9% |
| $200,000+ | 19 | 7.8% |
Household Income by Householder Age in Robin Glen Indiantown
The median household income in Robin Glen Indiantown is $59,471, with the highest median household income of $83,750 found in the 45 to 64 years age bracket for the primary householder. A total of 75 households (30.6%) fall into this category.
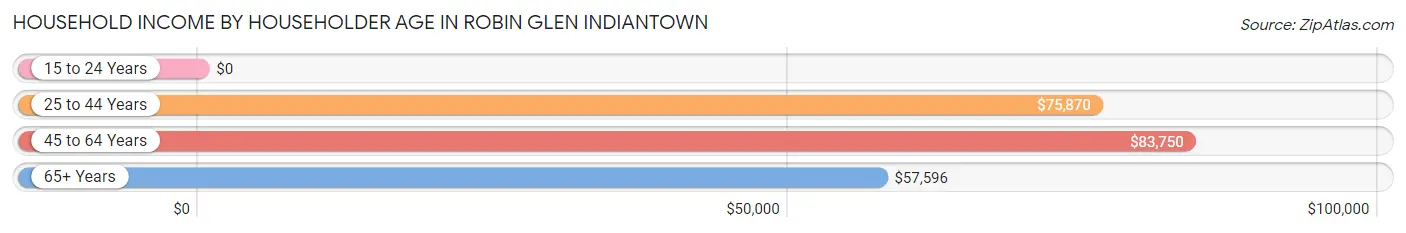
| Income Bracket | # Households | Median Income |
| 15 to 24 Years | 0 (0.0%) | $0 |
| 25 to 44 Years | 90 (36.7%) | $75,870 |
| 45 to 64 Years | 75 (30.6%) | $83,750 |
| 65+ Years | 80 (32.7%) | $57,596 |
| Total | 245 (100.0%) | $59,471 |
Poverty in Robin Glen Indiantown
Income Below Poverty by Sex and Age in Robin Glen Indiantown
With 8.4% poverty level for males and 6.1% for females among the residents of Robin Glen Indiantown, 25 to 34 year old males and 12 to 14 year old females are the most vulnerable to poverty, with 12 males (21.4%) and 8 females (34.8%) in their respective age groups living below the poverty level.
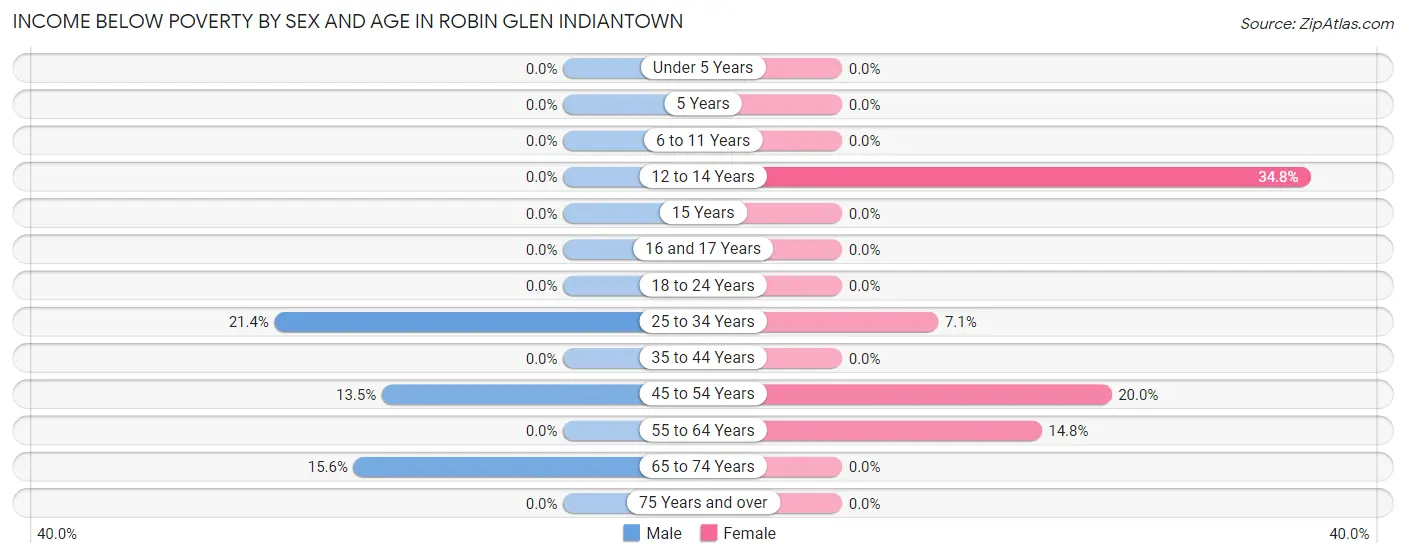
| Age Bracket | Male | Female |
| Under 5 Years | 0 (0.0%) | 0 (0.0%) |
| 5 Years | 0 (0.0%) | 0 (0.0%) |
| 6 to 11 Years | 0 (0.0%) | 0 (0.0%) |
| 12 to 14 Years | 0 (0.0%) | 8 (34.8%) |
| 15 Years | 0 (0.0%) | 0 (0.0%) |
| 16 and 17 Years | 0 (0.0%) | 0 (0.0%) |
| 18 to 24 Years | 0 (0.0%) | 0 (0.0%) |
| 25 to 34 Years | 12 (21.4%) | 3 (7.1%) |
| 35 to 44 Years | 0 (0.0%) | 0 (0.0%) |
| 45 to 54 Years | 7 (13.5%) | 5 (20.0%) |
| 55 to 64 Years | 0 (0.0%) | 4 (14.8%) |
| 65 to 74 Years | 7 (15.6%) | 0 (0.0%) |
| 75 Years and over | 0 (0.0%) | 0 (0.0%) |
| Total | 26 (8.4%) | 20 (6.1%) |
Income Above Poverty by Sex and Age in Robin Glen Indiantown
According to the poverty statistics in Robin Glen Indiantown, males aged 6 to 11 years and females aged under 5 years are the age groups that are most secure financially, with 100.0% of males and 100.0% of females in these age groups living above the poverty line.
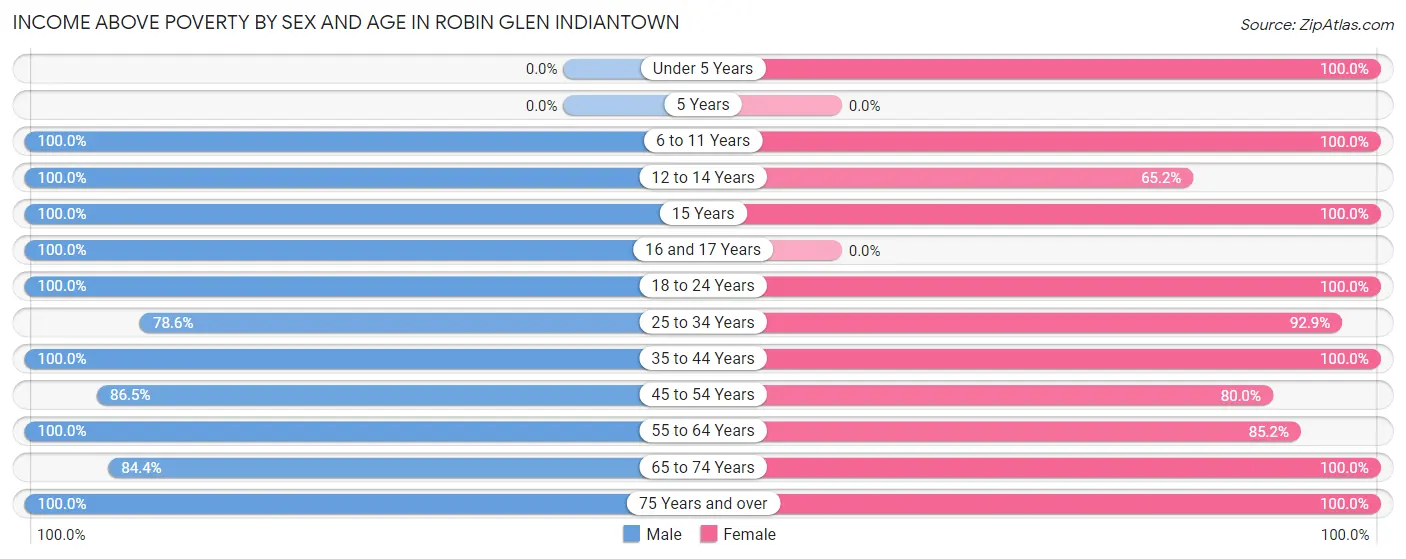
| Age Bracket | Male | Female |
| Under 5 Years | 0 (0.0%) | 24 (100.0%) |
| 5 Years | 0 (0.0%) | 0 (0.0%) |
| 6 to 11 Years | 36 (100.0%) | 45 (100.0%) |
| 12 to 14 Years | 13 (100.0%) | 15 (65.2%) |
| 15 Years | 20 (100.0%) | 7 (100.0%) |
| 16 and 17 Years | 9 (100.0%) | 0 (0.0%) |
| 18 to 24 Years | 9 (100.0%) | 33 (100.0%) |
| 25 to 34 Years | 44 (78.6%) | 39 (92.9%) |
| 35 to 44 Years | 19 (100.0%) | 24 (100.0%) |
| 45 to 54 Years | 45 (86.5%) | 20 (80.0%) |
| 55 to 64 Years | 35 (100.0%) | 23 (85.2%) |
| 65 to 74 Years | 38 (84.4%) | 51 (100.0%) |
| 75 Years and over | 14 (100.0%) | 25 (100.0%) |
| Total | 282 (91.6%) | 306 (93.9%) |
Income Below Poverty Among Married-Couple Families in Robin Glen Indiantown
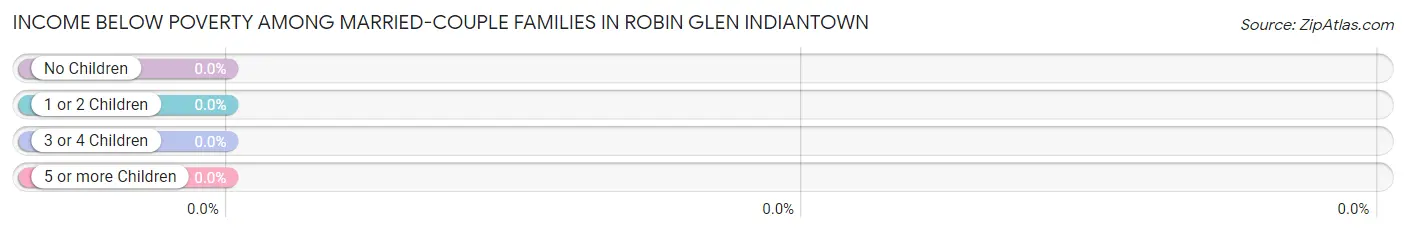
| Children | Above Poverty | Below Poverty |
| No Children | 65 (100.0%) | 0 (0.0%) |
| 1 or 2 Children | 9 (100.0%) | 0 (0.0%) |
| 3 or 4 Children | 19 (100.0%) | 0 (0.0%) |
| 5 or more Children | 0 (0.0%) | 0 (0.0%) |
| Total | 93 (100.0%) | 0 (0.0%) |
Income Below Poverty Among Single-Parent Households in Robin Glen Indiantown
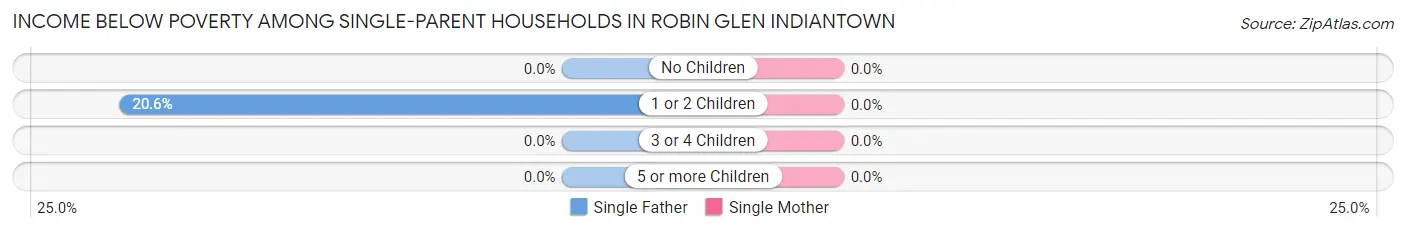
| Children | Single Father | Single Mother |
| No Children | 0 (0.0%) | 0 (0.0%) |
| 1 or 2 Children | 7 (20.6%) | 0 (0.0%) |
| 3 or 4 Children | 0 (0.0%) | 0 (0.0%) |
| 5 or more Children | 0 (0.0%) | 0 (0.0%) |
| Total | 7 (15.6%) | 0 (0.0%) |
Income Below Poverty Among Married-Couple vs Single-Parent Households in Robin Glen Indiantown
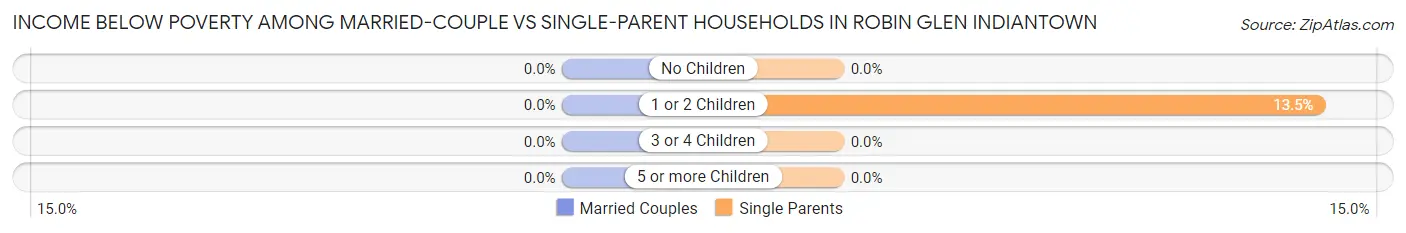
| Children | Married-Couple Families | Single-Parent Households |
| No Children | 0 (0.0%) | 0 (0.0%) |
| 1 or 2 Children | 0 (0.0%) | 7 (13.5%) |
| 3 or 4 Children | 0 (0.0%) | 0 (0.0%) |
| 5 or more Children | 0 (0.0%) | 0 (0.0%) |
| Total | 0 (0.0%) | 7 (8.0%) |
Race in Robin Glen Indiantown
The most populous races in Robin Glen Indiantown are White / Caucasian (564 | 89.0%), Hispanic or Latino (68 | 10.7%), and Two or more Races (48 | 7.6%).
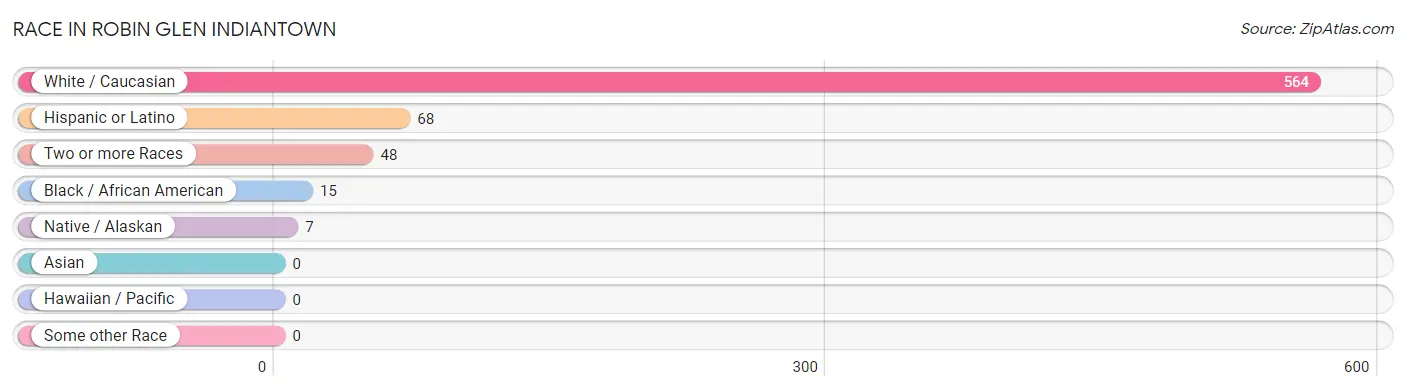
| Race | # Population | % Population |
| Asian | 0 | 0.0% |
| Black / African American | 15 | 2.4% |
| Hawaiian / Pacific | 0 | 0.0% |
| Hispanic or Latino | 68 | 10.7% |
| Native / Alaskan | 7 | 1.1% |
| White / Caucasian | 564 | 89.0% |
| Two or more Races | 48 | 7.6% |
| Some other Race | 0 | 0.0% |
| Total | 634 | 100.0% |
Ancestry in Robin Glen Indiantown
The most populous ancestries reported in Robin Glen Indiantown are German (223 | 35.2%), Mexican (68 | 10.7%), Irish (56 | 8.8%), Italian (41 | 6.5%), and Austrian (30 | 4.7%), together accounting for 65.9% of all Robin Glen Indiantown residents.
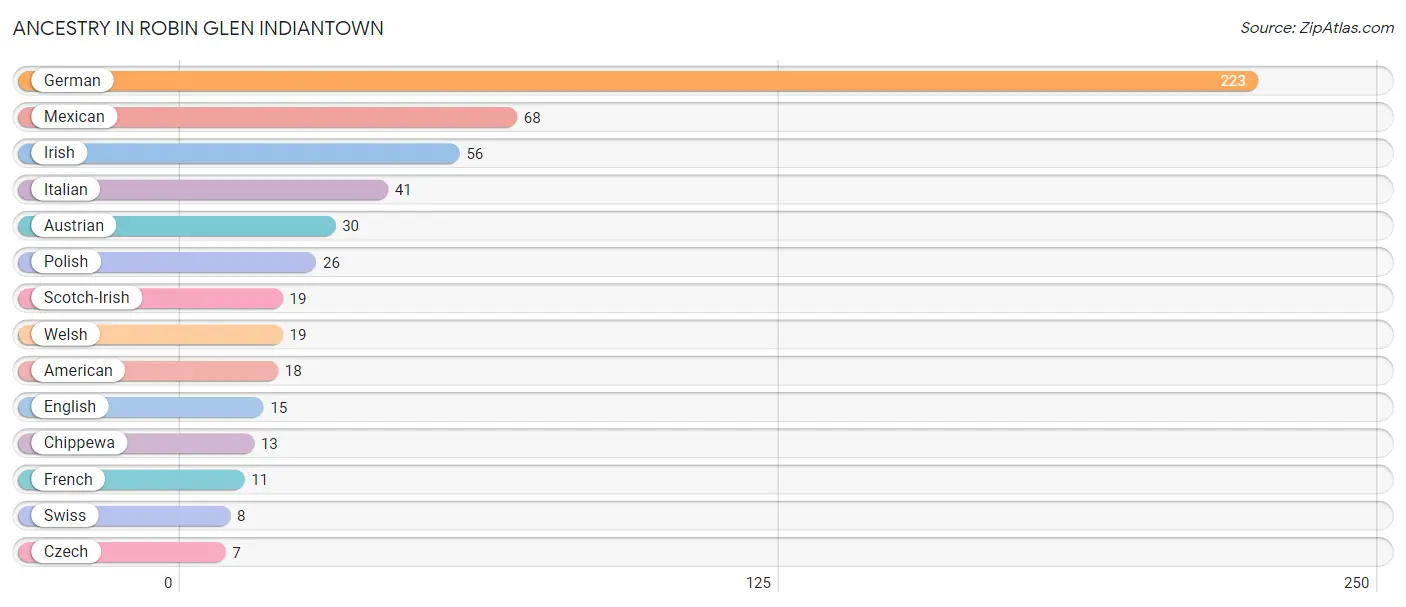
| Ancestry | # Population | % Population |
| American | 18 | 2.8% |
| Austrian | 30 | 4.7% |
| Chippewa | 13 | 2.1% |
| Czech | 7 | 1.1% |
| English | 15 | 2.4% |
| French | 11 | 1.7% |
| German | 223 | 35.2% |
| Irish | 56 | 8.8% |
| Italian | 41 | 6.5% |
| Mexican | 68 | 10.7% |
| Polish | 26 | 4.1% |
| Scotch-Irish | 19 | 3.0% |
| Swiss | 8 | 1.3% |
| Welsh | 19 | 3.0% | View All 14 Rows |
Immigrants in Robin Glen Indiantown

| Immigration Origin | # Population | % Population | View All 0 Rows |
Sex and Age in Robin Glen Indiantown
Sex and Age in Robin Glen Indiantown
The most populous age groups in Robin Glen Indiantown are 45 to 49 Years (45 | 14.6%) for men and 70 to 74 Years (44 | 13.5%) for women.
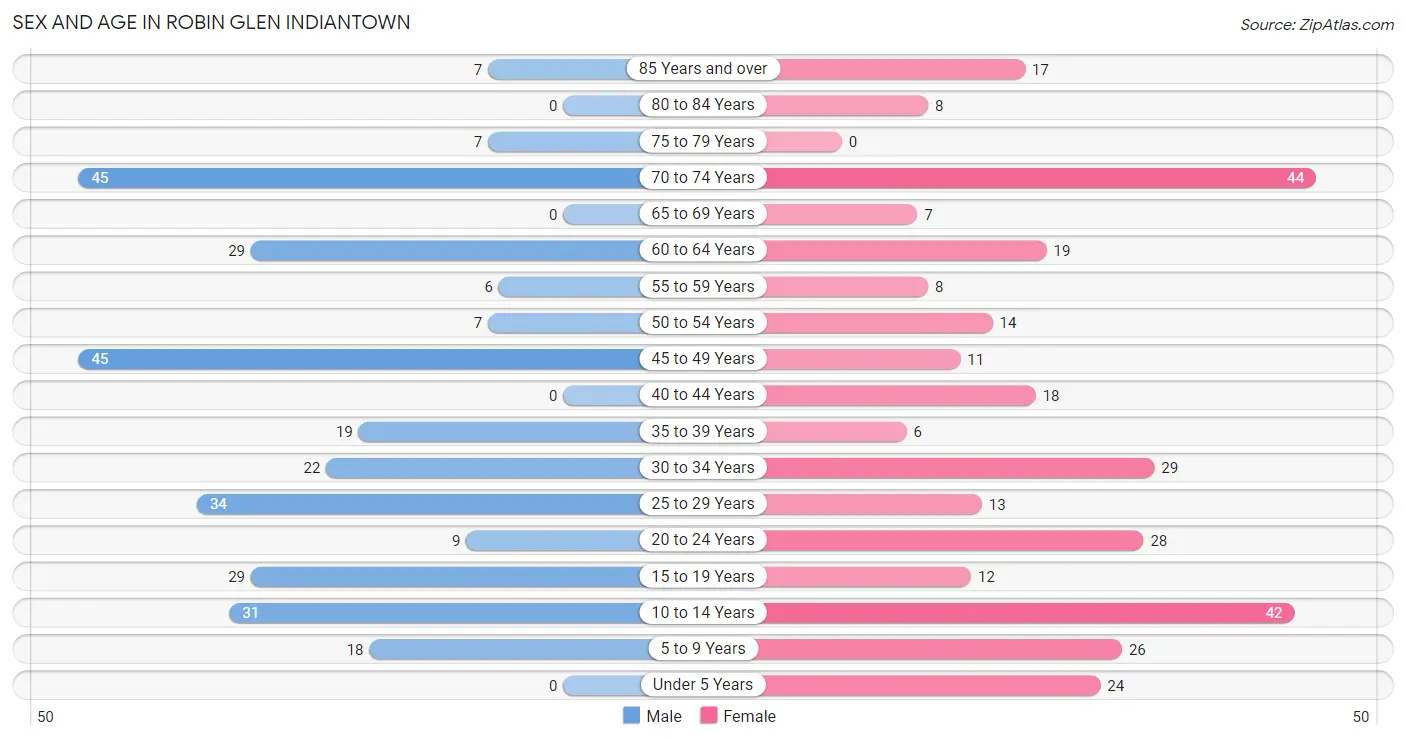
| Age Bracket | Male | Female |
| Under 5 Years | 0 (0.0%) | 24 (7.4%) |
| 5 to 9 Years | 18 (5.8%) | 26 (8.0%) |
| 10 to 14 Years | 31 (10.1%) | 42 (12.9%) |
| 15 to 19 Years | 29 (9.4%) | 12 (3.7%) |
| 20 to 24 Years | 9 (2.9%) | 28 (8.6%) |
| 25 to 29 Years | 34 (11.0%) | 13 (4.0%) |
| 30 to 34 Years | 22 (7.1%) | 29 (8.9%) |
| 35 to 39 Years | 19 (6.2%) | 6 (1.8%) |
| 40 to 44 Years | 0 (0.0%) | 18 (5.5%) |
| 45 to 49 Years | 45 (14.6%) | 11 (3.4%) |
| 50 to 54 Years | 7 (2.3%) | 14 (4.3%) |
| 55 to 59 Years | 6 (1.9%) | 8 (2.5%) |
| 60 to 64 Years | 29 (9.4%) | 19 (5.8%) |
| 65 to 69 Years | 0 (0.0%) | 7 (2.1%) |
| 70 to 74 Years | 45 (14.6%) | 44 (13.5%) |
| 75 to 79 Years | 7 (2.3%) | 0 (0.0%) |
| 80 to 84 Years | 0 (0.0%) | 8 (2.5%) |
| 85 Years and over | 7 (2.3%) | 17 (5.2%) |
| Total | 308 (100.0%) | 326 (100.0%) |
Families and Households in Robin Glen Indiantown
Median Family Size in Robin Glen Indiantown
The median family size in Robin Glen Indiantown is 2.79 persons per family, with single female/mother families (43 | 23.8%) accounting for the largest median family size of 3.07 persons per family. On the other hand, single male/father families (45 | 24.9%) represent the smallest median family size with 2.04 persons per family.
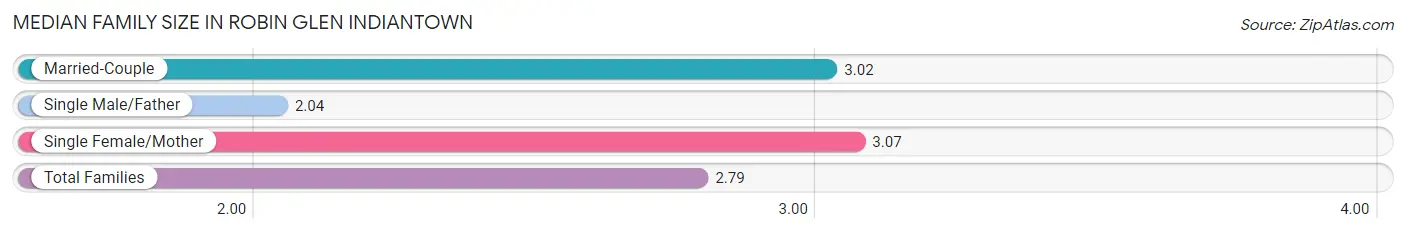
| Family Type | # Families | Family Size |
| Married-Couple | 93 (51.4%) | 3.02 |
| Single Male/Father | 45 (24.9%) | 2.04 |
| Single Female/Mother | 43 (23.8%) | 3.07 |
| Total Families | 181 (100.0%) | 2.79 |
Median Household Size in Robin Glen Indiantown
The median household size in Robin Glen Indiantown is 2.59 persons per household, with single female/mother households (43 | 17.5%) accounting for the largest median household size of 3.77 persons per household. non-family households (64 | 26.1%) represent the smallest median household size with 1.06 persons per household.
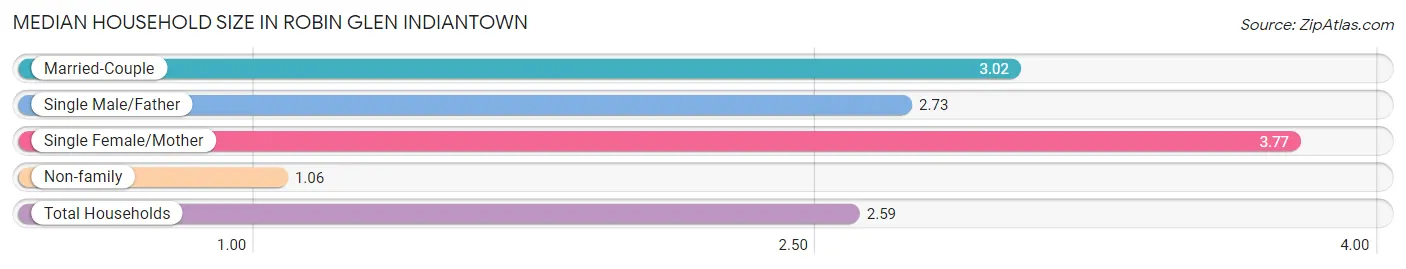
| Household Type | # Households | Household Size |
| Married-Couple | 93 (38.0%) | 3.02 |
| Single Male/Father | 45 (18.4%) | 2.73 |
| Single Female/Mother | 43 (17.5%) | 3.77 |
| Non-family | 64 (26.1%) | 1.06 |
| Total Households | 245 (100.0%) | 2.59 |
Household Size by Marriage Status in Robin Glen Indiantown
Out of a total of 245 households in Robin Glen Indiantown, 181 (73.9%) are family households, while 64 (26.1%) are nonfamily households. The most numerous type of family households are 2-person households, comprising 88, and the most common type of nonfamily households are 1-person households, comprising 57.
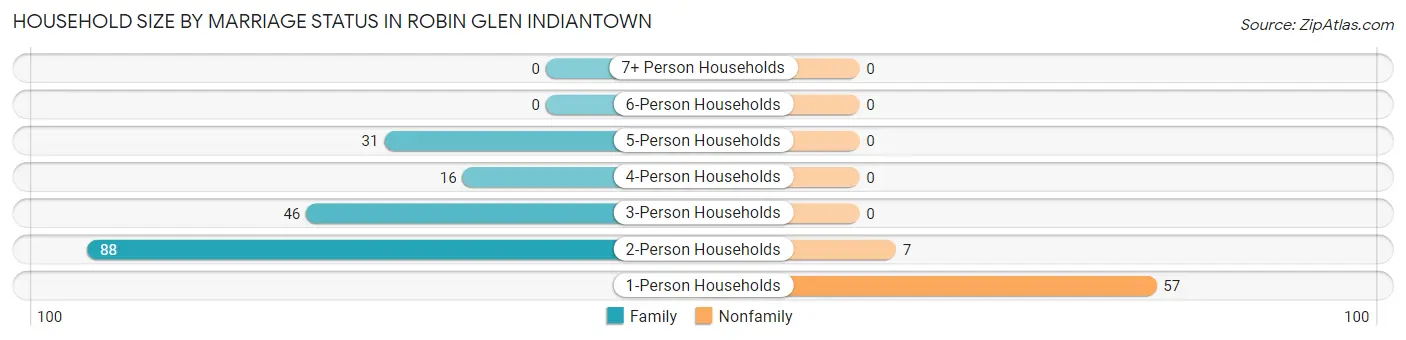
| Household Size | Family Households | Nonfamily Households |
| 1-Person Households | - | 57 (23.3%) |
| 2-Person Households | 88 (35.9%) | 7 (2.9%) |
| 3-Person Households | 46 (18.8%) | 0 (0.0%) |
| 4-Person Households | 16 (6.5%) | 0 (0.0%) |
| 5-Person Households | 31 (12.7%) | 0 (0.0%) |
| 6-Person Households | 0 (0.0%) | 0 (0.0%) |
| 7+ Person Households | 0 (0.0%) | 0 (0.0%) |
| Total | 181 (73.9%) | 64 (26.1%) |
Female Fertility in Robin Glen Indiantown
Fertility by Age in Robin Glen Indiantown
| Age Bracket | Women with Births | Births / 1,000 Women |
| 15 to 19 years | 0 (0.0%) | 0.0 |
| 20 to 34 years | 0 (0.0%) | 0.0 |
| 35 to 50 years | 0 (0.0%) | 0.0 |
| Total | 0 (0.0%) | 0.0 |
Fertility by Age by Marriage Status in Robin Glen Indiantown
| Age Bracket | Married | Unmarried |
| 15 to 19 years | 0 (0.0%) | 0 (0.0%) |
| 20 to 34 years | 0 (0.0%) | 0 (0.0%) |
| 35 to 50 years | 0 (0.0%) | 0 (0.0%) |
| Total | 0 (0.0%) | 0 (0.0%) |
Fertility by Education in Robin Glen Indiantown
| Educational Attainment | Women with Births | Births / 1,000 Women |
| Less than High School | 0 (0.0%) | 0.0 |
| High School Diploma | 0 (0.0%) | 0.0 |
| College or Associate's Degree | 0 (0.0%) | 0.0 |
| Bachelor's Degree | 0 (0.0%) | 0.0 |
| Graduate Degree | 0 (0.0%) | 0.0 |
| Total | 0 (0.0%) | 0.0 |
Fertility by Education by Marriage Status in Robin Glen Indiantown
| Educational Attainment | Married | Unmarried |
| Less than High School | 0 (0.0%) | 0 (0.0%) |
| High School Diploma | 0 (0.0%) | 0 (0.0%) |
| College or Associate's Degree | 0 (0.0%) | 0 (0.0%) |
| Bachelor's Degree | 0 (0.0%) | 0 (0.0%) |
| Graduate Degree | 0 (0.0%) | 0 (0.0%) |
| Total | 0 (0.0%) | 0 (0.0%) |
Employment Characteristics in Robin Glen Indiantown
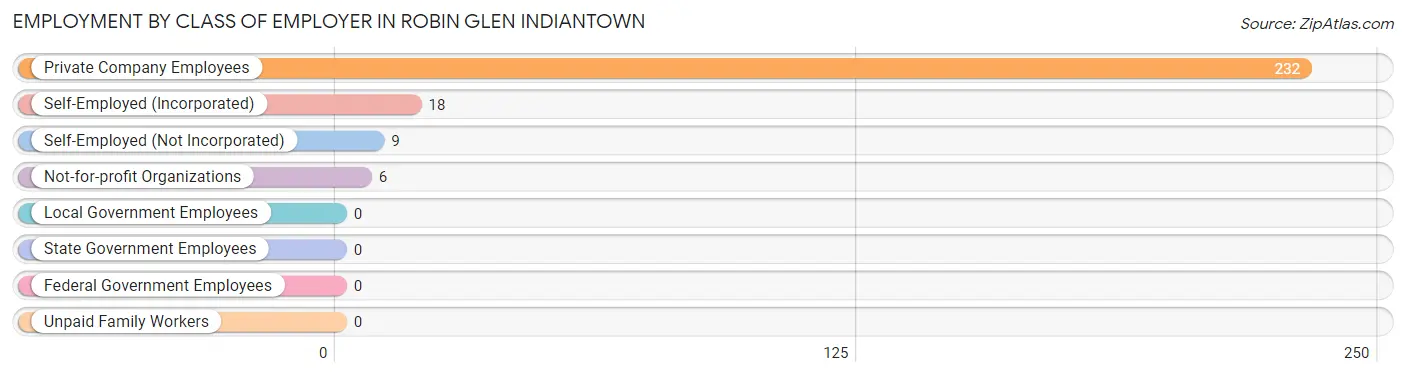
Employment by Class of Employer in Robin Glen Indiantown
Among the 265 employed individuals in Robin Glen Indiantown, private company employees (232 | 87.5%), self-employed (incorporated) (18 | 6.8%), and self-employed (not incorporated) (9 | 3.4%) make up the most common classes of employment.
| Employer Class | # Employees | % Employees |
| Private Company Employees | 232 | 87.5% |
| Self-Employed (Incorporated) | 18 | 6.8% |
| Self-Employed (Not Incorporated) | 9 | 3.4% |
| Not-for-profit Organizations | 6 | 2.3% |
| Local Government Employees | 0 | 0.0% |
| State Government Employees | 0 | 0.0% |
| Federal Government Employees | 0 | 0.0% |
| Unpaid Family Workers | 0 | 0.0% |
| Total | 265 | 100.0% |
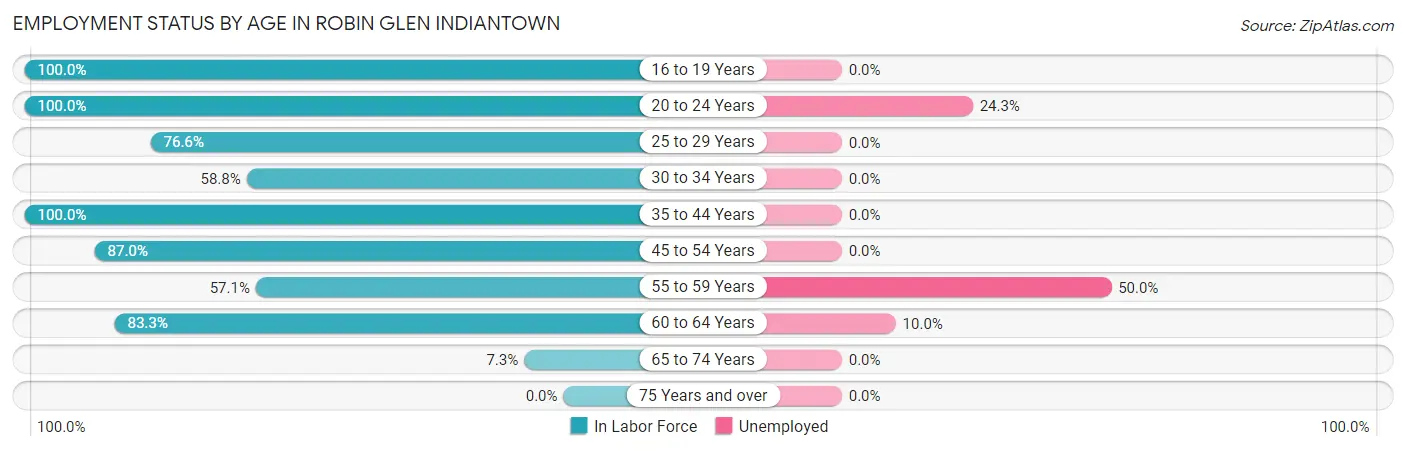
Employment Status by Age in Robin Glen Indiantown
According to the labor force statistics for Robin Glen Indiantown, out of the total population over 16 years of age (466), 60.5% or 282 individuals are in the labor force, with 6.0% or 17 of them unemployed. The age group with the highest labor force participation rate is 16 to 19 years, with 100.0% or 14 individuals in the labor force. Within the labor force, the 55 to 59 years age range has the highest percentage of unemployed individuals, with 50.0% or 4 of them being unemployed.
| Age Bracket | In Labor Force | Unemployed |
| 16 to 19 Years | 14 (100.0%) | 0 (0.0%) |
| 20 to 24 Years | 37 (100.0%) | 9 (24.3%) |
| 25 to 29 Years | 36 (76.6%) | 0 (0.0%) |
| 30 to 34 Years | 30 (58.8%) | 0 (0.0%) |
| 35 to 44 Years | 43 (100.0%) | 0 (0.0%) |
| 45 to 54 Years | 67 (87.0%) | 0 (0.0%) |
| 55 to 59 Years | 8 (57.1%) | 4 (50.0%) |
| 60 to 64 Years | 40 (83.3%) | 4 (10.0%) |
| 65 to 74 Years | 7 (7.3%) | 0 (0.0%) |
| 75 Years and over | 0 (0.0%) | 0 (0.0%) |
| Total | 282 (60.5%) | 17 (6.0%) |
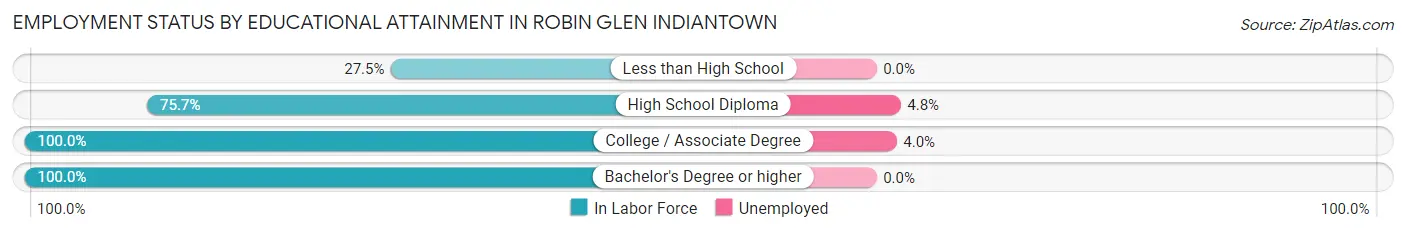
Employment Status by Educational Attainment in Robin Glen Indiantown
According to labor force statistics for Robin Glen Indiantown, 80.0% of individuals (224) out of the total population between 25 and 64 years of age (280) are in the labor force, with 3.6% or 8 of them being unemployed. The group with the highest labor force participation rate are those with the educational attainment of college / associate degree, with 100.0% or 100 individuals in the labor force. Within the labor force, individuals with high school diploma education have the highest percentage of unemployment, with 4.8% or 4 of them being unemployed.
| Educational Attainment | In Labor Force | Unemployed |
| Less than High School | 11 (27.5%) | 0 (0.0%) |
| High School Diploma | 84 (75.7%) | 5 (4.8%) |
| College / Associate Degree | 100 (100.0%) | 4 (4.0%) |
| Bachelor's Degree or higher | 29 (100.0%) | 0 (0.0%) |
| Total | 224 (80.0%) | 10 (3.6%) |
Employment Occupations by Sex in Robin Glen Indiantown
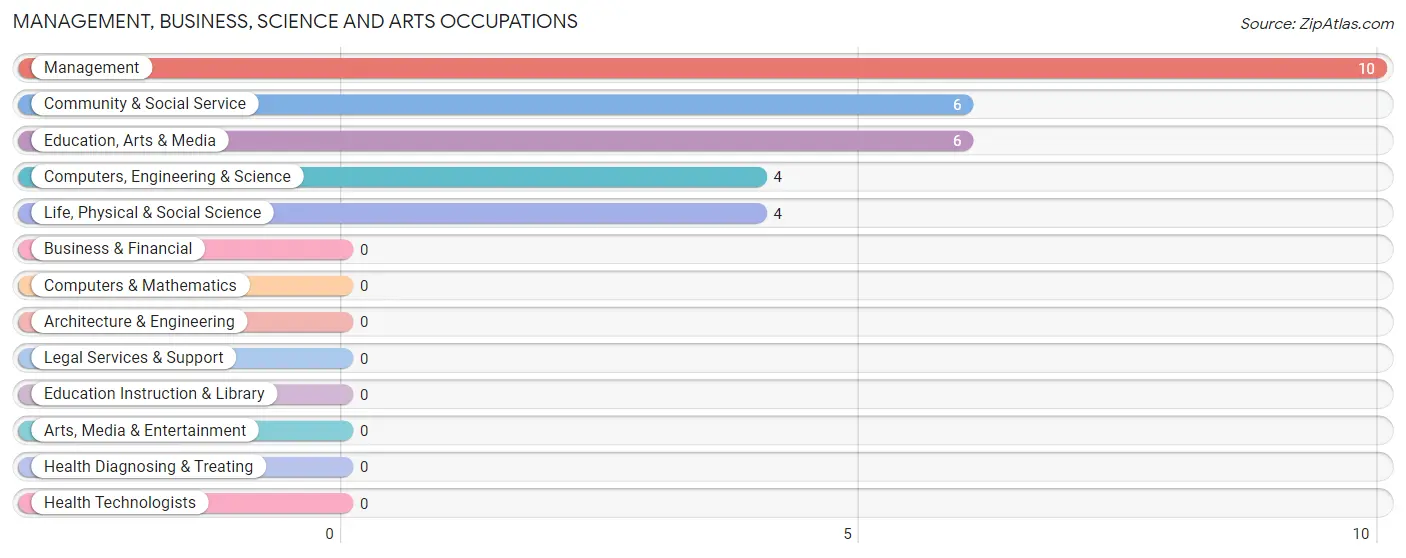
Management, Business, Science and Arts Occupations
The most common Management, Business, Science and Arts occupations in Robin Glen Indiantown are Management (10 | 3.8%), Community & Social Service (6 | 2.3%), Education, Arts & Media (6 | 2.3%), Computers, Engineering & Science (4 | 1.5%), and Life, Physical & Social Science (4 | 1.5%).
Management, Business, Science and Arts Occupations by Sex
Within the Management, Business, Science and Arts occupations in Robin Glen Indiantown, the most male-oriented occupations are Computers, Engineering & Science (100.0%), Life, Physical & Social Science (100.0%), and Management (60.0%), while the most female-oriented occupations are Community & Social Service (100.0%), Education, Arts & Media (100.0%), and Management (40.0%).
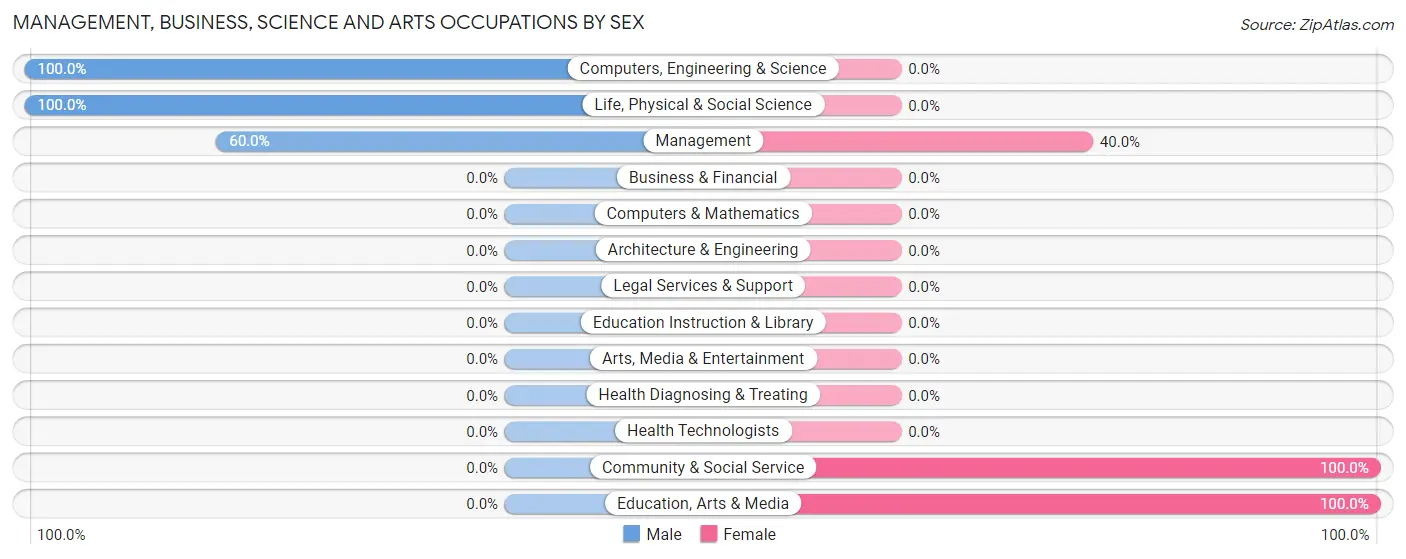
| Occupation | Male | Female |
| Management | 6 (60.0%) | 4 (40.0%) |
| Business & Financial | 0 (0.0%) | 0 (0.0%) |
| Computers, Engineering & Science | 4 (100.0%) | 0 (0.0%) |
| Computers & Mathematics | 0 (0.0%) | 0 (0.0%) |
| Architecture & Engineering | 0 (0.0%) | 0 (0.0%) |
| Life, Physical & Social Science | 4 (100.0%) | 0 (0.0%) |
| Community & Social Service | 0 (0.0%) | 6 (100.0%) |
| Education, Arts & Media | 0 (0.0%) | 6 (100.0%) |
| Legal Services & Support | 0 (0.0%) | 0 (0.0%) |
| Education Instruction & Library | 0 (0.0%) | 0 (0.0%) |
| Arts, Media & Entertainment | 0 (0.0%) | 0 (0.0%) |
| Health Diagnosing & Treating | 0 (0.0%) | 0 (0.0%) |
| Health Technologists | 0 (0.0%) | 0 (0.0%) |
| Total (Category) | 10 (50.0%) | 10 (50.0%) |
| Total (Overall) | 124 (46.8%) | 141 (53.2%) |
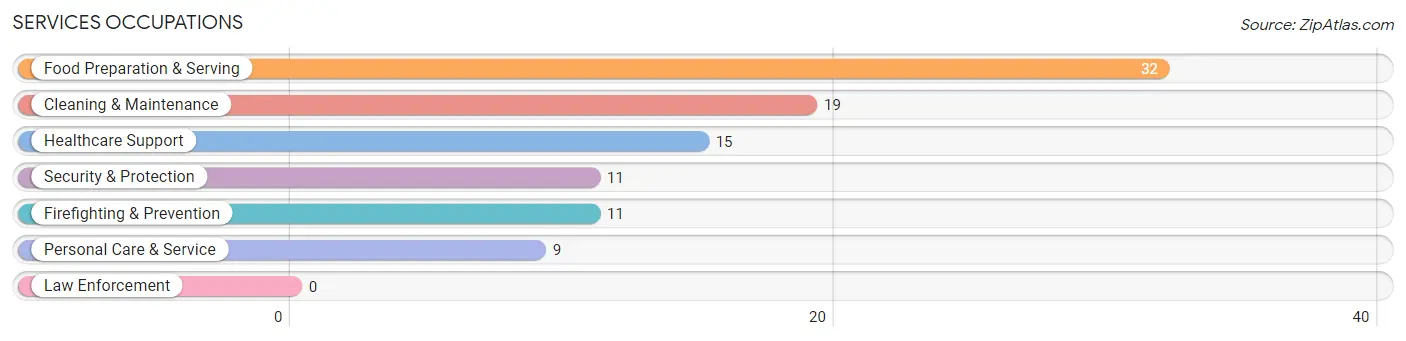
Services Occupations
The most common Services occupations in Robin Glen Indiantown are Food Preparation & Serving (32 | 12.1%), Cleaning & Maintenance (19 | 7.2%), Healthcare Support (15 | 5.7%), Security & Protection (11 | 4.2%), and Firefighting & Prevention (11 | 4.2%).
Services Occupations by Sex
Within the Services occupations in Robin Glen Indiantown, the most male-oriented occupations are Security & Protection (100.0%), Firefighting & Prevention (100.0%), and Personal Care & Service (100.0%), while the most female-oriented occupations are Healthcare Support (100.0%), Cleaning & Maintenance (100.0%), and Food Preparation & Serving (40.6%).
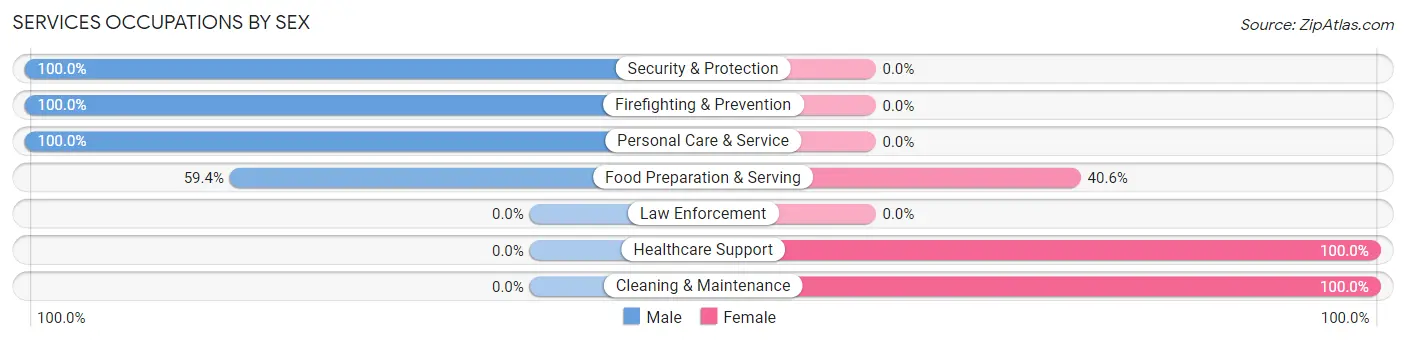
| Occupation | Male | Female |
| Healthcare Support | 0 (0.0%) | 15 (100.0%) |
| Security & Protection | 11 (100.0%) | 0 (0.0%) |
| Firefighting & Prevention | 11 (100.0%) | 0 (0.0%) |
| Law Enforcement | 0 (0.0%) | 0 (0.0%) |
| Food Preparation & Serving | 19 (59.4%) | 13 (40.6%) |
| Cleaning & Maintenance | 0 (0.0%) | 19 (100.0%) |
| Personal Care & Service | 9 (100.0%) | 0 (0.0%) |
| Total (Category) | 39 (45.4%) | 47 (54.6%) |
| Total (Overall) | 124 (46.8%) | 141 (53.2%) |
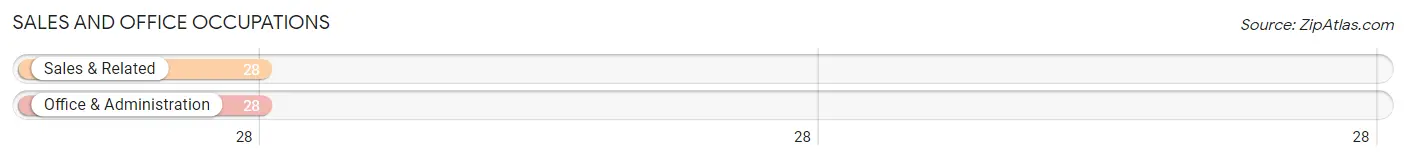
Sales and Office Occupations
The most common Sales and Office occupations in Robin Glen Indiantown are Sales & Related (28 | 10.6%), and Office & Administration (28 | 10.6%).
Sales and Office Occupations by Sex
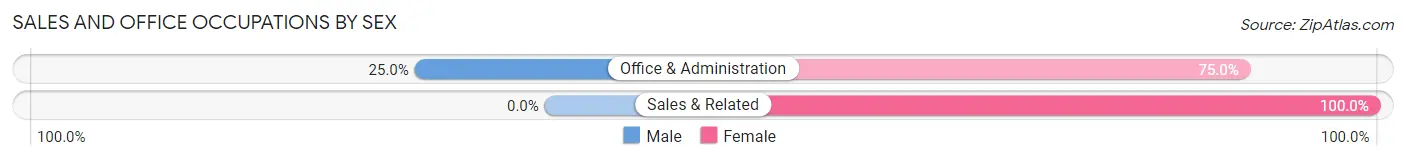
| Occupation | Male | Female |
| Sales & Related | 0 (0.0%) | 28 (100.0%) |
| Office & Administration | 7 (25.0%) | 21 (75.0%) |
| Total (Category) | 7 (12.5%) | 49 (87.5%) |
| Total (Overall) | 124 (46.8%) | 141 (53.2%) |
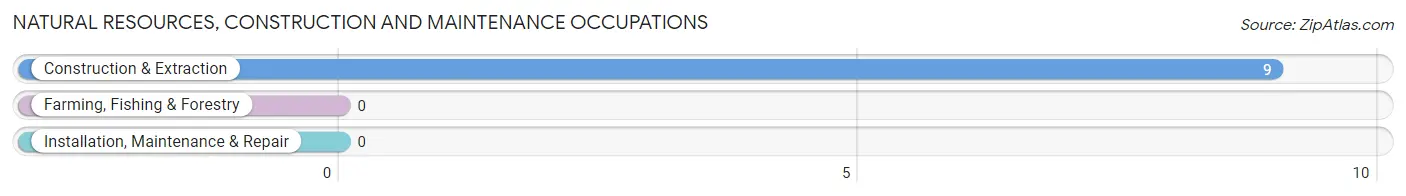
Natural Resources, Construction and Maintenance Occupations
The most common Natural Resources, Construction and Maintenance occupations in Robin Glen Indiantown are , and Construction & Extraction (9 | 3.4%).
Natural Resources, Construction and Maintenance Occupations by Sex
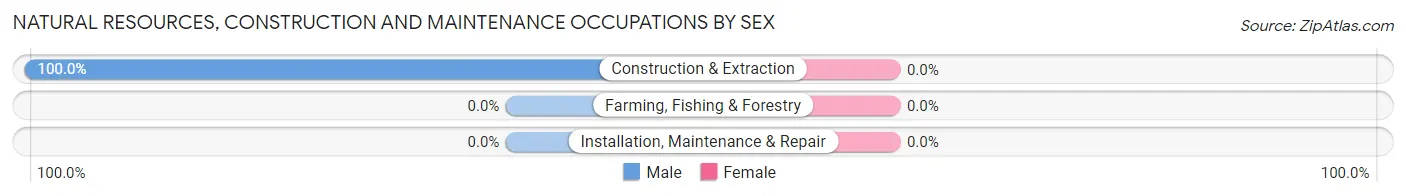
| Occupation | Male | Female |
| Farming, Fishing & Forestry | 0 (0.0%) | 0 (0.0%) |
| Construction & Extraction | 9 (100.0%) | 0 (0.0%) |
| Installation, Maintenance & Repair | 0 (0.0%) | 0 (0.0%) |
| Total (Category) | 9 (100.0%) | 0 (0.0%) |
| Total (Overall) | 124 (46.8%) | 141 (53.2%) |
Production, Transportation and Moving Occupations
The most common Production, Transportation and Moving occupations in Robin Glen Indiantown are Transportation (75 | 28.3%), and Production (19 | 7.2%).
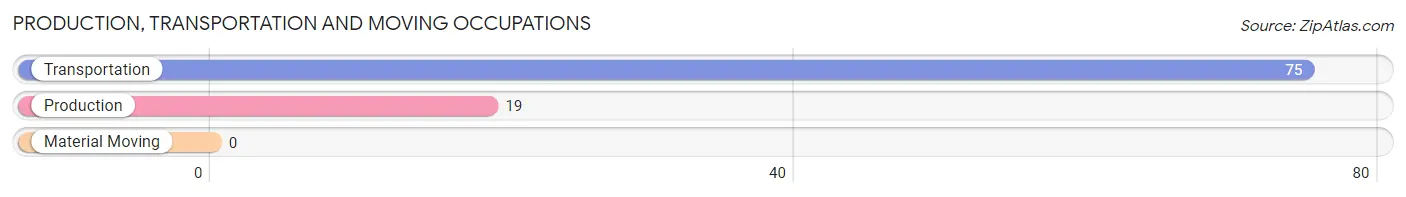
Production, Transportation and Moving Occupations by Sex
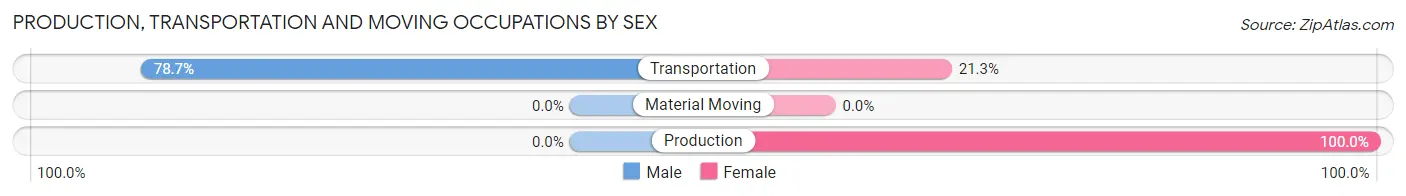
| Occupation | Male | Female |
| Production | 0 (0.0%) | 19 (100.0%) |
| Transportation | 59 (78.7%) | 16 (21.3%) |
| Material Moving | 0 (0.0%) | 0 (0.0%) |
| Total (Category) | 59 (62.8%) | 35 (37.2%) |
| Total (Overall) | 124 (46.8%) | 141 (53.2%) |
Employment Industries by Sex in Robin Glen Indiantown
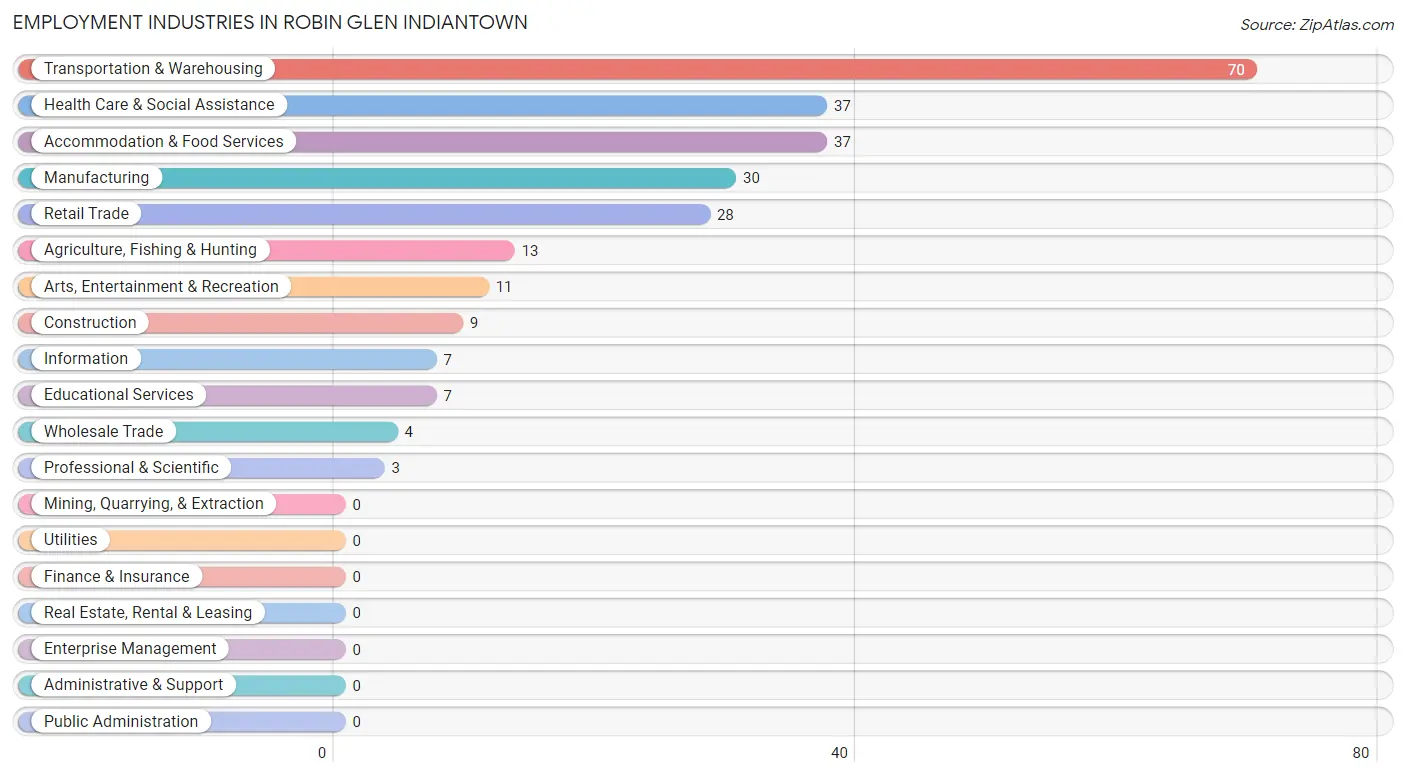
Employment Industries in Robin Glen Indiantown
The major employment industries in Robin Glen Indiantown include Transportation & Warehousing (70 | 26.4%), Health Care & Social Assistance (37 | 14.0%), Accommodation & Food Services (37 | 14.0%), Manufacturing (30 | 11.3%), and Retail Trade (28 | 10.6%).
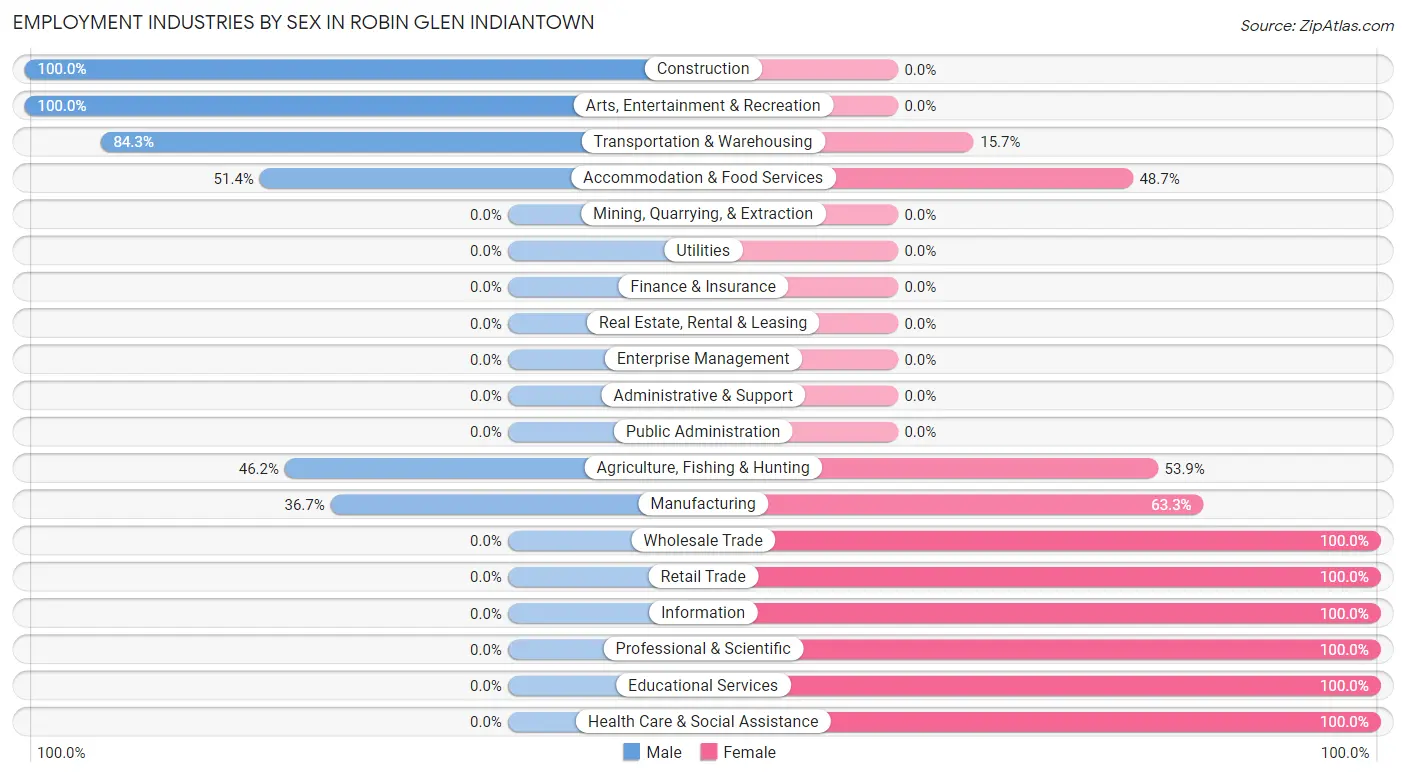
Employment Industries by Sex in Robin Glen Indiantown
The Robin Glen Indiantown industries that see more men than women are Construction (100.0%), Arts, Entertainment & Recreation (100.0%), and Transportation & Warehousing (84.3%), whereas the industries that tend to have a higher number of women are Wholesale Trade (100.0%), Retail Trade (100.0%), and Information (100.0%).
| Industry | Male | Female |
| Agriculture, Fishing & Hunting | 6 (46.2%) | 7 (53.8%) |
| Mining, Quarrying, & Extraction | 0 (0.0%) | 0 (0.0%) |
| Construction | 9 (100.0%) | 0 (0.0%) |
| Manufacturing | 11 (36.7%) | 19 (63.3%) |
| Wholesale Trade | 0 (0.0%) | 4 (100.0%) |
| Retail Trade | 0 (0.0%) | 28 (100.0%) |
| Transportation & Warehousing | 59 (84.3%) | 11 (15.7%) |
| Utilities | 0 (0.0%) | 0 (0.0%) |
| Information | 0 (0.0%) | 7 (100.0%) |
| Finance & Insurance | 0 (0.0%) | 0 (0.0%) |
| Real Estate, Rental & Leasing | 0 (0.0%) | 0 (0.0%) |
| Professional & Scientific | 0 (0.0%) | 3 (100.0%) |
| Enterprise Management | 0 (0.0%) | 0 (0.0%) |
| Administrative & Support | 0 (0.0%) | 0 (0.0%) |
| Educational Services | 0 (0.0%) | 7 (100.0%) |
| Health Care & Social Assistance | 0 (0.0%) | 37 (100.0%) |
| Arts, Entertainment & Recreation | 11 (100.0%) | 0 (0.0%) |
| Accommodation & Food Services | 19 (51.3%) | 18 (48.6%) |
| Public Administration | 0 (0.0%) | 0 (0.0%) |
| Total | 124 (46.8%) | 141 (53.2%) |
Education in Robin Glen Indiantown
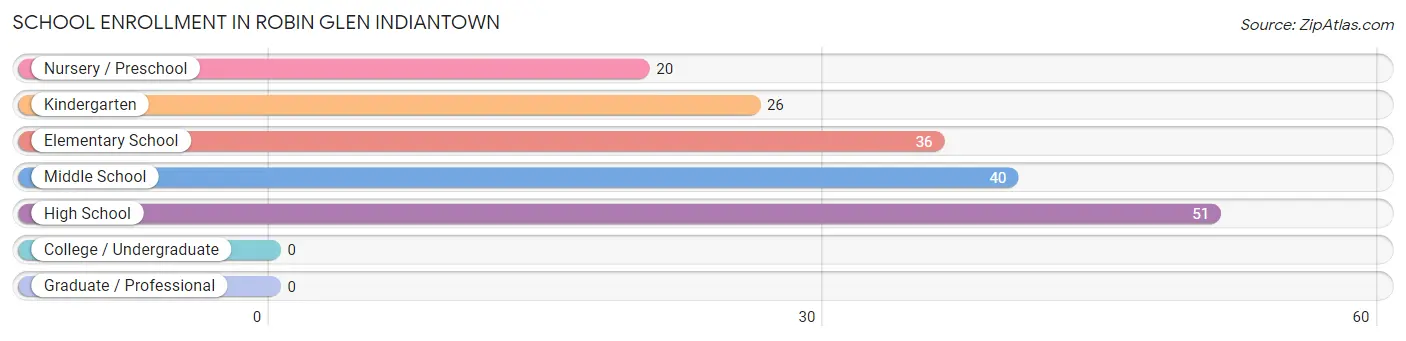
School Enrollment in Robin Glen Indiantown
The most common levels of schooling among the 173 students in Robin Glen Indiantown are high school (51 | 29.5%), middle school (40 | 23.1%), and elementary school (36 | 20.8%).
| School Level | # Students | % Students |
| Nursery / Preschool | 20 | 11.6% |
| Kindergarten | 26 | 15.0% |
| Elementary School | 36 | 20.8% |
| Middle School | 40 | 23.1% |
| High School | 51 | 29.5% |
| College / Undergraduate | 0 | 0.0% |
| Graduate / Professional | 0 | 0.0% |
| Total | 173 | 100.0% |
School Enrollment by Age by Funding Source in Robin Glen Indiantown
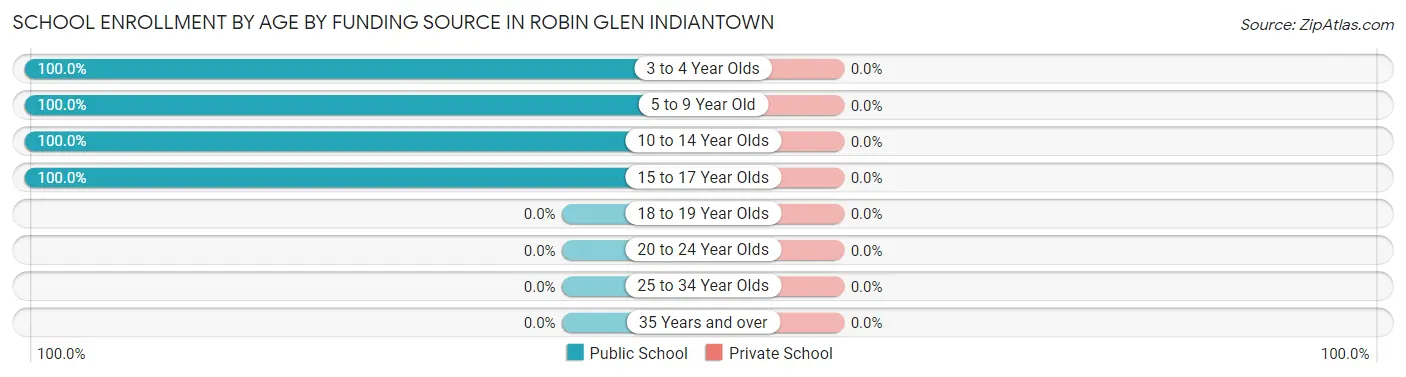
| Age Bracket | Public School | Private School |
| 3 to 4 Year Olds | 20 (100.0%) | 0 (0.0%) |
| 5 to 9 Year Old | 44 (100.0%) | 0 (0.0%) |
| 10 to 14 Year Olds | 73 (100.0%) | 0 (0.0%) |
| 15 to 17 Year Olds | 36 (100.0%) | 0 (0.0%) |
| 18 to 19 Year Olds | 0 (0.0%) | 0 (0.0%) |
| 20 to 24 Year Olds | 0 (0.0%) | 0 (0.0%) |
| 25 to 34 Year Olds | 0 (0.0%) | 0 (0.0%) |
| 35 Years and over | 0 (0.0%) | 0 (0.0%) |
| Total | 173 (100.0%) | 0 (0.0%) |
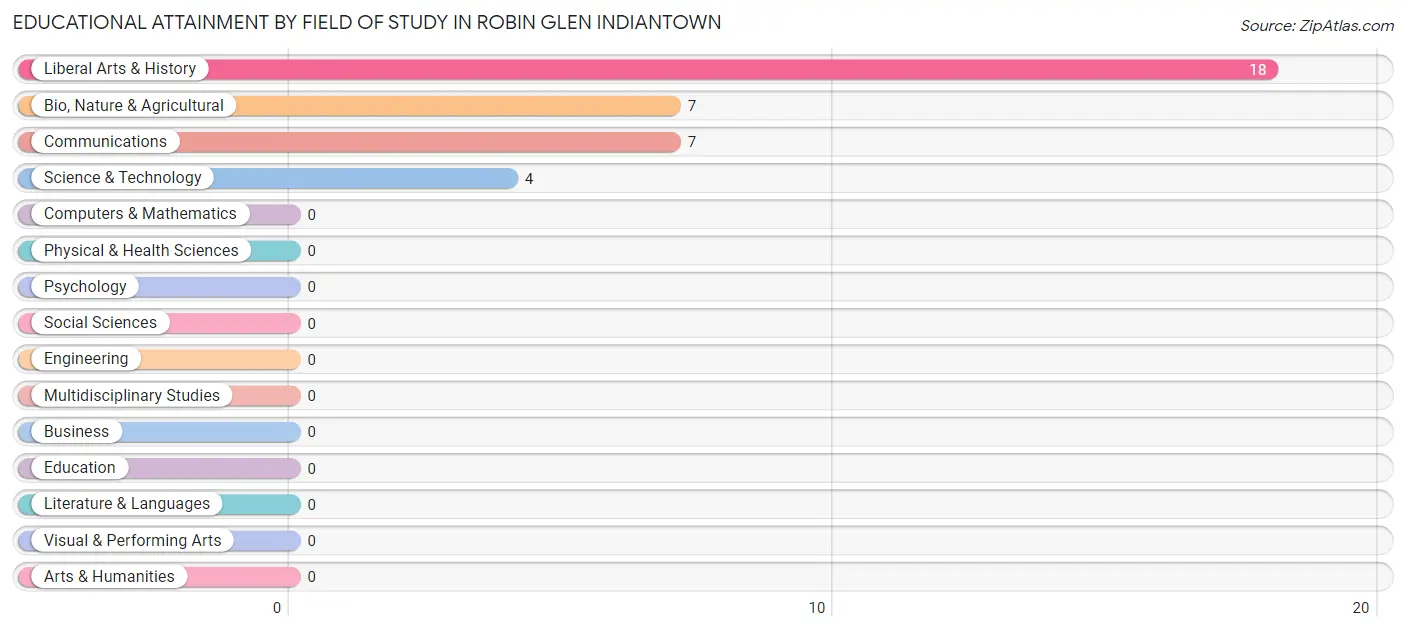
Educational Attainment by Field of Study in Robin Glen Indiantown
Liberal arts & history (18 | 50.0%), bio, nature & agricultural (7 | 19.4%), communications (7 | 19.4%), and science & technology (4 | 11.1%) are the most common fields of study among 36 individuals in Robin Glen Indiantown who have obtained a bachelor's degree or higher.
| Field of Study | # Graduates | % Graduates |
| Computers & Mathematics | 0 | 0.0% |
| Bio, Nature & Agricultural | 7 | 19.4% |
| Physical & Health Sciences | 0 | 0.0% |
| Psychology | 0 | 0.0% |
| Social Sciences | 0 | 0.0% |
| Engineering | 0 | 0.0% |
| Multidisciplinary Studies | 0 | 0.0% |
| Science & Technology | 4 | 11.1% |
| Business | 0 | 0.0% |
| Education | 0 | 0.0% |
| Literature & Languages | 0 | 0.0% |
| Liberal Arts & History | 18 | 50.0% |
| Visual & Performing Arts | 0 | 0.0% |
| Communications | 7 | 19.4% |
| Arts & Humanities | 0 | 0.0% |
| Total | 36 | 100.0% |
Transportation & Commute in Robin Glen Indiantown
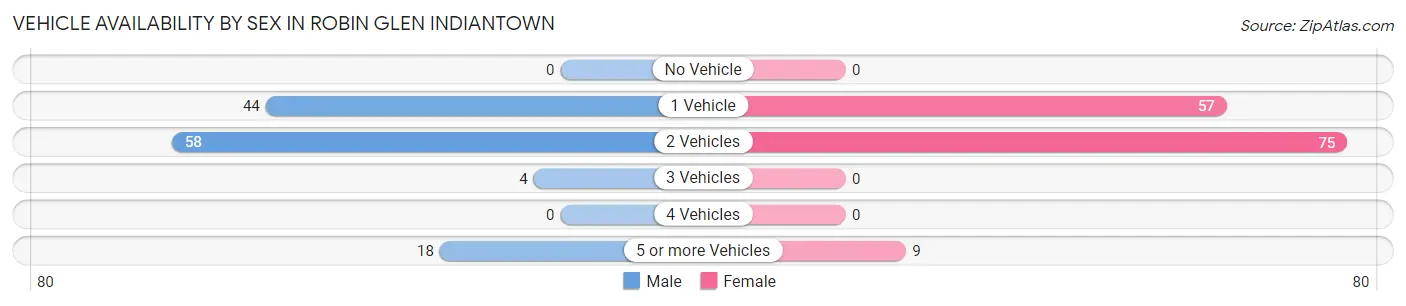
Vehicle Availability by Sex in Robin Glen Indiantown
The most prevalent vehicle ownership categories in Robin Glen Indiantown are males with 2 vehicles (58, accounting for 46.8%) and females with 2 vehicles (75, making up 41.1%).
| Vehicles Available | Male | Female |
| No Vehicle | 0 (0.0%) | 0 (0.0%) |
| 1 Vehicle | 44 (35.5%) | 57 (40.4%) |
| 2 Vehicles | 58 (46.8%) | 75 (53.2%) |
| 3 Vehicles | 4 (3.2%) | 0 (0.0%) |
| 4 Vehicles | 0 (0.0%) | 0 (0.0%) |
| 5 or more Vehicles | 18 (14.5%) | 9 (6.4%) |
| Total | 124 (100.0%) | 141 (100.0%) |
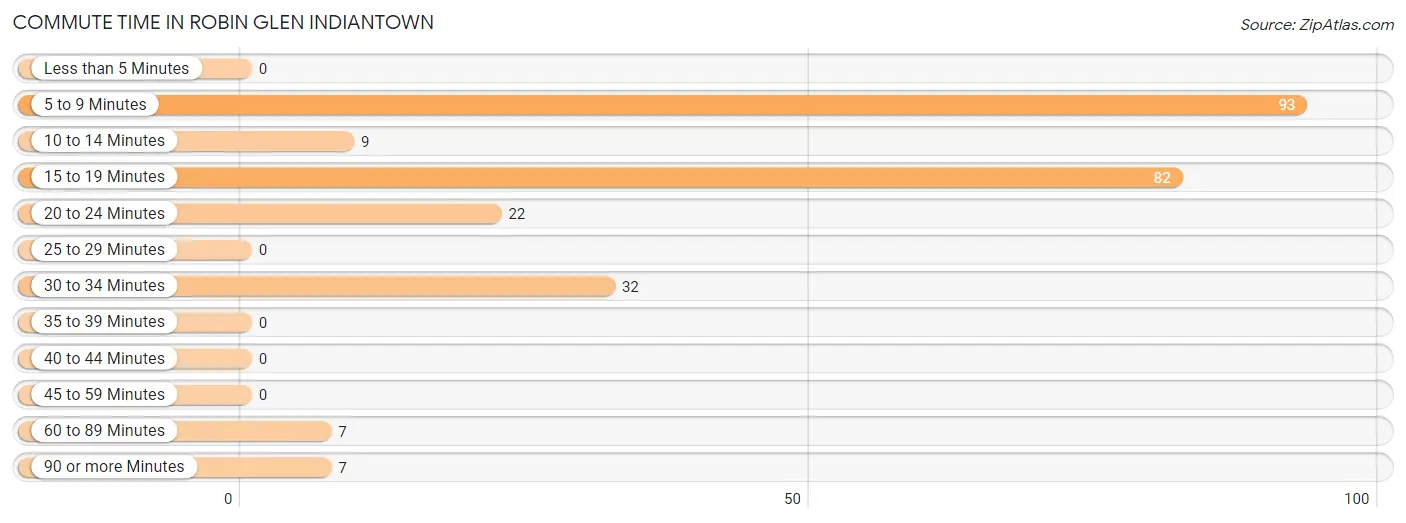
Commute Time in Robin Glen Indiantown
The most frequently occuring commute durations in Robin Glen Indiantown are 5 to 9 minutes (93 commuters, 36.9%), 15 to 19 minutes (82 commuters, 32.5%), and 30 to 34 minutes (32 commuters, 12.7%).
| Commute Time | # Commuters | % Commuters |
| Less than 5 Minutes | 0 | 0.0% |
| 5 to 9 Minutes | 93 | 36.9% |
| 10 to 14 Minutes | 9 | 3.6% |
| 15 to 19 Minutes | 82 | 32.5% |
| 20 to 24 Minutes | 22 | 8.7% |
| 25 to 29 Minutes | 0 | 0.0% |
| 30 to 34 Minutes | 32 | 12.7% |
| 35 to 39 Minutes | 0 | 0.0% |
| 40 to 44 Minutes | 0 | 0.0% |
| 45 to 59 Minutes | 0 | 0.0% |
| 60 to 89 Minutes | 7 | 2.8% |
| 90 or more Minutes | 7 | 2.8% |
Commute Time by Sex in Robin Glen Indiantown
The most common commute times in Robin Glen Indiantown are 15 to 19 minutes (48 commuters, 40.7%) for males and 5 to 9 minutes (71 commuters, 53.0%) for females.
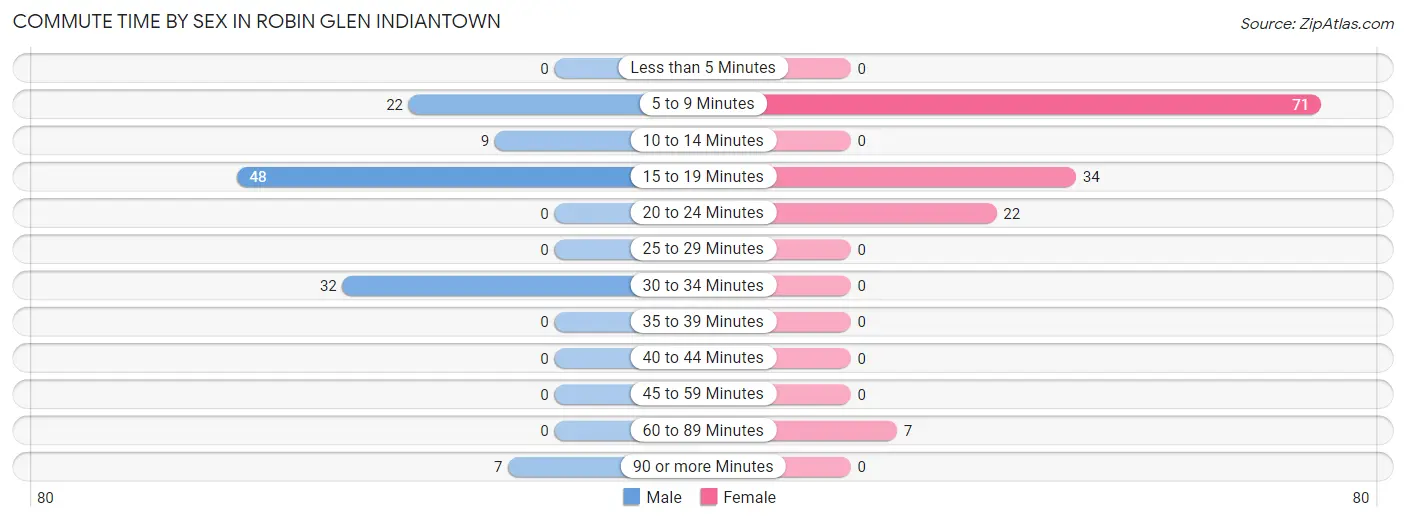
| Commute Time | Male | Female |
| Less than 5 Minutes | 0 (0.0%) | 0 (0.0%) |
| 5 to 9 Minutes | 22 (18.6%) | 71 (53.0%) |
| 10 to 14 Minutes | 9 (7.6%) | 0 (0.0%) |
| 15 to 19 Minutes | 48 (40.7%) | 34 (25.4%) |
| 20 to 24 Minutes | 0 (0.0%) | 22 (16.4%) |
| 25 to 29 Minutes | 0 (0.0%) | 0 (0.0%) |
| 30 to 34 Minutes | 32 (27.1%) | 0 (0.0%) |
| 35 to 39 Minutes | 0 (0.0%) | 0 (0.0%) |
| 40 to 44 Minutes | 0 (0.0%) | 0 (0.0%) |
| 45 to 59 Minutes | 0 (0.0%) | 0 (0.0%) |
| 60 to 89 Minutes | 0 (0.0%) | 7 (5.2%) |
| 90 or more Minutes | 7 (5.9%) | 0 (0.0%) |
Time of Departure to Work by Sex in Robin Glen Indiantown
The most frequent times of departure to work in Robin Glen Indiantown are 4:00 PM to 11:59 PM (46, 39.0%) for males and 12:00 PM to 3:59 PM (45, 33.6%) for females.
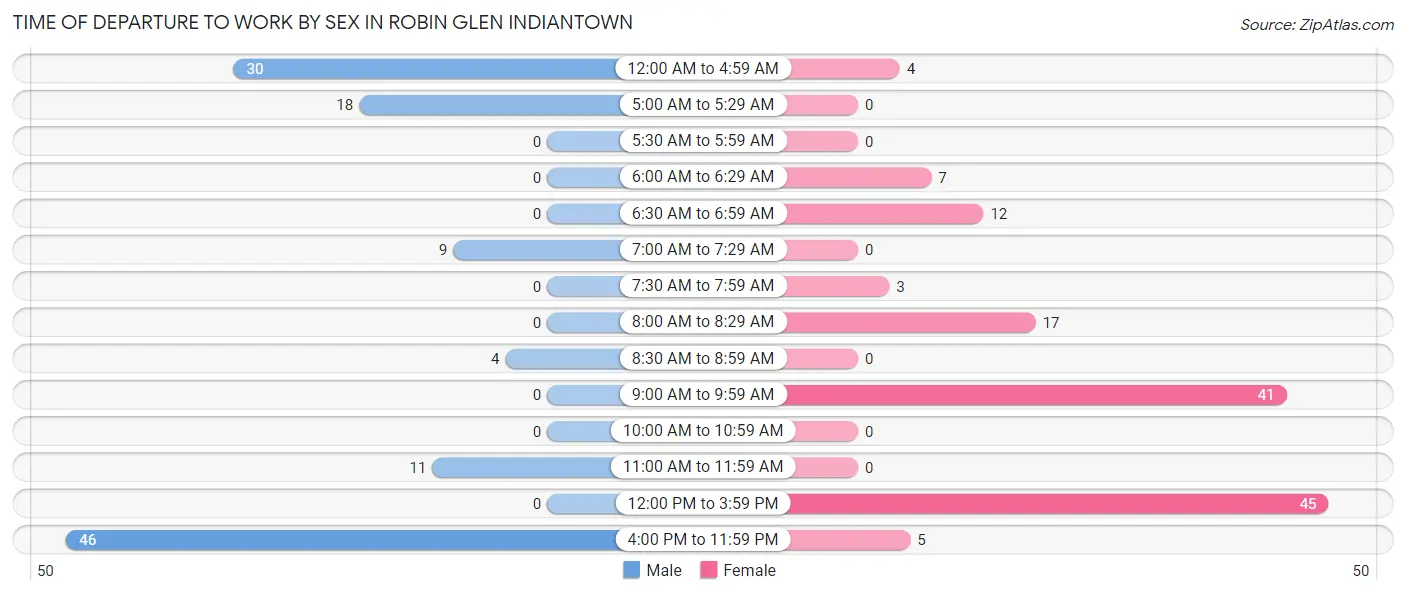
| Time of Departure | Male | Female |
| 12:00 AM to 4:59 AM | 30 (25.4%) | 4 (3.0%) |
| 5:00 AM to 5:29 AM | 18 (15.2%) | 0 (0.0%) |
| 5:30 AM to 5:59 AM | 0 (0.0%) | 0 (0.0%) |
| 6:00 AM to 6:29 AM | 0 (0.0%) | 7 (5.2%) |
| 6:30 AM to 6:59 AM | 0 (0.0%) | 12 (9.0%) |
| 7:00 AM to 7:29 AM | 9 (7.6%) | 0 (0.0%) |
| 7:30 AM to 7:59 AM | 0 (0.0%) | 3 (2.2%) |
| 8:00 AM to 8:29 AM | 0 (0.0%) | 17 (12.7%) |
| 8:30 AM to 8:59 AM | 4 (3.4%) | 0 (0.0%) |
| 9:00 AM to 9:59 AM | 0 (0.0%) | 41 (30.6%) |
| 10:00 AM to 10:59 AM | 0 (0.0%) | 0 (0.0%) |
| 11:00 AM to 11:59 AM | 11 (9.3%) | 0 (0.0%) |
| 12:00 PM to 3:59 PM | 0 (0.0%) | 45 (33.6%) |
| 4:00 PM to 11:59 PM | 46 (39.0%) | 5 (3.7%) |
| Total | 118 (100.0%) | 134 (100.0%) |
Housing Occupancy in Robin Glen Indiantown
Occupancy by Ownership in Robin Glen Indiantown
Of the total 245 dwellings in Robin Glen Indiantown, owner-occupied units account for 193 (78.8%), while renter-occupied units make up 52 (21.2%).
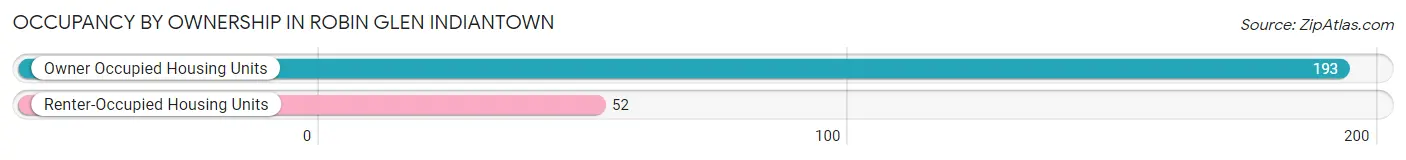
| Occupancy | # Housing Units | % Housing Units |
| Owner Occupied Housing Units | 193 | 78.8% |
| Renter-Occupied Housing Units | 52 | 21.2% |
| Total Occupied Housing Units | 245 | 100.0% |
Occupancy by Household Size in Robin Glen Indiantown
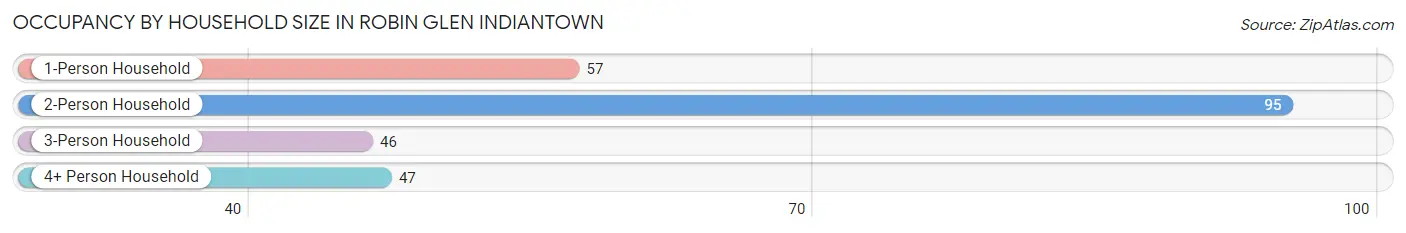
| Household Size | # Housing Units | % Housing Units |
| 1-Person Household | 57 | 23.3% |
| 2-Person Household | 95 | 38.8% |
| 3-Person Household | 46 | 18.8% |
| 4+ Person Household | 47 | 19.2% |
| Total Housing Units | 245 | 100.0% |
Occupancy by Ownership by Household Size in Robin Glen Indiantown
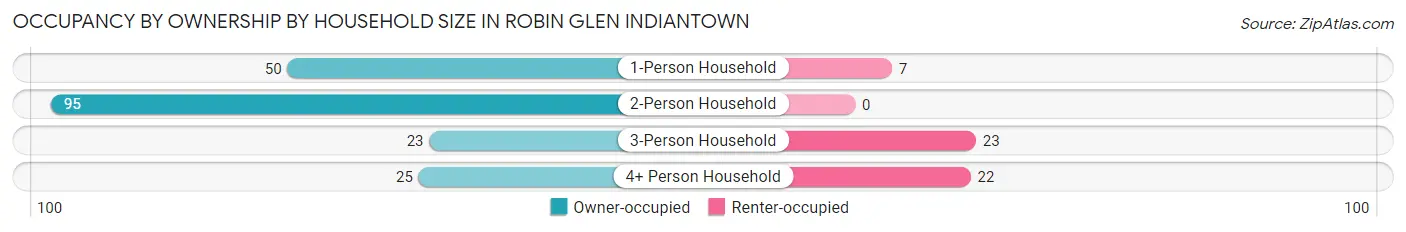
| Household Size | Owner-occupied | Renter-occupied |
| 1-Person Household | 50 (87.7%) | 7 (12.3%) |
| 2-Person Household | 95 (100.0%) | 0 (0.0%) |
| 3-Person Household | 23 (50.0%) | 23 (50.0%) |
| 4+ Person Household | 25 (53.2%) | 22 (46.8%) |
| Total Housing Units | 193 (78.8%) | 52 (21.2%) |
Occupancy by Educational Attainment in Robin Glen Indiantown
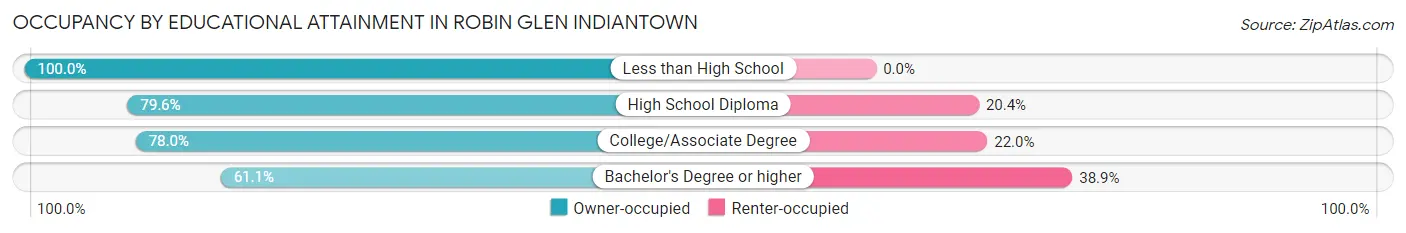
| Household Size | Owner-occupied | Renter-occupied |
| Less than High School | 11 (100.0%) | 0 (0.0%) |
| High School Diploma | 125 (79.6%) | 32 (20.4%) |
| College/Associate Degree | 46 (78.0%) | 13 (22.0%) |
| Bachelor's Degree or higher | 11 (61.1%) | 7 (38.9%) |
Occupancy by Age of Householder in Robin Glen Indiantown
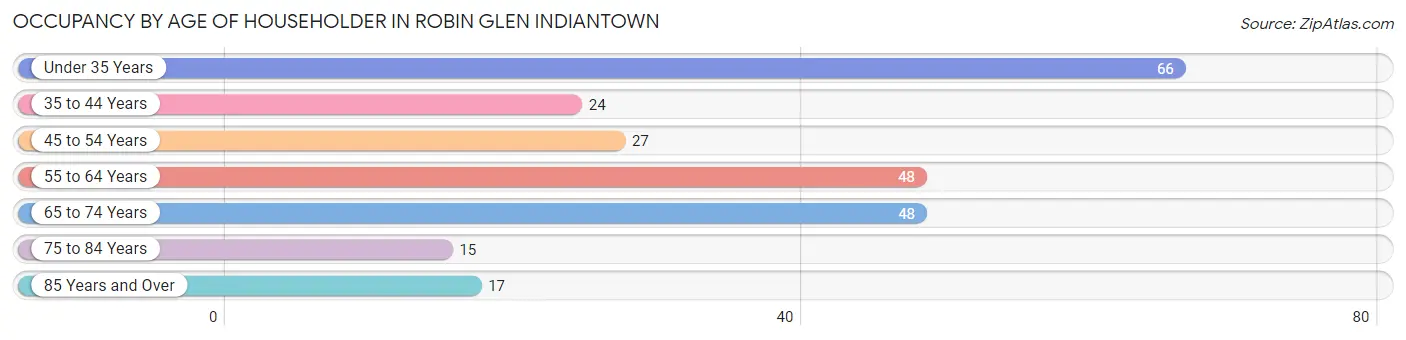
| Age Bracket | # Households | % Households |
| Under 35 Years | 66 | 26.9% |
| 35 to 44 Years | 24 | 9.8% |
| 45 to 54 Years | 27 | 11.0% |
| 55 to 64 Years | 48 | 19.6% |
| 65 to 74 Years | 48 | 19.6% |
| 75 to 84 Years | 15 | 6.1% |
| 85 Years and Over | 17 | 6.9% |
| Total | 245 | 100.0% |
Housing Finances in Robin Glen Indiantown
Median Income by Occupancy in Robin Glen Indiantown
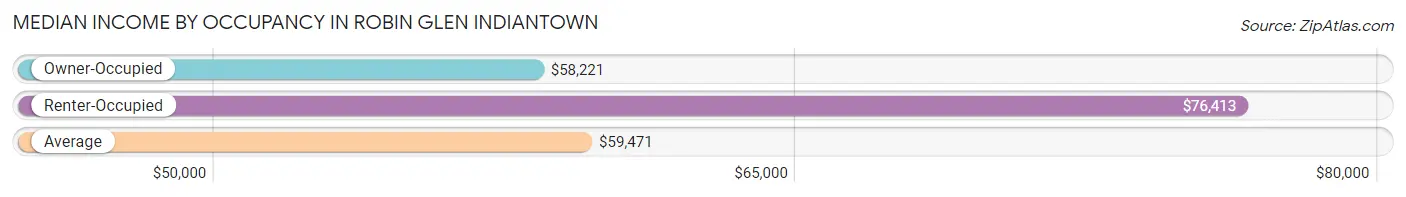
| Occupancy Type | # Households | Median Income |
| Owner-Occupied | 193 (78.8%) | $58,221 |
| Renter-Occupied | 52 (21.2%) | $76,413 |
| Average | 245 (100.0%) | $59,471 |
Occupancy by Householder Income Bracket in Robin Glen Indiantown
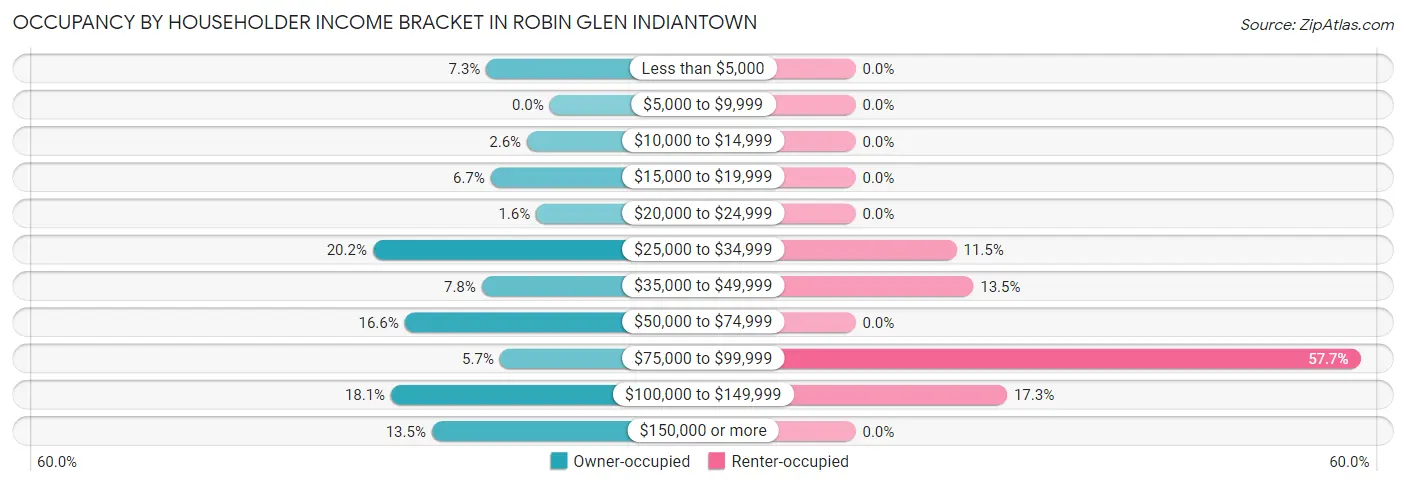
| Income Bracket | Owner-occupied | Renter-occupied |
| Less than $5,000 | 14 (7.2%) | 0 (0.0%) |
| $5,000 to $9,999 | 0 (0.0%) | 0 (0.0%) |
| $10,000 to $14,999 | 5 (2.6%) | 0 (0.0%) |
| $15,000 to $19,999 | 13 (6.7%) | 0 (0.0%) |
| $20,000 to $24,999 | 3 (1.5%) | 0 (0.0%) |
| $25,000 to $34,999 | 39 (20.2%) | 6 (11.5%) |
| $35,000 to $49,999 | 15 (7.8%) | 7 (13.5%) |
| $50,000 to $74,999 | 32 (16.6%) | 0 (0.0%) |
| $75,000 to $99,999 | 11 (5.7%) | 30 (57.7%) |
| $100,000 to $149,999 | 35 (18.1%) | 9 (17.3%) |
| $150,000 or more | 26 (13.5%) | 0 (0.0%) |
| Total | 193 (100.0%) | 52 (100.0%) |
Monthly Housing Cost Tiers in Robin Glen Indiantown
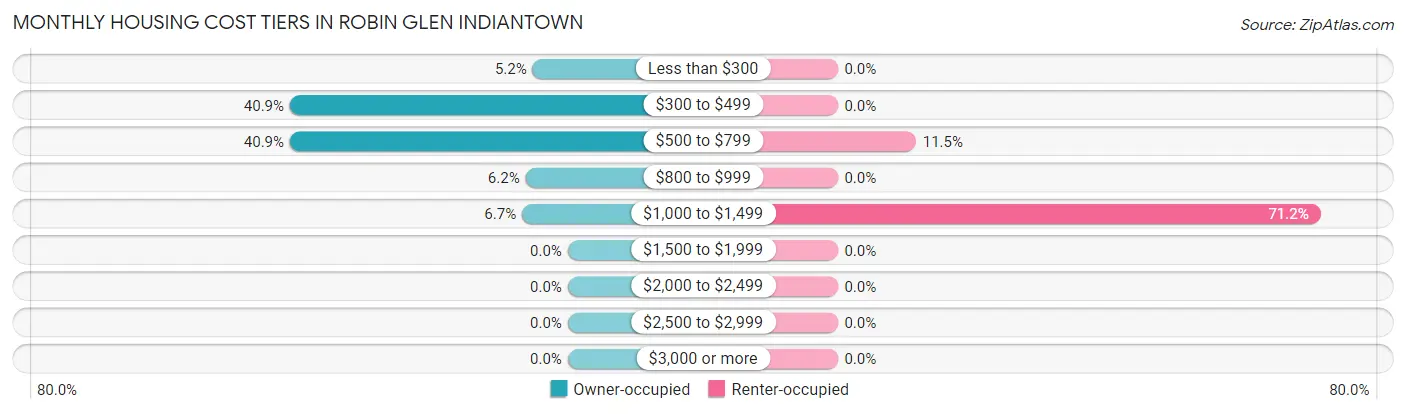
| Monthly Cost | Owner-occupied | Renter-occupied |
| Less than $300 | 10 (5.2%) | 0 (0.0%) |
| $300 to $499 | 79 (40.9%) | 0 (0.0%) |
| $500 to $799 | 79 (40.9%) | 6 (11.5%) |
| $800 to $999 | 12 (6.2%) | 0 (0.0%) |
| $1,000 to $1,499 | 13 (6.7%) | 37 (71.2%) |
| $1,500 to $1,999 | 0 (0.0%) | 0 (0.0%) |
| $2,000 to $2,499 | 0 (0.0%) | 0 (0.0%) |
| $2,500 to $2,999 | 0 (0.0%) | 0 (0.0%) |
| $3,000 or more | 0 (0.0%) | 0 (0.0%) |
| Total | 193 (100.0%) | 52 (100.0%) |
Physical Housing Characteristics in Robin Glen Indiantown
Housing Structures in Robin Glen Indiantown
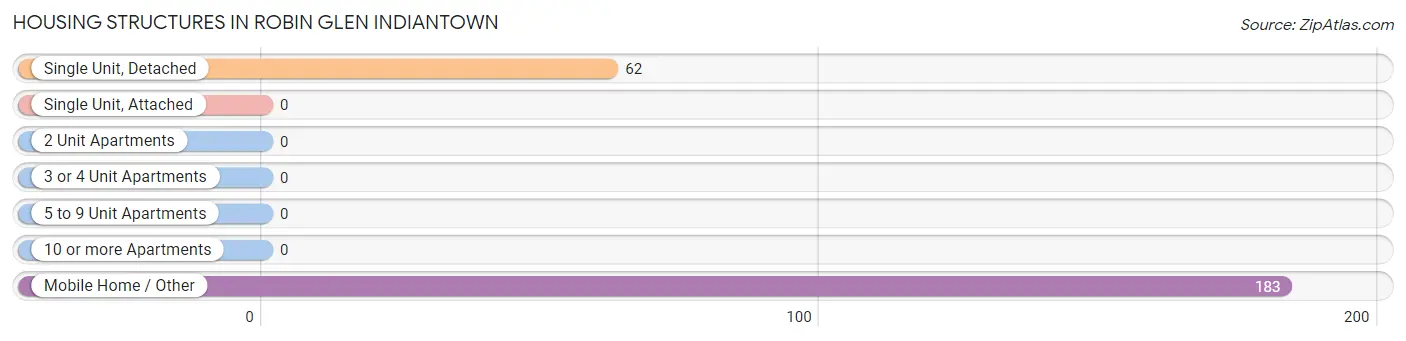
| Structure Type | # Housing Units | % Housing Units |
| Single Unit, Detached | 62 | 25.3% |
| Single Unit, Attached | 0 | 0.0% |
| 2 Unit Apartments | 0 | 0.0% |
| 3 or 4 Unit Apartments | 0 | 0.0% |
| 5 to 9 Unit Apartments | 0 | 0.0% |
| 10 or more Apartments | 0 | 0.0% |
| Mobile Home / Other | 183 | 74.7% |
| Total | 245 | 100.0% |
Housing Structures by Occupancy in Robin Glen Indiantown
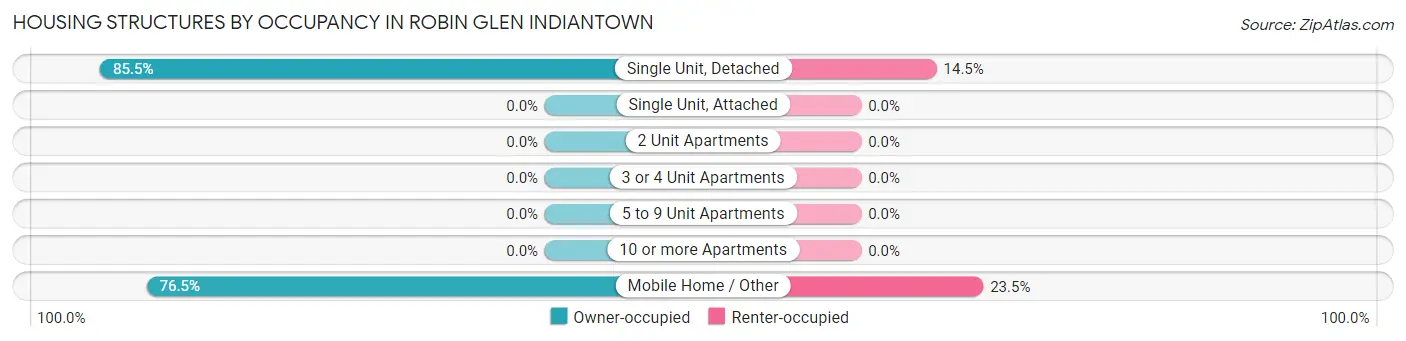
| Structure Type | Owner-occupied | Renter-occupied |
| Single Unit, Detached | 53 (85.5%) | 9 (14.5%) |
| Single Unit, Attached | 0 (0.0%) | 0 (0.0%) |
| 2 Unit Apartments | 0 (0.0%) | 0 (0.0%) |
| 3 or 4 Unit Apartments | 0 (0.0%) | 0 (0.0%) |
| 5 to 9 Unit Apartments | 0 (0.0%) | 0 (0.0%) |
| 10 or more Apartments | 0 (0.0%) | 0 (0.0%) |
| Mobile Home / Other | 140 (76.5%) | 43 (23.5%) |
| Total | 193 (78.8%) | 52 (21.2%) |
Housing Structures by Number of Rooms in Robin Glen Indiantown
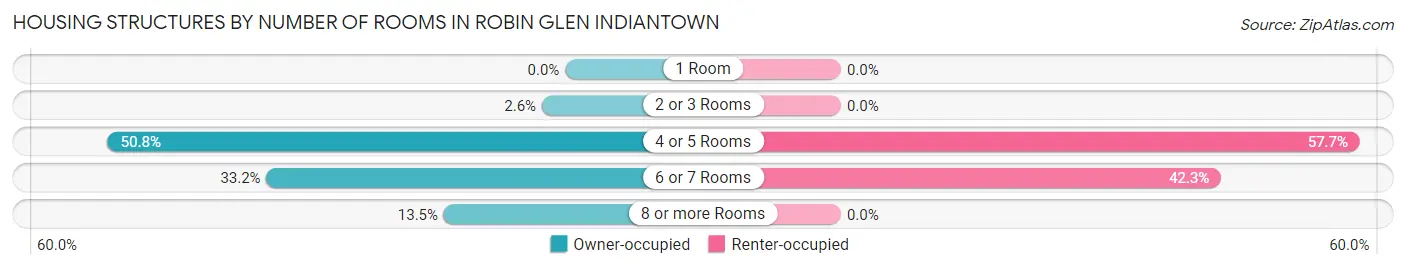
| Number of Rooms | Owner-occupied | Renter-occupied |
| 1 Room | 0 (0.0%) | 0 (0.0%) |
| 2 or 3 Rooms | 5 (2.6%) | 0 (0.0%) |
| 4 or 5 Rooms | 98 (50.8%) | 30 (57.7%) |
| 6 or 7 Rooms | 64 (33.2%) | 22 (42.3%) |
| 8 or more Rooms | 26 (13.5%) | 0 (0.0%) |
| Total | 193 (100.0%) | 52 (100.0%) |
Housing Structure by Heating Type in Robin Glen Indiantown
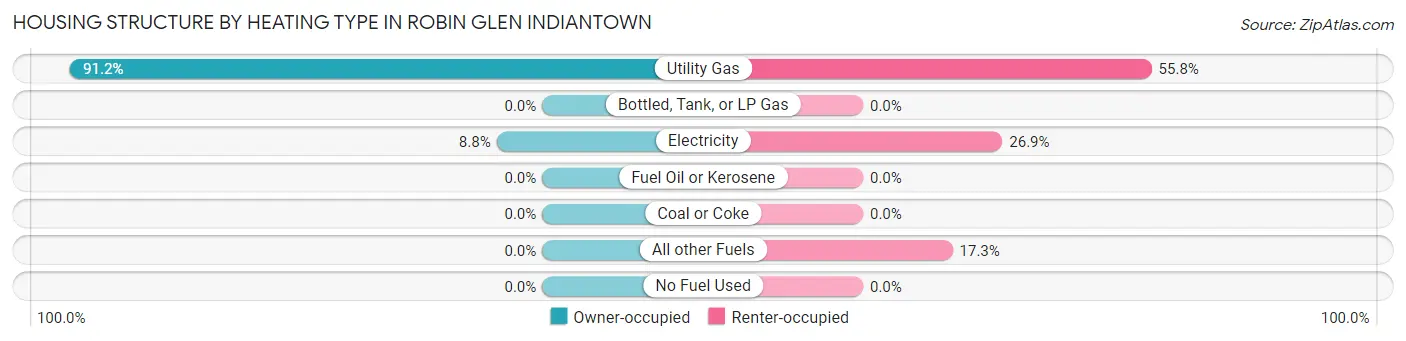
| Heating Type | Owner-occupied | Renter-occupied |
| Utility Gas | 176 (91.2%) | 29 (55.8%) |
| Bottled, Tank, or LP Gas | 0 (0.0%) | 0 (0.0%) |
| Electricity | 17 (8.8%) | 14 (26.9%) |
| Fuel Oil or Kerosene | 0 (0.0%) | 0 (0.0%) |
| Coal or Coke | 0 (0.0%) | 0 (0.0%) |
| All other Fuels | 0 (0.0%) | 9 (17.3%) |
| No Fuel Used | 0 (0.0%) | 0 (0.0%) |
| Total | 193 (100.0%) | 52 (100.0%) |
Household Vehicle Usage in Robin Glen Indiantown
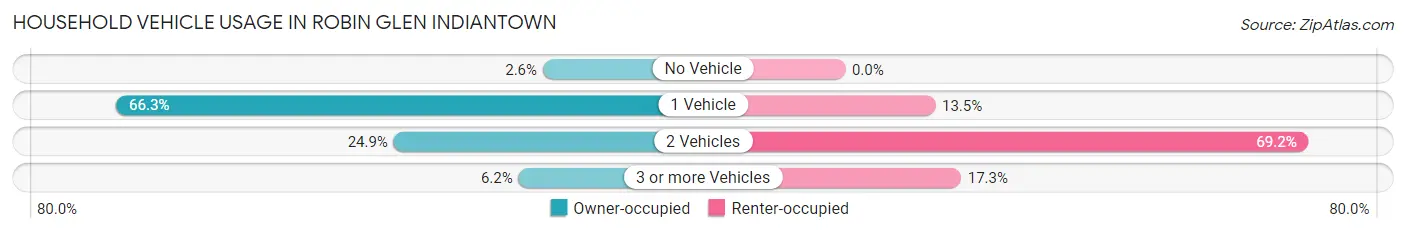
| Vehicles per Household | Owner-occupied | Renter-occupied |
| No Vehicle | 5 (2.6%) | 0 (0.0%) |
| 1 Vehicle | 128 (66.3%) | 7 (13.5%) |
| 2 Vehicles | 48 (24.9%) | 36 (69.2%) |
| 3 or more Vehicles | 12 (6.2%) | 9 (17.3%) |
| Total | 193 (100.0%) | 52 (100.0%) |
Real Estate & Mortgages in Robin Glen Indiantown
Real Estate and Mortgage Overview in Robin Glen Indiantown
| Characteristic | Without Mortgage | With Mortgage |
| Housing Units | 154 | 39 |
| Median Property Value | $9,999 | $0 |
| Median Household Income | $36,875 | $7 |
| Monthly Housing Costs | $456 | $0 |
| Real Estate Taxes | $1,900 | $28 |
Property Value by Mortgage Status in Robin Glen Indiantown
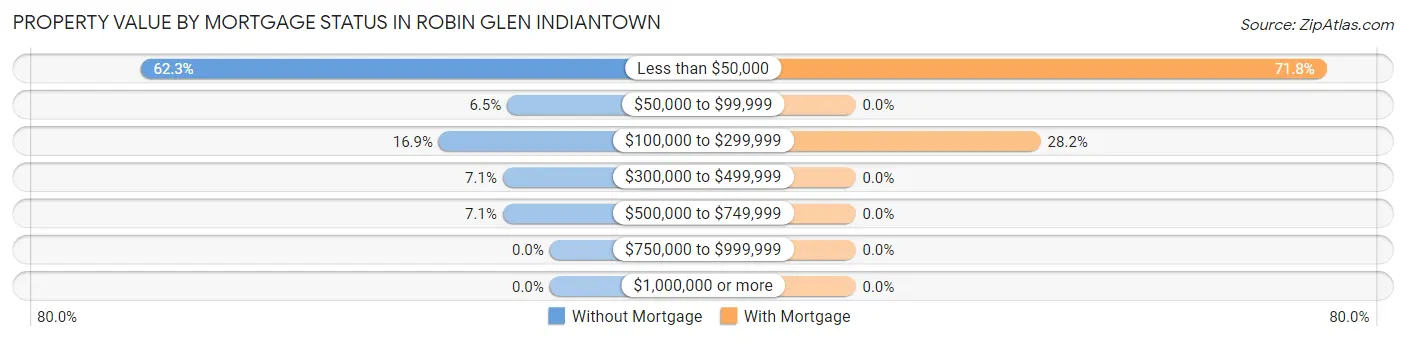
| Property Value | Without Mortgage | With Mortgage |
| Less than $50,000 | 96 (62.3%) | 28 (71.8%) |
| $50,000 to $99,999 | 10 (6.5%) | 0 (0.0%) |
| $100,000 to $299,999 | 26 (16.9%) | 11 (28.2%) |
| $300,000 to $499,999 | 11 (7.1%) | 0 (0.0%) |
| $500,000 to $749,999 | 11 (7.1%) | 0 (0.0%) |
| $750,000 to $999,999 | 0 (0.0%) | 0 (0.0%) |
| $1,000,000 or more | 0 (0.0%) | 0 (0.0%) |
| Total | 154 (100.0%) | 39 (100.0%) |
Household Income by Mortgage Status in Robin Glen Indiantown
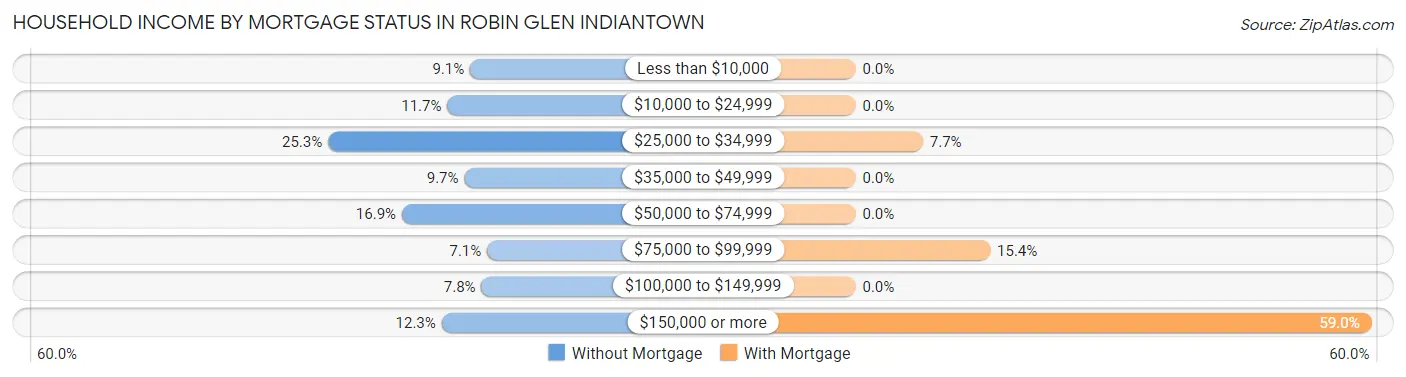
| Household Income | Without Mortgage | With Mortgage |
| Less than $10,000 | 14 (9.1%) | 0 (0.0%) |
| $10,000 to $24,999 | 18 (11.7%) | 0 (0.0%) |
| $25,000 to $34,999 | 39 (25.3%) | 3 (7.7%) |
| $35,000 to $49,999 | 15 (9.7%) | 0 (0.0%) |
| $50,000 to $74,999 | 26 (16.9%) | 0 (0.0%) |
| $75,000 to $99,999 | 11 (7.1%) | 6 (15.4%) |
| $100,000 to $149,999 | 12 (7.8%) | 0 (0.0%) |
| $150,000 or more | 19 (12.3%) | 23 (59.0%) |
| Total | 154 (100.0%) | 39 (100.0%) |
Property Value to Household Income Ratio in Robin Glen Indiantown
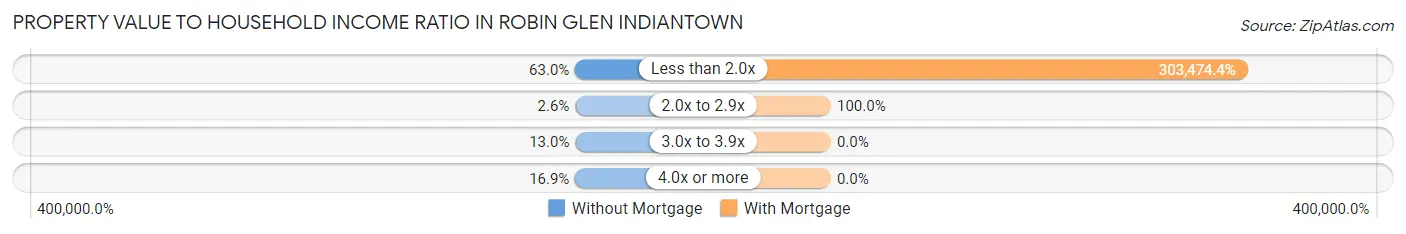
| Value-to-Income Ratio | Without Mortgage | With Mortgage |
| Less than 2.0x | 97 (63.0%) | 118,355 (303,474.4%) |
| 2.0x to 2.9x | 4 (2.6%) | 39 (100.0%) |
| 3.0x to 3.9x | 20 (13.0%) | 0 (0.0%) |
| 4.0x or more | 26 (16.9%) | 0 (0.0%) |
| Total | 154 (100.0%) | 39 (100.0%) |
Real Estate Taxes by Mortgage Status in Robin Glen Indiantown
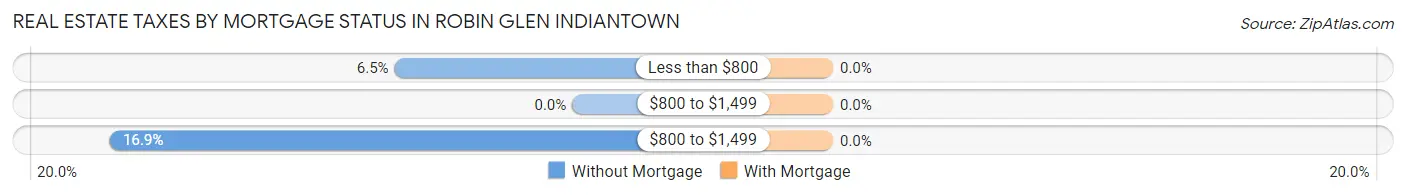
| Property Taxes | Without Mortgage | With Mortgage |
| Less than $800 | 10 (6.5%) | 0 (0.0%) |
| $800 to $1,499 | 0 (0.0%) | 0 (0.0%) |
| $800 to $1,499 | 26 (16.9%) | 0 (0.0%) |
| Total | 154 (100.0%) | 39 (100.0%) |
Health & Disability in Robin Glen Indiantown
Health Insurance Coverage by Age in Robin Glen Indiantown
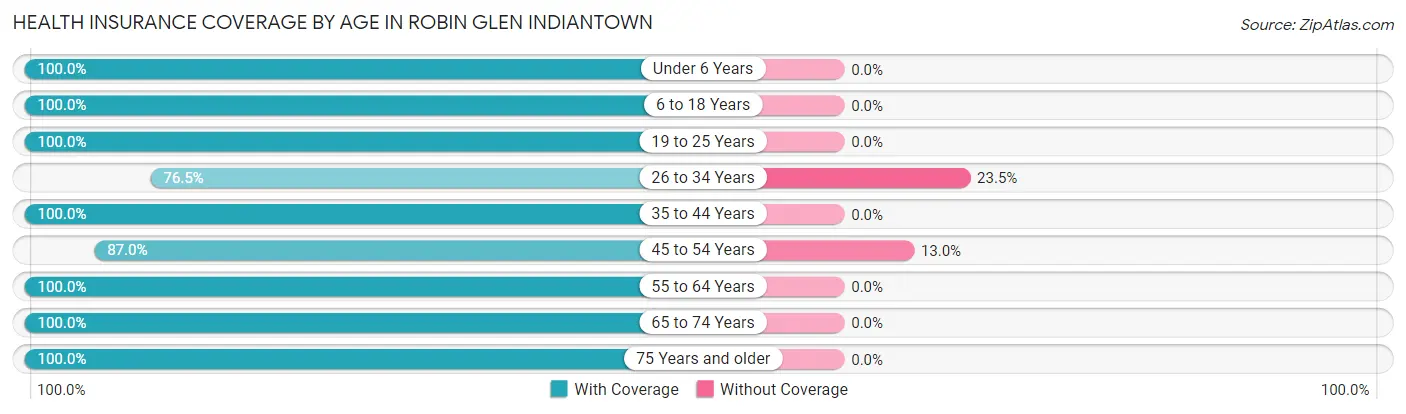
| Age Bracket | With Coverage | Without Coverage |
| Under 6 Years | 24 (100.0%) | 0 (0.0%) |
| 6 to 18 Years | 158 (100.0%) | 0 (0.0%) |
| 19 to 25 Years | 37 (100.0%) | 0 (0.0%) |
| 26 to 34 Years | 75 (76.5%) | 23 (23.5%) |
| 35 to 44 Years | 43 (100.0%) | 0 (0.0%) |
| 45 to 54 Years | 67 (87.0%) | 10 (13.0%) |
| 55 to 64 Years | 62 (100.0%) | 0 (0.0%) |
| 65 to 74 Years | 96 (100.0%) | 0 (0.0%) |
| 75 Years and older | 39 (100.0%) | 0 (0.0%) |
| Total | 601 (94.8%) | 33 (5.2%) |
Health Insurance Coverage by Citizenship Status in Robin Glen Indiantown
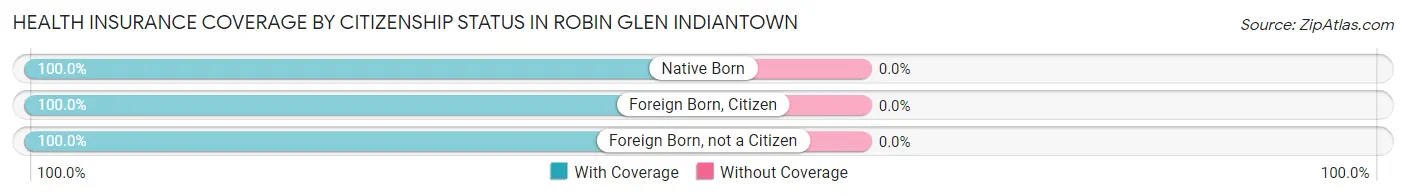
| Citizenship Status | With Coverage | Without Coverage |
| Native Born | 24 (100.0%) | 0 (0.0%) |
| Foreign Born, Citizen | 158 (100.0%) | 0 (0.0%) |
| Foreign Born, not a Citizen | 37 (100.0%) | 0 (0.0%) |
Health Insurance Coverage by Household Income in Robin Glen Indiantown
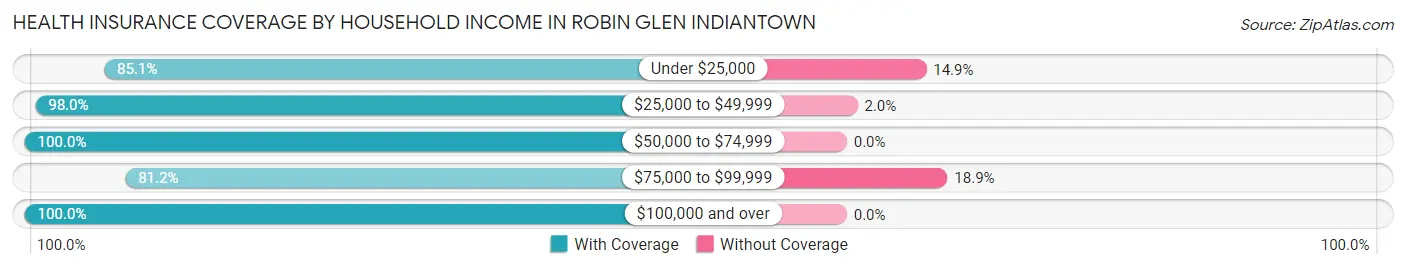
| Household Income | With Coverage | Without Coverage |
| Under $25,000 | 40 (85.1%) | 7 (14.9%) |
| $25,000 to $49,999 | 146 (98.0%) | 3 (2.0%) |
| $50,000 to $74,999 | 84 (100.0%) | 0 (0.0%) |
| $75,000 to $99,999 | 99 (81.1%) | 23 (18.9%) |
| $100,000 and over | 232 (100.0%) | 0 (0.0%) |
Public vs Private Health Insurance Coverage by Age in Robin Glen Indiantown
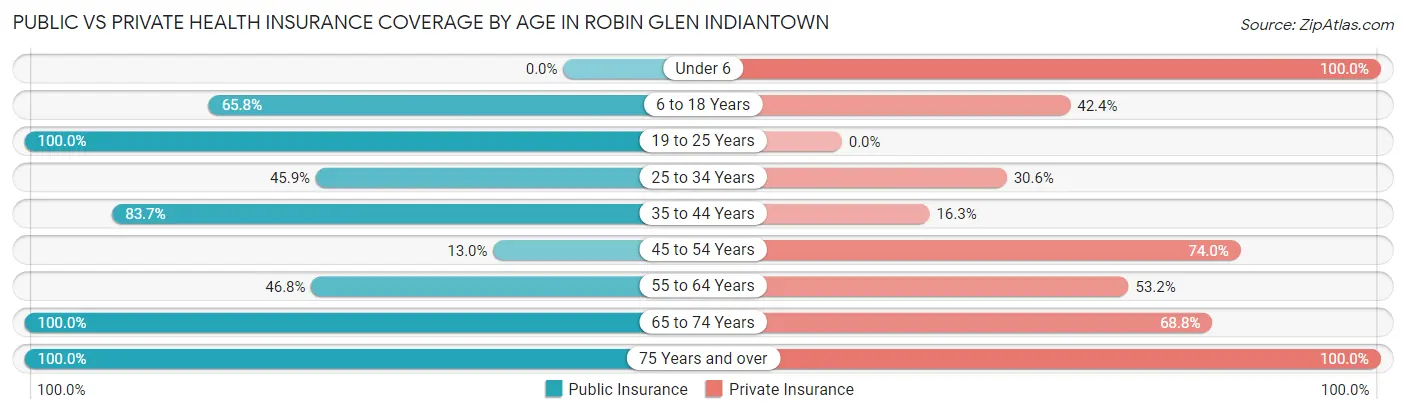
| Age Bracket | Public Insurance | Private Insurance |
| Under 6 | 0 (0.0%) | 24 (100.0%) |
| 6 to 18 Years | 104 (65.8%) | 67 (42.4%) |
| 19 to 25 Years | 37 (100.0%) | 0 (0.0%) |
| 25 to 34 Years | 45 (45.9%) | 30 (30.6%) |
| 35 to 44 Years | 36 (83.7%) | 7 (16.3%) |
| 45 to 54 Years | 10 (13.0%) | 57 (74.0%) |
| 55 to 64 Years | 29 (46.8%) | 33 (53.2%) |
| 65 to 74 Years | 96 (100.0%) | 66 (68.8%) |
| 75 Years and over | 39 (100.0%) | 39 (100.0%) |
| Total | 396 (62.5%) | 323 (50.9%) |
Disability Status by Sex by Age in Robin Glen Indiantown
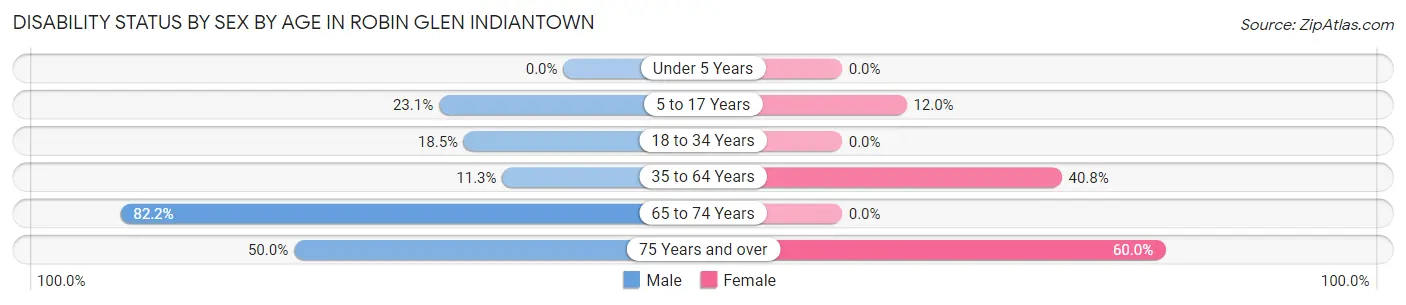
| Age Bracket | Male | Female |
| Under 5 Years | 0 (0.0%) | 0 (0.0%) |
| 5 to 17 Years | 18 (23.1%) | 9 (12.0%) |
| 18 to 34 Years | 12 (18.5%) | 0 (0.0%) |
| 35 to 64 Years | 12 (11.3%) | 31 (40.8%) |
| 65 to 74 Years | 37 (82.2%) | 0 (0.0%) |
| 75 Years and over | 7 (50.0%) | 15 (60.0%) |
Disability Class by Sex by Age in Robin Glen Indiantown
Disability Class: Hearing Difficulty
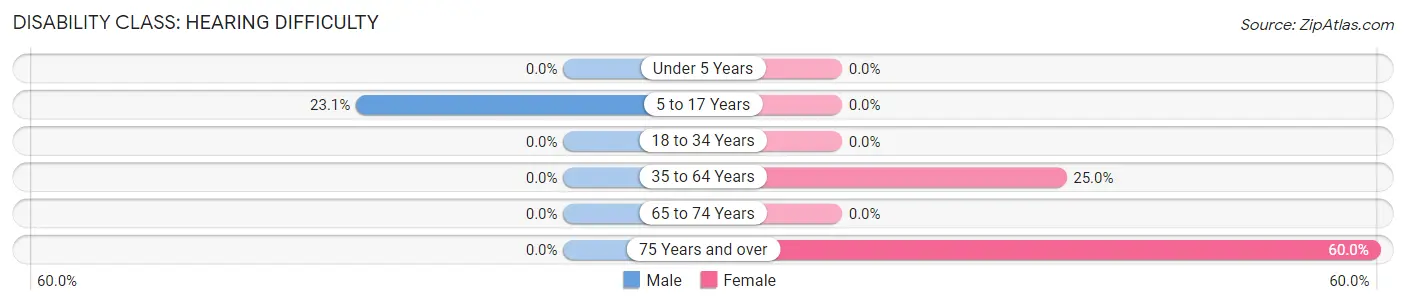
| Age Bracket | Male | Female |
| Under 5 Years | 0 (0.0%) | 0 (0.0%) |
| 5 to 17 Years | 18 (23.1%) | 0 (0.0%) |
| 18 to 34 Years | 0 (0.0%) | 0 (0.0%) |
| 35 to 64 Years | 0 (0.0%) | 19 (25.0%) |
| 65 to 74 Years | 0 (0.0%) | 0 (0.0%) |
| 75 Years and over | 0 (0.0%) | 15 (60.0%) |
Disability Class: Vision Difficulty
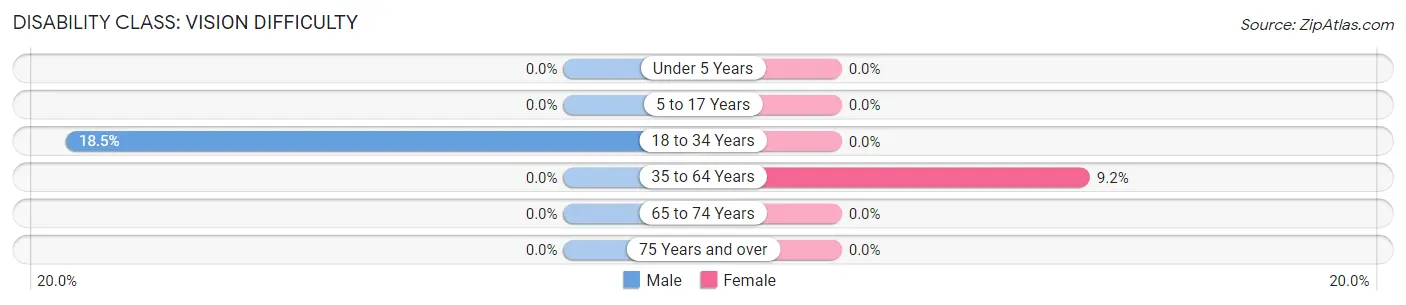
| Age Bracket | Male | Female |
| Under 5 Years | 0 (0.0%) | 0 (0.0%) |
| 5 to 17 Years | 0 (0.0%) | 0 (0.0%) |
| 18 to 34 Years | 12 (18.5%) | 0 (0.0%) |
| 35 to 64 Years | 0 (0.0%) | 7 (9.2%) |
| 65 to 74 Years | 0 (0.0%) | 0 (0.0%) |
| 75 Years and over | 0 (0.0%) | 0 (0.0%) |
Disability Class: Cognitive Difficulty
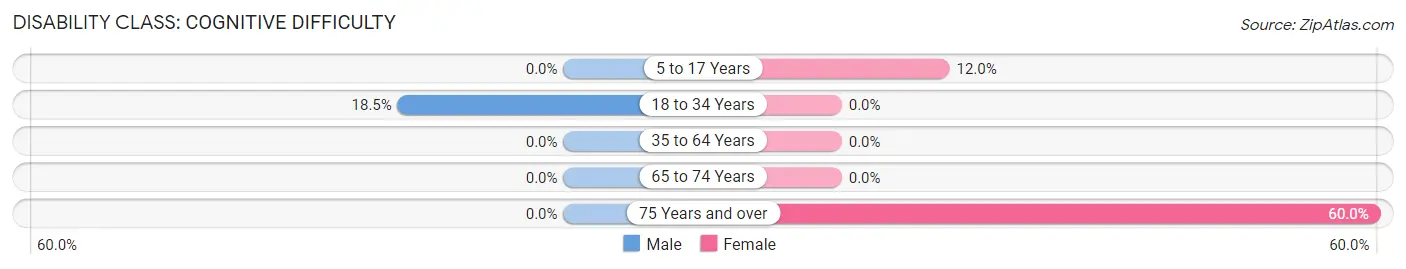
| Age Bracket | Male | Female |
| 5 to 17 Years | 0 (0.0%) | 9 (12.0%) |
| 18 to 34 Years | 12 (18.5%) | 0 (0.0%) |
| 35 to 64 Years | 0 (0.0%) | 0 (0.0%) |
| 65 to 74 Years | 0 (0.0%) | 0 (0.0%) |
| 75 Years and over | 0 (0.0%) | 15 (60.0%) |
Disability Class: Ambulatory Difficulty
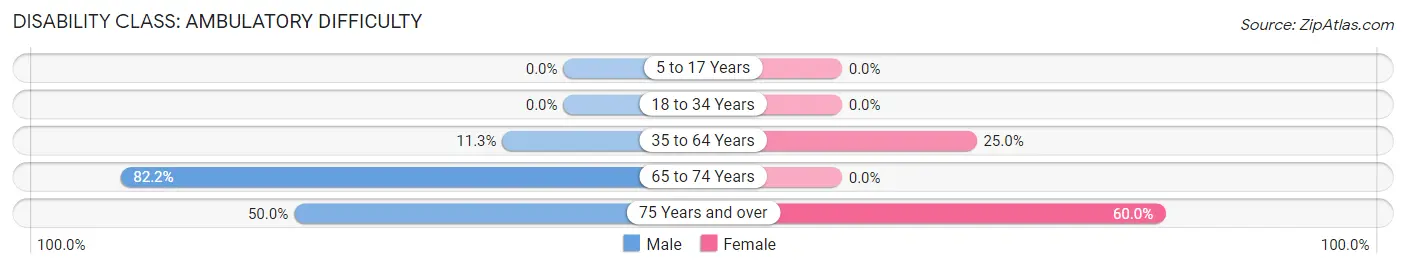
| Age Bracket | Male | Female |
| 5 to 17 Years | 0 (0.0%) | 0 (0.0%) |
| 18 to 34 Years | 0 (0.0%) | 0 (0.0%) |
| 35 to 64 Years | 12 (11.3%) | 19 (25.0%) |
| 65 to 74 Years | 37 (82.2%) | 0 (0.0%) |
| 75 Years and over | 7 (50.0%) | 15 (60.0%) |
Disability Class: Self-Care Difficulty
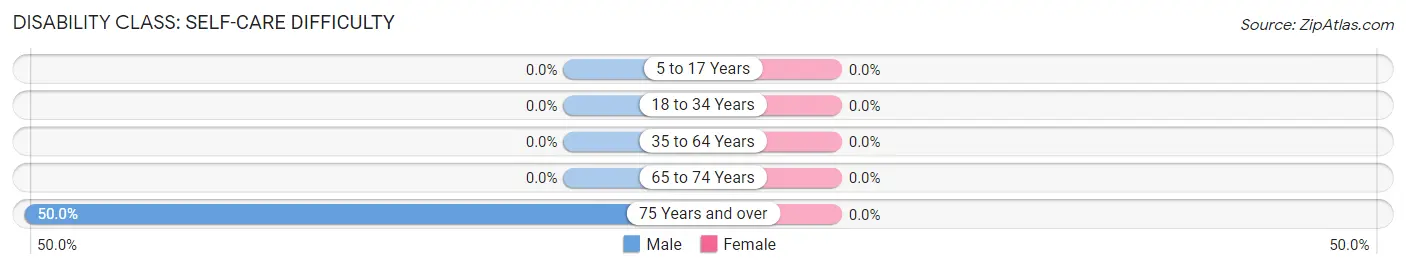
| Age Bracket | Male | Female |
| 5 to 17 Years | 0 (0.0%) | 0 (0.0%) |
| 18 to 34 Years | 0 (0.0%) | 0 (0.0%) |
| 35 to 64 Years | 0 (0.0%) | 0 (0.0%) |
| 65 to 74 Years | 0 (0.0%) | 0 (0.0%) |
| 75 Years and over | 7 (50.0%) | 0 (0.0%) |
Technology Access in Robin Glen Indiantown
Computing Device Access in Robin Glen Indiantown
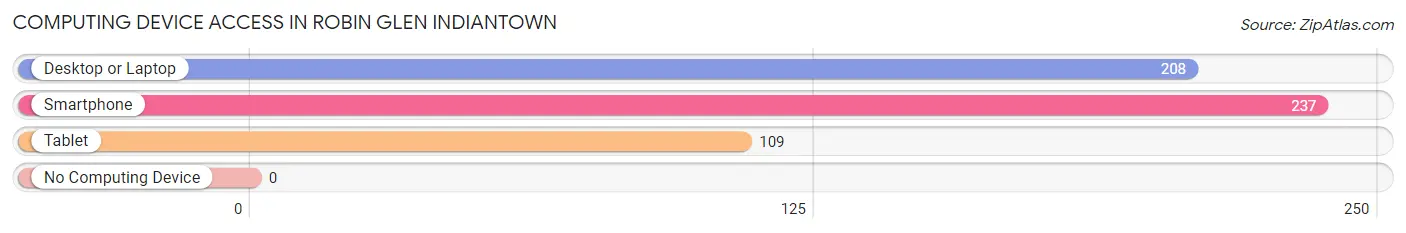
| Device Type | # Households | % Households |
| Desktop or Laptop | 208 | 84.9% |
| Smartphone | 237 | 96.7% |
| Tablet | 109 | 44.5% |
| No Computing Device | 0 | 0.0% |
| Total | 245 | 100.0% |
Internet Access in Robin Glen Indiantown
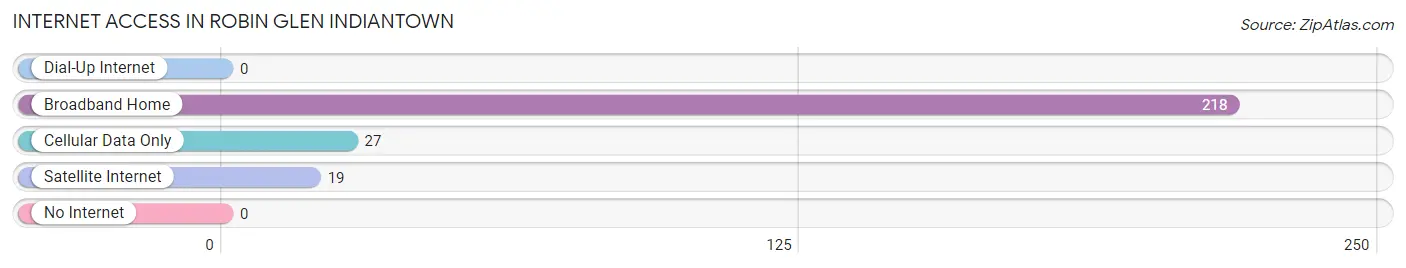
| Internet Type | # Households | % Households |
| Dial-Up Internet | 0 | 0.0% |
| Broadband Home | 218 | 89.0% |
| Cellular Data Only | 27 | 11.0% |
| Satellite Internet | 19 | 7.8% |
| No Internet | 0 | 0.0% |
| Total | 245 | 100.0% |
Robin Glen Indiantown Summary
History
The area now known as Indian Town, Michigan was originally inhabited by the Potawatomi people. The Potawatomi were a part of the Algonquin language group and were known as the “Keepers of the Fire”. They were a peaceful people who lived in harmony with nature and respected the land. The Potawatomi were forced to leave their homeland in the early 1800s due to the Indian Removal Act of 1830. The Potawatomi were relocated to a reservation in Kansas.
The area was then settled by European immigrants in the mid-1800s. The first settlers were mostly of German and Dutch descent. The town was originally called “Glen” after the Glen family who were among the first settlers. The name was changed to “Indian Town” in 1876 to honor the Potawatomi people who had once lived there.
The town grew slowly but steadily over the years. In the early 1900s, the town was home to a variety of businesses including a general store, a blacksmith, a sawmill, and a grist mill. The town also had a post office, a school, and a church.
Geography
Indian Town is located in the southwestern corner of Michigan in Van Buren County. It is situated on the banks of the Paw Paw River, which flows through the town. The town is surrounded by rolling hills and farmland. The climate is humid continental with hot summers and cold winters.
The town covers an area of 1.2 square miles and has a population of approximately 1,000 people. The town is served by two major highways, US-12 and M-51. The nearest major city is Kalamazoo, which is about 25 miles away.
Economy
The economy of Indian Town is largely based on agriculture. The town is home to several farms that produce a variety of crops including corn, soybeans, wheat, and hay. The town also has a few small businesses including a gas station, a grocery store, and a hardware store.
The town is also home to a few manufacturing companies that produce a variety of products including furniture, automotive parts, and medical supplies. The town is also home to a few restaurants and bars.
Demographics
The population of Indian Town is approximately 1,000 people. The town is predominantly white with a small minority population. The median household income is $45,000 and the median home value is $125,000. The town has a low unemployment rate of 3.5%.
The town is served by the Van Buren County School District. The town has one elementary school, one middle school, and one high school. The town also has a public library and a few parks.
Conclusion
Indian Town, Michigan is a small town with a rich history and a strong agricultural economy. The town is home to a diverse population and is served by a variety of businesses and services. The town is a great place to live and work and is a great example of small-town America.
Common Questions
What is Per Capita Income in Robin Glen Indiantown?
Per Capita income in Robin Glen Indiantown is $34,211.
What is the Median Family Income in Robin Glen Indiantown?
Median Family Income in Robin Glen Indiantown is $66,458.
What is the Median Household income in Robin Glen Indiantown?
Median Household Income in Robin Glen Indiantown is $59,471.
What is Income or Wage Gap in Robin Glen Indiantown?
Income or Wage Gap in Robin Glen Indiantown is 4.0%.
Women in Robin Glen Indiantown earn 96.0 cents for every dollar earned by a man.
What is Inequality or Gini Index in Robin Glen Indiantown?
Inequality or Gini Index in Robin Glen Indiantown is 0.49.
What is the Total Population of Robin Glen Indiantown?
Total Population of Robin Glen Indiantown is 634.
What is the Total Male Population of Robin Glen Indiantown?
Total Male Population of Robin Glen Indiantown is 308.
What is the Total Female Population of Robin Glen Indiantown?
Total Female Population of Robin Glen Indiantown is 326.
What is the Ratio of Males per 100 Females in Robin Glen Indiantown?
There are 94.48 Males per 100 Females in Robin Glen Indiantown.
What is the Ratio of Females per 100 Males in Robin Glen Indiantown?
There are 105.84 Females per 100 Males in Robin Glen Indiantown.
What is the Median Population Age in Robin Glen Indiantown?
Median Population Age in Robin Glen Indiantown is 35.0 Years.
What is the Average Family Size in Robin Glen Indiantown
Average Family Size in Robin Glen Indiantown is 2.8 People.
What is the Average Household Size in Robin Glen Indiantown
Average Household Size in Robin Glen Indiantown is 2.6 People.
How Large is the Labor Force in Robin Glen Indiantown?
There are 282 People in the Labor Forcein in Robin Glen Indiantown.
What is the Percentage of People in the Labor Force in Robin Glen Indiantown?
60.5% of People are in the Labor Force in Robin Glen Indiantown.
What is the Unemployment Rate in Robin Glen Indiantown?
Unemployment Rate in Robin Glen Indiantown is 6.0%.