Zeba, MI Map & Demographics
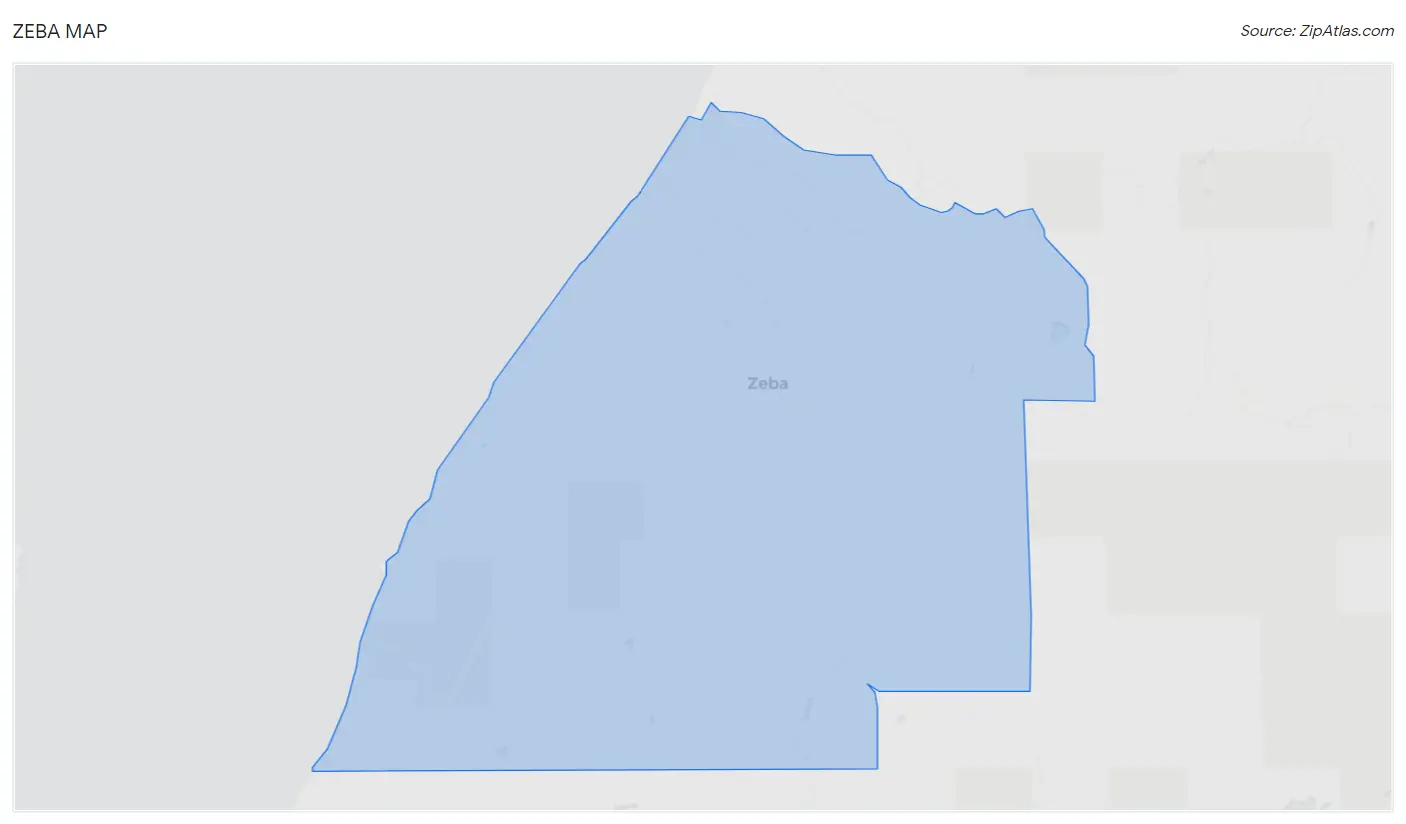
Zeba Map
Zeba Overview
$21,510
PER CAPITA INCOME
$50,417
AVG FAMILY INCOME
$36,250
AVG HOUSEHOLD INCOME
41.6%
WAGE / INCOME GAP [ % ]
58.4¢/ $1
WAGE / INCOME GAP [ $ ]
0.47
INEQUALITY / GINI INDEX
382
TOTAL POPULATION
165
MALE POPULATION
217
FEMALE POPULATION
76.04
MALES / 100 FEMALES
131.52
FEMALES / 100 MALES
44.2
MEDIAN AGE
3.3
AVG FAMILY SIZE
2.6
AVG HOUSEHOLD SIZE
112
LABOR FORCE [ PEOPLE ]
35.7%
PERCENT IN LABOR FORCE
Income in Zeba
Income Overview in Zeba
Per Capita Income in Zeba is $21,510, while median incomes of families and households are $50,417 and $36,250 respectively.
| Characteristic | Number | Measure |
| Per Capita Income | 382 | $21,510 |
| Median Family Income | 89 | $50,417 |
| Mean Family Income | 89 | $61,839 |
| Median Household Income | 148 | $36,250 |
| Mean Household Income | 148 | $55,089 |
| Income Deficit | 89 | $0 |
| Wage / Income Gap (%) | 382 | 41.62% |
| Wage / Income Gap ($) | 382 | 58.38¢ per $1 |
| Gini / Inequality Index | 382 | 0.47 |
Earnings by Sex in Zeba
Average Earnings in Zeba are $24,531, $38,542 for men and $22,500 for women, a difference of 41.6%.

| Sex | Number | Average Earnings |
| Male | 65 (44.2%) | $38,542 |
| Female | 82 (55.8%) | $22,500 |
| Total | 147 (100.0%) | $24,531 |
Earnings by Sex by Income Bracket in Zeba
The most common earnings brackets in Zeba are $75,000 to $99,999 for men (11 | 16.9%) and $2,499 or less for women (19 | 23.2%).
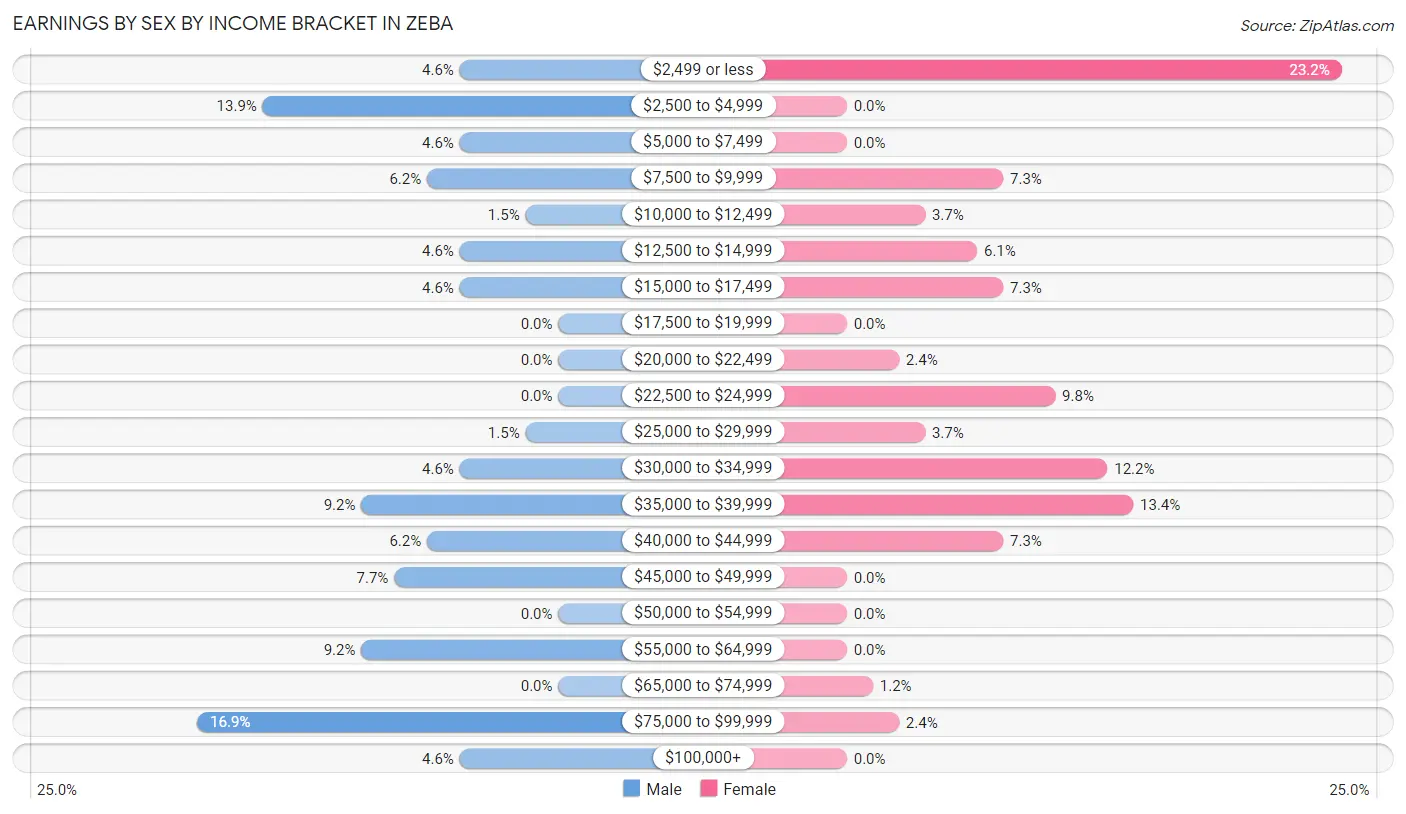
| Income | Male | Female |
| $2,499 or less | 3 (4.6%) | 19 (23.2%) |
| $2,500 to $4,999 | 9 (13.9%) | 0 (0.0%) |
| $5,000 to $7,499 | 3 (4.6%) | 0 (0.0%) |
| $7,500 to $9,999 | 4 (6.1%) | 6 (7.3%) |
| $10,000 to $12,499 | 1 (1.5%) | 3 (3.7%) |
| $12,500 to $14,999 | 3 (4.6%) | 5 (6.1%) |
| $15,000 to $17,499 | 3 (4.6%) | 6 (7.3%) |
| $17,500 to $19,999 | 0 (0.0%) | 0 (0.0%) |
| $20,000 to $22,499 | 0 (0.0%) | 2 (2.4%) |
| $22,500 to $24,999 | 0 (0.0%) | 8 (9.8%) |
| $25,000 to $29,999 | 1 (1.5%) | 3 (3.7%) |
| $30,000 to $34,999 | 3 (4.6%) | 10 (12.2%) |
| $35,000 to $39,999 | 6 (9.2%) | 11 (13.4%) |
| $40,000 to $44,999 | 4 (6.1%) | 6 (7.3%) |
| $45,000 to $49,999 | 5 (7.7%) | 0 (0.0%) |
| $50,000 to $54,999 | 0 (0.0%) | 0 (0.0%) |
| $55,000 to $64,999 | 6 (9.2%) | 0 (0.0%) |
| $65,000 to $74,999 | 0 (0.0%) | 1 (1.2%) |
| $75,000 to $99,999 | 11 (16.9%) | 2 (2.4%) |
| $100,000+ | 3 (4.6%) | 0 (0.0%) |
| Total | 65 (100.0%) | 82 (100.0%) |
Earnings by Sex by Educational Attainment in Zeba
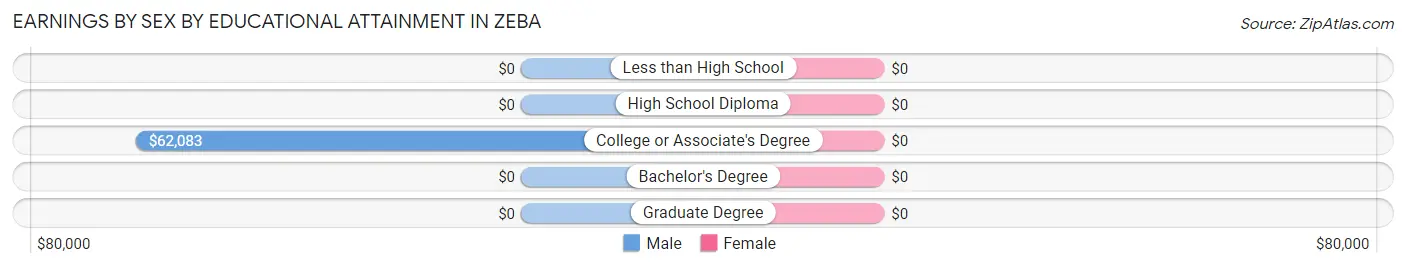
| Educational Attainment | Male Income | Female Income |
| Less than High School | - | - |
| High School Diploma | - | - |
| College or Associate's Degree | $62,083 | $0 |
| Bachelor's Degree | - | - |
| Graduate Degree | - | - |
| Total | $48,333 | $27,917 |
Family Income in Zeba
Family Income Brackets in Zeba
According to the Zeba family income data, there are 20 families falling into the less than $10,000 income range, which is the most common income bracket and makes up 22.5% of all families.
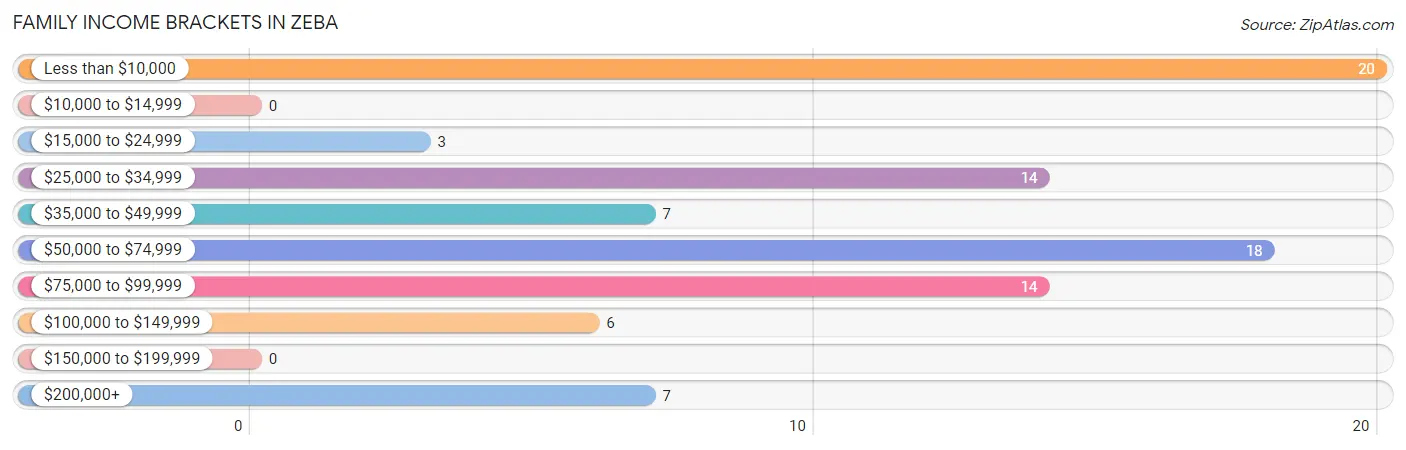
| Income Bracket | # Families | % Families |
| Less than $10,000 | 20 | 22.5% |
| $10,000 to $14,999 | 0 | 0.0% |
| $15,000 to $24,999 | 3 | 3.4% |
| $25,000 to $34,999 | 14 | 15.7% |
| $35,000 to $49,999 | 7 | 7.9% |
| $50,000 to $74,999 | 18 | 20.2% |
| $75,000 to $99,999 | 14 | 15.7% |
| $100,000 to $149,999 | 6 | 6.7% |
| $150,000 to $199,999 | 0 | 0.0% |
| $200,000+ | 7 | 7.9% |
Family Income by Famaliy Size in Zeba
2-person families (40 | 44.9%) account for the highest median family income in Zeba with $45,625 per family, while 2-person families (40 | 44.9%) have the highest median income of $22,812 per family member.

| Income Bracket | # Families | Median Income |
| 2-Person Families | 40 (44.9%) | $45,625 |
| 3-Person Families | 25 (28.1%) | $0 |
| 4-Person Families | 13 (14.6%) | $0 |
| 5-Person Families | 5 (5.6%) | $0 |
| 6-Person Families | 3 (3.4%) | $0 |
| 7+ Person Families | 3 (3.4%) | $0 |
| Total | 89 (100.0%) | $50,417 |
Family Income by Number of Earners in Zeba
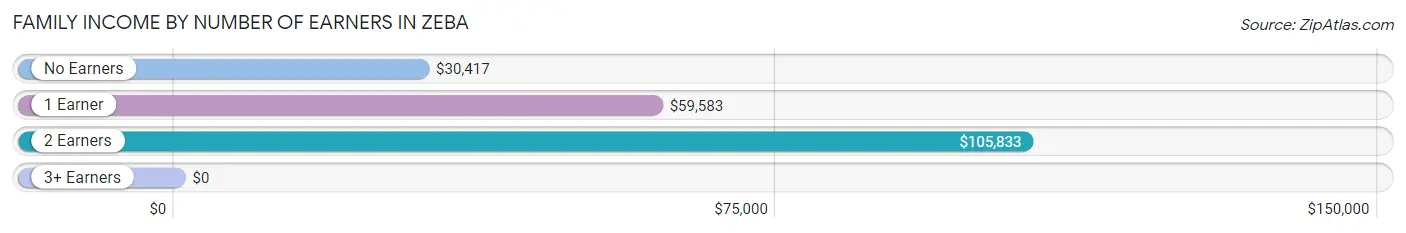
| Number of Earners | # Families | Median Income |
| No Earners | 29 (32.6%) | $30,417 |
| 1 Earner | 31 (34.8%) | $59,583 |
| 2 Earners | 18 (20.2%) | $105,833 |
| 3+ Earners | 11 (12.4%) | $0 |
| Total | 89 (100.0%) | $50,417 |
Household Income in Zeba
Household Income Brackets in Zeba
With 32 households falling in the category, the $25,000 to $34,999 income range is the most frequent in Zeba, accounting for 21.6% of all households.
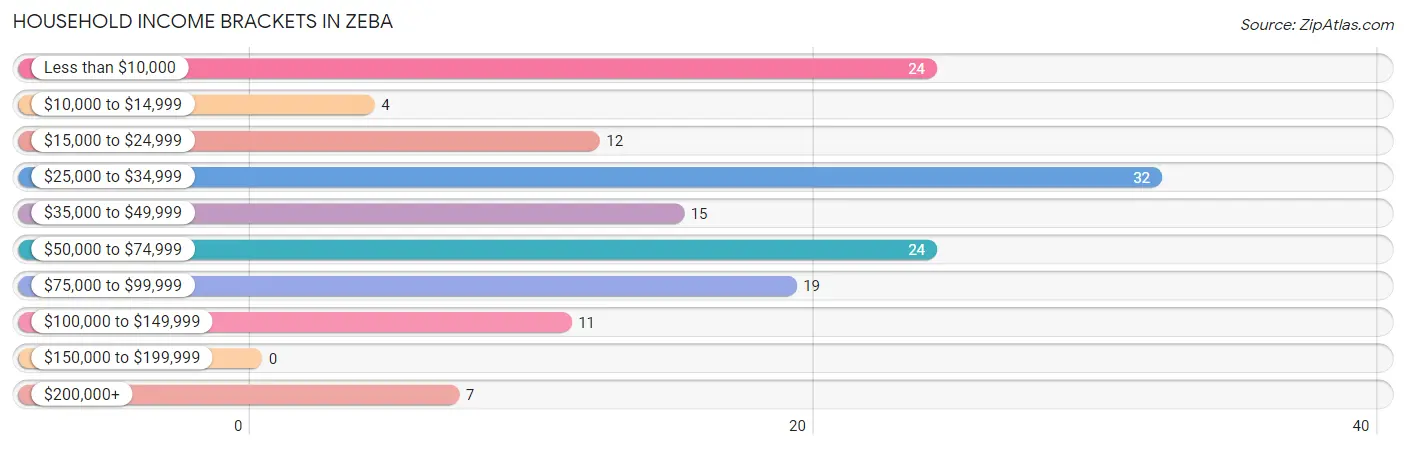
| Income Bracket | # Households | % Households |
| Less than $10,000 | 24 | 16.2% |
| $10,000 to $14,999 | 4 | 2.7% |
| $15,000 to $24,999 | 12 | 8.1% |
| $25,000 to $34,999 | 32 | 21.6% |
| $35,000 to $49,999 | 15 | 10.1% |
| $50,000 to $74,999 | 24 | 16.2% |
| $75,000 to $99,999 | 19 | 12.8% |
| $100,000 to $149,999 | 11 | 7.4% |
| $150,000 to $199,999 | 0 | 0.0% |
| $200,000+ | 7 | 4.7% |
Household Income by Householder Age in Zeba
The median household income in Zeba is $36,250, with the highest median household income of $92,083 found in the 25 to 44 years age bracket for the primary householder. A total of 21 households (14.2%) fall into this category.
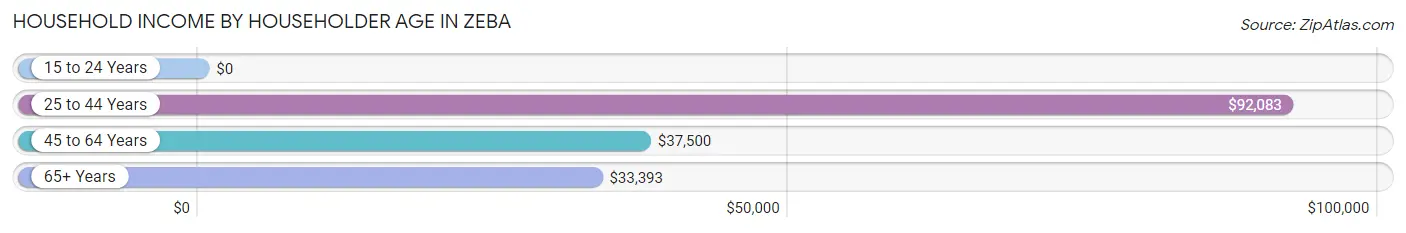
| Income Bracket | # Households | Median Income |
| 15 to 24 Years | 0 (0.0%) | $0 |
| 25 to 44 Years | 21 (14.2%) | $92,083 |
| 45 to 64 Years | 82 (55.4%) | $37,500 |
| 65+ Years | 45 (30.4%) | $33,393 |
| Total | 148 (100.0%) | $36,250 |
Poverty in Zeba
Income Below Poverty by Sex and Age in Zeba
With 21.8% poverty level for males and 26.3% for females among the residents of Zeba, 18 to 24 year old males and 15 year old females are the most vulnerable to poverty, with 6 males (40.0%) and 4 females (100.0%) in their respective age groups living below the poverty level.
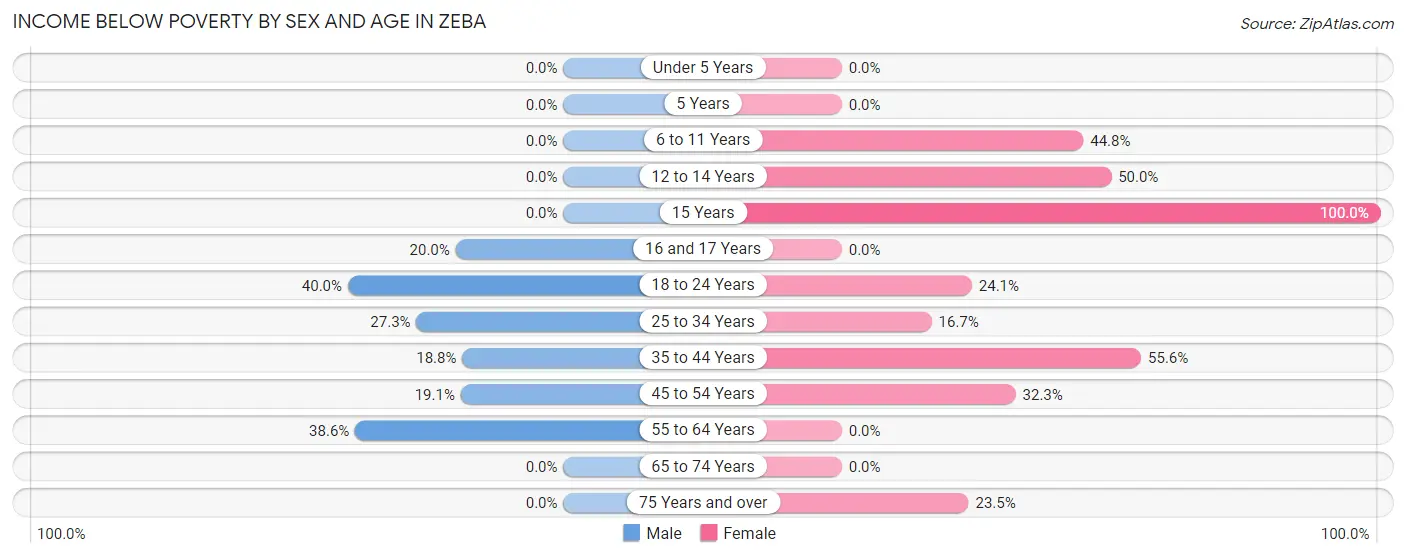
| Age Bracket | Male | Female |
| Under 5 Years | 0 (0.0%) | 0 (0.0%) |
| 5 Years | 0 (0.0%) | 0 (0.0%) |
| 6 to 11 Years | 0 (0.0%) | 13 (44.8%) |
| 12 to 14 Years | 0 (0.0%) | 6 (50.0%) |
| 15 Years | 0 (0.0%) | 4 (100.0%) |
| 16 and 17 Years | 3 (20.0%) | 0 (0.0%) |
| 18 to 24 Years | 6 (40.0%) | 7 (24.1%) |
| 25 to 34 Years | 3 (27.3%) | 3 (16.7%) |
| 35 to 44 Years | 3 (18.8%) | 10 (55.6%) |
| 45 to 54 Years | 4 (19.1%) | 10 (32.3%) |
| 55 to 64 Years | 17 (38.6%) | 0 (0.0%) |
| 65 to 74 Years | 0 (0.0%) | 0 (0.0%) |
| 75 Years and over | 0 (0.0%) | 4 (23.5%) |
| Total | 36 (21.8%) | 57 (26.3%) |
Income Above Poverty by Sex and Age in Zeba
According to the poverty statistics in Zeba, males aged 6 to 11 years and females aged under 5 years are the age groups that are most secure financially, with 100.0% of males and 100.0% of females in these age groups living above the poverty line.
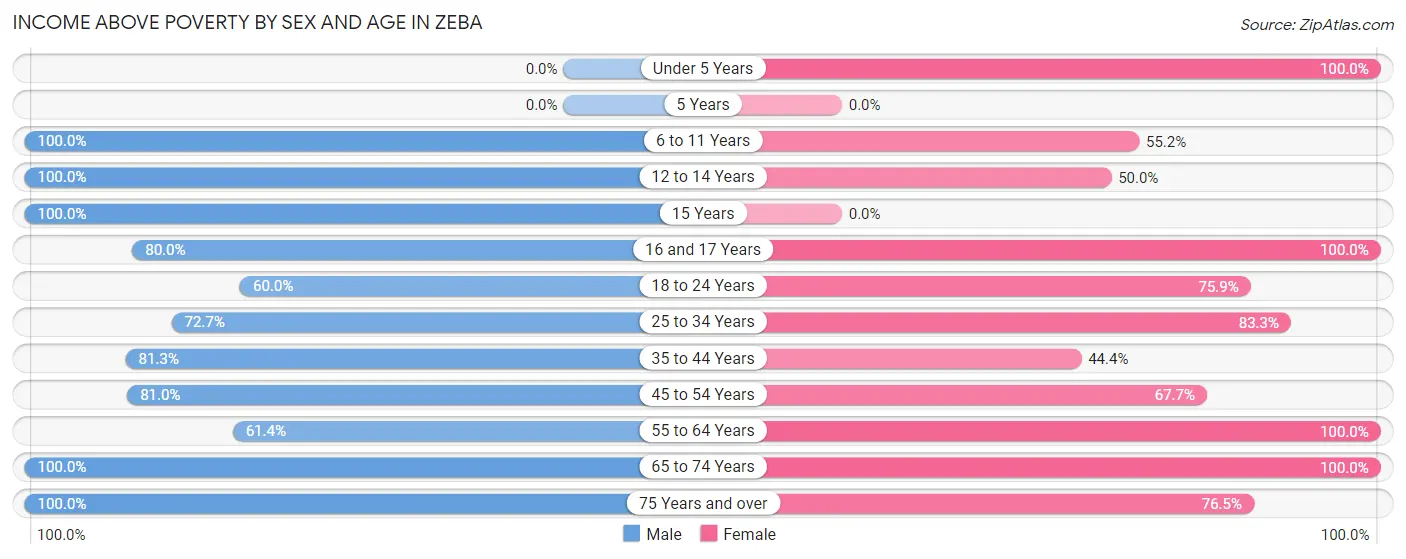
| Age Bracket | Male | Female |
| Under 5 Years | 0 (0.0%) | 4 (100.0%) |
| 5 Years | 0 (0.0%) | 0 (0.0%) |
| 6 to 11 Years | 6 (100.0%) | 16 (55.2%) |
| 12 to 14 Years | 10 (100.0%) | 6 (50.0%) |
| 15 Years | 3 (100.0%) | 0 (0.0%) |
| 16 and 17 Years | 12 (80.0%) | 6 (100.0%) |
| 18 to 24 Years | 9 (60.0%) | 22 (75.9%) |
| 25 to 34 Years | 8 (72.7%) | 15 (83.3%) |
| 35 to 44 Years | 13 (81.2%) | 8 (44.4%) |
| 45 to 54 Years | 17 (80.9%) | 21 (67.7%) |
| 55 to 64 Years | 27 (61.4%) | 31 (100.0%) |
| 65 to 74 Years | 14 (100.0%) | 18 (100.0%) |
| 75 Years and over | 10 (100.0%) | 13 (76.5%) |
| Total | 129 (78.2%) | 160 (73.7%) |
Income Below Poverty Among Married-Couple Families in Zeba
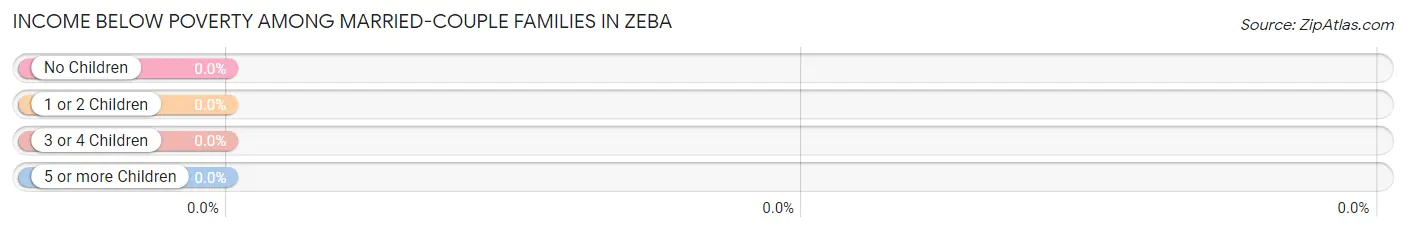
| Children | Above Poverty | Below Poverty |
| No Children | 31 (100.0%) | 0 (0.0%) |
| 1 or 2 Children | 10 (100.0%) | 0 (0.0%) |
| 3 or 4 Children | 5 (100.0%) | 0 (0.0%) |
| 5 or more Children | 3 (100.0%) | 0 (0.0%) |
| Total | 49 (100.0%) | 0 (0.0%) |
Income Below Poverty Among Single-Parent Households in Zeba
According to the poverty data in Zeba, 18.2% or 2 single-father households and 62.1% or 18 single-mother households are living below the poverty line. Among single-father households, those with 1 or 2 children have the highest poverty rate, with 2 households (100.0%) experiencing poverty. Likewise, among single-mother households, those with 1 or 2 children have the highest poverty rate, with 10 households (100.0%) falling below the poverty line.
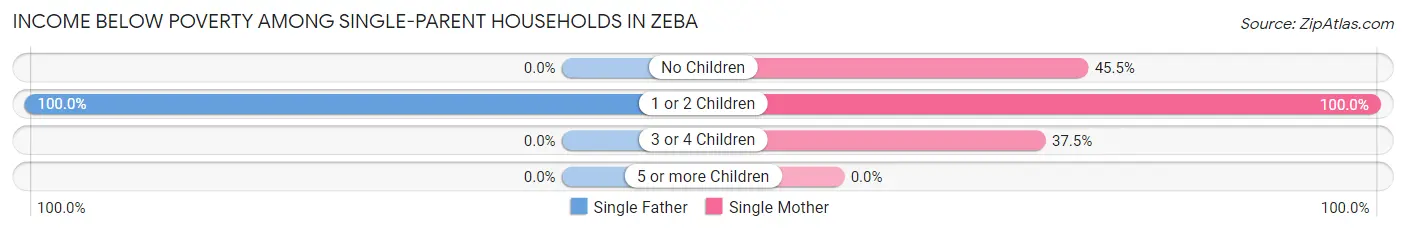
| Children | Single Father | Single Mother |
| No Children | 0 (0.0%) | 5 (45.5%) |
| 1 or 2 Children | 2 (100.0%) | 10 (100.0%) |
| 3 or 4 Children | 0 (0.0%) | 3 (37.5%) |
| 5 or more Children | 0 (0.0%) | 0 (0.0%) |
| Total | 2 (18.2%) | 18 (62.1%) |
Income Below Poverty Among Married-Couple vs Single-Parent Households in Zeba
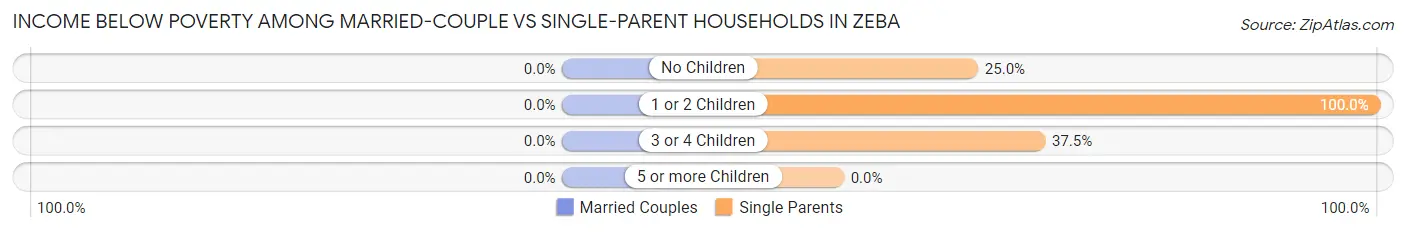
| Children | Married-Couple Families | Single-Parent Households |
| No Children | 0 (0.0%) | 5 (25.0%) |
| 1 or 2 Children | 0 (0.0%) | 12 (100.0%) |
| 3 or 4 Children | 0 (0.0%) | 3 (37.5%) |
| 5 or more Children | 0 (0.0%) | 0 (0.0%) |
| Total | 0 (0.0%) | 20 (50.0%) |
Race in Zeba
The most populous races in Zeba are Native / Alaskan (192 | 50.3%), White / Caucasian (151 | 39.5%), and Two or more Races (29 | 7.6%).
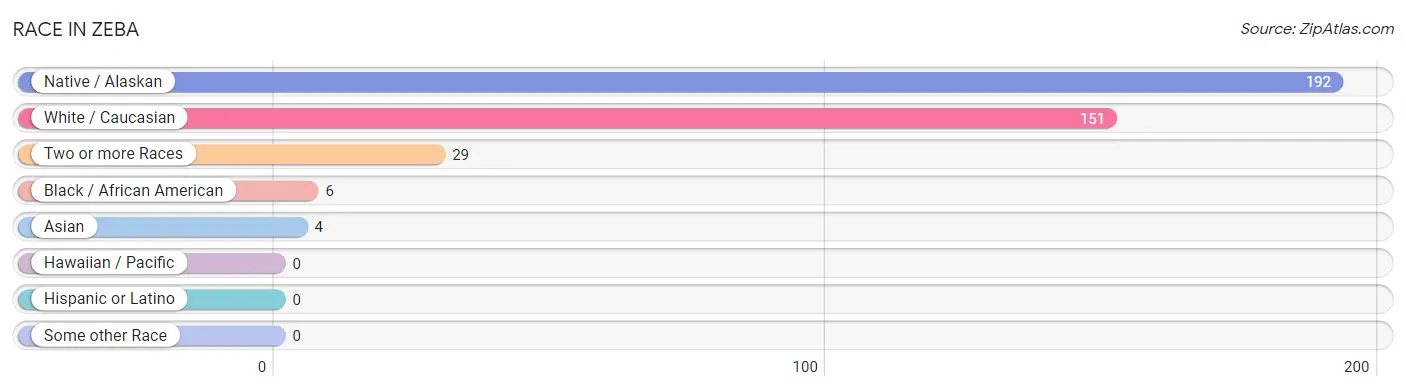
| Race | # Population | % Population |
| Asian | 4 | 1.1% |
| Black / African American | 6 | 1.6% |
| Hawaiian / Pacific | 0 | 0.0% |
| Hispanic or Latino | 0 | 0.0% |
| Native / Alaskan | 192 | 50.3% |
| White / Caucasian | 151 | 39.5% |
| Two or more Races | 29 | 7.6% |
| Some other Race | 0 | 0.0% |
| Total | 382 | 100.0% |
Ancestry in Zeba
The most populous ancestries reported in Zeba are Chippewa (172 | 45.0%), Finnish (46 | 12.0%), German (39 | 10.2%), Irish (37 | 9.7%), and English (25 | 6.5%), together accounting for 83.5% of all Zeba residents.
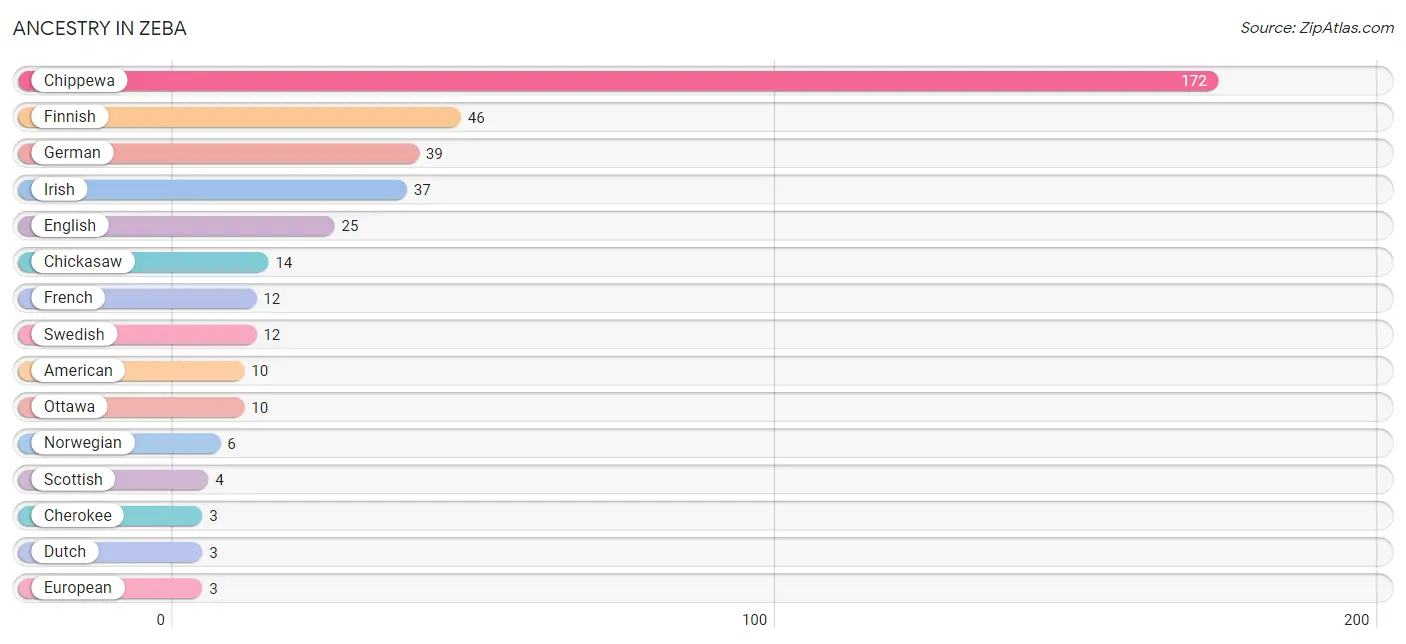
| Ancestry | # Population | % Population |
| American | 10 | 2.6% |
| Cherokee | 3 | 0.8% |
| Chickasaw | 14 | 3.7% |
| Chippewa | 172 | 45.0% |
| Danish | 2 | 0.5% |
| Dutch | 3 | 0.8% |
| English | 25 | 6.5% |
| European | 3 | 0.8% |
| Finnish | 46 | 12.0% |
| French | 12 | 3.1% |
| French Canadian | 2 | 0.5% |
| German | 39 | 10.2% |
| Iranian | 2 | 0.5% |
| Irish | 37 | 9.7% |
| Iroquois | 2 | 0.5% |
| Norwegian | 6 | 1.6% |
| Ottawa | 10 | 2.6% |
| Scotch-Irish | 3 | 0.8% |
| Scottish | 4 | 1.1% |
| Swedish | 12 | 3.1% | View All 20 Rows |
Immigrants in Zeba
The most numerous immigrant groups reported in Zeba came from Asia (4 | 1.1%), South Eastern Asia (4 | 1.1%), and Thailand (4 | 1.1%), together accounting for 3.2% of all Zeba residents.
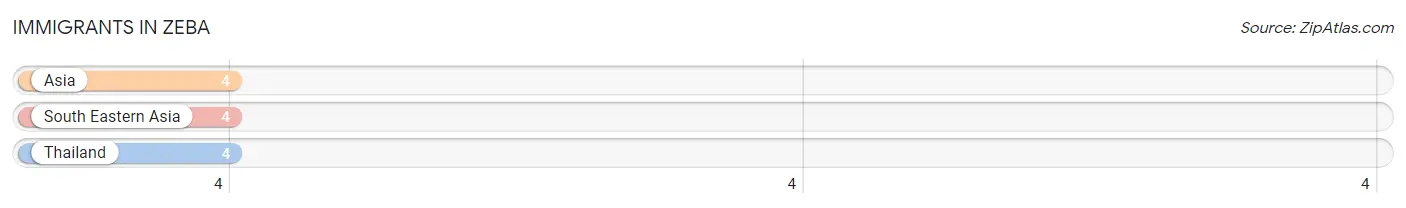
| Immigration Origin | # Population | % Population |
| Asia | 4 | 1.1% |
| South Eastern Asia | 4 | 1.1% |
| Thailand | 4 | 1.1% | View All 3 Rows |
Sex and Age in Zeba
Sex and Age in Zeba
The most populous age groups in Zeba are 60 to 64 Years (29 | 17.6%) for men and 10 to 14 Years (25 | 11.5%) for women.
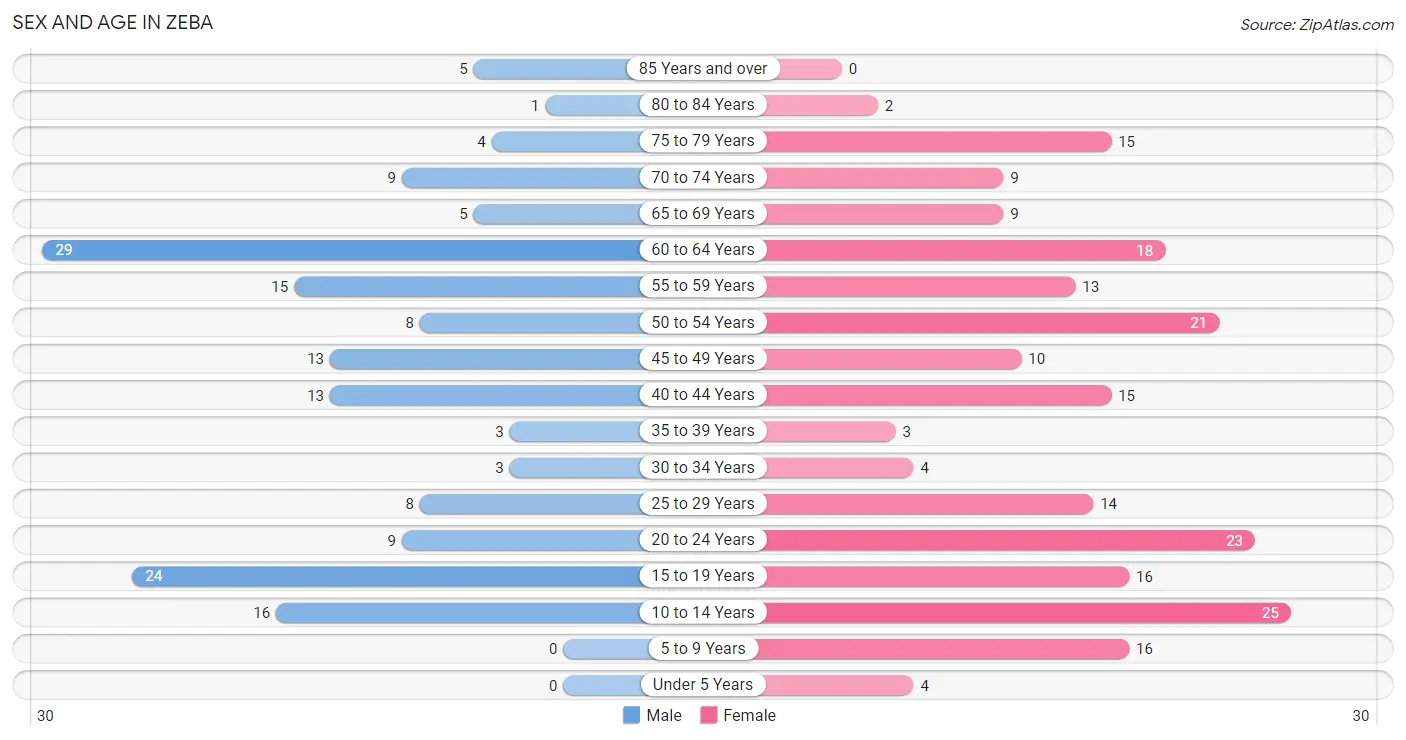
| Age Bracket | Male | Female |
| Under 5 Years | 0 (0.0%) | 4 (1.8%) |
| 5 to 9 Years | 0 (0.0%) | 16 (7.4%) |
| 10 to 14 Years | 16 (9.7%) | 25 (11.5%) |
| 15 to 19 Years | 24 (14.5%) | 16 (7.4%) |
| 20 to 24 Years | 9 (5.4%) | 23 (10.6%) |
| 25 to 29 Years | 8 (4.9%) | 14 (6.5%) |
| 30 to 34 Years | 3 (1.8%) | 4 (1.8%) |
| 35 to 39 Years | 3 (1.8%) | 3 (1.4%) |
| 40 to 44 Years | 13 (7.9%) | 15 (6.9%) |
| 45 to 49 Years | 13 (7.9%) | 10 (4.6%) |
| 50 to 54 Years | 8 (4.9%) | 21 (9.7%) |
| 55 to 59 Years | 15 (9.1%) | 13 (6.0%) |
| 60 to 64 Years | 29 (17.6%) | 18 (8.3%) |
| 65 to 69 Years | 5 (3.0%) | 9 (4.2%) |
| 70 to 74 Years | 9 (5.4%) | 9 (4.2%) |
| 75 to 79 Years | 4 (2.4%) | 15 (6.9%) |
| 80 to 84 Years | 1 (0.6%) | 2 (0.9%) |
| 85 Years and over | 5 (3.0%) | 0 (0.0%) |
| Total | 165 (100.0%) | 217 (100.0%) |
Families and Households in Zeba
Median Family Size in Zeba
The median family size in Zeba is 3.31 persons per family, with married-couple families (49 | 55.1%) accounting for the largest median family size of 3.78 persons per family. On the other hand, single female/mother families (29 | 32.6%) represent the smallest median family size with 2.62 persons per family.
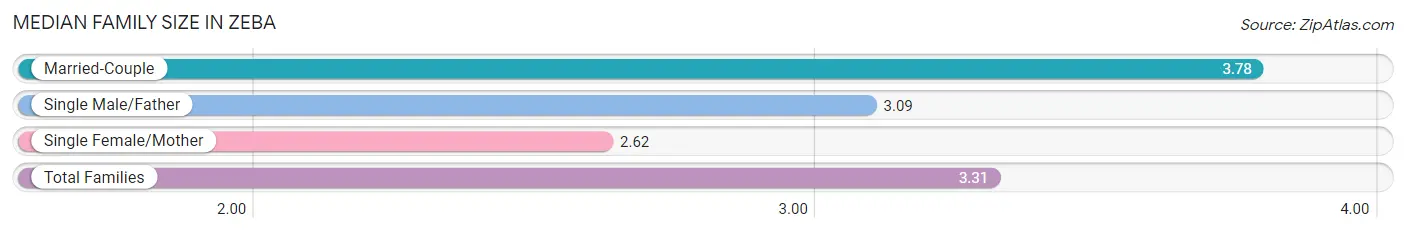
| Family Type | # Families | Family Size |
| Married-Couple | 49 (55.1%) | 3.78 |
| Single Male/Father | 11 (12.4%) | 3.09 |
| Single Female/Mother | 29 (32.6%) | 2.62 |
| Total Families | 89 (100.0%) | 3.31 |
Median Household Size in Zeba
The median household size in Zeba is 2.58 persons per household, with married-couple households (49 | 33.1%) accounting for the largest median household size of 3.78 persons per household. non-family households (59 | 39.9%) represent the smallest median household size with 1.27 persons per household.
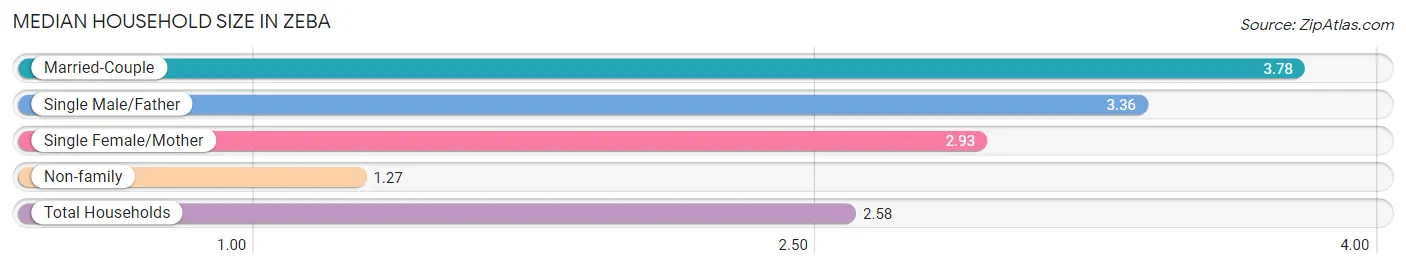
| Household Type | # Households | Household Size |
| Married-Couple | 49 (33.1%) | 3.78 |
| Single Male/Father | 11 (7.4%) | 3.36 |
| Single Female/Mother | 29 (19.6%) | 2.93 |
| Non-family | 59 (39.9%) | 1.27 |
| Total Households | 148 (100.0%) | 2.58 |
Household Size by Marriage Status in Zeba
Out of a total of 148 households in Zeba, 89 (60.1%) are family households, while 59 (39.9%) are nonfamily households. The most numerous type of family households are 2-person households, comprising 32, and the most common type of nonfamily households are 1-person households, comprising 43.
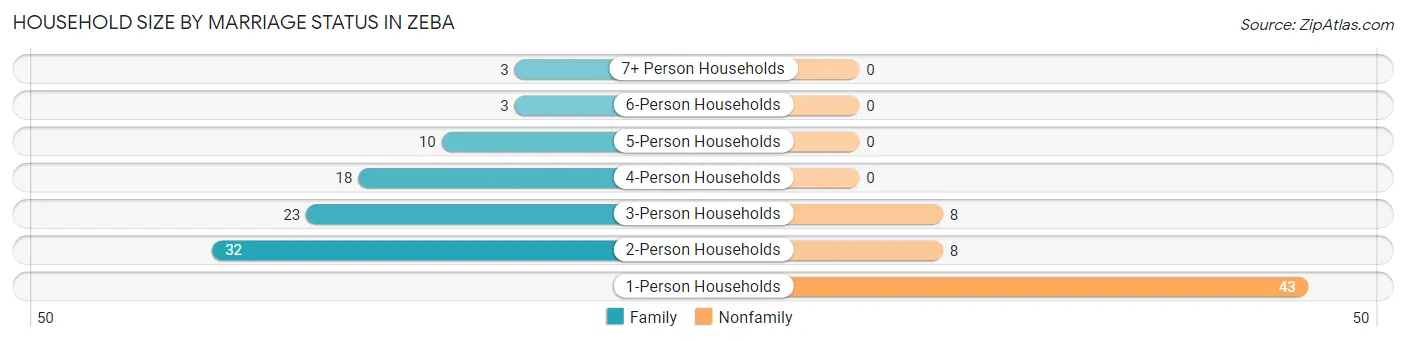
| Household Size | Family Households | Nonfamily Households |
| 1-Person Households | - | 43 (29.0%) |
| 2-Person Households | 32 (21.6%) | 8 (5.4%) |
| 3-Person Households | 23 (15.5%) | 8 (5.4%) |
| 4-Person Households | 18 (12.2%) | 0 (0.0%) |
| 5-Person Households | 10 (6.8%) | 0 (0.0%) |
| 6-Person Households | 3 (2.0%) | 0 (0.0%) |
| 7+ Person Households | 3 (2.0%) | 0 (0.0%) |
| Total | 89 (60.1%) | 59 (39.9%) |
Female Fertility in Zeba
Fertility by Age in Zeba
| Age Bracket | Women with Births | Births / 1,000 Women |
| 15 to 19 years | 0 (0.0%) | 0.0 |
| 20 to 34 years | 0 (0.0%) | 0.0 |
| 35 to 50 years | 0 (0.0%) | 0.0 |
| Total | 0 (0.0%) | 0.0 |
Fertility by Age by Marriage Status in Zeba
| Age Bracket | Married | Unmarried |
| 15 to 19 years | 0 (0.0%) | 0 (0.0%) |
| 20 to 34 years | 0 (0.0%) | 0 (0.0%) |
| 35 to 50 years | 0 (0.0%) | 0 (0.0%) |
| Total | 0 (0.0%) | 0 (0.0%) |
Fertility by Education in Zeba
| Educational Attainment | Women with Births | Births / 1,000 Women |
| Less than High School | 0 (0.0%) | 0.0 |
| High School Diploma | 0 (0.0%) | 0.0 |
| College or Associate's Degree | 0 (0.0%) | 0.0 |
| Bachelor's Degree | 0 (0.0%) | 0.0 |
| Graduate Degree | 0 (0.0%) | 0.0 |
| Total | 0 (0.0%) | 0.0 |
Fertility by Education by Marriage Status in Zeba
| Educational Attainment | Married | Unmarried |
| Less than High School | 0 (0.0%) | 0 (0.0%) |
| High School Diploma | 0 (0.0%) | 0 (0.0%) |
| College or Associate's Degree | 0 (0.0%) | 0 (0.0%) |
| Bachelor's Degree | 0 (0.0%) | 0 (0.0%) |
| Graduate Degree | 0 (0.0%) | 0 (0.0%) |
| Total | 0 (0.0%) | 0 (0.0%) |
Employment Characteristics in Zeba
Employment by Class of Employer in Zeba
Among the 104 employed individuals in Zeba, private company employees (62 | 59.6%), state government employees (14 | 13.5%), and not-for-profit organizations (12 | 11.5%) make up the most common classes of employment.
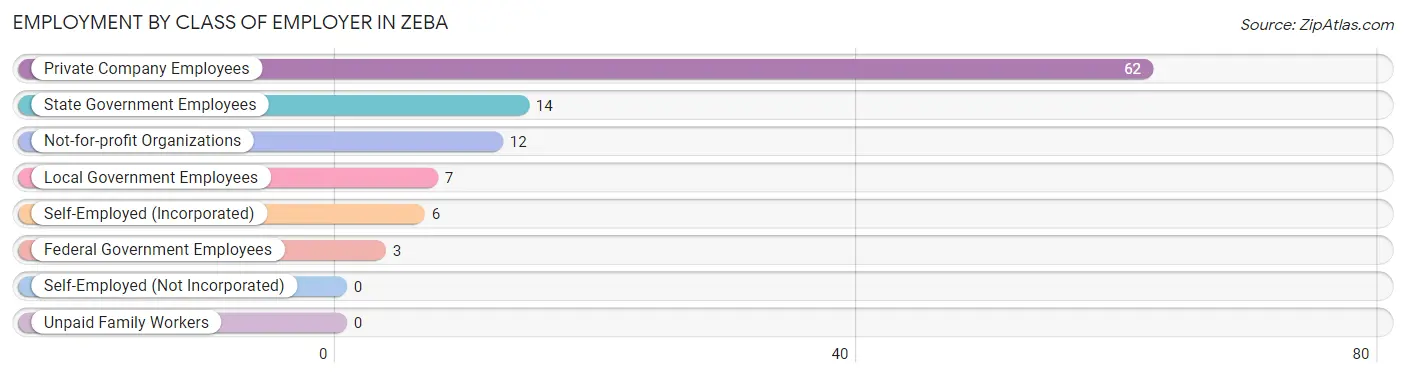
| Employer Class | # Employees | % Employees |
| Private Company Employees | 62 | 59.6% |
| Self-Employed (Incorporated) | 6 | 5.8% |
| Self-Employed (Not Incorporated) | 0 | 0.0% |
| Not-for-profit Organizations | 12 | 11.5% |
| Local Government Employees | 7 | 6.7% |
| State Government Employees | 14 | 13.5% |
| Federal Government Employees | 3 | 2.9% |
| Unpaid Family Workers | 0 | 0.0% |
| Total | 104 | 100.0% |
Employment Status by Age in Zeba
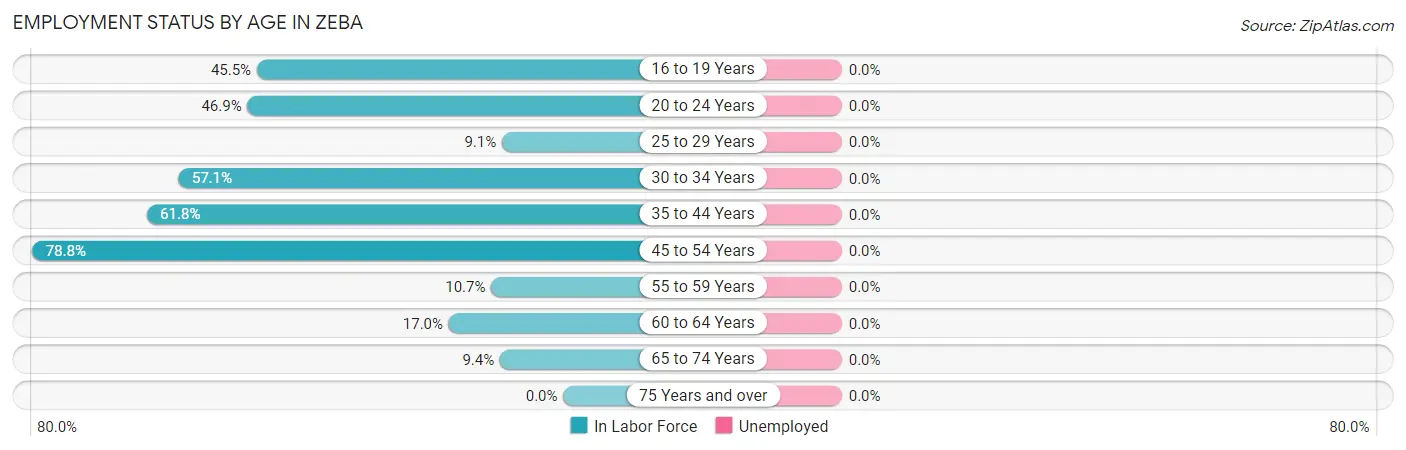
| Age Bracket | In Labor Force | Unemployed |
| 16 to 19 Years | 15 (45.5%) | 0 (0.0%) |
| 20 to 24 Years | 15 (46.9%) | 0 (0.0%) |
| 25 to 29 Years | 2 (9.1%) | 0 (0.0%) |
| 30 to 34 Years | 4 (57.1%) | 0 (0.0%) |
| 35 to 44 Years | 21 (61.8%) | 0 (0.0%) |
| 45 to 54 Years | 41 (78.8%) | 0 (0.0%) |
| 55 to 59 Years | 3 (10.7%) | 0 (0.0%) |
| 60 to 64 Years | 8 (17.0%) | 0 (0.0%) |
| 65 to 74 Years | 3 (9.4%) | 0 (0.0%) |
| 75 Years and over | 0 (0.0%) | 0 (0.0%) |
| Total | 112 (35.7%) | 0 (0.0%) |
Employment Status by Educational Attainment in Zeba
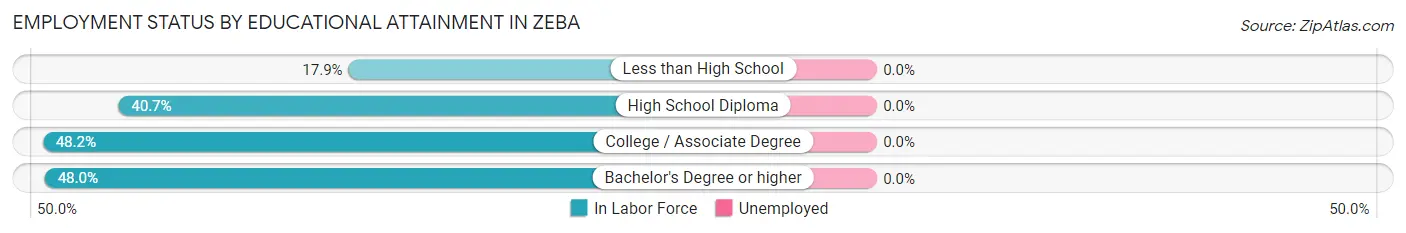
| Educational Attainment | In Labor Force | Unemployed |
| Less than High School | 5 (17.9%) | 0 (0.0%) |
| High School Diploma | 22 (40.7%) | 0 (0.0%) |
| College / Associate Degree | 40 (48.2%) | 0 (0.0%) |
| Bachelor's Degree or higher | 12 (48.0%) | 0 (0.0%) |
| Total | 79 (41.6%) | 0 (0.0%) |
Employment Occupations by Sex in Zeba
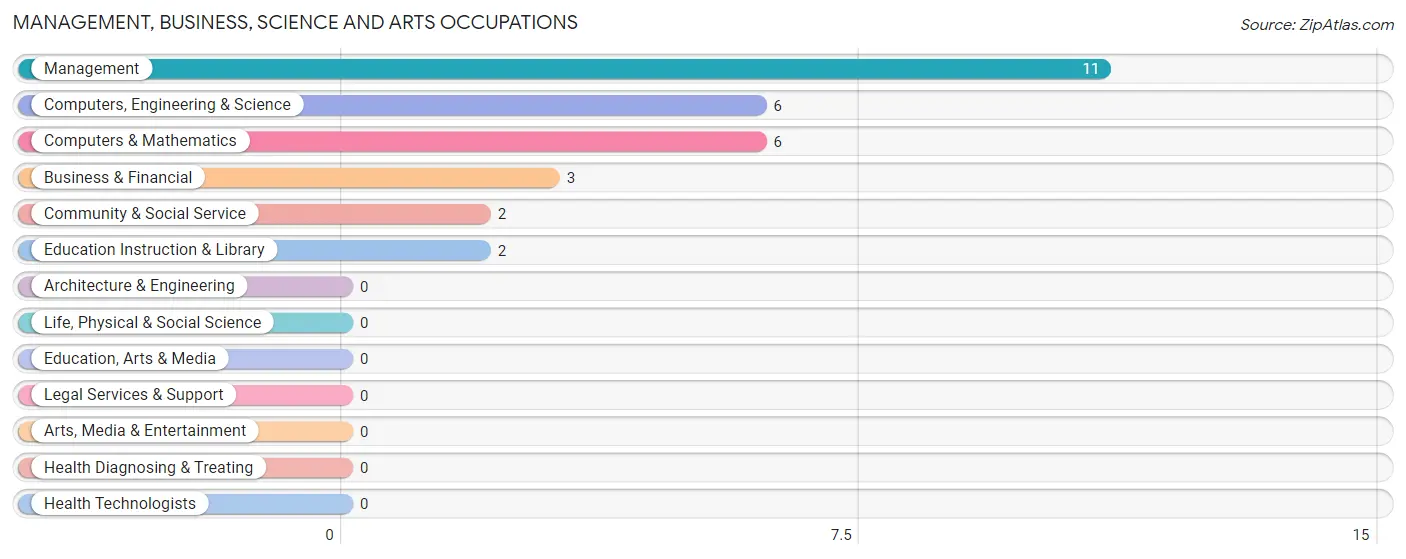
Management, Business, Science and Arts Occupations
The most common Management, Business, Science and Arts occupations in Zeba are Management (11 | 9.8%), Computers, Engineering & Science (6 | 5.4%), Computers & Mathematics (6 | 5.4%), Business & Financial (3 | 2.7%), and Community & Social Service (2 | 1.8%).
Management, Business, Science and Arts Occupations by Sex
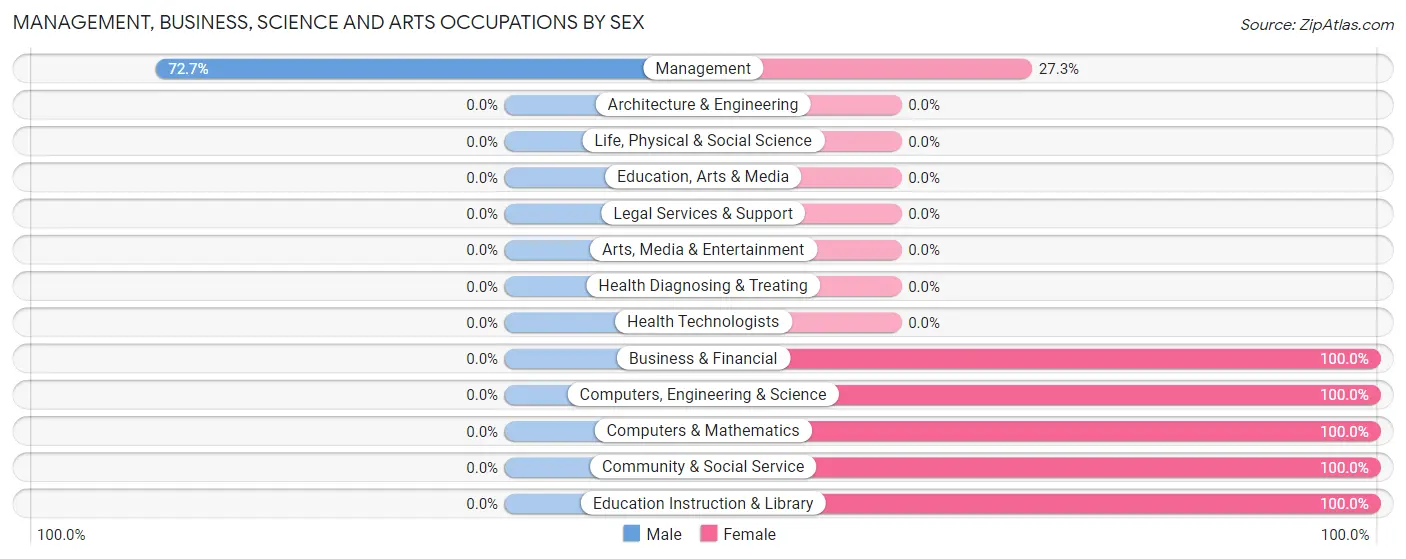
| Occupation | Male | Female |
| Management | 8 (72.7%) | 3 (27.3%) |
| Business & Financial | 0 (0.0%) | 3 (100.0%) |
| Computers, Engineering & Science | 0 (0.0%) | 6 (100.0%) |
| Computers & Mathematics | 0 (0.0%) | 6 (100.0%) |
| Architecture & Engineering | 0 (0.0%) | 0 (0.0%) |
| Life, Physical & Social Science | 0 (0.0%) | 0 (0.0%) |
| Community & Social Service | 0 (0.0%) | 2 (100.0%) |
| Education, Arts & Media | 0 (0.0%) | 0 (0.0%) |
| Legal Services & Support | 0 (0.0%) | 0 (0.0%) |
| Education Instruction & Library | 0 (0.0%) | 2 (100.0%) |
| Arts, Media & Entertainment | 0 (0.0%) | 0 (0.0%) |
| Health Diagnosing & Treating | 0 (0.0%) | 0 (0.0%) |
| Health Technologists | 0 (0.0%) | 0 (0.0%) |
| Total (Category) | 8 (36.4%) | 14 (63.6%) |
| Total (Overall) | 61 (54.5%) | 51 (45.5%) |
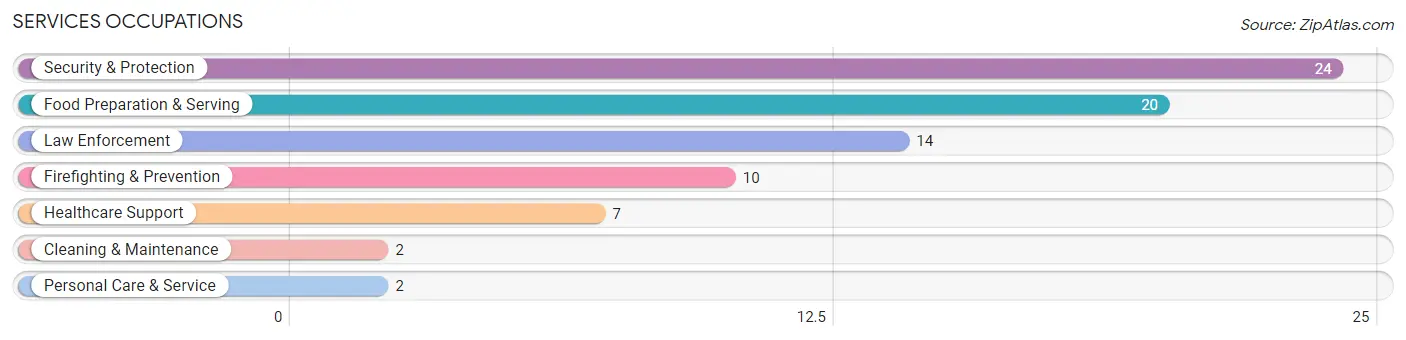
Services Occupations
The most common Services occupations in Zeba are Security & Protection (24 | 21.4%), Food Preparation & Serving (20 | 17.9%), Law Enforcement (14 | 12.5%), Firefighting & Prevention (10 | 8.9%), and Healthcare Support (7 | 6.2%).
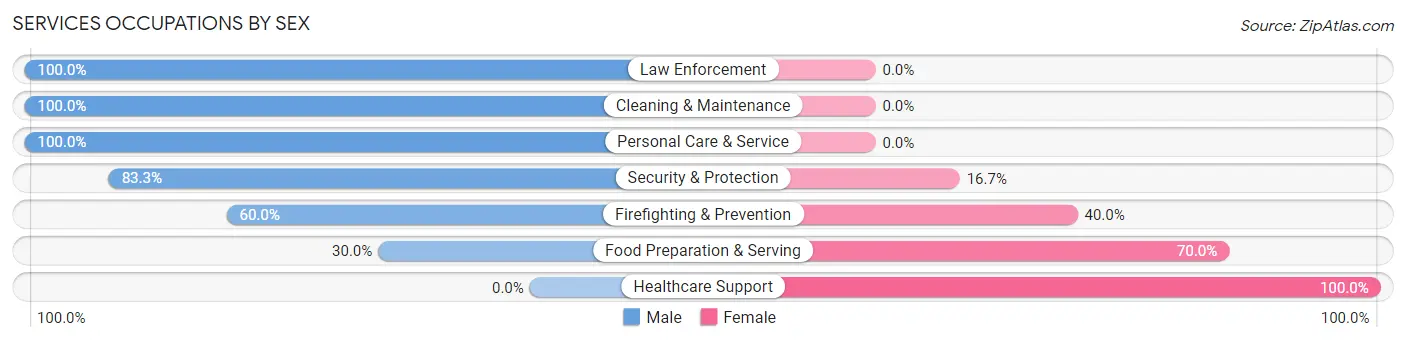
Services Occupations by Sex
Within the Services occupations in Zeba, the most male-oriented occupations are Law Enforcement (100.0%), Cleaning & Maintenance (100.0%), and Personal Care & Service (100.0%), while the most female-oriented occupations are Healthcare Support (100.0%), Food Preparation & Serving (70.0%), and Firefighting & Prevention (40.0%).
| Occupation | Male | Female |
| Healthcare Support | 0 (0.0%) | 7 (100.0%) |
| Security & Protection | 20 (83.3%) | 4 (16.7%) |
| Firefighting & Prevention | 6 (60.0%) | 4 (40.0%) |
| Law Enforcement | 14 (100.0%) | 0 (0.0%) |
| Food Preparation & Serving | 6 (30.0%) | 14 (70.0%) |
| Cleaning & Maintenance | 2 (100.0%) | 0 (0.0%) |
| Personal Care & Service | 2 (100.0%) | 0 (0.0%) |
| Total (Category) | 30 (54.5%) | 25 (45.5%) |
| Total (Overall) | 61 (54.5%) | 51 (45.5%) |
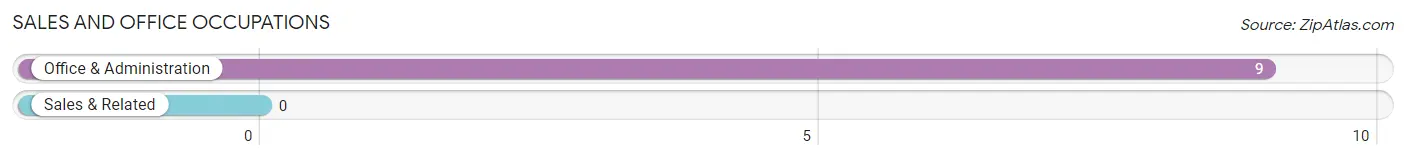
Sales and Office Occupations
The most common Sales and Office occupations in Zeba are , and Office & Administration (9 | 8.0%).
Sales and Office Occupations by Sex
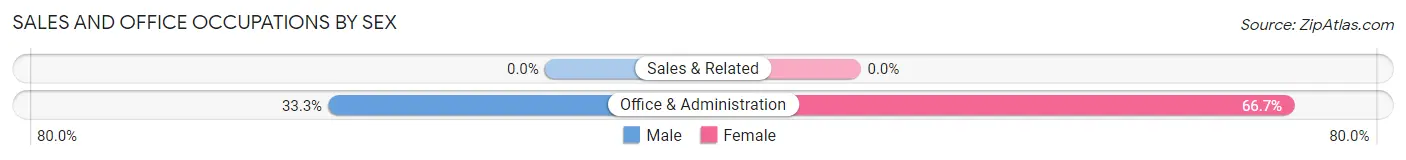
| Occupation | Male | Female |
| Sales & Related | 0 (0.0%) | 0 (0.0%) |
| Office & Administration | 3 (33.3%) | 6 (66.7%) |
| Total (Category) | 3 (33.3%) | 6 (66.7%) |
| Total (Overall) | 61 (54.5%) | 51 (45.5%) |
Natural Resources, Construction and Maintenance Occupations
The most common Natural Resources, Construction and Maintenance occupations in Zeba are , and Farming, Fishing & Forestry (3 | 2.7%).
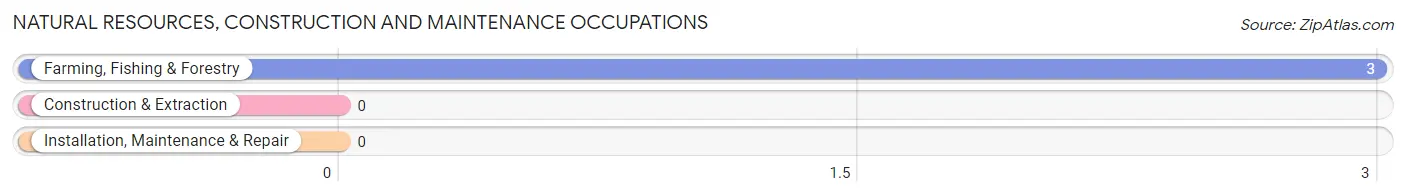
Natural Resources, Construction and Maintenance Occupations by Sex
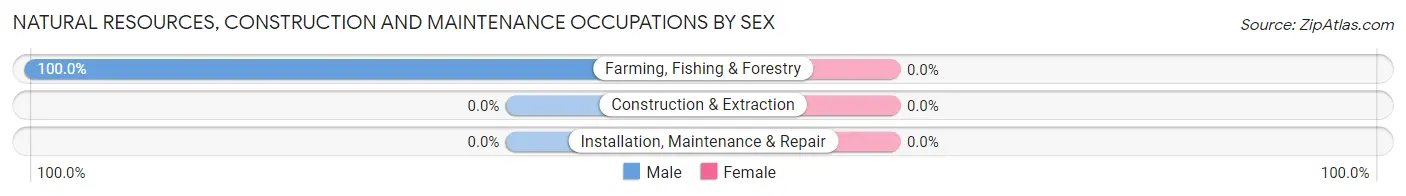
| Occupation | Male | Female |
| Farming, Fishing & Forestry | 3 (100.0%) | 0 (0.0%) |
| Construction & Extraction | 0 (0.0%) | 0 (0.0%) |
| Installation, Maintenance & Repair | 0 (0.0%) | 0 (0.0%) |
| Total (Category) | 3 (100.0%) | 0 (0.0%) |
| Total (Overall) | 61 (54.5%) | 51 (45.5%) |
Production, Transportation and Moving Occupations
The most common Production, Transportation and Moving occupations in Zeba are Production (13 | 11.6%), and Material Moving (10 | 8.9%).
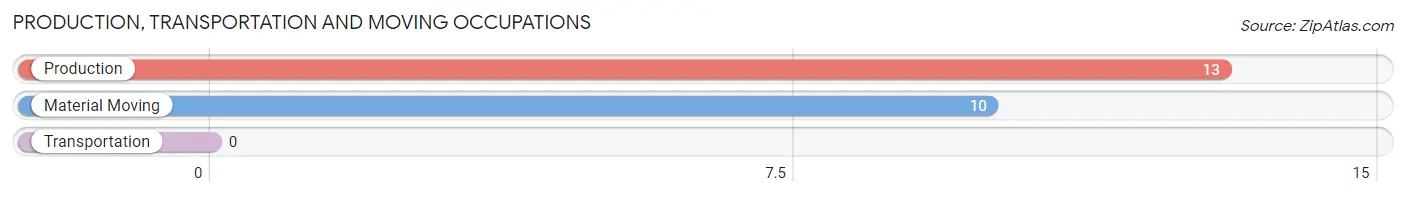
Production, Transportation and Moving Occupations by Sex
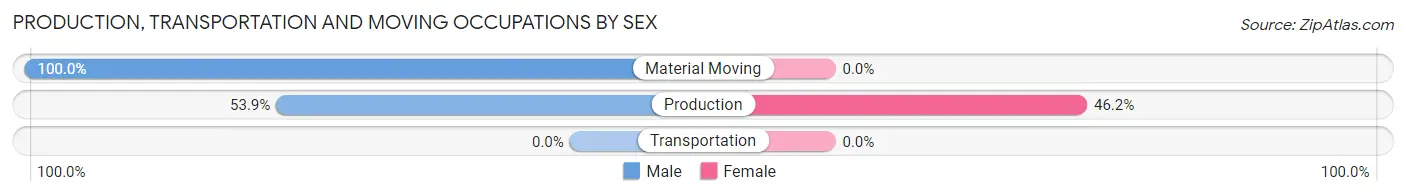
| Occupation | Male | Female |
| Production | 7 (53.8%) | 6 (46.2%) |
| Transportation | 0 (0.0%) | 0 (0.0%) |
| Material Moving | 10 (100.0%) | 0 (0.0%) |
| Total (Category) | 17 (73.9%) | 6 (26.1%) |
| Total (Overall) | 61 (54.5%) | 51 (45.5%) |
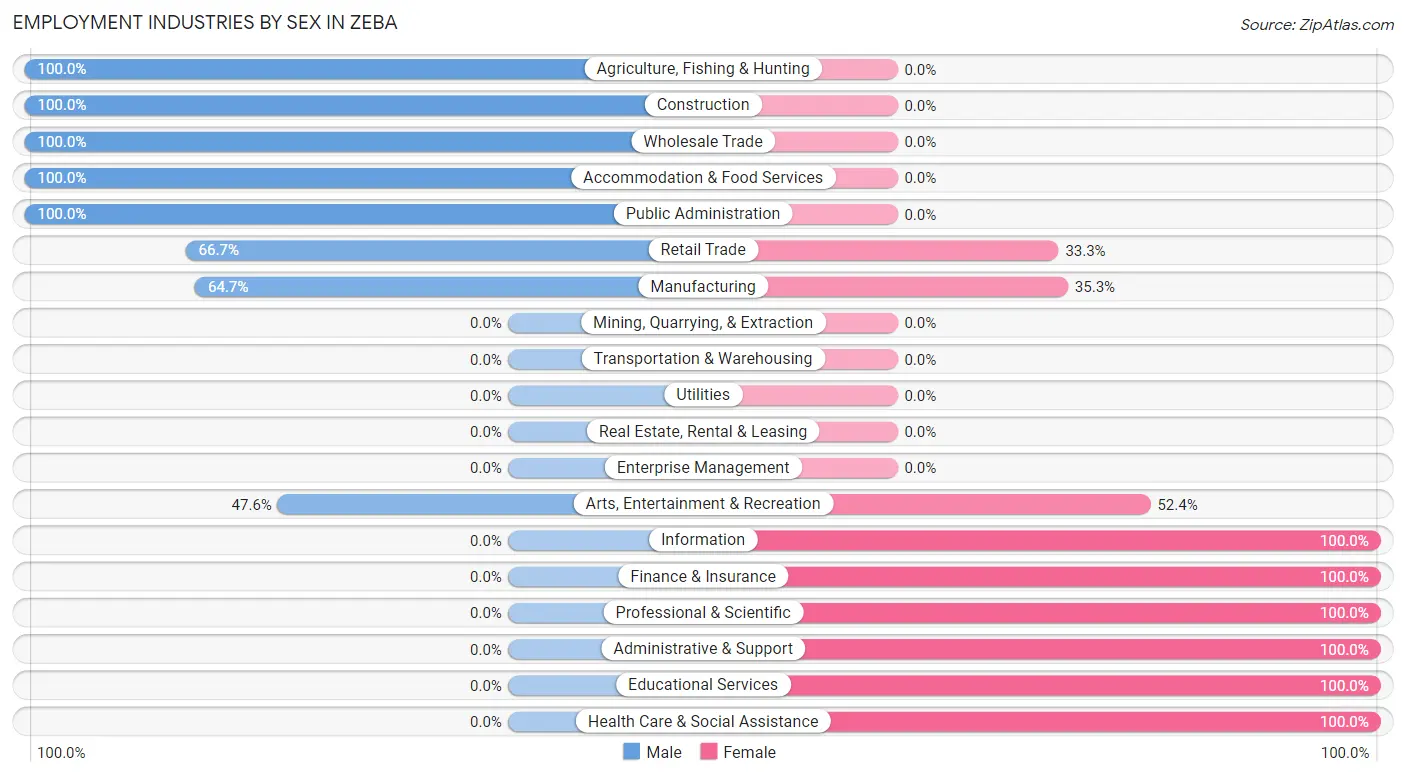
Employment Industries by Sex in Zeba
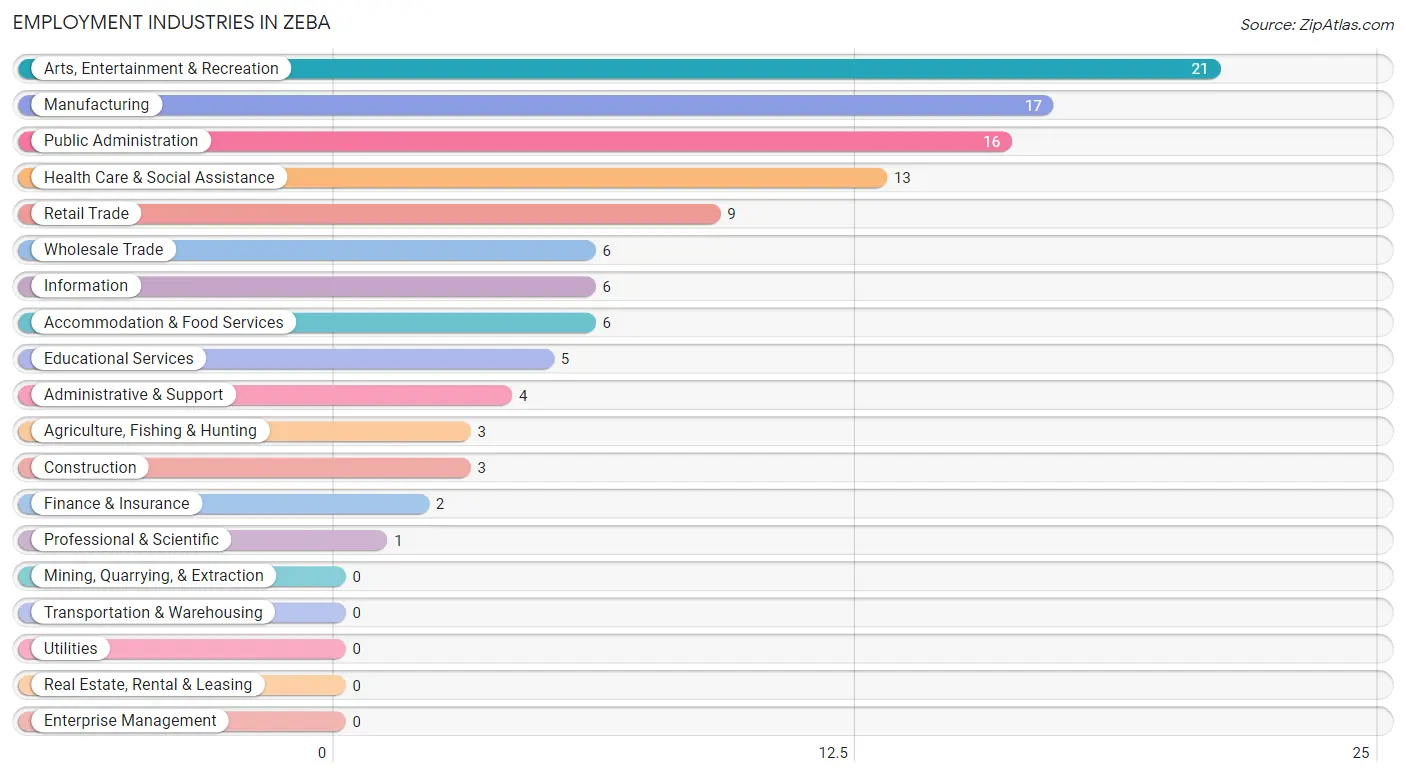
Employment Industries in Zeba
The major employment industries in Zeba include Arts, Entertainment & Recreation (21 | 18.8%), Manufacturing (17 | 15.2%), Public Administration (16 | 14.3%), Health Care & Social Assistance (13 | 11.6%), and Retail Trade (9 | 8.0%).
Employment Industries by Sex in Zeba
The Zeba industries that see more men than women are Agriculture, Fishing & Hunting (100.0%), Construction (100.0%), and Wholesale Trade (100.0%), whereas the industries that tend to have a higher number of women are Information (100.0%), Finance & Insurance (100.0%), and Professional & Scientific (100.0%).
| Industry | Male | Female |
| Agriculture, Fishing & Hunting | 3 (100.0%) | 0 (0.0%) |
| Mining, Quarrying, & Extraction | 0 (0.0%) | 0 (0.0%) |
| Construction | 3 (100.0%) | 0 (0.0%) |
| Manufacturing | 11 (64.7%) | 6 (35.3%) |
| Wholesale Trade | 6 (100.0%) | 0 (0.0%) |
| Retail Trade | 6 (66.7%) | 3 (33.3%) |
| Transportation & Warehousing | 0 (0.0%) | 0 (0.0%) |
| Utilities | 0 (0.0%) | 0 (0.0%) |
| Information | 0 (0.0%) | 6 (100.0%) |
| Finance & Insurance | 0 (0.0%) | 2 (100.0%) |
| Real Estate, Rental & Leasing | 0 (0.0%) | 0 (0.0%) |
| Professional & Scientific | 0 (0.0%) | 1 (100.0%) |
| Enterprise Management | 0 (0.0%) | 0 (0.0%) |
| Administrative & Support | 0 (0.0%) | 4 (100.0%) |
| Educational Services | 0 (0.0%) | 5 (100.0%) |
| Health Care & Social Assistance | 0 (0.0%) | 13 (100.0%) |
| Arts, Entertainment & Recreation | 10 (47.6%) | 11 (52.4%) |
| Accommodation & Food Services | 6 (100.0%) | 0 (0.0%) |
| Public Administration | 16 (100.0%) | 0 (0.0%) |
| Total | 61 (54.5%) | 51 (45.5%) |
Education in Zeba
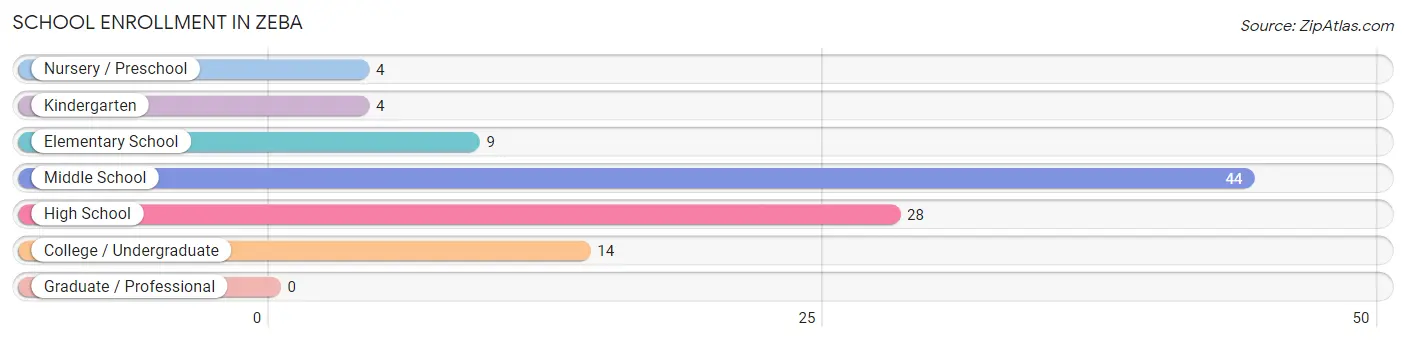
School Enrollment in Zeba
The most common levels of schooling among the 103 students in Zeba are middle school (44 | 42.7%), high school (28 | 27.2%), and college / undergraduate (14 | 13.6%).
| School Level | # Students | % Students |
| Nursery / Preschool | 4 | 3.9% |
| Kindergarten | 4 | 3.9% |
| Elementary School | 9 | 8.7% |
| Middle School | 44 | 42.7% |
| High School | 28 | 27.2% |
| College / Undergraduate | 14 | 13.6% |
| Graduate / Professional | 0 | 0.0% |
| Total | 103 | 100.0% |
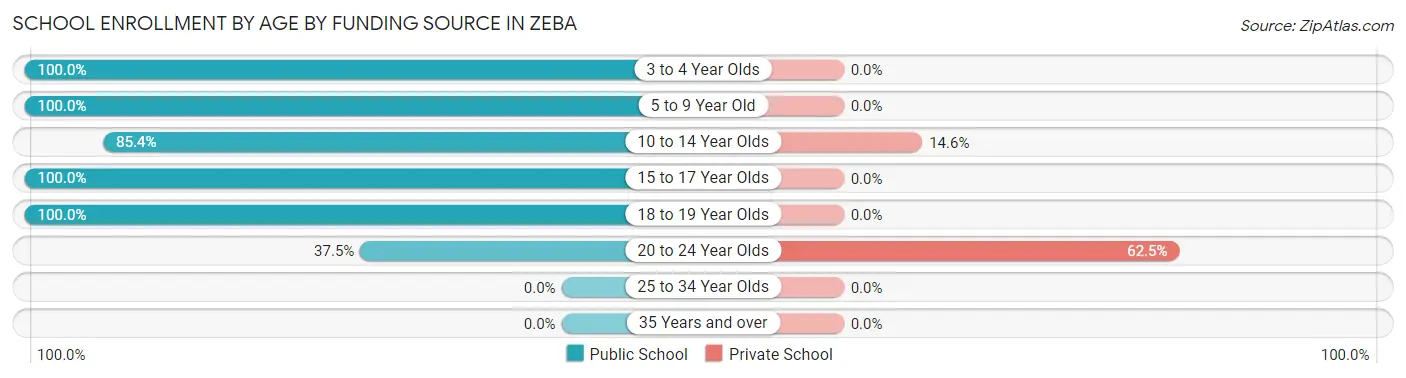
School Enrollment by Age by Funding Source in Zeba
Out of a total of 103 students who are enrolled in schools in Zeba, 11 (10.7%) attend a private institution, while the remaining 92 (89.3%) are enrolled in public schools. The age group of 20 to 24 year olds has the highest likelihood of being enrolled in private schools, with 5 (62.5% in the age bracket) enrolled. Conversely, the age group of 3 to 4 year olds has the lowest likelihood of being enrolled in a private school, with 4 (100.0% in the age bracket) attending a public institution.
| Age Bracket | Public School | Private School |
| 3 to 4 Year Olds | 4 (100.0%) | 0 (0.0%) |
| 5 to 9 Year Old | 16 (100.0%) | 0 (0.0%) |
| 10 to 14 Year Olds | 35 (85.4%) | 6 (14.6%) |
| 15 to 17 Year Olds | 28 (100.0%) | 0 (0.0%) |
| 18 to 19 Year Olds | 6 (100.0%) | 0 (0.0%) |
| 20 to 24 Year Olds | 3 (37.5%) | 5 (62.5%) |
| 25 to 34 Year Olds | 0 (0.0%) | 0 (0.0%) |
| 35 Years and over | 0 (0.0%) | 0 (0.0%) |
| Total | 92 (89.3%) | 11 (10.7%) |
Educational Attainment by Field of Study in Zeba
Business (9 | 21.4%), bio, nature & agricultural (7 | 16.7%), science & technology (7 | 16.7%), education (7 | 16.7%), and engineering (6 | 14.3%) are the most common fields of study among 42 individuals in Zeba who have obtained a bachelor's degree or higher.
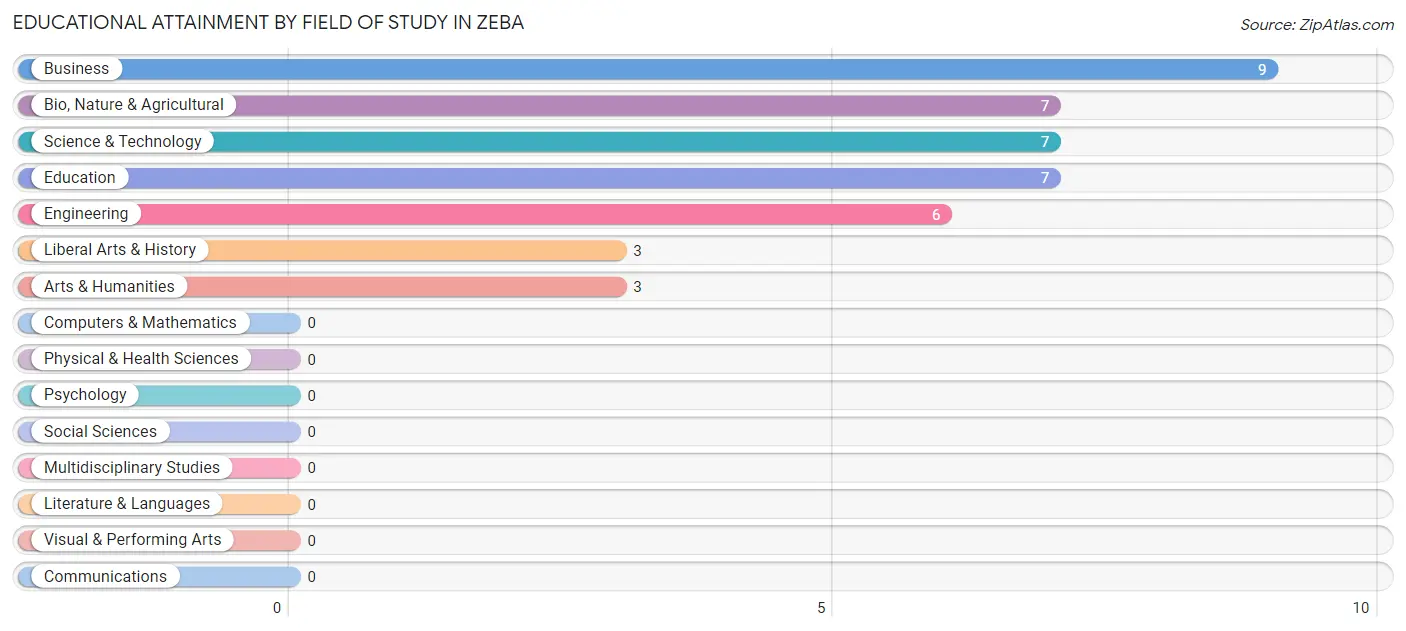
| Field of Study | # Graduates | % Graduates |
| Computers & Mathematics | 0 | 0.0% |
| Bio, Nature & Agricultural | 7 | 16.7% |
| Physical & Health Sciences | 0 | 0.0% |
| Psychology | 0 | 0.0% |
| Social Sciences | 0 | 0.0% |
| Engineering | 6 | 14.3% |
| Multidisciplinary Studies | 0 | 0.0% |
| Science & Technology | 7 | 16.7% |
| Business | 9 | 21.4% |
| Education | 7 | 16.7% |
| Literature & Languages | 0 | 0.0% |
| Liberal Arts & History | 3 | 7.1% |
| Visual & Performing Arts | 0 | 0.0% |
| Communications | 0 | 0.0% |
| Arts & Humanities | 3 | 7.1% |
| Total | 42 | 100.0% |
Transportation & Commute in Zeba
Vehicle Availability by Sex in Zeba
The most prevalent vehicle ownership categories in Zeba are males with 2 vehicles (22, accounting for 36.1%) and females with 2 vehicles (20, making up 51.2%).
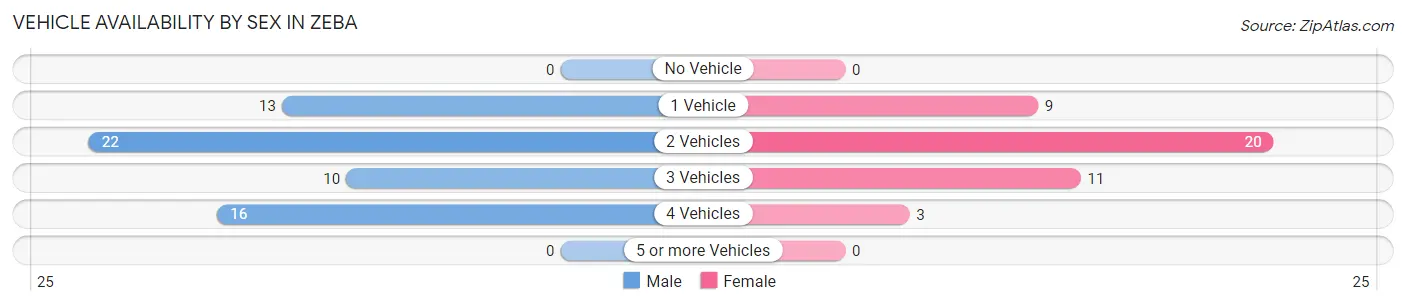
| Vehicles Available | Male | Female |
| No Vehicle | 0 (0.0%) | 0 (0.0%) |
| 1 Vehicle | 13 (21.3%) | 9 (20.9%) |
| 2 Vehicles | 22 (36.1%) | 20 (46.5%) |
| 3 Vehicles | 10 (16.4%) | 11 (25.6%) |
| 4 Vehicles | 16 (26.2%) | 3 (7.0%) |
| 5 or more Vehicles | 0 (0.0%) | 0 (0.0%) |
| Total | 61 (100.0%) | 43 (100.0%) |
Commute Time in Zeba
The most frequently occuring commute durations in Zeba are 15 to 19 minutes (33 commuters, 31.7%), 10 to 14 minutes (27 commuters, 26.0%), and 20 to 24 minutes (13 commuters, 12.5%).
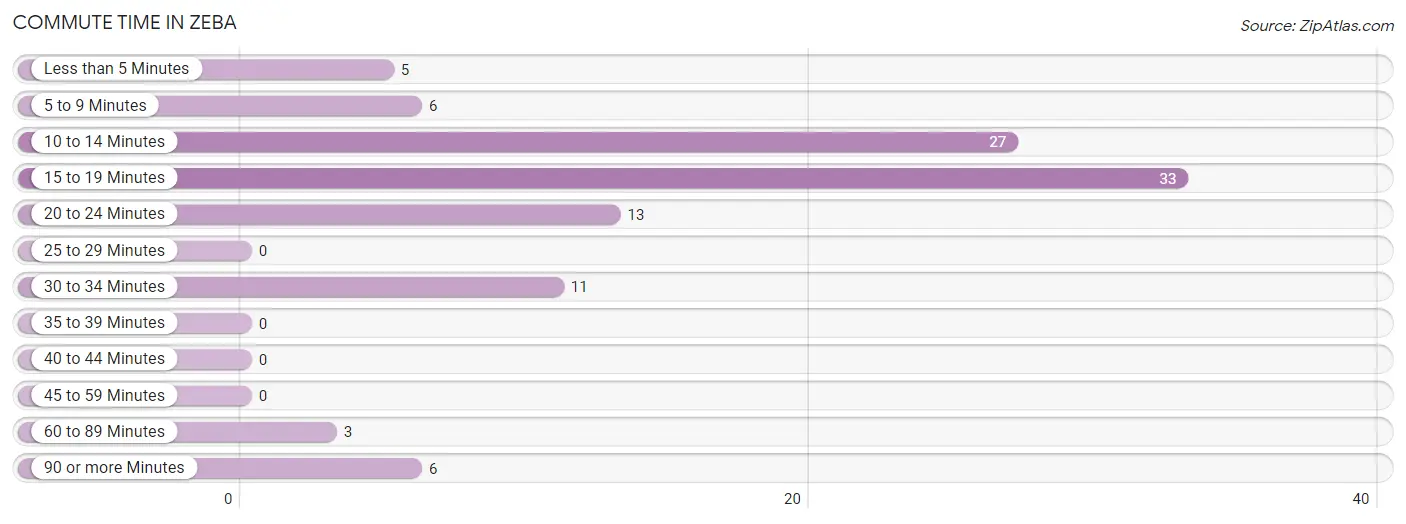
| Commute Time | # Commuters | % Commuters |
| Less than 5 Minutes | 5 | 4.8% |
| 5 to 9 Minutes | 6 | 5.8% |
| 10 to 14 Minutes | 27 | 26.0% |
| 15 to 19 Minutes | 33 | 31.7% |
| 20 to 24 Minutes | 13 | 12.5% |
| 25 to 29 Minutes | 0 | 0.0% |
| 30 to 34 Minutes | 11 | 10.6% |
| 35 to 39 Minutes | 0 | 0.0% |
| 40 to 44 Minutes | 0 | 0.0% |
| 45 to 59 Minutes | 0 | 0.0% |
| 60 to 89 Minutes | 3 | 2.9% |
| 90 or more Minutes | 6 | 5.8% |
Commute Time by Sex in Zeba
The most common commute times in Zeba are 10 to 14 minutes (14 commuters, 23.0%) for males and 15 to 19 minutes (22 commuters, 51.2%) for females.
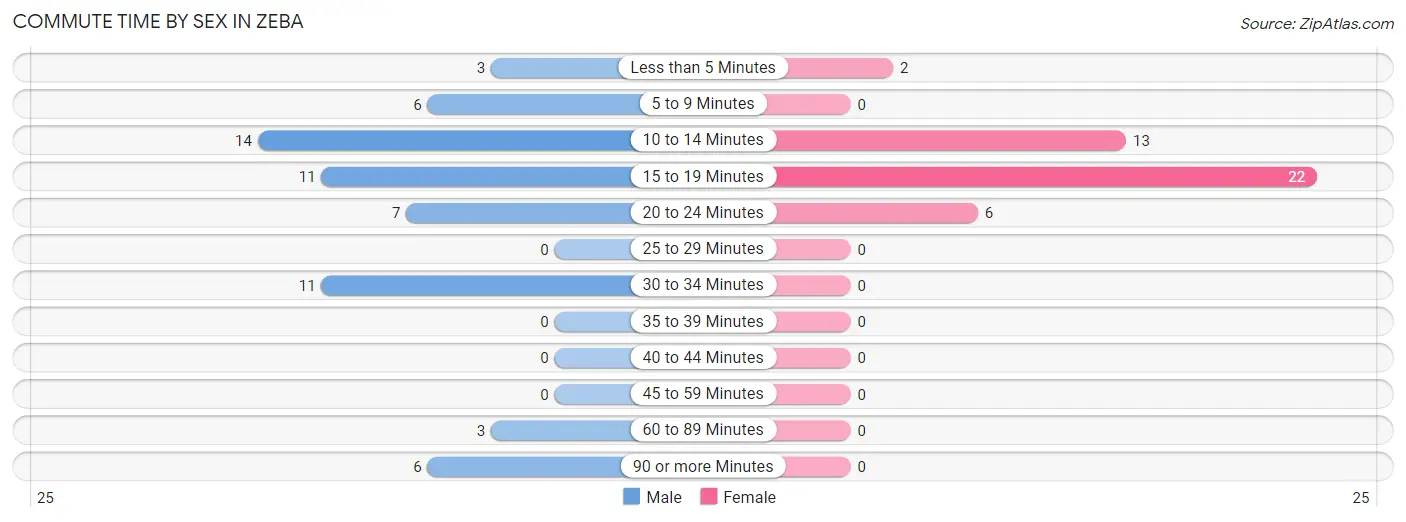
| Commute Time | Male | Female |
| Less than 5 Minutes | 3 (4.9%) | 2 (4.6%) |
| 5 to 9 Minutes | 6 (9.8%) | 0 (0.0%) |
| 10 to 14 Minutes | 14 (23.0%) | 13 (30.2%) |
| 15 to 19 Minutes | 11 (18.0%) | 22 (51.2%) |
| 20 to 24 Minutes | 7 (11.5%) | 6 (14.0%) |
| 25 to 29 Minutes | 0 (0.0%) | 0 (0.0%) |
| 30 to 34 Minutes | 11 (18.0%) | 0 (0.0%) |
| 35 to 39 Minutes | 0 (0.0%) | 0 (0.0%) |
| 40 to 44 Minutes | 0 (0.0%) | 0 (0.0%) |
| 45 to 59 Minutes | 0 (0.0%) | 0 (0.0%) |
| 60 to 89 Minutes | 3 (4.9%) | 0 (0.0%) |
| 90 or more Minutes | 6 (9.8%) | 0 (0.0%) |
Time of Departure to Work by Sex in Zeba
The most frequent times of departure to work in Zeba are 4:00 PM to 11:59 PM (18, 29.5%) for males and 7:30 AM to 7:59 AM (12, 27.9%) for females.
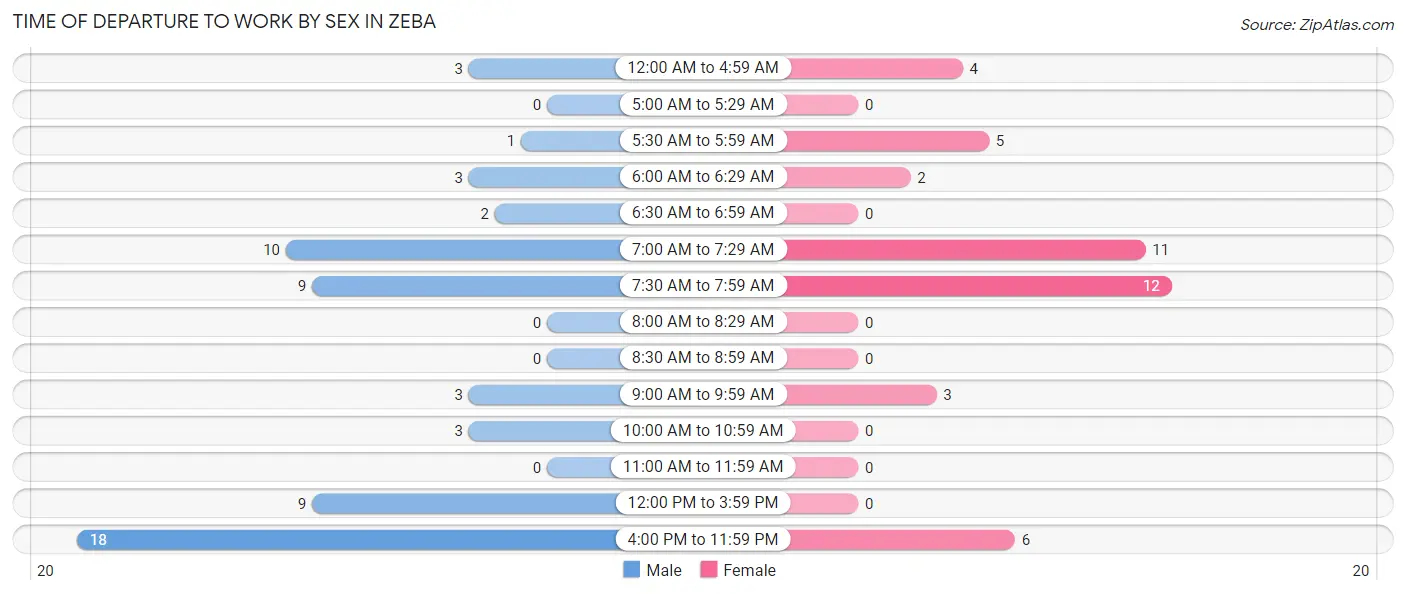
| Time of Departure | Male | Female |
| 12:00 AM to 4:59 AM | 3 (4.9%) | 4 (9.3%) |
| 5:00 AM to 5:29 AM | 0 (0.0%) | 0 (0.0%) |
| 5:30 AM to 5:59 AM | 1 (1.6%) | 5 (11.6%) |
| 6:00 AM to 6:29 AM | 3 (4.9%) | 2 (4.6%) |
| 6:30 AM to 6:59 AM | 2 (3.3%) | 0 (0.0%) |
| 7:00 AM to 7:29 AM | 10 (16.4%) | 11 (25.6%) |
| 7:30 AM to 7:59 AM | 9 (14.7%) | 12 (27.9%) |
| 8:00 AM to 8:29 AM | 0 (0.0%) | 0 (0.0%) |
| 8:30 AM to 8:59 AM | 0 (0.0%) | 0 (0.0%) |
| 9:00 AM to 9:59 AM | 3 (4.9%) | 3 (7.0%) |
| 10:00 AM to 10:59 AM | 3 (4.9%) | 0 (0.0%) |
| 11:00 AM to 11:59 AM | 0 (0.0%) | 0 (0.0%) |
| 12:00 PM to 3:59 PM | 9 (14.7%) | 0 (0.0%) |
| 4:00 PM to 11:59 PM | 18 (29.5%) | 6 (14.0%) |
| Total | 61 (100.0%) | 43 (100.0%) |
Housing Occupancy in Zeba
Occupancy by Ownership in Zeba
Of the total 148 dwellings in Zeba, owner-occupied units account for 112 (75.7%), while renter-occupied units make up 36 (24.3%).
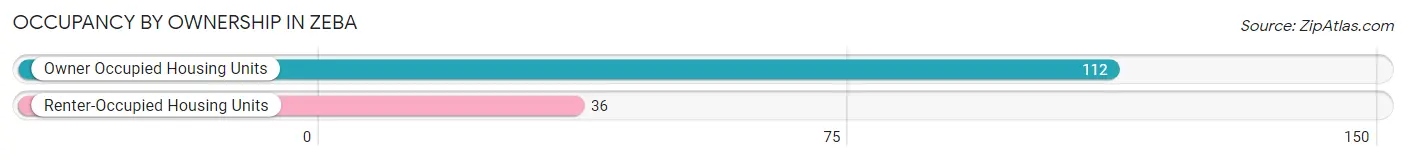
| Occupancy | # Housing Units | % Housing Units |
| Owner Occupied Housing Units | 112 | 75.7% |
| Renter-Occupied Housing Units | 36 | 24.3% |
| Total Occupied Housing Units | 148 | 100.0% |
Occupancy by Household Size in Zeba
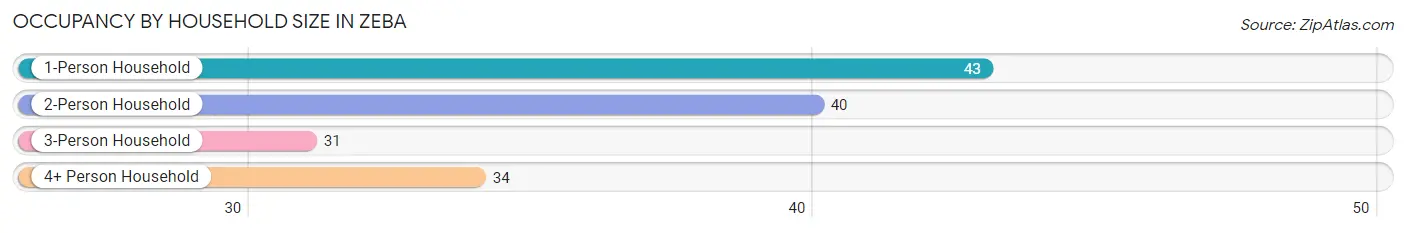
| Household Size | # Housing Units | % Housing Units |
| 1-Person Household | 43 | 29.0% |
| 2-Person Household | 40 | 27.0% |
| 3-Person Household | 31 | 20.9% |
| 4+ Person Household | 34 | 23.0% |
| Total Housing Units | 148 | 100.0% |
Occupancy by Ownership by Household Size in Zeba
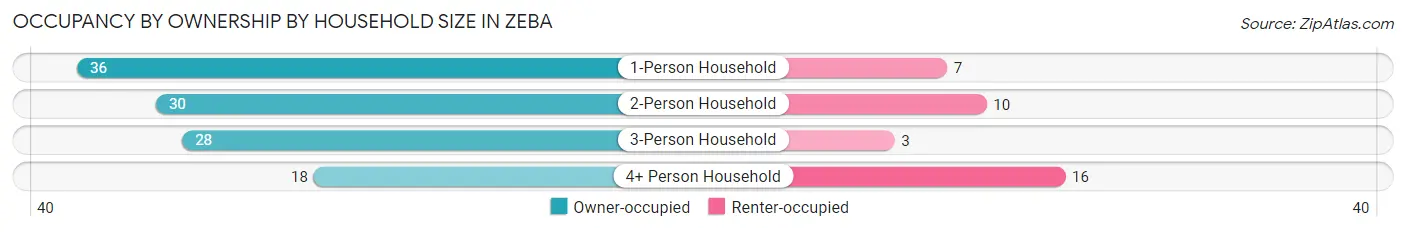
| Household Size | Owner-occupied | Renter-occupied |
| 1-Person Household | 36 (83.7%) | 7 (16.3%) |
| 2-Person Household | 30 (75.0%) | 10 (25.0%) |
| 3-Person Household | 28 (90.3%) | 3 (9.7%) |
| 4+ Person Household | 18 (52.9%) | 16 (47.1%) |
| Total Housing Units | 112 (75.7%) | 36 (24.3%) |
Occupancy by Educational Attainment in Zeba
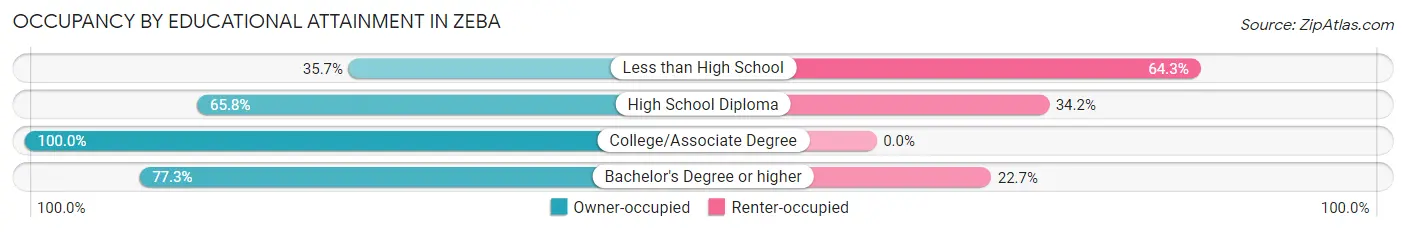
| Household Size | Owner-occupied | Renter-occupied |
| Less than High School | 10 (35.7%) | 18 (64.3%) |
| High School Diploma | 25 (65.8%) | 13 (34.2%) |
| College/Associate Degree | 60 (100.0%) | 0 (0.0%) |
| Bachelor's Degree or higher | 17 (77.3%) | 5 (22.7%) |
Occupancy by Age of Householder in Zeba
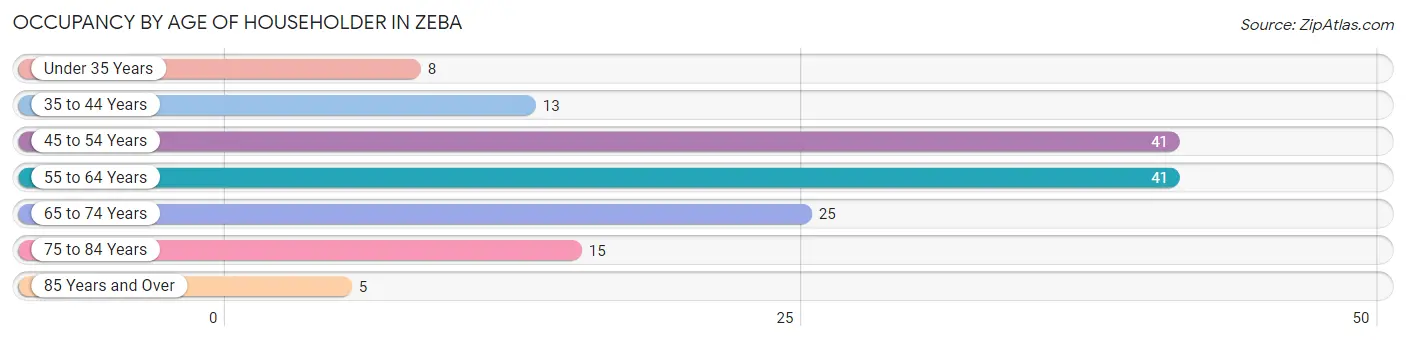
| Age Bracket | # Households | % Households |
| Under 35 Years | 8 | 5.4% |
| 35 to 44 Years | 13 | 8.8% |
| 45 to 54 Years | 41 | 27.7% |
| 55 to 64 Years | 41 | 27.7% |
| 65 to 74 Years | 25 | 16.9% |
| 75 to 84 Years | 15 | 10.1% |
| 85 Years and Over | 5 | 3.4% |
| Total | 148 | 100.0% |
Housing Finances in Zeba
Median Income by Occupancy in Zeba
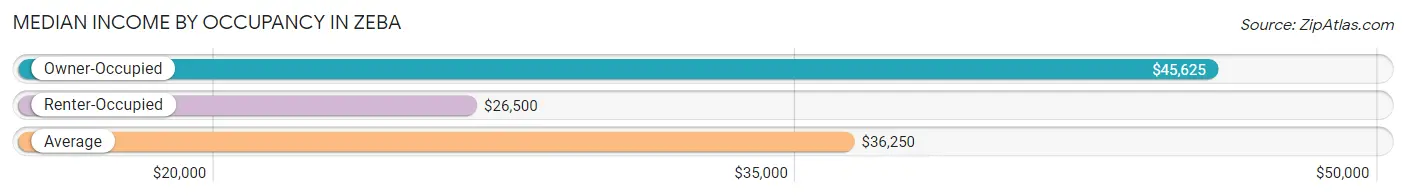
| Occupancy Type | # Households | Median Income |
| Owner-Occupied | 112 (75.7%) | $45,625 |
| Renter-Occupied | 36 (24.3%) | $26,500 |
| Average | 148 (100.0%) | $36,250 |
Occupancy by Householder Income Bracket in Zeba
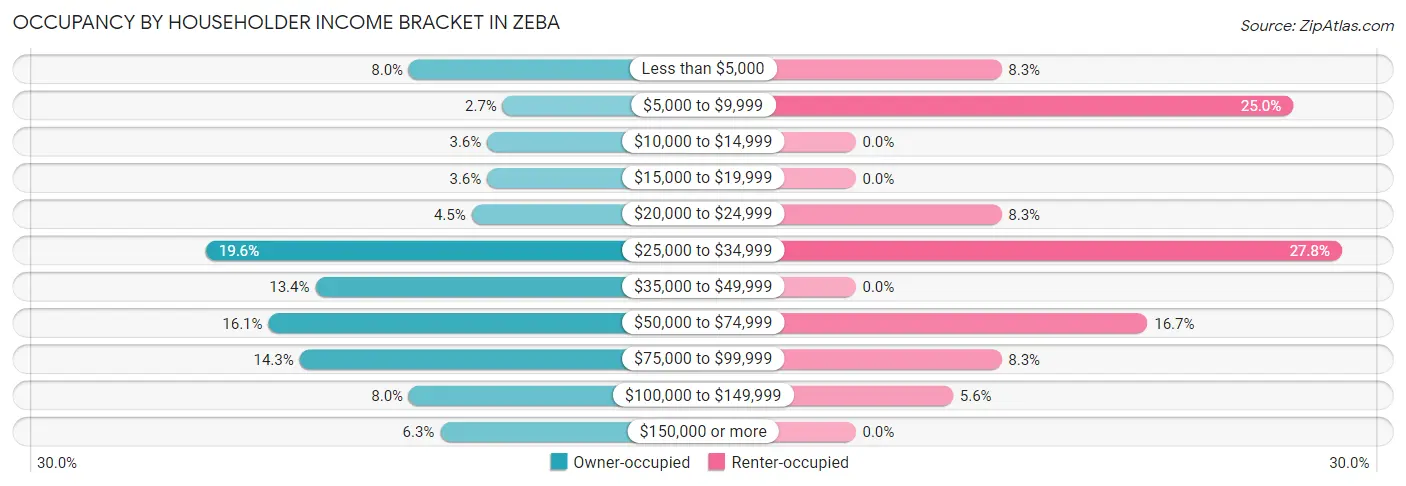
| Income Bracket | Owner-occupied | Renter-occupied |
| Less than $5,000 | 9 (8.0%) | 3 (8.3%) |
| $5,000 to $9,999 | 3 (2.7%) | 9 (25.0%) |
| $10,000 to $14,999 | 4 (3.6%) | 0 (0.0%) |
| $15,000 to $19,999 | 4 (3.6%) | 0 (0.0%) |
| $20,000 to $24,999 | 5 (4.5%) | 3 (8.3%) |
| $25,000 to $34,999 | 22 (19.6%) | 10 (27.8%) |
| $35,000 to $49,999 | 15 (13.4%) | 0 (0.0%) |
| $50,000 to $74,999 | 18 (16.1%) | 6 (16.7%) |
| $75,000 to $99,999 | 16 (14.3%) | 3 (8.3%) |
| $100,000 to $149,999 | 9 (8.0%) | 2 (5.6%) |
| $150,000 or more | 7 (6.2%) | 0 (0.0%) |
| Total | 112 (100.0%) | 36 (100.0%) |
Monthly Housing Cost Tiers in Zeba
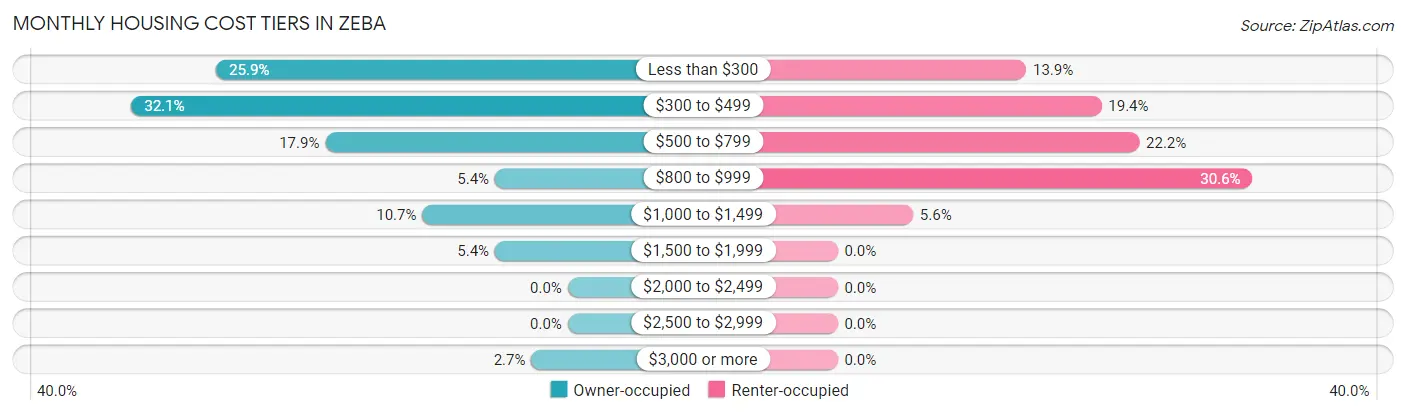
| Monthly Cost | Owner-occupied | Renter-occupied |
| Less than $300 | 29 (25.9%) | 5 (13.9%) |
| $300 to $499 | 36 (32.1%) | 7 (19.4%) |
| $500 to $799 | 20 (17.9%) | 8 (22.2%) |
| $800 to $999 | 6 (5.4%) | 11 (30.6%) |
| $1,000 to $1,499 | 12 (10.7%) | 2 (5.6%) |
| $1,500 to $1,999 | 6 (5.4%) | 0 (0.0%) |
| $2,000 to $2,499 | 0 (0.0%) | 0 (0.0%) |
| $2,500 to $2,999 | 0 (0.0%) | 0 (0.0%) |
| $3,000 or more | 3 (2.7%) | 0 (0.0%) |
| Total | 112 (100.0%) | 36 (100.0%) |
Physical Housing Characteristics in Zeba
Housing Structures in Zeba
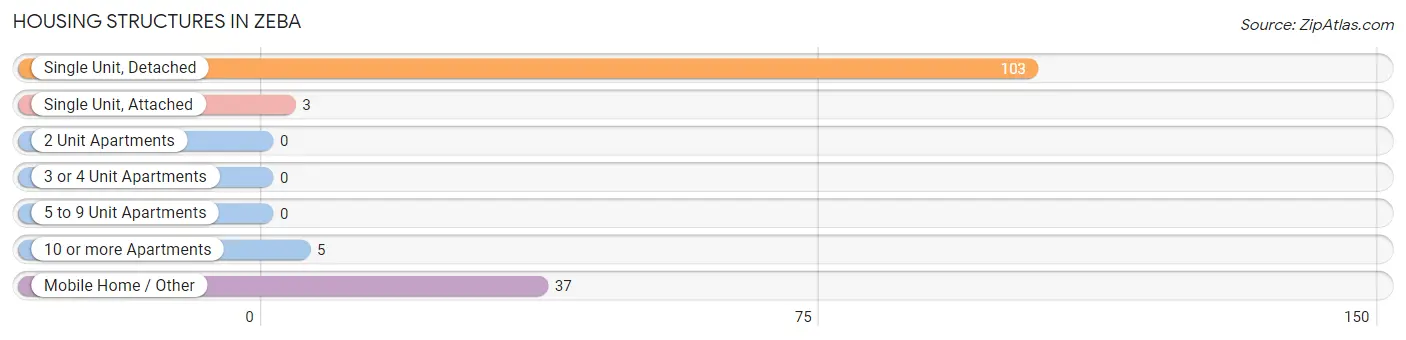
| Structure Type | # Housing Units | % Housing Units |
| Single Unit, Detached | 103 | 69.6% |
| Single Unit, Attached | 3 | 2.0% |
| 2 Unit Apartments | 0 | 0.0% |
| 3 or 4 Unit Apartments | 0 | 0.0% |
| 5 to 9 Unit Apartments | 0 | 0.0% |
| 10 or more Apartments | 5 | 3.4% |
| Mobile Home / Other | 37 | 25.0% |
| Total | 148 | 100.0% |
Housing Structures by Occupancy in Zeba
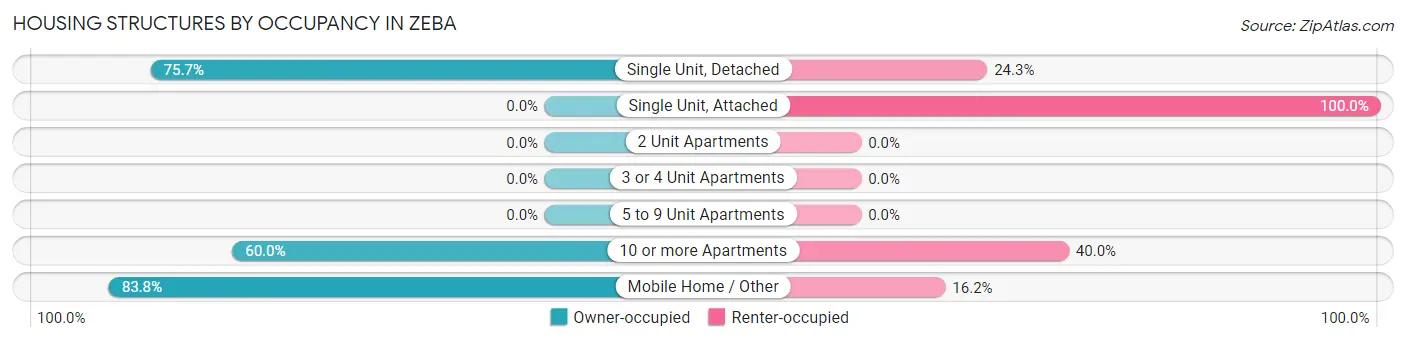
| Structure Type | Owner-occupied | Renter-occupied |
| Single Unit, Detached | 78 (75.7%) | 25 (24.3%) |
| Single Unit, Attached | 0 (0.0%) | 3 (100.0%) |
| 2 Unit Apartments | 0 (0.0%) | 0 (0.0%) |
| 3 or 4 Unit Apartments | 0 (0.0%) | 0 (0.0%) |
| 5 to 9 Unit Apartments | 0 (0.0%) | 0 (0.0%) |
| 10 or more Apartments | 3 (60.0%) | 2 (40.0%) |
| Mobile Home / Other | 31 (83.8%) | 6 (16.2%) |
| Total | 112 (75.7%) | 36 (24.3%) |
Housing Structures by Number of Rooms in Zeba
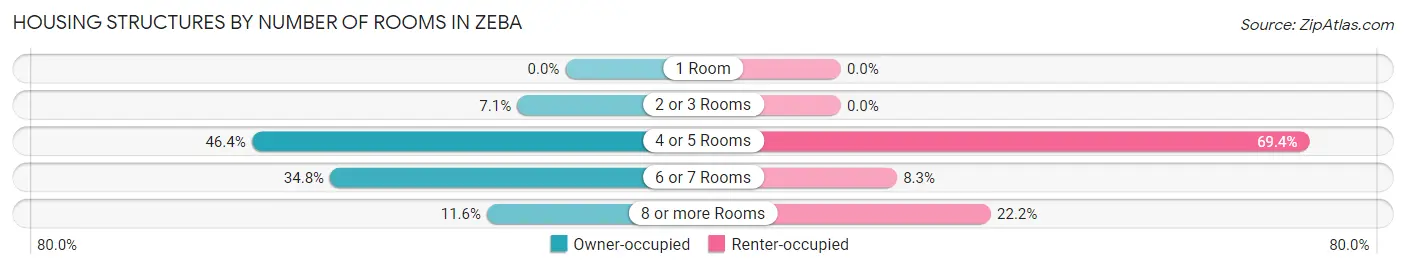
| Number of Rooms | Owner-occupied | Renter-occupied |
| 1 Room | 0 (0.0%) | 0 (0.0%) |
| 2 or 3 Rooms | 8 (7.1%) | 0 (0.0%) |
| 4 or 5 Rooms | 52 (46.4%) | 25 (69.4%) |
| 6 or 7 Rooms | 39 (34.8%) | 3 (8.3%) |
| 8 or more Rooms | 13 (11.6%) | 8 (22.2%) |
| Total | 112 (100.0%) | 36 (100.0%) |
Housing Structure by Heating Type in Zeba
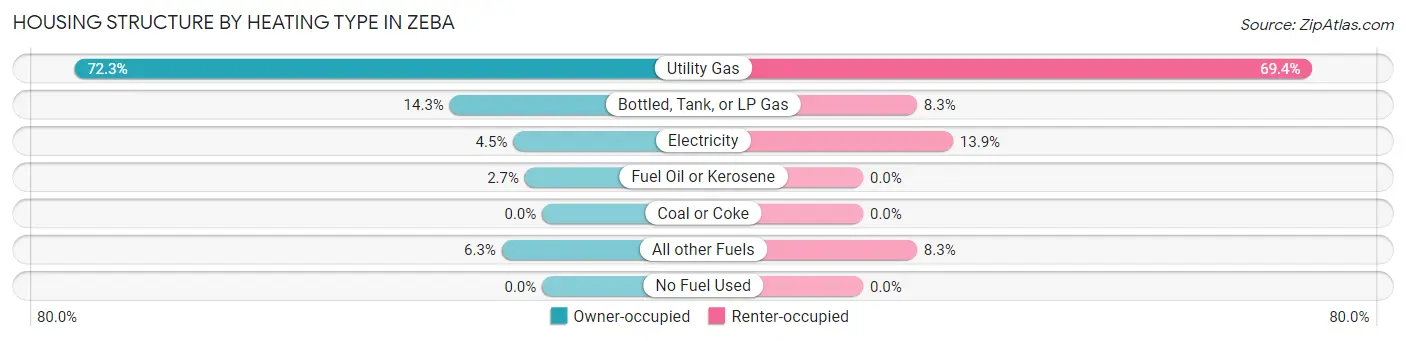
| Heating Type | Owner-occupied | Renter-occupied |
| Utility Gas | 81 (72.3%) | 25 (69.4%) |
| Bottled, Tank, or LP Gas | 16 (14.3%) | 3 (8.3%) |
| Electricity | 5 (4.5%) | 5 (13.9%) |
| Fuel Oil or Kerosene | 3 (2.7%) | 0 (0.0%) |
| Coal or Coke | 0 (0.0%) | 0 (0.0%) |
| All other Fuels | 7 (6.2%) | 3 (8.3%) |
| No Fuel Used | 0 (0.0%) | 0 (0.0%) |
| Total | 112 (100.0%) | 36 (100.0%) |
Household Vehicle Usage in Zeba
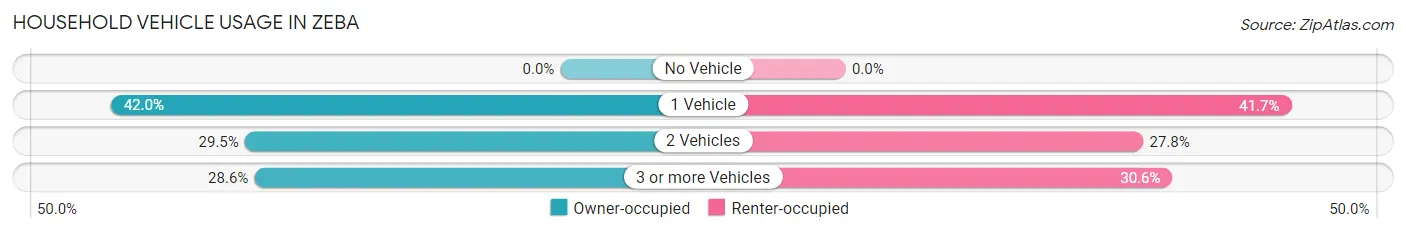
| Vehicles per Household | Owner-occupied | Renter-occupied |
| No Vehicle | 0 (0.0%) | 0 (0.0%) |
| 1 Vehicle | 47 (42.0%) | 15 (41.7%) |
| 2 Vehicles | 33 (29.5%) | 10 (27.8%) |
| 3 or more Vehicles | 32 (28.6%) | 11 (30.6%) |
| Total | 112 (100.0%) | 36 (100.0%) |
Real Estate & Mortgages in Zeba
Real Estate and Mortgage Overview in Zeba
| Characteristic | Without Mortgage | With Mortgage |
| Housing Units | 83 | 29 |
| Median Property Value | $81,600 | $128,100 |
| Median Household Income | $34,107 | $3 |
| Monthly Housing Costs | $363 | $3 |
| Real Estate Taxes | $1,750 | $14 |
Property Value by Mortgage Status in Zeba
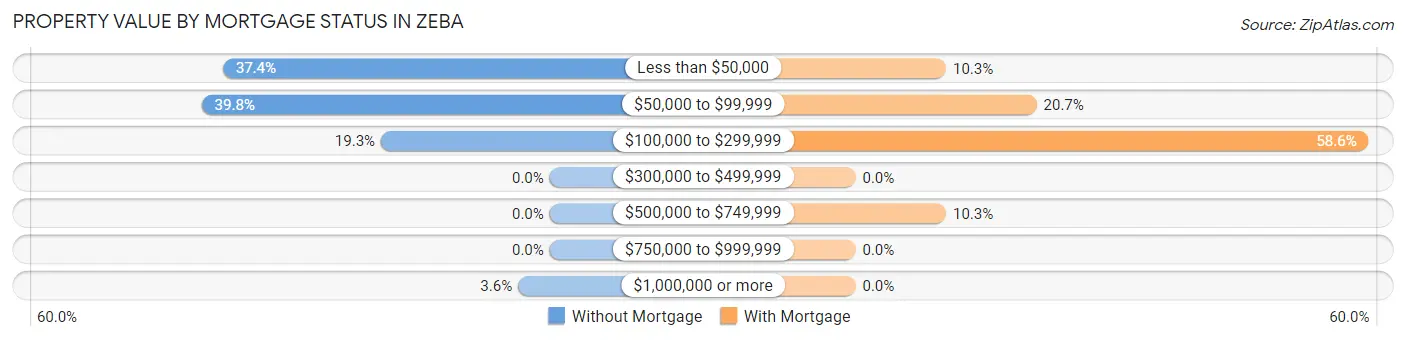
| Property Value | Without Mortgage | With Mortgage |
| Less than $50,000 | 31 (37.3%) | 3 (10.3%) |
| $50,000 to $99,999 | 33 (39.8%) | 6 (20.7%) |
| $100,000 to $299,999 | 16 (19.3%) | 17 (58.6%) |
| $300,000 to $499,999 | 0 (0.0%) | 0 (0.0%) |
| $500,000 to $749,999 | 0 (0.0%) | 3 (10.3%) |
| $750,000 to $999,999 | 0 (0.0%) | 0 (0.0%) |
| $1,000,000 or more | 3 (3.6%) | 0 (0.0%) |
| Total | 83 (100.0%) | 29 (100.0%) |
Household Income by Mortgage Status in Zeba
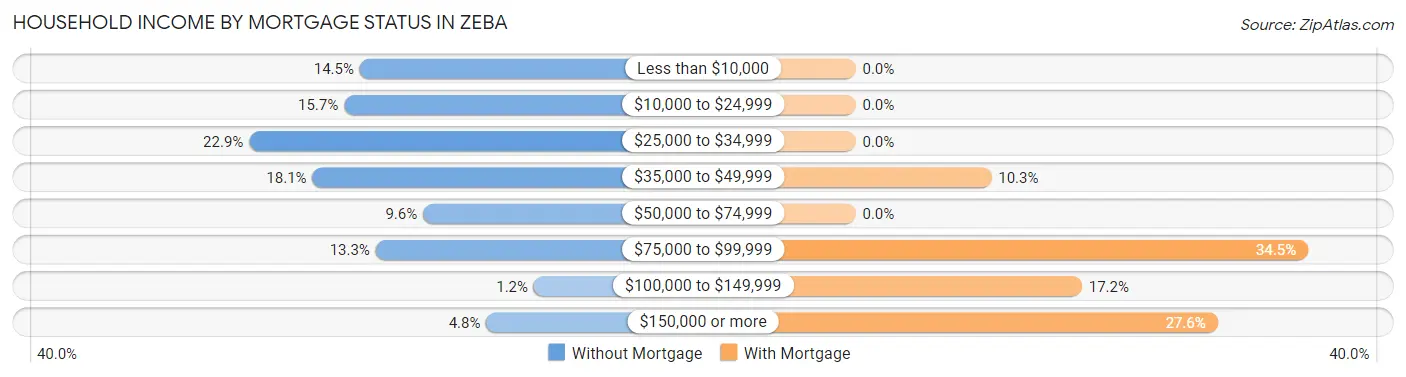
| Household Income | Without Mortgage | With Mortgage |
| Less than $10,000 | 12 (14.5%) | 0 (0.0%) |
| $10,000 to $24,999 | 13 (15.7%) | 0 (0.0%) |
| $25,000 to $34,999 | 19 (22.9%) | 0 (0.0%) |
| $35,000 to $49,999 | 15 (18.1%) | 3 (10.3%) |
| $50,000 to $74,999 | 8 (9.6%) | 0 (0.0%) |
| $75,000 to $99,999 | 11 (13.3%) | 10 (34.5%) |
| $100,000 to $149,999 | 1 (1.2%) | 5 (17.2%) |
| $150,000 or more | 4 (4.8%) | 8 (27.6%) |
| Total | 83 (100.0%) | 29 (100.0%) |
Property Value to Household Income Ratio in Zeba
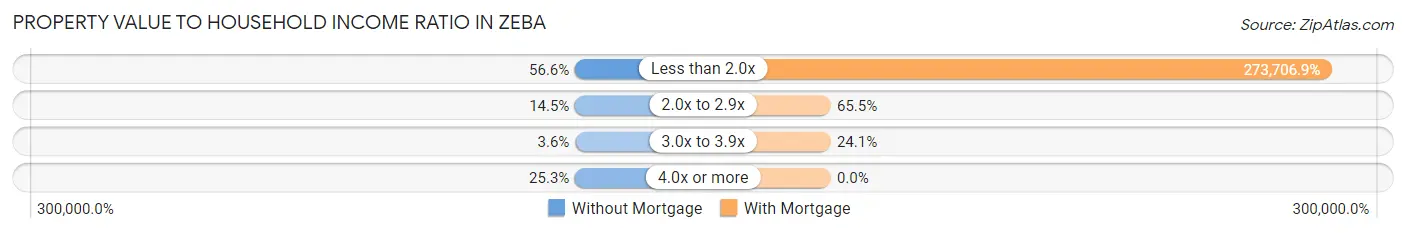
| Value-to-Income Ratio | Without Mortgage | With Mortgage |
| Less than 2.0x | 47 (56.6%) | 79,375 (273,706.9%) |
| 2.0x to 2.9x | 12 (14.5%) | 19 (65.5%) |
| 3.0x to 3.9x | 3 (3.6%) | 7 (24.1%) |
| 4.0x or more | 21 (25.3%) | 0 (0.0%) |
| Total | 83 (100.0%) | 29 (100.0%) |
Real Estate Taxes by Mortgage Status in Zeba
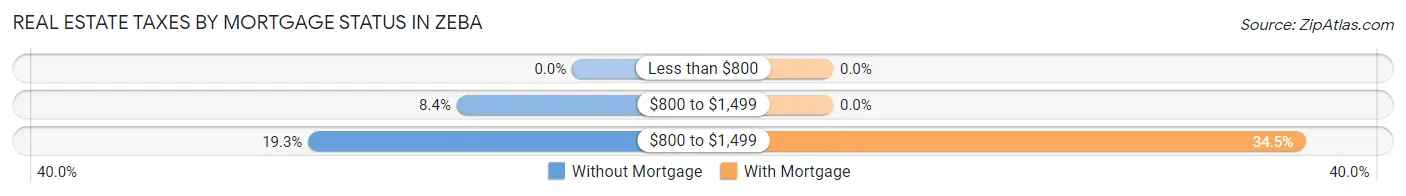
| Property Taxes | Without Mortgage | With Mortgage |
| Less than $800 | 0 (0.0%) | 0 (0.0%) |
| $800 to $1,499 | 7 (8.4%) | 0 (0.0%) |
| $800 to $1,499 | 16 (19.3%) | 10 (34.5%) |
| Total | 83 (100.0%) | 29 (100.0%) |
Health & Disability in Zeba
Health Insurance Coverage by Age in Zeba
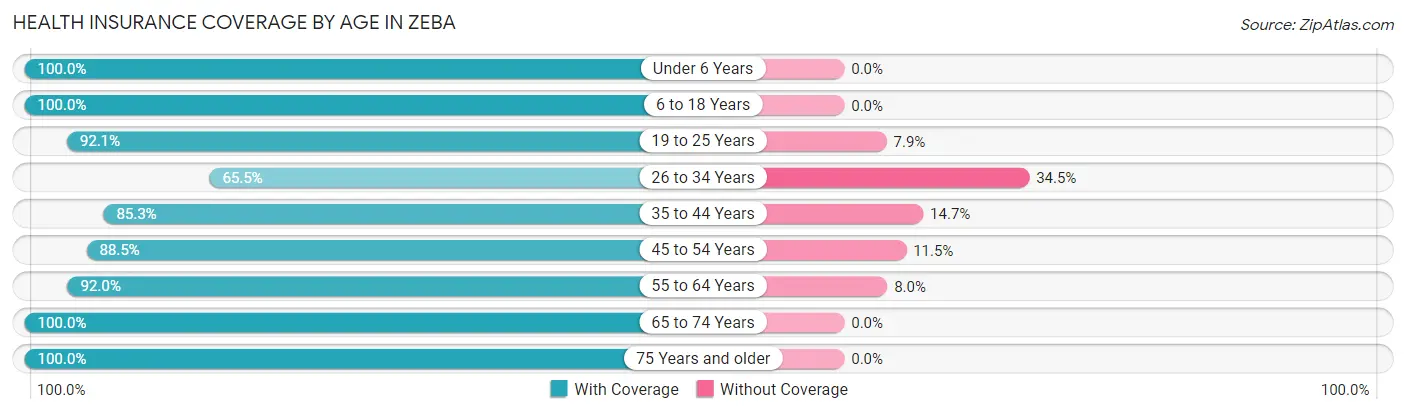
| Age Bracket | With Coverage | Without Coverage |
| Under 6 Years | 4 (100.0%) | 0 (0.0%) |
| 6 to 18 Years | 91 (100.0%) | 0 (0.0%) |
| 19 to 25 Years | 35 (92.1%) | 3 (7.9%) |
| 26 to 34 Years | 19 (65.5%) | 10 (34.5%) |
| 35 to 44 Years | 29 (85.3%) | 5 (14.7%) |
| 45 to 54 Years | 46 (88.5%) | 6 (11.5%) |
| 55 to 64 Years | 69 (92.0%) | 6 (8.0%) |
| 65 to 74 Years | 32 (100.0%) | 0 (0.0%) |
| 75 Years and older | 27 (100.0%) | 0 (0.0%) |
| Total | 352 (92.1%) | 30 (7.9%) |
Health Insurance Coverage by Citizenship Status in Zeba
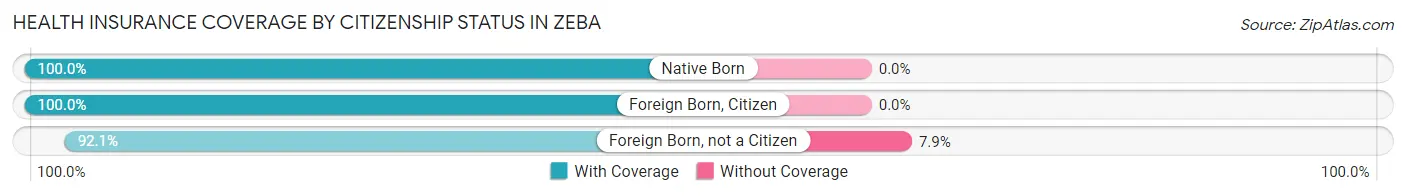
| Citizenship Status | With Coverage | Without Coverage |
| Native Born | 4 (100.0%) | 0 (0.0%) |
| Foreign Born, Citizen | 91 (100.0%) | 0 (0.0%) |
| Foreign Born, not a Citizen | 35 (92.1%) | 3 (7.9%) |
Health Insurance Coverage by Household Income in Zeba
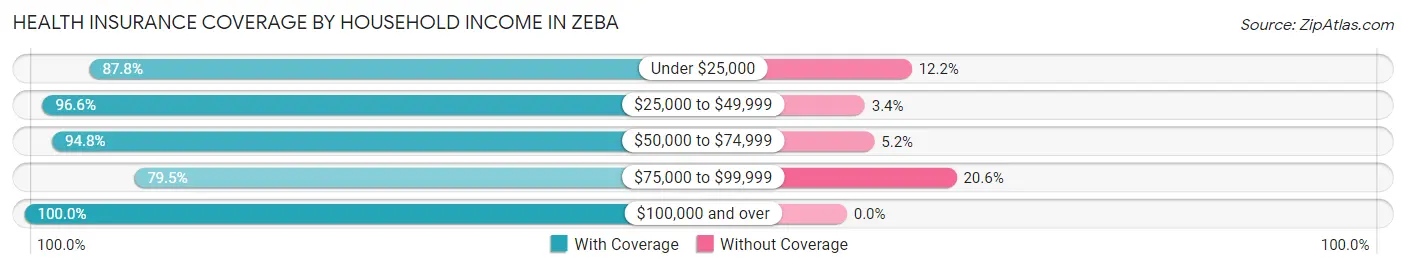
| Household Income | With Coverage | Without Coverage |
| Under $25,000 | 65 (87.8%) | 9 (12.2%) |
| $25,000 to $49,999 | 86 (96.6%) | 3 (3.4%) |
| $50,000 to $74,999 | 55 (94.8%) | 3 (5.2%) |
| $75,000 to $99,999 | 58 (79.4%) | 15 (20.5%) |
| $100,000 and over | 88 (100.0%) | 0 (0.0%) |
Public vs Private Health Insurance Coverage by Age in Zeba
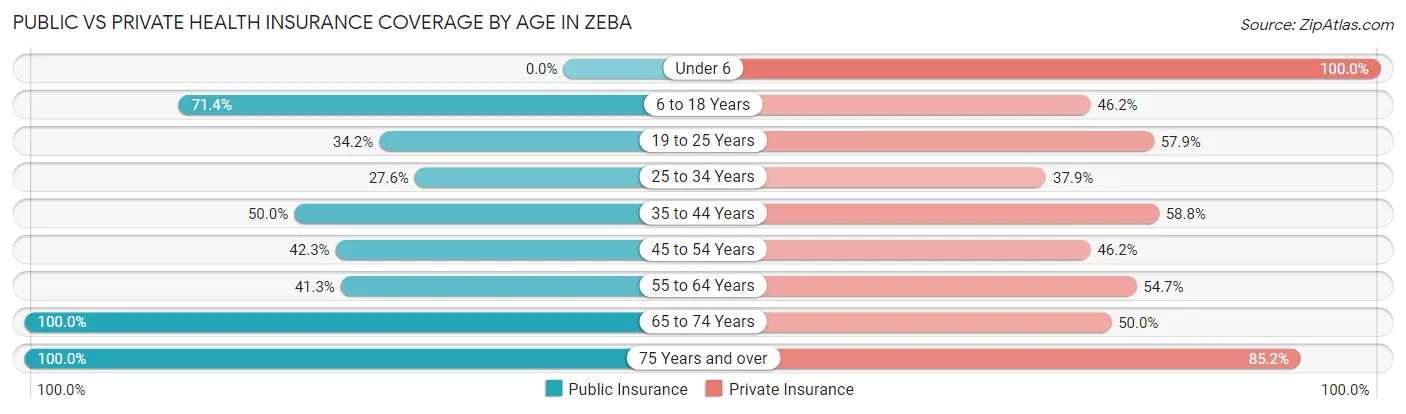
| Age Bracket | Public Insurance | Private Insurance |
| Under 6 | 0 (0.0%) | 4 (100.0%) |
| 6 to 18 Years | 65 (71.4%) | 42 (46.2%) |
| 19 to 25 Years | 13 (34.2%) | 22 (57.9%) |
| 25 to 34 Years | 8 (27.6%) | 11 (37.9%) |
| 35 to 44 Years | 17 (50.0%) | 20 (58.8%) |
| 45 to 54 Years | 22 (42.3%) | 24 (46.2%) |
| 55 to 64 Years | 31 (41.3%) | 41 (54.7%) |
| 65 to 74 Years | 32 (100.0%) | 16 (50.0%) |
| 75 Years and over | 27 (100.0%) | 23 (85.2%) |
| Total | 215 (56.3%) | 203 (53.1%) |
Disability Status by Sex by Age in Zeba
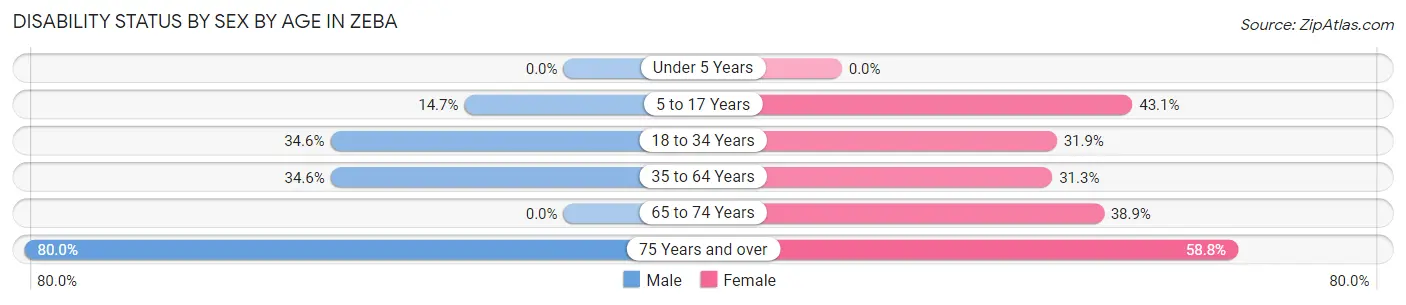
| Age Bracket | Male | Female |
| Under 5 Years | 0 (0.0%) | 0 (0.0%) |
| 5 to 17 Years | 5 (14.7%) | 22 (43.1%) |
| 18 to 34 Years | 9 (34.6%) | 15 (31.9%) |
| 35 to 64 Years | 28 (34.6%) | 25 (31.2%) |
| 65 to 74 Years | 0 (0.0%) | 7 (38.9%) |
| 75 Years and over | 8 (80.0%) | 10 (58.8%) |
Disability Class by Sex by Age in Zeba
Disability Class: Hearing Difficulty
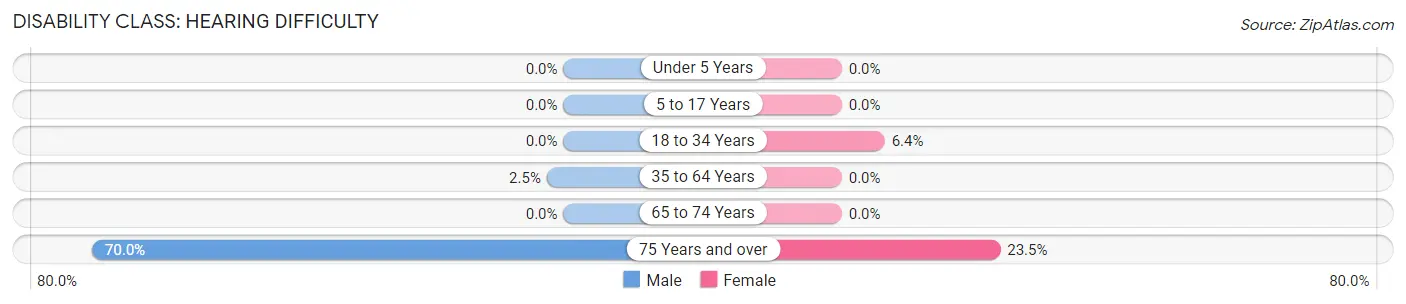
| Age Bracket | Male | Female |
| Under 5 Years | 0 (0.0%) | 0 (0.0%) |
| 5 to 17 Years | 0 (0.0%) | 0 (0.0%) |
| 18 to 34 Years | 0 (0.0%) | 3 (6.4%) |
| 35 to 64 Years | 2 (2.5%) | 0 (0.0%) |
| 65 to 74 Years | 0 (0.0%) | 0 (0.0%) |
| 75 Years and over | 7 (70.0%) | 4 (23.5%) |
Disability Class: Vision Difficulty
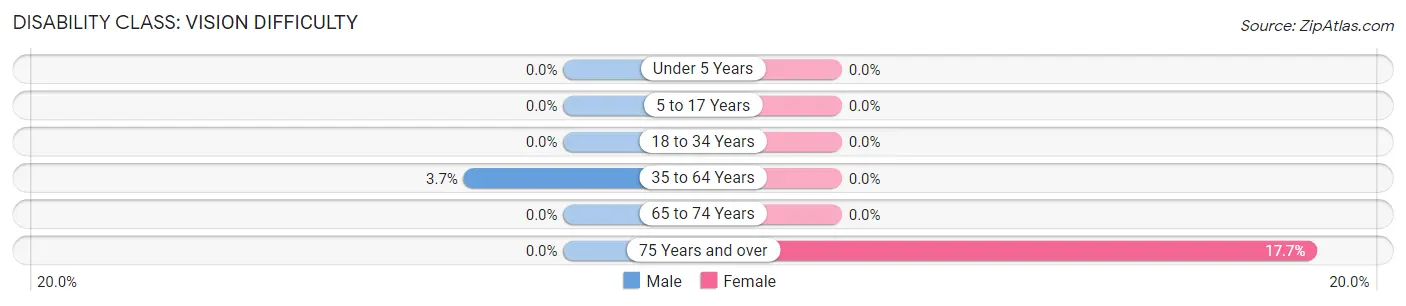
| Age Bracket | Male | Female |
| Under 5 Years | 0 (0.0%) | 0 (0.0%) |
| 5 to 17 Years | 0 (0.0%) | 0 (0.0%) |
| 18 to 34 Years | 0 (0.0%) | 0 (0.0%) |
| 35 to 64 Years | 3 (3.7%) | 0 (0.0%) |
| 65 to 74 Years | 0 (0.0%) | 0 (0.0%) |
| 75 Years and over | 0 (0.0%) | 3 (17.6%) |
Disability Class: Cognitive Difficulty
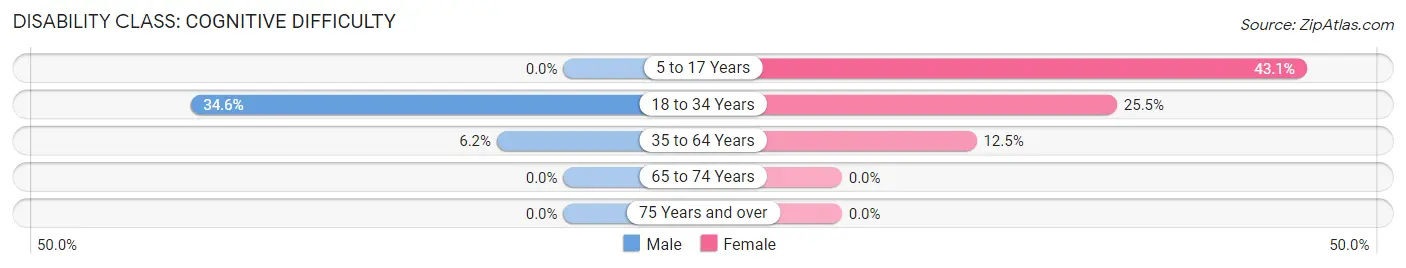
| Age Bracket | Male | Female |
| 5 to 17 Years | 0 (0.0%) | 22 (43.1%) |
| 18 to 34 Years | 9 (34.6%) | 12 (25.5%) |
| 35 to 64 Years | 5 (6.2%) | 10 (12.5%) |
| 65 to 74 Years | 0 (0.0%) | 0 (0.0%) |
| 75 Years and over | 0 (0.0%) | 0 (0.0%) |
Disability Class: Ambulatory Difficulty
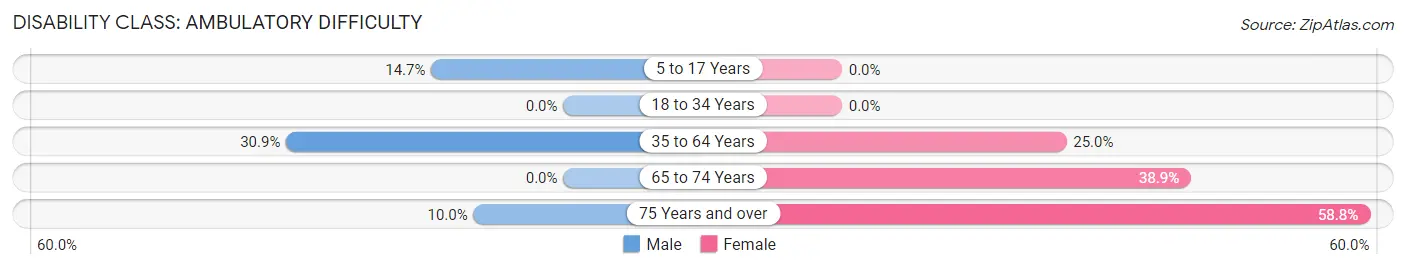
| Age Bracket | Male | Female |
| 5 to 17 Years | 5 (14.7%) | 0 (0.0%) |
| 18 to 34 Years | 0 (0.0%) | 0 (0.0%) |
| 35 to 64 Years | 25 (30.9%) | 20 (25.0%) |
| 65 to 74 Years | 0 (0.0%) | 7 (38.9%) |
| 75 Years and over | 1 (10.0%) | 10 (58.8%) |
Disability Class: Self-Care Difficulty
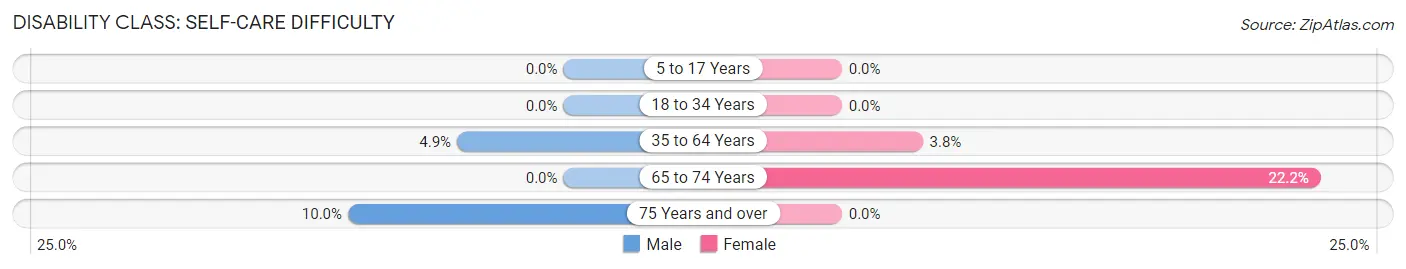
| Age Bracket | Male | Female |
| 5 to 17 Years | 0 (0.0%) | 0 (0.0%) |
| 18 to 34 Years | 0 (0.0%) | 0 (0.0%) |
| 35 to 64 Years | 4 (4.9%) | 3 (3.7%) |
| 65 to 74 Years | 0 (0.0%) | 4 (22.2%) |
| 75 Years and over | 1 (10.0%) | 0 (0.0%) |
Technology Access in Zeba
Computing Device Access in Zeba
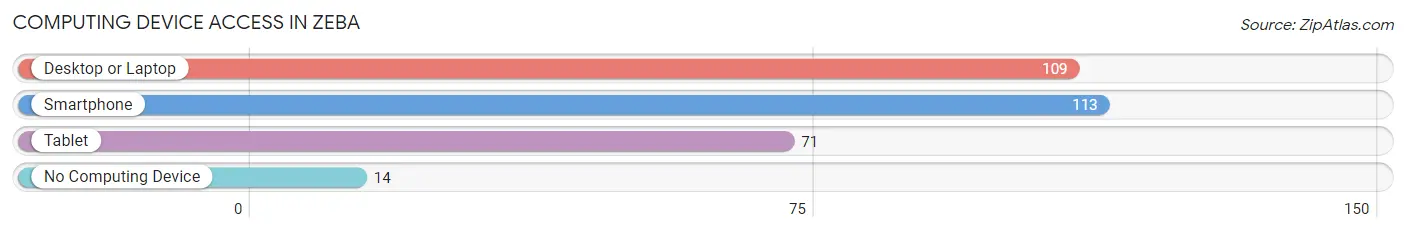
| Device Type | # Households | % Households |
| Desktop or Laptop | 109 | 73.7% |
| Smartphone | 113 | 76.3% |
| Tablet | 71 | 48.0% |
| No Computing Device | 14 | 9.5% |
| Total | 148 | 100.0% |
Internet Access in Zeba
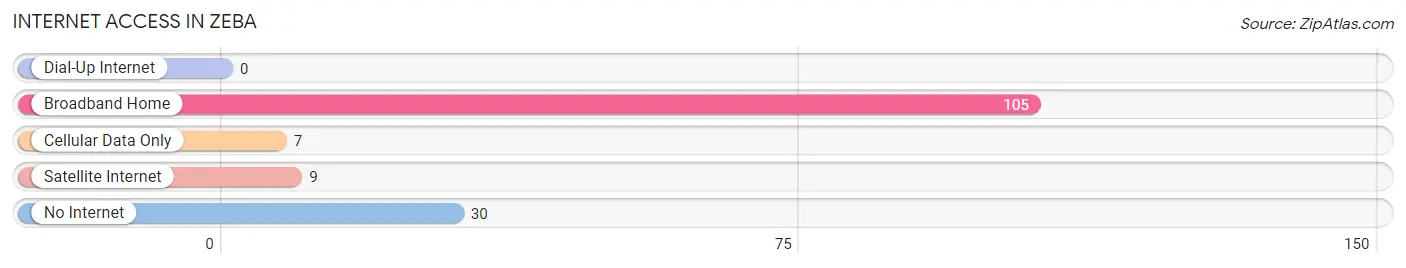
| Internet Type | # Households | % Households |
| Dial-Up Internet | 0 | 0.0% |
| Broadband Home | 105 | 71.0% |
| Cellular Data Only | 7 | 4.7% |
| Satellite Internet | 9 | 6.1% |
| No Internet | 30 | 20.3% |
| Total | 148 | 100.0% |
Zeba Summary
Zeba is a small unincorporated community located in the Upper Peninsula of Michigan. It is situated in the western part of Menominee County, approximately 10 miles south of the city of Menominee. The population of Zeba was estimated to be around 200 people in 2000.
History
The area that is now Zeba was first settled in the late 1800s by a group of Finnish immigrants. The settlement was originally known as “Finn Town” and was located near the Menominee River. The name was later changed to Zeba, which is derived from the Finnish word for “lake”.
The first post office in Zeba was established in 1891 and the first school was built in 1895. The community grew slowly over the years and by the early 1900s, it had become a thriving logging and farming community.
In the 1920s, the area experienced a boom in the lumber industry. Several sawmills were built in the area and the population of Zeba grew rapidly. The town also became a popular tourist destination, with several resorts and lodges being built in the area.
Geography
Zeba is located in the western part of Menominee County, approximately 10 miles south of the city of Menominee. The community is situated on the Menominee River, which is a tributary of Lake Michigan.
The terrain in the area is mostly flat, with some rolling hills. The area is heavily forested, with a mix of hardwood and coniferous trees. The climate in the area is generally mild, with cold winters and warm summers.
Economy
The economy of Zeba is largely based on tourism and logging. The area is home to several resorts and lodges, which attract visitors from all over the region. The logging industry is also an important part of the local economy, with several sawmills located in the area.
In addition to these industries, Zeba is also home to several small businesses, including a grocery store, a hardware store, and a gas station.
Demographics
The population of Zeba was estimated to be around 200 people in 2000. The racial makeup of the town was 97.5% White, 0.5% Native American, and 2.0% other. The median household income in the town was $30,000.
The majority of the population is of Finnish descent, with many of the residents having immigrated to the area in the late 1800s. The town also has a small Native American population, with many of the residents being members of the Menominee tribe.
Conclusion
Zeba is a small unincorporated community located in the Upper Peninsula of Michigan. It is situated in the western part of Menominee County, approximately 10 miles south of the city of Menominee. The population of Zeba was estimated to be around 200 people in 2000.
The area was first settled in the late 1800s by a group of Finnish immigrants and the town has since become a popular tourist destination. The economy of Zeba is largely based on tourism and logging, with several resorts and sawmills located in the area. The majority of the population is of Finnish descent, with many of the residents having immigrated to the area in the late 1800s.
Common Questions
What is Per Capita Income in Zeba?
Per Capita income in Zeba is $21,510.
What is the Median Family Income in Zeba?
Median Family Income in Zeba is $50,417.
What is the Median Household income in Zeba?
Median Household Income in Zeba is $36,250.
What is Income or Wage Gap in Zeba?
Income or Wage Gap in Zeba is 41.6%.
Women in Zeba earn 58.4 cents for every dollar earned by a man.
What is Inequality or Gini Index in Zeba?
Inequality or Gini Index in Zeba is 0.47.
What is the Total Population of Zeba?
Total Population of Zeba is 382.
What is the Total Male Population of Zeba?
Total Male Population of Zeba is 165.
What is the Total Female Population of Zeba?
Total Female Population of Zeba is 217.
What is the Ratio of Males per 100 Females in Zeba?
There are 76.04 Males per 100 Females in Zeba.
What is the Ratio of Females per 100 Males in Zeba?
There are 131.52 Females per 100 Males in Zeba.
What is the Median Population Age in Zeba?
Median Population Age in Zeba is 44.2 Years.
What is the Average Family Size in Zeba
Average Family Size in Zeba is 3.3 People.
What is the Average Household Size in Zeba
Average Household Size in Zeba is 2.6 People.
How Large is the Labor Force in Zeba?
There are 112 People in the Labor Forcein in Zeba.
What is the Percentage of People in the Labor Force in Zeba?
35.7% of People are in the Labor Force in Zeba.