Zip Codes with the Highest Percentage of Population Employed in Security & Protection in Lansing, MI
RELATED REPORTS & OPTIONS
Security & Protection
Lansing
Compare Zip Codes
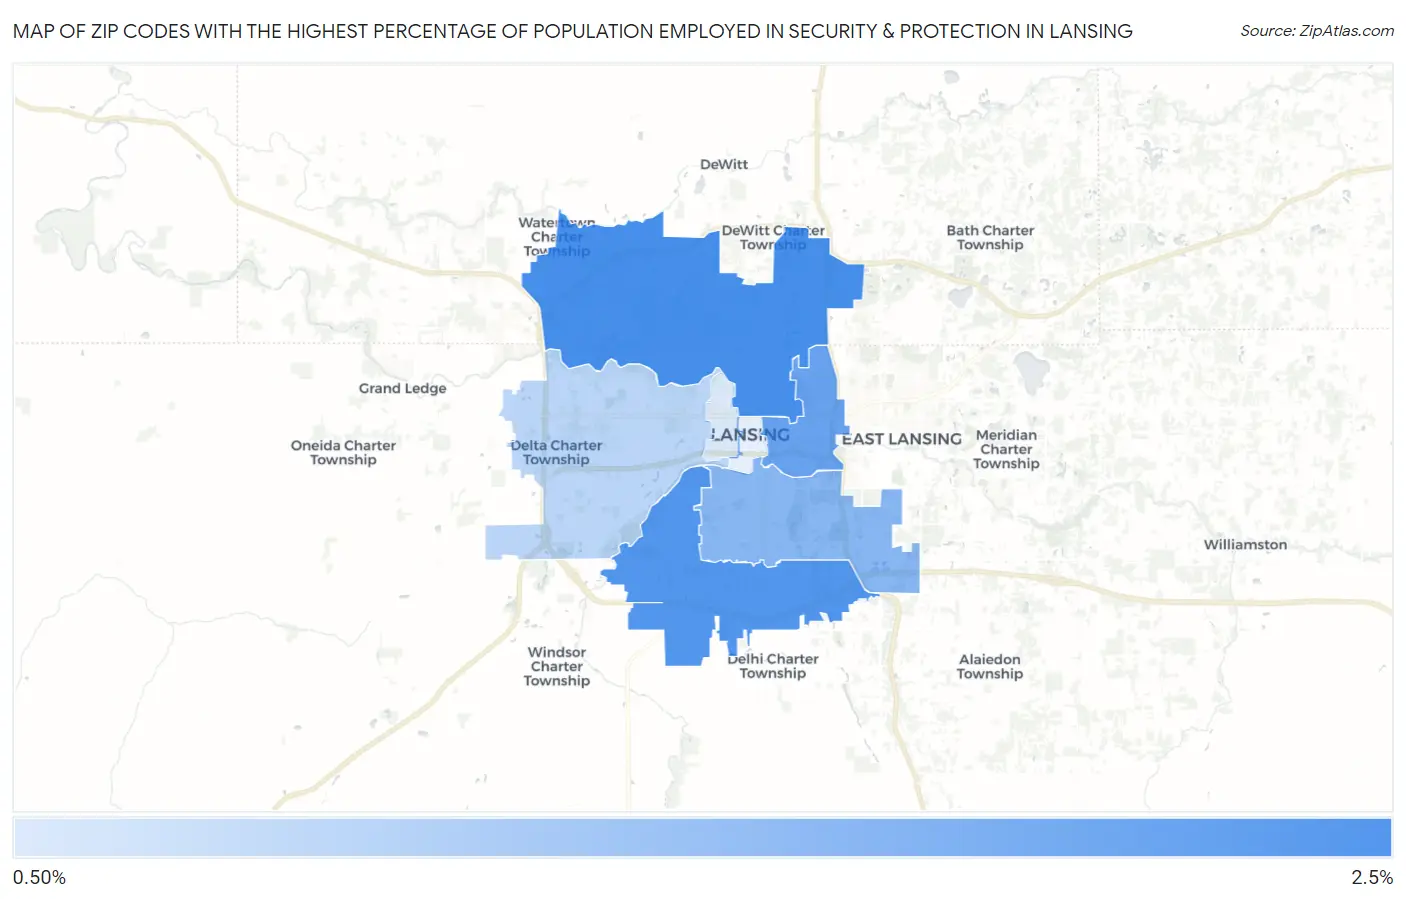
Map of Zip Codes with the Highest Percentage of Population Employed in Security & Protection in Lansing
0.82%
2.1%
Zip Codes with the Highest Percentage of Population Employed in Security & Protection in Lansing, MI
| Zip Code | % Employed | vs State | vs National | |
| 1. | 48906 | 2.1% | 1.6%(+0.485)#257 | 2.1%(-0.022)#11,731 |
| 2. | 48911 | 2.0% | 1.6%(+0.376)#285 | 2.1%(-0.131)#12,441 |
| 3. | 48912 | 1.8% | 1.6%(+0.206)#337 | 2.1%(-0.301)#13,581 |
| 4. | 48910 | 1.6% | 1.6%(-0.071)#433 | 2.1%(-0.578)#15,635 |
| 5. | 48917 | 1.1% | 1.6%(-0.524)#580 | 2.1%(-1.03)#19,160 |
| 6. | 48915 | 0.82% | 1.6%(-0.819)#674 | 2.1%(-1.33)#21,286 |
1
Common Questions
What are the Top 5 Zip Codes with the Highest Percentage of Population Employed in Security & Protection in Lansing, MI?
Top 5 Zip Codes with the Highest Percentage of Population Employed in Security & Protection in Lansing, MI are:
What zip code has the Highest Percentage of Population Employed in Security & Protection in Lansing, MI?
48906 has the Highest Percentage of Population Employed in Security & Protection in Lansing, MI with 2.1%.
What is the Percentage of Population Employed in Security & Protection in Lansing, MI?
Percentage of Population Employed in Security & Protection in Lansing is 1.6%.
What is the Percentage of Population Employed in Security & Protection in Michigan?
Percentage of Population Employed in Security & Protection in Michigan is 1.6%.
What is the Percentage of Population Employed in Security & Protection in the United States?
Percentage of Population Employed in Security & Protection in the United States is 2.1%.