Zip Codes with the Highest Percentage of Population Employed in Security & Protection in Bay City, MI
RELATED REPORTS & OPTIONS
Security & Protection
Bay City
Compare Zip Codes
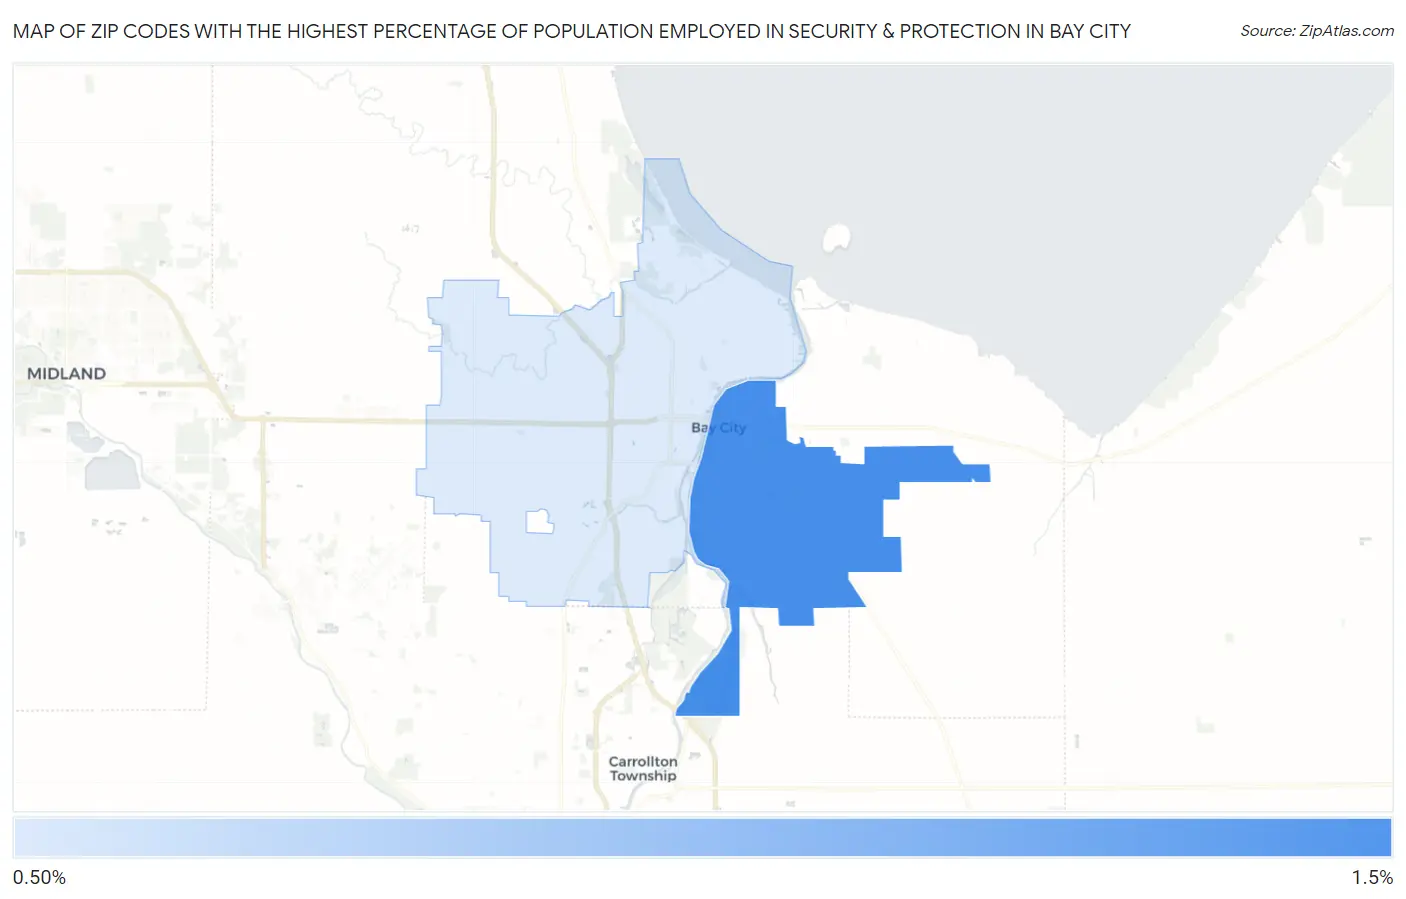
Map of Zip Codes with the Highest Percentage of Population Employed in Security & Protection in Bay City
1.1%
1.5%
Zip Codes with the Highest Percentage of Population Employed in Security & Protection in Bay City, MI
| Zip Code | % Employed | vs State | vs National | |
| 1. | 48708 | 1.5% | 1.6%(-0.152)#458 | 2.1%(-0.659)#16,293 |
| 2. | 48706 | 1.1% | 1.6%(-0.512)#572 | 2.1%(-1.02)#19,064 |
1
Common Questions
What are the Top Zip Codes with the Highest Percentage of Population Employed in Security & Protection in Bay City, MI?
Top Zip Codes with the Highest Percentage of Population Employed in Security & Protection in Bay City, MI are:
What zip code has the Highest Percentage of Population Employed in Security & Protection in Bay City, MI?
48708 has the Highest Percentage of Population Employed in Security & Protection in Bay City, MI with 1.5%.
What is the Percentage of Population Employed in Security & Protection in Bay City, MI?
Percentage of Population Employed in Security & Protection in Bay City is 1.8%.
What is the Percentage of Population Employed in Security & Protection in Michigan?
Percentage of Population Employed in Security & Protection in Michigan is 1.6%.
What is the Percentage of Population Employed in Security & Protection in the United States?
Percentage of Population Employed in Security & Protection in the United States is 2.1%.