Michigamme, MI Map & Demographics
Michigamme Map
Michigamme Overview
$26,893
PER CAPITA INCOME
$60,000
AVG FAMILY INCOME
$42,917
AVG HOUSEHOLD INCOME
$12,082
FAMILY INCOME DEFICIT
0.41
INEQUALITY / GINI INDEX
226
TOTAL POPULATION
112
MALE POPULATION
114
FEMALE POPULATION
98.25
MALES / 100 FEMALES
101.79
FEMALES / 100 MALES
56.4
MEDIAN AGE
2.6
AVG FAMILY SIZE
2.2
AVG HOUSEHOLD SIZE
86
LABOR FORCE [ PEOPLE ]
42.8%
PERCENT IN LABOR FORCE
17.4%
UNEMPLOYMENT RATE
Michigamme Zip Codes
Michigamme Area Codes
Income in Michigamme
Income Overview in Michigamme
Per Capita Income in Michigamme is $26,893, while median incomes of families and households are $60,000 and $42,917 respectively.
| Characteristic | Number | Measure |
| Per Capita Income | 226 | $26,893 |
| Median Family Income | 64 | $60,000 |
| Mean Family Income | 64 | $63,614 |
| Median Household Income | 101 | $42,917 |
| Mean Household Income | 101 | $54,840 |
| Income Deficit | 64 | $12,082 |
| Wage / Income Gap (%) | 226 | 0.00% |
| Wage / Income Gap ($) | 226 | 100.00¢ per $1 |
| Gini / Inequality Index | 226 | 0.41 |
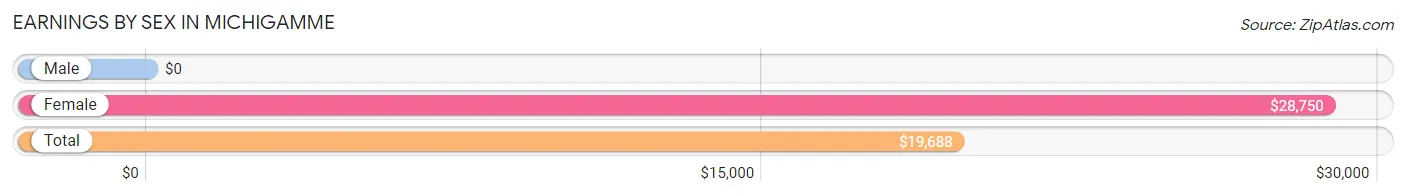
Earnings by Sex in Michigamme
| Sex | Number | Average Earnings |
| Male | 45 (60.0%) | $0 |
| Female | 30 (40.0%) | $28,750 |
| Total | 75 (100.0%) | $19,688 |
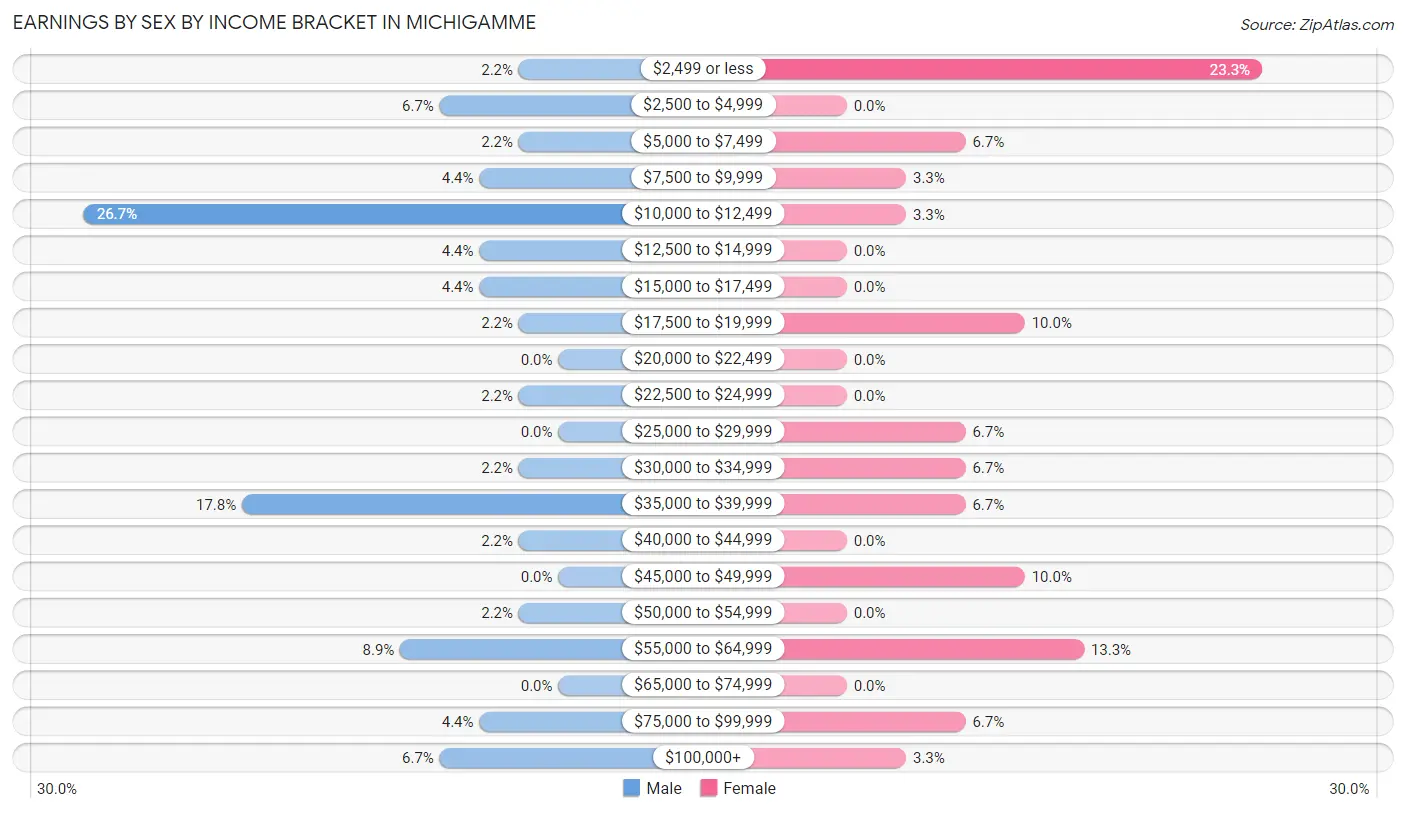
Earnings by Sex by Income Bracket in Michigamme
The most common earnings brackets in Michigamme are $10,000 to $12,499 for men (12 | 26.7%) and $2,499 or less for women (7 | 23.3%).
| Income | Male | Female |
| $2,499 or less | 1 (2.2%) | 7 (23.3%) |
| $2,500 to $4,999 | 3 (6.7%) | 0 (0.0%) |
| $5,000 to $7,499 | 1 (2.2%) | 2 (6.7%) |
| $7,500 to $9,999 | 2 (4.4%) | 1 (3.3%) |
| $10,000 to $12,499 | 12 (26.7%) | 1 (3.3%) |
| $12,500 to $14,999 | 2 (4.4%) | 0 (0.0%) |
| $15,000 to $17,499 | 2 (4.4%) | 0 (0.0%) |
| $17,500 to $19,999 | 1 (2.2%) | 3 (10.0%) |
| $20,000 to $22,499 | 0 (0.0%) | 0 (0.0%) |
| $22,500 to $24,999 | 1 (2.2%) | 0 (0.0%) |
| $25,000 to $29,999 | 0 (0.0%) | 2 (6.7%) |
| $30,000 to $34,999 | 1 (2.2%) | 2 (6.7%) |
| $35,000 to $39,999 | 8 (17.8%) | 2 (6.7%) |
| $40,000 to $44,999 | 1 (2.2%) | 0 (0.0%) |
| $45,000 to $49,999 | 0 (0.0%) | 3 (10.0%) |
| $50,000 to $54,999 | 1 (2.2%) | 0 (0.0%) |
| $55,000 to $64,999 | 4 (8.9%) | 4 (13.3%) |
| $65,000 to $74,999 | 0 (0.0%) | 0 (0.0%) |
| $75,000 to $99,999 | 2 (4.4%) | 2 (6.7%) |
| $100,000+ | 3 (6.7%) | 1 (3.3%) |
| Total | 45 (100.0%) | 30 (100.0%) |
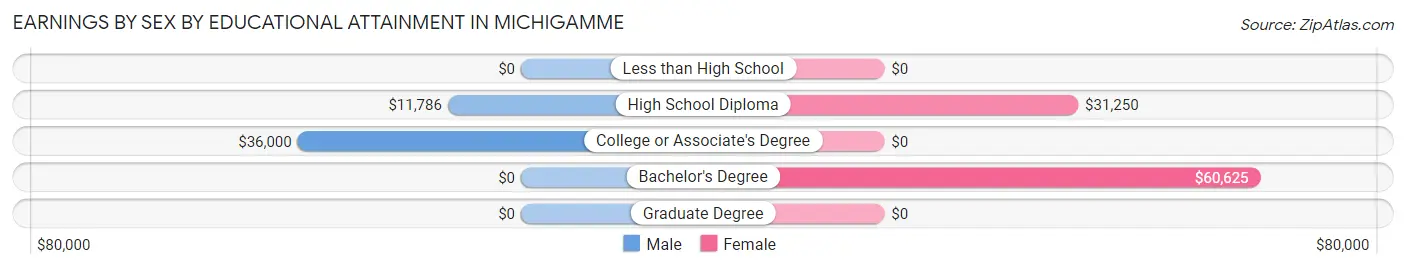
Earnings by Sex by Educational Attainment in Michigamme
Average earnings in Michigamme are $27,500 for men and $28,750 for women, a difference of 4.3%. Men with an educational attainment of college or associate's degree enjoy the highest average annual earnings of $36,000, while those with high school diploma education earn the least with $11,786. Women with an educational attainment of bachelor's degree earn the most with the average annual earnings of $60,625, while those with high school diploma education have the smallest earnings of $31,250.
| Educational Attainment | Male Income | Female Income |
| Less than High School | - | - |
| High School Diploma | $11,786 | $31,250 |
| College or Associate's Degree | $36,000 | $0 |
| Bachelor's Degree | - | - |
| Graduate Degree | - | - |
| Total | $27,500 | $28,750 |
Family Income in Michigamme
Family Income Brackets in Michigamme
According to the Michigamme family income data, there are 14 families falling into the $50,000 to $74,999 income range, which is the most common income bracket and makes up 21.9% of all families. Conversely, the $150,000 to $199,999 income bracket is the least frequent group with only 1 families (1.6%) belonging to this category.
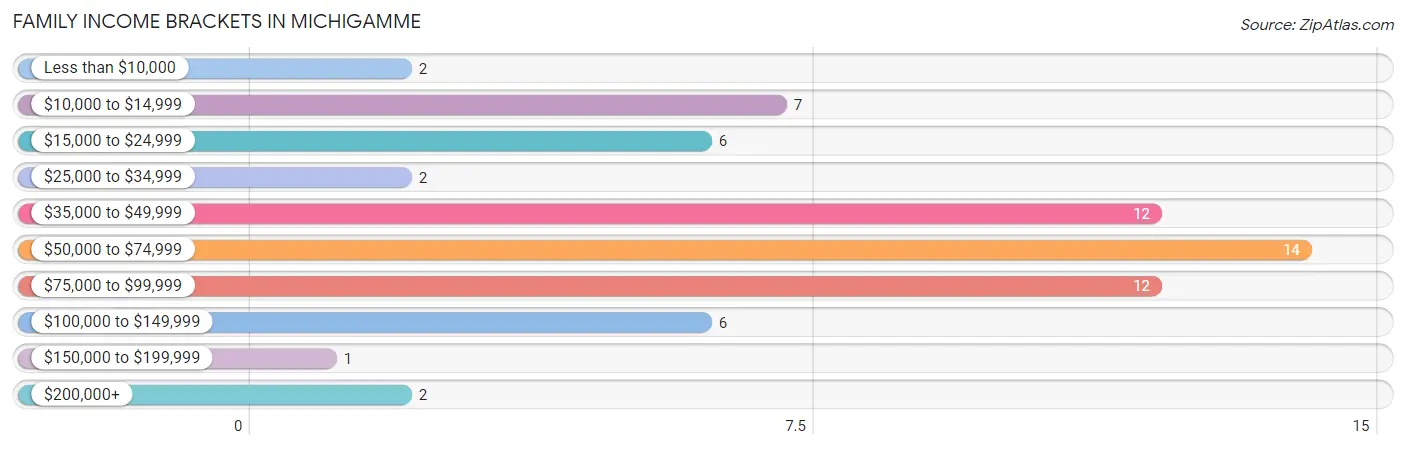
| Income Bracket | # Families | % Families |
| Less than $10,000 | 2 | 3.1% |
| $10,000 to $14,999 | 7 | 10.9% |
| $15,000 to $24,999 | 6 | 9.4% |
| $25,000 to $34,999 | 2 | 3.1% |
| $35,000 to $49,999 | 12 | 18.8% |
| $50,000 to $74,999 | 14 | 21.9% |
| $75,000 to $99,999 | 12 | 18.8% |
| $100,000 to $149,999 | 6 | 9.4% |
| $150,000 to $199,999 | 1 | 1.6% |
| $200,000+ | 2 | 3.1% |
Family Income by Famaliy Size in Michigamme
2-person families (47 | 73.4%) account for the highest median family income in Michigamme with $72,083 per family, while 2-person families (47 | 73.4%) have the highest median income of $36,042 per family member.
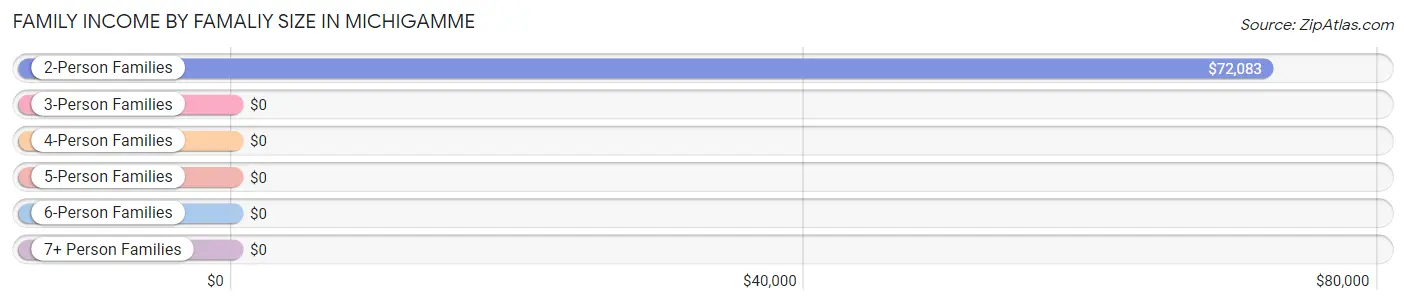
| Income Bracket | # Families | Median Income |
| 2-Person Families | 47 (73.4%) | $72,083 |
| 3-Person Families | 4 (6.2%) | $0 |
| 4-Person Families | 12 (18.8%) | $0 |
| 5-Person Families | 1 (1.6%) | $0 |
| 6-Person Families | 0 (0.0%) | $0 |
| 7+ Person Families | 0 (0.0%) | $0 |
| Total | 64 (100.0%) | $60,000 |
Family Income by Number of Earners in Michigamme
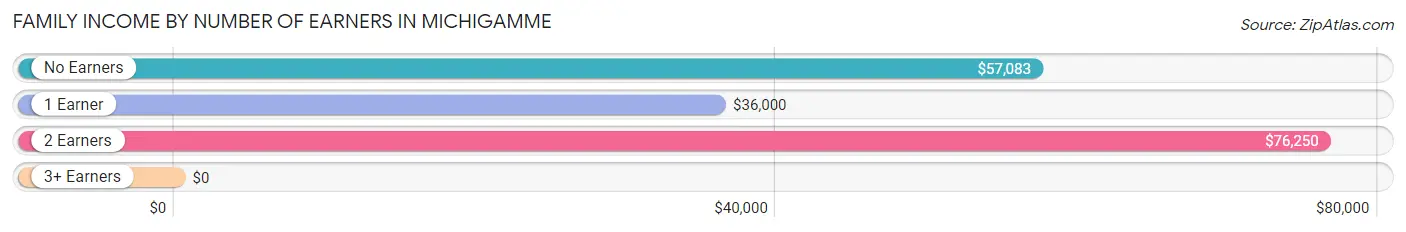
| Number of Earners | # Families | Median Income |
| No Earners | 31 (48.4%) | $57,083 |
| 1 Earner | 20 (31.2%) | $36,000 |
| 2 Earners | 13 (20.3%) | $76,250 |
| 3+ Earners | 0 (0.0%) | $0 |
| Total | 64 (100.0%) | $60,000 |
Household Income in Michigamme
Household Income Brackets in Michigamme
With 26 households falling in the category, the $15,000 to $24,999 income range is the most frequent in Michigamme, accounting for 25.7% of all households. In contrast, only 1 households (1.0%) fall into the $150,000 to $199,999 income bracket, making it the least populous group.
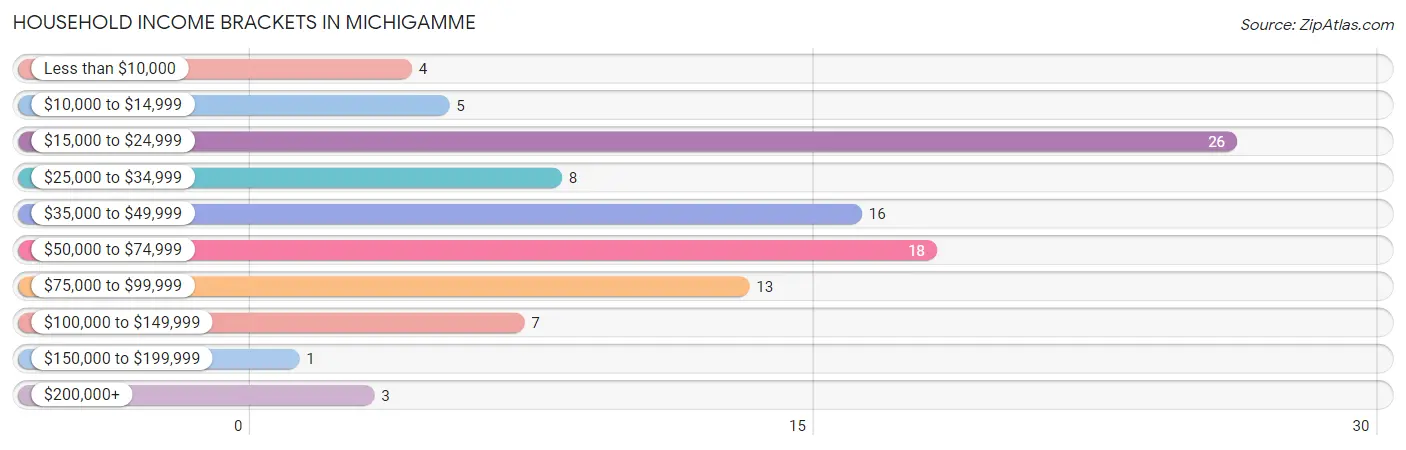
| Income Bracket | # Households | % Households |
| Less than $10,000 | 4 | 4.0% |
| $10,000 to $14,999 | 5 | 5.0% |
| $15,000 to $24,999 | 26 | 25.7% |
| $25,000 to $34,999 | 8 | 7.9% |
| $35,000 to $49,999 | 16 | 15.8% |
| $50,000 to $74,999 | 18 | 17.8% |
| $75,000 to $99,999 | 13 | 12.9% |
| $100,000 to $149,999 | 7 | 6.9% |
| $150,000 to $199,999 | 1 | 1.0% |
| $200,000+ | 3 | 3.0% |
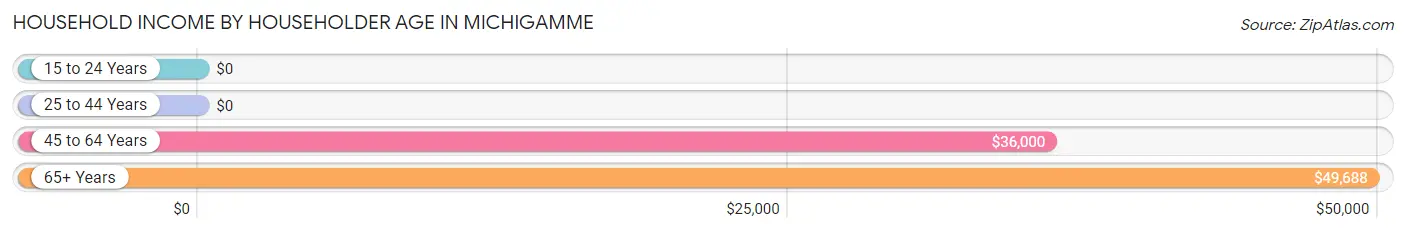
Household Income by Householder Age in Michigamme
The median household income in Michigamme is $42,917, with the highest median household income of $49,688 found in the 65+ years age bracket for the primary householder. A total of 53 households (52.5%) fall into this category.
| Income Bracket | # Households | Median Income |
| 15 to 24 Years | 0 (0.0%) | $0 |
| 25 to 44 Years | 8 (7.9%) | $0 |
| 45 to 64 Years | 40 (39.6%) | $36,000 |
| 65+ Years | 53 (52.5%) | $49,688 |
| Total | 101 (100.0%) | $42,917 |
Poverty in Michigamme
Income Below Poverty by Sex and Age in Michigamme
With 28.6% poverty level for males and 24.6% for females among the residents of Michigamme, 16 and 17 year old males and 18 to 24 year old females are the most vulnerable to poverty, with 2 males (100.0%) and 4 females (100.0%) in their respective age groups living below the poverty level.
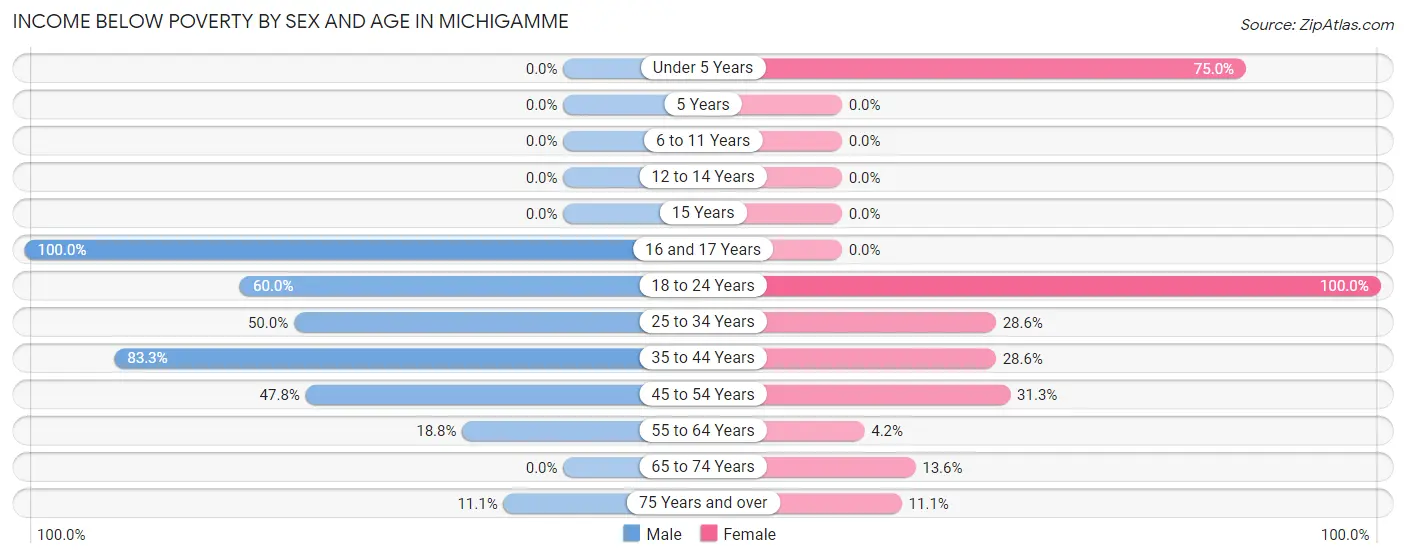
| Age Bracket | Male | Female |
| Under 5 Years | 0 (0.0%) | 9 (75.0%) |
| 5 Years | 0 (0.0%) | 0 (0.0%) |
| 6 to 11 Years | 0 (0.0%) | 0 (0.0%) |
| 12 to 14 Years | 0 (0.0%) | 0 (0.0%) |
| 15 Years | 0 (0.0%) | 0 (0.0%) |
| 16 and 17 Years | 2 (100.0%) | 0 (0.0%) |
| 18 to 24 Years | 9 (60.0%) | 4 (100.0%) |
| 25 to 34 Years | 1 (50.0%) | 2 (28.6%) |
| 35 to 44 Years | 5 (83.3%) | 2 (28.6%) |
| 45 to 54 Years | 11 (47.8%) | 5 (31.2%) |
| 55 to 64 Years | 3 (18.8%) | 1 (4.2%) |
| 65 to 74 Years | 0 (0.0%) | 3 (13.6%) |
| 75 Years and over | 1 (11.1%) | 2 (11.1%) |
| Total | 32 (28.6%) | 28 (24.6%) |
Income Above Poverty by Sex and Age in Michigamme
According to the poverty statistics in Michigamme, males aged under 5 years and females aged 12 to 14 years are the age groups that are most secure financially, with 100.0% of males and 100.0% of females in these age groups living above the poverty line.
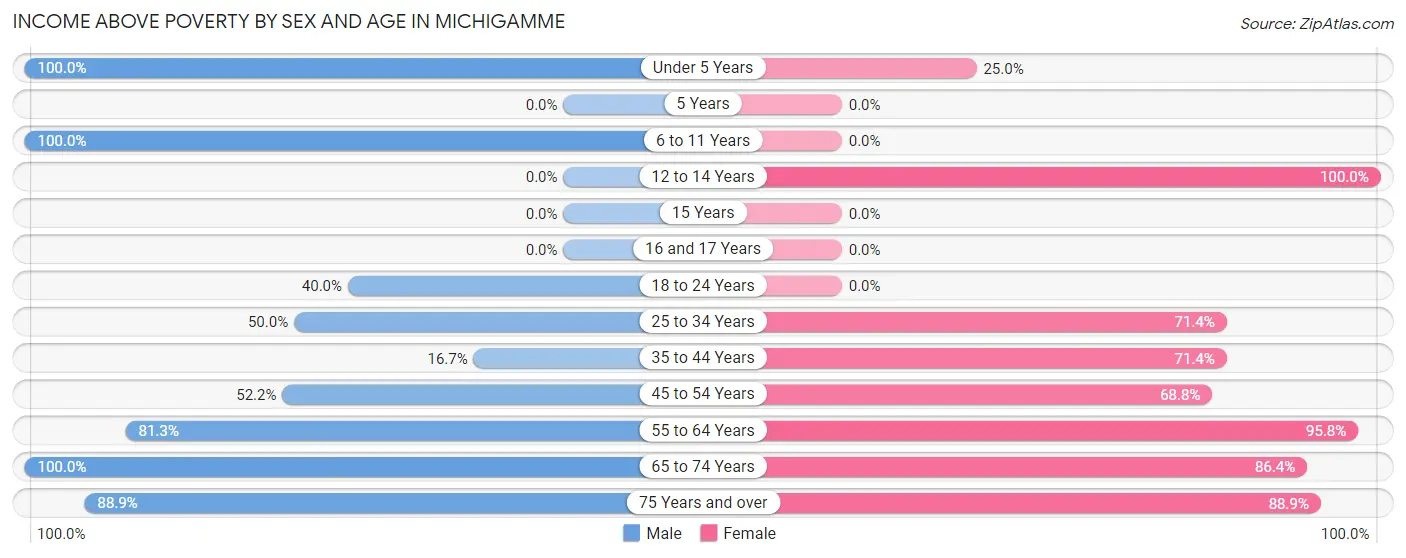
| Age Bracket | Male | Female |
| Under 5 Years | 4 (100.0%) | 3 (25.0%) |
| 5 Years | 0 (0.0%) | 0 (0.0%) |
| 6 to 11 Years | 5 (100.0%) | 0 (0.0%) |
| 12 to 14 Years | 0 (0.0%) | 4 (100.0%) |
| 15 Years | 0 (0.0%) | 0 (0.0%) |
| 16 and 17 Years | 0 (0.0%) | 0 (0.0%) |
| 18 to 24 Years | 6 (40.0%) | 0 (0.0%) |
| 25 to 34 Years | 1 (50.0%) | 5 (71.4%) |
| 35 to 44 Years | 1 (16.7%) | 5 (71.4%) |
| 45 to 54 Years | 12 (52.2%) | 11 (68.8%) |
| 55 to 64 Years | 13 (81.2%) | 23 (95.8%) |
| 65 to 74 Years | 30 (100.0%) | 19 (86.4%) |
| 75 Years and over | 8 (88.9%) | 16 (88.9%) |
| Total | 80 (71.4%) | 86 (75.4%) |
Income Below Poverty Among Married-Couple Families in Michigamme
The poverty statistics for married-couple families in Michigamme show that 13.5% or 7 of the total 52 families live below the poverty line. Families with 1 or 2 children have the highest poverty rate of 42.9%, comprising of 6 families. On the other hand, families with no children have the lowest poverty rate of 2.6%, which includes 1 families.
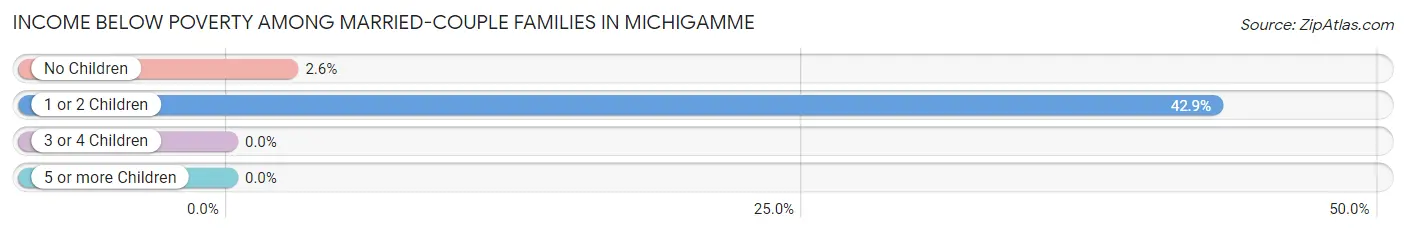
| Children | Above Poverty | Below Poverty |
| No Children | 37 (97.4%) | 1 (2.6%) |
| 1 or 2 Children | 8 (57.1%) | 6 (42.9%) |
| 3 or 4 Children | 0 (0.0%) | 0 (0.0%) |
| 5 or more Children | 0 (0.0%) | 0 (0.0%) |
| Total | 45 (86.5%) | 7 (13.5%) |
Income Below Poverty Among Single-Parent Households in Michigamme
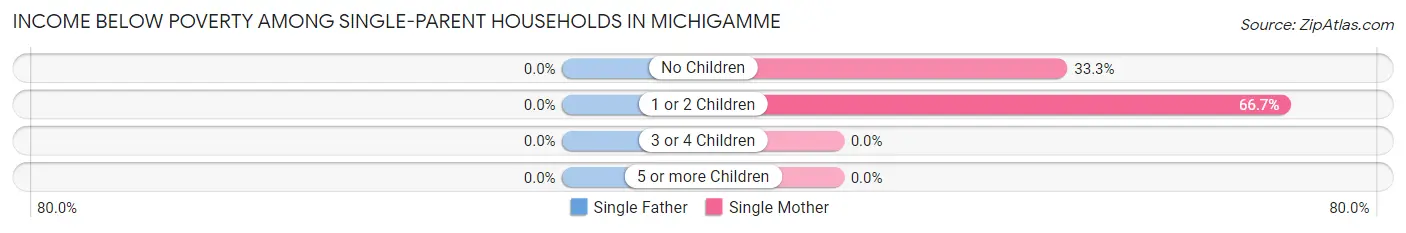
| Children | Single Father | Single Mother |
| No Children | 0 (0.0%) | 2 (33.3%) |
| 1 or 2 Children | 0 (0.0%) | 2 (66.7%) |
| 3 or 4 Children | 0 (0.0%) | 0 (0.0%) |
| 5 or more Children | 0 (0.0%) | 0 (0.0%) |
| Total | 0 (0.0%) | 4 (44.4%) |
Income Below Poverty Among Married-Couple vs Single-Parent Households in Michigamme
The poverty data for Michigamme shows that 7 of the married-couple family households (13.5%) and 4 of the single-parent households (33.3%) are living below the poverty level. Within the married-couple family households, those with 1 or 2 children have the highest poverty rate, with 6 households (42.9%) falling below the poverty line. Among the single-parent households, those with 1 or 2 children have the highest poverty rate, with 2 household (40.0%) living below poverty.
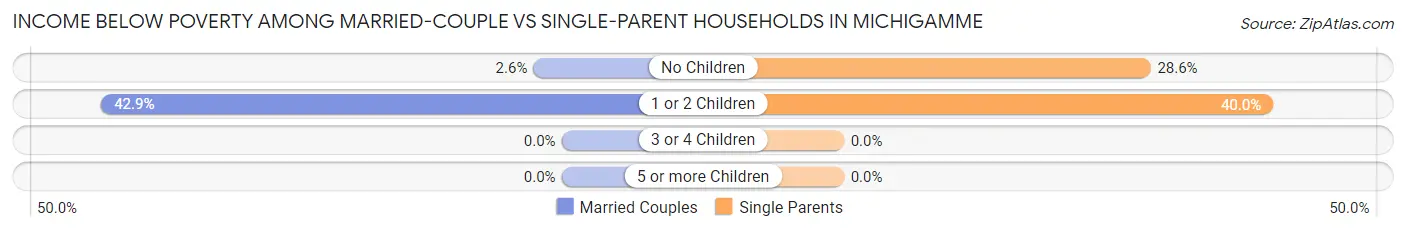
| Children | Married-Couple Families | Single-Parent Households |
| No Children | 1 (2.6%) | 2 (28.6%) |
| 1 or 2 Children | 6 (42.9%) | 2 (40.0%) |
| 3 or 4 Children | 0 (0.0%) | 0 (0.0%) |
| 5 or more Children | 0 (0.0%) | 0 (0.0%) |
| Total | 7 (13.5%) | 4 (33.3%) |
Race in Michigamme
The most populous races in Michigamme are White / Caucasian (214 | 94.7%), Hispanic or Latino (8 | 3.5%), and Two or more Races (8 | 3.5%).
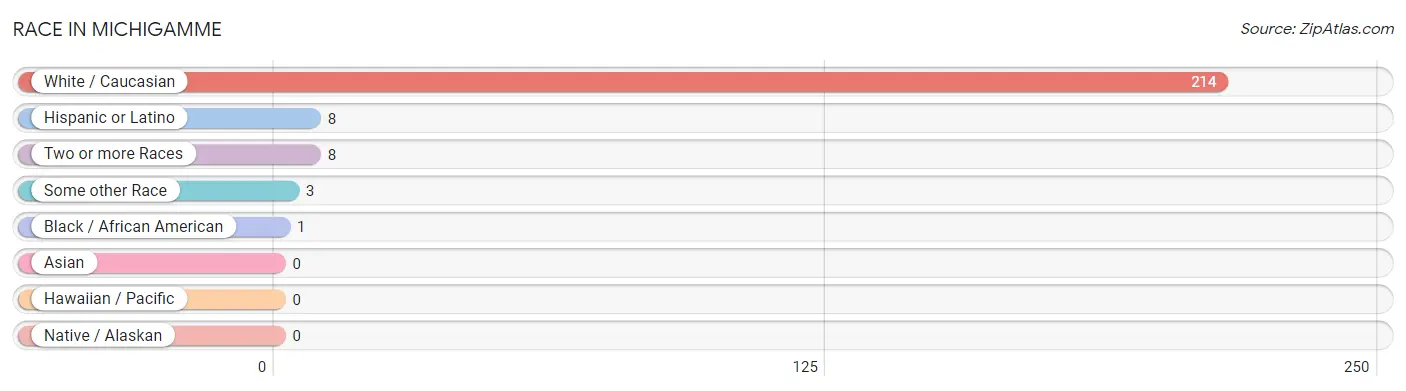
| Race | # Population | % Population |
| Asian | 0 | 0.0% |
| Black / African American | 1 | 0.4% |
| Hawaiian / Pacific | 0 | 0.0% |
| Hispanic or Latino | 8 | 3.5% |
| Native / Alaskan | 0 | 0.0% |
| White / Caucasian | 214 | 94.7% |
| Two or more Races | 8 | 3.5% |
| Some other Race | 3 | 1.3% |
| Total | 226 | 100.0% |
Ancestry in Michigamme
The most populous ancestries reported in Michigamme are German (45 | 19.9%), English (40 | 17.7%), Finnish (34 | 15.0%), Irish (31 | 13.7%), and French (23 | 10.2%), together accounting for 76.5% of all Michigamme residents.
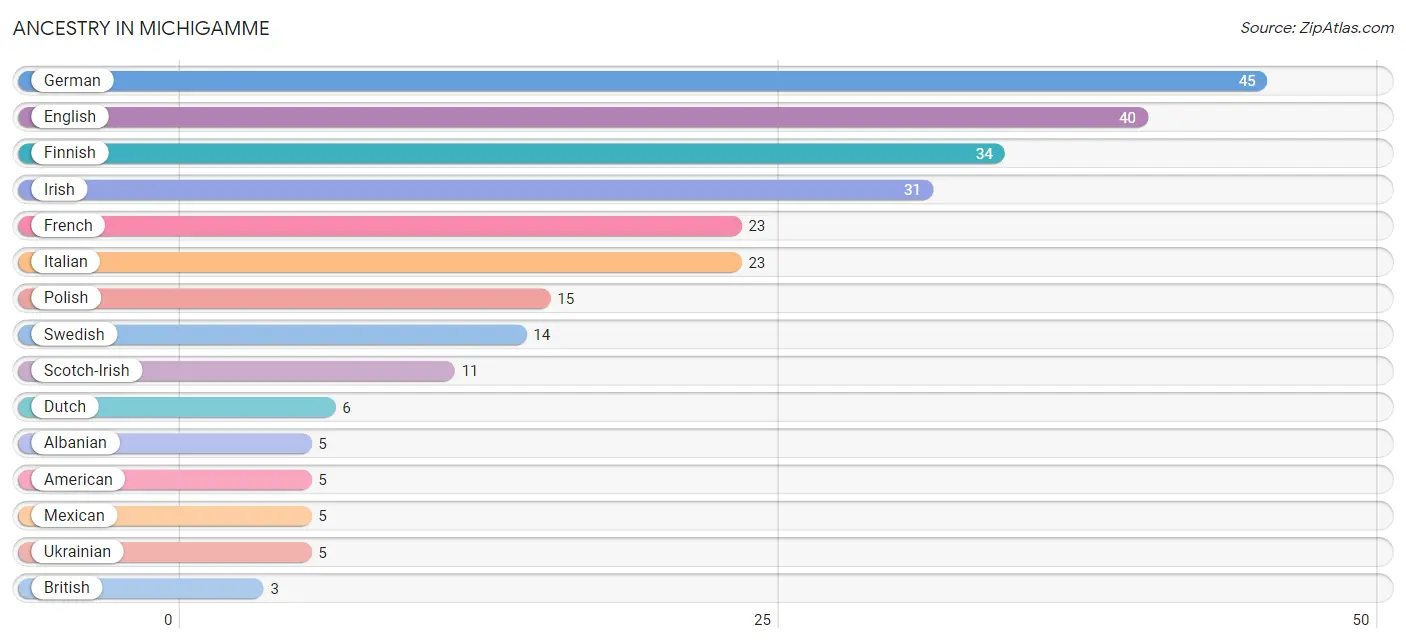
| Ancestry | # Population | % Population |
| Albanian | 5 | 2.2% |
| American | 5 | 2.2% |
| British | 3 | 1.3% |
| Danish | 1 | 0.4% |
| Dutch | 6 | 2.6% |
| English | 40 | 17.7% |
| European | 1 | 0.4% |
| Finnish | 34 | 15.0% |
| French | 23 | 10.2% |
| French Canadian | 3 | 1.3% |
| German | 45 | 19.9% |
| Irish | 31 | 13.7% |
| Italian | 23 | 10.2% |
| Mexican | 5 | 2.2% |
| Norwegian | 1 | 0.4% |
| Peruvian | 3 | 1.3% |
| Polish | 15 | 6.6% |
| Russian | 1 | 0.4% |
| Scotch-Irish | 11 | 4.9% |
| Scottish | 3 | 1.3% |
| Serbian | 1 | 0.4% |
| South American | 3 | 1.3% |
| Swedish | 14 | 6.2% |
| Ukrainian | 5 | 2.2% | View All 24 Rows |
Immigrants in Michigamme
The most numerous immigrant groups reported in Michigamme came from Europe (6 | 2.6%), Albania (4 | 1.8%), Eastern Europe (4 | 1.8%), Canada (2 | 0.9%), and Germany (2 | 0.9%), together accounting for 8.0% of all Michigamme residents.
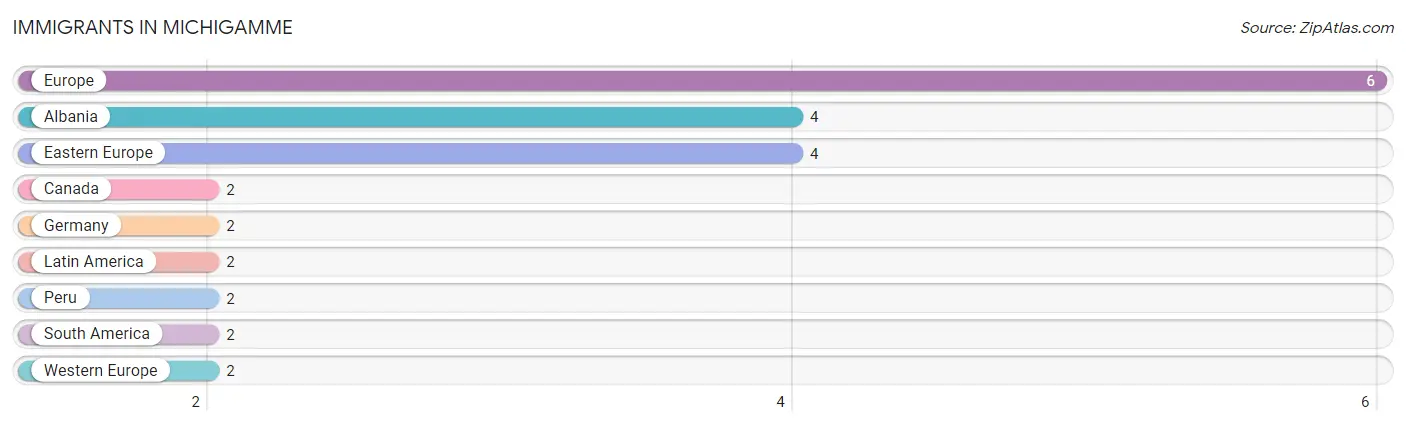
| Immigration Origin | # Population | % Population |
| Albania | 4 | 1.8% |
| Canada | 2 | 0.9% |
| Eastern Europe | 4 | 1.8% |
| Europe | 6 | 2.6% |
| Germany | 2 | 0.9% |
| Latin America | 2 | 0.9% |
| Peru | 2 | 0.9% |
| South America | 2 | 0.9% |
| Western Europe | 2 | 0.9% | View All 9 Rows |
Sex and Age in Michigamme
Sex and Age in Michigamme
The most populous age groups in Michigamme are 45 to 49 Years (17 | 15.2%) for men and 55 to 59 Years (14 | 12.3%) for women.
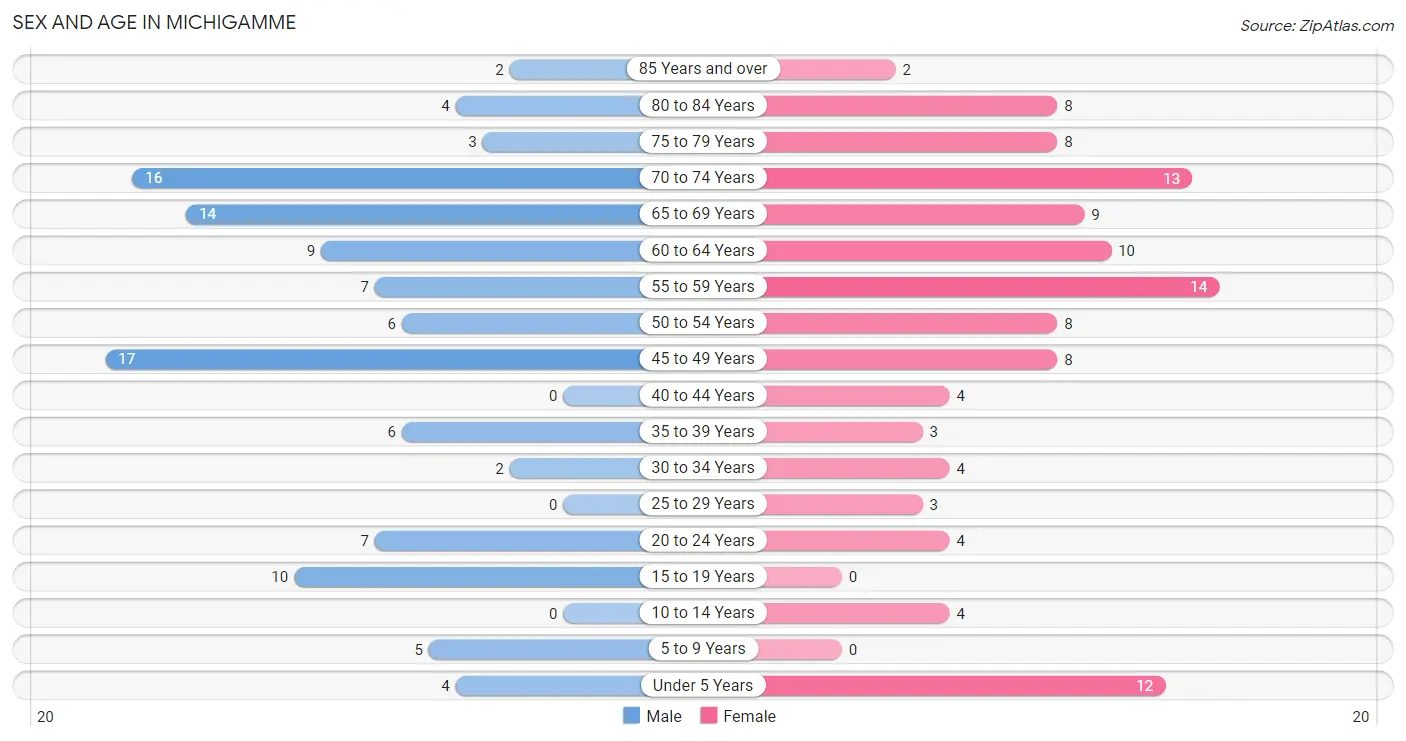
| Age Bracket | Male | Female |
| Under 5 Years | 4 (3.6%) | 12 (10.5%) |
| 5 to 9 Years | 5 (4.5%) | 0 (0.0%) |
| 10 to 14 Years | 0 (0.0%) | 4 (3.5%) |
| 15 to 19 Years | 10 (8.9%) | 0 (0.0%) |
| 20 to 24 Years | 7 (6.2%) | 4 (3.5%) |
| 25 to 29 Years | 0 (0.0%) | 3 (2.6%) |
| 30 to 34 Years | 2 (1.8%) | 4 (3.5%) |
| 35 to 39 Years | 6 (5.4%) | 3 (2.6%) |
| 40 to 44 Years | 0 (0.0%) | 4 (3.5%) |
| 45 to 49 Years | 17 (15.2%) | 8 (7.0%) |
| 50 to 54 Years | 6 (5.4%) | 8 (7.0%) |
| 55 to 59 Years | 7 (6.2%) | 14 (12.3%) |
| 60 to 64 Years | 9 (8.0%) | 10 (8.8%) |
| 65 to 69 Years | 14 (12.5%) | 9 (7.9%) |
| 70 to 74 Years | 16 (14.3%) | 13 (11.4%) |
| 75 to 79 Years | 3 (2.7%) | 8 (7.0%) |
| 80 to 84 Years | 4 (3.6%) | 8 (7.0%) |
| 85 Years and over | 2 (1.8%) | 2 (1.8%) |
| Total | 112 (100.0%) | 114 (100.0%) |
Families and Households in Michigamme
Median Family Size in Michigamme
The median family size in Michigamme is 2.64 persons per family, with single female/mother families (9 | 14.1%) accounting for the largest median family size of 3.56 persons per family. On the other hand, married-couple families (52 | 81.2%) represent the smallest median family size with 2.44 persons per family.
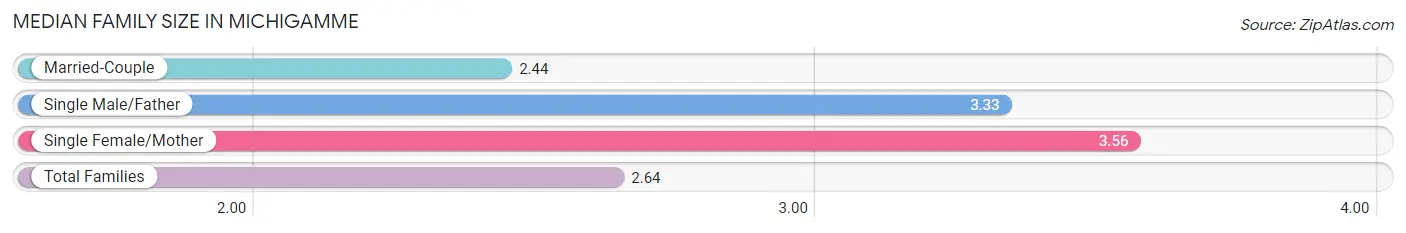
| Family Type | # Families | Family Size |
| Married-Couple | 52 (81.2%) | 2.44 |
| Single Male/Father | 3 (4.7%) | 3.33 |
| Single Female/Mother | 9 (14.1%) | 3.56 |
| Total Families | 64 (100.0%) | 2.64 |
Median Household Size in Michigamme
The median household size in Michigamme is 2.24 persons per household, with single female/mother households (9 | 8.9%) accounting for the largest median household size of 4.33 persons per household. non-family households (37 | 36.6%) represent the smallest median household size with 1.27 persons per household.
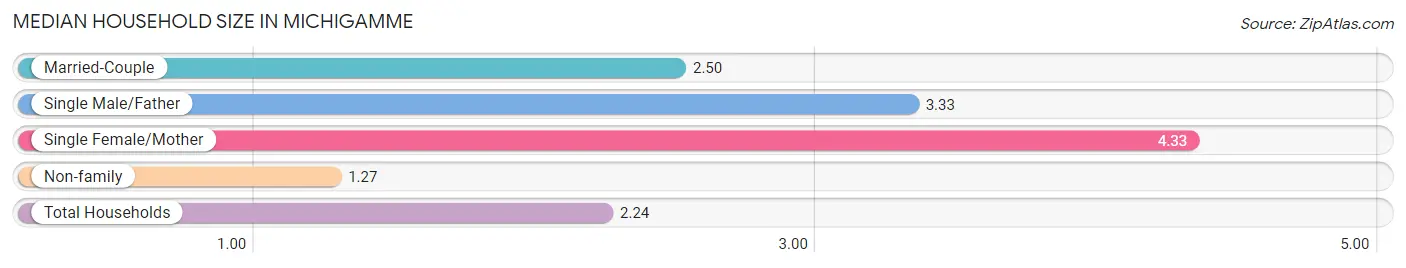
| Household Type | # Households | Household Size |
| Married-Couple | 52 (51.5%) | 2.50 |
| Single Male/Father | 3 (3.0%) | 3.33 |
| Single Female/Mother | 9 (8.9%) | 4.33 |
| Non-family | 37 (36.6%) | 1.27 |
| Total Households | 101 (100.0%) | 2.24 |
Household Size by Marriage Status in Michigamme
Out of a total of 101 households in Michigamme, 64 (63.4%) are family households, while 37 (36.6%) are nonfamily households. The most numerous type of family households are 2-person households, comprising 44, and the most common type of nonfamily households are 1-person households, comprising 30.
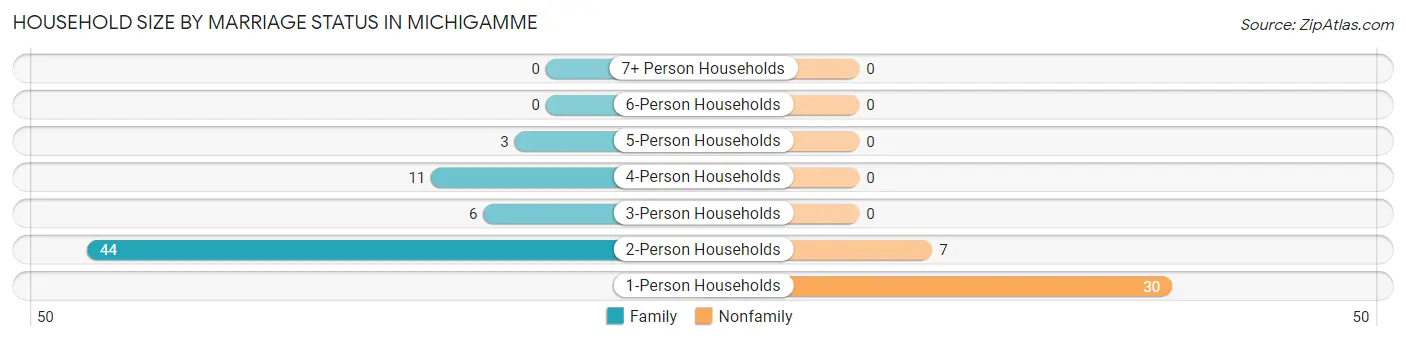
| Household Size | Family Households | Nonfamily Households |
| 1-Person Households | - | 30 (29.7%) |
| 2-Person Households | 44 (43.6%) | 7 (6.9%) |
| 3-Person Households | 6 (5.9%) | 0 (0.0%) |
| 4-Person Households | 11 (10.9%) | 0 (0.0%) |
| 5-Person Households | 3 (3.0%) | 0 (0.0%) |
| 6-Person Households | 0 (0.0%) | 0 (0.0%) |
| 7+ Person Households | 0 (0.0%) | 0 (0.0%) |
| Total | 64 (63.4%) | 37 (36.6%) |
Female Fertility in Michigamme
Fertility by Age in Michigamme
Average fertility rate in Michigamme is 154.0 births per 1,000 women. Women in the age bracket of 20 to 34 years have the highest fertility rate with 364.0 births per 1,000 women. Women in the age bracket of 20 to 34 years acount for 100.0% of all women with births.
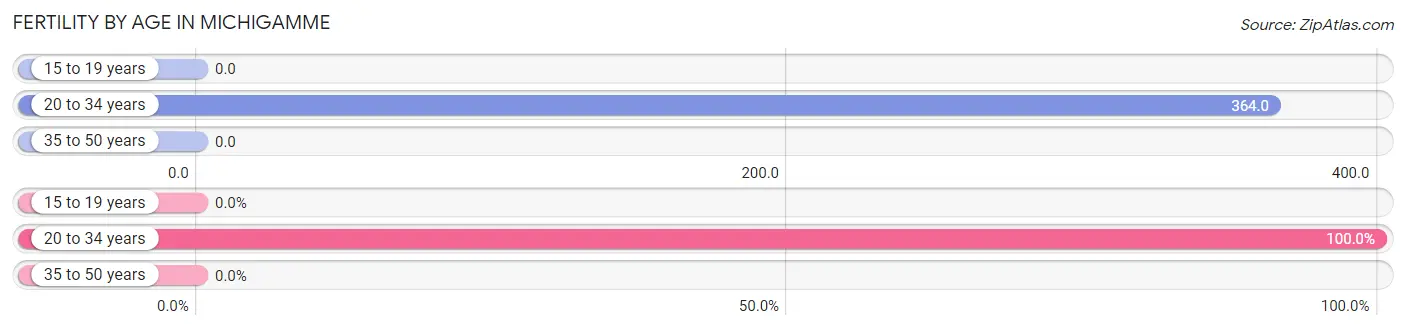
| Age Bracket | Women with Births | Births / 1,000 Women |
| 15 to 19 years | 0 (0.0%) | 0.0 |
| 20 to 34 years | 4 (100.0%) | 364.0 |
| 35 to 50 years | 0 (0.0%) | 0.0 |
| Total | 4 (100.0%) | 154.0 |
Fertility by Age by Marriage Status in Michigamme
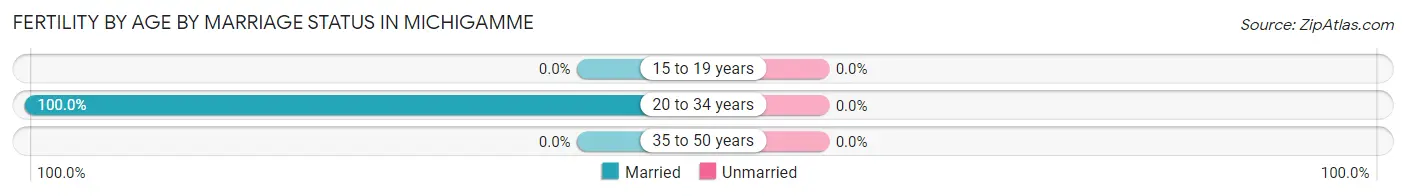
| Age Bracket | Married | Unmarried |
| 15 to 19 years | 0 (0.0%) | 0 (0.0%) |
| 20 to 34 years | 4 (100.0%) | 0 (0.0%) |
| 35 to 50 years | 0 (0.0%) | 0 (0.0%) |
| Total | 4 (100.0%) | 0 (0.0%) |
Fertility by Education in Michigamme
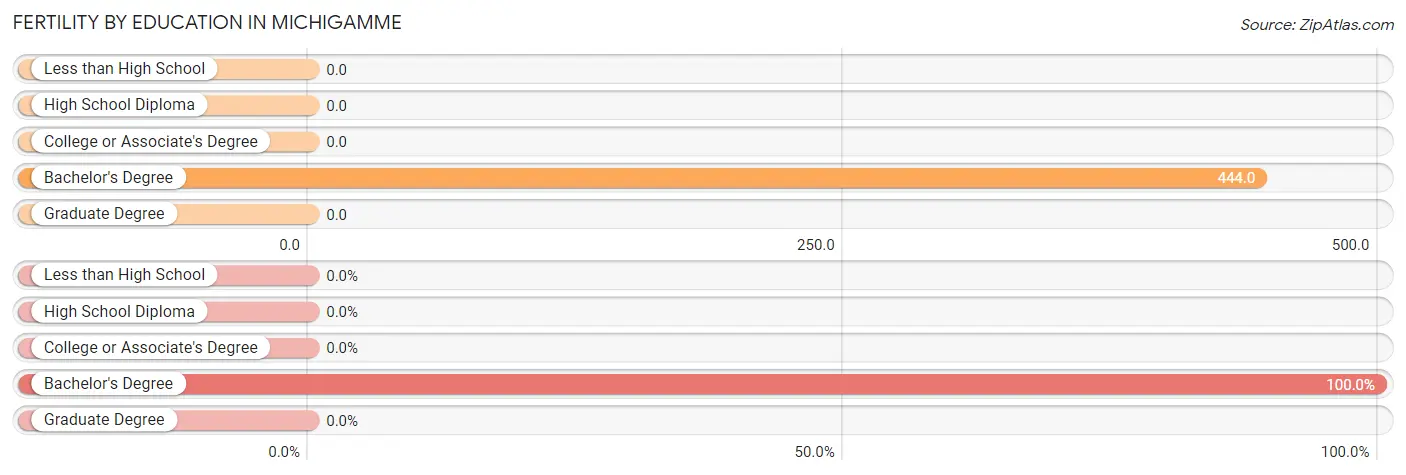
| Educational Attainment | Women with Births | Births / 1,000 Women |
| Less than High School | 0 (0.0%) | 0.0 |
| High School Diploma | 0 (0.0%) | 0.0 |
| College or Associate's Degree | 0 (0.0%) | 0.0 |
| Bachelor's Degree | 4 (100.0%) | 444.0 |
| Graduate Degree | 0 (0.0%) | 0.0 |
| Total | 4 (100.0%) | 154.0 |
Fertility by Education by Marriage Status in Michigamme
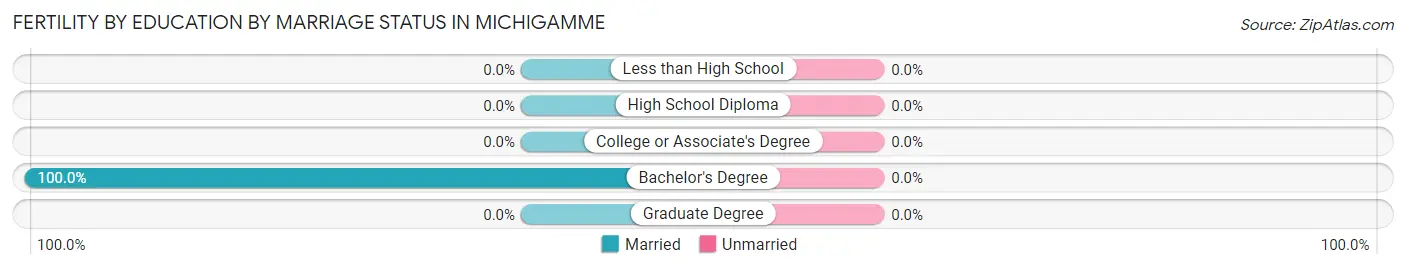
| Educational Attainment | Married | Unmarried |
| Less than High School | 0 (0.0%) | 0 (0.0%) |
| High School Diploma | 0 (0.0%) | 0 (0.0%) |
| College or Associate's Degree | 0 (0.0%) | 0 (0.0%) |
| Bachelor's Degree | 4 (100.0%) | 0 (0.0%) |
| Graduate Degree | 0 (0.0%) | 0 (0.0%) |
| Total | 4 (100.0%) | 0 (0.0%) |
Employment Characteristics in Michigamme
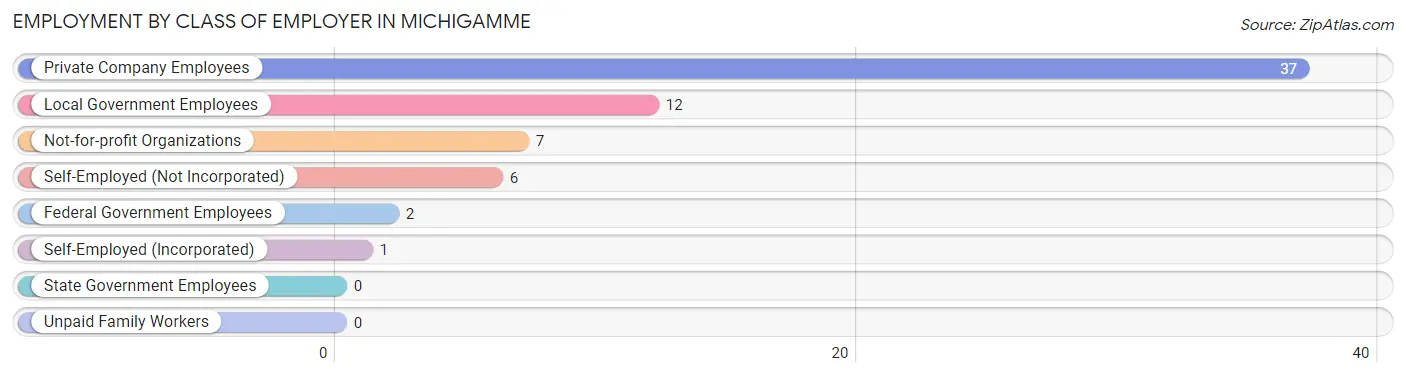
Employment by Class of Employer in Michigamme
Among the 65 employed individuals in Michigamme, private company employees (37 | 56.9%), local government employees (12 | 18.5%), and not-for-profit organizations (7 | 10.8%) make up the most common classes of employment.
| Employer Class | # Employees | % Employees |
| Private Company Employees | 37 | 56.9% |
| Self-Employed (Incorporated) | 1 | 1.5% |
| Self-Employed (Not Incorporated) | 6 | 9.2% |
| Not-for-profit Organizations | 7 | 10.8% |
| Local Government Employees | 12 | 18.5% |
| State Government Employees | 0 | 0.0% |
| Federal Government Employees | 2 | 3.1% |
| Unpaid Family Workers | 0 | 0.0% |
| Total | 65 | 100.0% |
Employment Status by Age in Michigamme
According to the labor force statistics for Michigamme, out of the total population over 16 years of age (201), 42.8% or 86 individuals are in the labor force, with 17.4% or 15 of them unemployed. The age group with the highest labor force participation rate is 20 to 24 years, with 81.8% or 9 individuals in the labor force. Within the labor force, the 55 to 59 years age range has the highest percentage of unemployed individuals, with 47.1% or 8 of them being unemployed.
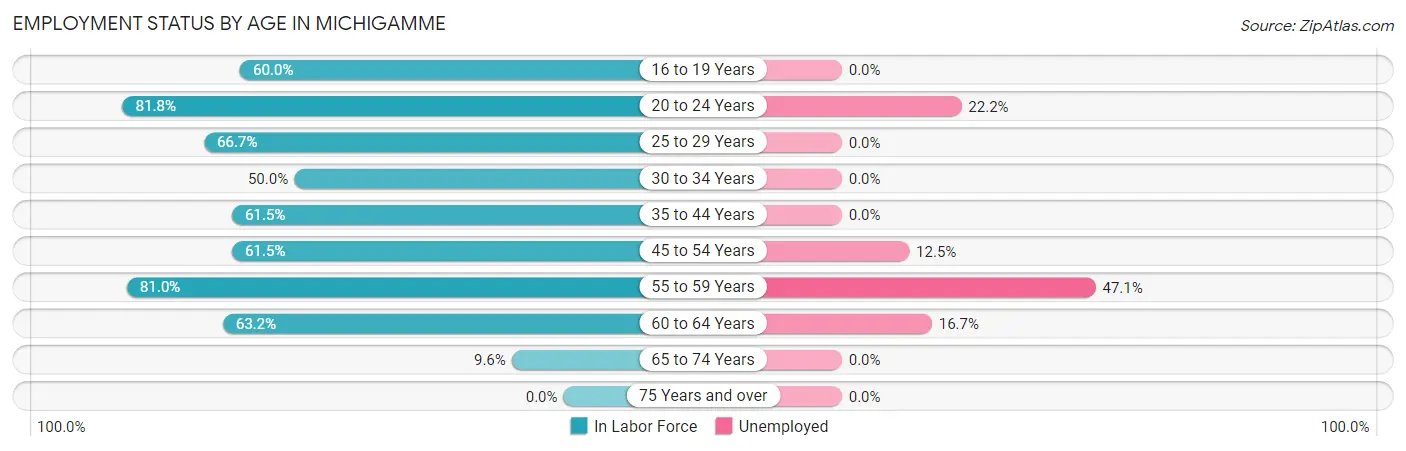
| Age Bracket | In Labor Force | Unemployed |
| 16 to 19 Years | 6 (60.0%) | 0 (0.0%) |
| 20 to 24 Years | 9 (81.8%) | 2 (22.2%) |
| 25 to 29 Years | 2 (66.7%) | 0 (0.0%) |
| 30 to 34 Years | 3 (50.0%) | 0 (0.0%) |
| 35 to 44 Years | 8 (61.5%) | 0 (0.0%) |
| 45 to 54 Years | 24 (61.5%) | 3 (12.5%) |
| 55 to 59 Years | 17 (81.0%) | 8 (47.1%) |
| 60 to 64 Years | 12 (63.2%) | 2 (16.7%) |
| 65 to 74 Years | 5 (9.6%) | 0 (0.0%) |
| 75 Years and over | 0 (0.0%) | 0 (0.0%) |
| Total | 86 (42.8%) | 15 (17.4%) |
Employment Status by Educational Attainment in Michigamme
According to labor force statistics for Michigamme, 65.3% of individuals (66) out of the total population between 25 and 64 years of age (101) are in the labor force, with 19.7% or 13 of them being unemployed. The group with the highest labor force participation rate are those with the educational attainment of less than high school, with 100.0% or 1 individuals in the labor force. Within the labor force, individuals with bachelor's degree or higher education have the highest percentage of unemployment, with 31.3% or 5 of them being unemployed.
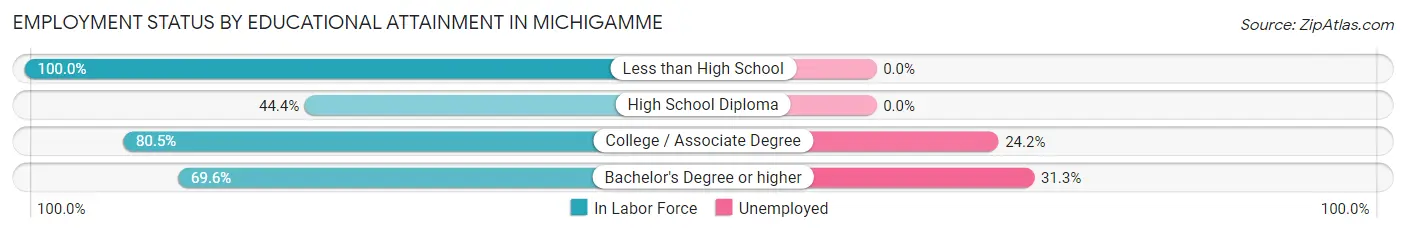
| Educational Attainment | In Labor Force | Unemployed |
| Less than High School | 1 (100.0%) | 0 (0.0%) |
| High School Diploma | 16 (44.4%) | 0 (0.0%) |
| College / Associate Degree | 33 (80.5%) | 10 (24.2%) |
| Bachelor's Degree or higher | 16 (69.6%) | 7 (31.3%) |
| Total | 66 (65.3%) | 20 (19.7%) |
Employment Occupations by Sex in Michigamme
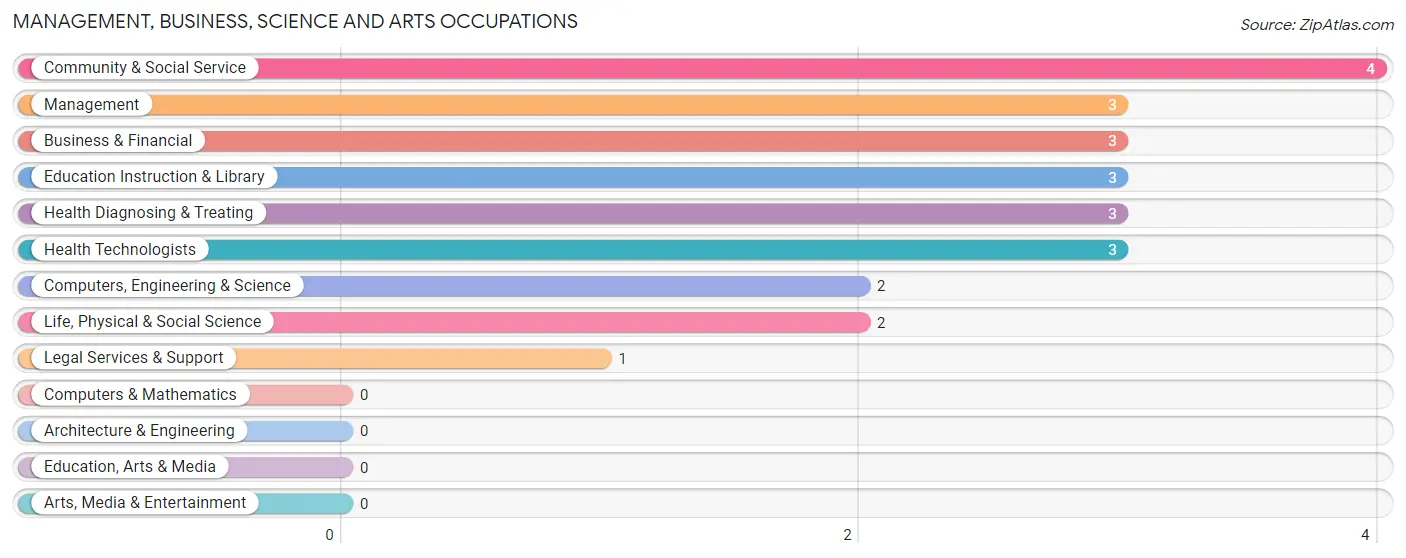
Management, Business, Science and Arts Occupations
The most common Management, Business, Science and Arts occupations in Michigamme are Community & Social Service (4 | 5.6%), Management (3 | 4.2%), Business & Financial (3 | 4.2%), Education Instruction & Library (3 | 4.2%), and Health Diagnosing & Treating (3 | 4.2%).
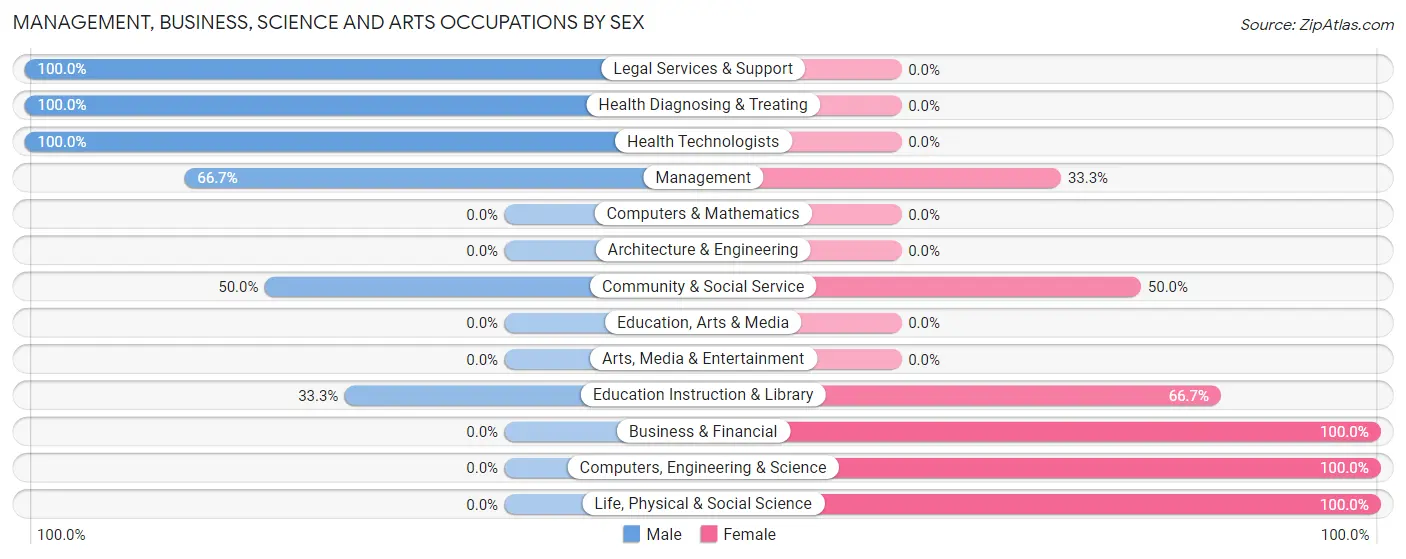
Management, Business, Science and Arts Occupations by Sex
Within the Management, Business, Science and Arts occupations in Michigamme, the most male-oriented occupations are Legal Services & Support (100.0%), Health Diagnosing & Treating (100.0%), and Health Technologists (100.0%), while the most female-oriented occupations are Business & Financial (100.0%), Computers, Engineering & Science (100.0%), and Life, Physical & Social Science (100.0%).
| Occupation | Male | Female |
| Management | 2 (66.7%) | 1 (33.3%) |
| Business & Financial | 0 (0.0%) | 3 (100.0%) |
| Computers, Engineering & Science | 0 (0.0%) | 2 (100.0%) |
| Computers & Mathematics | 0 (0.0%) | 0 (0.0%) |
| Architecture & Engineering | 0 (0.0%) | 0 (0.0%) |
| Life, Physical & Social Science | 0 (0.0%) | 2 (100.0%) |
| Community & Social Service | 2 (50.0%) | 2 (50.0%) |
| Education, Arts & Media | 0 (0.0%) | 0 (0.0%) |
| Legal Services & Support | 1 (100.0%) | 0 (0.0%) |
| Education Instruction & Library | 1 (33.3%) | 2 (66.7%) |
| Arts, Media & Entertainment | 0 (0.0%) | 0 (0.0%) |
| Health Diagnosing & Treating | 3 (100.0%) | 0 (0.0%) |
| Health Technologists | 3 (100.0%) | 0 (0.0%) |
| Total (Category) | 7 (46.7%) | 8 (53.3%) |
| Total (Overall) | 42 (59.2%) | 29 (40.8%) |
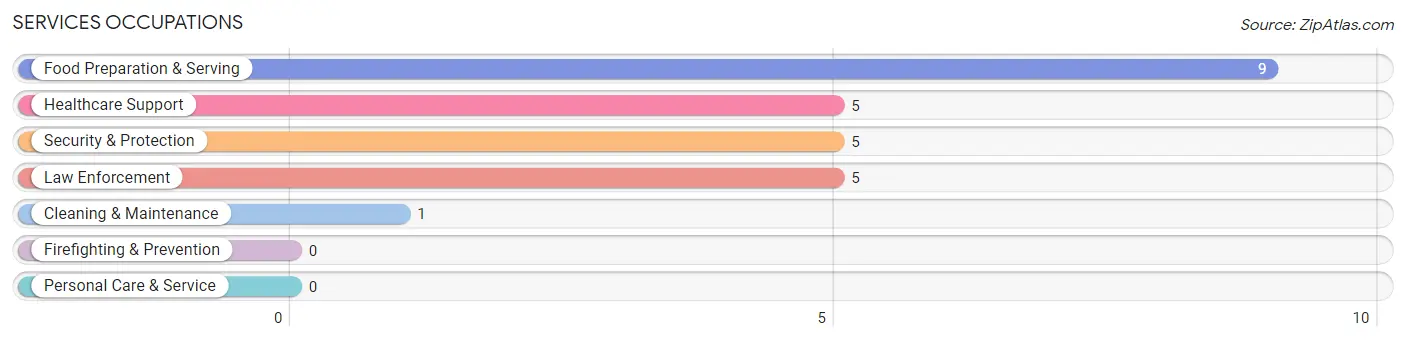
Services Occupations
The most common Services occupations in Michigamme are Food Preparation & Serving (9 | 12.7%), Healthcare Support (5 | 7.0%), Security & Protection (5 | 7.0%), Law Enforcement (5 | 7.0%), and Cleaning & Maintenance (1 | 1.4%).
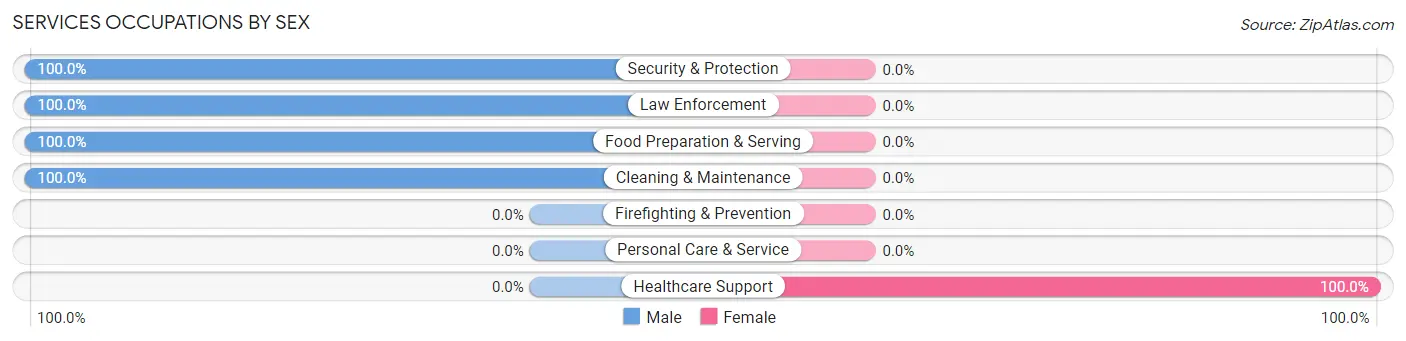
Services Occupations by Sex
| Occupation | Male | Female |
| Healthcare Support | 0 (0.0%) | 5 (100.0%) |
| Security & Protection | 5 (100.0%) | 0 (0.0%) |
| Firefighting & Prevention | 0 (0.0%) | 0 (0.0%) |
| Law Enforcement | 5 (100.0%) | 0 (0.0%) |
| Food Preparation & Serving | 9 (100.0%) | 0 (0.0%) |
| Cleaning & Maintenance | 1 (100.0%) | 0 (0.0%) |
| Personal Care & Service | 0 (0.0%) | 0 (0.0%) |
| Total (Category) | 15 (75.0%) | 5 (25.0%) |
| Total (Overall) | 42 (59.2%) | 29 (40.8%) |
Sales and Office Occupations
The most common Sales and Office occupations in Michigamme are Office & Administration (13 | 18.3%), and Sales & Related (1 | 1.4%).
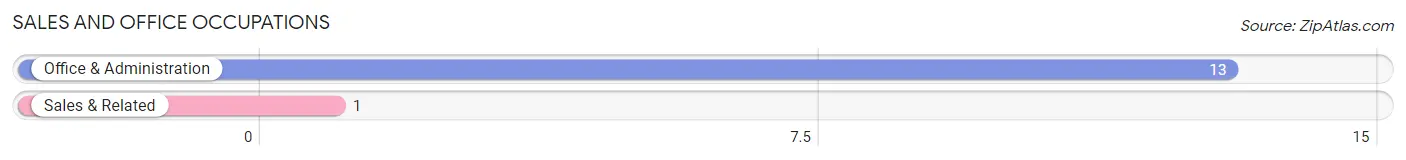
Sales and Office Occupations by Sex
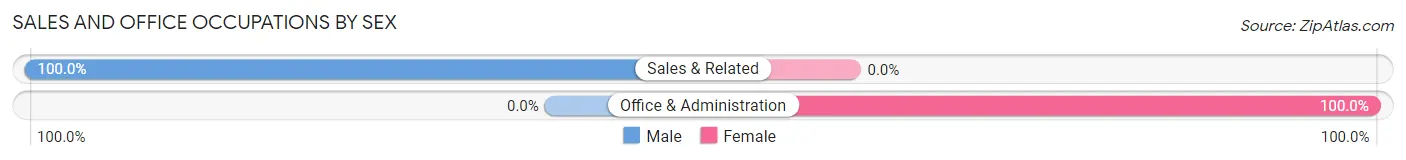
| Occupation | Male | Female |
| Sales & Related | 1 (100.0%) | 0 (0.0%) |
| Office & Administration | 0 (0.0%) | 13 (100.0%) |
| Total (Category) | 1 (7.1%) | 13 (92.9%) |
| Total (Overall) | 42 (59.2%) | 29 (40.8%) |
Natural Resources, Construction and Maintenance Occupations
The most common Natural Resources, Construction and Maintenance occupations in Michigamme are Construction & Extraction (7 | 9.9%), and Installation, Maintenance & Repair (1 | 1.4%).
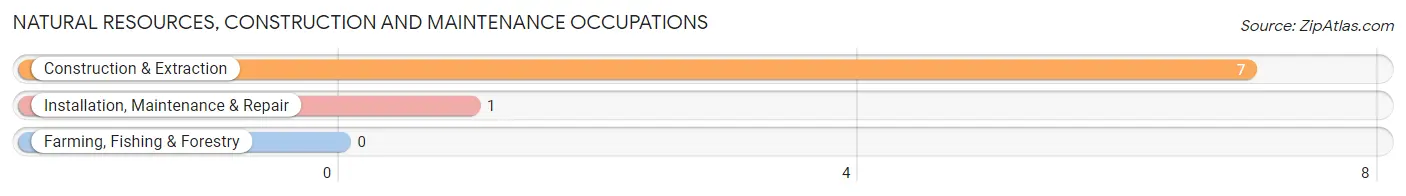
Natural Resources, Construction and Maintenance Occupations by Sex
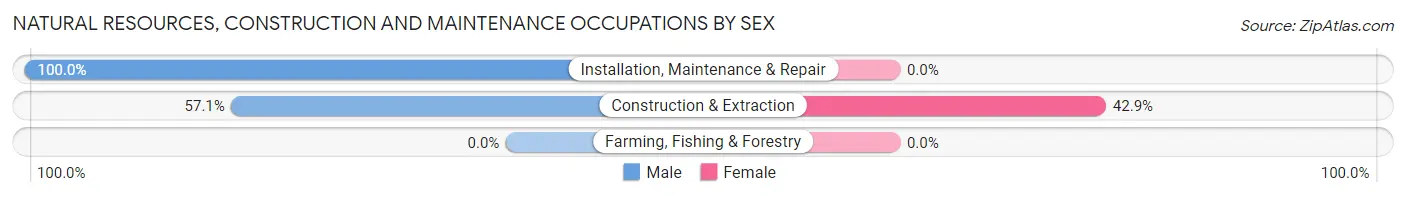
| Occupation | Male | Female |
| Farming, Fishing & Forestry | 0 (0.0%) | 0 (0.0%) |
| Construction & Extraction | 4 (57.1%) | 3 (42.9%) |
| Installation, Maintenance & Repair | 1 (100.0%) | 0 (0.0%) |
| Total (Category) | 5 (62.5%) | 3 (37.5%) |
| Total (Overall) | 42 (59.2%) | 29 (40.8%) |
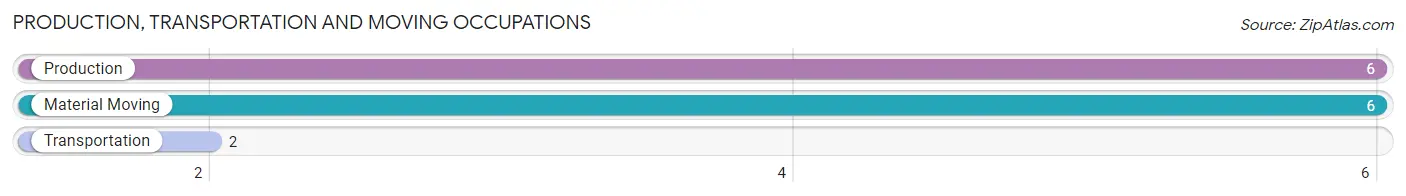
Production, Transportation and Moving Occupations
The most common Production, Transportation and Moving occupations in Michigamme are Production (6 | 8.5%), Material Moving (6 | 8.5%), and Transportation (2 | 2.8%).
Production, Transportation and Moving Occupations by Sex
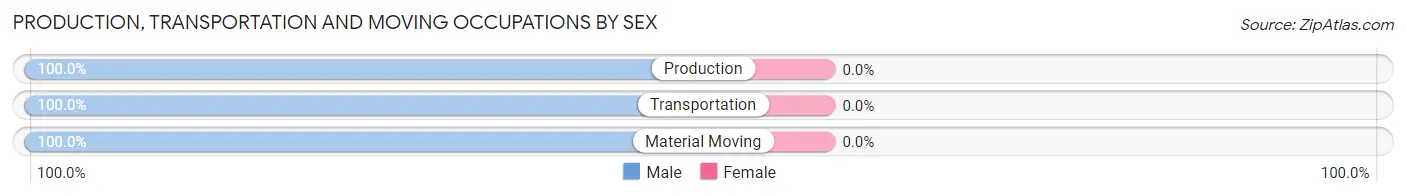
| Occupation | Male | Female |
| Production | 6 (100.0%) | 0 (0.0%) |
| Transportation | 2 (100.0%) | 0 (0.0%) |
| Material Moving | 6 (100.0%) | 0 (0.0%) |
| Total (Category) | 14 (100.0%) | 0 (0.0%) |
| Total (Overall) | 42 (59.2%) | 29 (40.8%) |
Employment Industries by Sex in Michigamme
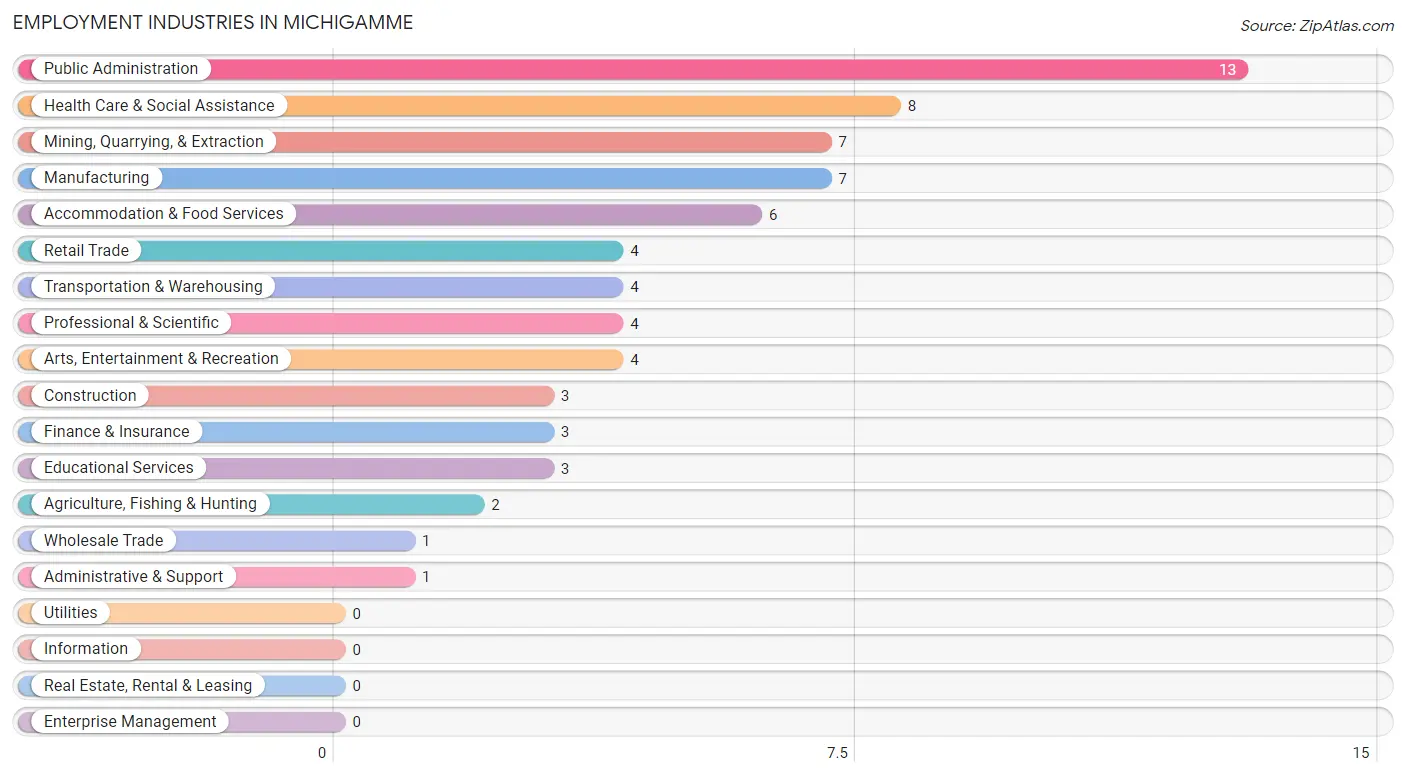
Employment Industries in Michigamme
The major employment industries in Michigamme include Public Administration (13 | 18.3%), Health Care & Social Assistance (8 | 11.3%), Mining, Quarrying, & Extraction (7 | 9.9%), Manufacturing (7 | 9.9%), and Accommodation & Food Services (6 | 8.5%).
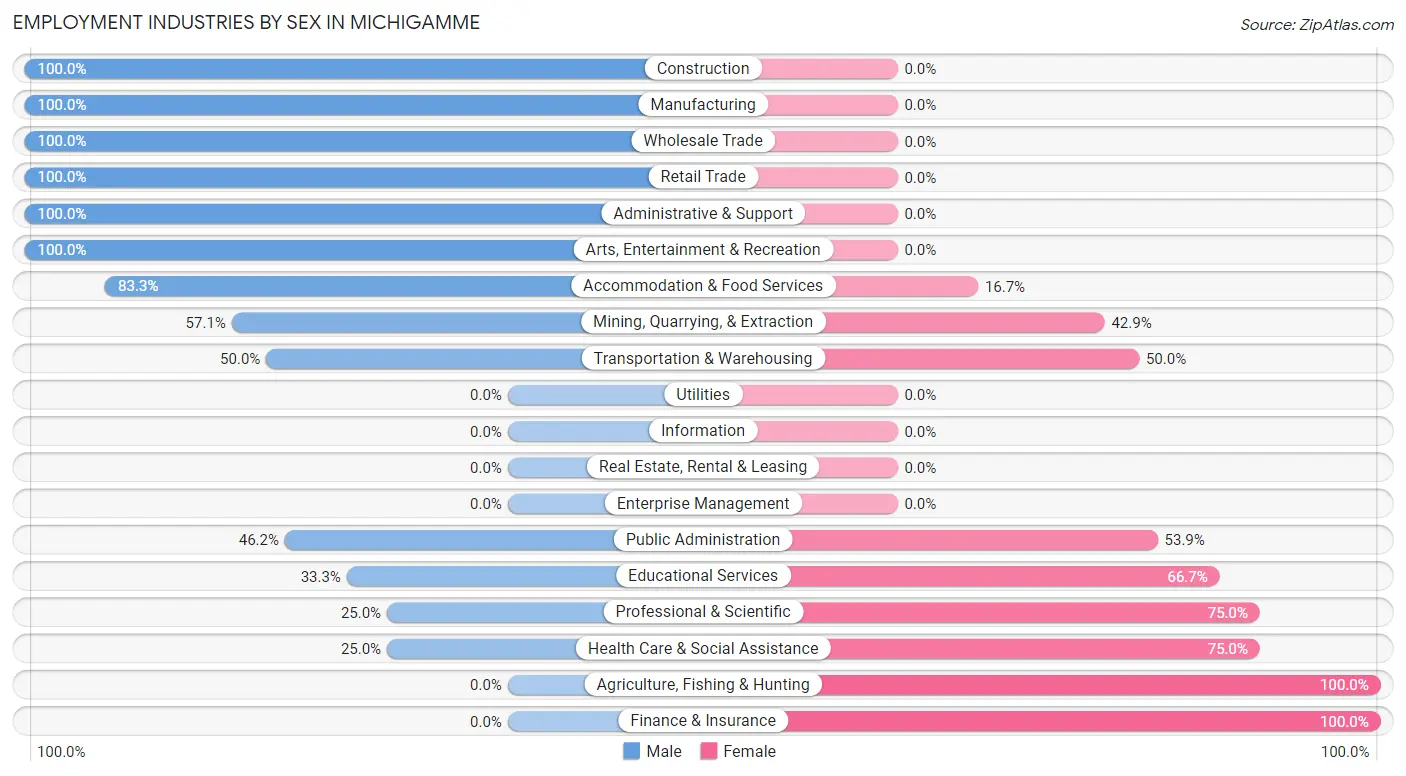
Employment Industries by Sex in Michigamme
The Michigamme industries that see more men than women are Construction (100.0%), Manufacturing (100.0%), and Wholesale Trade (100.0%), whereas the industries that tend to have a higher number of women are Agriculture, Fishing & Hunting (100.0%), Finance & Insurance (100.0%), and Professional & Scientific (75.0%).
| Industry | Male | Female |
| Agriculture, Fishing & Hunting | 0 (0.0%) | 2 (100.0%) |
| Mining, Quarrying, & Extraction | 4 (57.1%) | 3 (42.9%) |
| Construction | 3 (100.0%) | 0 (0.0%) |
| Manufacturing | 7 (100.0%) | 0 (0.0%) |
| Wholesale Trade | 1 (100.0%) | 0 (0.0%) |
| Retail Trade | 4 (100.0%) | 0 (0.0%) |
| Transportation & Warehousing | 2 (50.0%) | 2 (50.0%) |
| Utilities | 0 (0.0%) | 0 (0.0%) |
| Information | 0 (0.0%) | 0 (0.0%) |
| Finance & Insurance | 0 (0.0%) | 3 (100.0%) |
| Real Estate, Rental & Leasing | 0 (0.0%) | 0 (0.0%) |
| Professional & Scientific | 1 (25.0%) | 3 (75.0%) |
| Enterprise Management | 0 (0.0%) | 0 (0.0%) |
| Administrative & Support | 1 (100.0%) | 0 (0.0%) |
| Educational Services | 1 (33.3%) | 2 (66.7%) |
| Health Care & Social Assistance | 2 (25.0%) | 6 (75.0%) |
| Arts, Entertainment & Recreation | 4 (100.0%) | 0 (0.0%) |
| Accommodation & Food Services | 5 (83.3%) | 1 (16.7%) |
| Public Administration | 6 (46.2%) | 7 (53.8%) |
| Total | 42 (59.2%) | 29 (40.8%) |
Education in Michigamme
School Enrollment in Michigamme
The most common levels of schooling among the 38 students in Michigamme are high school (10 | 26.3%), college / undergraduate (8 | 21.0%), and graduate / professional (8 | 21.0%).
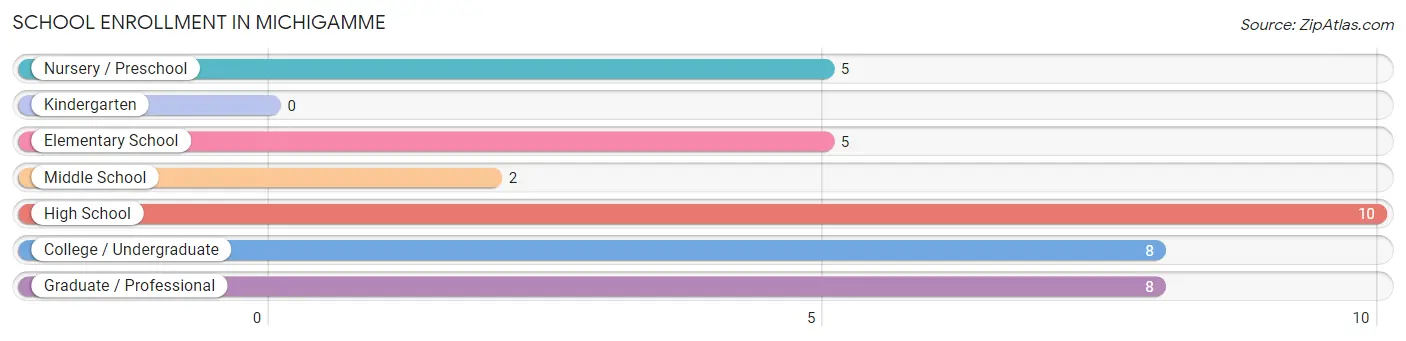
| School Level | # Students | % Students |
| Nursery / Preschool | 5 | 13.2% |
| Kindergarten | 0 | 0.0% |
| Elementary School | 5 | 13.2% |
| Middle School | 2 | 5.3% |
| High School | 10 | 26.3% |
| College / Undergraduate | 8 | 21.0% |
| Graduate / Professional | 8 | 21.0% |
| Total | 38 | 100.0% |
School Enrollment by Age by Funding Source in Michigamme
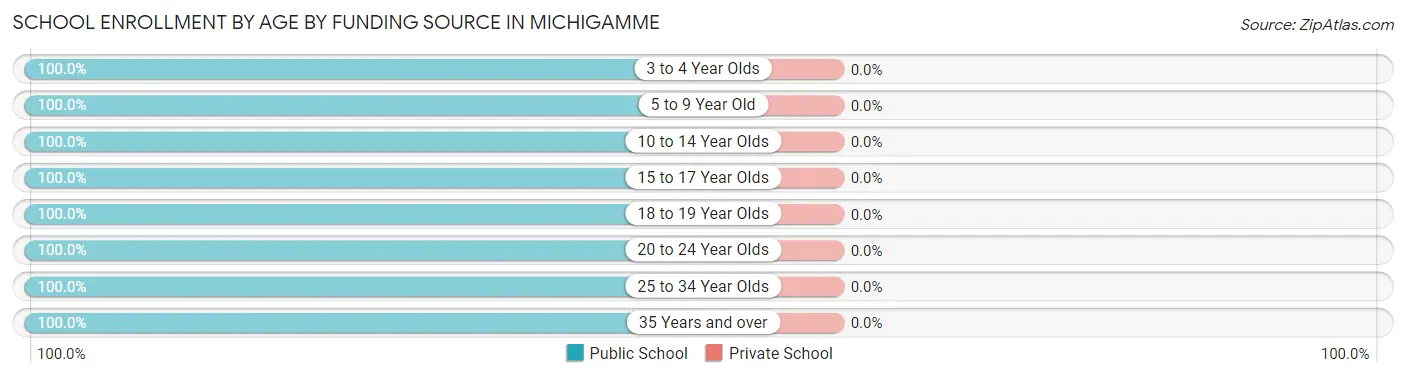
| Age Bracket | Public School | Private School |
| 3 to 4 Year Olds | 5 (100.0%) | 0 (0.0%) |
| 5 to 9 Year Old | 5 (100.0%) | 0 (0.0%) |
| 10 to 14 Year Olds | 4 (100.0%) | 0 (0.0%) |
| 15 to 17 Year Olds | 2 (100.0%) | 0 (0.0%) |
| 18 to 19 Year Olds | 6 (100.0%) | 0 (0.0%) |
| 20 to 24 Year Olds | 2 (100.0%) | 0 (0.0%) |
| 25 to 34 Year Olds | 1 (100.0%) | 0 (0.0%) |
| 35 Years and over | 13 (100.0%) | 0 (0.0%) |
| Total | 38 (100.0%) | 0 (0.0%) |
Educational Attainment by Field of Study in Michigamme
Education (19 | 29.2%), business (18 | 27.7%), science & technology (10 | 15.4%), social sciences (4 | 6.1%), and bio, nature & agricultural (3 | 4.6%) are the most common fields of study among 65 individuals in Michigamme who have obtained a bachelor's degree or higher.
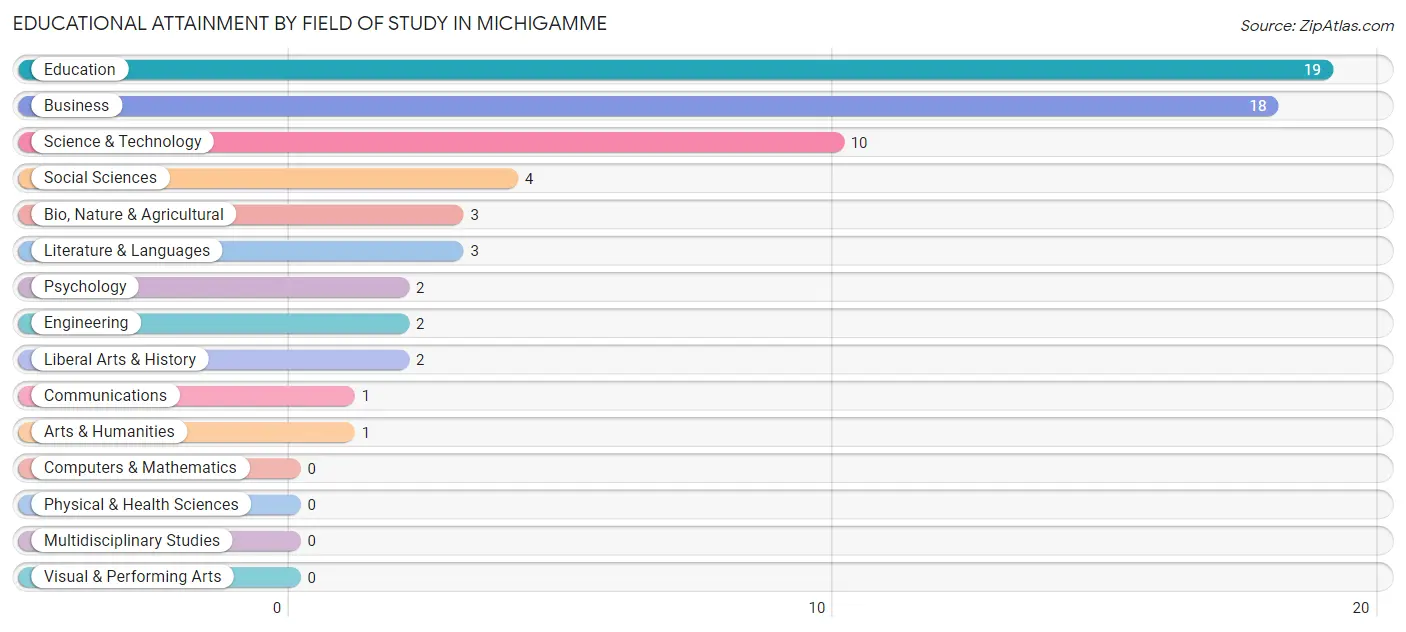
| Field of Study | # Graduates | % Graduates |
| Computers & Mathematics | 0 | 0.0% |
| Bio, Nature & Agricultural | 3 | 4.6% |
| Physical & Health Sciences | 0 | 0.0% |
| Psychology | 2 | 3.1% |
| Social Sciences | 4 | 6.1% |
| Engineering | 2 | 3.1% |
| Multidisciplinary Studies | 0 | 0.0% |
| Science & Technology | 10 | 15.4% |
| Business | 18 | 27.7% |
| Education | 19 | 29.2% |
| Literature & Languages | 3 | 4.6% |
| Liberal Arts & History | 2 | 3.1% |
| Visual & Performing Arts | 0 | 0.0% |
| Communications | 1 | 1.5% |
| Arts & Humanities | 1 | 1.5% |
| Total | 65 | 100.0% |
Transportation & Commute in Michigamme
Vehicle Availability by Sex in Michigamme
The most prevalent vehicle ownership categories in Michigamme are males with 1 vehicle (11, accounting for 30.6%) and females with 1 vehicle (11, making up 37.9%).
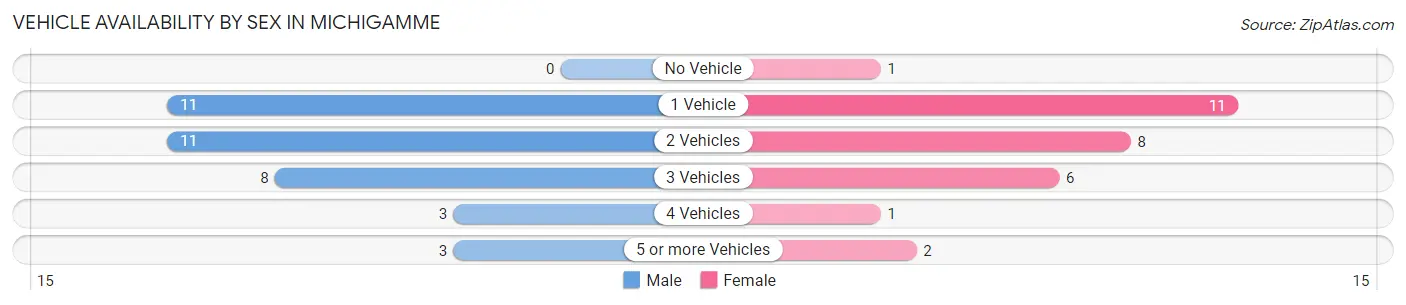
| Vehicles Available | Male | Female |
| No Vehicle | 0 (0.0%) | 1 (3.5%) |
| 1 Vehicle | 11 (30.6%) | 11 (37.9%) |
| 2 Vehicles | 11 (30.6%) | 8 (27.6%) |
| 3 Vehicles | 8 (22.2%) | 6 (20.7%) |
| 4 Vehicles | 3 (8.3%) | 1 (3.5%) |
| 5 or more Vehicles | 3 (8.3%) | 2 (6.9%) |
| Total | 36 (100.0%) | 29 (100.0%) |
Commute Time in Michigamme
The most frequently occuring commute durations in Michigamme are 5 to 9 minutes (12 commuters, 19.7%), 30 to 34 minutes (12 commuters, 19.7%), and 35 to 39 minutes (7 commuters, 11.5%).
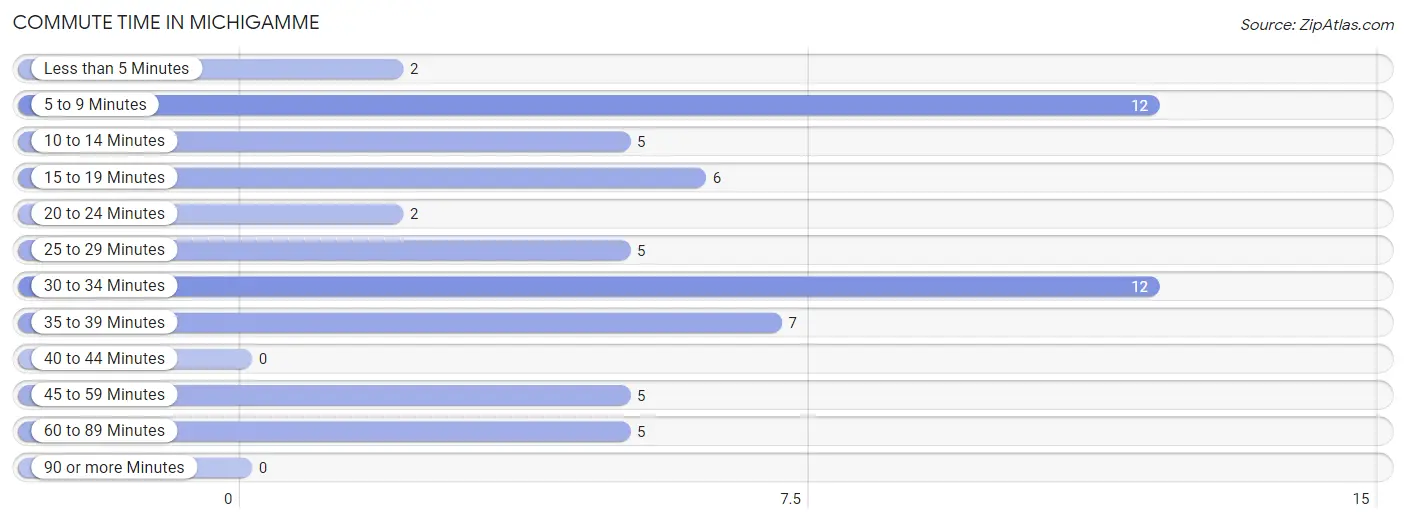
| Commute Time | # Commuters | % Commuters |
| Less than 5 Minutes | 2 | 3.3% |
| 5 to 9 Minutes | 12 | 19.7% |
| 10 to 14 Minutes | 5 | 8.2% |
| 15 to 19 Minutes | 6 | 9.8% |
| 20 to 24 Minutes | 2 | 3.3% |
| 25 to 29 Minutes | 5 | 8.2% |
| 30 to 34 Minutes | 12 | 19.7% |
| 35 to 39 Minutes | 7 | 11.5% |
| 40 to 44 Minutes | 0 | 0.0% |
| 45 to 59 Minutes | 5 | 8.2% |
| 60 to 89 Minutes | 5 | 8.2% |
| 90 or more Minutes | 0 | 0.0% |
Commute Time by Sex in Michigamme
The most common commute times in Michigamme are 30 to 34 minutes (9 commuters, 25.7%) for males and 5 to 9 minutes (10 commuters, 38.5%) for females.
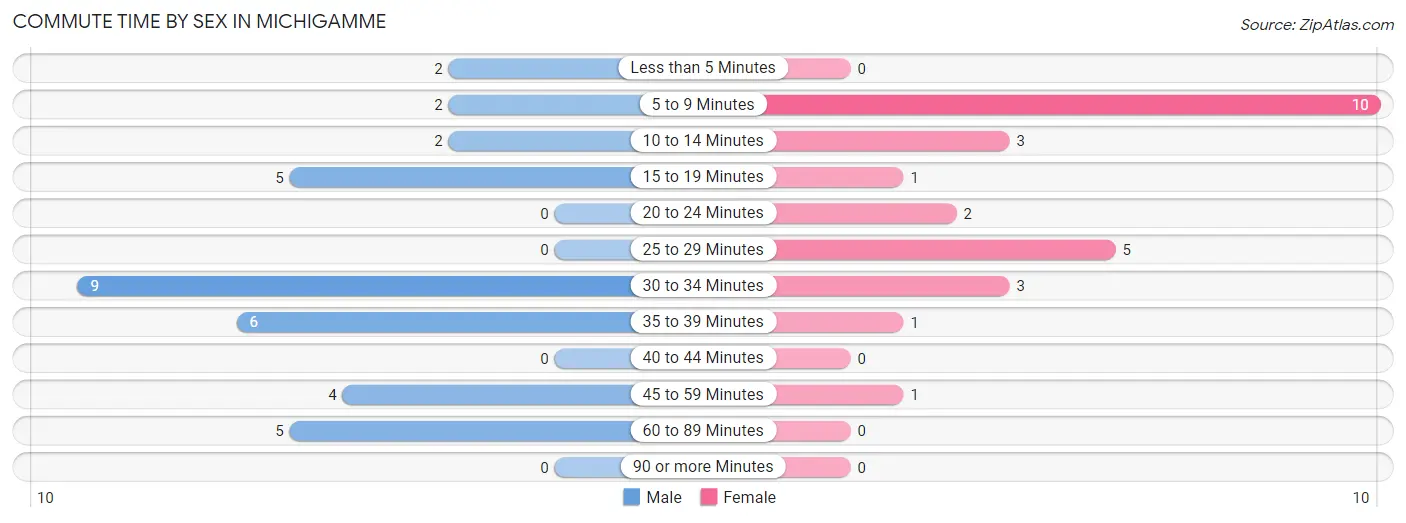
| Commute Time | Male | Female |
| Less than 5 Minutes | 2 (5.7%) | 0 (0.0%) |
| 5 to 9 Minutes | 2 (5.7%) | 10 (38.5%) |
| 10 to 14 Minutes | 2 (5.7%) | 3 (11.5%) |
| 15 to 19 Minutes | 5 (14.3%) | 1 (3.8%) |
| 20 to 24 Minutes | 0 (0.0%) | 2 (7.7%) |
| 25 to 29 Minutes | 0 (0.0%) | 5 (19.2%) |
| 30 to 34 Minutes | 9 (25.7%) | 3 (11.5%) |
| 35 to 39 Minutes | 6 (17.1%) | 1 (3.8%) |
| 40 to 44 Minutes | 0 (0.0%) | 0 (0.0%) |
| 45 to 59 Minutes | 4 (11.4%) | 1 (3.8%) |
| 60 to 89 Minutes | 5 (14.3%) | 0 (0.0%) |
| 90 or more Minutes | 0 (0.0%) | 0 (0.0%) |
Time of Departure to Work by Sex in Michigamme
The most frequent times of departure to work in Michigamme are 5:00 AM to 5:29 AM (10, 28.6%) for males and 7:30 AM to 7:59 AM (9, 34.6%) for females.
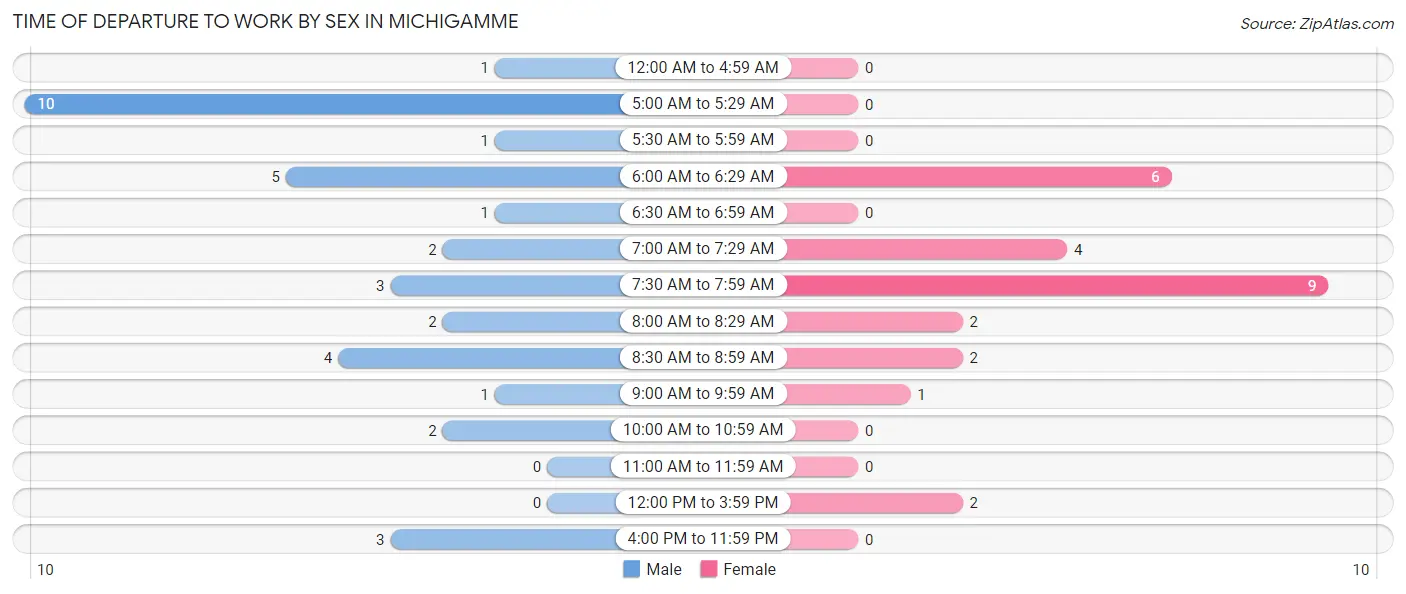
| Time of Departure | Male | Female |
| 12:00 AM to 4:59 AM | 1 (2.9%) | 0 (0.0%) |
| 5:00 AM to 5:29 AM | 10 (28.6%) | 0 (0.0%) |
| 5:30 AM to 5:59 AM | 1 (2.9%) | 0 (0.0%) |
| 6:00 AM to 6:29 AM | 5 (14.3%) | 6 (23.1%) |
| 6:30 AM to 6:59 AM | 1 (2.9%) | 0 (0.0%) |
| 7:00 AM to 7:29 AM | 2 (5.7%) | 4 (15.4%) |
| 7:30 AM to 7:59 AM | 3 (8.6%) | 9 (34.6%) |
| 8:00 AM to 8:29 AM | 2 (5.7%) | 2 (7.7%) |
| 8:30 AM to 8:59 AM | 4 (11.4%) | 2 (7.7%) |
| 9:00 AM to 9:59 AM | 1 (2.9%) | 1 (3.8%) |
| 10:00 AM to 10:59 AM | 2 (5.7%) | 0 (0.0%) |
| 11:00 AM to 11:59 AM | 0 (0.0%) | 0 (0.0%) |
| 12:00 PM to 3:59 PM | 0 (0.0%) | 2 (7.7%) |
| 4:00 PM to 11:59 PM | 3 (8.6%) | 0 (0.0%) |
| Total | 35 (100.0%) | 26 (100.0%) |
Housing Occupancy in Michigamme
Occupancy by Ownership in Michigamme
Of the total 101 dwellings in Michigamme, owner-occupied units account for 99 (98.0%), while renter-occupied units make up 2 (2.0%).
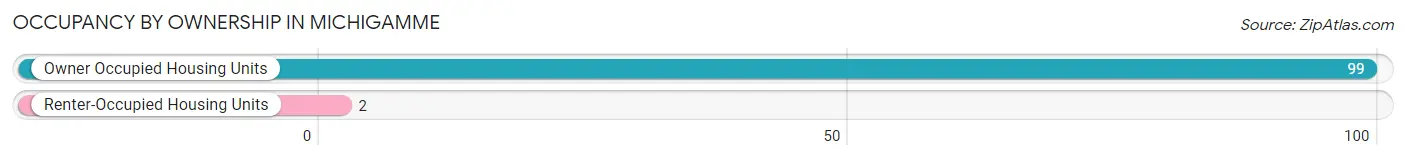
| Occupancy | # Housing Units | % Housing Units |
| Owner Occupied Housing Units | 99 | 98.0% |
| Renter-Occupied Housing Units | 2 | 2.0% |
| Total Occupied Housing Units | 101 | 100.0% |
Occupancy by Household Size in Michigamme
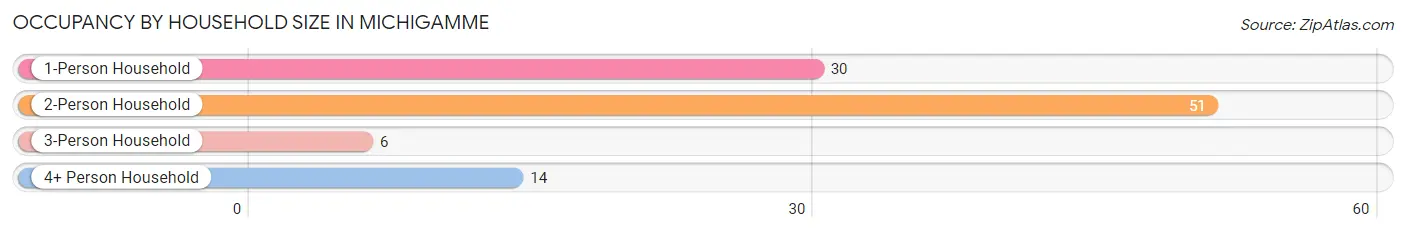
| Household Size | # Housing Units | % Housing Units |
| 1-Person Household | 30 | 29.7% |
| 2-Person Household | 51 | 50.5% |
| 3-Person Household | 6 | 5.9% |
| 4+ Person Household | 14 | 13.9% |
| Total Housing Units | 101 | 100.0% |
Occupancy by Ownership by Household Size in Michigamme
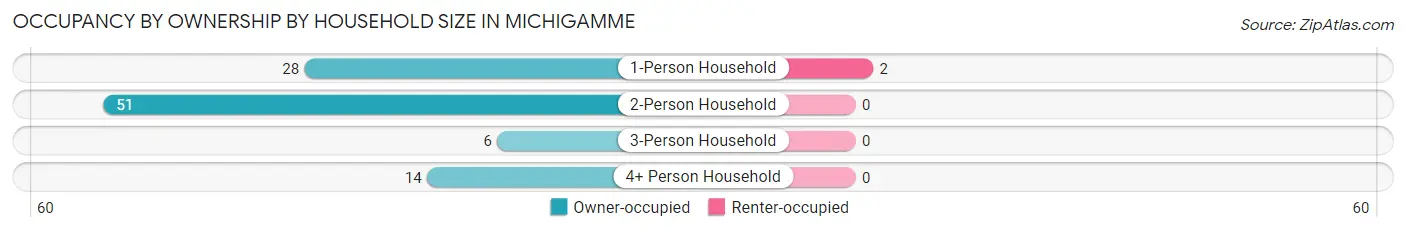
| Household Size | Owner-occupied | Renter-occupied |
| 1-Person Household | 28 (93.3%) | 2 (6.7%) |
| 2-Person Household | 51 (100.0%) | 0 (0.0%) |
| 3-Person Household | 6 (100.0%) | 0 (0.0%) |
| 4+ Person Household | 14 (100.0%) | 0 (0.0%) |
| Total Housing Units | 99 (98.0%) | 2 (2.0%) |
Occupancy by Educational Attainment in Michigamme
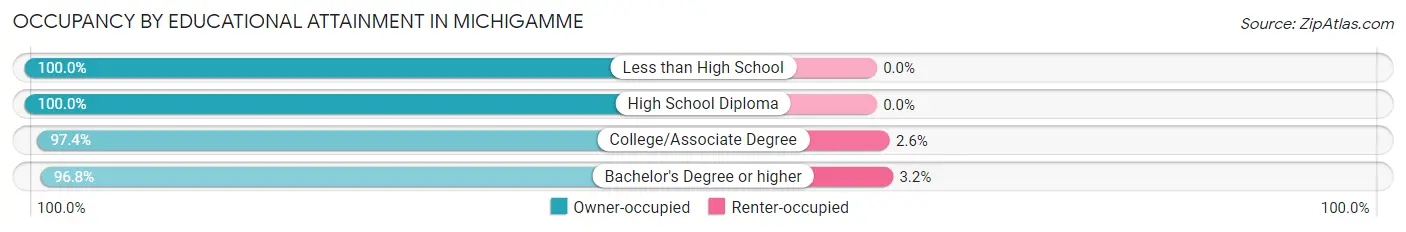
| Household Size | Owner-occupied | Renter-occupied |
| Less than High School | 3 (100.0%) | 0 (0.0%) |
| High School Diploma | 28 (100.0%) | 0 (0.0%) |
| College/Associate Degree | 38 (97.4%) | 1 (2.6%) |
| Bachelor's Degree or higher | 30 (96.8%) | 1 (3.2%) |
Occupancy by Age of Householder in Michigamme
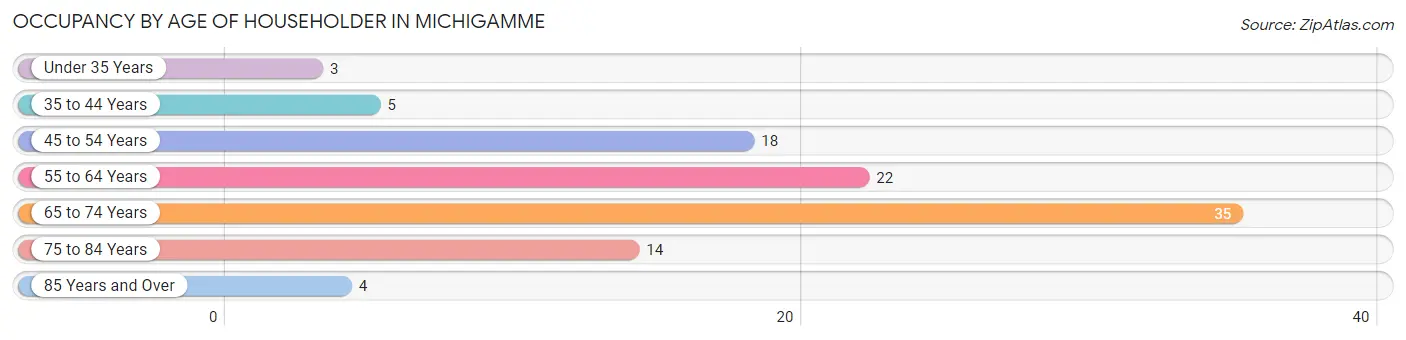
| Age Bracket | # Households | % Households |
| Under 35 Years | 3 | 3.0% |
| 35 to 44 Years | 5 | 5.0% |
| 45 to 54 Years | 18 | 17.8% |
| 55 to 64 Years | 22 | 21.8% |
| 65 to 74 Years | 35 | 34.6% |
| 75 to 84 Years | 14 | 13.9% |
| 85 Years and Over | 4 | 4.0% |
| Total | 101 | 100.0% |
Housing Finances in Michigamme
Median Income by Occupancy in Michigamme
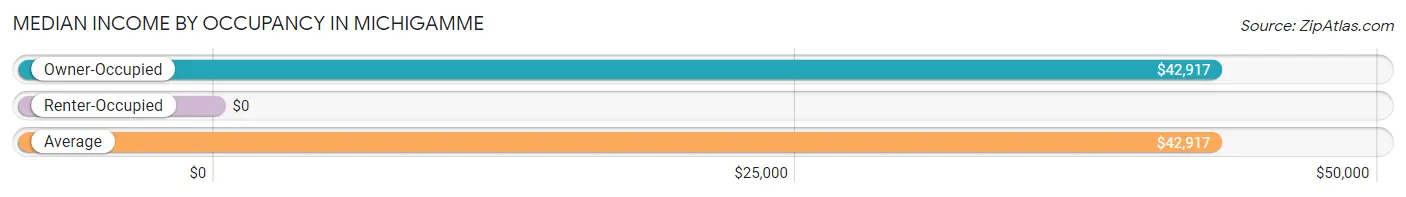
| Occupancy Type | # Households | Median Income |
| Owner-Occupied | 99 (98.0%) | $42,917 |
| Renter-Occupied | 2 (2.0%) | $0 |
| Average | 101 (100.0%) | $42,917 |
Occupancy by Householder Income Bracket in Michigamme
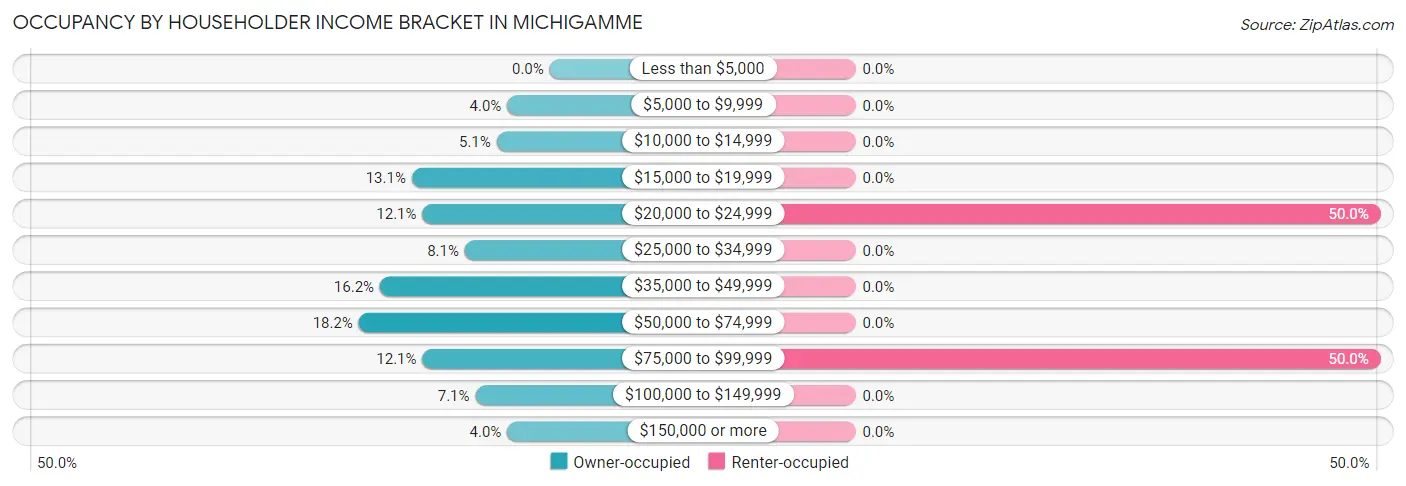
| Income Bracket | Owner-occupied | Renter-occupied |
| Less than $5,000 | 0 (0.0%) | 0 (0.0%) |
| $5,000 to $9,999 | 4 (4.0%) | 0 (0.0%) |
| $10,000 to $14,999 | 5 (5.1%) | 0 (0.0%) |
| $15,000 to $19,999 | 13 (13.1%) | 0 (0.0%) |
| $20,000 to $24,999 | 12 (12.1%) | 1 (50.0%) |
| $25,000 to $34,999 | 8 (8.1%) | 0 (0.0%) |
| $35,000 to $49,999 | 16 (16.2%) | 0 (0.0%) |
| $50,000 to $74,999 | 18 (18.2%) | 0 (0.0%) |
| $75,000 to $99,999 | 12 (12.1%) | 1 (50.0%) |
| $100,000 to $149,999 | 7 (7.1%) | 0 (0.0%) |
| $150,000 or more | 4 (4.0%) | 0 (0.0%) |
| Total | 99 (100.0%) | 2 (100.0%) |
Monthly Housing Cost Tiers in Michigamme
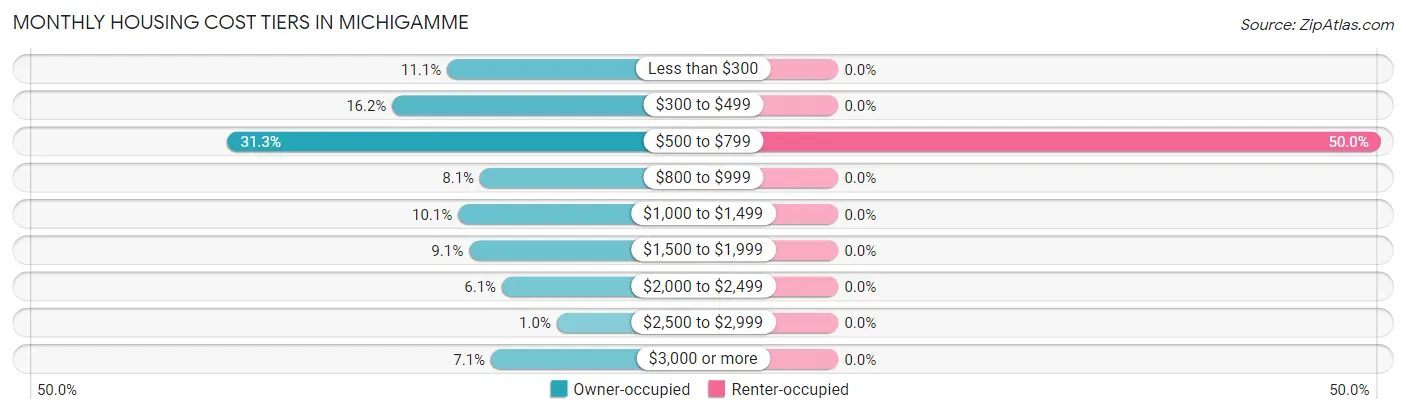
| Monthly Cost | Owner-occupied | Renter-occupied |
| Less than $300 | 11 (11.1%) | 0 (0.0%) |
| $300 to $499 | 16 (16.2%) | 0 (0.0%) |
| $500 to $799 | 31 (31.3%) | 1 (50.0%) |
| $800 to $999 | 8 (8.1%) | 0 (0.0%) |
| $1,000 to $1,499 | 10 (10.1%) | 0 (0.0%) |
| $1,500 to $1,999 | 9 (9.1%) | 0 (0.0%) |
| $2,000 to $2,499 | 6 (6.1%) | 0 (0.0%) |
| $2,500 to $2,999 | 1 (1.0%) | 0 (0.0%) |
| $3,000 or more | 7 (7.1%) | 0 (0.0%) |
| Total | 99 (100.0%) | 2 (100.0%) |
Physical Housing Characteristics in Michigamme
Housing Structures in Michigamme
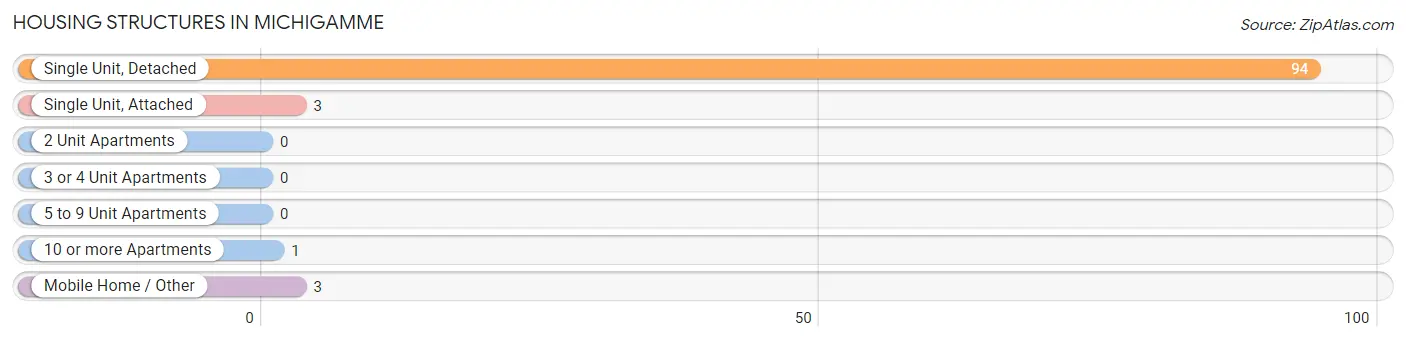
| Structure Type | # Housing Units | % Housing Units |
| Single Unit, Detached | 94 | 93.1% |
| Single Unit, Attached | 3 | 3.0% |
| 2 Unit Apartments | 0 | 0.0% |
| 3 or 4 Unit Apartments | 0 | 0.0% |
| 5 to 9 Unit Apartments | 0 | 0.0% |
| 10 or more Apartments | 1 | 1.0% |
| Mobile Home / Other | 3 | 3.0% |
| Total | 101 | 100.0% |
Housing Structures by Occupancy in Michigamme
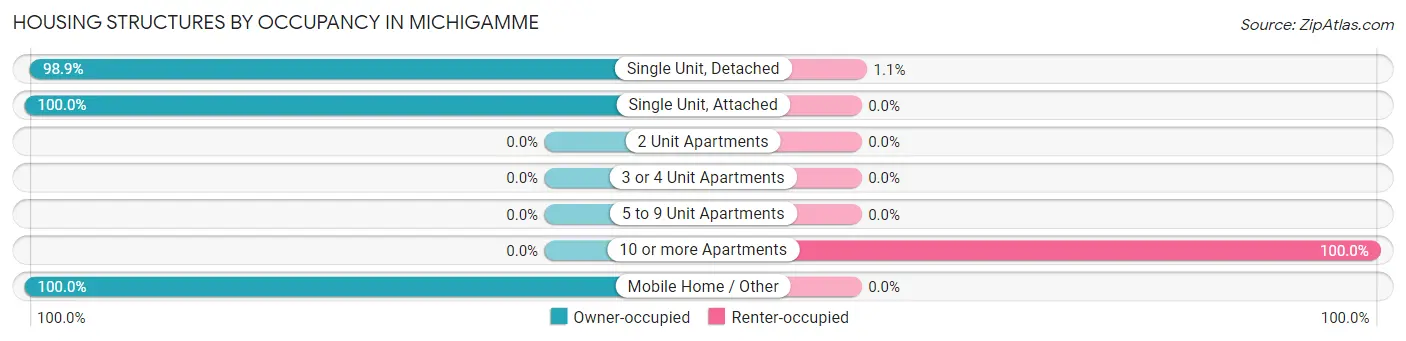
| Structure Type | Owner-occupied | Renter-occupied |
| Single Unit, Detached | 93 (98.9%) | 1 (1.1%) |
| Single Unit, Attached | 3 (100.0%) | 0 (0.0%) |
| 2 Unit Apartments | 0 (0.0%) | 0 (0.0%) |
| 3 or 4 Unit Apartments | 0 (0.0%) | 0 (0.0%) |
| 5 to 9 Unit Apartments | 0 (0.0%) | 0 (0.0%) |
| 10 or more Apartments | 0 (0.0%) | 1 (100.0%) |
| Mobile Home / Other | 3 (100.0%) | 0 (0.0%) |
| Total | 99 (98.0%) | 2 (2.0%) |
Housing Structures by Number of Rooms in Michigamme
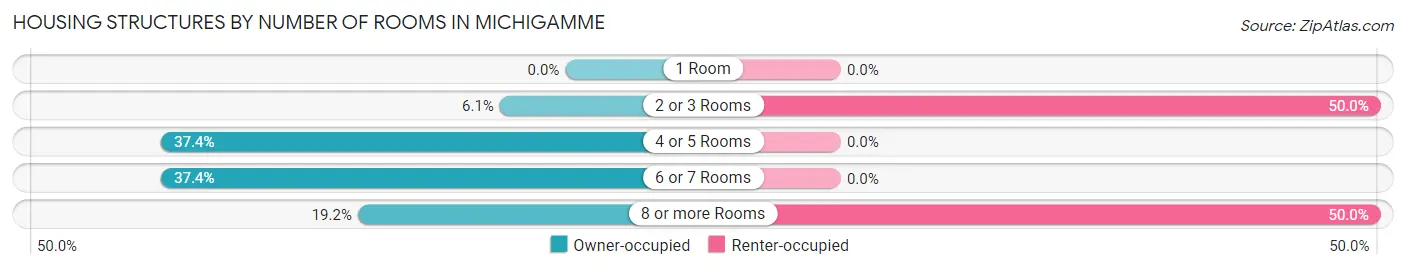
| Number of Rooms | Owner-occupied | Renter-occupied |
| 1 Room | 0 (0.0%) | 0 (0.0%) |
| 2 or 3 Rooms | 6 (6.1%) | 1 (50.0%) |
| 4 or 5 Rooms | 37 (37.4%) | 0 (0.0%) |
| 6 or 7 Rooms | 37 (37.4%) | 0 (0.0%) |
| 8 or more Rooms | 19 (19.2%) | 1 (50.0%) |
| Total | 99 (100.0%) | 2 (100.0%) |
Housing Structure by Heating Type in Michigamme
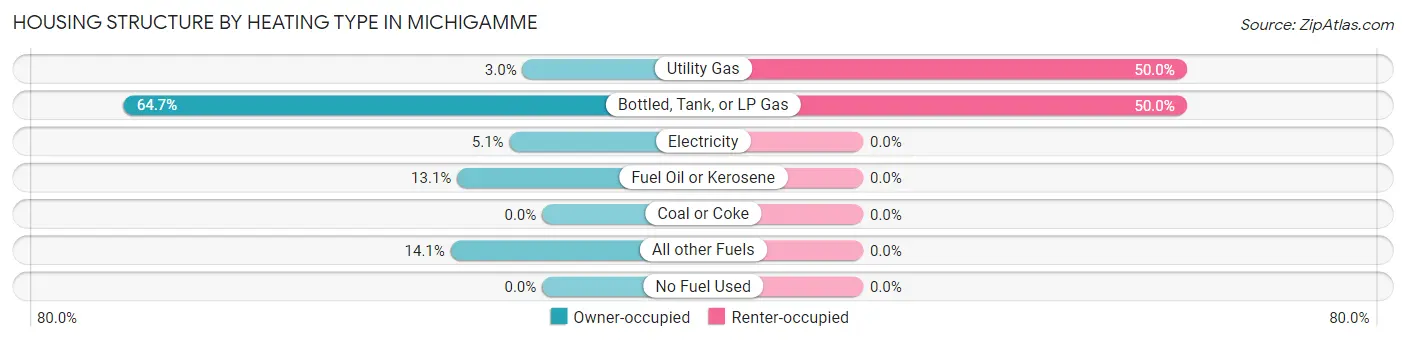
| Heating Type | Owner-occupied | Renter-occupied |
| Utility Gas | 3 (3.0%) | 1 (50.0%) |
| Bottled, Tank, or LP Gas | 64 (64.6%) | 1 (50.0%) |
| Electricity | 5 (5.1%) | 0 (0.0%) |
| Fuel Oil or Kerosene | 13 (13.1%) | 0 (0.0%) |
| Coal or Coke | 0 (0.0%) | 0 (0.0%) |
| All other Fuels | 14 (14.1%) | 0 (0.0%) |
| No Fuel Used | 0 (0.0%) | 0 (0.0%) |
| Total | 99 (100.0%) | 2 (100.0%) |
Household Vehicle Usage in Michigamme
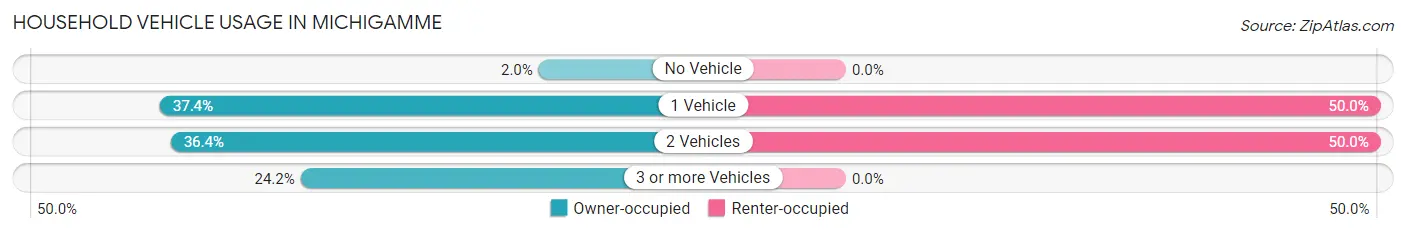
| Vehicles per Household | Owner-occupied | Renter-occupied |
| No Vehicle | 2 (2.0%) | 0 (0.0%) |
| 1 Vehicle | 37 (37.4%) | 1 (50.0%) |
| 2 Vehicles | 36 (36.4%) | 1 (50.0%) |
| 3 or more Vehicles | 24 (24.2%) | 0 (0.0%) |
| Total | 99 (100.0%) | 2 (100.0%) |
Real Estate & Mortgages in Michigamme
Real Estate and Mortgage Overview in Michigamme
| Characteristic | Without Mortgage | With Mortgage |
| Housing Units | 58 | 41 |
| Median Property Value | $100,000 | $162,500 |
| Median Household Income | $38,750 | $3 |
| Monthly Housing Costs | $525 | $7 |
| Real Estate Taxes | $1,536 | $2 |
Property Value by Mortgage Status in Michigamme
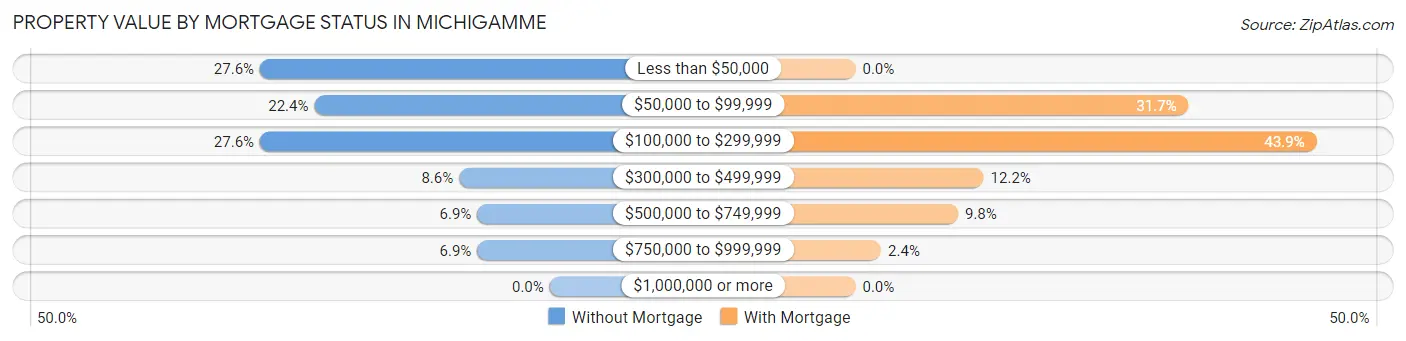
| Property Value | Without Mortgage | With Mortgage |
| Less than $50,000 | 16 (27.6%) | 0 (0.0%) |
| $50,000 to $99,999 | 13 (22.4%) | 13 (31.7%) |
| $100,000 to $299,999 | 16 (27.6%) | 18 (43.9%) |
| $300,000 to $499,999 | 5 (8.6%) | 5 (12.2%) |
| $500,000 to $749,999 | 4 (6.9%) | 4 (9.8%) |
| $750,000 to $999,999 | 4 (6.9%) | 1 (2.4%) |
| $1,000,000 or more | 0 (0.0%) | 0 (0.0%) |
| Total | 58 (100.0%) | 41 (100.0%) |
Household Income by Mortgage Status in Michigamme
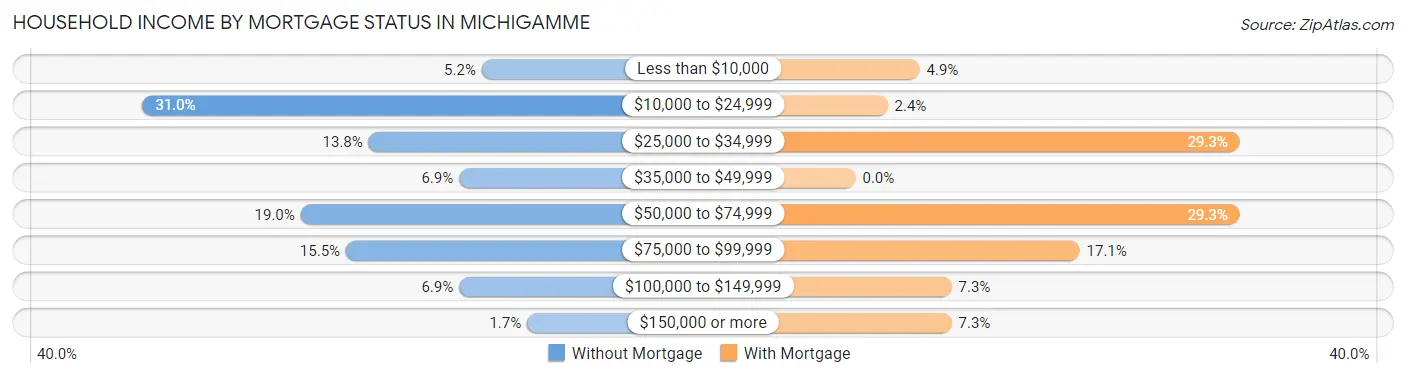
| Household Income | Without Mortgage | With Mortgage |
| Less than $10,000 | 3 (5.2%) | 2 (4.9%) |
| $10,000 to $24,999 | 18 (31.0%) | 1 (2.4%) |
| $25,000 to $34,999 | 8 (13.8%) | 12 (29.3%) |
| $35,000 to $49,999 | 4 (6.9%) | 0 (0.0%) |
| $50,000 to $74,999 | 11 (19.0%) | 12 (29.3%) |
| $75,000 to $99,999 | 9 (15.5%) | 7 (17.1%) |
| $100,000 to $149,999 | 4 (6.9%) | 3 (7.3%) |
| $150,000 or more | 1 (1.7%) | 3 (7.3%) |
| Total | 58 (100.0%) | 41 (100.0%) |
Property Value to Household Income Ratio in Michigamme
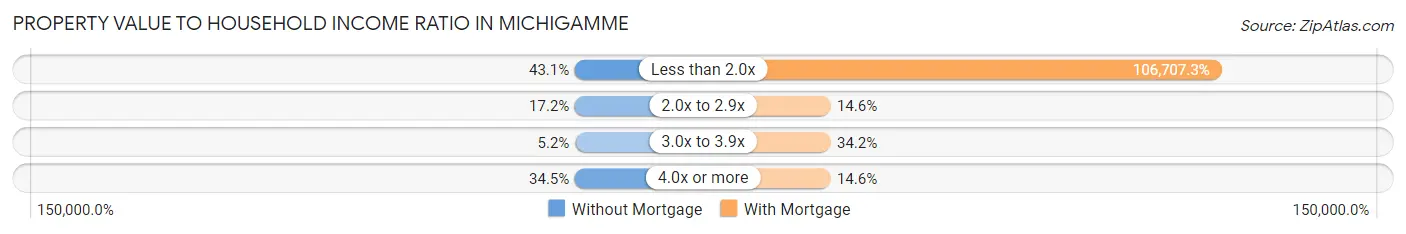
| Value-to-Income Ratio | Without Mortgage | With Mortgage |
| Less than 2.0x | 25 (43.1%) | 43,750 (106,707.3%) |
| 2.0x to 2.9x | 10 (17.2%) | 6 (14.6%) |
| 3.0x to 3.9x | 3 (5.2%) | 14 (34.2%) |
| 4.0x or more | 20 (34.5%) | 6 (14.6%) |
| Total | 58 (100.0%) | 41 (100.0%) |
Real Estate Taxes by Mortgage Status in Michigamme
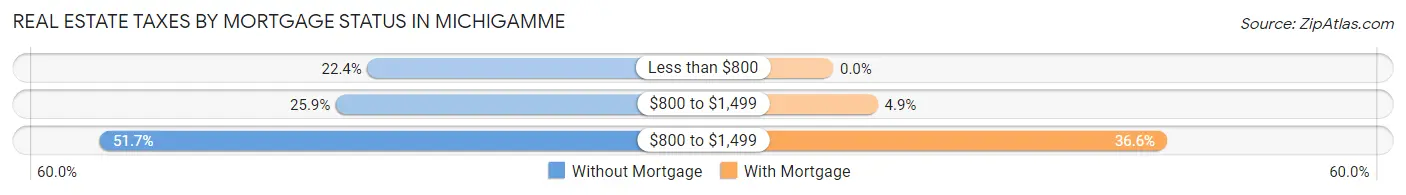
| Property Taxes | Without Mortgage | With Mortgage |
| Less than $800 | 13 (22.4%) | 0 (0.0%) |
| $800 to $1,499 | 15 (25.9%) | 2 (4.9%) |
| $800 to $1,499 | 30 (51.7%) | 15 (36.6%) |
| Total | 58 (100.0%) | 41 (100.0%) |
Health & Disability in Michigamme
Health Insurance Coverage by Age in Michigamme
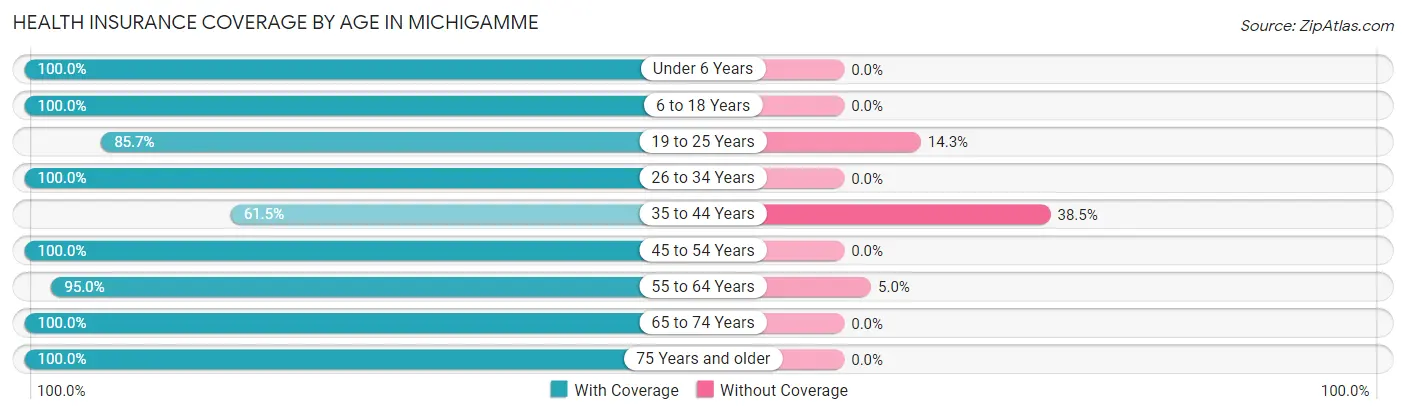
| Age Bracket | With Coverage | Without Coverage |
| Under 6 Years | 16 (100.0%) | 0 (0.0%) |
| 6 to 18 Years | 17 (100.0%) | 0 (0.0%) |
| 19 to 25 Years | 12 (85.7%) | 2 (14.3%) |
| 26 to 34 Years | 8 (100.0%) | 0 (0.0%) |
| 35 to 44 Years | 8 (61.5%) | 5 (38.5%) |
| 45 to 54 Years | 39 (100.0%) | 0 (0.0%) |
| 55 to 64 Years | 38 (95.0%) | 2 (5.0%) |
| 65 to 74 Years | 52 (100.0%) | 0 (0.0%) |
| 75 Years and older | 27 (100.0%) | 0 (0.0%) |
| Total | 217 (96.0%) | 9 (4.0%) |
Health Insurance Coverage by Citizenship Status in Michigamme
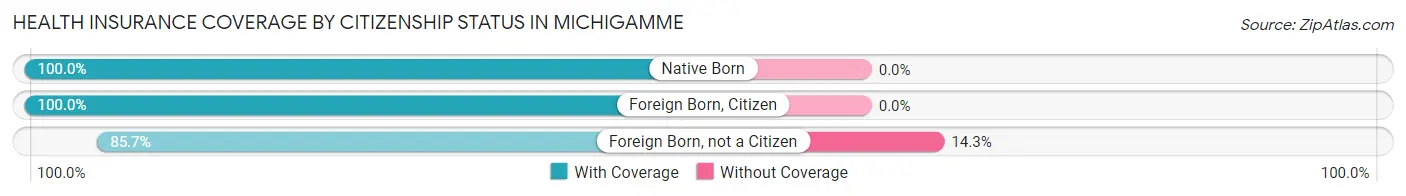
| Citizenship Status | With Coverage | Without Coverage |
| Native Born | 16 (100.0%) | 0 (0.0%) |
| Foreign Born, Citizen | 17 (100.0%) | 0 (0.0%) |
| Foreign Born, not a Citizen | 12 (85.7%) | 2 (14.3%) |
Health Insurance Coverage by Household Income in Michigamme
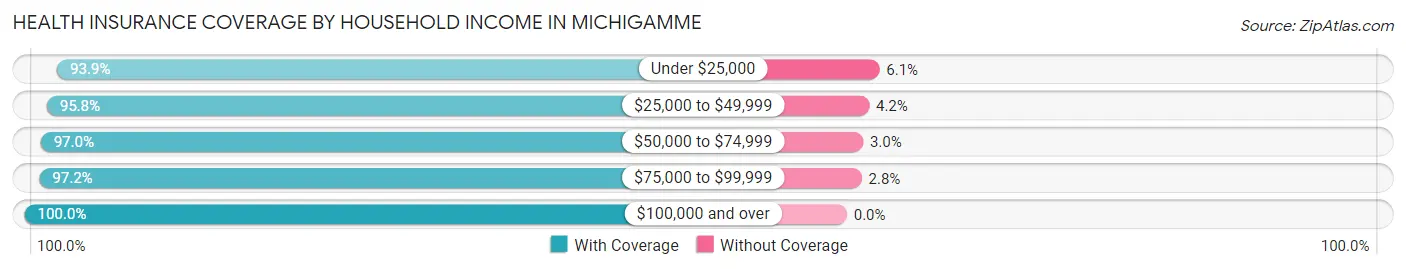
| Household Income | With Coverage | Without Coverage |
| Under $25,000 | 77 (93.9%) | 5 (6.1%) |
| $25,000 to $49,999 | 46 (95.8%) | 2 (4.2%) |
| $50,000 to $74,999 | 32 (97.0%) | 1 (3.0%) |
| $75,000 to $99,999 | 35 (97.2%) | 1 (2.8%) |
| $100,000 and over | 27 (100.0%) | 0 (0.0%) |
Public vs Private Health Insurance Coverage by Age in Michigamme
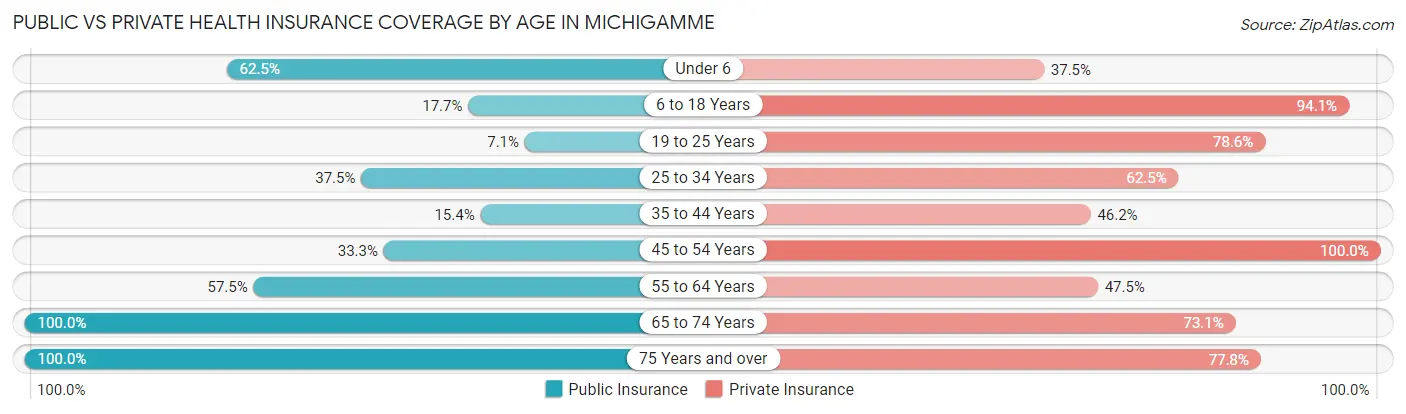
| Age Bracket | Public Insurance | Private Insurance |
| Under 6 | 10 (62.5%) | 6 (37.5%) |
| 6 to 18 Years | 3 (17.6%) | 16 (94.1%) |
| 19 to 25 Years | 1 (7.1%) | 11 (78.6%) |
| 25 to 34 Years | 3 (37.5%) | 5 (62.5%) |
| 35 to 44 Years | 2 (15.4%) | 6 (46.2%) |
| 45 to 54 Years | 13 (33.3%) | 39 (100.0%) |
| 55 to 64 Years | 23 (57.5%) | 19 (47.5%) |
| 65 to 74 Years | 52 (100.0%) | 38 (73.1%) |
| 75 Years and over | 27 (100.0%) | 21 (77.8%) |
| Total | 134 (59.3%) | 161 (71.2%) |
Disability Status by Sex by Age in Michigamme
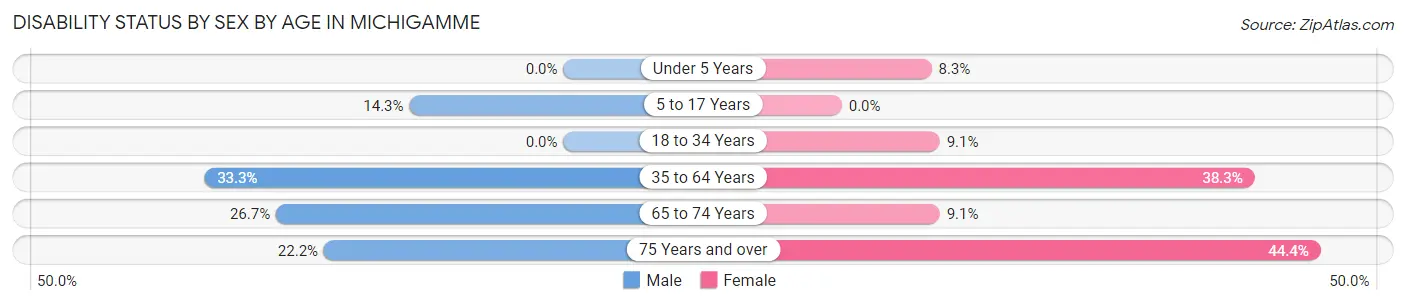
| Age Bracket | Male | Female |
| Under 5 Years | 0 (0.0%) | 1 (8.3%) |
| 5 to 17 Years | 1 (14.3%) | 0 (0.0%) |
| 18 to 34 Years | 0 (0.0%) | 1 (9.1%) |
| 35 to 64 Years | 15 (33.3%) | 18 (38.3%) |
| 65 to 74 Years | 8 (26.7%) | 2 (9.1%) |
| 75 Years and over | 2 (22.2%) | 8 (44.4%) |
Disability Class by Sex by Age in Michigamme
Disability Class: Hearing Difficulty
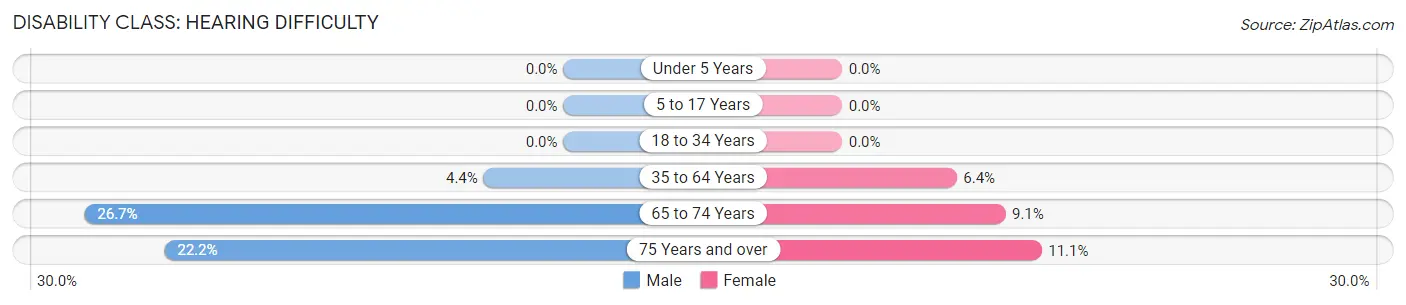
| Age Bracket | Male | Female |
| Under 5 Years | 0 (0.0%) | 0 (0.0%) |
| 5 to 17 Years | 0 (0.0%) | 0 (0.0%) |
| 18 to 34 Years | 0 (0.0%) | 0 (0.0%) |
| 35 to 64 Years | 2 (4.4%) | 3 (6.4%) |
| 65 to 74 Years | 8 (26.7%) | 2 (9.1%) |
| 75 Years and over | 2 (22.2%) | 2 (11.1%) |
Disability Class: Vision Difficulty
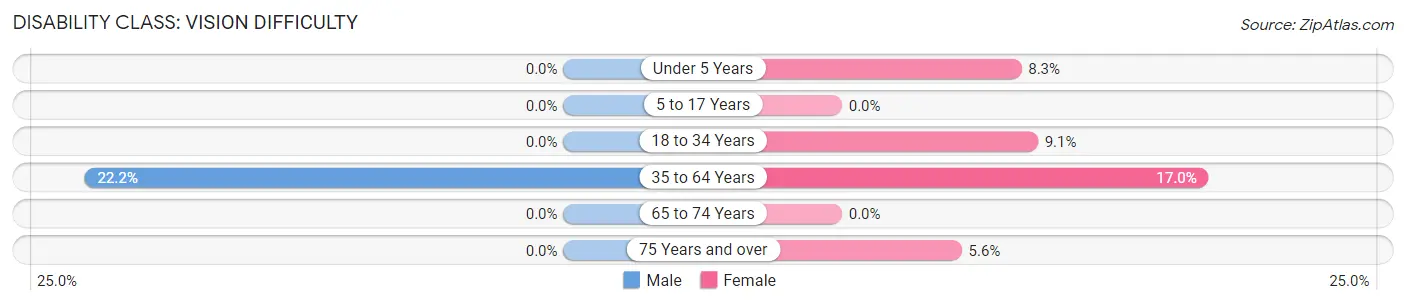
| Age Bracket | Male | Female |
| Under 5 Years | 0 (0.0%) | 1 (8.3%) |
| 5 to 17 Years | 0 (0.0%) | 0 (0.0%) |
| 18 to 34 Years | 0 (0.0%) | 1 (9.1%) |
| 35 to 64 Years | 10 (22.2%) | 8 (17.0%) |
| 65 to 74 Years | 0 (0.0%) | 0 (0.0%) |
| 75 Years and over | 0 (0.0%) | 1 (5.6%) |
Disability Class: Cognitive Difficulty
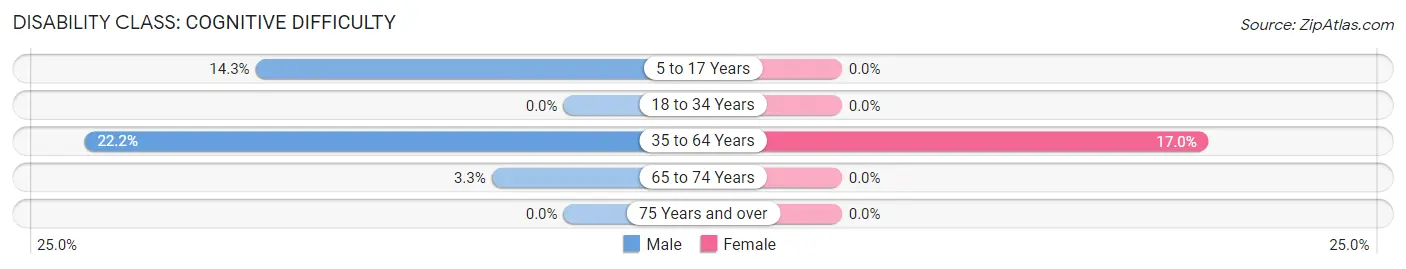
| Age Bracket | Male | Female |
| 5 to 17 Years | 1 (14.3%) | 0 (0.0%) |
| 18 to 34 Years | 0 (0.0%) | 0 (0.0%) |
| 35 to 64 Years | 10 (22.2%) | 8 (17.0%) |
| 65 to 74 Years | 1 (3.3%) | 0 (0.0%) |
| 75 Years and over | 0 (0.0%) | 0 (0.0%) |
Disability Class: Ambulatory Difficulty
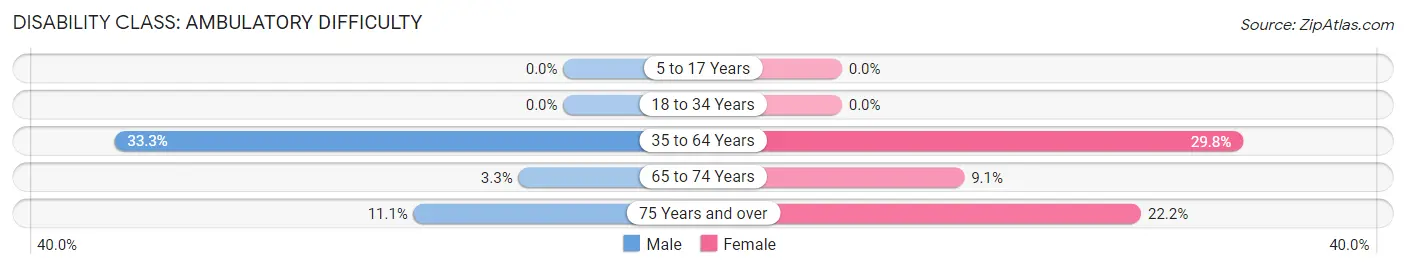
| Age Bracket | Male | Female |
| 5 to 17 Years | 0 (0.0%) | 0 (0.0%) |
| 18 to 34 Years | 0 (0.0%) | 0 (0.0%) |
| 35 to 64 Years | 15 (33.3%) | 14 (29.8%) |
| 65 to 74 Years | 1 (3.3%) | 2 (9.1%) |
| 75 Years and over | 1 (11.1%) | 4 (22.2%) |
Disability Class: Self-Care Difficulty
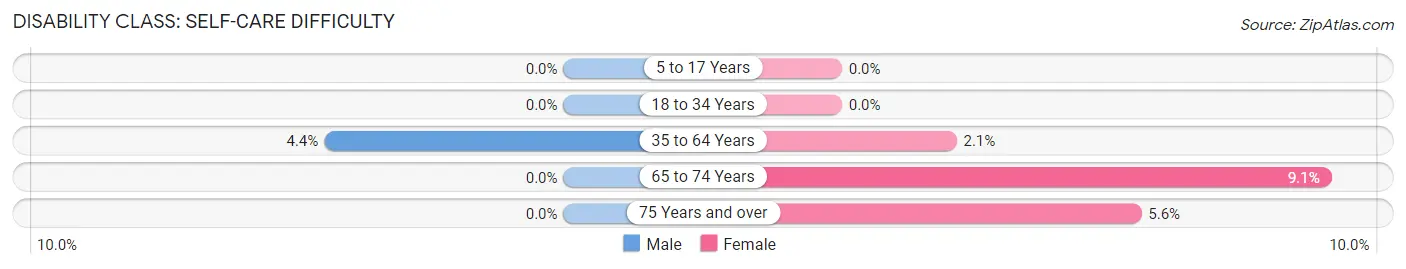
| Age Bracket | Male | Female |
| 5 to 17 Years | 0 (0.0%) | 0 (0.0%) |
| 18 to 34 Years | 0 (0.0%) | 0 (0.0%) |
| 35 to 64 Years | 2 (4.4%) | 1 (2.1%) |
| 65 to 74 Years | 0 (0.0%) | 2 (9.1%) |
| 75 Years and over | 0 (0.0%) | 1 (5.6%) |
Technology Access in Michigamme
Computing Device Access in Michigamme
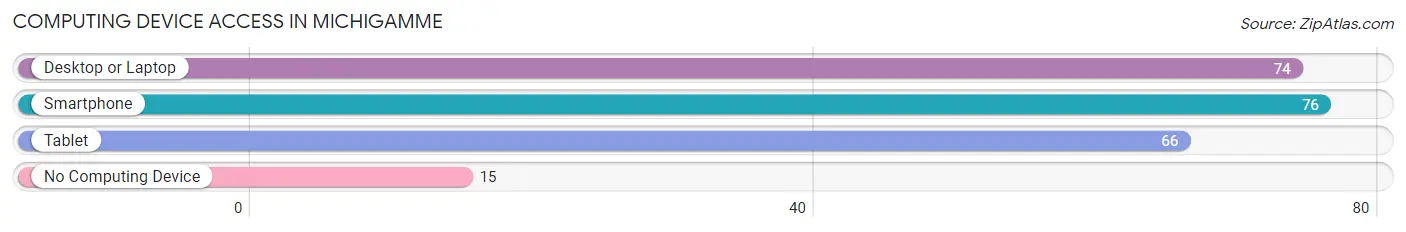
| Device Type | # Households | % Households |
| Desktop or Laptop | 74 | 73.3% |
| Smartphone | 76 | 75.2% |
| Tablet | 66 | 65.3% |
| No Computing Device | 15 | 14.8% |
| Total | 101 | 100.0% |
Internet Access in Michigamme
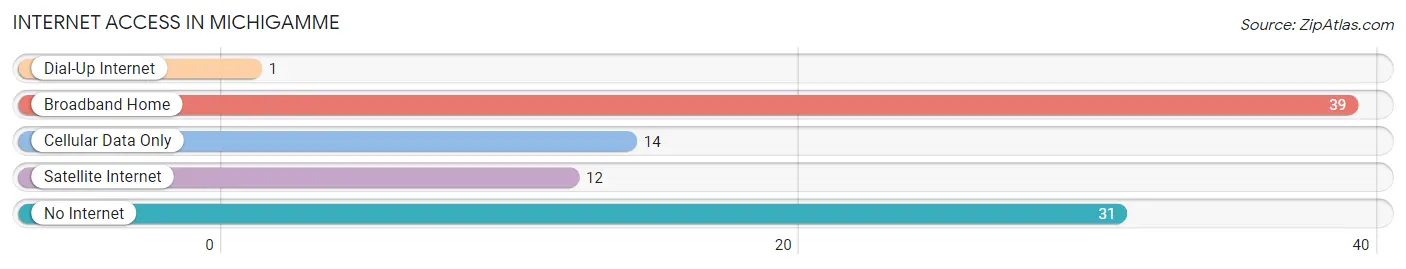
| Internet Type | # Households | % Households |
| Dial-Up Internet | 1 | 1.0% |
| Broadband Home | 39 | 38.6% |
| Cellular Data Only | 14 | 13.9% |
| Satellite Internet | 12 | 11.9% |
| No Internet | 31 | 30.7% |
| Total | 101 | 100.0% |
Michigamme Summary
Michigamme is a small town located in the Upper Peninsula of Michigan, United States. It is situated in Marquette County, and is part of the Marquette Metropolitan Statistical Area. The town is located on the shores of Lake Michigamme, and is surrounded by forests and lakes. As of the 2010 census, the population of Michigamme was 590.
History
The area that is now Michigamme was first inhabited by the Ojibwe people. The town was founded in 1871 by the Michigan Iron Company, which was looking to exploit the area’s rich iron ore deposits. The town was named after the nearby lake, which was named by the Ojibwe people. The town grew rapidly in the late 19th century, and by the early 20th century, it had become a bustling mining town. The town’s population peaked in the 1920s, when it had over 2,000 residents.
The town’s economy was heavily reliant on the iron ore industry, and when the industry began to decline in the mid-20th century, the town’s population began to decline as well. By the 1970s, the population had dropped to just over 1,000. The town’s population has remained relatively stable since then, and as of the 2010 census, the population was 590.
Geography
Michigamme is located in the Upper Peninsula of Michigan, in Marquette County. The town is situated on the shores of Lake Michigamme, and is surrounded by forests and lakes. The town is located about 25 miles northwest of Marquette, the county seat. The town is located at an elevation of 1,072 feet above sea level.
The climate in Michigamme is classified as humid continental, with cold winters and warm summers. The average temperature in January is 16°F, and the average temperature in July is 68°F. The average annual precipitation is 33 inches.
Economy
The economy of Michigamme is largely based on tourism and recreation. The town is home to several resorts and campgrounds, which attract visitors from all over the state. The town is also home to several small businesses, including restaurants, shops, and other services.
The town is also home to several manufacturing companies, which produce a variety of products, including furniture, clothing, and automotive parts. The town is also home to several logging companies, which harvest timber from the surrounding forests.
Demographics
As of the 2010 census, the population of Michigamme was 590. The racial makeup of the town was 97.2% White, 0.2% African American, 0.2% Native American, 0.2% Asian, 0.2% from other races, and 1.9% from two or more races. Hispanic or Latino of any race were 1.7% of the population.
The median income for a household in Michigamme was $37,500, and the median income for a family was $45,000. The per capita income for the town was $19,000. About 10.2% of families and 13.2% of the population were below the poverty line, including 16.7% of those under age 18 and 8.3% of those age 65 or over.
Common Questions
What is Per Capita Income in Michigamme?
Per Capita income in Michigamme is $26,893.
What is the Median Family Income in Michigamme?
Median Family Income in Michigamme is $60,000.
What is the Median Household income in Michigamme?
Median Household Income in Michigamme is $42,917.
What is Family Income Deficit in Michigamme?
Family Income Deficit in Michigamme is $12,082.
Families that are below poverty line in Michigamme earn $12,082 less on average than the poverty threshold level.
What is Inequality or Gini Index in Michigamme?
Inequality or Gini Index in Michigamme is 0.41.
What is the Total Population of Michigamme?
Total Population of Michigamme is 226.
What is the Total Male Population of Michigamme?
Total Male Population of Michigamme is 112.
What is the Total Female Population of Michigamme?
Total Female Population of Michigamme is 114.
What is the Ratio of Males per 100 Females in Michigamme?
There are 98.25 Males per 100 Females in Michigamme.
What is the Ratio of Females per 100 Males in Michigamme?
There are 101.79 Females per 100 Males in Michigamme.
What is the Median Population Age in Michigamme?
Median Population Age in Michigamme is 56.4 Years.
What is the Average Family Size in Michigamme
Average Family Size in Michigamme is 2.6 People.
What is the Average Household Size in Michigamme
Average Household Size in Michigamme is 2.2 People.
How Large is the Labor Force in Michigamme?
There are 86 People in the Labor Forcein in Michigamme.
What is the Percentage of People in the Labor Force in Michigamme?
42.8% of People are in the Labor Force in Michigamme.
What is the Unemployment Rate in Michigamme?
Unemployment Rate in Michigamme is 17.4%.