Canadian Lakes, MI Map & Demographics
Canadian Lakes Map
Canadian Lakes Overview
$37,740
PER CAPITA INCOME
$79,814
AVG FAMILY INCOME
$66,786
AVG HOUSEHOLD INCOME
29.5%
WAGE / INCOME GAP [ % ]
70.5¢/ $1
WAGE / INCOME GAP [ $ ]
0.34
INEQUALITY / GINI INDEX
2,578
TOTAL POPULATION
1,282
MALE POPULATION
1,296
FEMALE POPULATION
98.92
MALES / 100 FEMALES
101.09
FEMALES / 100 MALES
65.9
MEDIAN AGE
2.2
AVG FAMILY SIZE
1.9
AVG HOUSEHOLD SIZE
597
LABOR FORCE [ PEOPLE ]
25.2%
PERCENT IN LABOR FORCE
1.0%
UNEMPLOYMENT RATE
Canadian Lakes Area Codes
Income in Canadian Lakes
Income Overview in Canadian Lakes
Per Capita Income in Canadian Lakes is $37,740, while median incomes of families and households are $79,814 and $66,786 respectively.
| Characteristic | Number | Measure |
| Per Capita Income | 2,578 | $37,740 |
| Median Family Income | 951 | $79,814 |
| Mean Family Income | 951 | $83,091 |
| Median Household Income | 1,364 | $66,786 |
| Mean Household Income | 1,364 | $72,490 |
| Income Deficit | 951 | $0 |
| Wage / Income Gap (%) | 2,578 | 29.49% |
| Wage / Income Gap ($) | 2,578 | 70.51¢ per $1 |
| Gini / Inequality Index | 2,578 | 0.34 |
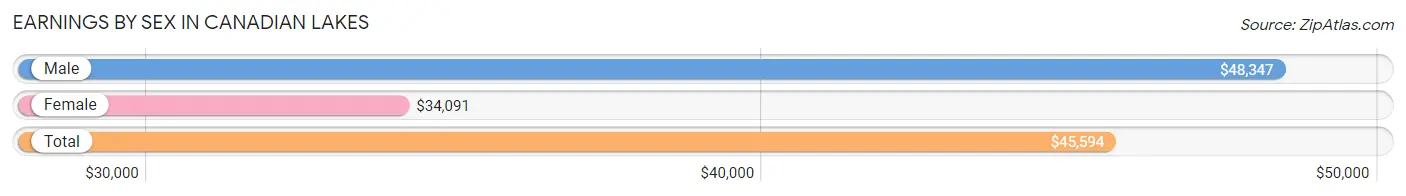
Earnings by Sex in Canadian Lakes
Average Earnings in Canadian Lakes are $45,594, $48,347 for men and $34,091 for women, a difference of 29.5%.
| Sex | Number | Average Earnings |
| Male | 407 (59.8%) | $48,347 |
| Female | 274 (40.2%) | $34,091 |
| Total | 681 (100.0%) | $45,594 |
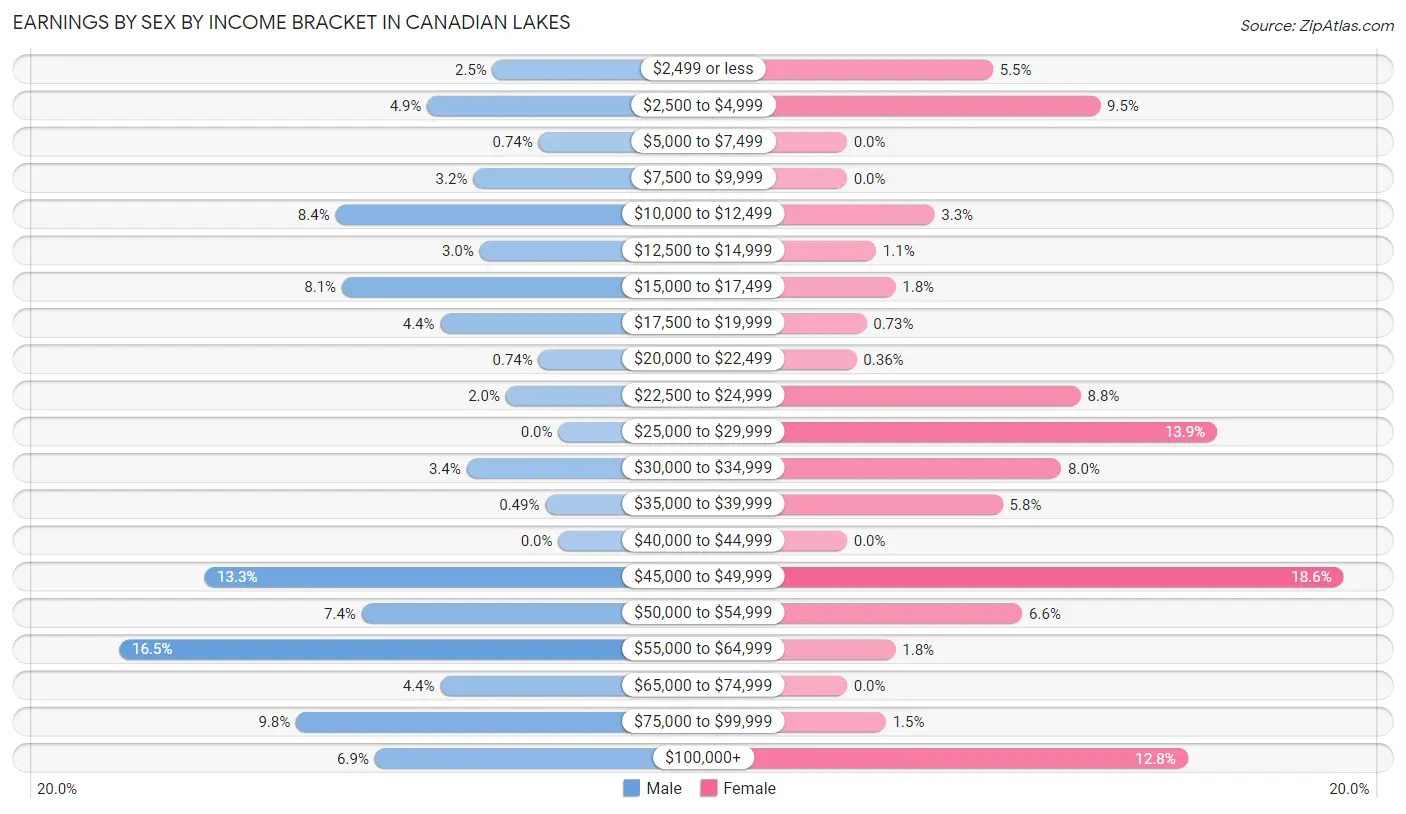
Earnings by Sex by Income Bracket in Canadian Lakes
The most common earnings brackets in Canadian Lakes are $55,000 to $64,999 for men (67 | 16.5%) and $45,000 to $49,999 for women (51 | 18.6%).
| Income | Male | Female |
| $2,499 or less | 10 (2.5%) | 15 (5.5%) |
| $2,500 to $4,999 | 20 (4.9%) | 26 (9.5%) |
| $5,000 to $7,499 | 3 (0.7%) | 0 (0.0%) |
| $7,500 to $9,999 | 13 (3.2%) | 0 (0.0%) |
| $10,000 to $12,499 | 34 (8.4%) | 9 (3.3%) |
| $12,500 to $14,999 | 12 (2.9%) | 3 (1.1%) |
| $15,000 to $17,499 | 33 (8.1%) | 5 (1.8%) |
| $17,500 to $19,999 | 18 (4.4%) | 2 (0.7%) |
| $20,000 to $22,499 | 3 (0.7%) | 1 (0.4%) |
| $22,500 to $24,999 | 8 (2.0%) | 24 (8.8%) |
| $25,000 to $29,999 | 0 (0.0%) | 38 (13.9%) |
| $30,000 to $34,999 | 14 (3.4%) | 22 (8.0%) |
| $35,000 to $39,999 | 2 (0.5%) | 16 (5.8%) |
| $40,000 to $44,999 | 0 (0.0%) | 0 (0.0%) |
| $45,000 to $49,999 | 54 (13.3%) | 51 (18.6%) |
| $50,000 to $54,999 | 30 (7.4%) | 18 (6.6%) |
| $55,000 to $64,999 | 67 (16.5%) | 5 (1.8%) |
| $65,000 to $74,999 | 18 (4.4%) | 0 (0.0%) |
| $75,000 to $99,999 | 40 (9.8%) | 4 (1.5%) |
| $100,000+ | 28 (6.9%) | 35 (12.8%) |
| Total | 407 (100.0%) | 274 (100.0%) |
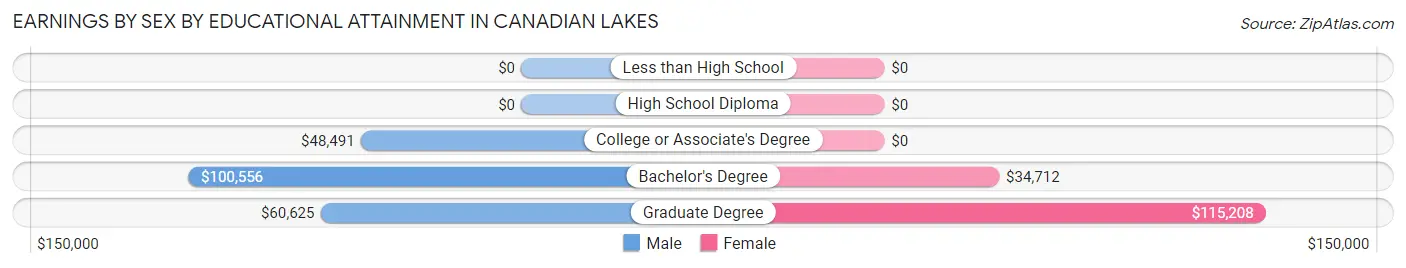
Earnings by Sex by Educational Attainment in Canadian Lakes
Average earnings in Canadian Lakes are $48,911 for men and $34,148 for women, a difference of 30.2%. Men with an educational attainment of bachelor's degree enjoy the highest average annual earnings of $100,556, while those with college or associate's degree education earn the least with $48,491. Women with an educational attainment of graduate degree earn the most with the average annual earnings of $115,208, while those with bachelor's degree education have the smallest earnings of $34,712.
| Educational Attainment | Male Income | Female Income |
| Less than High School | - | - |
| High School Diploma | - | - |
| College or Associate's Degree | $48,491 | $0 |
| Bachelor's Degree | $100,556 | $34,712 |
| Graduate Degree | $60,625 | $115,208 |
| Total | $48,911 | $34,148 |
Family Income in Canadian Lakes
Family Income Brackets in Canadian Lakes
According to the Canadian Lakes family income data, there are 278 families falling into the $75,000 to $99,999 income range, which is the most common income bracket and makes up 29.2% of all families.
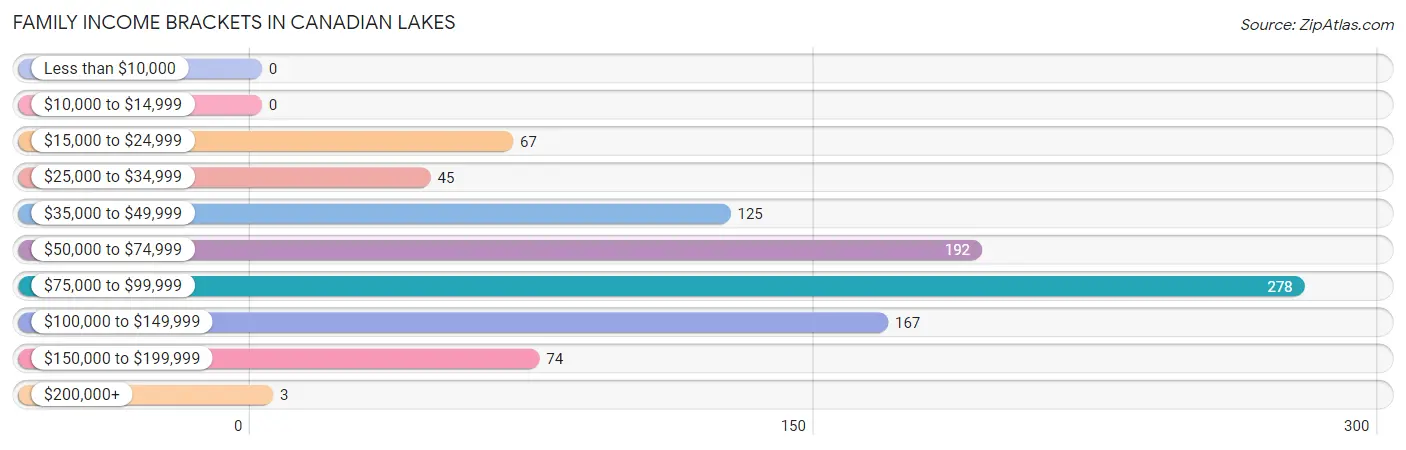
| Income Bracket | # Families | % Families |
| Less than $10,000 | 0 | 0.0% |
| $10,000 to $14,999 | 0 | 0.0% |
| $15,000 to $24,999 | 67 | 7.0% |
| $25,000 to $34,999 | 45 | 4.7% |
| $35,000 to $49,999 | 125 | 13.1% |
| $50,000 to $74,999 | 192 | 20.2% |
| $75,000 to $99,999 | 278 | 29.2% |
| $100,000 to $149,999 | 167 | 17.6% |
| $150,000 to $199,999 | 74 | 7.8% |
| $200,000+ | 3 | 0.3% |
Family Income by Famaliy Size in Canadian Lakes
5-person families (28 | 2.9%) account for the highest median family income in Canadian Lakes with $90,978 per family, while 2-person families (816 | 85.8%) have the highest median income of $39,920 per family member.
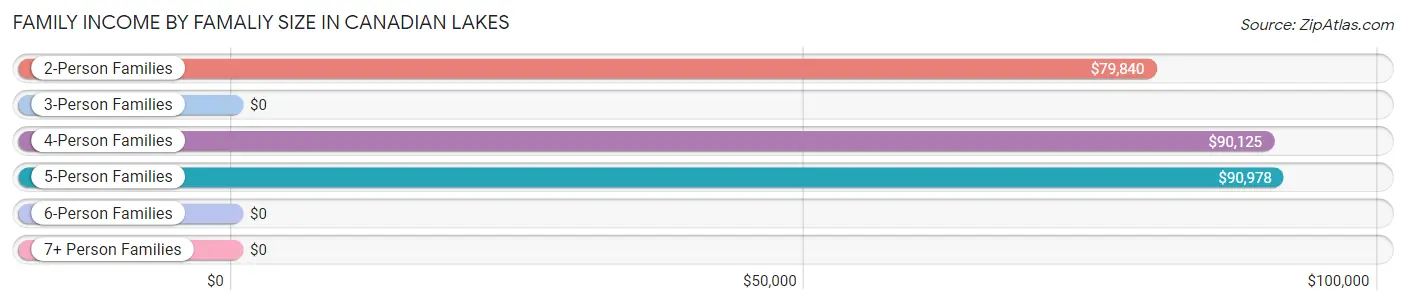
| Income Bracket | # Families | Median Income |
| 2-Person Families | 816 (85.8%) | $79,840 |
| 3-Person Families | 69 (7.3%) | $0 |
| 4-Person Families | 33 (3.5%) | $90,125 |
| 5-Person Families | 28 (2.9%) | $90,978 |
| 6-Person Families | 0 (0.0%) | $0 |
| 7+ Person Families | 5 (0.5%) | $0 |
| Total | 951 (100.0%) | $79,814 |
Family Income by Number of Earners in Canadian Lakes
The median family income in Canadian Lakes is $79,814, with families comprising 3+ earners (8) having the highest median family income of $181,000, while families with 1 earner (266) have the lowest median family income of $61,333, accounting for 0.8% and 28.0% of families, respectively.
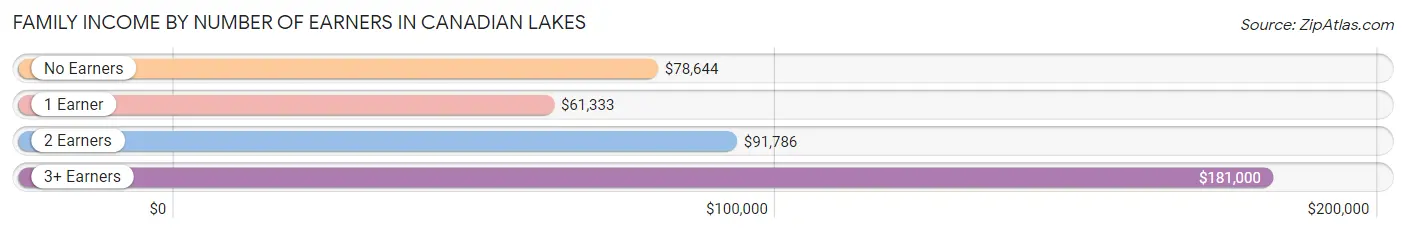
| Number of Earners | # Families | Median Income |
| No Earners | 541 (56.9%) | $78,644 |
| 1 Earner | 266 (28.0%) | $61,333 |
| 2 Earners | 136 (14.3%) | $91,786 |
| 3+ Earners | 8 (0.8%) | $181,000 |
| Total | 951 (100.0%) | $79,814 |
Household Income in Canadian Lakes
Household Income Brackets in Canadian Lakes
With 301 households falling in the category, the $50,000 to $74,999 income range is the most frequent in Canadian Lakes, accounting for 22.1% of all households. In contrast, only 3 households (0.2%) fall into the $200,000+ income bracket, making it the least populous group.
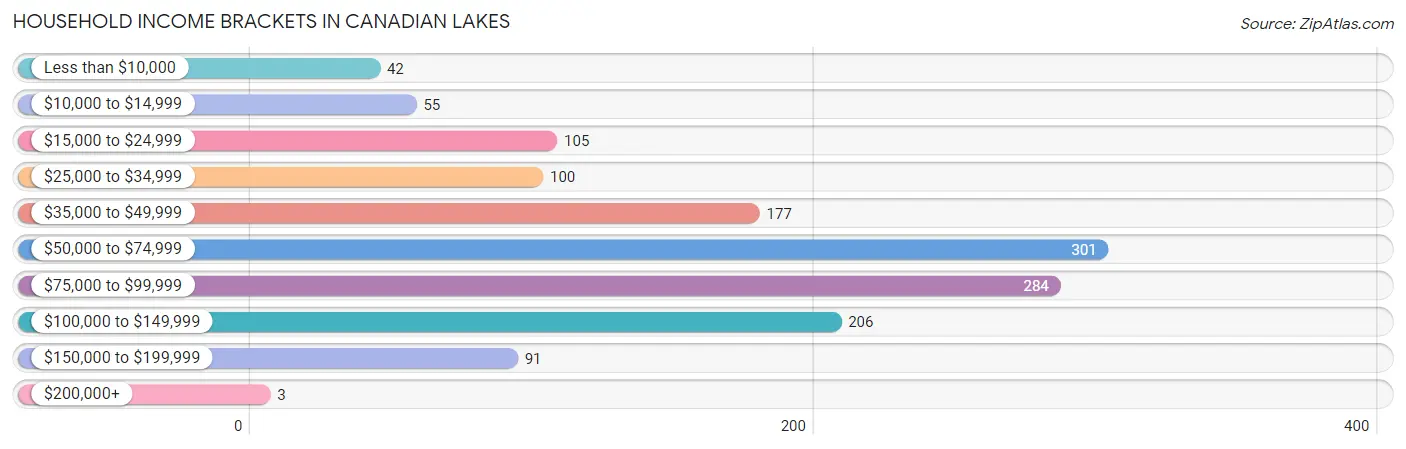
| Income Bracket | # Households | % Households |
| Less than $10,000 | 42 | 3.1% |
| $10,000 to $14,999 | 55 | 4.0% |
| $15,000 to $24,999 | 105 | 7.7% |
| $25,000 to $34,999 | 100 | 7.3% |
| $35,000 to $49,999 | 177 | 13.0% |
| $50,000 to $74,999 | 301 | 22.1% |
| $75,000 to $99,999 | 284 | 20.8% |
| $100,000 to $149,999 | 206 | 15.1% |
| $150,000 to $199,999 | 91 | 6.7% |
| $200,000+ | 3 | 0.2% |
Household Income by Householder Age in Canadian Lakes
The median household income in Canadian Lakes is $66,786, with the highest median household income of $69,926 found in the 45 to 64 years age bracket for the primary householder. A total of 336 households (24.6%) fall into this category.
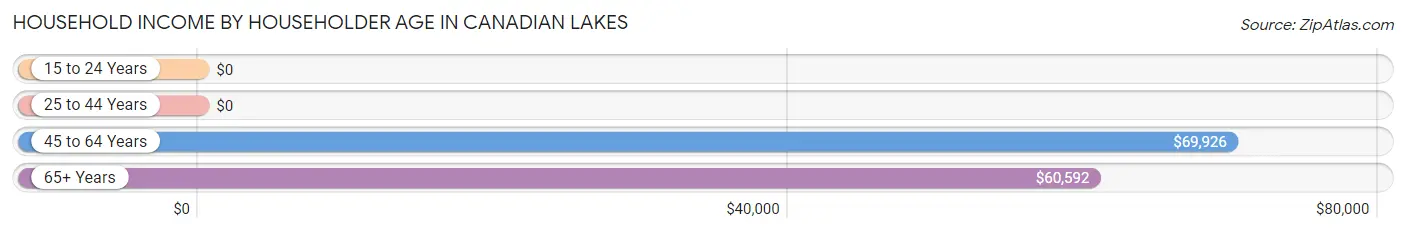
| Income Bracket | # Households | Median Income |
| 15 to 24 Years | 0 (0.0%) | $0 |
| 25 to 44 Years | 163 (11.9%) | $0 |
| 45 to 64 Years | 336 (24.6%) | $69,926 |
| 65+ Years | 865 (63.4%) | $60,592 |
| Total | 1,364 (100.0%) | $66,786 |
Poverty in Canadian Lakes
Income Below Poverty by Sex and Age in Canadian Lakes
With 9.9% poverty level for males and 5.7% for females among the residents of Canadian Lakes, 35 to 44 year old males and 45 to 54 year old females are the most vulnerable to poverty, with 34 males (39.5%) and 34 females (36.6%) in their respective age groups living below the poverty level.
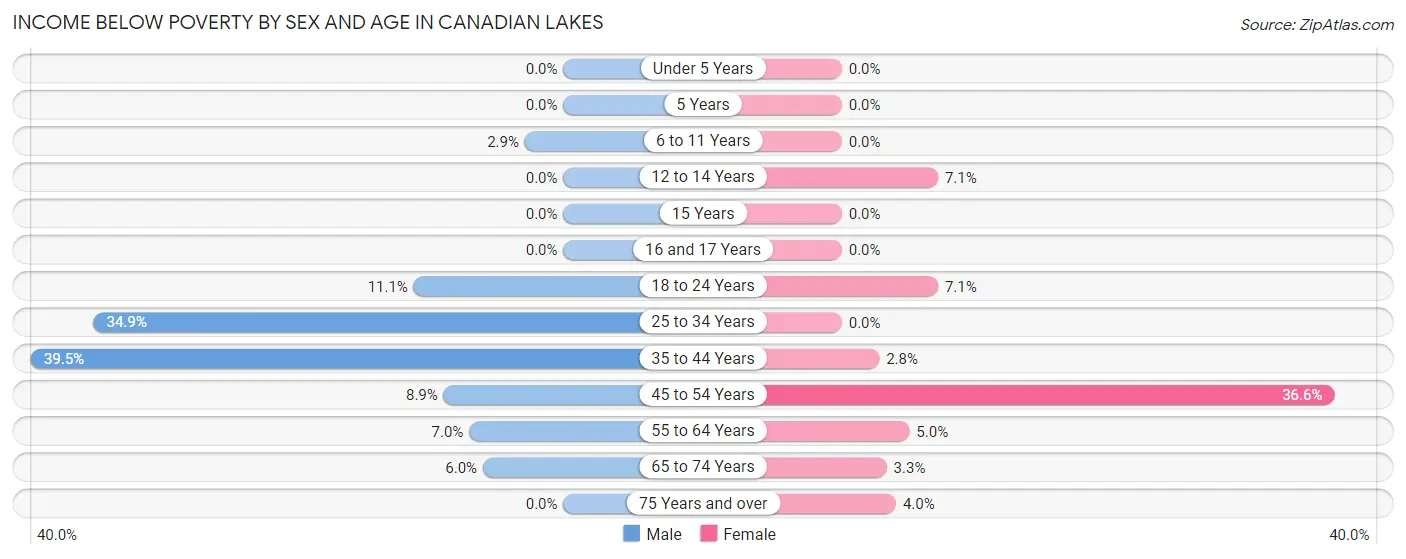
| Age Bracket | Male | Female |
| Under 5 Years | 0 (0.0%) | 0 (0.0%) |
| 5 Years | 0 (0.0%) | 0 (0.0%) |
| 6 to 11 Years | 1 (2.9%) | 0 (0.0%) |
| 12 to 14 Years | 0 (0.0%) | 1 (7.1%) |
| 15 Years | 0 (0.0%) | 0 (0.0%) |
| 16 and 17 Years | 0 (0.0%) | 0 (0.0%) |
| 18 to 24 Years | 1 (11.1%) | 1 (7.1%) |
| 25 to 34 Years | 45 (34.9%) | 0 (0.0%) |
| 35 to 44 Years | 34 (39.5%) | 1 (2.8%) |
| 45 to 54 Years | 8 (8.9%) | 34 (36.6%) |
| 55 to 64 Years | 13 (7.0%) | 12 (5.0%) |
| 65 to 74 Years | 25 (6.0%) | 15 (3.3%) |
| 75 Years and over | 0 (0.0%) | 10 (4.0%) |
| Total | 127 (9.9%) | 74 (5.7%) |
Income Above Poverty by Sex and Age in Canadian Lakes
According to the poverty statistics in Canadian Lakes, males aged under 5 years and females aged under 5 years are the age groups that are most secure financially, with 100.0% of males and 100.0% of females in these age groups living above the poverty line.
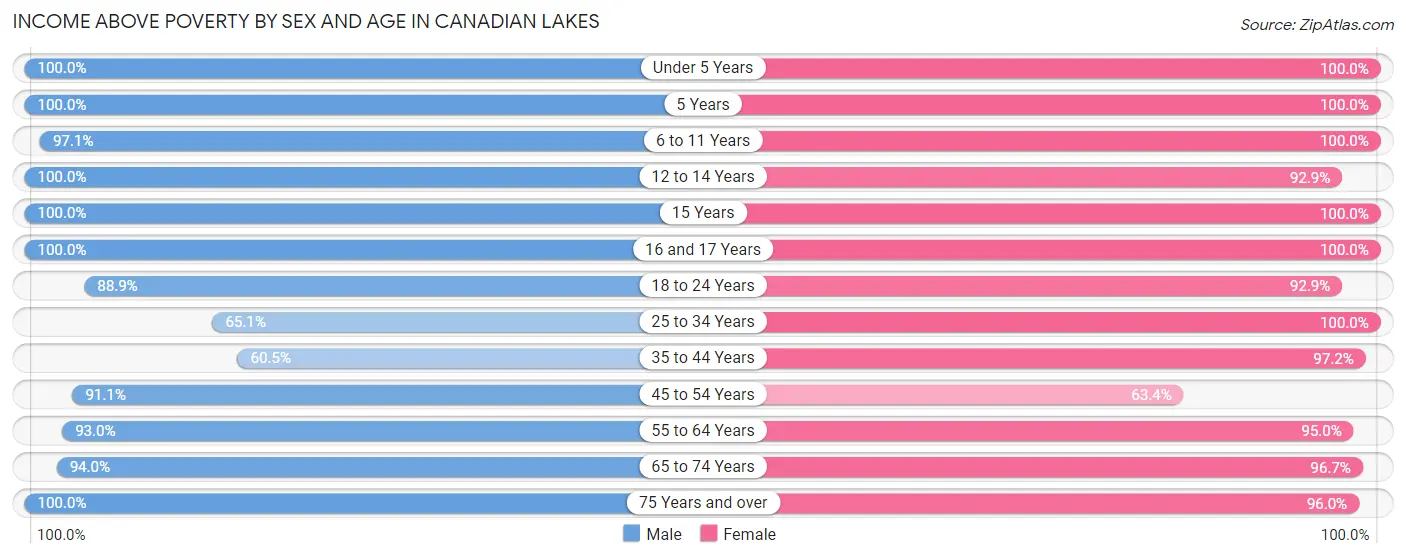
| Age Bracket | Male | Female |
| Under 5 Years | 54 (100.0%) | 19 (100.0%) |
| 5 Years | 2 (100.0%) | 5 (100.0%) |
| 6 to 11 Years | 34 (97.1%) | 50 (100.0%) |
| 12 to 14 Years | 17 (100.0%) | 13 (92.9%) |
| 15 Years | 5 (100.0%) | 8 (100.0%) |
| 16 and 17 Years | 11 (100.0%) | 42 (100.0%) |
| 18 to 24 Years | 8 (88.9%) | 13 (92.9%) |
| 25 to 34 Years | 84 (65.1%) | 77 (100.0%) |
| 35 to 44 Years | 52 (60.5%) | 35 (97.2%) |
| 45 to 54 Years | 82 (91.1%) | 59 (63.4%) |
| 55 to 64 Years | 173 (93.0%) | 227 (95.0%) |
| 65 to 74 Years | 394 (94.0%) | 435 (96.7%) |
| 75 Years and over | 239 (100.0%) | 239 (96.0%) |
| Total | 1,155 (90.1%) | 1,222 (94.3%) |
Income Below Poverty Among Married-Couple Families in Canadian Lakes
The poverty statistics for married-couple families in Canadian Lakes show that 1.9% or 15 of the total 793 families live below the poverty line. Families with no children have the highest poverty rate of 2.0%, comprising of 15 families. On the other hand, families with 1 or 2 children have the lowest poverty rate of 0.0%, which includes 0 families.
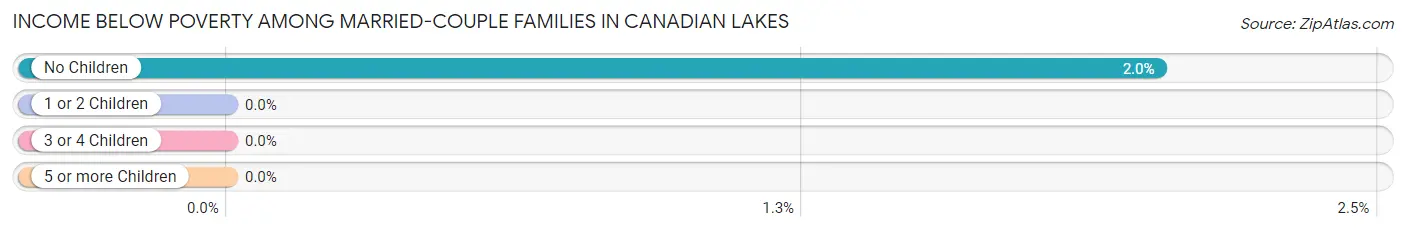
| Children | Above Poverty | Below Poverty |
| No Children | 728 (98.0%) | 15 (2.0%) |
| 1 or 2 Children | 22 (100.0%) | 0 (0.0%) |
| 3 or 4 Children | 23 (100.0%) | 0 (0.0%) |
| 5 or more Children | 5 (100.0%) | 0 (0.0%) |
| Total | 778 (98.1%) | 15 (1.9%) |
Income Below Poverty Among Single-Parent Households in Canadian Lakes
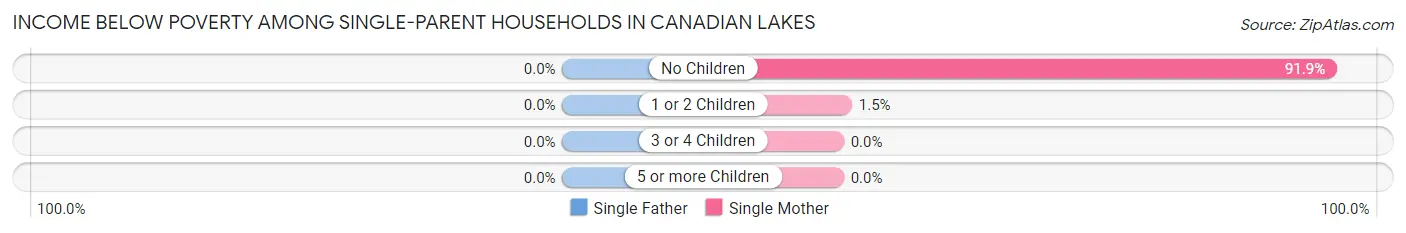
| Children | Single Father | Single Mother |
| No Children | 0 (0.0%) | 34 (91.9%) |
| 1 or 2 Children | 0 (0.0%) | 1 (1.5%) |
| 3 or 4 Children | 0 (0.0%) | 0 (0.0%) |
| 5 or more Children | 0 (0.0%) | 0 (0.0%) |
| Total | 0 (0.0%) | 35 (31.2%) |
Income Below Poverty Among Married-Couple vs Single-Parent Households in Canadian Lakes
The poverty data for Canadian Lakes shows that 15 of the married-couple family households (1.9%) and 35 of the single-parent households (22.2%) are living below the poverty level. Within the married-couple family households, those with no children have the highest poverty rate, with 15 households (2.0%) falling below the poverty line. Among the single-parent households, those with no children have the highest poverty rate, with 34 household (44.7%) living below poverty.
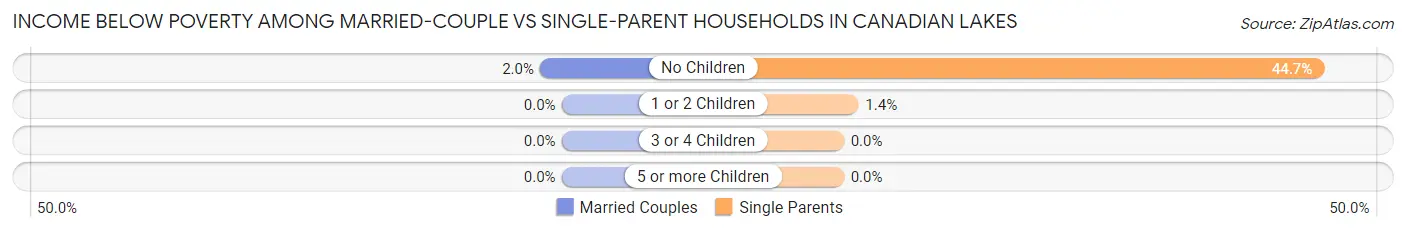
| Children | Married-Couple Families | Single-Parent Households |
| No Children | 15 (2.0%) | 34 (44.7%) |
| 1 or 2 Children | 0 (0.0%) | 1 (1.4%) |
| 3 or 4 Children | 0 (0.0%) | 0 (0.0%) |
| 5 or more Children | 0 (0.0%) | 0 (0.0%) |
| Total | 15 (1.9%) | 35 (22.2%) |
Race in Canadian Lakes
The most populous races in Canadian Lakes are White / Caucasian (2,534 | 98.3%), Two or more Races (44 | 1.7%), and Hispanic or Latino (28 | 1.1%).
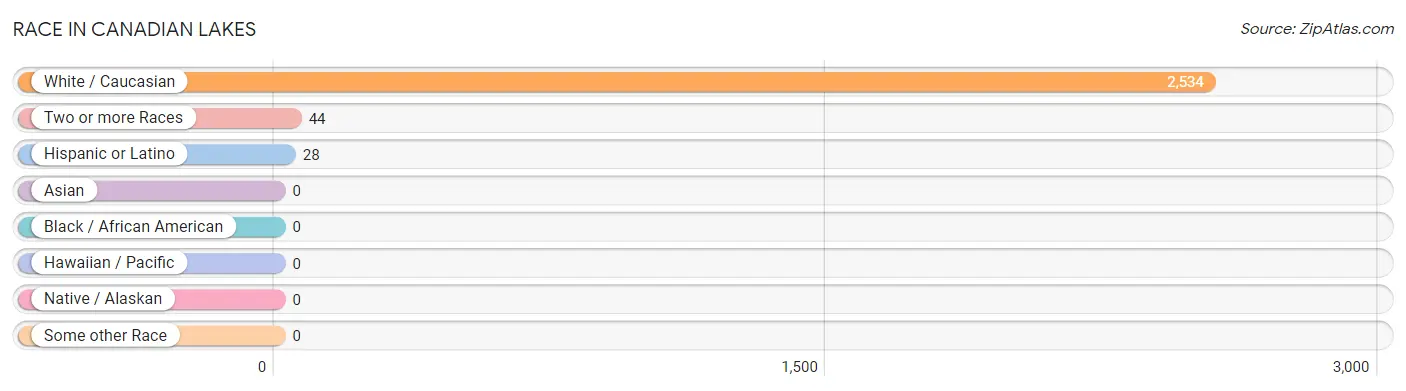
| Race | # Population | % Population |
| Asian | 0 | 0.0% |
| Black / African American | 0 | 0.0% |
| Hawaiian / Pacific | 0 | 0.0% |
| Hispanic or Latino | 28 | 1.1% |
| Native / Alaskan | 0 | 0.0% |
| White / Caucasian | 2,534 | 98.3% |
| Two or more Races | 44 | 1.7% |
| Some other Race | 0 | 0.0% |
| Total | 2,578 | 100.0% |
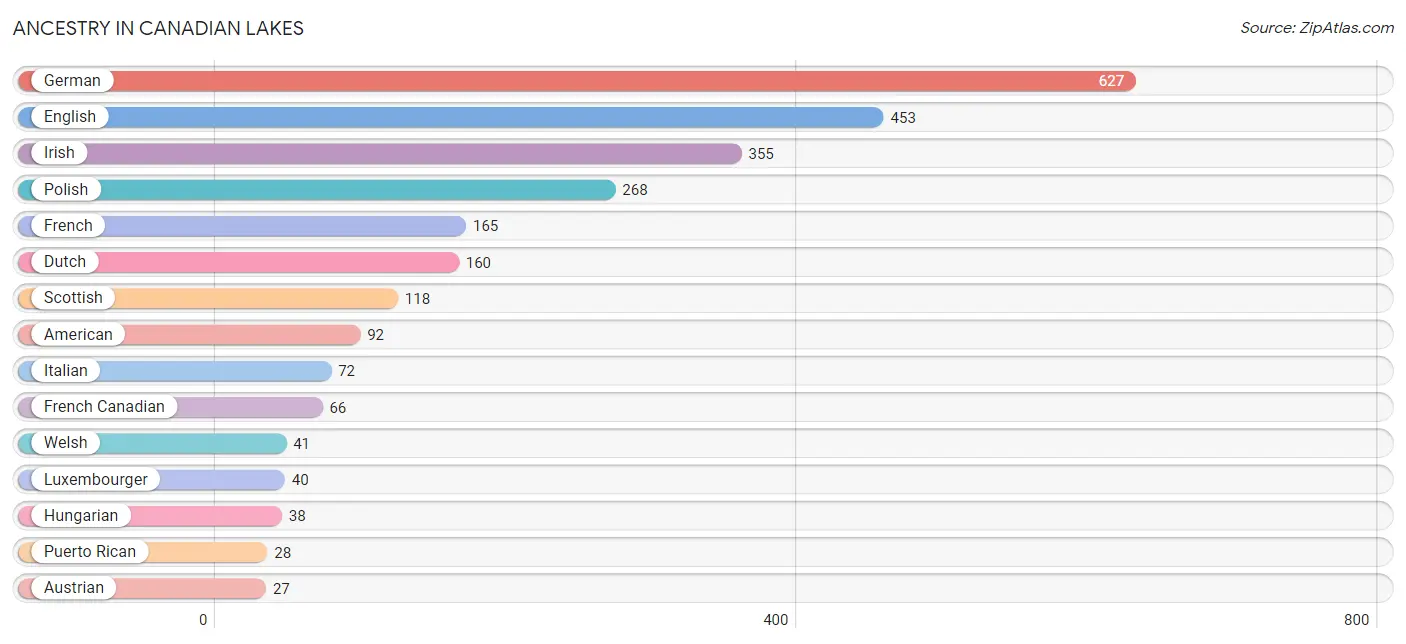
Ancestry in Canadian Lakes
The most populous ancestries reported in Canadian Lakes are German (627 | 24.3%), English (453 | 17.6%), Irish (355 | 13.8%), Polish (268 | 10.4%), and French (165 | 6.4%), together accounting for 72.5% of all Canadian Lakes residents.
| Ancestry | # Population | % Population |
| American | 92 | 3.6% |
| Arab | 17 | 0.7% |
| Austrian | 27 | 1.1% |
| Belgian | 8 | 0.3% |
| Belizean | 17 | 0.7% |
| British | 17 | 0.7% |
| Croatian | 6 | 0.2% |
| Czech | 23 | 0.9% |
| Czechoslovakian | 19 | 0.7% |
| Danish | 24 | 0.9% |
| Dutch | 160 | 6.2% |
| Eastern European | 8 | 0.3% |
| English | 453 | 17.6% |
| European | 4 | 0.2% |
| Finnish | 19 | 0.7% |
| French | 165 | 6.4% |
| French Canadian | 66 | 2.6% |
| German | 627 | 24.3% |
| Hungarian | 38 | 1.5% |
| Irish | 355 | 13.8% |
| Italian | 72 | 2.8% |
| Lebanese | 17 | 0.7% |
| Lithuanian | 8 | 0.3% |
| Luxembourger | 40 | 1.5% |
| Northern European | 3 | 0.1% |
| Norwegian | 27 | 1.1% |
| Polish | 268 | 10.4% |
| Puerto Rican | 28 | 1.1% |
| Scottish | 118 | 4.6% |
| Slovak | 14 | 0.5% |
| Swedish | 26 | 1.0% |
| Thai | 22 | 0.9% |
| Ukrainian | 17 | 0.7% |
| Welsh | 41 | 1.6% | View All 34 Rows |
Immigrants in Canadian Lakes
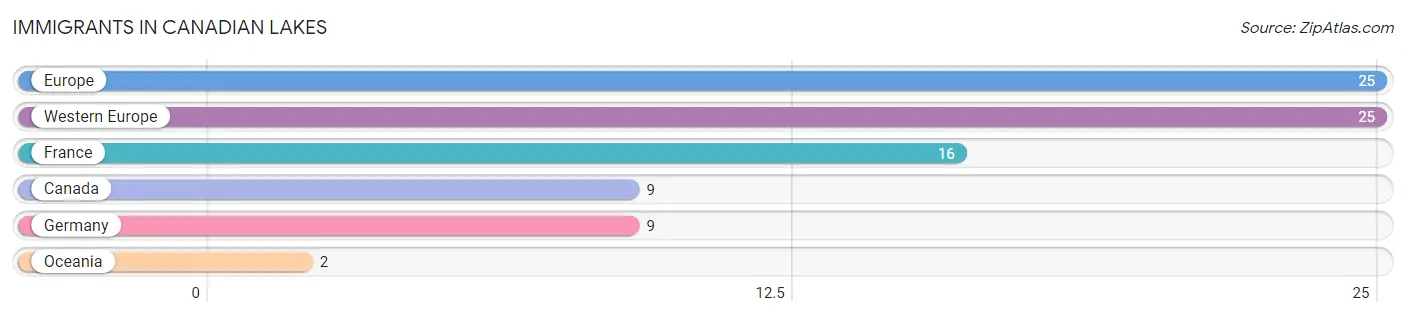
The most numerous immigrant groups reported in Canadian Lakes came from Europe (25 | 1.0%), Western Europe (25 | 1.0%), France (16 | 0.6%), Canada (9 | 0.4%), and Germany (9 | 0.4%), together accounting for 3.3% of all Canadian Lakes residents.
| Immigration Origin | # Population | % Population |
| Canada | 9 | 0.4% |
| Europe | 25 | 1.0% |
| France | 16 | 0.6% |
| Germany | 9 | 0.4% |
| Oceania | 2 | 0.1% |
| Western Europe | 25 | 1.0% | View All 6 Rows |
Sex and Age in Canadian Lakes
Sex and Age in Canadian Lakes
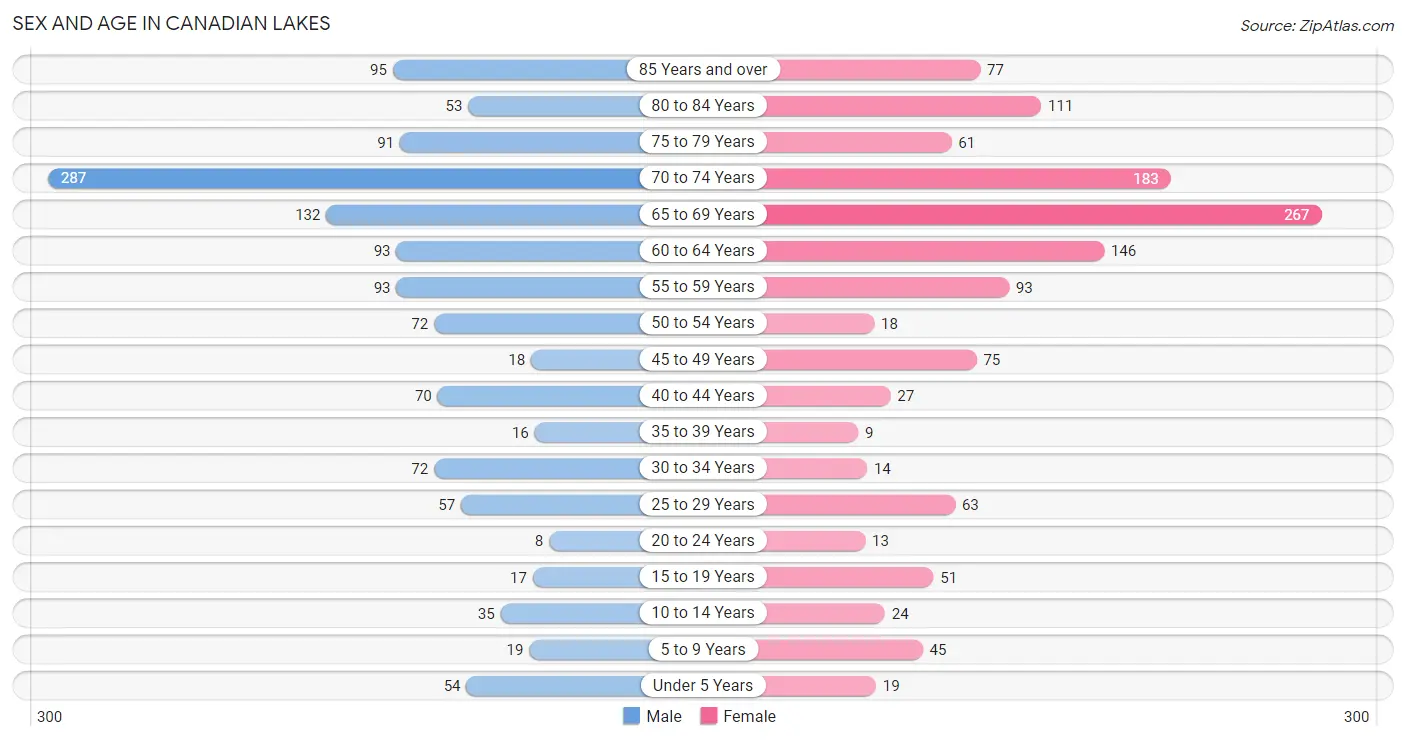
The most populous age groups in Canadian Lakes are 70 to 74 Years (287 | 22.4%) for men and 65 to 69 Years (267 | 20.6%) for women.
| Age Bracket | Male | Female |
| Under 5 Years | 54 (4.2%) | 19 (1.5%) |
| 5 to 9 Years | 19 (1.5%) | 45 (3.5%) |
| 10 to 14 Years | 35 (2.7%) | 24 (1.8%) |
| 15 to 19 Years | 17 (1.3%) | 51 (3.9%) |
| 20 to 24 Years | 8 (0.6%) | 13 (1.0%) |
| 25 to 29 Years | 57 (4.4%) | 63 (4.9%) |
| 30 to 34 Years | 72 (5.6%) | 14 (1.1%) |
| 35 to 39 Years | 16 (1.3%) | 9 (0.7%) |
| 40 to 44 Years | 70 (5.5%) | 27 (2.1%) |
| 45 to 49 Years | 18 (1.4%) | 75 (5.8%) |
| 50 to 54 Years | 72 (5.6%) | 18 (1.4%) |
| 55 to 59 Years | 93 (7.2%) | 93 (7.2%) |
| 60 to 64 Years | 93 (7.2%) | 146 (11.3%) |
| 65 to 69 Years | 132 (10.3%) | 267 (20.6%) |
| 70 to 74 Years | 287 (22.4%) | 183 (14.1%) |
| 75 to 79 Years | 91 (7.1%) | 61 (4.7%) |
| 80 to 84 Years | 53 (4.1%) | 111 (8.6%) |
| 85 Years and over | 95 (7.4%) | 77 (5.9%) |
| Total | 1,282 (100.0%) | 1,296 (100.0%) |
Families and Households in Canadian Lakes
Median Family Size in Canadian Lakes
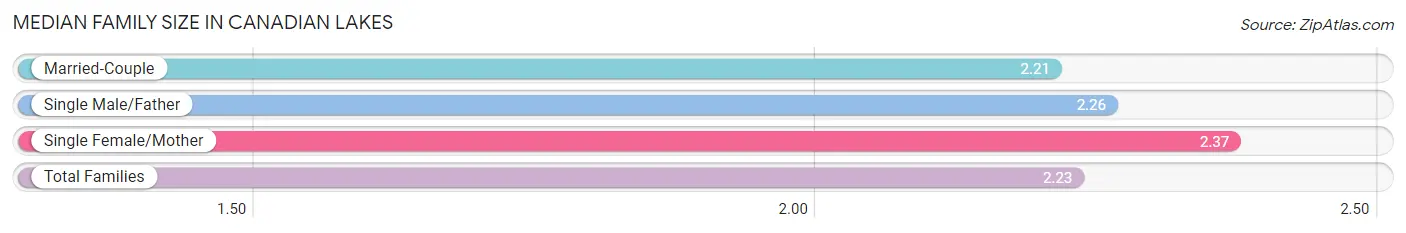
The median family size in Canadian Lakes is 2.23 persons per family, with single female/mother families (112 | 11.8%) accounting for the largest median family size of 2.37 persons per family. On the other hand, married-couple families (793 | 83.4%) represent the smallest median family size with 2.21 persons per family.
| Family Type | # Families | Family Size |
| Married-Couple | 793 (83.4%) | 2.21 |
| Single Male/Father | 46 (4.8%) | 2.26 |
| Single Female/Mother | 112 (11.8%) | 2.37 |
| Total Families | 951 (100.0%) | 2.23 |
Median Household Size in Canadian Lakes
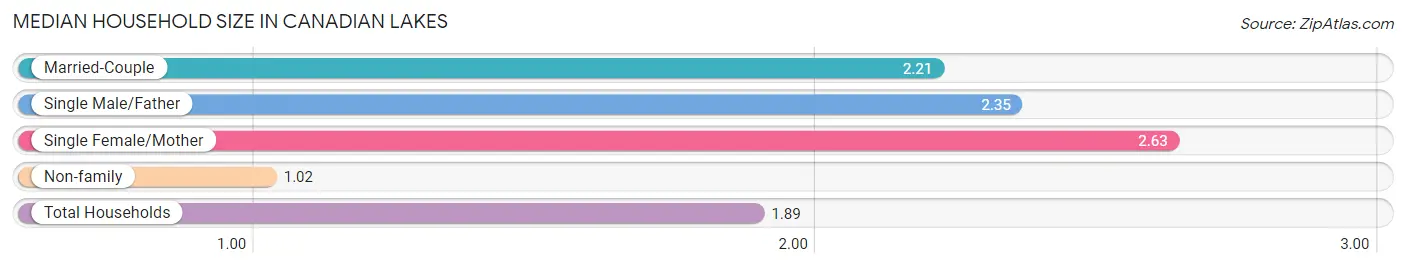
The median household size in Canadian Lakes is 1.89 persons per household, with single female/mother households (112 | 8.2%) accounting for the largest median household size of 2.63 persons per household. non-family households (413 | 30.3%) represent the smallest median household size with 1.02 persons per household.
| Household Type | # Households | Household Size |
| Married-Couple | 793 (58.1%) | 2.21 |
| Single Male/Father | 46 (3.4%) | 2.35 |
| Single Female/Mother | 112 (8.2%) | 2.63 |
| Non-family | 413 (30.3%) | 1.02 |
| Total Households | 1,364 (100.0%) | 1.89 |
Household Size by Marriage Status in Canadian Lakes
Out of a total of 1,364 households in Canadian Lakes, 951 (69.7%) are family households, while 413 (30.3%) are nonfamily households. The most numerous type of family households are 2-person households, comprising 779, and the most common type of nonfamily households are 1-person households, comprising 403.
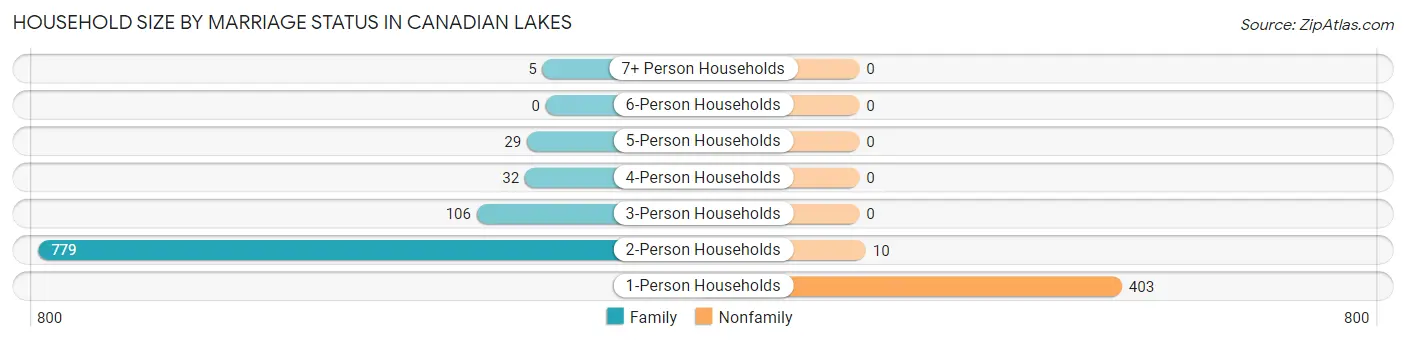
| Household Size | Family Households | Nonfamily Households |
| 1-Person Households | - | 403 (29.5%) |
| 2-Person Households | 779 (57.1%) | 10 (0.7%) |
| 3-Person Households | 106 (7.8%) | 0 (0.0%) |
| 4-Person Households | 32 (2.4%) | 0 (0.0%) |
| 5-Person Households | 29 (2.1%) | 0 (0.0%) |
| 6-Person Households | 0 (0.0%) | 0 (0.0%) |
| 7+ Person Households | 5 (0.4%) | 0 (0.0%) |
| Total | 951 (69.7%) | 413 (30.3%) |
Female Fertility in Canadian Lakes
Fertility by Age in Canadian Lakes
Average fertility rate in Canadian Lakes is 28.0 births per 1,000 women. Women in the age bracket of 20 to 34 years have the highest fertility rate with 78.0 births per 1,000 women. Women in the age bracket of 20 to 34 years acount for 100.0% of all women with births.
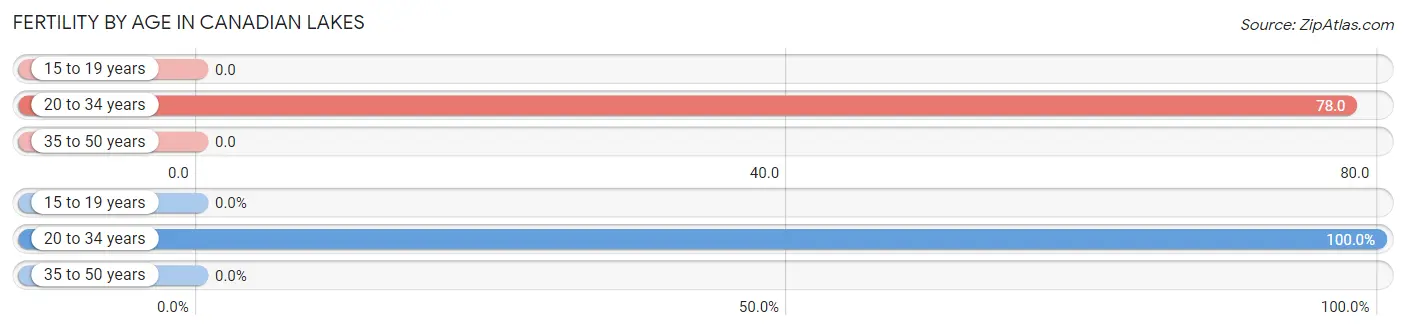
| Age Bracket | Women with Births | Births / 1,000 Women |
| 15 to 19 years | 0 (0.0%) | 0.0 |
| 20 to 34 years | 7 (100.0%) | 78.0 |
| 35 to 50 years | 0 (0.0%) | 0.0 |
| Total | 7 (100.0%) | 28.0 |
Fertility by Age by Marriage Status in Canadian Lakes
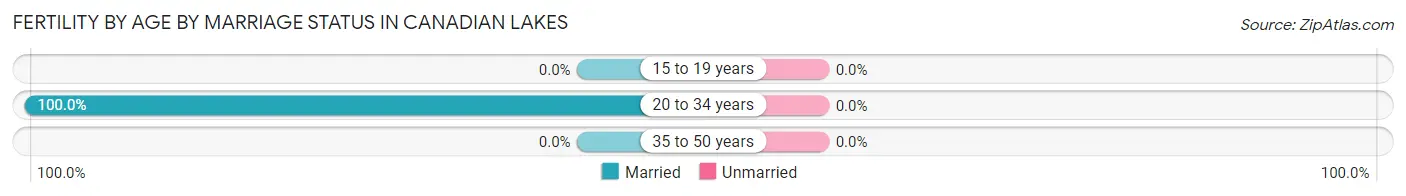
| Age Bracket | Married | Unmarried |
| 15 to 19 years | 0 (0.0%) | 0 (0.0%) |
| 20 to 34 years | 7 (100.0%) | 0 (0.0%) |
| 35 to 50 years | 0 (0.0%) | 0 (0.0%) |
| Total | 7 (100.0%) | 0 (0.0%) |
Fertility by Education in Canadian Lakes
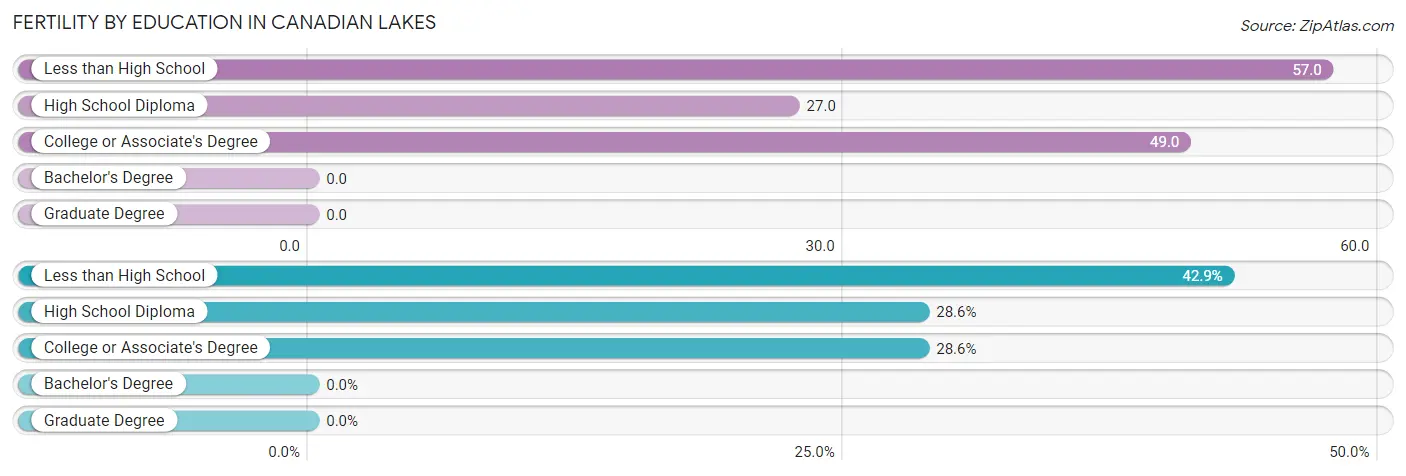
| Educational Attainment | Women with Births | Births / 1,000 Women |
| Less than High School | 3 (42.9%) | 57.0 |
| High School Diploma | 2 (28.6%) | 27.0 |
| College or Associate's Degree | 2 (28.6%) | 49.0 |
| Bachelor's Degree | 0 (0.0%) | 0.0 |
| Graduate Degree | 0 (0.0%) | 0.0 |
| Total | 7 (100.0%) | 28.0 |
Fertility by Education by Marriage Status in Canadian Lakes
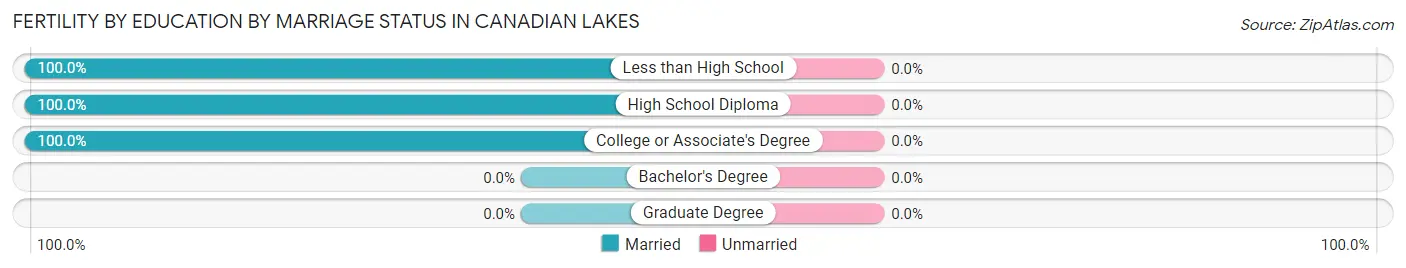
| Educational Attainment | Married | Unmarried |
| Less than High School | 3 (100.0%) | 0 (0.0%) |
| High School Diploma | 2 (100.0%) | 0 (0.0%) |
| College or Associate's Degree | 2 (100.0%) | 0 (0.0%) |
| Bachelor's Degree | 0 (0.0%) | 0 (0.0%) |
| Graduate Degree | 0 (0.0%) | 0 (0.0%) |
| Total | 7 (100.0%) | 0 (0.0%) |
Employment Characteristics in Canadian Lakes
Employment by Class of Employer in Canadian Lakes
Among the 575 employed individuals in Canadian Lakes, private company employees (408 | 71.0%), local government employees (57 | 9.9%), and state government employees (52 | 9.0%) make up the most common classes of employment.
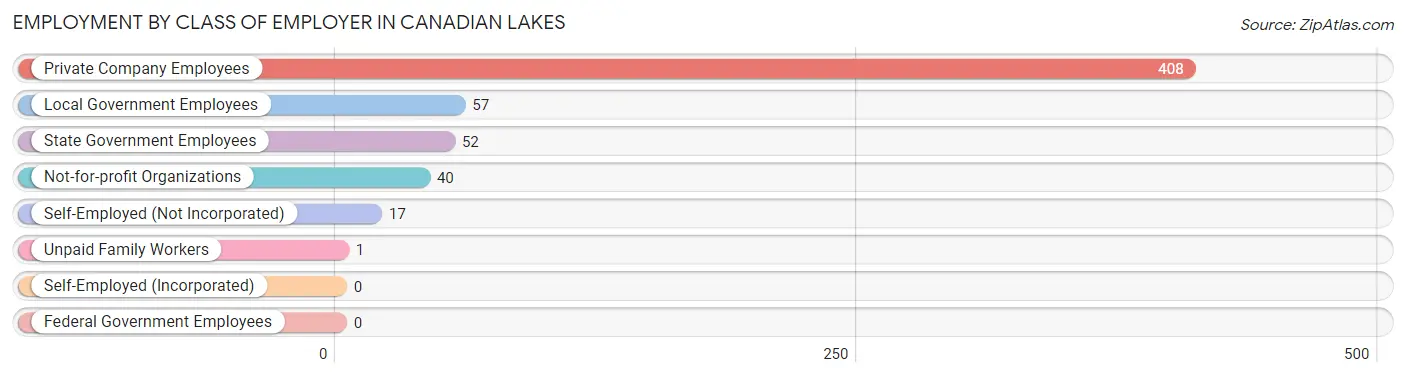
| Employer Class | # Employees | % Employees |
| Private Company Employees | 408 | 71.0% |
| Self-Employed (Incorporated) | 0 | 0.0% |
| Self-Employed (Not Incorporated) | 17 | 3.0% |
| Not-for-profit Organizations | 40 | 7.0% |
| Local Government Employees | 57 | 9.9% |
| State Government Employees | 52 | 9.0% |
| Federal Government Employees | 0 | 0.0% |
| Unpaid Family Workers | 1 | 0.2% |
| Total | 575 | 100.0% |
Employment Status by Age in Canadian Lakes
According to the labor force statistics for Canadian Lakes, out of the total population over 16 years of age (2,369), 25.2% or 597 individuals are in the labor force, with 1.0% or 6 of them unemployed. The age group with the highest labor force participation rate is 25 to 29 years, with 98.3% or 118 individuals in the labor force. Within the labor force, the 20 to 24 years age range has the highest percentage of unemployed individuals, with 35.7% or 5 of them being unemployed.
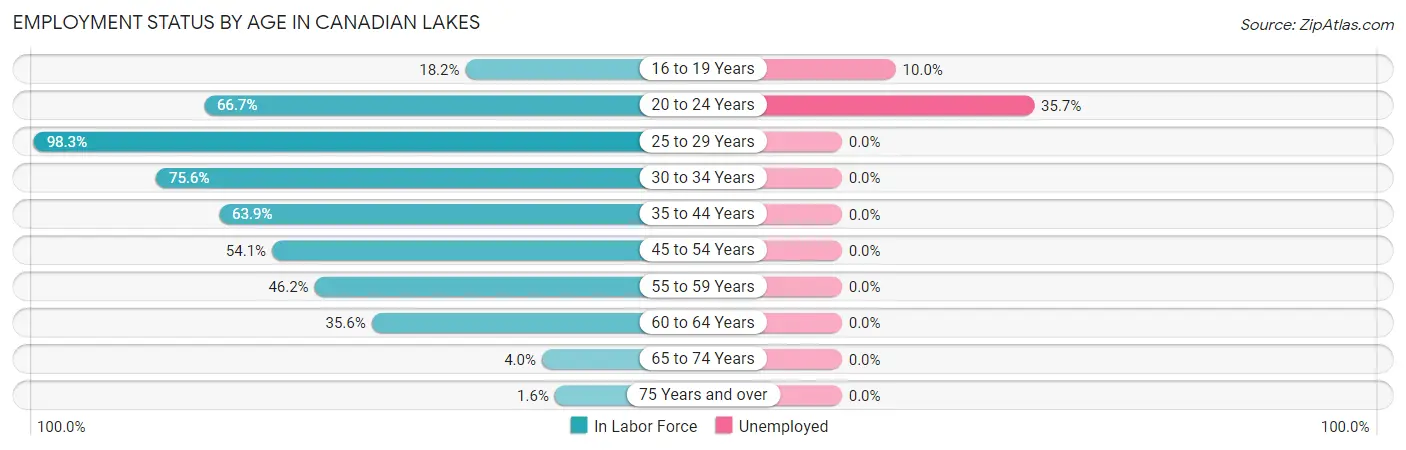
| Age Bracket | In Labor Force | Unemployed |
| 16 to 19 Years | 10 (18.2%) | 1 (10.0%) |
| 20 to 24 Years | 14 (66.7%) | 5 (35.7%) |
| 25 to 29 Years | 118 (98.3%) | 0 (0.0%) |
| 30 to 34 Years | 65 (75.6%) | 0 (0.0%) |
| 35 to 44 Years | 78 (63.9%) | 0 (0.0%) |
| 45 to 54 Years | 99 (54.1%) | 0 (0.0%) |
| 55 to 59 Years | 86 (46.2%) | 0 (0.0%) |
| 60 to 64 Years | 85 (35.6%) | 0 (0.0%) |
| 65 to 74 Years | 35 (4.0%) | 0 (0.0%) |
| 75 Years and over | 8 (1.6%) | 0 (0.0%) |
| Total | 597 (25.2%) | 6 (1.0%) |
Employment Status by Educational Attainment in Canadian Lakes
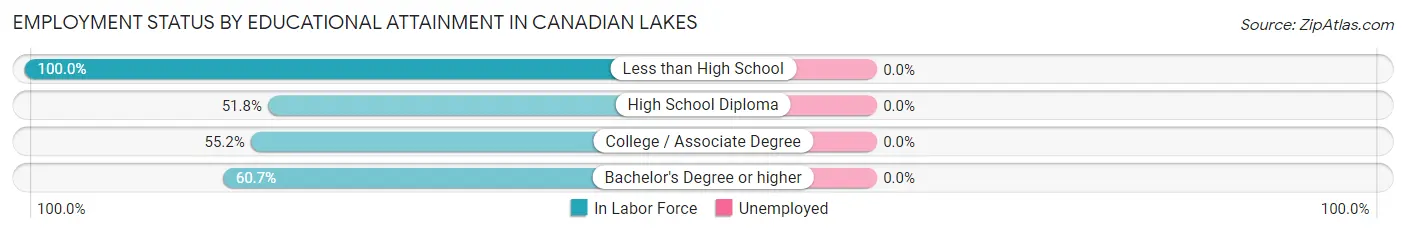
| Educational Attainment | In Labor Force | Unemployed |
| Less than High School | 15 (100.0%) | 0 (0.0%) |
| High School Diploma | 147 (51.8%) | 0 (0.0%) |
| College / Associate Degree | 179 (55.2%) | 0 (0.0%) |
| Bachelor's Degree or higher | 190 (60.7%) | 0 (0.0%) |
| Total | 531 (56.7%) | 0 (0.0%) |
Employment Occupations by Sex in Canadian Lakes
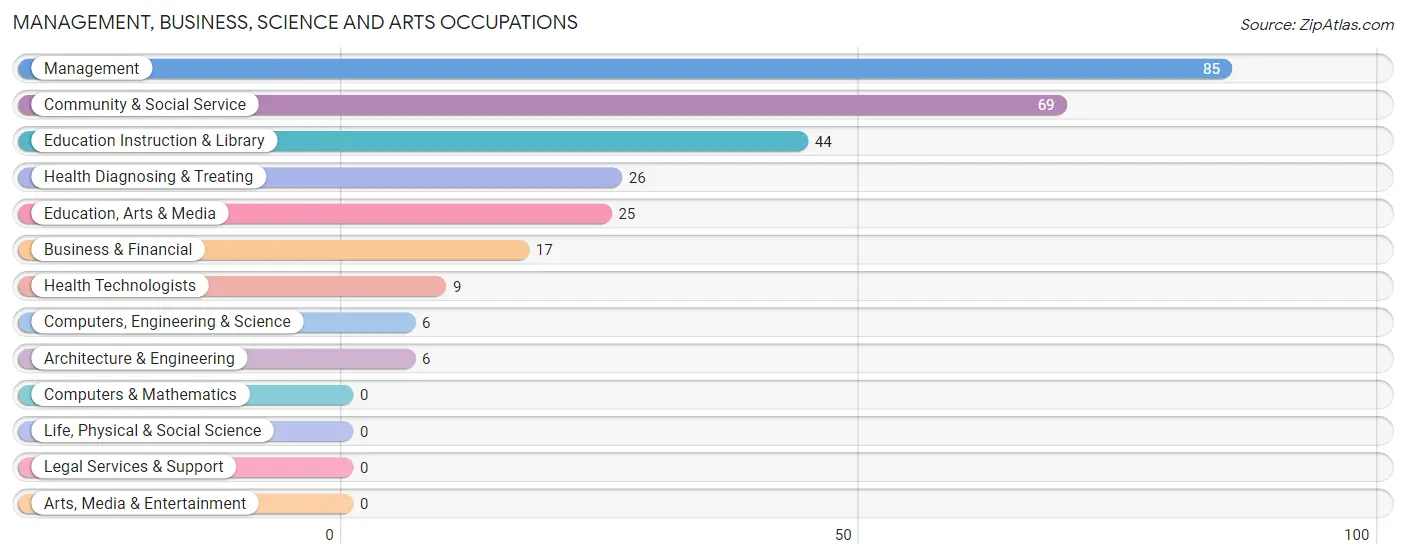
Management, Business, Science and Arts Occupations
The most common Management, Business, Science and Arts occupations in Canadian Lakes are Management (85 | 14.4%), Community & Social Service (69 | 11.7%), Education Instruction & Library (44 | 7.4%), Health Diagnosing & Treating (26 | 4.4%), and Education, Arts & Media (25 | 4.2%).
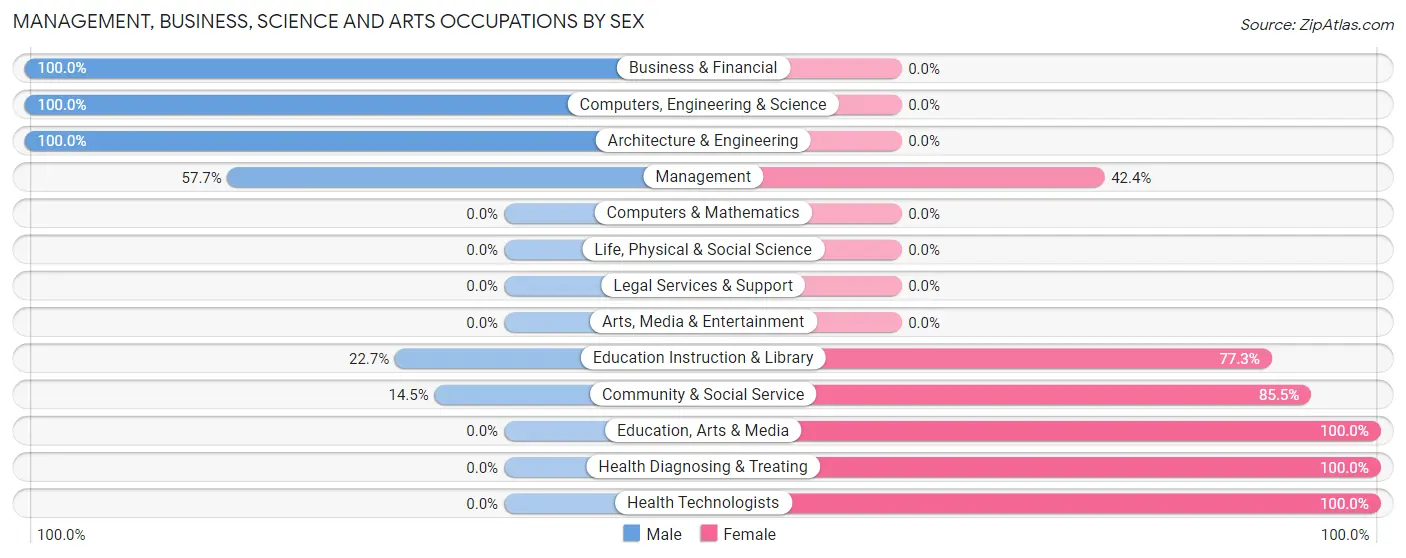
Management, Business, Science and Arts Occupations by Sex
Within the Management, Business, Science and Arts occupations in Canadian Lakes, the most male-oriented occupations are Business & Financial (100.0%), Computers, Engineering & Science (100.0%), and Architecture & Engineering (100.0%), while the most female-oriented occupations are Education, Arts & Media (100.0%), Health Diagnosing & Treating (100.0%), and Health Technologists (100.0%).
| Occupation | Male | Female |
| Management | 49 (57.7%) | 36 (42.3%) |
| Business & Financial | 17 (100.0%) | 0 (0.0%) |
| Computers, Engineering & Science | 6 (100.0%) | 0 (0.0%) |
| Computers & Mathematics | 0 (0.0%) | 0 (0.0%) |
| Architecture & Engineering | 6 (100.0%) | 0 (0.0%) |
| Life, Physical & Social Science | 0 (0.0%) | 0 (0.0%) |
| Community & Social Service | 10 (14.5%) | 59 (85.5%) |
| Education, Arts & Media | 0 (0.0%) | 25 (100.0%) |
| Legal Services & Support | 0 (0.0%) | 0 (0.0%) |
| Education Instruction & Library | 10 (22.7%) | 34 (77.3%) |
| Arts, Media & Entertainment | 0 (0.0%) | 0 (0.0%) |
| Health Diagnosing & Treating | 0 (0.0%) | 26 (100.0%) |
| Health Technologists | 0 (0.0%) | 9 (100.0%) |
| Total (Category) | 82 (40.4%) | 121 (59.6%) |
| Total (Overall) | 347 (58.6%) | 245 (41.4%) |
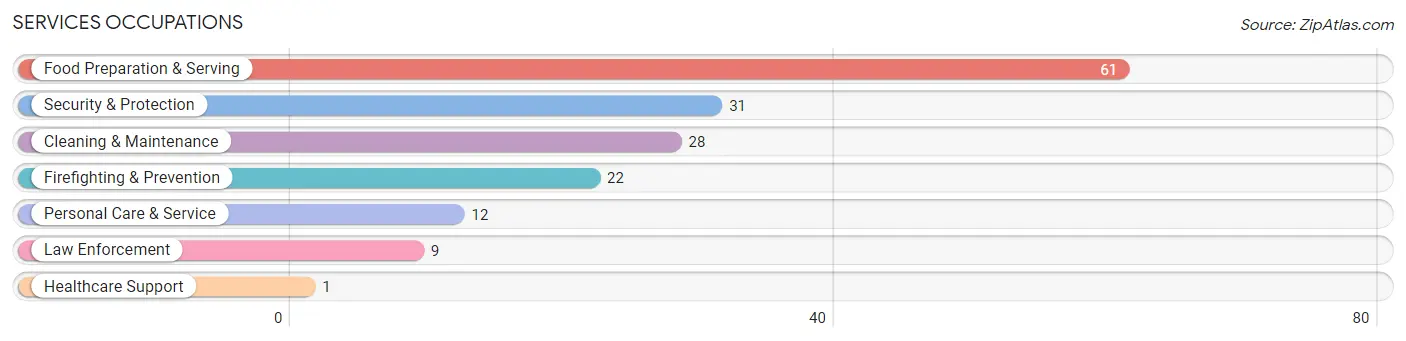
Services Occupations
The most common Services occupations in Canadian Lakes are Food Preparation & Serving (61 | 10.3%), Security & Protection (31 | 5.2%), Cleaning & Maintenance (28 | 4.7%), Firefighting & Prevention (22 | 3.7%), and Personal Care & Service (12 | 2.0%).
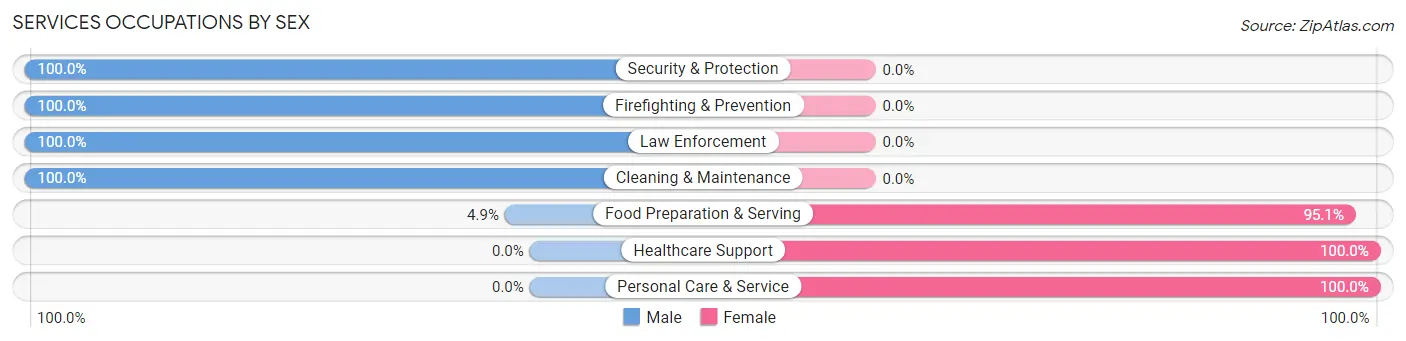
Services Occupations by Sex
Within the Services occupations in Canadian Lakes, the most male-oriented occupations are Security & Protection (100.0%), Firefighting & Prevention (100.0%), and Law Enforcement (100.0%), while the most female-oriented occupations are Healthcare Support (100.0%), Personal Care & Service (100.0%), and Food Preparation & Serving (95.1%).
| Occupation | Male | Female |
| Healthcare Support | 0 (0.0%) | 1 (100.0%) |
| Security & Protection | 31 (100.0%) | 0 (0.0%) |
| Firefighting & Prevention | 22 (100.0%) | 0 (0.0%) |
| Law Enforcement | 9 (100.0%) | 0 (0.0%) |
| Food Preparation & Serving | 3 (4.9%) | 58 (95.1%) |
| Cleaning & Maintenance | 28 (100.0%) | 0 (0.0%) |
| Personal Care & Service | 0 (0.0%) | 12 (100.0%) |
| Total (Category) | 62 (46.6%) | 71 (53.4%) |
| Total (Overall) | 347 (58.6%) | 245 (41.4%) |
Sales and Office Occupations
The most common Sales and Office occupations in Canadian Lakes are Sales & Related (87 | 14.7%), and Office & Administration (22 | 3.7%).
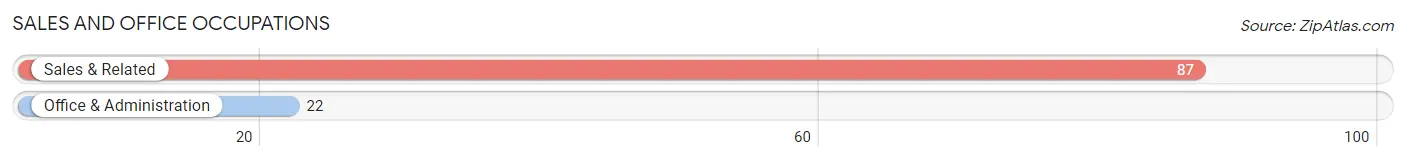
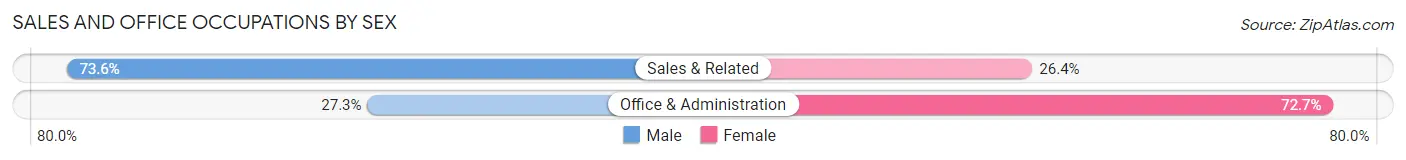
Sales and Office Occupations by Sex
| Occupation | Male | Female |
| Sales & Related | 64 (73.6%) | 23 (26.4%) |
| Office & Administration | 6 (27.3%) | 16 (72.7%) |
| Total (Category) | 70 (64.2%) | 39 (35.8%) |
| Total (Overall) | 347 (58.6%) | 245 (41.4%) |
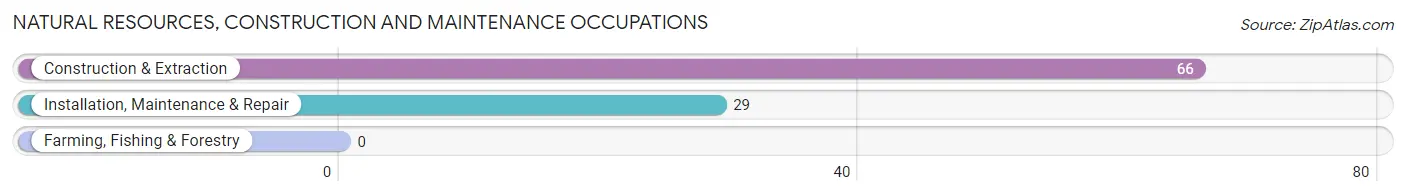
Natural Resources, Construction and Maintenance Occupations
The most common Natural Resources, Construction and Maintenance occupations in Canadian Lakes are Construction & Extraction (66 | 11.2%), and Installation, Maintenance & Repair (29 | 4.9%).
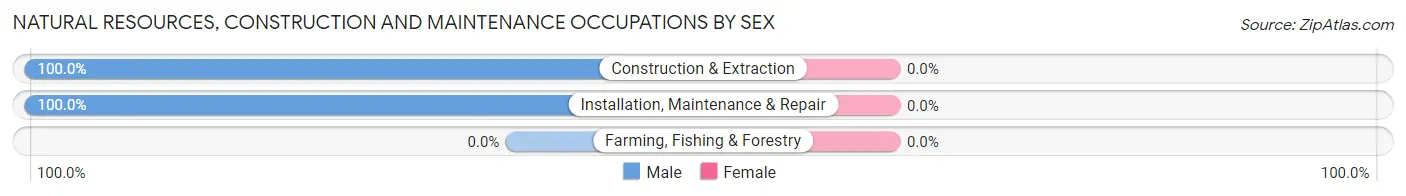
Natural Resources, Construction and Maintenance Occupations by Sex
| Occupation | Male | Female |
| Farming, Fishing & Forestry | 0 (0.0%) | 0 (0.0%) |
| Construction & Extraction | 66 (100.0%) | 0 (0.0%) |
| Installation, Maintenance & Repair | 29 (100.0%) | 0 (0.0%) |
| Total (Category) | 95 (100.0%) | 0 (0.0%) |
| Total (Overall) | 347 (58.6%) | 245 (41.4%) |
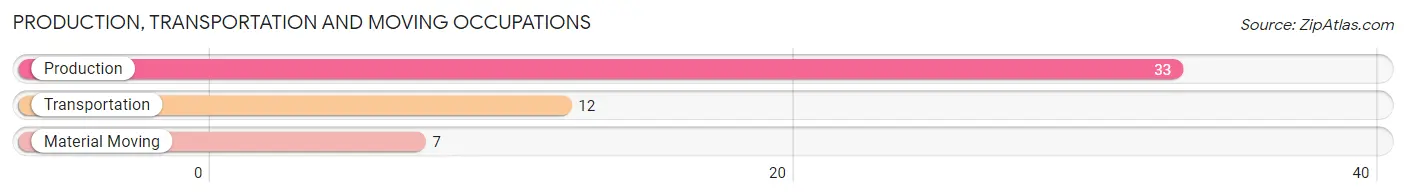
Production, Transportation and Moving Occupations
The most common Production, Transportation and Moving occupations in Canadian Lakes are Production (33 | 5.6%), Transportation (12 | 2.0%), and Material Moving (7 | 1.2%).
Production, Transportation and Moving Occupations by Sex
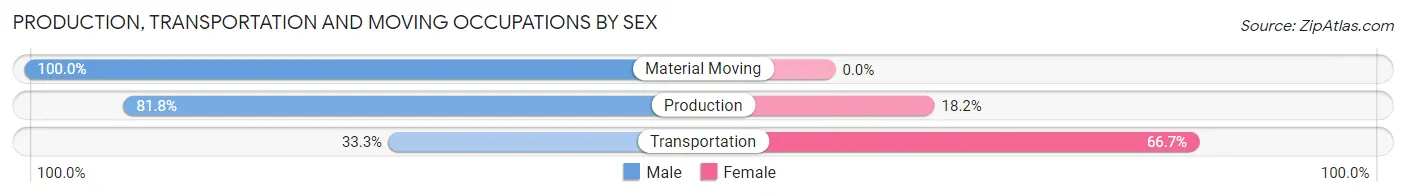
| Occupation | Male | Female |
| Production | 27 (81.8%) | 6 (18.2%) |
| Transportation | 4 (33.3%) | 8 (66.7%) |
| Material Moving | 7 (100.0%) | 0 (0.0%) |
| Total (Category) | 38 (73.1%) | 14 (26.9%) |
| Total (Overall) | 347 (58.6%) | 245 (41.4%) |
Employment Industries by Sex in Canadian Lakes
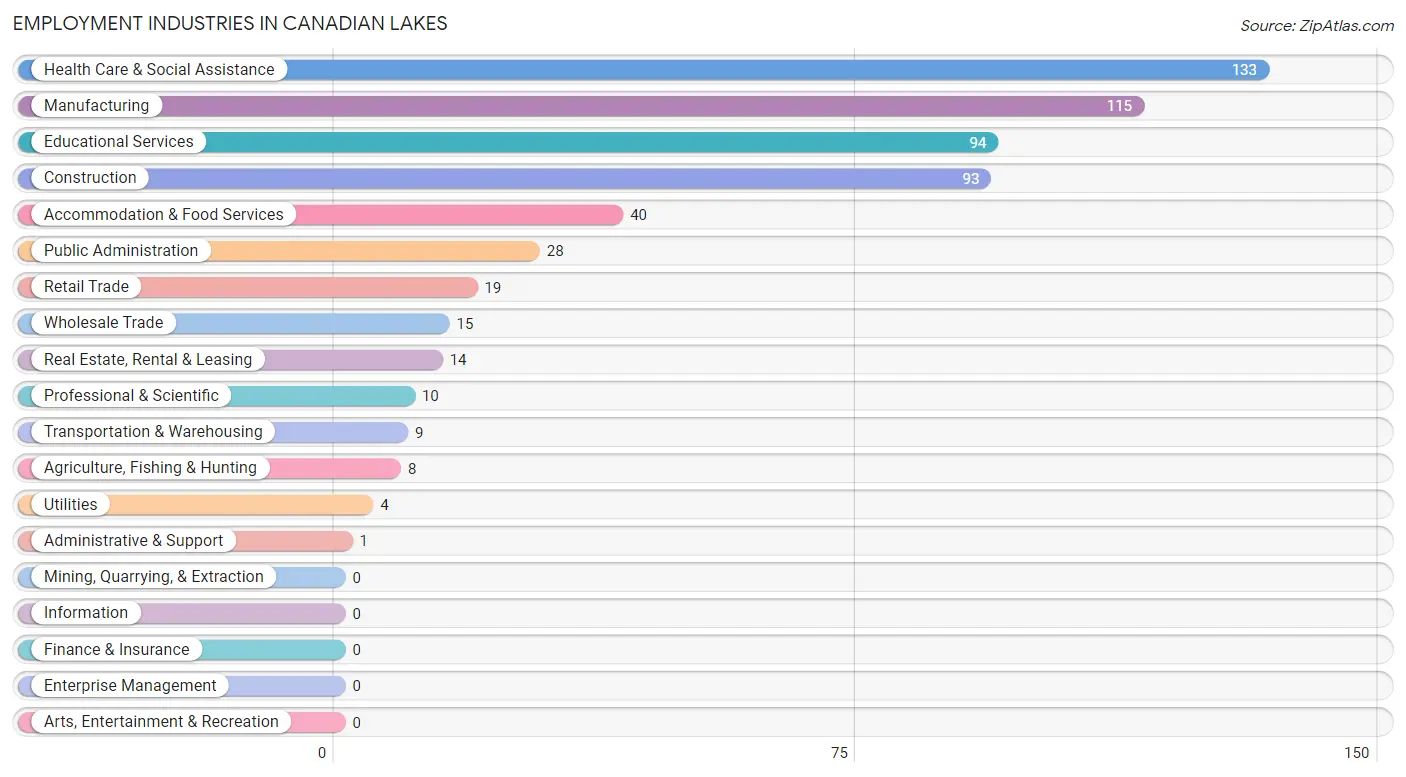
Employment Industries in Canadian Lakes
The major employment industries in Canadian Lakes include Health Care & Social Assistance (133 | 22.5%), Manufacturing (115 | 19.4%), Educational Services (94 | 15.9%), Construction (93 | 15.7%), and Accommodation & Food Services (40 | 6.8%).
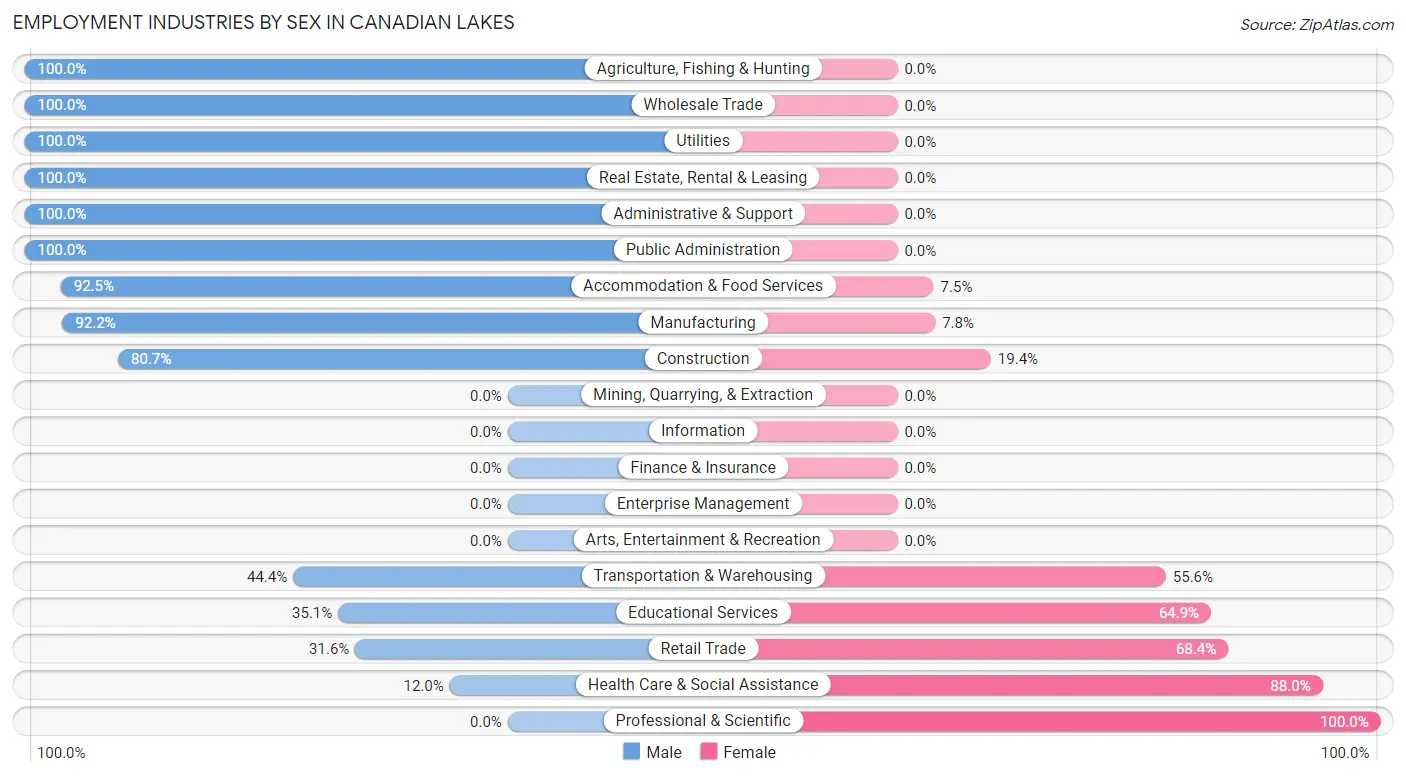
Employment Industries by Sex in Canadian Lakes
The Canadian Lakes industries that see more men than women are Agriculture, Fishing & Hunting (100.0%), Wholesale Trade (100.0%), and Utilities (100.0%), whereas the industries that tend to have a higher number of women are Professional & Scientific (100.0%), Health Care & Social Assistance (88.0%), and Retail Trade (68.4%).
| Industry | Male | Female |
| Agriculture, Fishing & Hunting | 8 (100.0%) | 0 (0.0%) |
| Mining, Quarrying, & Extraction | 0 (0.0%) | 0 (0.0%) |
| Construction | 75 (80.6%) | 18 (19.4%) |
| Manufacturing | 106 (92.2%) | 9 (7.8%) |
| Wholesale Trade | 15 (100.0%) | 0 (0.0%) |
| Retail Trade | 6 (31.6%) | 13 (68.4%) |
| Transportation & Warehousing | 4 (44.4%) | 5 (55.6%) |
| Utilities | 4 (100.0%) | 0 (0.0%) |
| Information | 0 (0.0%) | 0 (0.0%) |
| Finance & Insurance | 0 (0.0%) | 0 (0.0%) |
| Real Estate, Rental & Leasing | 14 (100.0%) | 0 (0.0%) |
| Professional & Scientific | 0 (0.0%) | 10 (100.0%) |
| Enterprise Management | 0 (0.0%) | 0 (0.0%) |
| Administrative & Support | 1 (100.0%) | 0 (0.0%) |
| Educational Services | 33 (35.1%) | 61 (64.9%) |
| Health Care & Social Assistance | 16 (12.0%) | 117 (88.0%) |
| Arts, Entertainment & Recreation | 0 (0.0%) | 0 (0.0%) |
| Accommodation & Food Services | 37 (92.5%) | 3 (7.5%) |
| Public Administration | 28 (100.0%) | 0 (0.0%) |
| Total | 347 (58.6%) | 245 (41.4%) |
Education in Canadian Lakes
School Enrollment in Canadian Lakes
The most common levels of schooling among the 229 students in Canadian Lakes are high school (83 | 36.2%), kindergarten (39 | 17.0%), and college / undergraduate (38 | 16.6%).
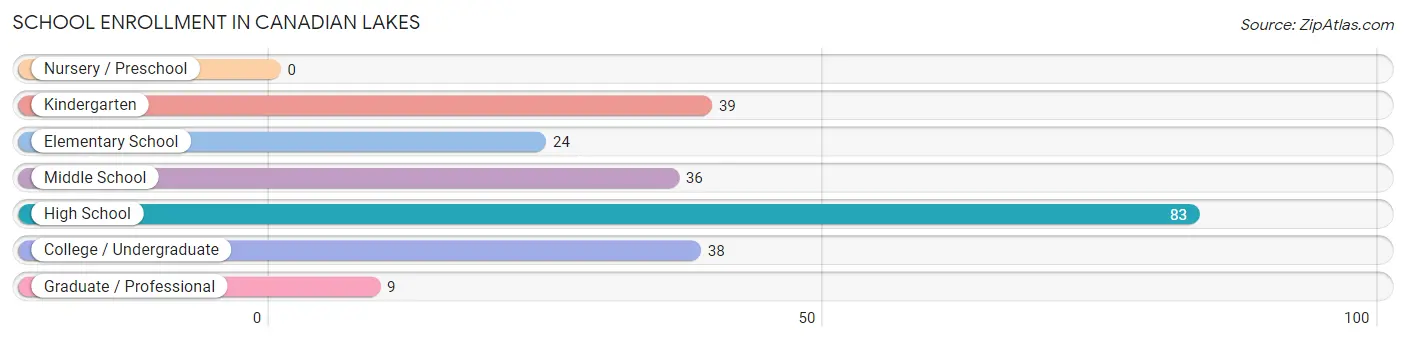
| School Level | # Students | % Students |
| Nursery / Preschool | 0 | 0.0% |
| Kindergarten | 39 | 17.0% |
| Elementary School | 24 | 10.5% |
| Middle School | 36 | 15.7% |
| High School | 83 | 36.2% |
| College / Undergraduate | 38 | 16.6% |
| Graduate / Professional | 9 | 3.9% |
| Total | 229 | 100.0% |
School Enrollment by Age by Funding Source in Canadian Lakes
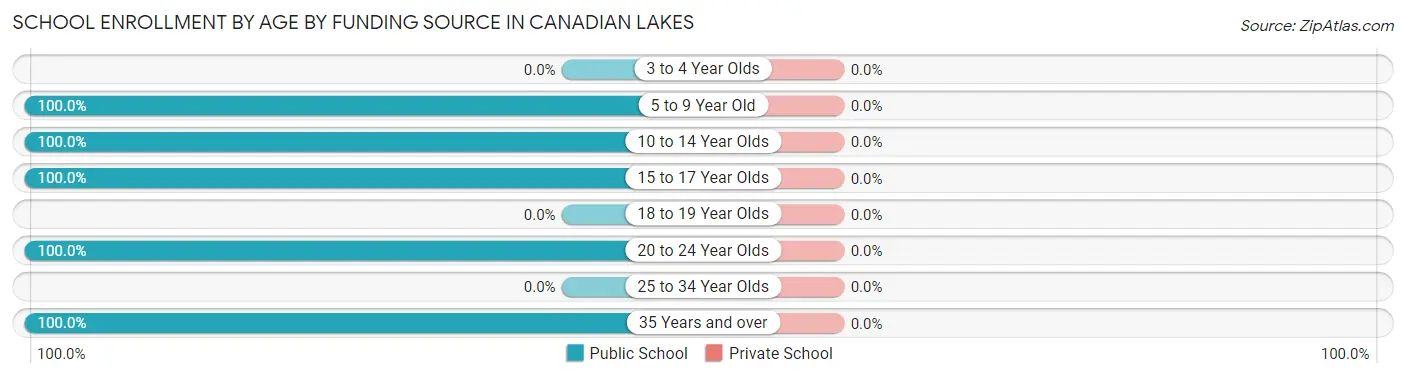
| Age Bracket | Public School | Private School |
| 3 to 4 Year Olds | 0 (0.0%) | 0 (0.0%) |
| 5 to 9 Year Old | 57 (100.0%) | 0 (0.0%) |
| 10 to 14 Year Olds | 59 (100.0%) | 0 (0.0%) |
| 15 to 17 Year Olds | 66 (100.0%) | 0 (0.0%) |
| 18 to 19 Year Olds | 0 (0.0%) | 0 (0.0%) |
| 20 to 24 Year Olds | 5 (100.0%) | 0 (0.0%) |
| 25 to 34 Year Olds | 0 (0.0%) | 0 (0.0%) |
| 35 Years and over | 42 (100.0%) | 0 (0.0%) |
| Total | 229 (100.0%) | 0 (0.0%) |
Educational Attainment by Field of Study in Canadian Lakes
Education (232 | 25.6%), business (124 | 13.7%), science & technology (107 | 11.8%), arts & humanities (90 | 9.9%), and social sciences (82 | 9.0%) are the most common fields of study among 906 individuals in Canadian Lakes who have obtained a bachelor's degree or higher.
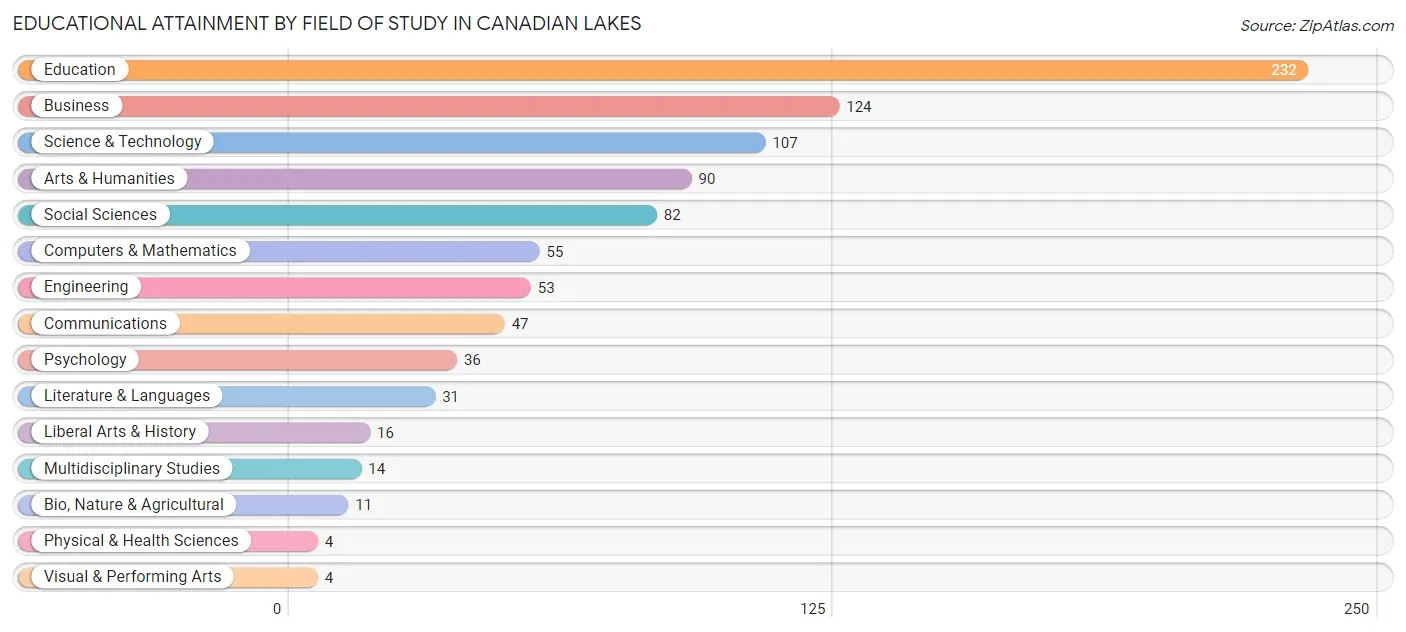
| Field of Study | # Graduates | % Graduates |
| Computers & Mathematics | 55 | 6.1% |
| Bio, Nature & Agricultural | 11 | 1.2% |
| Physical & Health Sciences | 4 | 0.4% |
| Psychology | 36 | 4.0% |
| Social Sciences | 82 | 9.0% |
| Engineering | 53 | 5.9% |
| Multidisciplinary Studies | 14 | 1.5% |
| Science & Technology | 107 | 11.8% |
| Business | 124 | 13.7% |
| Education | 232 | 25.6% |
| Literature & Languages | 31 | 3.4% |
| Liberal Arts & History | 16 | 1.8% |
| Visual & Performing Arts | 4 | 0.4% |
| Communications | 47 | 5.2% |
| Arts & Humanities | 90 | 9.9% |
| Total | 906 | 100.0% |
Transportation & Commute in Canadian Lakes
Vehicle Availability by Sex in Canadian Lakes
The most prevalent vehicle ownership categories in Canadian Lakes are males with 2 vehicles (158, accounting for 47.6%) and females with 2 vehicles (62, making up 65.0%).
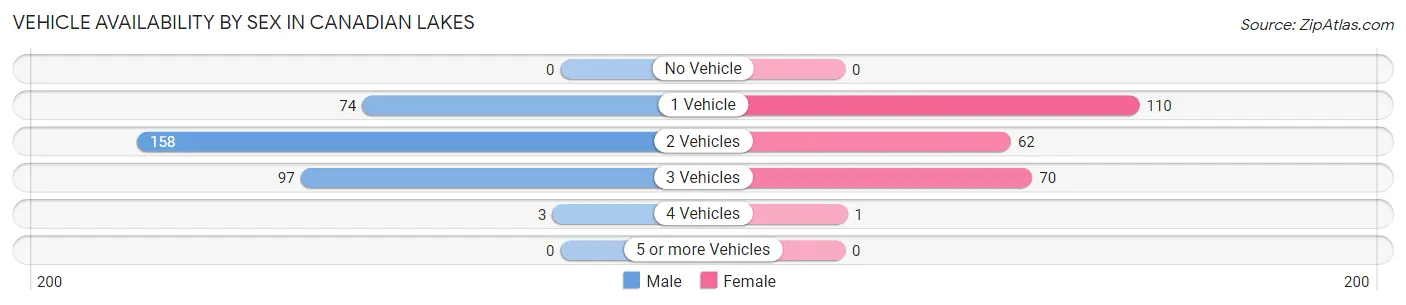
| Vehicles Available | Male | Female |
| No Vehicle | 0 (0.0%) | 0 (0.0%) |
| 1 Vehicle | 74 (22.3%) | 110 (45.3%) |
| 2 Vehicles | 158 (47.6%) | 62 (25.5%) |
| 3 Vehicles | 97 (29.2%) | 70 (28.8%) |
| 4 Vehicles | 3 (0.9%) | 1 (0.4%) |
| 5 or more Vehicles | 0 (0.0%) | 0 (0.0%) |
| Total | 332 (100.0%) | 243 (100.0%) |
Commute Time in Canadian Lakes
The most frequently occuring commute durations in Canadian Lakes are 30 to 34 minutes (93 commuters, 17.7%), 60 to 89 minutes (91 commuters, 17.3%), and 25 to 29 minutes (63 commuters, 12.0%).
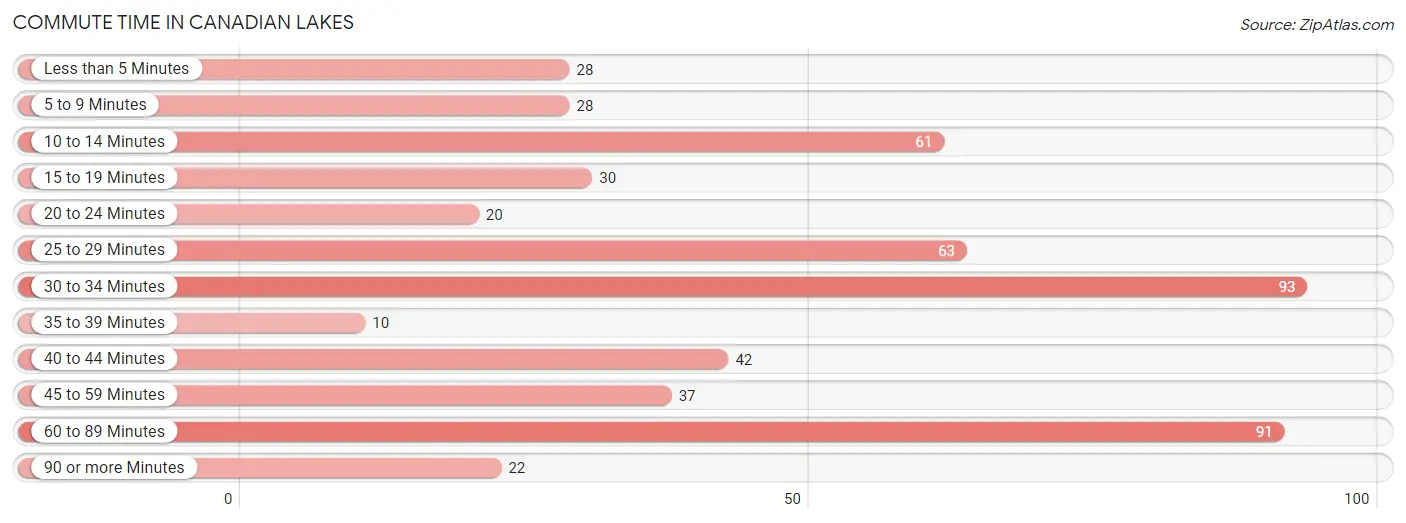
| Commute Time | # Commuters | % Commuters |
| Less than 5 Minutes | 28 | 5.3% |
| 5 to 9 Minutes | 28 | 5.3% |
| 10 to 14 Minutes | 61 | 11.6% |
| 15 to 19 Minutes | 30 | 5.7% |
| 20 to 24 Minutes | 20 | 3.8% |
| 25 to 29 Minutes | 63 | 12.0% |
| 30 to 34 Minutes | 93 | 17.7% |
| 35 to 39 Minutes | 10 | 1.9% |
| 40 to 44 Minutes | 42 | 8.0% |
| 45 to 59 Minutes | 37 | 7.0% |
| 60 to 89 Minutes | 91 | 17.3% |
| 90 or more Minutes | 22 | 4.2% |
Commute Time by Sex in Canadian Lakes
The most common commute times in Canadian Lakes are 10 to 14 minutes (61 commuters, 20.5%) for males and 25 to 29 minutes (60 commuters, 26.3%) for females.
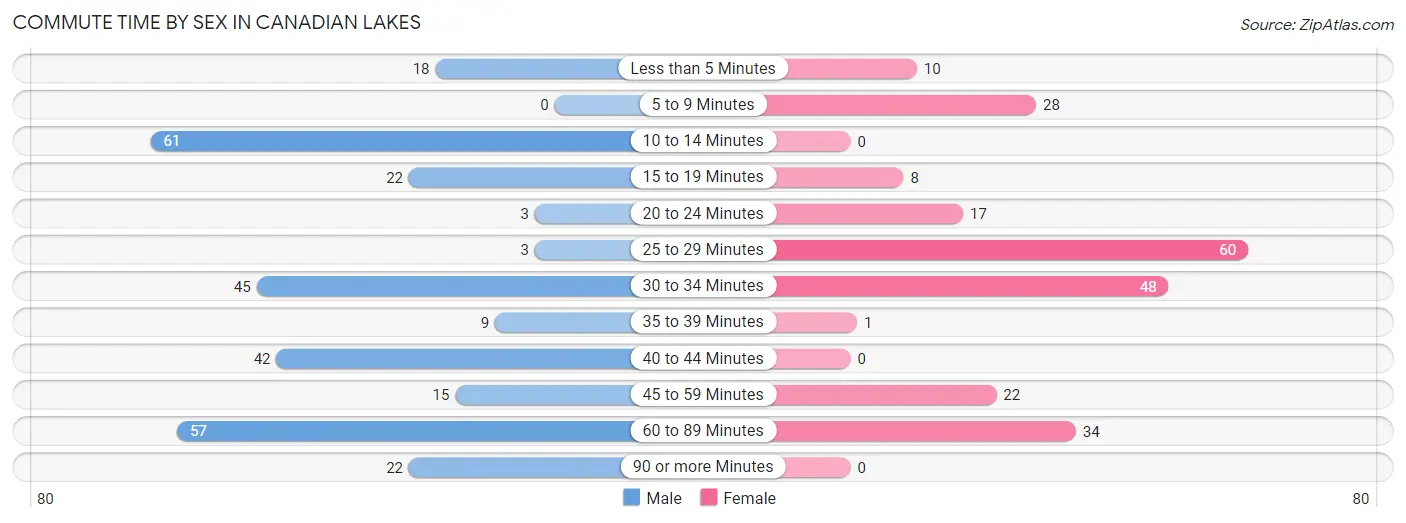
| Commute Time | Male | Female |
| Less than 5 Minutes | 18 (6.1%) | 10 (4.4%) |
| 5 to 9 Minutes | 0 (0.0%) | 28 (12.3%) |
| 10 to 14 Minutes | 61 (20.5%) | 0 (0.0%) |
| 15 to 19 Minutes | 22 (7.4%) | 8 (3.5%) |
| 20 to 24 Minutes | 3 (1.0%) | 17 (7.5%) |
| 25 to 29 Minutes | 3 (1.0%) | 60 (26.3%) |
| 30 to 34 Minutes | 45 (15.1%) | 48 (21.0%) |
| 35 to 39 Minutes | 9 (3.0%) | 1 (0.4%) |
| 40 to 44 Minutes | 42 (14.1%) | 0 (0.0%) |
| 45 to 59 Minutes | 15 (5.1%) | 22 (9.7%) |
| 60 to 89 Minutes | 57 (19.2%) | 34 (14.9%) |
| 90 or more Minutes | 22 (7.4%) | 0 (0.0%) |
Time of Departure to Work by Sex in Canadian Lakes
The most frequent times of departure to work in Canadian Lakes are 5:30 AM to 5:59 AM (80, 26.9%) for males and 6:00 AM to 6:29 AM (74, 32.5%) for females.
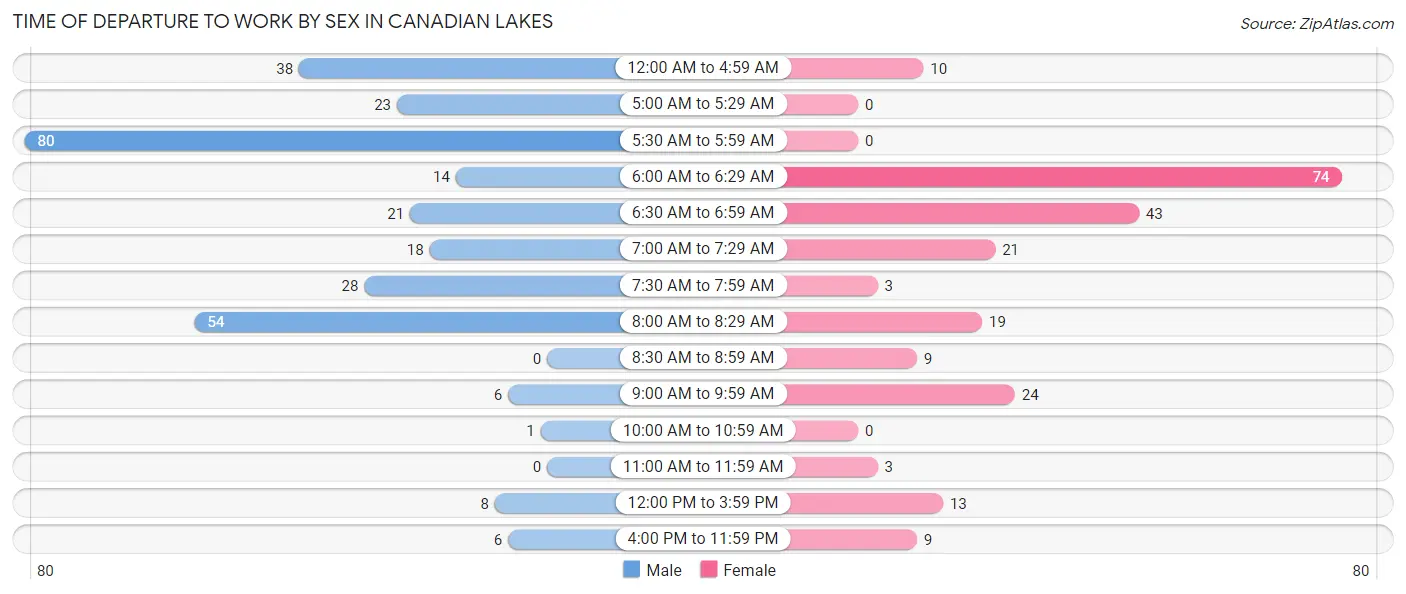
| Time of Departure | Male | Female |
| 12:00 AM to 4:59 AM | 38 (12.8%) | 10 (4.4%) |
| 5:00 AM to 5:29 AM | 23 (7.7%) | 0 (0.0%) |
| 5:30 AM to 5:59 AM | 80 (26.9%) | 0 (0.0%) |
| 6:00 AM to 6:29 AM | 14 (4.7%) | 74 (32.5%) |
| 6:30 AM to 6:59 AM | 21 (7.1%) | 43 (18.9%) |
| 7:00 AM to 7:29 AM | 18 (6.1%) | 21 (9.2%) |
| 7:30 AM to 7:59 AM | 28 (9.4%) | 3 (1.3%) |
| 8:00 AM to 8:29 AM | 54 (18.2%) | 19 (8.3%) |
| 8:30 AM to 8:59 AM | 0 (0.0%) | 9 (4.0%) |
| 9:00 AM to 9:59 AM | 6 (2.0%) | 24 (10.5%) |
| 10:00 AM to 10:59 AM | 1 (0.3%) | 0 (0.0%) |
| 11:00 AM to 11:59 AM | 0 (0.0%) | 3 (1.3%) |
| 12:00 PM to 3:59 PM | 8 (2.7%) | 13 (5.7%) |
| 4:00 PM to 11:59 PM | 6 (2.0%) | 9 (4.0%) |
| Total | 297 (100.0%) | 228 (100.0%) |
Housing Occupancy in Canadian Lakes
Occupancy by Ownership in Canadian Lakes
Of the total 1,364 dwellings in Canadian Lakes, owner-occupied units account for 1,275 (93.5%), while renter-occupied units make up 89 (6.5%).
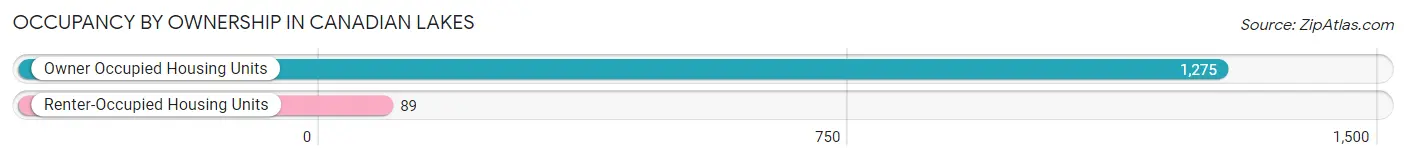
| Occupancy | # Housing Units | % Housing Units |
| Owner Occupied Housing Units | 1,275 | 93.5% |
| Renter-Occupied Housing Units | 89 | 6.5% |
| Total Occupied Housing Units | 1,364 | 100.0% |
Occupancy by Household Size in Canadian Lakes
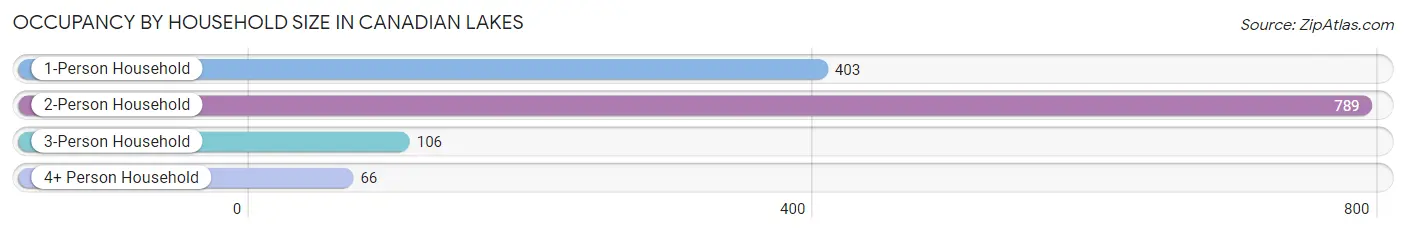
| Household Size | # Housing Units | % Housing Units |
| 1-Person Household | 403 | 29.5% |
| 2-Person Household | 789 | 57.8% |
| 3-Person Household | 106 | 7.8% |
| 4+ Person Household | 66 | 4.8% |
| Total Housing Units | 1,364 | 100.0% |
Occupancy by Ownership by Household Size in Canadian Lakes
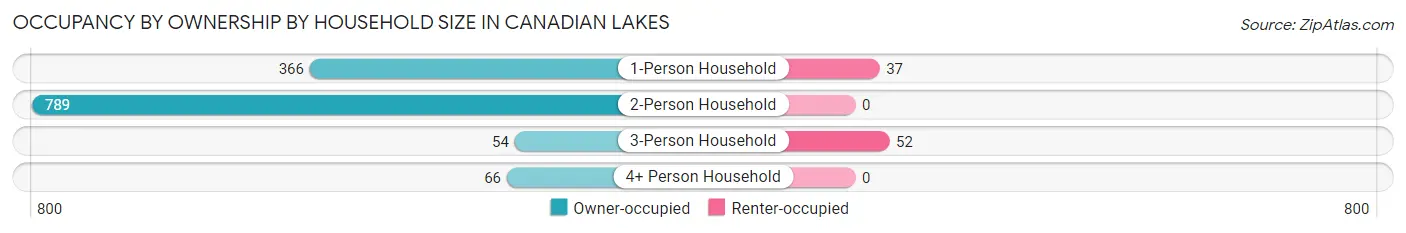
| Household Size | Owner-occupied | Renter-occupied |
| 1-Person Household | 366 (90.8%) | 37 (9.2%) |
| 2-Person Household | 789 (100.0%) | 0 (0.0%) |
| 3-Person Household | 54 (50.9%) | 52 (49.1%) |
| 4+ Person Household | 66 (100.0%) | 0 (0.0%) |
| Total Housing Units | 1,275 (93.5%) | 89 (6.5%) |
Occupancy by Educational Attainment in Canadian Lakes
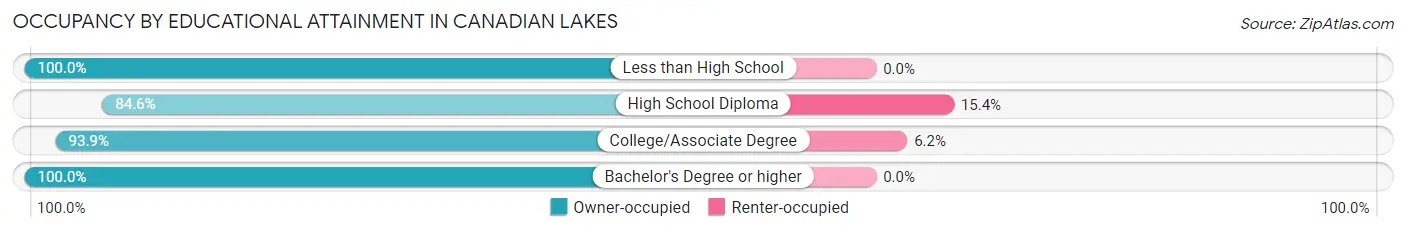
| Household Size | Owner-occupied | Renter-occupied |
| Less than High School | 7 (100.0%) | 0 (0.0%) |
| High School Diploma | 340 (84.6%) | 62 (15.4%) |
| College/Associate Degree | 412 (93.9%) | 27 (6.1%) |
| Bachelor's Degree or higher | 516 (100.0%) | 0 (0.0%) |
Occupancy by Age of Householder in Canadian Lakes
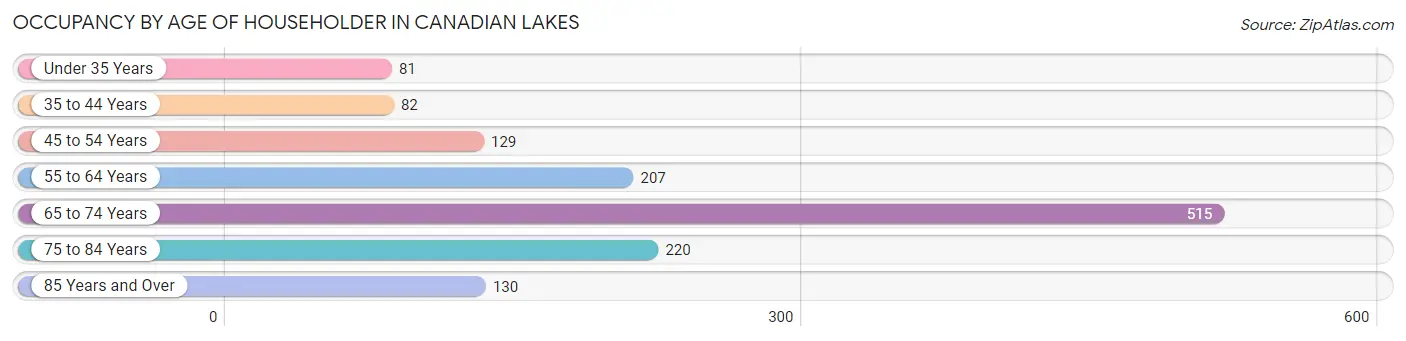
| Age Bracket | # Households | % Households |
| Under 35 Years | 81 | 5.9% |
| 35 to 44 Years | 82 | 6.0% |
| 45 to 54 Years | 129 | 9.5% |
| 55 to 64 Years | 207 | 15.2% |
| 65 to 74 Years | 515 | 37.8% |
| 75 to 84 Years | 220 | 16.1% |
| 85 Years and Over | 130 | 9.5% |
| Total | 1,364 | 100.0% |
Housing Finances in Canadian Lakes
Median Income by Occupancy in Canadian Lakes
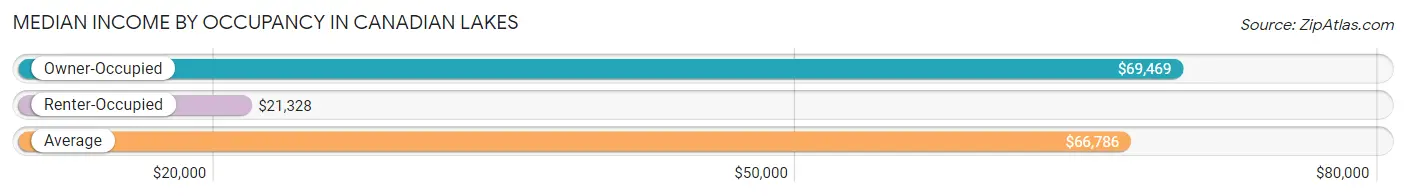
| Occupancy Type | # Households | Median Income |
| Owner-Occupied | 1,275 (93.5%) | $69,469 |
| Renter-Occupied | 89 (6.5%) | $21,328 |
| Average | 1,364 (100.0%) | $66,786 |
Occupancy by Householder Income Bracket in Canadian Lakes
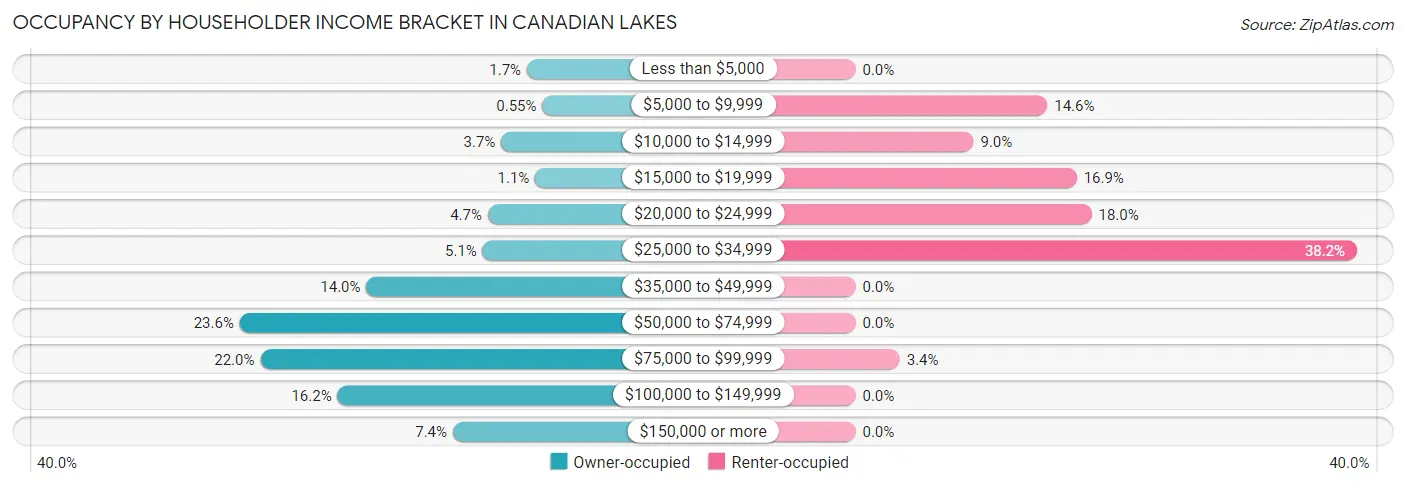
| Income Bracket | Owner-occupied | Renter-occupied |
| Less than $5,000 | 22 (1.7%) | 0 (0.0%) |
| $5,000 to $9,999 | 7 (0.5%) | 13 (14.6%) |
| $10,000 to $14,999 | 47 (3.7%) | 8 (9.0%) |
| $15,000 to $19,999 | 14 (1.1%) | 15 (16.9%) |
| $20,000 to $24,999 | 60 (4.7%) | 16 (18.0%) |
| $25,000 to $34,999 | 65 (5.1%) | 34 (38.2%) |
| $35,000 to $49,999 | 178 (14.0%) | 0 (0.0%) |
| $50,000 to $74,999 | 301 (23.6%) | 0 (0.0%) |
| $75,000 to $99,999 | 281 (22.0%) | 3 (3.4%) |
| $100,000 to $149,999 | 206 (16.2%) | 0 (0.0%) |
| $150,000 or more | 94 (7.4%) | 0 (0.0%) |
| Total | 1,275 (100.0%) | 89 (100.0%) |
Monthly Housing Cost Tiers in Canadian Lakes
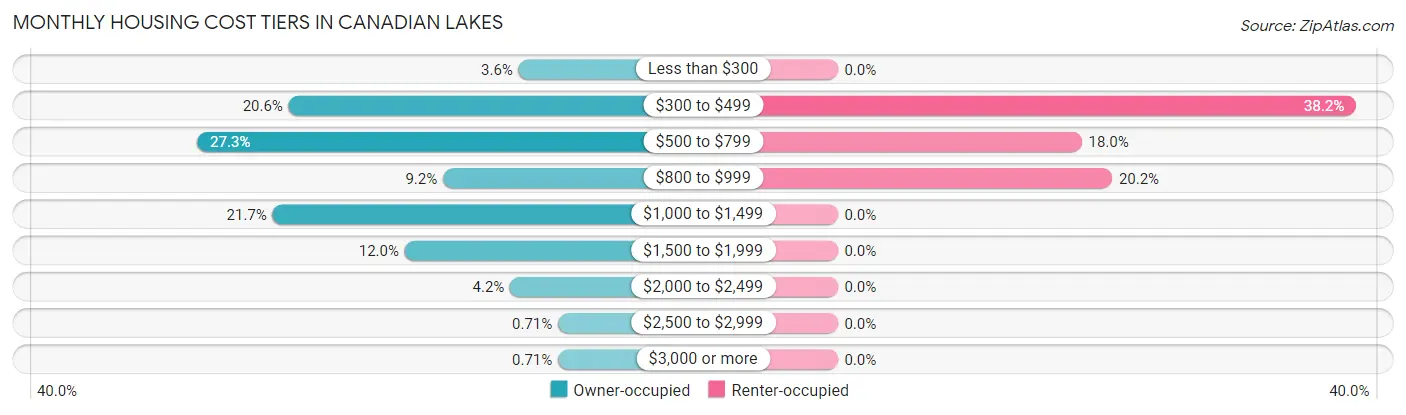
| Monthly Cost | Owner-occupied | Renter-occupied |
| Less than $300 | 46 (3.6%) | 0 (0.0%) |
| $300 to $499 | 262 (20.5%) | 34 (38.2%) |
| $500 to $799 | 348 (27.3%) | 16 (18.0%) |
| $800 to $999 | 117 (9.2%) | 18 (20.2%) |
| $1,000 to $1,499 | 277 (21.7%) | 0 (0.0%) |
| $1,500 to $1,999 | 153 (12.0%) | 0 (0.0%) |
| $2,000 to $2,499 | 54 (4.2%) | 0 (0.0%) |
| $2,500 to $2,999 | 9 (0.7%) | 0 (0.0%) |
| $3,000 or more | 9 (0.7%) | 0 (0.0%) |
| Total | 1,275 (100.0%) | 89 (100.0%) |
Physical Housing Characteristics in Canadian Lakes
Housing Structures in Canadian Lakes
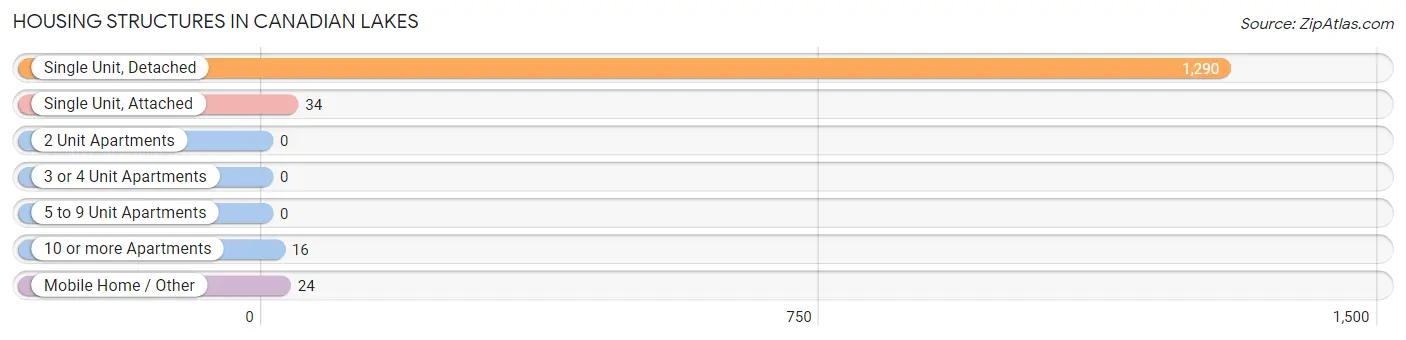
| Structure Type | # Housing Units | % Housing Units |
| Single Unit, Detached | 1,290 | 94.6% |
| Single Unit, Attached | 34 | 2.5% |
| 2 Unit Apartments | 0 | 0.0% |
| 3 or 4 Unit Apartments | 0 | 0.0% |
| 5 to 9 Unit Apartments | 0 | 0.0% |
| 10 or more Apartments | 16 | 1.2% |
| Mobile Home / Other | 24 | 1.8% |
| Total | 1,364 | 100.0% |
Housing Structures by Occupancy in Canadian Lakes
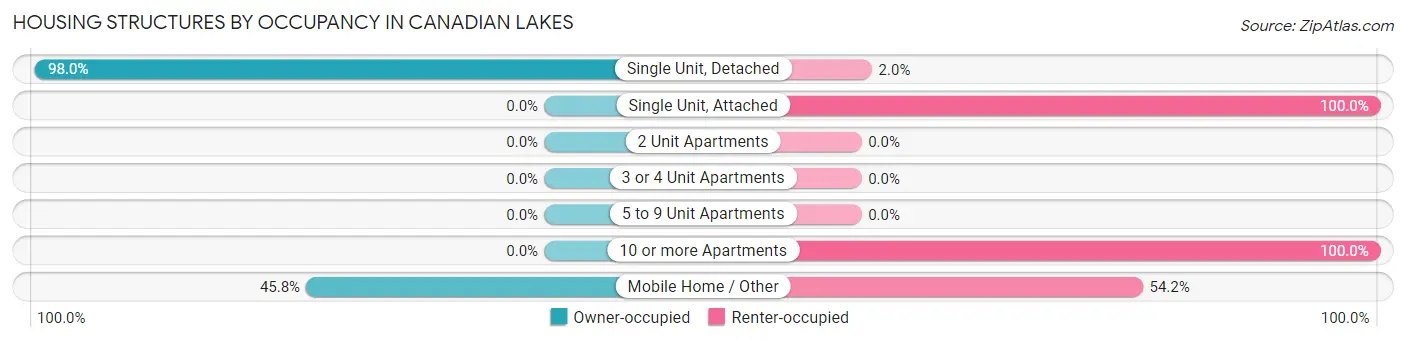
| Structure Type | Owner-occupied | Renter-occupied |
| Single Unit, Detached | 1,264 (98.0%) | 26 (2.0%) |
| Single Unit, Attached | 0 (0.0%) | 34 (100.0%) |
| 2 Unit Apartments | 0 (0.0%) | 0 (0.0%) |
| 3 or 4 Unit Apartments | 0 (0.0%) | 0 (0.0%) |
| 5 to 9 Unit Apartments | 0 (0.0%) | 0 (0.0%) |
| 10 or more Apartments | 0 (0.0%) | 16 (100.0%) |
| Mobile Home / Other | 11 (45.8%) | 13 (54.2%) |
| Total | 1,275 (93.5%) | 89 (6.5%) |
Housing Structures by Number of Rooms in Canadian Lakes
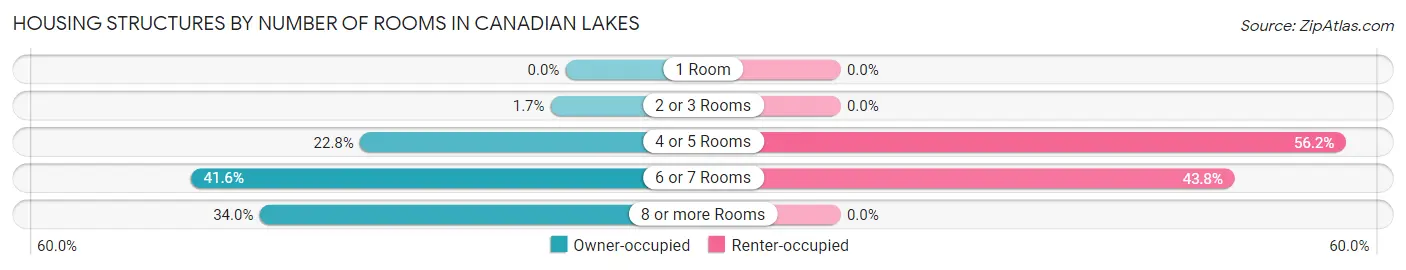
| Number of Rooms | Owner-occupied | Renter-occupied |
| 1 Room | 0 (0.0%) | 0 (0.0%) |
| 2 or 3 Rooms | 21 (1.7%) | 0 (0.0%) |
| 4 or 5 Rooms | 291 (22.8%) | 50 (56.2%) |
| 6 or 7 Rooms | 530 (41.6%) | 39 (43.8%) |
| 8 or more Rooms | 433 (34.0%) | 0 (0.0%) |
| Total | 1,275 (100.0%) | 89 (100.0%) |
Housing Structure by Heating Type in Canadian Lakes
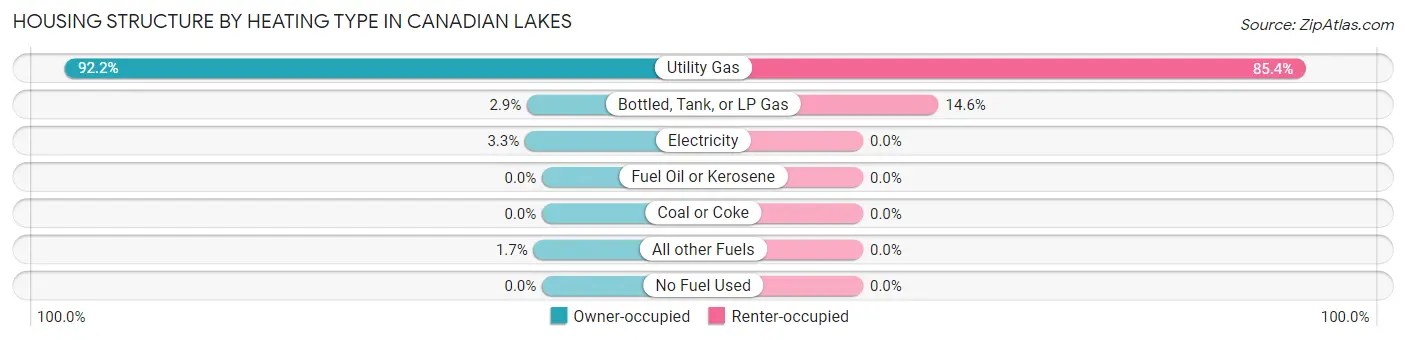
| Heating Type | Owner-occupied | Renter-occupied |
| Utility Gas | 1,175 (92.2%) | 76 (85.4%) |
| Bottled, Tank, or LP Gas | 37 (2.9%) | 13 (14.6%) |
| Electricity | 42 (3.3%) | 0 (0.0%) |
| Fuel Oil or Kerosene | 0 (0.0%) | 0 (0.0%) |
| Coal or Coke | 0 (0.0%) | 0 (0.0%) |
| All other Fuels | 21 (1.7%) | 0 (0.0%) |
| No Fuel Used | 0 (0.0%) | 0 (0.0%) |
| Total | 1,275 (100.0%) | 89 (100.0%) |
Household Vehicle Usage in Canadian Lakes
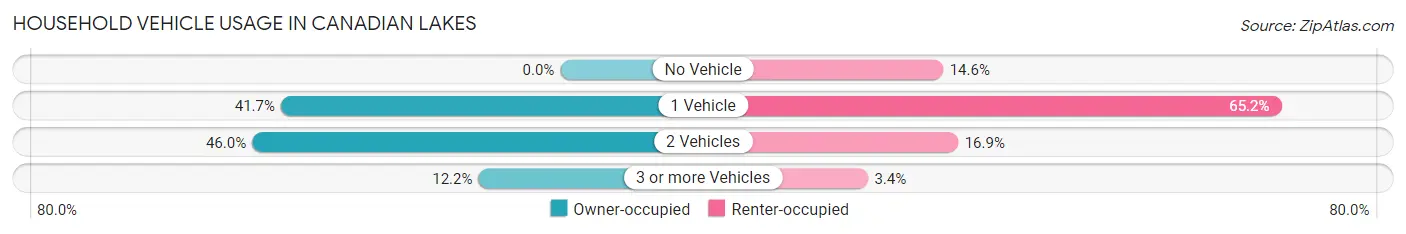
| Vehicles per Household | Owner-occupied | Renter-occupied |
| No Vehicle | 0 (0.0%) | 13 (14.6%) |
| 1 Vehicle | 532 (41.7%) | 58 (65.2%) |
| 2 Vehicles | 587 (46.0%) | 15 (16.9%) |
| 3 or more Vehicles | 156 (12.2%) | 3 (3.4%) |
| Total | 1,275 (100.0%) | 89 (100.0%) |
Real Estate & Mortgages in Canadian Lakes
Real Estate and Mortgage Overview in Canadian Lakes
| Characteristic | Without Mortgage | With Mortgage |
| Housing Units | 642 | 633 |
| Median Property Value | $261,900 | $217,800 |
| Median Household Income | $60,988 | $60 |
| Monthly Housing Costs | $508 | $9 |
| Real Estate Taxes | $2,633 | $2 |
Property Value by Mortgage Status in Canadian Lakes
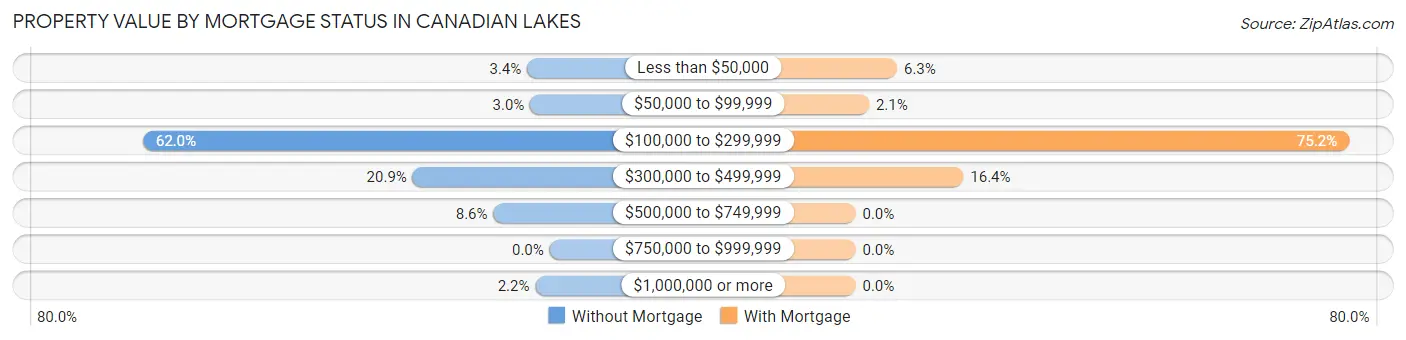
| Property Value | Without Mortgage | With Mortgage |
| Less than $50,000 | 22 (3.4%) | 40 (6.3%) |
| $50,000 to $99,999 | 19 (3.0%) | 13 (2.1%) |
| $100,000 to $299,999 | 398 (62.0%) | 476 (75.2%) |
| $300,000 to $499,999 | 134 (20.9%) | 104 (16.4%) |
| $500,000 to $749,999 | 55 (8.6%) | 0 (0.0%) |
| $750,000 to $999,999 | 0 (0.0%) | 0 (0.0%) |
| $1,000,000 or more | 14 (2.2%) | 0 (0.0%) |
| Total | 642 (100.0%) | 633 (100.0%) |
Household Income by Mortgage Status in Canadian Lakes
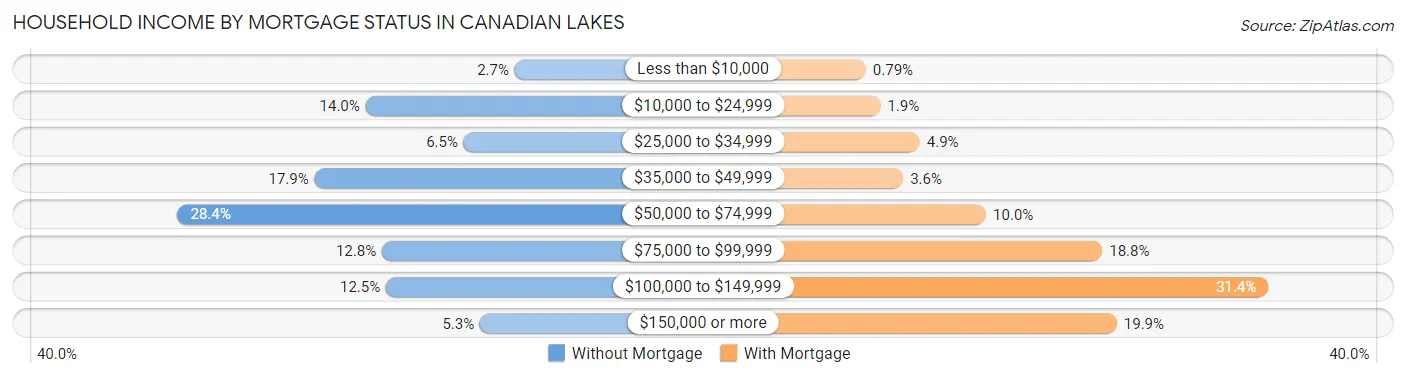
| Household Income | Without Mortgage | With Mortgage |
| Less than $10,000 | 17 (2.6%) | 5 (0.8%) |
| $10,000 to $24,999 | 90 (14.0%) | 12 (1.9%) |
| $25,000 to $34,999 | 42 (6.5%) | 31 (4.9%) |
| $35,000 to $49,999 | 115 (17.9%) | 23 (3.6%) |
| $50,000 to $74,999 | 182 (28.3%) | 63 (10.0%) |
| $75,000 to $99,999 | 82 (12.8%) | 119 (18.8%) |
| $100,000 to $149,999 | 80 (12.5%) | 199 (31.4%) |
| $150,000 or more | 34 (5.3%) | 126 (19.9%) |
| Total | 642 (100.0%) | 633 (100.0%) |
Property Value to Household Income Ratio in Canadian Lakes
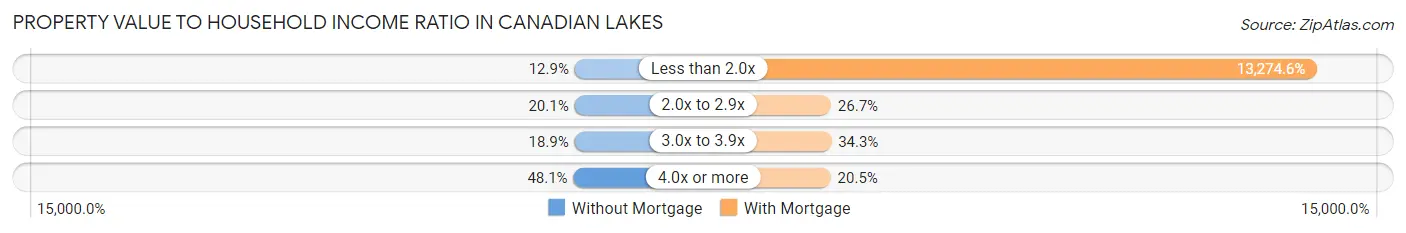
| Value-to-Income Ratio | Without Mortgage | With Mortgage |
| Less than 2.0x | 83 (12.9%) | 84,028 (13,274.6%) |
| 2.0x to 2.9x | 129 (20.1%) | 169 (26.7%) |
| 3.0x to 3.9x | 121 (18.9%) | 217 (34.3%) |
| 4.0x or more | 309 (48.1%) | 130 (20.5%) |
| Total | 642 (100.0%) | 633 (100.0%) |
Real Estate Taxes by Mortgage Status in Canadian Lakes
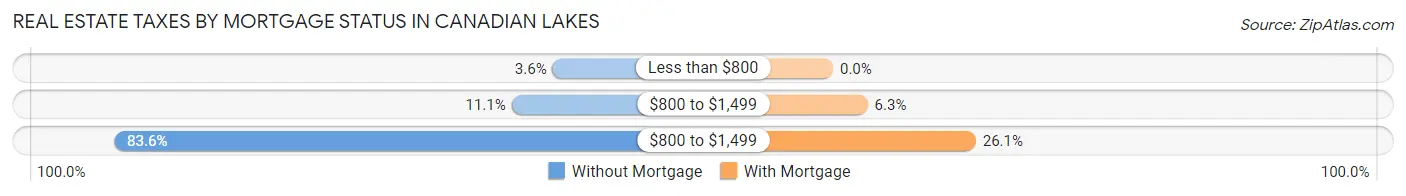
| Property Taxes | Without Mortgage | With Mortgage |
| Less than $800 | 23 (3.6%) | 0 (0.0%) |
| $800 to $1,499 | 71 (11.1%) | 40 (6.3%) |
| $800 to $1,499 | 537 (83.6%) | 165 (26.1%) |
| Total | 642 (100.0%) | 633 (100.0%) |
Health & Disability in Canadian Lakes
Health Insurance Coverage by Age in Canadian Lakes
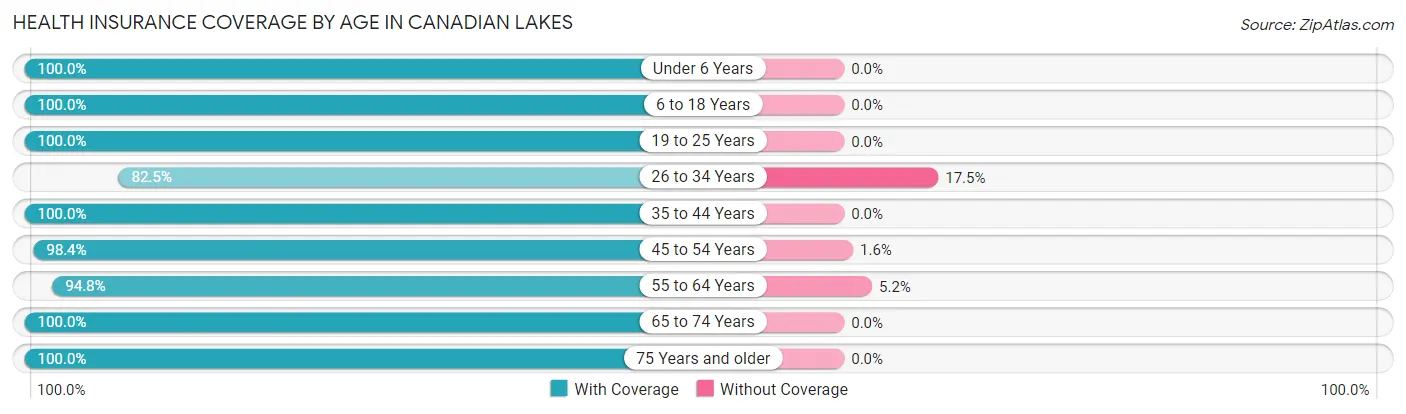
| Age Bracket | With Coverage | Without Coverage |
| Under 6 Years | 80 (100.0%) | 0 (0.0%) |
| 6 to 18 Years | 183 (100.0%) | 0 (0.0%) |
| 19 to 25 Years | 34 (100.0%) | 0 (0.0%) |
| 26 to 34 Years | 160 (82.5%) | 34 (17.5%) |
| 35 to 44 Years | 122 (100.0%) | 0 (0.0%) |
| 45 to 54 Years | 180 (98.4%) | 3 (1.6%) |
| 55 to 64 Years | 403 (94.8%) | 22 (5.2%) |
| 65 to 74 Years | 869 (100.0%) | 0 (0.0%) |
| 75 Years and older | 488 (100.0%) | 0 (0.0%) |
| Total | 2,519 (97.7%) | 59 (2.3%) |
Health Insurance Coverage by Citizenship Status in Canadian Lakes
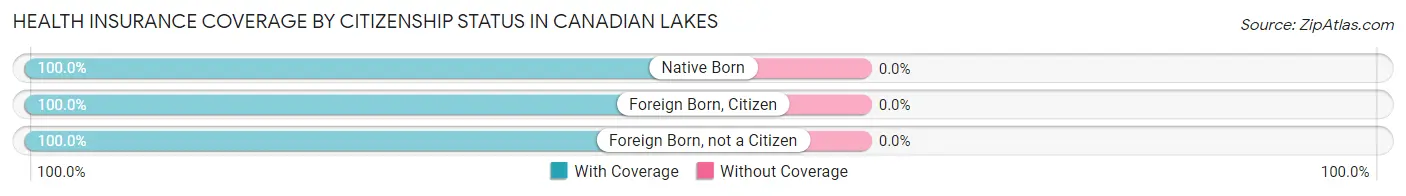
| Citizenship Status | With Coverage | Without Coverage |
| Native Born | 80 (100.0%) | 0 (0.0%) |
| Foreign Born, Citizen | 183 (100.0%) | 0 (0.0%) |
| Foreign Born, not a Citizen | 34 (100.0%) | 0 (0.0%) |
Health Insurance Coverage by Household Income in Canadian Lakes
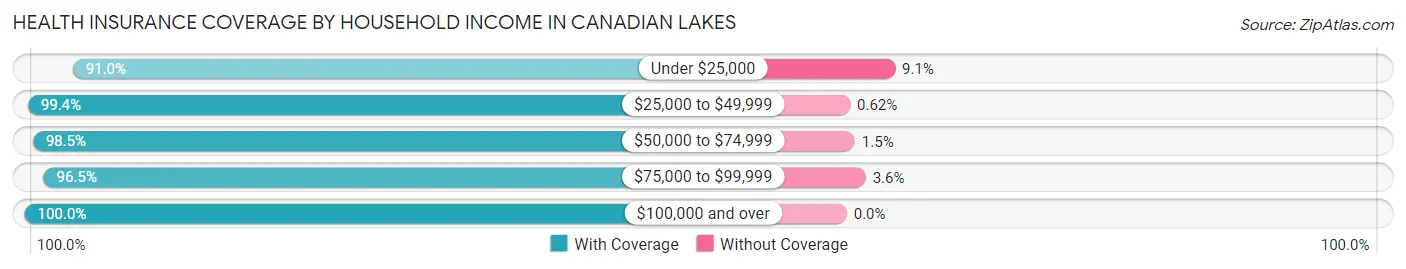
| Household Income | With Coverage | Without Coverage |
| Under $25,000 | 221 (90.9%) | 22 (9.0%) |
| $25,000 to $49,999 | 478 (99.4%) | 3 (0.6%) |
| $50,000 to $74,999 | 583 (98.5%) | 9 (1.5%) |
| $75,000 to $99,999 | 680 (96.5%) | 25 (3.5%) |
| $100,000 and over | 557 (100.0%) | 0 (0.0%) |
Public vs Private Health Insurance Coverage by Age in Canadian Lakes
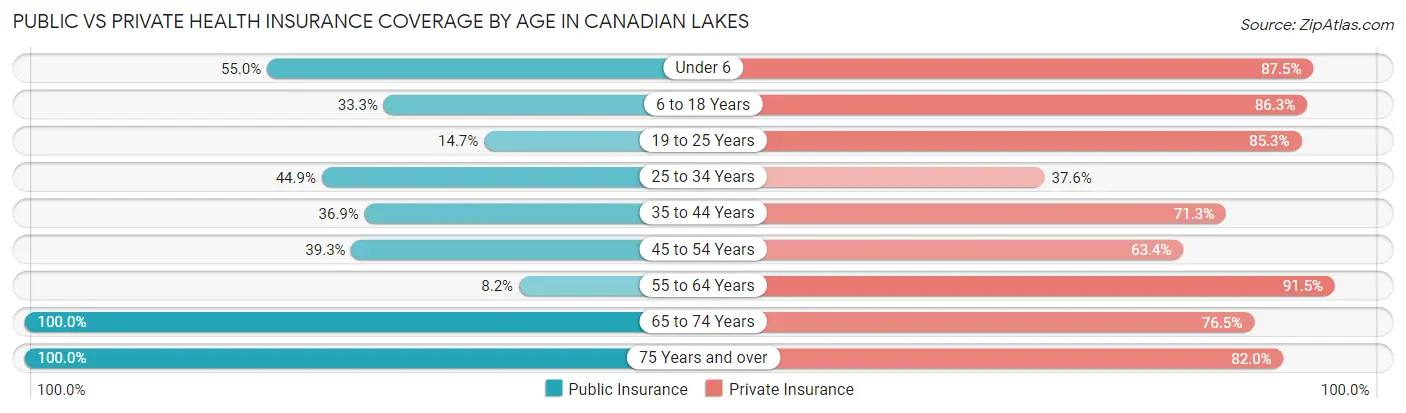
| Age Bracket | Public Insurance | Private Insurance |
| Under 6 | 44 (55.0%) | 70 (87.5%) |
| 6 to 18 Years | 61 (33.3%) | 158 (86.3%) |
| 19 to 25 Years | 5 (14.7%) | 29 (85.3%) |
| 25 to 34 Years | 87 (44.9%) | 73 (37.6%) |
| 35 to 44 Years | 45 (36.9%) | 87 (71.3%) |
| 45 to 54 Years | 72 (39.3%) | 116 (63.4%) |
| 55 to 64 Years | 35 (8.2%) | 389 (91.5%) |
| 65 to 74 Years | 869 (100.0%) | 665 (76.5%) |
| 75 Years and over | 488 (100.0%) | 400 (82.0%) |
| Total | 1,706 (66.2%) | 1,987 (77.1%) |
Disability Status by Sex by Age in Canadian Lakes
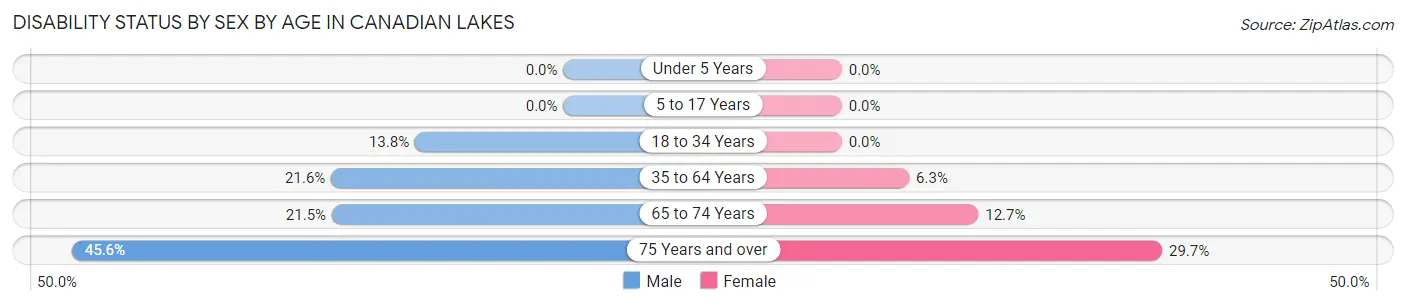
| Age Bracket | Male | Female |
| Under 5 Years | 0 (0.0%) | 0 (0.0%) |
| 5 to 17 Years | 0 (0.0%) | 0 (0.0%) |
| 18 to 34 Years | 19 (13.8%) | 0 (0.0%) |
| 35 to 64 Years | 78 (21.5%) | 23 (6.2%) |
| 65 to 74 Years | 90 (21.5%) | 57 (12.7%) |
| 75 Years and over | 109 (45.6%) | 74 (29.7%) |
Disability Class by Sex by Age in Canadian Lakes
Disability Class: Hearing Difficulty
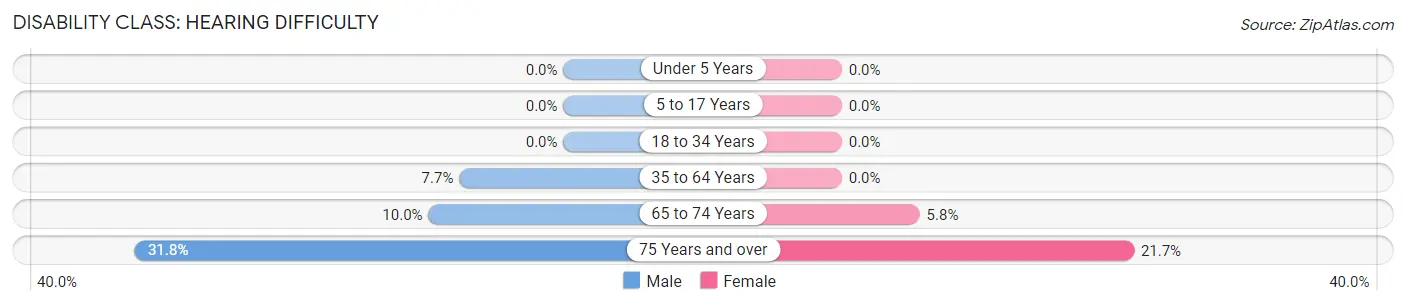
| Age Bracket | Male | Female |
| Under 5 Years | 0 (0.0%) | 0 (0.0%) |
| 5 to 17 Years | 0 (0.0%) | 0 (0.0%) |
| 18 to 34 Years | 0 (0.0%) | 0 (0.0%) |
| 35 to 64 Years | 28 (7.7%) | 0 (0.0%) |
| 65 to 74 Years | 42 (10.0%) | 26 (5.8%) |
| 75 Years and over | 76 (31.8%) | 54 (21.7%) |
Disability Class: Vision Difficulty
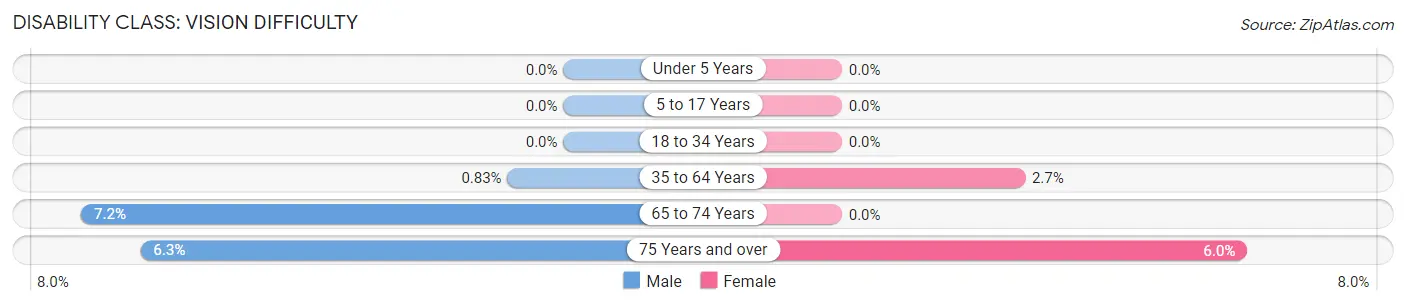
| Age Bracket | Male | Female |
| Under 5 Years | 0 (0.0%) | 0 (0.0%) |
| 5 to 17 Years | 0 (0.0%) | 0 (0.0%) |
| 18 to 34 Years | 0 (0.0%) | 0 (0.0%) |
| 35 to 64 Years | 3 (0.8%) | 10 (2.7%) |
| 65 to 74 Years | 30 (7.2%) | 0 (0.0%) |
| 75 Years and over | 15 (6.3%) | 15 (6.0%) |
Disability Class: Cognitive Difficulty
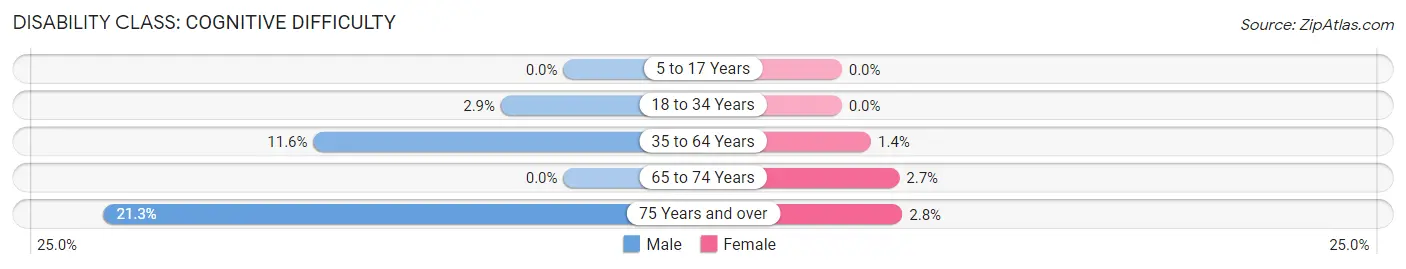
| Age Bracket | Male | Female |
| 5 to 17 Years | 0 (0.0%) | 0 (0.0%) |
| 18 to 34 Years | 4 (2.9%) | 0 (0.0%) |
| 35 to 64 Years | 42 (11.6%) | 5 (1.4%) |
| 65 to 74 Years | 0 (0.0%) | 12 (2.7%) |
| 75 Years and over | 51 (21.3%) | 7 (2.8%) |
Disability Class: Ambulatory Difficulty
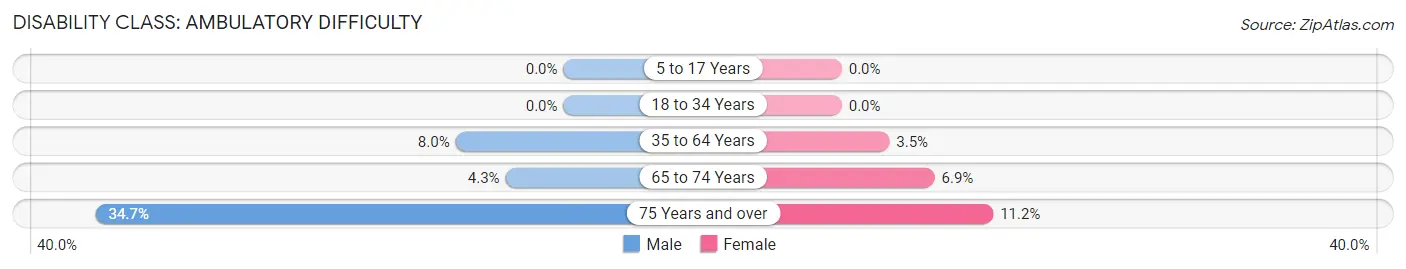
| Age Bracket | Male | Female |
| 5 to 17 Years | 0 (0.0%) | 0 (0.0%) |
| 18 to 34 Years | 0 (0.0%) | 0 (0.0%) |
| 35 to 64 Years | 29 (8.0%) | 13 (3.5%) |
| 65 to 74 Years | 18 (4.3%) | 31 (6.9%) |
| 75 Years and over | 83 (34.7%) | 28 (11.2%) |
Disability Class: Self-Care Difficulty
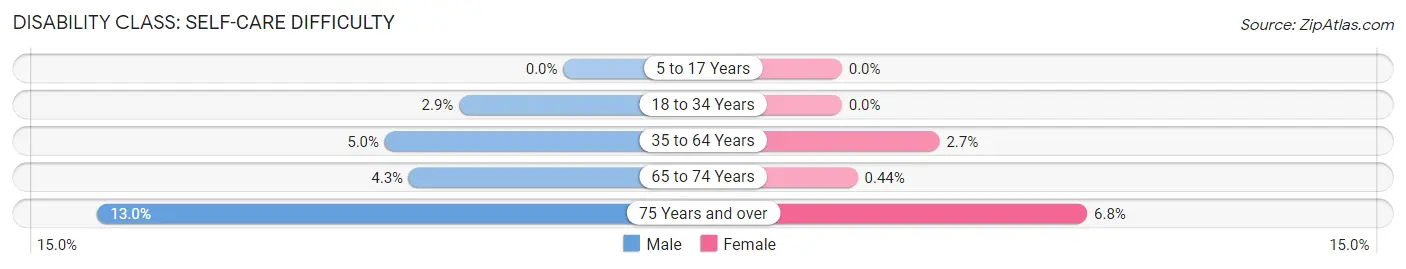
| Age Bracket | Male | Female |
| 5 to 17 Years | 0 (0.0%) | 0 (0.0%) |
| 18 to 34 Years | 4 (2.9%) | 0 (0.0%) |
| 35 to 64 Years | 18 (5.0%) | 10 (2.7%) |
| 65 to 74 Years | 18 (4.3%) | 2 (0.4%) |
| 75 Years and over | 31 (13.0%) | 17 (6.8%) |
Technology Access in Canadian Lakes
Computing Device Access in Canadian Lakes
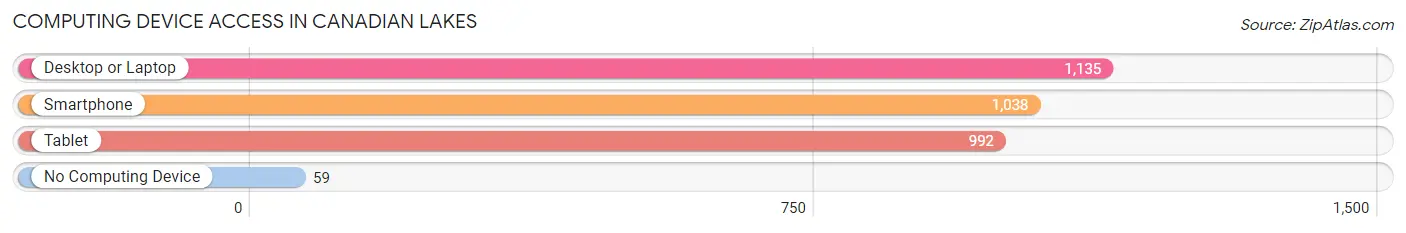
| Device Type | # Households | % Households |
| Desktop or Laptop | 1,135 | 83.2% |
| Smartphone | 1,038 | 76.1% |
| Tablet | 992 | 72.7% |
| No Computing Device | 59 | 4.3% |
| Total | 1,364 | 100.0% |
Internet Access in Canadian Lakes
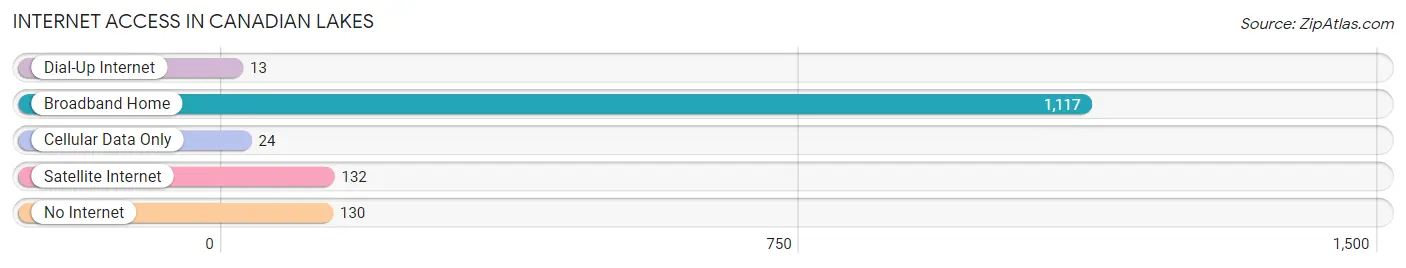
| Internet Type | # Households | % Households |
| Dial-Up Internet | 13 | 0.9% |
| Broadband Home | 1,117 | 81.9% |
| Cellular Data Only | 24 | 1.8% |
| Satellite Internet | 132 | 9.7% |
| No Internet | 130 | 9.5% |
| Total | 1,364 | 100.0% |
Canadian Lakes Summary
History
The area now known as Canadian Lakes, Michigan was first inhabited by the Potawatomi Native American tribe. The tribe lived in the area for centuries before the arrival of European settlers in the early 19th century. The first permanent settlers in the area were French-Canadian fur traders who established trading posts in the area. The first permanent settlement in the area was established in 1836 by a group of French-Canadian settlers led by Jean Baptiste Bissonnette. The settlement was named Bissonnetteville and was located near the present-day town of Canadian Lakes.
The area was officially organized as a township in 1855 and was named Canadian Lakes Township. The name was chosen to reflect the large number of Canadian settlers in the area. The township was officially incorporated in 1871.
The area experienced rapid growth in the late 19th and early 20th centuries due to the logging industry. The area was home to several large sawmills and lumber companies, which provided employment for many of the area’s residents. The area also experienced a boom in tourism in the early 20th century, as visitors flocked to the area to enjoy its natural beauty and recreational opportunities.
Geography
Canadian Lakes is located in Mecosta County, Michigan. The township is situated in the central part of the state, approximately 40 miles north of Grand Rapids. The township covers an area of approximately 35 square miles and is bordered by Big Rapids Township to the north, Morton Township to the east, Austin Township to the south, and Millbrook Township to the west.
The terrain of Canadian Lakes is mostly flat, with some rolling hills in the northern part of the township. The area is drained by several small creeks and streams, including the Muskegon River, which flows through the township. The area is also home to several small lakes, including Canadian Lakes, which is the largest lake in the township.
Economy
The economy of Canadian Lakes is largely based on tourism and recreation. The area is home to several resorts and recreational facilities, including the Canadian Lakes Golf Course, the Canadian Lakes Country Club, and the Canadian Lakes Marina. The area is also home to several small businesses, including restaurants, retail stores, and service providers.
The area is also home to several manufacturing companies, including the Canadian Lakes Manufacturing Company, which produces a variety of products, including furniture, cabinetry, and windows. The area is also home to several agricultural operations, including dairy farms, fruit orchards, and vegetable farms.
Demographics
As of the 2010 census, the population of Canadian Lakes was 2,845. The population is predominantly white (96.3%), with small percentages of African American (1.2%), Native American (0.5%), Asian (0.3%), and other races (1.7%). The median household income in the area is $45,945, and the median home value is $133,400. The area is served by the Mecosta-Osceola Intermediate School District.
Common Questions
What is Per Capita Income in Canadian Lakes?
Per Capita income in Canadian Lakes is $37,740.
What is the Median Family Income in Canadian Lakes?
Median Family Income in Canadian Lakes is $79,814.
What is the Median Household income in Canadian Lakes?
Median Household Income in Canadian Lakes is $66,786.
What is Income or Wage Gap in Canadian Lakes?
Income or Wage Gap in Canadian Lakes is 29.5%.
Women in Canadian Lakes earn 70.5 cents for every dollar earned by a man.
What is Inequality or Gini Index in Canadian Lakes?
Inequality or Gini Index in Canadian Lakes is 0.34.
What is the Total Population of Canadian Lakes?
Total Population of Canadian Lakes is 2,578.
What is the Total Male Population of Canadian Lakes?
Total Male Population of Canadian Lakes is 1,282.
What is the Total Female Population of Canadian Lakes?
Total Female Population of Canadian Lakes is 1,296.
What is the Ratio of Males per 100 Females in Canadian Lakes?
There are 98.92 Males per 100 Females in Canadian Lakes.
What is the Ratio of Females per 100 Males in Canadian Lakes?
There are 101.09 Females per 100 Males in Canadian Lakes.
What is the Median Population Age in Canadian Lakes?
Median Population Age in Canadian Lakes is 65.9 Years.
What is the Average Family Size in Canadian Lakes
Average Family Size in Canadian Lakes is 2.2 People.
What is the Average Household Size in Canadian Lakes
Average Household Size in Canadian Lakes is 1.9 People.
How Large is the Labor Force in Canadian Lakes?
There are 597 People in the Labor Forcein in Canadian Lakes.
What is the Percentage of People in the Labor Force in Canadian Lakes?
25.2% of People are in the Labor Force in Canadian Lakes.
What is the Unemployment Rate in Canadian Lakes?
Unemployment Rate in Canadian Lakes is 1.0%.