Zip Codes with the Highest Percentage of Population Employed in Security & Protection in Michigan
RELATED REPORTS & OPTIONS
Security & Protection
Michigan
Compare Zip Codes
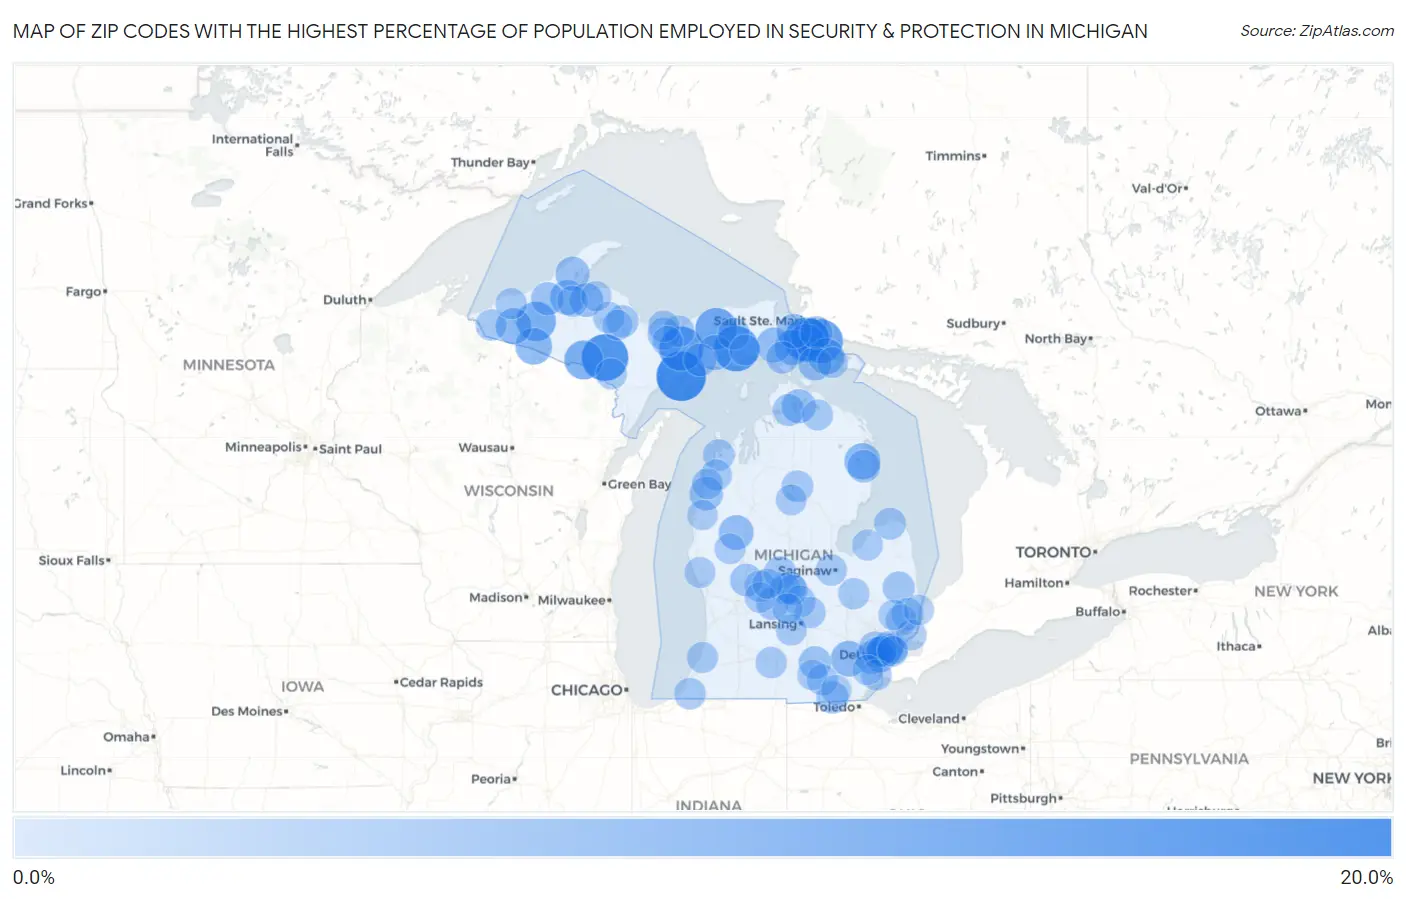
Map of Zip Codes with the Highest Percentage of Population Employed in Security & Protection in Michigan
0.0%
20.0%
Zip Codes with the Highest Percentage of Population Employed in Security & Protection in Michigan
| Zip Code | % Employed | vs State | vs National | |
| 1. | 49864 | 20.0% | 1.6%(+18.4)#1 | 2.1%(+17.9)#198 |
| 2. | 49881 | 17.4% | 1.6%(+15.8)#2 | 2.1%(+15.3)#269 |
| 3. | 49820 | 16.3% | 1.6%(+14.6)#3 | 2.1%(+14.1)#304 |
| 4. | 49752 | 15.6% | 1.6%(+14.0)#4 | 2.1%(+13.5)#333 |
| 5. | 49895 | 15.4% | 1.6%(+13.7)#5 | 2.1%(+13.2)#346 |
| 6. | 49710 | 14.6% | 1.6%(+13.0)#6 | 2.1%(+12.5)#381 |
| 7. | 49883 | 13.2% | 1.6%(+11.5)#7 | 2.1%(+11.0)#468 |
| 8. | 49912 | 11.2% | 1.6%(+9.58)#8 | 2.1%(+9.08)#624 |
| 9. | 49902 | 10.6% | 1.6%(+9.00)#9 | 2.1%(+8.49)#687 |
| 10. | 49724 | 9.9% | 1.6%(+8.27)#10 | 2.1%(+7.77)#780 |
| 11. | 49788 | 9.3% | 1.6%(+7.64)#11 | 2.1%(+7.13)#864 |
| 12. | 49969 | 8.9% | 1.6%(+7.22)#12 | 2.1%(+6.71)#940 |
| 13. | 49736 | 8.4% | 1.6%(+6.76)#13 | 2.1%(+6.25)#1,040 |
| 14. | 48762 | 8.4% | 1.6%(+6.74)#14 | 2.1%(+6.23)#1,048 |
| 15. | 49947 | 8.2% | 1.6%(+6.59)#15 | 2.1%(+6.08)#1,089 |
| 16. | 48109 | 8.1% | 1.6%(+6.45)#16 | 2.1%(+5.95)#1,132 |
| 17. | 49780 | 7.7% | 1.6%(+6.06)#17 | 2.1%(+5.55)#1,265 |
| 18. | 49840 | 7.6% | 1.6%(+5.98)#18 | 2.1%(+5.47)#1,287 |
| 19. | 49958 | 7.3% | 1.6%(+5.69)#19 | 2.1%(+5.19)#1,387 |
| 20. | 49793 | 7.3% | 1.6%(+5.68)#20 | 2.1%(+5.17)#1,392 |
| 21. | 49623 | 7.2% | 1.6%(+5.55)#21 | 2.1%(+5.04)#1,444 |
| 22. | 49715 | 7.1% | 1.6%(+5.47)#22 | 2.1%(+4.96)#1,488 |
| 23. | 49921 | 6.6% | 1.6%(+4.99)#23 | 2.1%(+4.48)#1,725 |
| 24. | 49791 | 6.6% | 1.6%(+4.94)#24 | 2.1%(+4.43)#1,746 |
| 25. | 49946 | 6.4% | 1.6%(+4.76)#25 | 2.1%(+4.25)#1,830 |
| 26. | 49675 | 6.1% | 1.6%(+4.46)#26 | 2.1%(+3.95)#2,012 |
| 27. | 49719 | 6.0% | 1.6%(+4.40)#27 | 2.1%(+3.89)#2,055 |
| 28. | 49948 | 5.7% | 1.6%(+4.07)#28 | 2.1%(+3.57)#2,276 |
| 29. | 48211 | 5.7% | 1.6%(+4.07)#29 | 2.1%(+3.56)#2,282 |
| 30. | 48742 | 5.6% | 1.6%(+3.93)#30 | 2.1%(+3.43)#2,392 |
| 31. | 48141 | 5.6% | 1.6%(+3.92)#31 | 2.1%(+3.41)#2,403 |
| 32. | 49854 | 5.5% | 1.6%(+3.88)#32 | 2.1%(+3.37)#2,436 |
| 33. | 48120 | 5.4% | 1.6%(+3.75)#33 | 2.1%(+3.24)#2,547 |
| 34. | 49254 | 5.4% | 1.6%(+3.73)#34 | 2.1%(+3.22)#2,570 |
| 35. | 48846 | 5.3% | 1.6%(+3.67)#35 | 2.1%(+3.16)#2,629 |
| 36. | 49783 | 5.2% | 1.6%(+3.60)#36 | 2.1%(+3.09)#2,679 |
| 37. | 49343 | 5.2% | 1.6%(+3.59)#37 | 2.1%(+3.08)#2,688 |
| 38. | 49248 | 5.1% | 1.6%(+3.49)#38 | 2.1%(+2.99)#2,777 |
| 39. | 49825 | 5.1% | 1.6%(+3.49)#39 | 2.1%(+2.98)#2,784 |
| 40. | 48891 | 5.1% | 1.6%(+3.42)#40 | 2.1%(+2.91)#2,853 |
| 41. | 49760 | 5.0% | 1.6%(+3.39)#41 | 2.1%(+2.88)#2,892 |
| 42. | 48454 | 5.0% | 1.6%(+3.34)#42 | 2.1%(+2.83)#2,947 |
| 43. | 49866 | 5.0% | 1.6%(+3.33)#43 | 2.1%(+2.82)#2,963 |
| 44. | 48206 | 4.9% | 1.6%(+3.30)#44 | 2.1%(+2.80)#2,992 |
| 45. | 48219 | 4.9% | 1.6%(+3.28)#45 | 2.1%(+2.78)#3,013 |
| 46. | 48234 | 4.9% | 1.6%(+3.26)#46 | 2.1%(+2.76)#3,042 |
| 47. | 49706 | 4.8% | 1.6%(+3.19)#47 | 2.1%(+2.68)#3,136 |
| 48. | 49853 | 4.8% | 1.6%(+3.17)#48 | 2.1%(+2.67)#3,164 |
| 49. | 48467 | 4.8% | 1.6%(+3.12)#49 | 2.1%(+2.61)#3,228 |
| 50. | 48856 | 4.7% | 1.6%(+3.05)#50 | 2.1%(+2.55)#3,310 |
| 51. | 48838 | 4.6% | 1.6%(+3.01)#51 | 2.1%(+2.50)#3,375 |
| 52. | 48063 | 4.6% | 1.6%(+2.99)#52 | 2.1%(+2.48)#3,389 |
| 53. | 49113 | 4.6% | 1.6%(+2.98)#53 | 2.1%(+2.48)#3,399 |
| 54. | 48653 | 4.6% | 1.6%(+2.93)#54 | 2.1%(+2.42)#3,489 |
| 55. | 49862 | 4.5% | 1.6%(+2.86)#55 | 2.1%(+2.36)#3,603 |
| 56. | 49636 | 4.5% | 1.6%(+2.81)#56 | 2.1%(+2.31)#3,681 |
| 57. | 48811 | 4.4% | 1.6%(+2.80)#57 | 2.1%(+2.29)#3,708 |
| 58. | 48879 | 4.4% | 1.6%(+2.76)#58 | 2.1%(+2.26)#3,769 |
| 59. | 48848 | 4.4% | 1.6%(+2.75)#59 | 2.1%(+2.25)#3,786 |
| 60. | 49806 | 4.4% | 1.6%(+2.75)#60 | 2.1%(+2.24)#3,792 |
| 61. | 49033 | 4.4% | 1.6%(+2.72)#61 | 2.1%(+2.21)#3,844 |
| 62. | 48638 | 4.3% | 1.6%(+2.70)#62 | 2.1%(+2.19)#3,874 |
| 63. | 49617 | 4.3% | 1.6%(+2.70)#63 | 2.1%(+2.19)#3,878 |
| 64. | 49959 | 4.3% | 1.6%(+2.68)#64 | 2.1%(+2.17)#3,914 |
| 65. | 49814 | 4.3% | 1.6%(+2.61)#65 | 2.1%(+2.11)#4,013 |
| 66. | 48437 | 4.3% | 1.6%(+2.61)#66 | 2.1%(+2.11)#4,017 |
| 67. | 49971 | 4.2% | 1.6%(+2.60)#67 | 2.1%(+2.09)#4,053 |
| 68. | 49265 | 4.2% | 1.6%(+2.57)#68 | 2.1%(+2.07)#4,101 |
| 69. | 48228 | 4.2% | 1.6%(+2.54)#69 | 2.1%(+2.04)#4,149 |
| 70. | 49908 | 4.1% | 1.6%(+2.50)#70 | 2.1%(+1.99)#4,233 |
| 71. | 49043 | 4.1% | 1.6%(+2.48)#71 | 2.1%(+1.97)#4,262 |
| 72. | 49827 | 4.1% | 1.6%(+2.46)#72 | 2.1%(+1.95)#4,301 |
| 73. | 49870 | 4.1% | 1.6%(+2.45)#73 | 2.1%(+1.95)#4,308 |
| 74. | 49613 | 4.1% | 1.6%(+2.44)#74 | 2.1%(+1.93)#4,336 |
| 75. | 48224 | 4.1% | 1.6%(+2.42)#75 | 2.1%(+1.91)#4,372 |
| 76. | 48204 | 4.1% | 1.6%(+2.42)#76 | 2.1%(+1.91)#4,381 |
| 77. | 48876 | 4.1% | 1.6%(+2.41)#77 | 2.1%(+1.90)#4,395 |
| 78. | 49765 | 4.0% | 1.6%(+2.40)#78 | 2.1%(+1.89)#4,419 |
| 79. | 48759 | 4.0% | 1.6%(+2.38)#79 | 2.1%(+1.87)#4,447 |
| 80. | 49461 | 4.0% | 1.6%(+2.38)#80 | 2.1%(+1.87)#4,452 |
| 81. | 48871 | 4.0% | 1.6%(+2.38)#81 | 2.1%(+1.87)#4,462 |
| 82. | 49725 | 4.0% | 1.6%(+2.36)#82 | 2.1%(+1.85)#4,490 |
| 83. | 48050 | 4.0% | 1.6%(+2.35)#83 | 2.1%(+1.84)#4,522 |
| 84. | 48173 | 4.0% | 1.6%(+2.32)#84 | 2.1%(+1.82)#4,565 |
| 85. | 48629 | 3.9% | 1.6%(+2.22)#85 | 2.1%(+1.72)#4,770 |
| 86. | 49816 | 3.9% | 1.6%(+2.22)#86 | 2.1%(+1.71)#4,785 |
| 87. | 49312 | 3.8% | 1.6%(+2.20)#87 | 2.1%(+1.70)#4,816 |
| 88. | 48028 | 3.8% | 1.6%(+2.20)#88 | 2.1%(+1.69)#4,830 |
| 89. | 48215 | 3.8% | 1.6%(+2.15)#89 | 2.1%(+1.64)#4,925 |
| 90. | 49233 | 3.8% | 1.6%(+2.13)#90 | 2.1%(+1.62)#4,966 |
| 91. | 48894 | 3.8% | 1.6%(+2.13)#91 | 2.1%(+1.62)#4,968 |
| 92. | 48005 | 3.8% | 1.6%(+2.11)#92 | 2.1%(+1.60)#5,029 |
| 93. | 48809 | 3.7% | 1.6%(+2.10)#93 | 2.1%(+1.59)#5,046 |
| 94. | 48040 | 3.7% | 1.6%(+2.04)#94 | 2.1%(+1.53)#5,195 |
| 95. | 49849 | 3.7% | 1.6%(+2.01)#95 | 2.1%(+1.51)#5,266 |
| 96. | 49411 | 3.6% | 1.6%(+1.98)#96 | 2.1%(+1.47)#5,361 |
| 97. | 49962 | 3.6% | 1.6%(+1.93)#97 | 2.1%(+1.42)#5,474 |
| 98. | 48885 | 3.6% | 1.6%(+1.92)#98 | 2.1%(+1.41)#5,510 |
| 99. | 49268 | 3.6% | 1.6%(+1.91)#99 | 2.1%(+1.41)#5,524 |
| 100. | 48164 | 3.5% | 1.6%(+1.90)#100 | 2.1%(+1.40)#5,555 |
Common Questions
What are the Top 10 Zip Codes with the Highest Percentage of Population Employed in Security & Protection in Michigan?
Top 10 Zip Codes with the Highest Percentage of Population Employed in Security & Protection in Michigan are:
What zip code has the Highest Percentage of Population Employed in Security & Protection in Michigan?
49864 has the Highest Percentage of Population Employed in Security & Protection in Michigan with 20.0%.
What is the Percentage of Population Employed in Security & Protection in the State of Michigan?
Percentage of Population Employed in Security & Protection in Michigan is 1.6%.
What is the Percentage of Population Employed in Security & Protection in the United States?
Percentage of Population Employed in Security & Protection in the United States is 2.1%.