Maple Grove, MI Map & Demographics
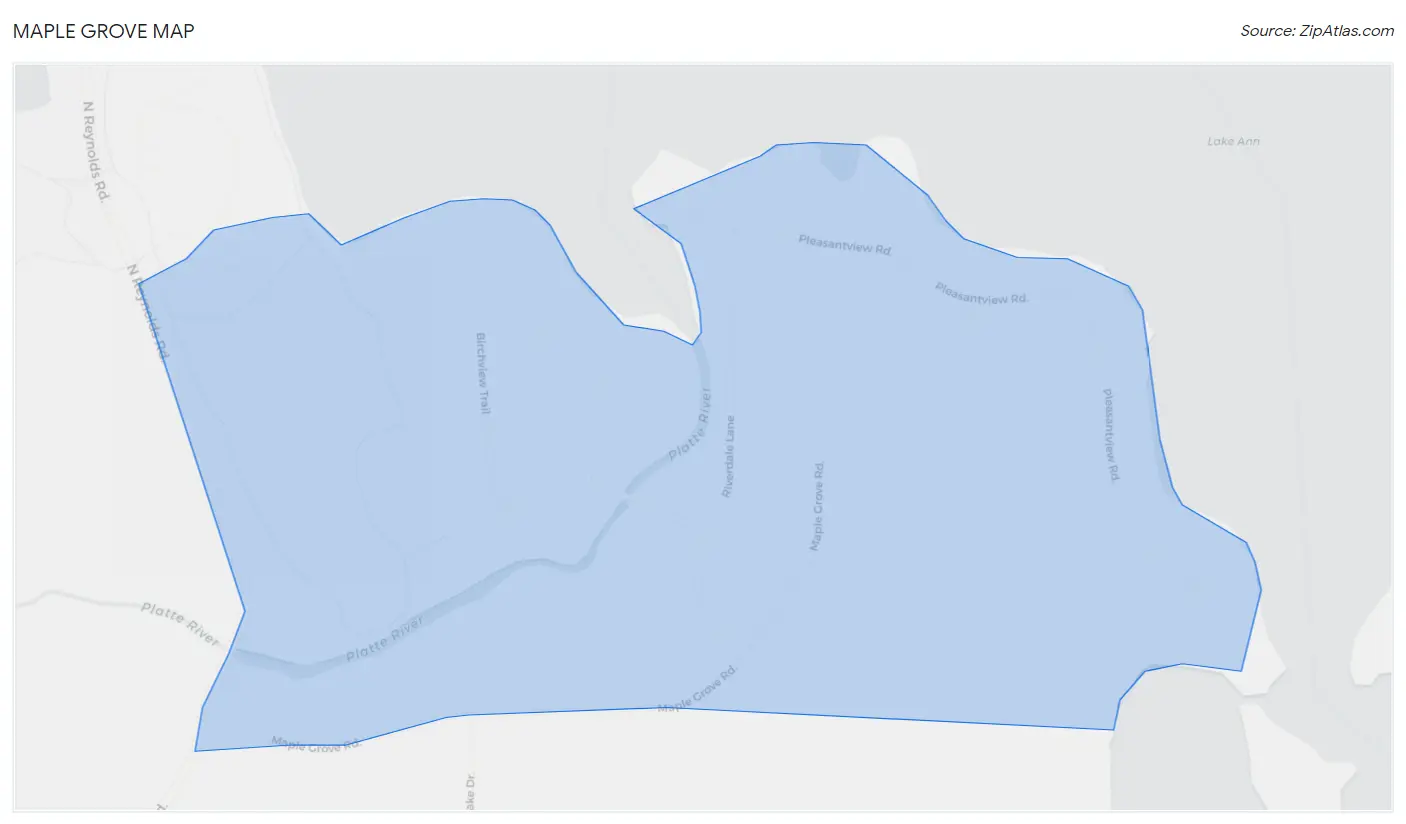
Maple Grove Map
Maple Grove Overview
$51,581
PER CAPITA INCOME
$146,125
AVG FAMILY INCOME
$146,125
AVG HOUSEHOLD INCOME
0.21
INEQUALITY / GINI INDEX
165
TOTAL POPULATION
81
MALE POPULATION
84
FEMALE POPULATION
96.43
MALES / 100 FEMALES
103.70
FEMALES / 100 MALES
47.8
MEDIAN AGE
3.3
AVG FAMILY SIZE
3.3
AVG HOUSEHOLD SIZE
137
LABOR FORCE [ PEOPLE ]
83.0%
PERCENT IN LABOR FORCE
Income in Maple Grove
Income Overview in Maple Grove
Per Capita Income in Maple Grove is $51,581, while median incomes of families and households are $146,125 and $146,125 respectively.
| Characteristic | Number | Measure |
| Per Capita Income | 165 | $51,581 |
| Median Family Income | 50 | $146,125 |
| Mean Family Income | 50 | $159,046 |
| Median Household Income | 50 | $146,125 |
| Mean Household Income | 50 | $159,046 |
| Income Deficit | 50 | $0 |
| Wage / Income Gap (%) | 165 | 0.00% |
| Wage / Income Gap ($) | 165 | 100.00¢ per $1 |
| Gini / Inequality Index | 165 | 0.21 |
Earnings by Sex in Maple Grove
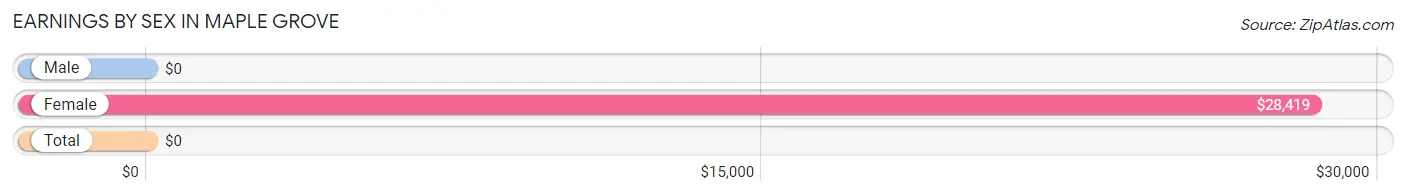
| Sex | Number | Average Earnings |
| Male | 81 (54.0%) | $0 |
| Female | 69 (46.0%) | $28,419 |
| Total | 150 (100.0%) | $0 |
Earnings by Sex by Income Bracket in Maple Grove
The most common earnings brackets in Maple Grove are $22,500 to $24,999 for men (31 | 38.3%) and $25,000 to $29,999 for women (34 | 49.3%).
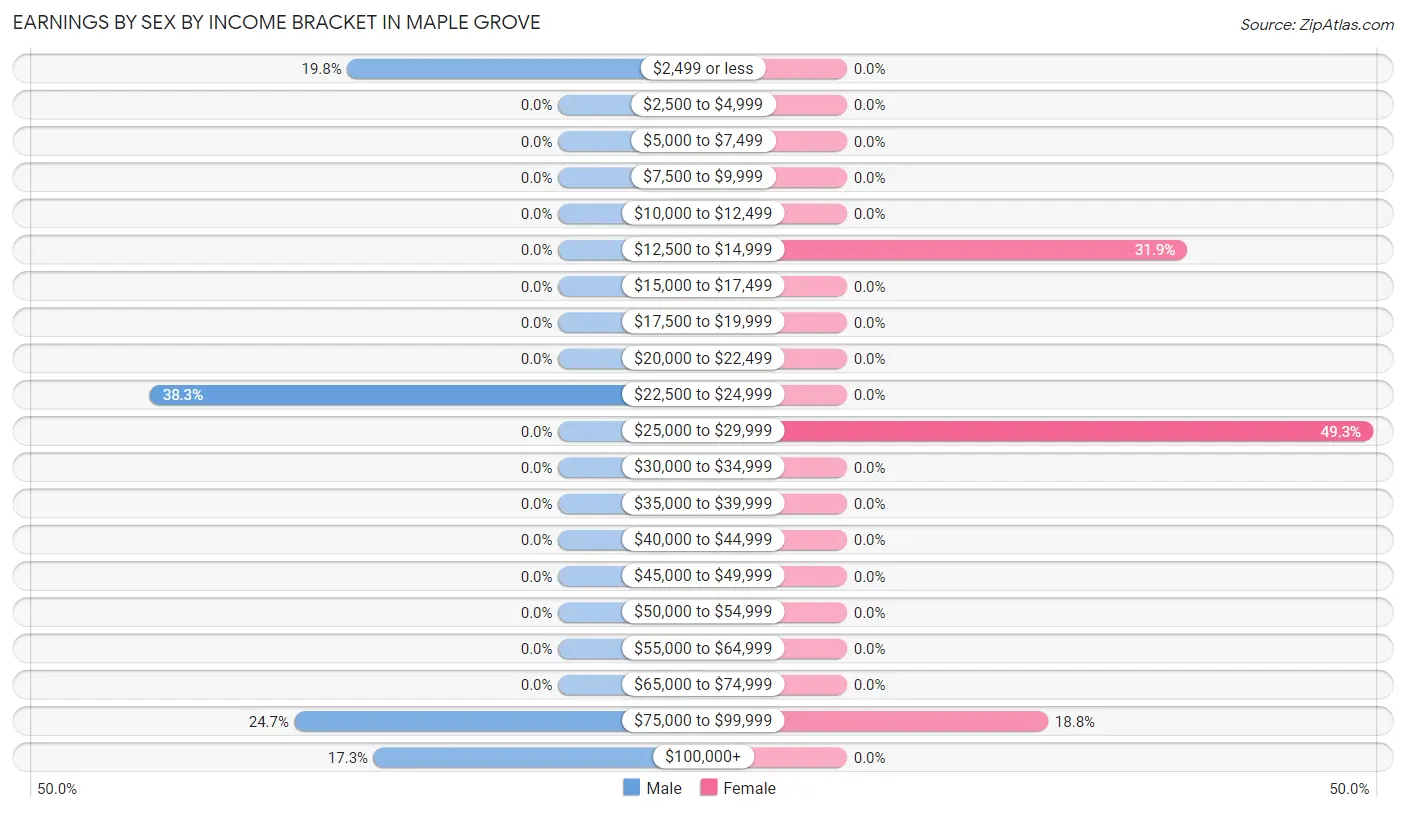
| Income | Male | Female |
| $2,499 or less | 16 (19.8%) | 0 (0.0%) |
| $2,500 to $4,999 | 0 (0.0%) | 0 (0.0%) |
| $5,000 to $7,499 | 0 (0.0%) | 0 (0.0%) |
| $7,500 to $9,999 | 0 (0.0%) | 0 (0.0%) |
| $10,000 to $12,499 | 0 (0.0%) | 0 (0.0%) |
| $12,500 to $14,999 | 0 (0.0%) | 22 (31.9%) |
| $15,000 to $17,499 | 0 (0.0%) | 0 (0.0%) |
| $17,500 to $19,999 | 0 (0.0%) | 0 (0.0%) |
| $20,000 to $22,499 | 0 (0.0%) | 0 (0.0%) |
| $22,500 to $24,999 | 31 (38.3%) | 0 (0.0%) |
| $25,000 to $29,999 | 0 (0.0%) | 34 (49.3%) |
| $30,000 to $34,999 | 0 (0.0%) | 0 (0.0%) |
| $35,000 to $39,999 | 0 (0.0%) | 0 (0.0%) |
| $40,000 to $44,999 | 0 (0.0%) | 0 (0.0%) |
| $45,000 to $49,999 | 0 (0.0%) | 0 (0.0%) |
| $50,000 to $54,999 | 0 (0.0%) | 0 (0.0%) |
| $55,000 to $64,999 | 0 (0.0%) | 0 (0.0%) |
| $65,000 to $74,999 | 0 (0.0%) | 0 (0.0%) |
| $75,000 to $99,999 | 20 (24.7%) | 13 (18.8%) |
| $100,000+ | 14 (17.3%) | 0 (0.0%) |
| Total | 81 (100.0%) | 69 (100.0%) |
Earnings by Sex by Educational Attainment in Maple Grove
| Educational Attainment | Male Income | Female Income |
| Less than High School | - | - |
| High School Diploma | - | - |
| College or Associate's Degree | - | - |
| Bachelor's Degree | - | - |
| Graduate Degree | - | - |
| Total | - | - |
Family Income in Maple Grove
Family Income Brackets in Maple Grove
According to the Maple Grove family income data, there are 20 families falling into the $100,000 to $149,999 income range, which is the most common income bracket and makes up 40.0% of all families.
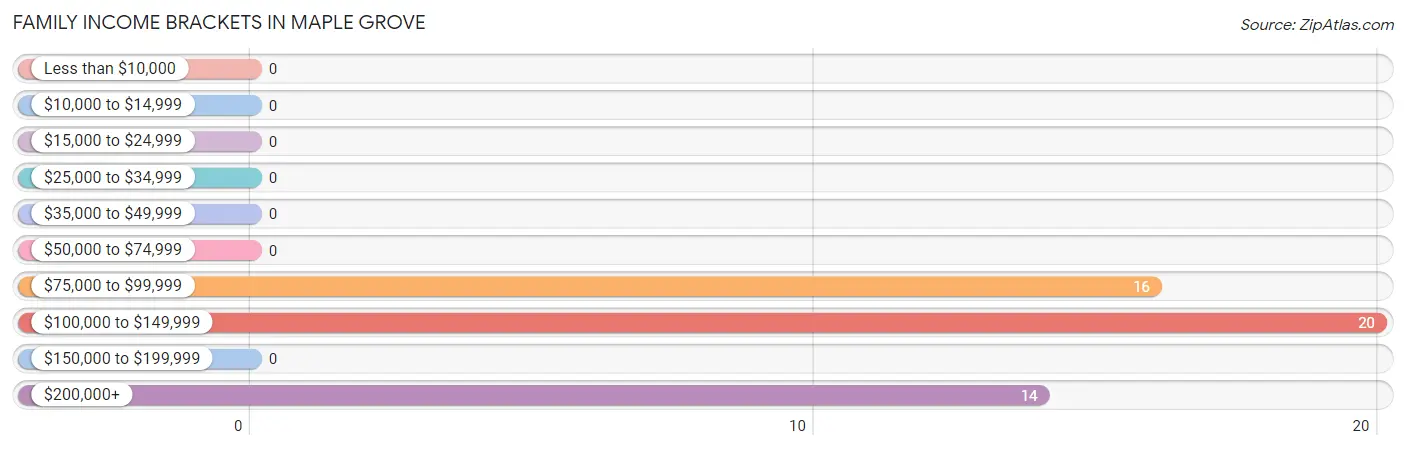
| Income Bracket | # Families | % Families |
| Less than $10,000 | 0 | 0.0% |
| $10,000 to $14,999 | 0 | 0.0% |
| $15,000 to $24,999 | 0 | 0.0% |
| $25,000 to $34,999 | 0 | 0.0% |
| $35,000 to $49,999 | 0 | 0.0% |
| $50,000 to $74,999 | 0 | 0.0% |
| $75,000 to $99,999 | 16 | 32.0% |
| $100,000 to $149,999 | 20 | 40.0% |
| $150,000 to $199,999 | 0 | 0.0% |
| $200,000+ | 14 | 28.0% |
Family Income by Famaliy Size in Maple Grove
| Income Bracket | # Families | Median Income |
| 2-Person Families | 30 (60.0%) | $0 |
| 3-Person Families | 0 (0.0%) | $0 |
| 4-Person Families | 20 (40.0%) | $0 |
| 5-Person Families | 0 (0.0%) | $0 |
| 6-Person Families | 0 (0.0%) | $0 |
| 7+ Person Families | 0 (0.0%) | $0 |
| Total | 50 (100.0%) | $146,125 |
Family Income by Number of Earners in Maple Grove
| Number of Earners | # Families | Median Income |
| No Earners | 0 (0.0%) | $0 |
| 1 Earner | 16 (32.0%) | $0 |
| 2 Earners | 14 (28.0%) | $0 |
| 3+ Earners | 20 (40.0%) | $0 |
| Total | 50 (100.0%) | $146,125 |
Household Income in Maple Grove
Household Income Brackets in Maple Grove
With 20 households falling in the category, the $100,000 to $149,999 income range is the most frequent in Maple Grove, accounting for 40.0% of all households.
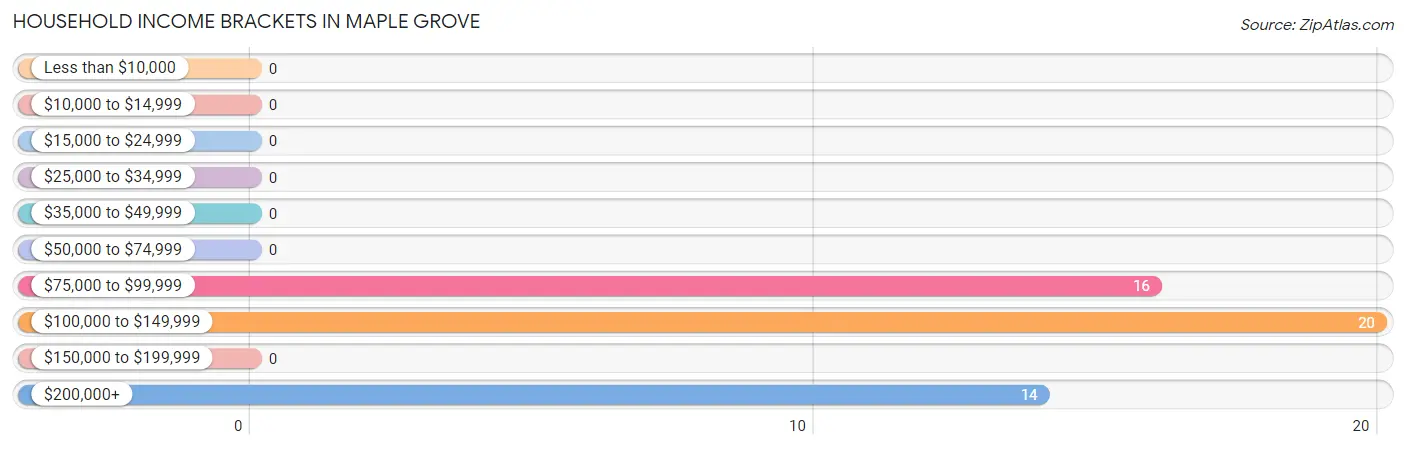
| Income Bracket | # Households | % Households |
| Less than $10,000 | 0 | 0.0% |
| $10,000 to $14,999 | 0 | 0.0% |
| $15,000 to $24,999 | 0 | 0.0% |
| $25,000 to $34,999 | 0 | 0.0% |
| $35,000 to $49,999 | 0 | 0.0% |
| $50,000 to $74,999 | 0 | 0.0% |
| $75,000 to $99,999 | 16 | 32.0% |
| $100,000 to $149,999 | 20 | 40.0% |
| $150,000 to $199,999 | 0 | 0.0% |
| $200,000+ | 14 | 28.0% |
Household Income by Householder Age in Maple Grove
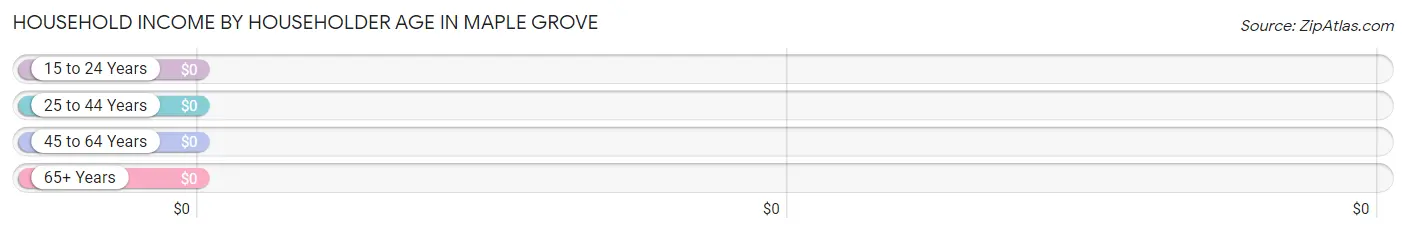
| Income Bracket | # Households | Median Income |
| 15 to 24 Years | 0 (0.0%) | $0 |
| 25 to 44 Years | 0 (0.0%) | $0 |
| 45 to 64 Years | 34 (68.0%) | $0 |
| 65+ Years | 16 (32.0%) | $0 |
| Total | 50 (100.0%) | $146,125 |
Poverty in Maple Grove
Income Below Poverty by Sex and Age in Maple Grove
| Age Bracket | Male | Female |
| Under 5 Years | 0 (0.0%) | 0 (0.0%) |
| 5 Years | 0 (0.0%) | 0 (0.0%) |
| 6 to 11 Years | 0 (0.0%) | 0 (0.0%) |
| 12 to 14 Years | 0 (0.0%) | 0 (0.0%) |
| 15 Years | 0 (0.0%) | 0 (0.0%) |
| 16 and 17 Years | 0 (0.0%) | 0 (0.0%) |
| 18 to 24 Years | 0 (0.0%) | 0 (0.0%) |
| 25 to 34 Years | 0 (0.0%) | 0 (0.0%) |
| 35 to 44 Years | 0 (0.0%) | 0 (0.0%) |
| 45 to 54 Years | 0 (0.0%) | 0 (0.0%) |
| 55 to 64 Years | 0 (0.0%) | 0 (0.0%) |
| 65 to 74 Years | 0 (0.0%) | 0 (0.0%) |
| 75 Years and over | 0 (0.0%) | 0 (0.0%) |
| Total | 0 (0.0%) | 0 (0.0%) |
Income Above Poverty by Sex and Age in Maple Grove
According to the poverty statistics in Maple Grove, males aged 18 to 24 years and females aged 18 to 24 years are the age groups that are most secure financially, with 100.0% of males and 100.0% of females in these age groups living above the poverty line.
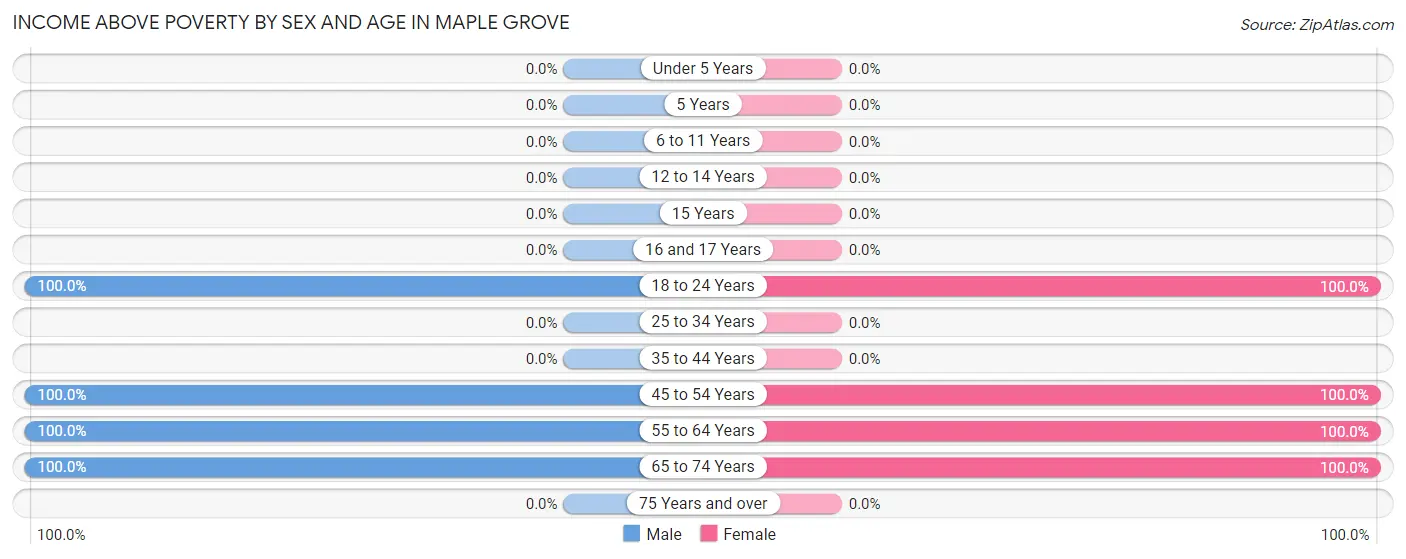
| Age Bracket | Male | Female |
| Under 5 Years | 0 (0.0%) | 0 (0.0%) |
| 5 Years | 0 (0.0%) | 0 (0.0%) |
| 6 to 11 Years | 0 (0.0%) | 0 (0.0%) |
| 12 to 14 Years | 0 (0.0%) | 0 (0.0%) |
| 15 Years | 0 (0.0%) | 0 (0.0%) |
| 16 and 17 Years | 0 (0.0%) | 0 (0.0%) |
| 18 to 24 Years | 31 (100.0%) | 34 (100.0%) |
| 25 to 34 Years | 0 (0.0%) | 0 (0.0%) |
| 35 to 44 Years | 0 (0.0%) | 0 (0.0%) |
| 45 to 54 Years | 20 (100.0%) | 22 (100.0%) |
| 55 to 64 Years | 14 (100.0%) | 13 (100.0%) |
| 65 to 74 Years | 16 (100.0%) | 15 (100.0%) |
| 75 Years and over | 0 (0.0%) | 0 (0.0%) |
| Total | 81 (100.0%) | 84 (100.0%) |
Income Below Poverty Among Married-Couple Families in Maple Grove
| Children | Above Poverty | Below Poverty |
| No Children | 50 (100.0%) | 0 (0.0%) |
| 1 or 2 Children | 0 (0.0%) | 0 (0.0%) |
| 3 or 4 Children | 0 (0.0%) | 0 (0.0%) |
| 5 or more Children | 0 (0.0%) | 0 (0.0%) |
| Total | 50 (100.0%) | 0 (0.0%) |
Income Below Poverty Among Single-Parent Households in Maple Grove
| Children | Single Father | Single Mother |
| No Children | 0 (0.0%) | 0 (0.0%) |
| 1 or 2 Children | 0 (0.0%) | 0 (0.0%) |
| 3 or 4 Children | 0 (0.0%) | 0 (0.0%) |
| 5 or more Children | 0 (0.0%) | 0 (0.0%) |
| Total | 0 (0.0%) | 0 (0.0%) |
Income Below Poverty Among Married-Couple vs Single-Parent Households in Maple Grove
| Children | Married-Couple Families | Single-Parent Households |
| No Children | 0 (0.0%) | 0 (0.0%) |
| 1 or 2 Children | 0 (0.0%) | 0 (0.0%) |
| 3 or 4 Children | 0 (0.0%) | 0 (0.0%) |
| 5 or more Children | 0 (0.0%) | 0 (0.0%) |
| Total | 0 (0.0%) | 0 (0.0%) |
Race in Maple Grove
The most populous races in Maple Grove are , and White / Caucasian (165 | 100.0%).
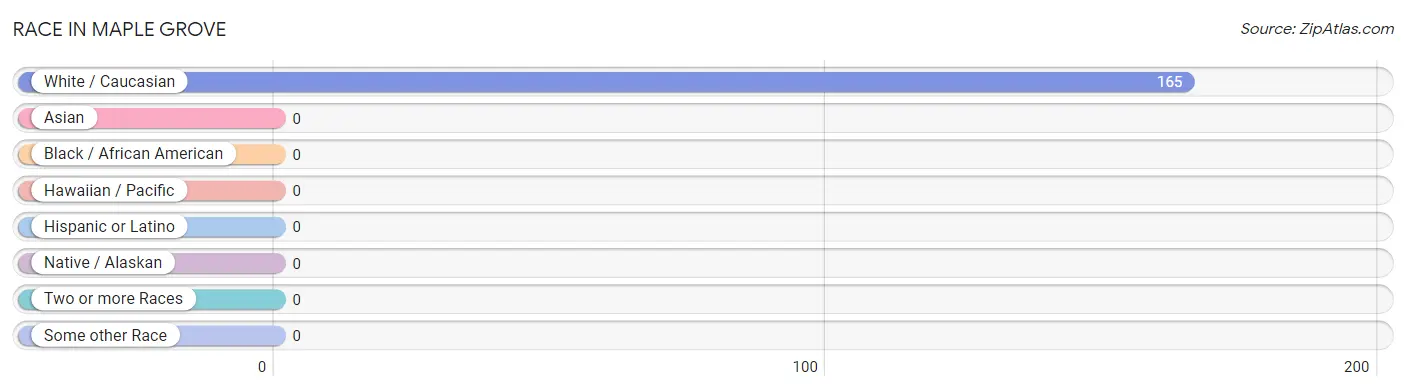
| Race | # Population | % Population |
| Asian | 0 | 0.0% |
| Black / African American | 0 | 0.0% |
| Hawaiian / Pacific | 0 | 0.0% |
| Hispanic or Latino | 0 | 0.0% |
| Native / Alaskan | 0 | 0.0% |
| White / Caucasian | 165 | 100.0% |
| Two or more Races | 0 | 0.0% |
| Some other Race | 0 | 0.0% |
| Total | 165 | 100.0% |
Ancestry in Maple Grove
The most populous ancestries reported in Maple Grove are English (107 | 64.8%), German (45 | 27.3%), Irish (22 | 13.3%), Scotch-Irish (20 | 12.1%), and Dutch (13 | 7.9%), together accounting for 125.4% of all Maple Grove residents.
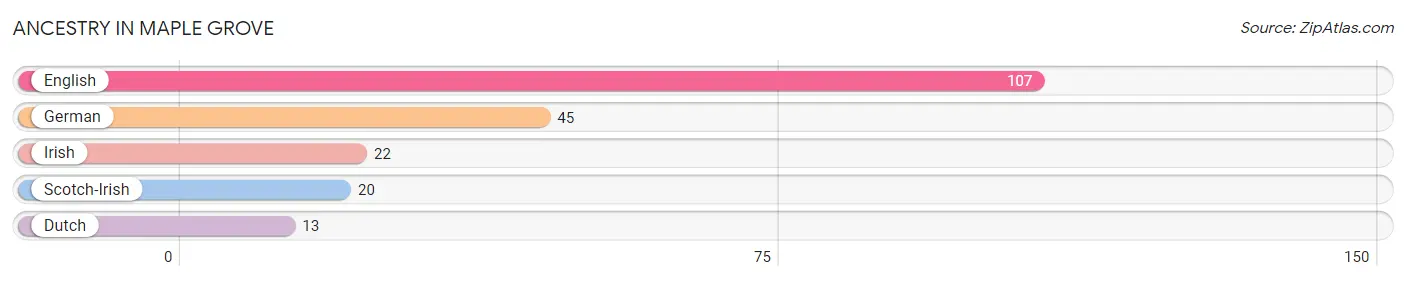
| Ancestry | # Population | % Population |
| Dutch | 13 | 7.9% |
| English | 107 | 64.8% |
| German | 45 | 27.3% |
| Irish | 22 | 13.3% |
| Scotch-Irish | 20 | 12.1% | View All 5 Rows |
Immigrants in Maple Grove

| Immigration Origin | # Population | % Population | View All 0 Rows |
Sex and Age in Maple Grove
Sex and Age in Maple Grove
The most populous age groups in Maple Grove are 20 to 24 Years (31 | 38.3%) for men and 20 to 24 Years (34 | 40.5%) for women.
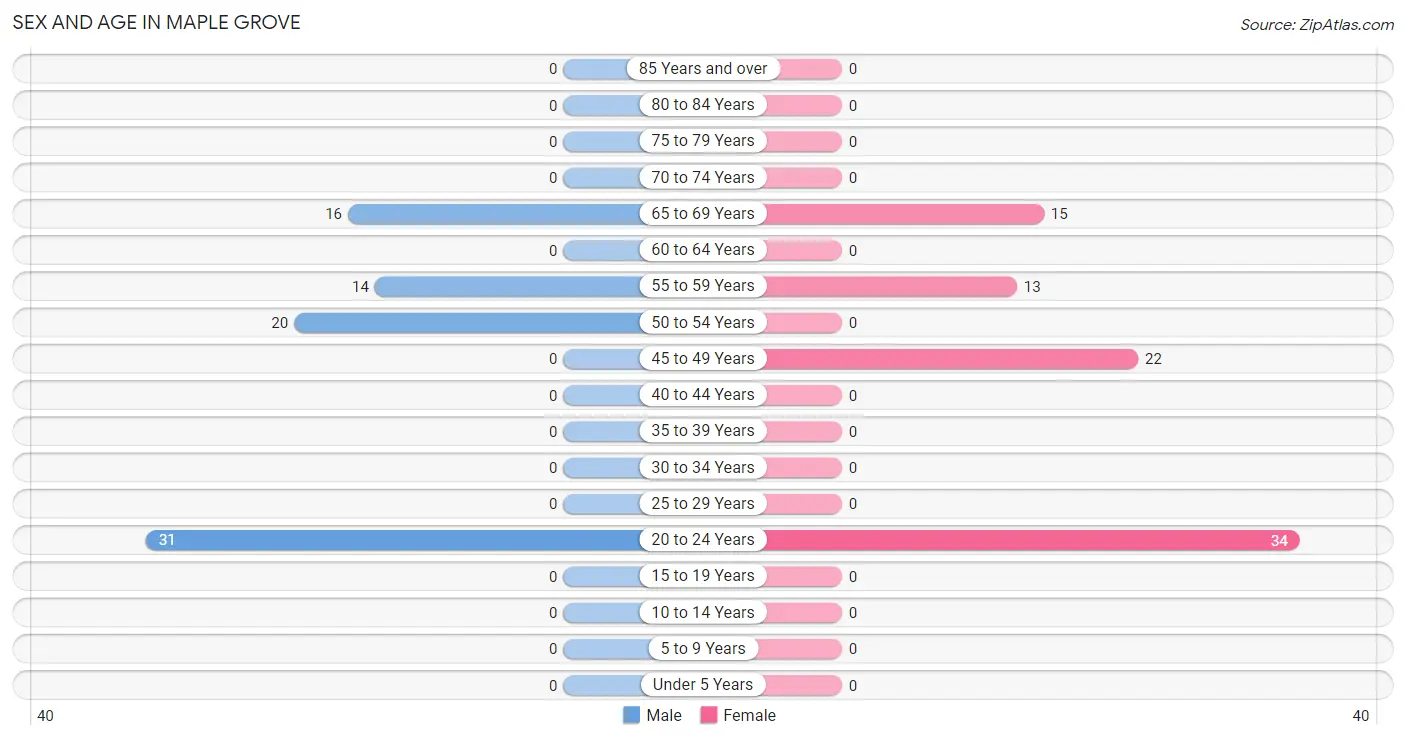
| Age Bracket | Male | Female |
| Under 5 Years | 0 (0.0%) | 0 (0.0%) |
| 5 to 9 Years | 0 (0.0%) | 0 (0.0%) |
| 10 to 14 Years | 0 (0.0%) | 0 (0.0%) |
| 15 to 19 Years | 0 (0.0%) | 0 (0.0%) |
| 20 to 24 Years | 31 (38.3%) | 34 (40.5%) |
| 25 to 29 Years | 0 (0.0%) | 0 (0.0%) |
| 30 to 34 Years | 0 (0.0%) | 0 (0.0%) |
| 35 to 39 Years | 0 (0.0%) | 0 (0.0%) |
| 40 to 44 Years | 0 (0.0%) | 0 (0.0%) |
| 45 to 49 Years | 0 (0.0%) | 22 (26.2%) |
| 50 to 54 Years | 20 (24.7%) | 0 (0.0%) |
| 55 to 59 Years | 14 (17.3%) | 13 (15.5%) |
| 60 to 64 Years | 0 (0.0%) | 0 (0.0%) |
| 65 to 69 Years | 16 (19.8%) | 15 (17.9%) |
| 70 to 74 Years | 0 (0.0%) | 0 (0.0%) |
| 75 to 79 Years | 0 (0.0%) | 0 (0.0%) |
| 80 to 84 Years | 0 (0.0%) | 0 (0.0%) |
| 85 Years and over | 0 (0.0%) | 0 (0.0%) |
| Total | 81 (100.0%) | 84 (100.0%) |
Families and Households in Maple Grove
Median Family Size in Maple Grove
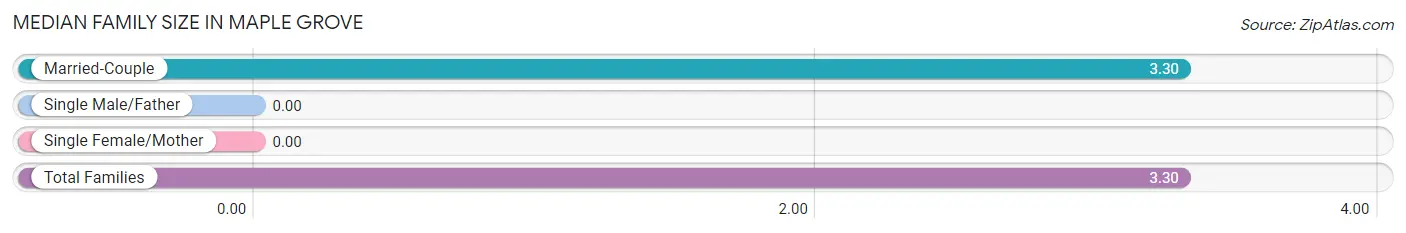
| Family Type | # Families | Family Size |
| Married-Couple | 50 (100.0%) | 3.30 |
| Single Male/Father | 0 (0.0%) | - |
| Single Female/Mother | 0 (0.0%) | - |
| Total Families | 50 (100.0%) | 3.30 |
Median Household Size in Maple Grove
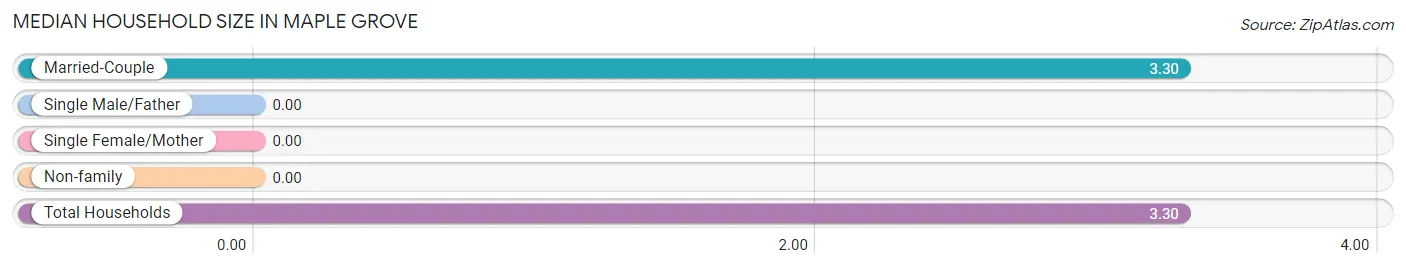
| Household Type | # Households | Household Size |
| Married-Couple | 50 (100.0%) | 3.30 |
| Single Male/Father | 0 (0.0%) | - |
| Single Female/Mother | 0 (0.0%) | - |
| Non-family | 0 (0.0%) | - |
| Total Households | 50 (100.0%) | 3.30 |
Household Size by Marriage Status in Maple Grove
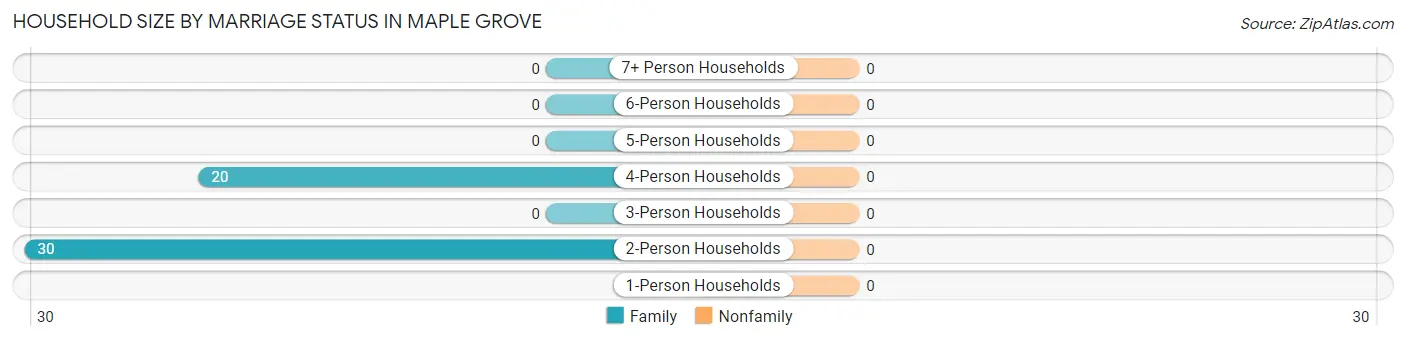
| Household Size | Family Households | Nonfamily Households |
| 1-Person Households | - | 0 (0.0%) |
| 2-Person Households | 30 (60.0%) | 0 (0.0%) |
| 3-Person Households | 0 (0.0%) | 0 (0.0%) |
| 4-Person Households | 20 (40.0%) | 0 (0.0%) |
| 5-Person Households | 0 (0.0%) | 0 (0.0%) |
| 6-Person Households | 0 (0.0%) | 0 (0.0%) |
| 7+ Person Households | 0 (0.0%) | 0 (0.0%) |
| Total | 50 (100.0%) | 0 (0.0%) |
Female Fertility in Maple Grove
Fertility by Age in Maple Grove
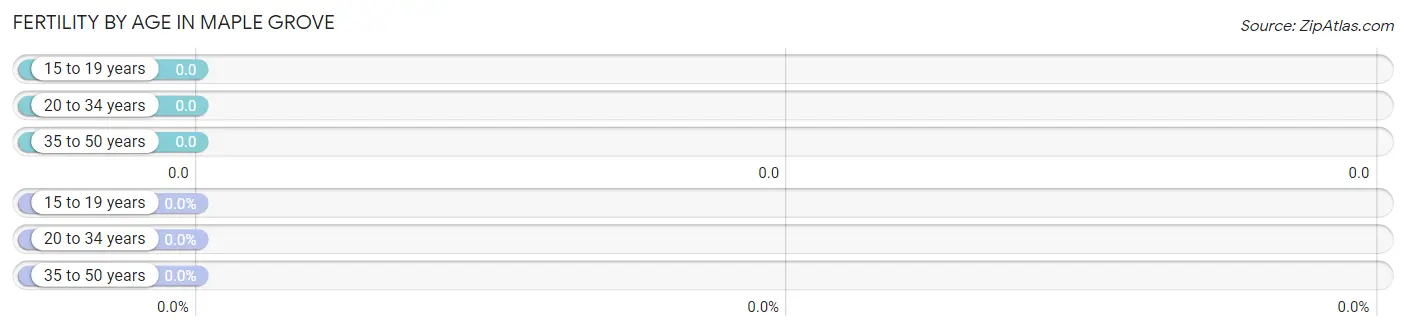
| Age Bracket | Women with Births | Births / 1,000 Women |
| 15 to 19 years | 0 (0.0%) | 0.0 |
| 20 to 34 years | 0 (0.0%) | 0.0 |
| 35 to 50 years | 0 (0.0%) | 0.0 |
| Total | 0 (0.0%) | 0.0 |
Fertility by Age by Marriage Status in Maple Grove
| Age Bracket | Married | Unmarried |
| 15 to 19 years | 0 (0.0%) | 0 (0.0%) |
| 20 to 34 years | 0 (0.0%) | 0 (0.0%) |
| 35 to 50 years | 0 (0.0%) | 0 (0.0%) |
| Total | 0 (0.0%) | 0 (0.0%) |
Fertility by Education in Maple Grove
| Educational Attainment | Women with Births | Births / 1,000 Women |
| Less than High School | 0 (0.0%) | 0.0 |
| High School Diploma | 0 (0.0%) | 0.0 |
| College or Associate's Degree | 0 (0.0%) | 0.0 |
| Bachelor's Degree | 0 (0.0%) | 0.0 |
| Graduate Degree | 0 (0.0%) | 0.0 |
| Total | 0 (0.0%) | 0.0 |
Fertility by Education by Marriage Status in Maple Grove
| Educational Attainment | Married | Unmarried |
| Less than High School | 0 (0.0%) | 0 (0.0%) |
| High School Diploma | 0 (0.0%) | 0 (0.0%) |
| College or Associate's Degree | 0 (0.0%) | 0 (0.0%) |
| Bachelor's Degree | 0 (0.0%) | 0 (0.0%) |
| Graduate Degree | 0 (0.0%) | 0 (0.0%) |
| Total | 0 (0.0%) | 0 (0.0%) |
Employment Characteristics in Maple Grove
Employment by Class of Employer in Maple Grove
Among the 137 employed individuals in Maple Grove, not-for-profit organizations (65 | 47.4%), private company employees (52 | 38.0%), and local government employees (20 | 14.6%) make up the most common classes of employment.
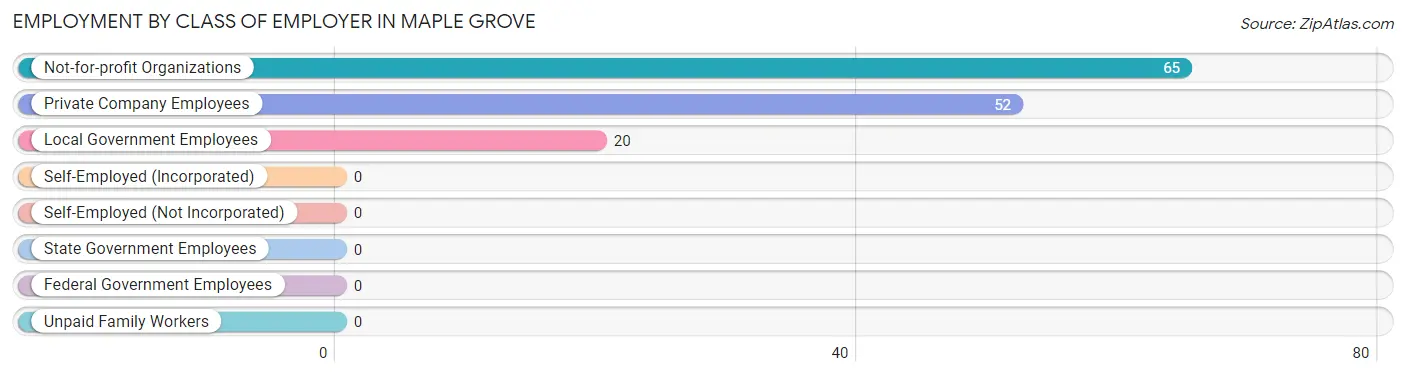
| Employer Class | # Employees | % Employees |
| Private Company Employees | 52 | 38.0% |
| Self-Employed (Incorporated) | 0 | 0.0% |
| Self-Employed (Not Incorporated) | 0 | 0.0% |
| Not-for-profit Organizations | 65 | 47.4% |
| Local Government Employees | 20 | 14.6% |
| State Government Employees | 0 | 0.0% |
| Federal Government Employees | 0 | 0.0% |
| Unpaid Family Workers | 0 | 0.0% |
| Total | 137 | 100.0% |
Employment Status by Age in Maple Grove
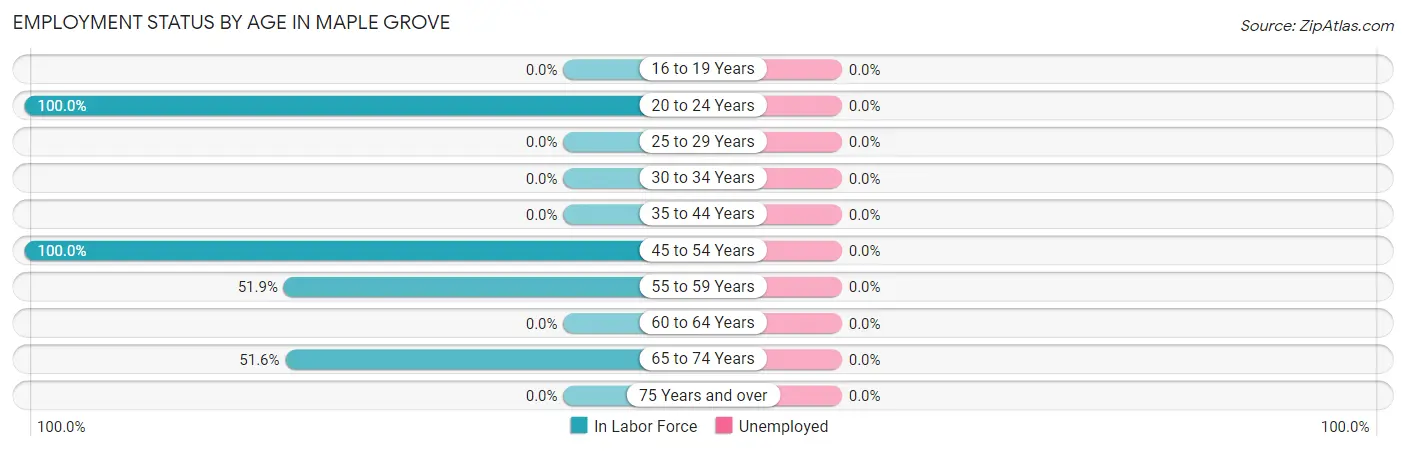
| Age Bracket | In Labor Force | Unemployed |
| 16 to 19 Years | 0 (0.0%) | 0 (0.0%) |
| 20 to 24 Years | 65 (100.0%) | 0 (0.0%) |
| 25 to 29 Years | 0 (0.0%) | 0 (0.0%) |
| 30 to 34 Years | 0 (0.0%) | 0 (0.0%) |
| 35 to 44 Years | 0 (0.0%) | 0 (0.0%) |
| 45 to 54 Years | 42 (100.0%) | 0 (0.0%) |
| 55 to 59 Years | 14 (51.9%) | 0 (0.0%) |
| 60 to 64 Years | 0 (0.0%) | 0 (0.0%) |
| 65 to 74 Years | 16 (51.6%) | 0 (0.0%) |
| 75 Years and over | 0 (0.0%) | 0 (0.0%) |
| Total | 137 (83.0%) | 0 (0.0%) |
Employment Status by Educational Attainment in Maple Grove
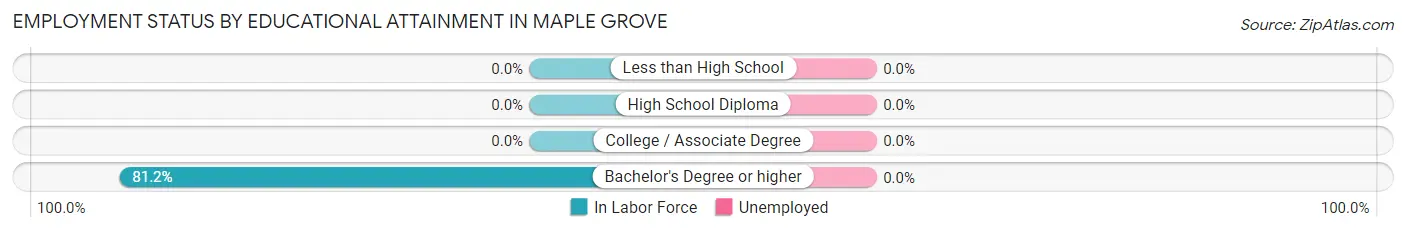
| Educational Attainment | In Labor Force | Unemployed |
| Less than High School | 0 (0.0%) | 0 (0.0%) |
| High School Diploma | 0 (0.0%) | 0 (0.0%) |
| College / Associate Degree | 0 (0.0%) | 0 (0.0%) |
| Bachelor's Degree or higher | 56 (81.2%) | 0 (0.0%) |
| Total | 56 (81.2%) | 0 (0.0%) |
Employment Occupations by Sex in Maple Grove
Management, Business, Science and Arts Occupations
The most common Management, Business, Science and Arts occupations in Maple Grove are Health Diagnosing & Treating (51 | 37.2%), and Business & Financial (14 | 10.2%).
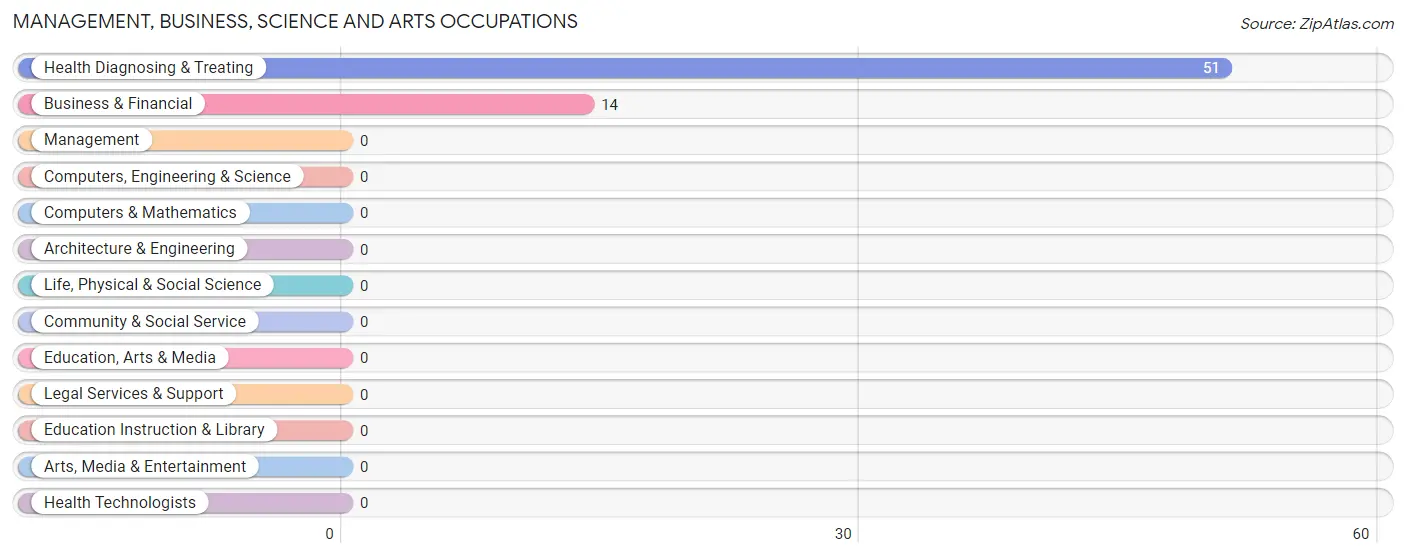
Management, Business, Science and Arts Occupations by Sex
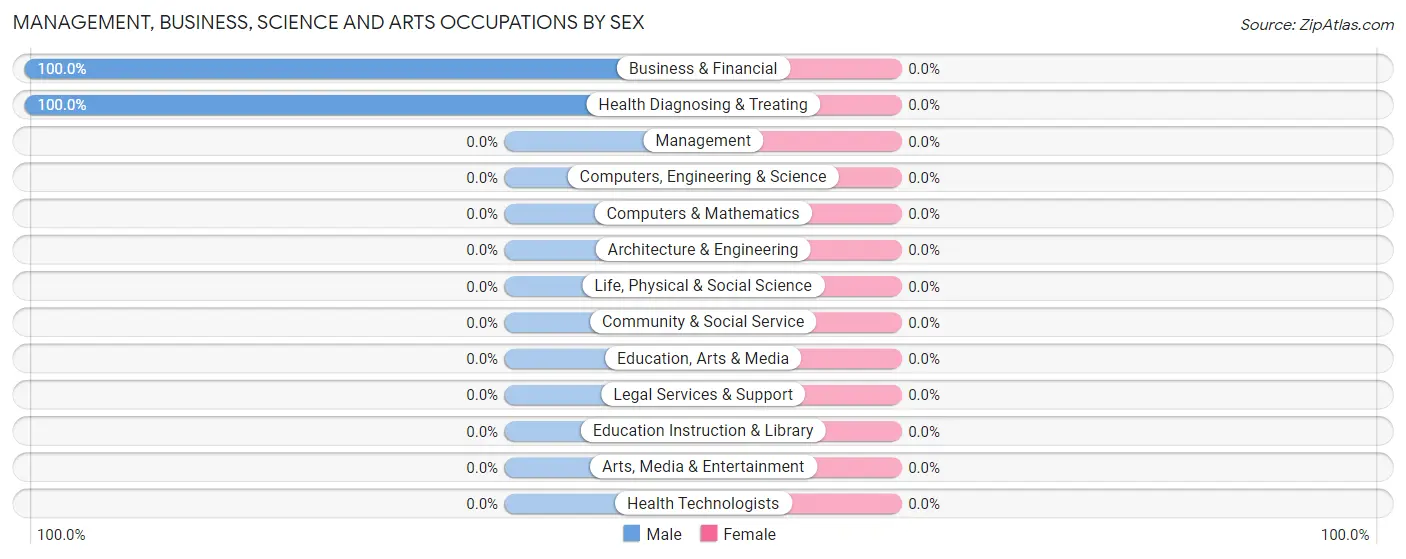
| Occupation | Male | Female |
| Management | 0 (0.0%) | 0 (0.0%) |
| Business & Financial | 14 (100.0%) | 0 (0.0%) |
| Computers, Engineering & Science | 0 (0.0%) | 0 (0.0%) |
| Computers & Mathematics | 0 (0.0%) | 0 (0.0%) |
| Architecture & Engineering | 0 (0.0%) | 0 (0.0%) |
| Life, Physical & Social Science | 0 (0.0%) | 0 (0.0%) |
| Community & Social Service | 0 (0.0%) | 0 (0.0%) |
| Education, Arts & Media | 0 (0.0%) | 0 (0.0%) |
| Legal Services & Support | 0 (0.0%) | 0 (0.0%) |
| Education Instruction & Library | 0 (0.0%) | 0 (0.0%) |
| Arts, Media & Entertainment | 0 (0.0%) | 0 (0.0%) |
| Health Diagnosing & Treating | 51 (100.0%) | 0 (0.0%) |
| Health Technologists | 0 (0.0%) | 0 (0.0%) |
| Total (Category) | 65 (100.0%) | 0 (0.0%) |
| Total (Overall) | 81 (59.1%) | 56 (40.9%) |
Services Occupations
The most common Services occupations in Maple Grove are Healthcare Support (56 | 40.9%), Security & Protection (16 | 11.7%), and Firefighting & Prevention (16 | 11.7%).
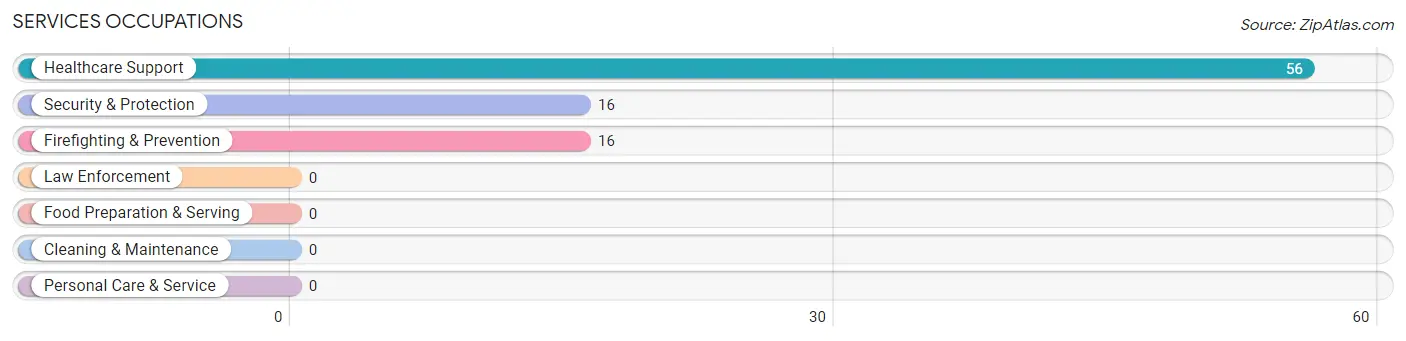
Services Occupations by Sex
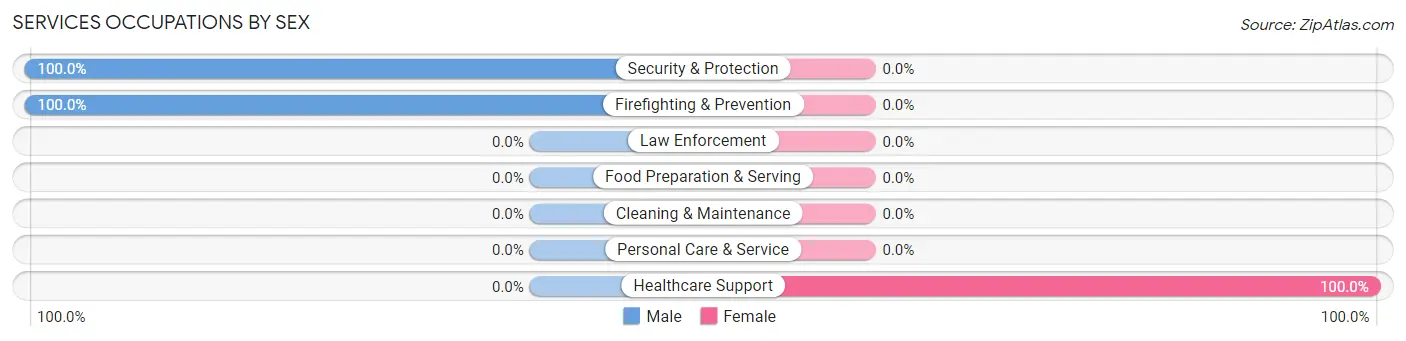
| Occupation | Male | Female |
| Healthcare Support | 0 (0.0%) | 56 (100.0%) |
| Security & Protection | 16 (100.0%) | 0 (0.0%) |
| Firefighting & Prevention | 16 (100.0%) | 0 (0.0%) |
| Law Enforcement | 0 (0.0%) | 0 (0.0%) |
| Food Preparation & Serving | 0 (0.0%) | 0 (0.0%) |
| Cleaning & Maintenance | 0 (0.0%) | 0 (0.0%) |
| Personal Care & Service | 0 (0.0%) | 0 (0.0%) |
| Total (Category) | 16 (22.2%) | 56 (77.8%) |
| Total (Overall) | 81 (59.1%) | 56 (40.9%) |
Sales and Office Occupations
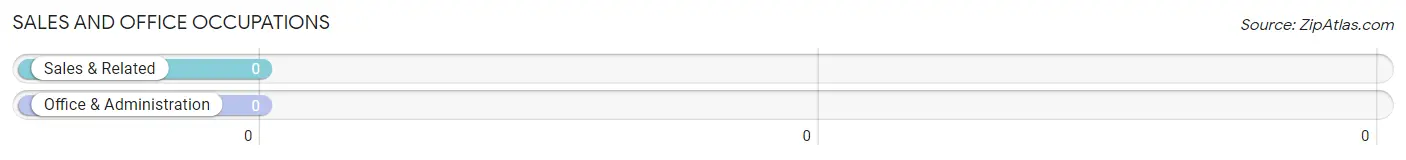
Sales and Office Occupations by Sex
| Occupation | Male | Female |
| Sales & Related | 0 (0.0%) | 0 (0.0%) |
| Office & Administration | 0 (0.0%) | 0 (0.0%) |
| Total (Category) | 0 (0.0%) | 0 (0.0%) |
| Total (Overall) | 81 (59.1%) | 56 (40.9%) |
Natural Resources, Construction and Maintenance Occupations
Natural Resources, Construction and Maintenance Occupations by Sex
| Occupation | Male | Female |
| Farming, Fishing & Forestry | 0 (0.0%) | 0 (0.0%) |
| Construction & Extraction | 0 (0.0%) | 0 (0.0%) |
| Installation, Maintenance & Repair | 0 (0.0%) | 0 (0.0%) |
| Total (Category) | 0 (0.0%) | 0 (0.0%) |
| Total (Overall) | 81 (59.1%) | 56 (40.9%) |
Production, Transportation and Moving Occupations
Production, Transportation and Moving Occupations by Sex
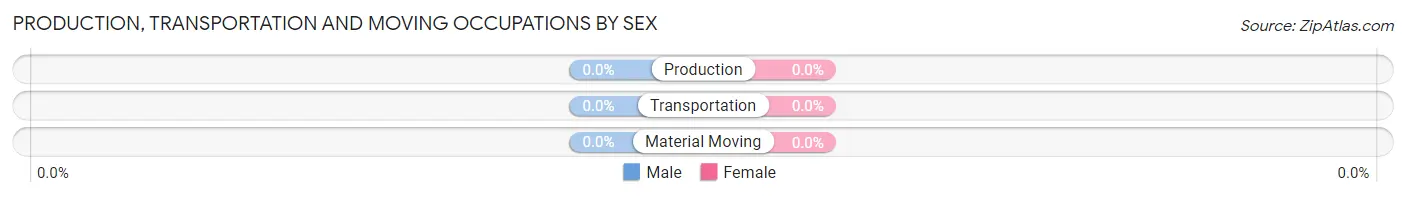
| Occupation | Male | Female |
| Production | 0 (0.0%) | 0 (0.0%) |
| Transportation | 0 (0.0%) | 0 (0.0%) |
| Material Moving | 0 (0.0%) | 0 (0.0%) |
| Total (Category) | 0 (0.0%) | 0 (0.0%) |
| Total (Overall) | 81 (59.1%) | 56 (40.9%) |
Employment Industries by Sex in Maple Grove
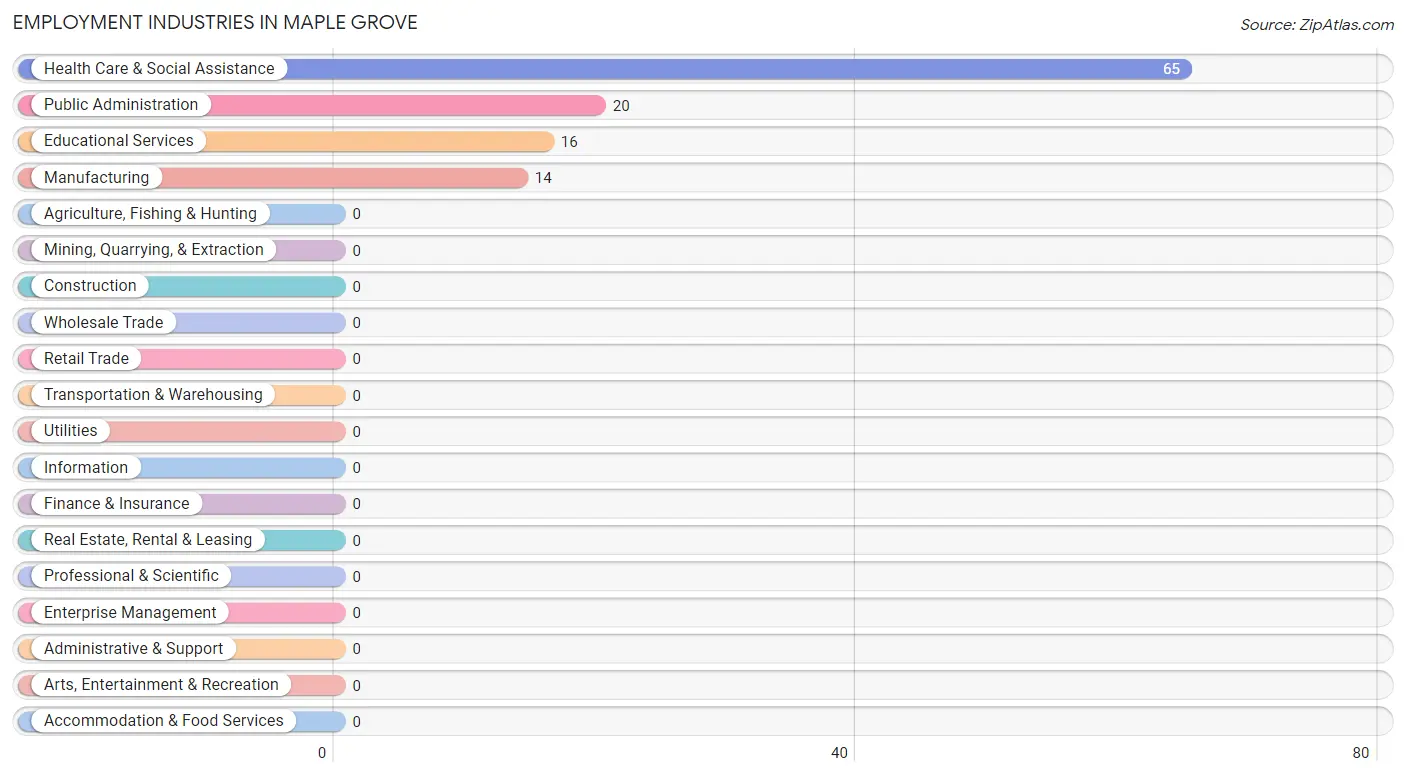
Employment Industries in Maple Grove
The major employment industries in Maple Grove include Health Care & Social Assistance (65 | 47.4%), Public Administration (20 | 14.6%), Educational Services (16 | 11.7%), and Manufacturing (14 | 10.2%).
Employment Industries by Sex in Maple Grove
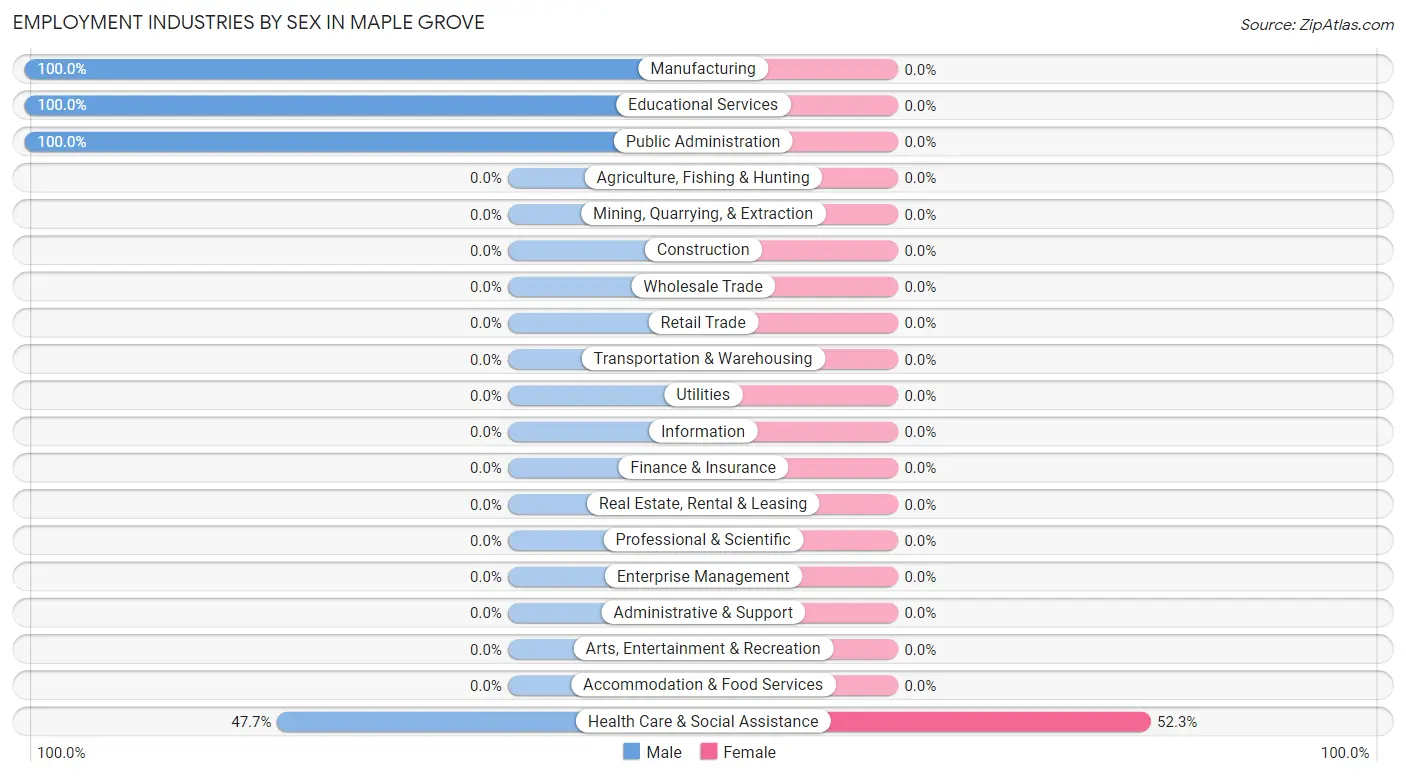
| Industry | Male | Female |
| Agriculture, Fishing & Hunting | 0 (0.0%) | 0 (0.0%) |
| Mining, Quarrying, & Extraction | 0 (0.0%) | 0 (0.0%) |
| Construction | 0 (0.0%) | 0 (0.0%) |
| Manufacturing | 14 (100.0%) | 0 (0.0%) |
| Wholesale Trade | 0 (0.0%) | 0 (0.0%) |
| Retail Trade | 0 (0.0%) | 0 (0.0%) |
| Transportation & Warehousing | 0 (0.0%) | 0 (0.0%) |
| Utilities | 0 (0.0%) | 0 (0.0%) |
| Information | 0 (0.0%) | 0 (0.0%) |
| Finance & Insurance | 0 (0.0%) | 0 (0.0%) |
| Real Estate, Rental & Leasing | 0 (0.0%) | 0 (0.0%) |
| Professional & Scientific | 0 (0.0%) | 0 (0.0%) |
| Enterprise Management | 0 (0.0%) | 0 (0.0%) |
| Administrative & Support | 0 (0.0%) | 0 (0.0%) |
| Educational Services | 16 (100.0%) | 0 (0.0%) |
| Health Care & Social Assistance | 31 (47.7%) | 34 (52.3%) |
| Arts, Entertainment & Recreation | 0 (0.0%) | 0 (0.0%) |
| Accommodation & Food Services | 0 (0.0%) | 0 (0.0%) |
| Public Administration | 20 (100.0%) | 0 (0.0%) |
| Total | 81 (59.1%) | 56 (40.9%) |
Education in Maple Grove
School Enrollment in Maple Grove
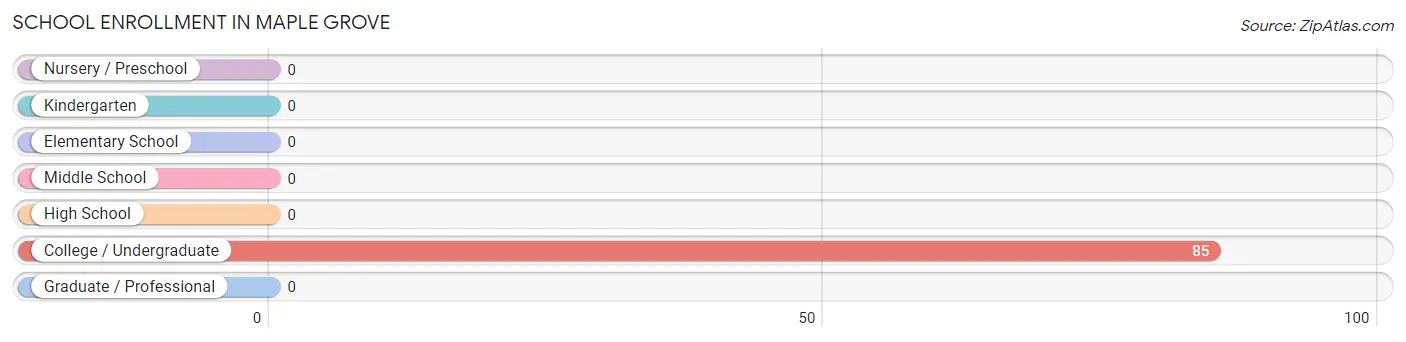
| School Level | # Students | % Students |
| Nursery / Preschool | 0 | 0.0% |
| Kindergarten | 0 | 0.0% |
| Elementary School | 0 | 0.0% |
| Middle School | 0 | 0.0% |
| High School | 0 | 0.0% |
| College / Undergraduate | 85 | 100.0% |
| Graduate / Professional | 0 | 0.0% |
| Total | 85 | 100.0% |
School Enrollment by Age by Funding Source in Maple Grove
Out of a total of 85 students who are enrolled in schools in Maple Grove, 20 (23.5%) attend a private institution, while the remaining 65 (76.5%) are enrolled in public schools. The age group of 35 years and over has the highest likelihood of being enrolled in private schools, with 20 (100.0% in the age bracket) enrolled. Conversely, the age group of 20 to 24 year olds has the lowest likelihood of being enrolled in a private school, with 65 (100.0% in the age bracket) attending a public institution.
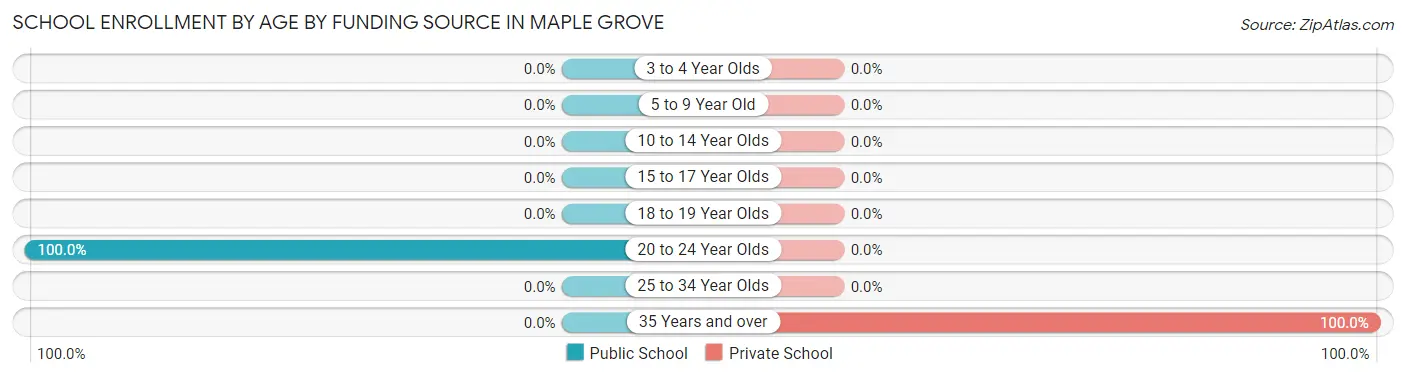
| Age Bracket | Public School | Private School |
| 3 to 4 Year Olds | 0 (0.0%) | 0 (0.0%) |
| 5 to 9 Year Old | 0 (0.0%) | 0 (0.0%) |
| 10 to 14 Year Olds | 0 (0.0%) | 0 (0.0%) |
| 15 to 17 Year Olds | 0 (0.0%) | 0 (0.0%) |
| 18 to 19 Year Olds | 0 (0.0%) | 0 (0.0%) |
| 20 to 24 Year Olds | 65 (100.0%) | 0 (0.0%) |
| 25 to 34 Year Olds | 0 (0.0%) | 0 (0.0%) |
| 35 Years and over | 0 (0.0%) | 20 (100.0%) |
| Total | 65 (76.5%) | 20 (23.5%) |
Educational Attainment by Field of Study in Maple Grove
Education (35 | 30.2%), bio, nature & agricultural (31 | 26.7%), arts & humanities (20 | 17.2%), physical & health sciences (16 | 13.8%), and business (14 | 12.1%) are the most common fields of study among 116 individuals in Maple Grove who have obtained a bachelor's degree or higher.
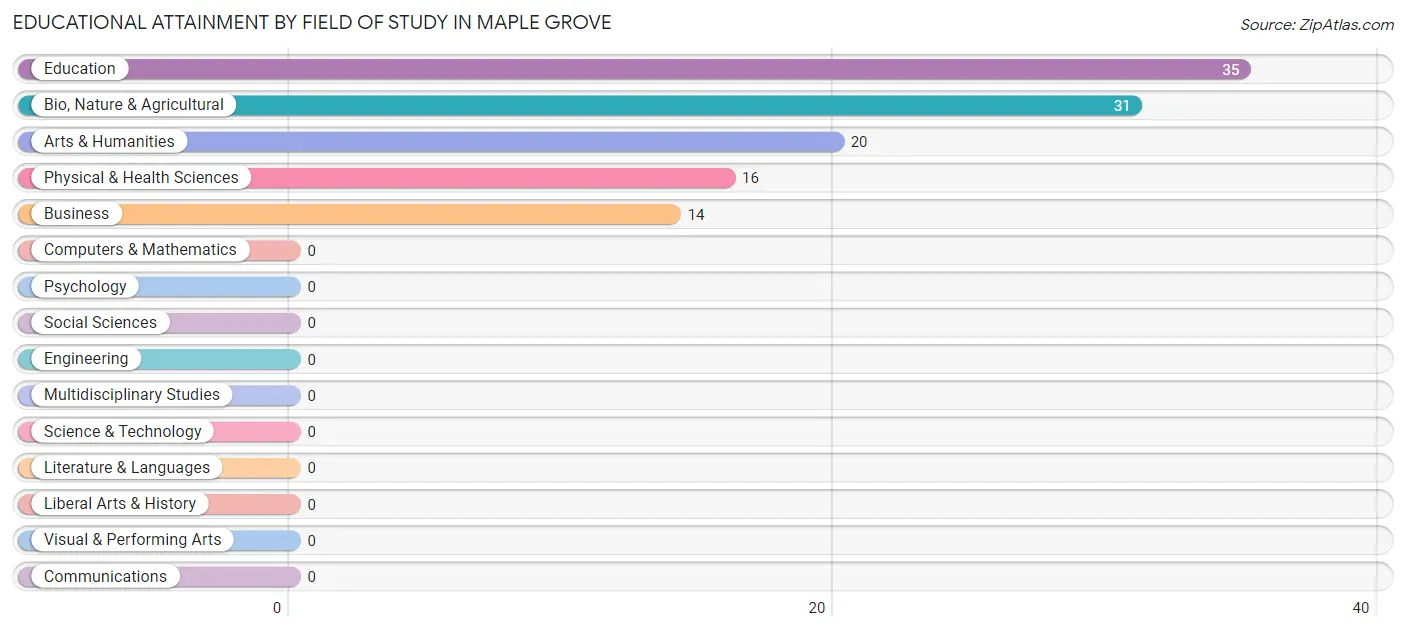
| Field of Study | # Graduates | % Graduates |
| Computers & Mathematics | 0 | 0.0% |
| Bio, Nature & Agricultural | 31 | 26.7% |
| Physical & Health Sciences | 16 | 13.8% |
| Psychology | 0 | 0.0% |
| Social Sciences | 0 | 0.0% |
| Engineering | 0 | 0.0% |
| Multidisciplinary Studies | 0 | 0.0% |
| Science & Technology | 0 | 0.0% |
| Business | 14 | 12.1% |
| Education | 35 | 30.2% |
| Literature & Languages | 0 | 0.0% |
| Liberal Arts & History | 0 | 0.0% |
| Visual & Performing Arts | 0 | 0.0% |
| Communications | 0 | 0.0% |
| Arts & Humanities | 20 | 17.2% |
| Total | 116 | 100.0% |
Transportation & Commute in Maple Grove
Vehicle Availability by Sex in Maple Grove
The most prevalent vehicle ownership categories in Maple Grove are males with 4 vehicles (65, accounting for 80.2%) and females with 4 vehicles (56, making up 116.1%).
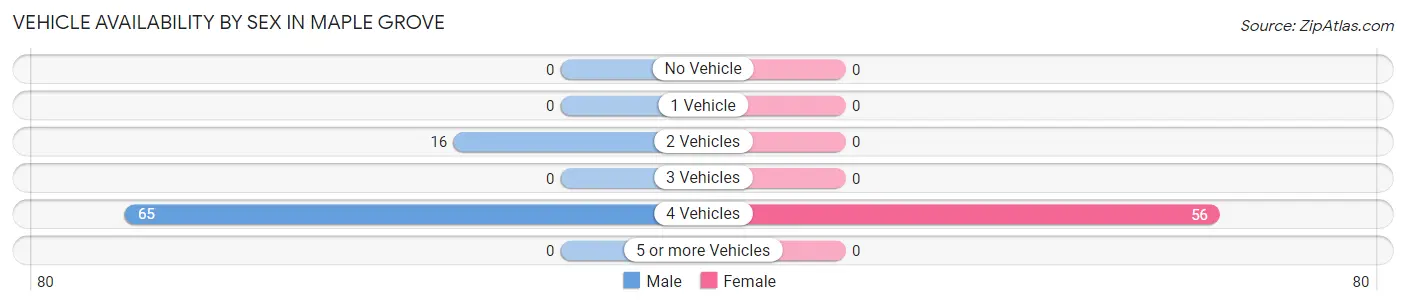
| Vehicles Available | Male | Female |
| No Vehicle | 0 (0.0%) | 0 (0.0%) |
| 1 Vehicle | 0 (0.0%) | 0 (0.0%) |
| 2 Vehicles | 16 (19.8%) | 0 (0.0%) |
| 3 Vehicles | 0 (0.0%) | 0 (0.0%) |
| 4 Vehicles | 65 (80.2%) | 56 (100.0%) |
| 5 or more Vehicles | 0 (0.0%) | 0 (0.0%) |
| Total | 81 (100.0%) | 56 (100.0%) |
Commute Time in Maple Grove
The most frequently occuring commute durations in Maple Grove are 35 to 39 minutes (53 commuters, 38.7%), 30 to 34 minutes (34 commuters, 24.8%), and 20 to 24 minutes (30 commuters, 21.9%).
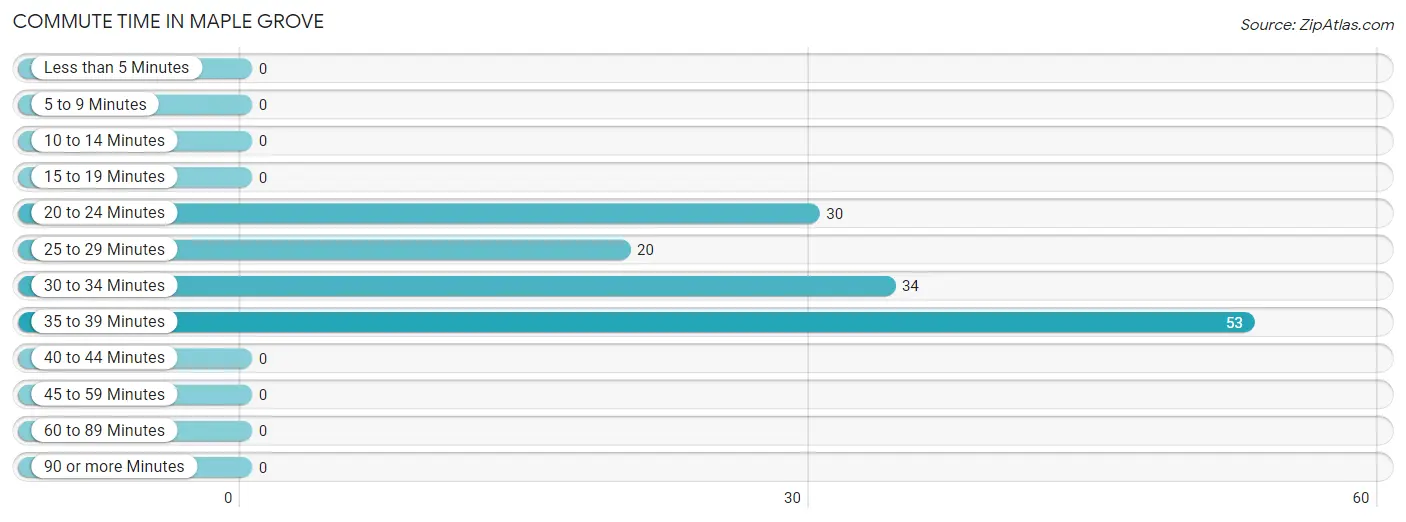
| Commute Time | # Commuters | % Commuters |
| Less than 5 Minutes | 0 | 0.0% |
| 5 to 9 Minutes | 0 | 0.0% |
| 10 to 14 Minutes | 0 | 0.0% |
| 15 to 19 Minutes | 0 | 0.0% |
| 20 to 24 Minutes | 30 | 21.9% |
| 25 to 29 Minutes | 20 | 14.6% |
| 30 to 34 Minutes | 34 | 24.8% |
| 35 to 39 Minutes | 53 | 38.7% |
| 40 to 44 Minutes | 0 | 0.0% |
| 45 to 59 Minutes | 0 | 0.0% |
| 60 to 89 Minutes | 0 | 0.0% |
| 90 or more Minutes | 0 | 0.0% |
Commute Time by Sex in Maple Grove
The most common commute times in Maple Grove are 35 to 39 minutes (31 commuters, 38.3%) for males and 30 to 34 minutes (34 commuters, 60.7%) for females.
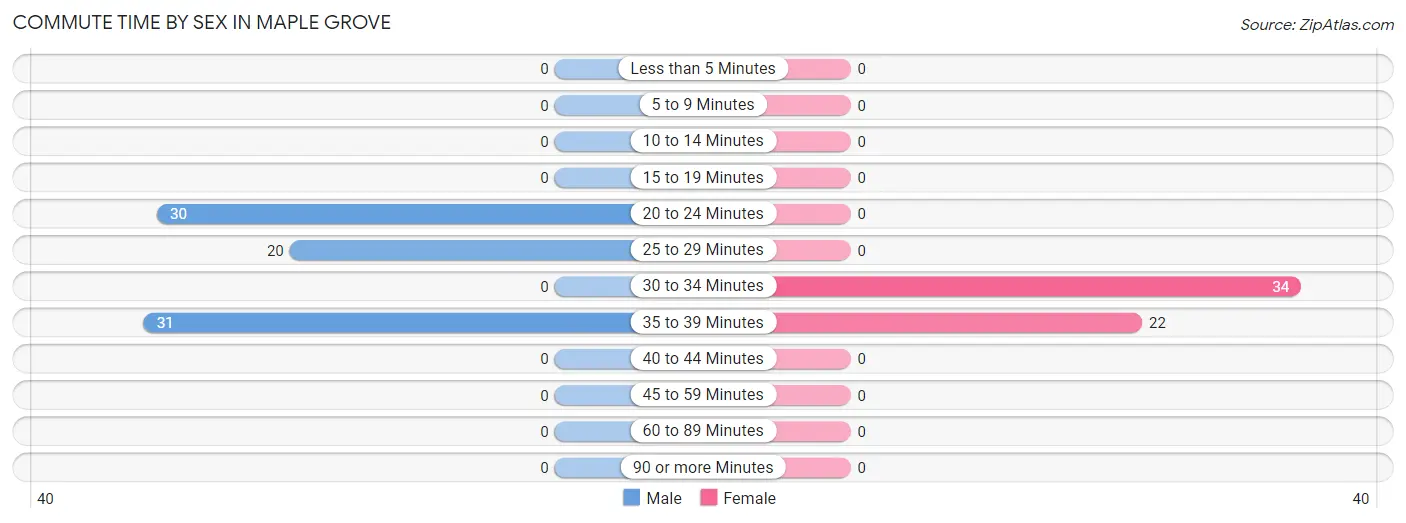
| Commute Time | Male | Female |
| Less than 5 Minutes | 0 (0.0%) | 0 (0.0%) |
| 5 to 9 Minutes | 0 (0.0%) | 0 (0.0%) |
| 10 to 14 Minutes | 0 (0.0%) | 0 (0.0%) |
| 15 to 19 Minutes | 0 (0.0%) | 0 (0.0%) |
| 20 to 24 Minutes | 30 (37.0%) | 0 (0.0%) |
| 25 to 29 Minutes | 20 (24.7%) | 0 (0.0%) |
| 30 to 34 Minutes | 0 (0.0%) | 34 (60.7%) |
| 35 to 39 Minutes | 31 (38.3%) | 22 (39.3%) |
| 40 to 44 Minutes | 0 (0.0%) | 0 (0.0%) |
| 45 to 59 Minutes | 0 (0.0%) | 0 (0.0%) |
| 60 to 89 Minutes | 0 (0.0%) | 0 (0.0%) |
| 90 or more Minutes | 0 (0.0%) | 0 (0.0%) |
Time of Departure to Work by Sex in Maple Grove
The most frequent times of departure to work in Maple Grove are 4:00 PM to 11:59 PM (31, 38.3%) for males and 6:00 AM to 6:29 AM (34, 60.7%) for females.
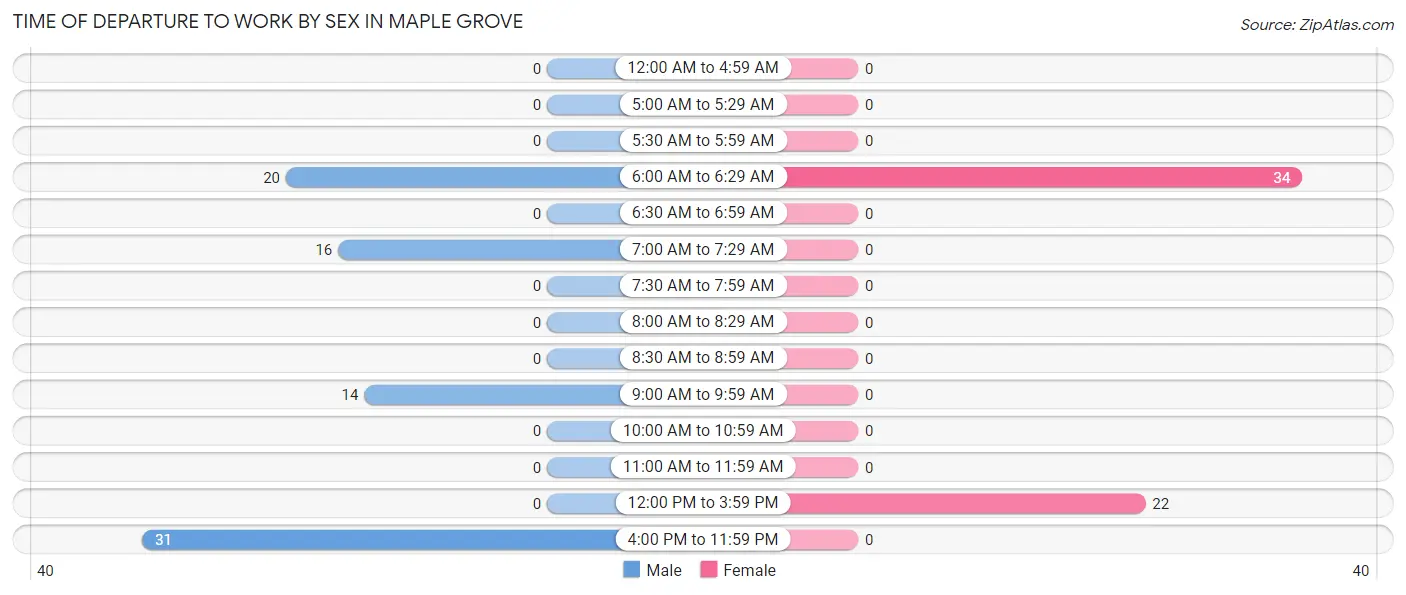
| Time of Departure | Male | Female |
| 12:00 AM to 4:59 AM | 0 (0.0%) | 0 (0.0%) |
| 5:00 AM to 5:29 AM | 0 (0.0%) | 0 (0.0%) |
| 5:30 AM to 5:59 AM | 0 (0.0%) | 0 (0.0%) |
| 6:00 AM to 6:29 AM | 20 (24.7%) | 34 (60.7%) |
| 6:30 AM to 6:59 AM | 0 (0.0%) | 0 (0.0%) |
| 7:00 AM to 7:29 AM | 16 (19.8%) | 0 (0.0%) |
| 7:30 AM to 7:59 AM | 0 (0.0%) | 0 (0.0%) |
| 8:00 AM to 8:29 AM | 0 (0.0%) | 0 (0.0%) |
| 8:30 AM to 8:59 AM | 0 (0.0%) | 0 (0.0%) |
| 9:00 AM to 9:59 AM | 14 (17.3%) | 0 (0.0%) |
| 10:00 AM to 10:59 AM | 0 (0.0%) | 0 (0.0%) |
| 11:00 AM to 11:59 AM | 0 (0.0%) | 0 (0.0%) |
| 12:00 PM to 3:59 PM | 0 (0.0%) | 22 (39.3%) |
| 4:00 PM to 11:59 PM | 31 (38.3%) | 0 (0.0%) |
| Total | 81 (100.0%) | 56 (100.0%) |
Housing Occupancy in Maple Grove
Occupancy by Ownership in Maple Grove
Of the total 50 dwellings in Maple Grove, owner-occupied units account for 50 (100.0%), while renter-occupied units make up 0 (0.0%).
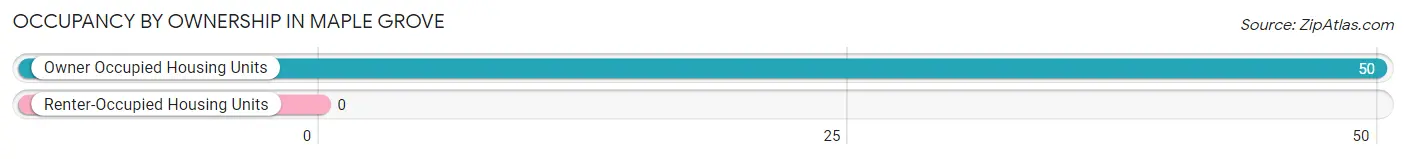
| Occupancy | # Housing Units | % Housing Units |
| Owner Occupied Housing Units | 50 | 100.0% |
| Renter-Occupied Housing Units | 0 | 0.0% |
| Total Occupied Housing Units | 50 | 100.0% |
Occupancy by Household Size in Maple Grove
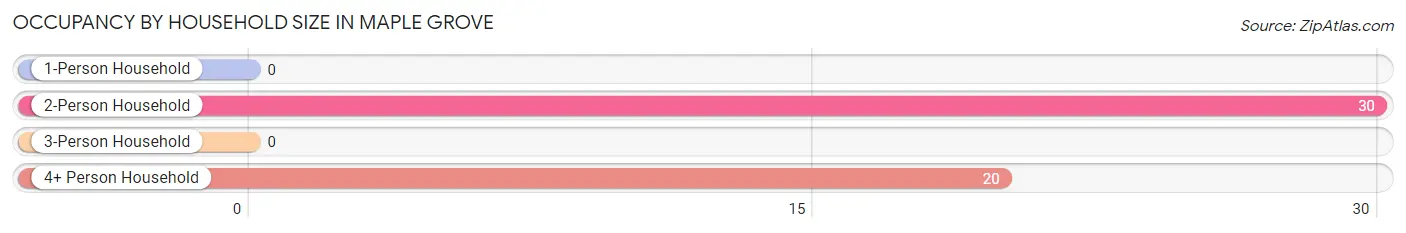
| Household Size | # Housing Units | % Housing Units |
| 1-Person Household | 0 | 0.0% |
| 2-Person Household | 30 | 60.0% |
| 3-Person Household | 0 | 0.0% |
| 4+ Person Household | 20 | 40.0% |
| Total Housing Units | 50 | 100.0% |
Occupancy by Ownership by Household Size in Maple Grove
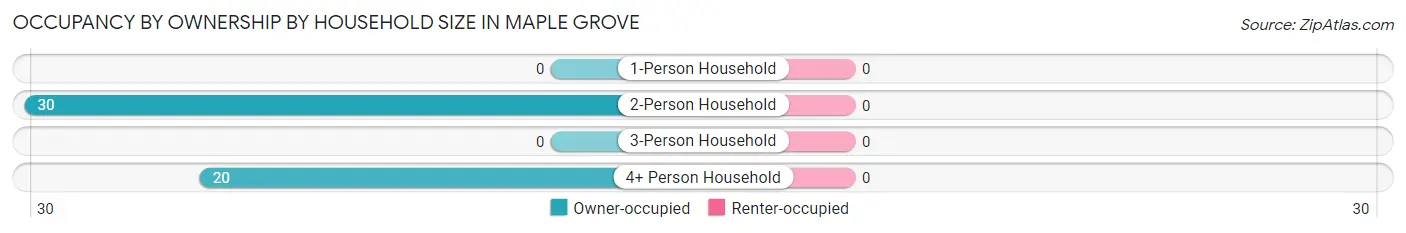
| Household Size | Owner-occupied | Renter-occupied |
| 1-Person Household | 0 (0.0%) | 0 (0.0%) |
| 2-Person Household | 30 (100.0%) | 0 (0.0%) |
| 3-Person Household | 0 (0.0%) | 0 (0.0%) |
| 4+ Person Household | 20 (100.0%) | 0 (0.0%) |
| Total Housing Units | 50 (100.0%) | 0 (0.0%) |
Occupancy by Educational Attainment in Maple Grove
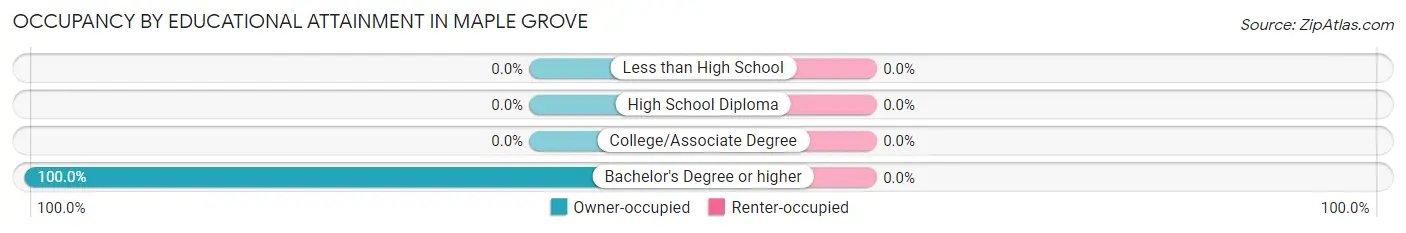
| Household Size | Owner-occupied | Renter-occupied |
| Less than High School | 0 (0.0%) | 0 (0.0%) |
| High School Diploma | 0 (0.0%) | 0 (0.0%) |
| College/Associate Degree | 0 (0.0%) | 0 (0.0%) |
| Bachelor's Degree or higher | 50 (100.0%) | 0 (0.0%) |
Occupancy by Age of Householder in Maple Grove
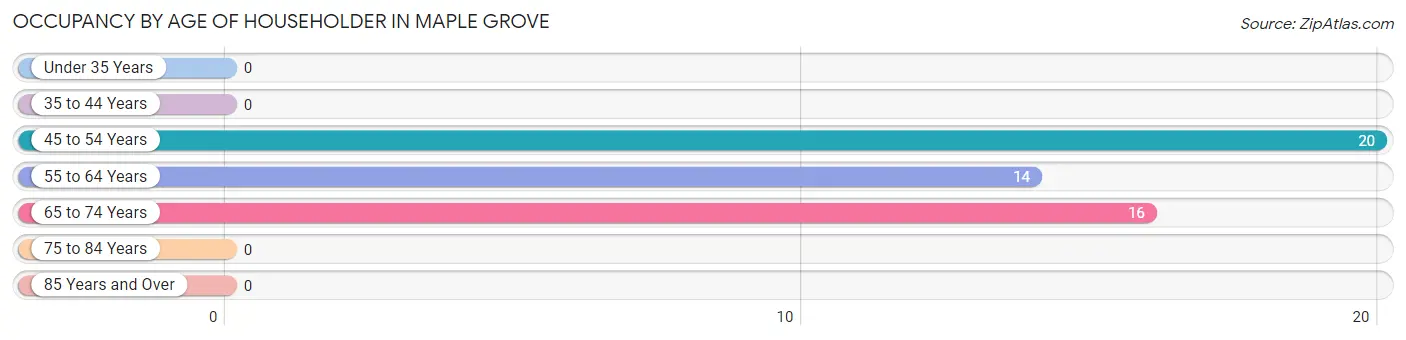
| Age Bracket | # Households | % Households |
| Under 35 Years | 0 | 0.0% |
| 35 to 44 Years | 0 | 0.0% |
| 45 to 54 Years | 20 | 40.0% |
| 55 to 64 Years | 14 | 28.0% |
| 65 to 74 Years | 16 | 32.0% |
| 75 to 84 Years | 0 | 0.0% |
| 85 Years and Over | 0 | 0.0% |
| Total | 50 | 100.0% |
Housing Finances in Maple Grove
Median Income by Occupancy in Maple Grove
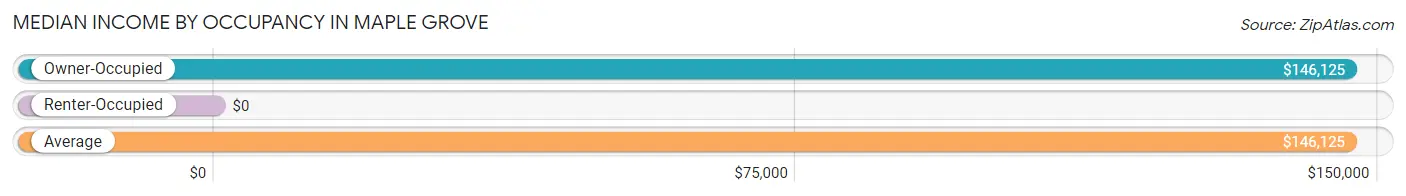
| Occupancy Type | # Households | Median Income |
| Owner-Occupied | 50 (100.0%) | $146,125 |
| Renter-Occupied | 0 (0.0%) | $0 |
| Average | 50 (100.0%) | $146,125 |
Occupancy by Householder Income Bracket in Maple Grove
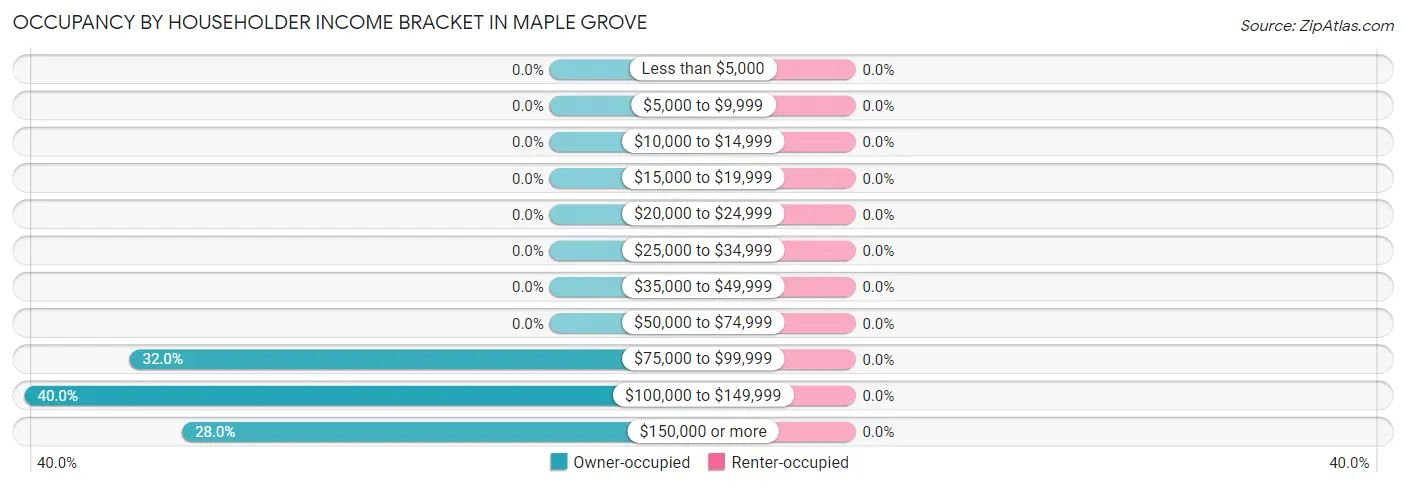
| Income Bracket | Owner-occupied | Renter-occupied |
| Less than $5,000 | 0 (0.0%) | 0 (0.0%) |
| $5,000 to $9,999 | 0 (0.0%) | 0 (0.0%) |
| $10,000 to $14,999 | 0 (0.0%) | 0 (0.0%) |
| $15,000 to $19,999 | 0 (0.0%) | 0 (0.0%) |
| $20,000 to $24,999 | 0 (0.0%) | 0 (0.0%) |
| $25,000 to $34,999 | 0 (0.0%) | 0 (0.0%) |
| $35,000 to $49,999 | 0 (0.0%) | 0 (0.0%) |
| $50,000 to $74,999 | 0 (0.0%) | 0 (0.0%) |
| $75,000 to $99,999 | 16 (32.0%) | 0 (0.0%) |
| $100,000 to $149,999 | 20 (40.0%) | 0 (0.0%) |
| $150,000 or more | 14 (28.0%) | 0 (0.0%) |
| Total | 50 (100.0%) | 0 (0.0%) |
Monthly Housing Cost Tiers in Maple Grove
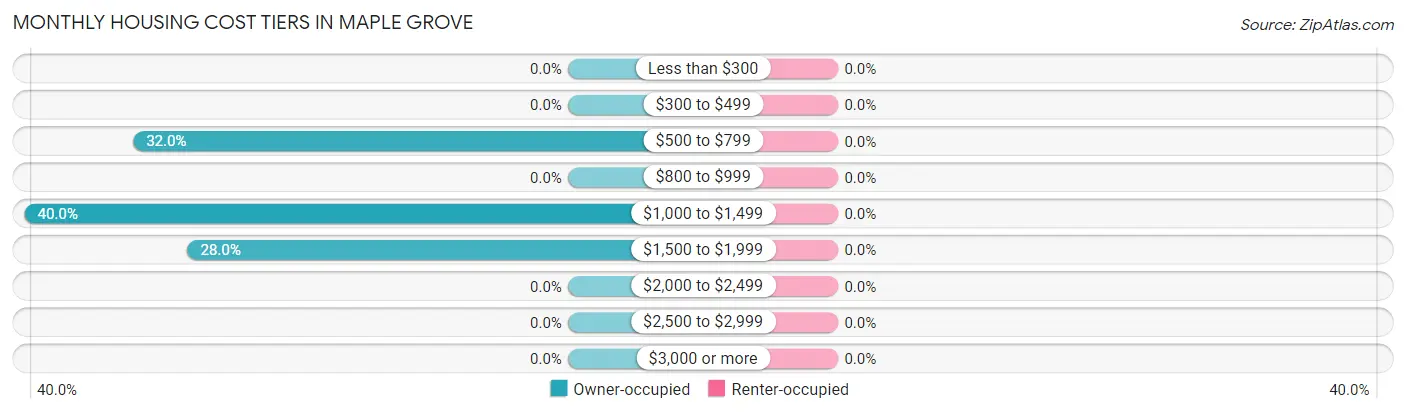
| Monthly Cost | Owner-occupied | Renter-occupied |
| Less than $300 | 0 (0.0%) | 0 (0.0%) |
| $300 to $499 | 0 (0.0%) | 0 (0.0%) |
| $500 to $799 | 16 (32.0%) | 0 (0.0%) |
| $800 to $999 | 0 (0.0%) | 0 (0.0%) |
| $1,000 to $1,499 | 20 (40.0%) | 0 (0.0%) |
| $1,500 to $1,999 | 14 (28.0%) | 0 (0.0%) |
| $2,000 to $2,499 | 0 (0.0%) | 0 (0.0%) |
| $2,500 to $2,999 | 0 (0.0%) | 0 (0.0%) |
| $3,000 or more | 0 (0.0%) | 0 (0.0%) |
| Total | 50 (100.0%) | 0 (0.0%) |
Physical Housing Characteristics in Maple Grove
Housing Structures in Maple Grove
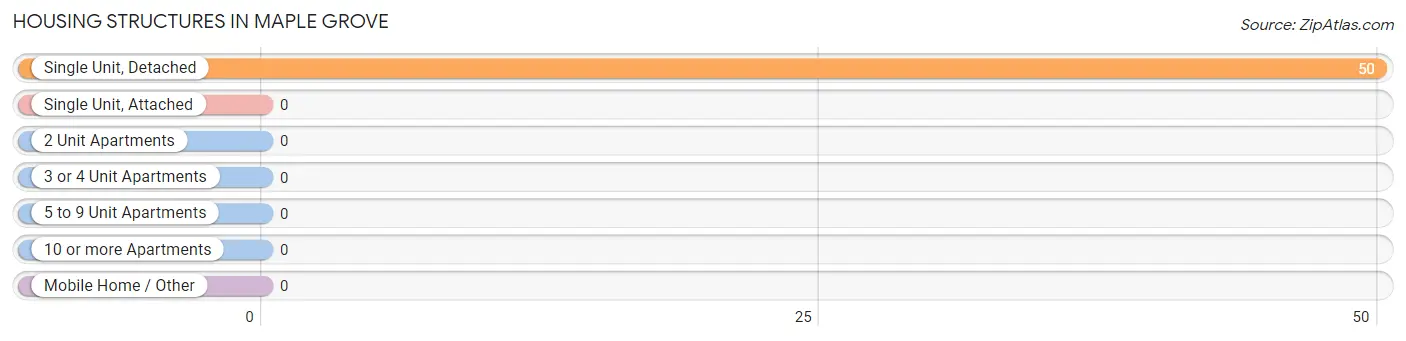
| Structure Type | # Housing Units | % Housing Units |
| Single Unit, Detached | 50 | 100.0% |
| Single Unit, Attached | 0 | 0.0% |
| 2 Unit Apartments | 0 | 0.0% |
| 3 or 4 Unit Apartments | 0 | 0.0% |
| 5 to 9 Unit Apartments | 0 | 0.0% |
| 10 or more Apartments | 0 | 0.0% |
| Mobile Home / Other | 0 | 0.0% |
| Total | 50 | 100.0% |
Housing Structures by Occupancy in Maple Grove
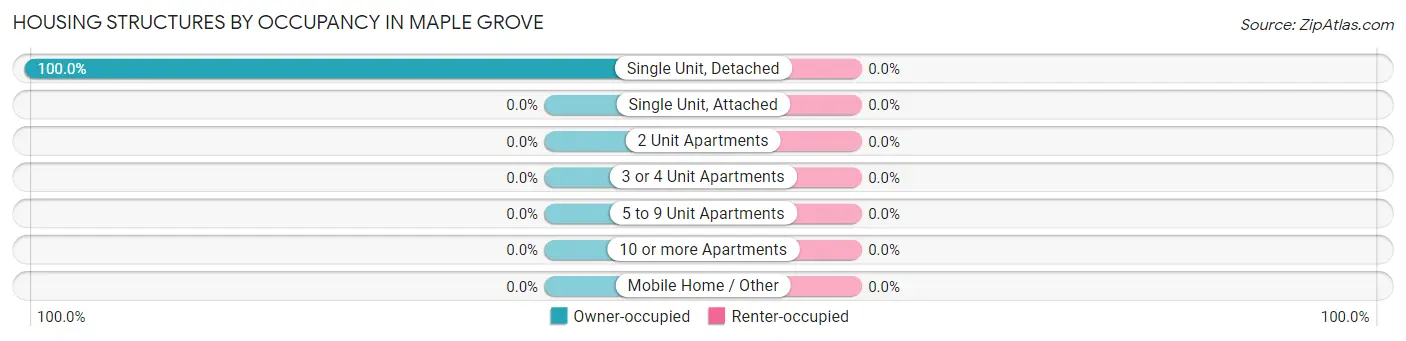
| Structure Type | Owner-occupied | Renter-occupied |
| Single Unit, Detached | 50 (100.0%) | 0 (0.0%) |
| Single Unit, Attached | 0 (0.0%) | 0 (0.0%) |
| 2 Unit Apartments | 0 (0.0%) | 0 (0.0%) |
| 3 or 4 Unit Apartments | 0 (0.0%) | 0 (0.0%) |
| 5 to 9 Unit Apartments | 0 (0.0%) | 0 (0.0%) |
| 10 or more Apartments | 0 (0.0%) | 0 (0.0%) |
| Mobile Home / Other | 0 (0.0%) | 0 (0.0%) |
| Total | 50 (100.0%) | 0 (0.0%) |
Housing Structures by Number of Rooms in Maple Grove
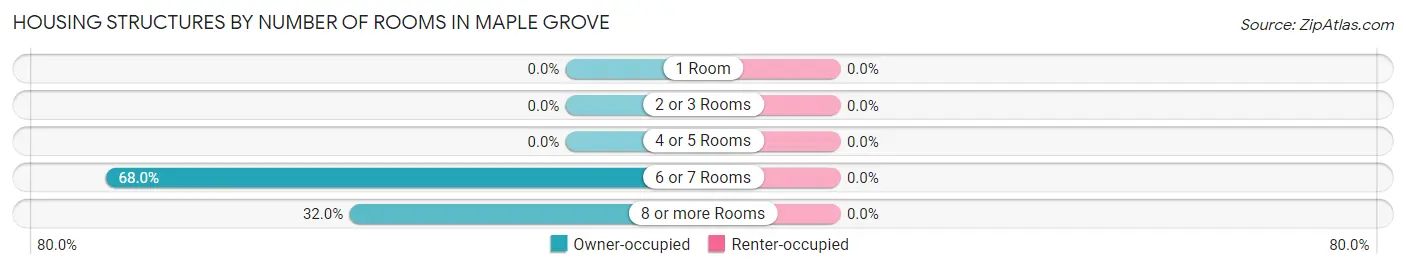
| Number of Rooms | Owner-occupied | Renter-occupied |
| 1 Room | 0 (0.0%) | 0 (0.0%) |
| 2 or 3 Rooms | 0 (0.0%) | 0 (0.0%) |
| 4 or 5 Rooms | 0 (0.0%) | 0 (0.0%) |
| 6 or 7 Rooms | 34 (68.0%) | 0 (0.0%) |
| 8 or more Rooms | 16 (32.0%) | 0 (0.0%) |
| Total | 50 (100.0%) | 0 (0.0%) |
Housing Structure by Heating Type in Maple Grove
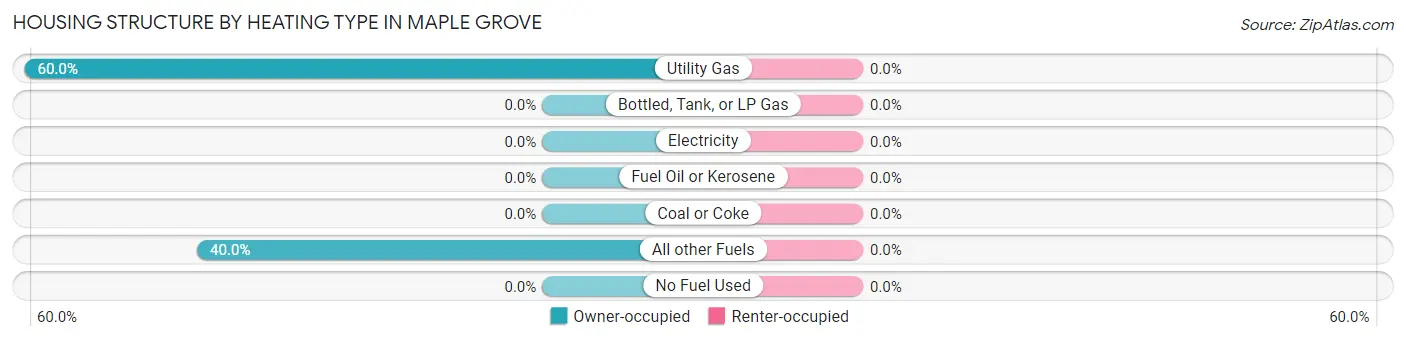
| Heating Type | Owner-occupied | Renter-occupied |
| Utility Gas | 30 (60.0%) | 0 (0.0%) |
| Bottled, Tank, or LP Gas | 0 (0.0%) | 0 (0.0%) |
| Electricity | 0 (0.0%) | 0 (0.0%) |
| Fuel Oil or Kerosene | 0 (0.0%) | 0 (0.0%) |
| Coal or Coke | 0 (0.0%) | 0 (0.0%) |
| All other Fuels | 20 (40.0%) | 0 (0.0%) |
| No Fuel Used | 0 (0.0%) | 0 (0.0%) |
| Total | 50 (100.0%) | 0 (0.0%) |
Household Vehicle Usage in Maple Grove
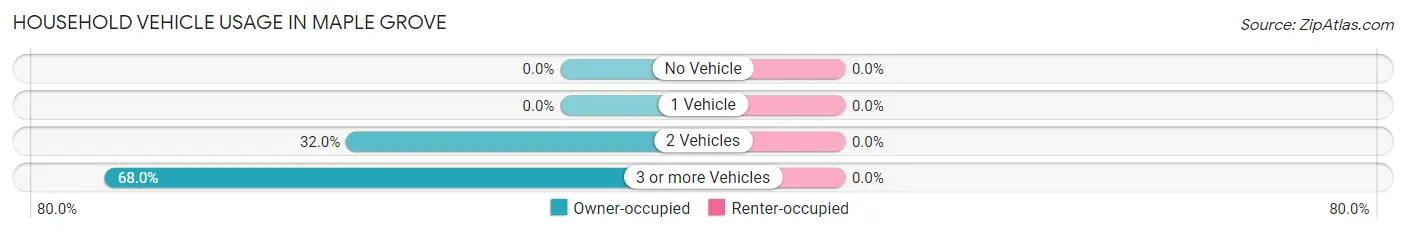
| Vehicles per Household | Owner-occupied | Renter-occupied |
| No Vehicle | 0 (0.0%) | 0 (0.0%) |
| 1 Vehicle | 0 (0.0%) | 0 (0.0%) |
| 2 Vehicles | 16 (32.0%) | 0 (0.0%) |
| 3 or more Vehicles | 34 (68.0%) | 0 (0.0%) |
| Total | 50 (100.0%) | 0 (0.0%) |
Real Estate & Mortgages in Maple Grove
Real Estate and Mortgage Overview in Maple Grove
| Characteristic | Without Mortgage | With Mortgage |
| Housing Units | 16 | 34 |
| Median Property Value | - | - |
| Median Household Income | - | - |
| Monthly Housing Costs | - | - |
| Real Estate Taxes | - | - |
Property Value by Mortgage Status in Maple Grove
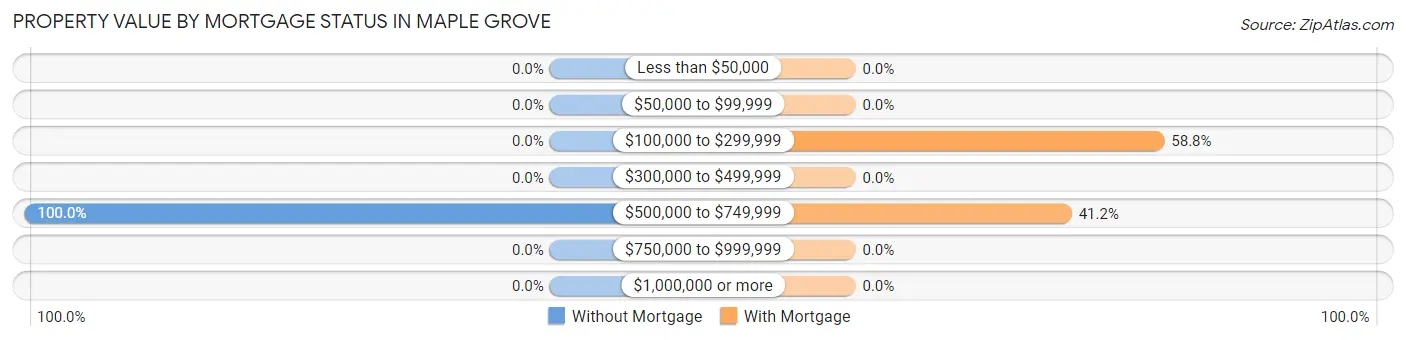
| Property Value | Without Mortgage | With Mortgage |
| Less than $50,000 | 0 (0.0%) | 0 (0.0%) |
| $50,000 to $99,999 | 0 (0.0%) | 0 (0.0%) |
| $100,000 to $299,999 | 0 (0.0%) | 20 (58.8%) |
| $300,000 to $499,999 | 0 (0.0%) | 0 (0.0%) |
| $500,000 to $749,999 | 16 (100.0%) | 14 (41.2%) |
| $750,000 to $999,999 | 0 (0.0%) | 0 (0.0%) |
| $1,000,000 or more | 0 (0.0%) | 0 (0.0%) |
| Total | 16 (100.0%) | 34 (100.0%) |
Household Income by Mortgage Status in Maple Grove
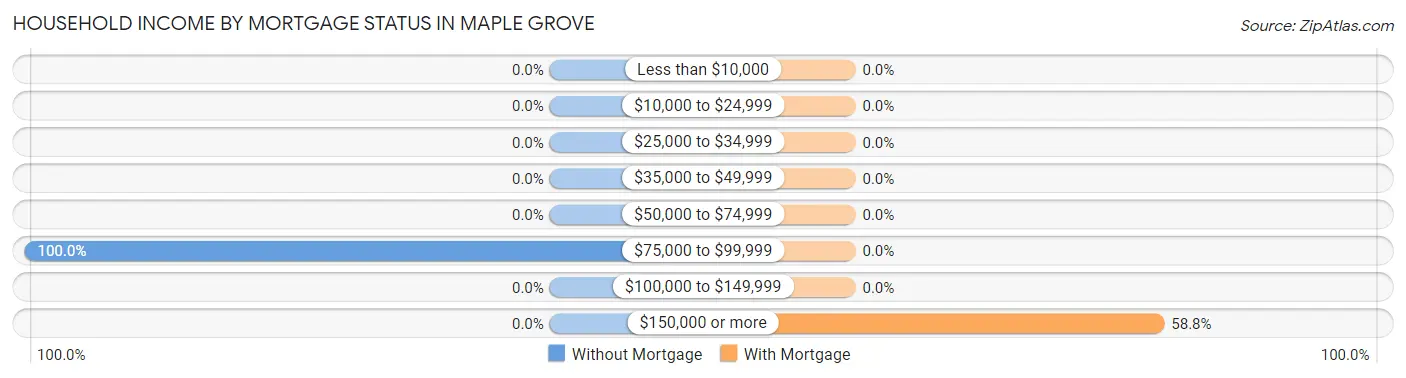
| Household Income | Without Mortgage | With Mortgage |
| Less than $10,000 | 0 (0.0%) | 0 (0.0%) |
| $10,000 to $24,999 | 0 (0.0%) | 0 (0.0%) |
| $25,000 to $34,999 | 0 (0.0%) | 0 (0.0%) |
| $35,000 to $49,999 | 0 (0.0%) | 0 (0.0%) |
| $50,000 to $74,999 | 0 (0.0%) | 0 (0.0%) |
| $75,000 to $99,999 | 16 (100.0%) | 0 (0.0%) |
| $100,000 to $149,999 | 0 (0.0%) | 0 (0.0%) |
| $150,000 or more | 0 (0.0%) | 20 (58.8%) |
| Total | 16 (100.0%) | 34 (100.0%) |
Property Value to Household Income Ratio in Maple Grove
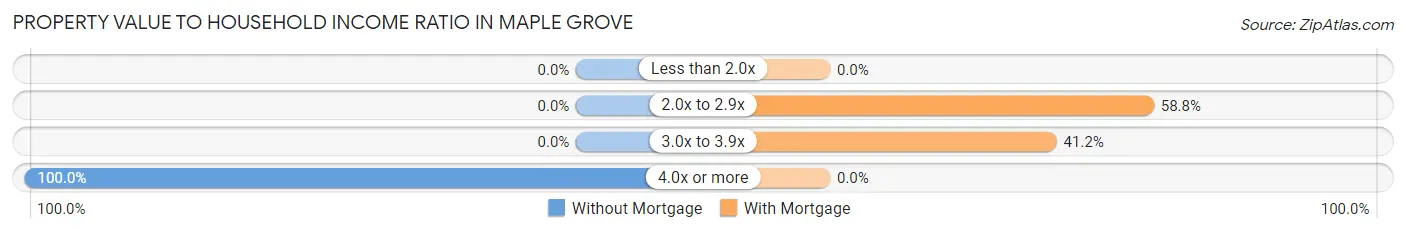
| Value-to-Income Ratio | Without Mortgage | With Mortgage |
| Less than 2.0x | 0 (0.0%) | 0 (0.0%) |
| 2.0x to 2.9x | 0 (0.0%) | 20 (58.8%) |
| 3.0x to 3.9x | 0 (0.0%) | 14 (41.2%) |
| 4.0x or more | 16 (100.0%) | 0 (0.0%) |
| Total | 16 (100.0%) | 34 (100.0%) |
Real Estate Taxes by Mortgage Status in Maple Grove
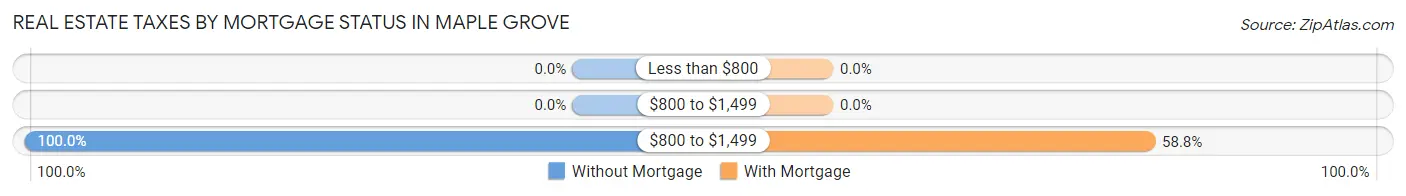
| Property Taxes | Without Mortgage | With Mortgage |
| Less than $800 | 0 (0.0%) | 0 (0.0%) |
| $800 to $1,499 | 0 (0.0%) | 0 (0.0%) |
| $800 to $1,499 | 16 (100.0%) | 20 (58.8%) |
| Total | 16 (100.0%) | 34 (100.0%) |
Health & Disability in Maple Grove
Health Insurance Coverage by Age in Maple Grove
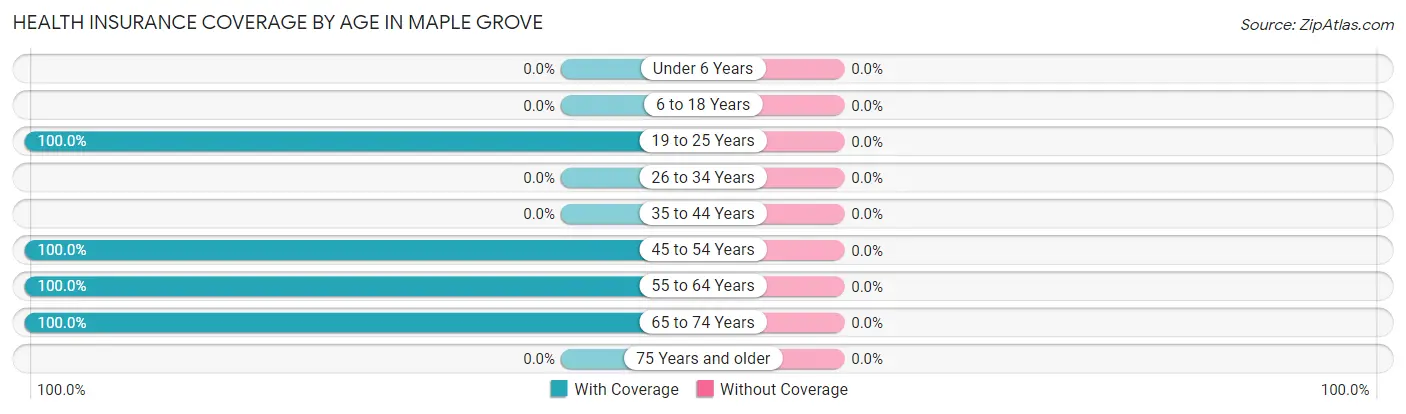
| Age Bracket | With Coverage | Without Coverage |
| Under 6 Years | 0 (0.0%) | 0 (0.0%) |
| 6 to 18 Years | 0 (0.0%) | 0 (0.0%) |
| 19 to 25 Years | 65 (100.0%) | 0 (0.0%) |
| 26 to 34 Years | 0 (0.0%) | 0 (0.0%) |
| 35 to 44 Years | 0 (0.0%) | 0 (0.0%) |
| 45 to 54 Years | 42 (100.0%) | 0 (0.0%) |
| 55 to 64 Years | 27 (100.0%) | 0 (0.0%) |
| 65 to 74 Years | 31 (100.0%) | 0 (0.0%) |
| 75 Years and older | 0 (0.0%) | 0 (0.0%) |
| Total | 165 (100.0%) | 0 (0.0%) |
Health Insurance Coverage by Citizenship Status in Maple Grove
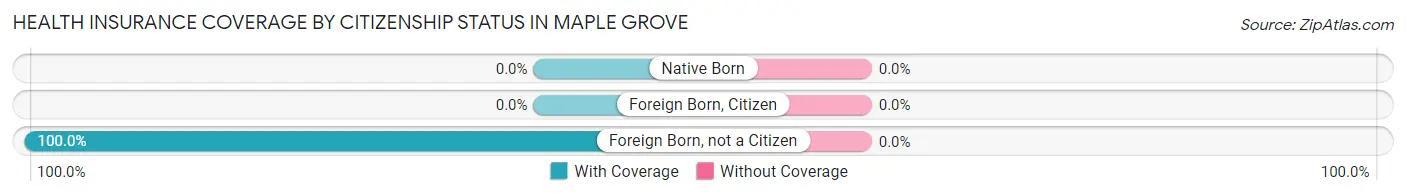
| Citizenship Status | With Coverage | Without Coverage |
| Native Born | 0 (0.0%) | 0 (0.0%) |
| Foreign Born, Citizen | 0 (0.0%) | 0 (0.0%) |
| Foreign Born, not a Citizen | 65 (100.0%) | 0 (0.0%) |
Health Insurance Coverage by Household Income in Maple Grove
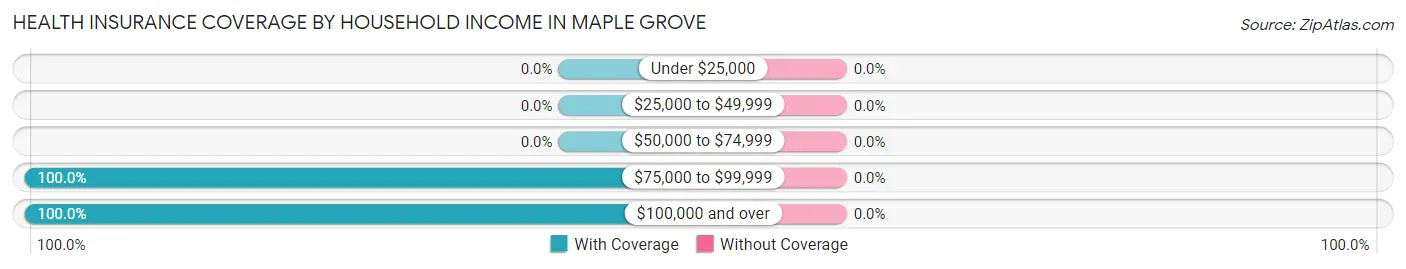
| Household Income | With Coverage | Without Coverage |
| Under $25,000 | 0 (0.0%) | 0 (0.0%) |
| $25,000 to $49,999 | 0 (0.0%) | 0 (0.0%) |
| $50,000 to $74,999 | 0 (0.0%) | 0 (0.0%) |
| $75,000 to $99,999 | 31 (100.0%) | 0 (0.0%) |
| $100,000 and over | 134 (100.0%) | 0 (0.0%) |
Public vs Private Health Insurance Coverage by Age in Maple Grove
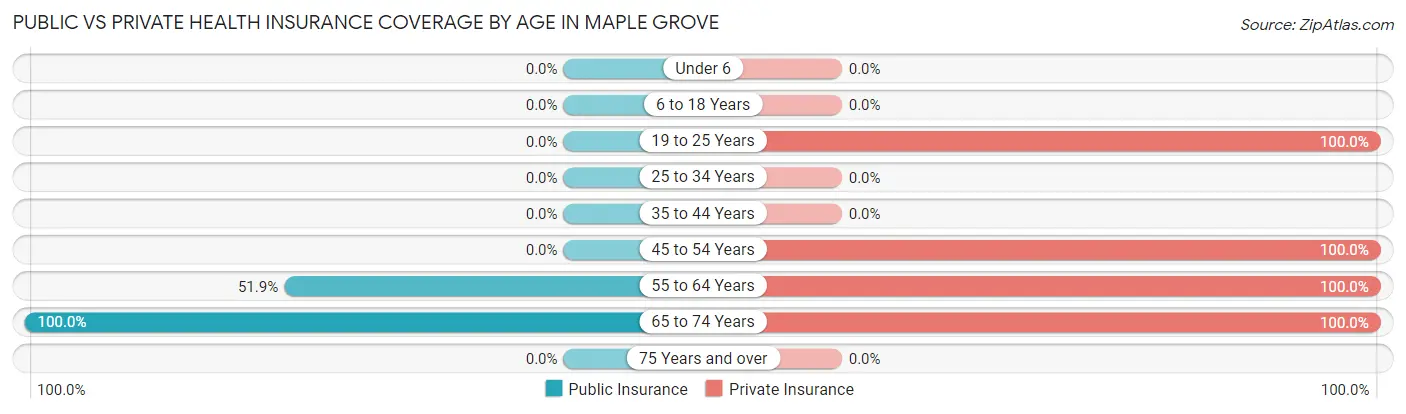
| Age Bracket | Public Insurance | Private Insurance |
| Under 6 | 0 (0.0%) | 0 (0.0%) |
| 6 to 18 Years | 0 (0.0%) | 0 (0.0%) |
| 19 to 25 Years | 0 (0.0%) | 65 (100.0%) |
| 25 to 34 Years | 0 (0.0%) | 0 (0.0%) |
| 35 to 44 Years | 0 (0.0%) | 0 (0.0%) |
| 45 to 54 Years | 0 (0.0%) | 42 (100.0%) |
| 55 to 64 Years | 14 (51.8%) | 27 (100.0%) |
| 65 to 74 Years | 31 (100.0%) | 31 (100.0%) |
| 75 Years and over | 0 (0.0%) | 0 (0.0%) |
| Total | 45 (27.3%) | 165 (100.0%) |
Disability Status by Sex by Age in Maple Grove
| Age Bracket | Male | Female |
| Under 5 Years | 0 (0.0%) | 0 (0.0%) |
| 5 to 17 Years | 0 (0.0%) | 0 (0.0%) |
| 18 to 34 Years | 0 (0.0%) | 0 (0.0%) |
| 35 to 64 Years | 0 (0.0%) | 0 (0.0%) |
| 65 to 74 Years | 0 (0.0%) | 0 (0.0%) |
| 75 Years and over | 0 (0.0%) | 0 (0.0%) |
Disability Class by Sex by Age in Maple Grove
Disability Class: Hearing Difficulty
| Age Bracket | Male | Female |
| Under 5 Years | 0 (0.0%) | 0 (0.0%) |
| 5 to 17 Years | 0 (0.0%) | 0 (0.0%) |
| 18 to 34 Years | 0 (0.0%) | 0 (0.0%) |
| 35 to 64 Years | 0 (0.0%) | 0 (0.0%) |
| 65 to 74 Years | 0 (0.0%) | 0 (0.0%) |
| 75 Years and over | 0 (0.0%) | 0 (0.0%) |
Disability Class: Vision Difficulty
| Age Bracket | Male | Female |
| Under 5 Years | 0 (0.0%) | 0 (0.0%) |
| 5 to 17 Years | 0 (0.0%) | 0 (0.0%) |
| 18 to 34 Years | 0 (0.0%) | 0 (0.0%) |
| 35 to 64 Years | 0 (0.0%) | 0 (0.0%) |
| 65 to 74 Years | 0 (0.0%) | 0 (0.0%) |
| 75 Years and over | 0 (0.0%) | 0 (0.0%) |
Disability Class: Cognitive Difficulty
| Age Bracket | Male | Female |
| 5 to 17 Years | 0 (0.0%) | 0 (0.0%) |
| 18 to 34 Years | 0 (0.0%) | 0 (0.0%) |
| 35 to 64 Years | 0 (0.0%) | 0 (0.0%) |
| 65 to 74 Years | 0 (0.0%) | 0 (0.0%) |
| 75 Years and over | 0 (0.0%) | 0 (0.0%) |
Disability Class: Ambulatory Difficulty
| Age Bracket | Male | Female |
| 5 to 17 Years | 0 (0.0%) | 0 (0.0%) |
| 18 to 34 Years | 0 (0.0%) | 0 (0.0%) |
| 35 to 64 Years | 0 (0.0%) | 0 (0.0%) |
| 65 to 74 Years | 0 (0.0%) | 0 (0.0%) |
| 75 Years and over | 0 (0.0%) | 0 (0.0%) |
Disability Class: Self-Care Difficulty
| Age Bracket | Male | Female |
| 5 to 17 Years | 0 (0.0%) | 0 (0.0%) |
| 18 to 34 Years | 0 (0.0%) | 0 (0.0%) |
| 35 to 64 Years | 0 (0.0%) | 0 (0.0%) |
| 65 to 74 Years | 0 (0.0%) | 0 (0.0%) |
| 75 Years and over | 0 (0.0%) | 0 (0.0%) |
Technology Access in Maple Grove
Computing Device Access in Maple Grove
| Device Type | # Households | % Households |
| Desktop or Laptop | 50 | 100.0% |
| Smartphone | 50 | 100.0% |
| Tablet | 34 | 68.0% |
| No Computing Device | 0 | 0.0% |
| Total | 50 | 100.0% |
Internet Access in Maple Grove
| Internet Type | # Households | % Households |
| Dial-Up Internet | 0 | 0.0% |
| Broadband Home | 34 | 68.0% |
| Cellular Data Only | 0 | 0.0% |
| Satellite Internet | 0 | 0.0% |
| No Internet | 16 | 32.0% |
| Total | 50 | 100.0% |
Maple Grove Summary
Maple Grove is a small village located in the state of Michigan, in the United States. It is situated in the northwest corner of the state, in the county of Grand Traverse. The village is located on the banks of the Maple River, which flows through the area. The village is home to a population of approximately 1,000 people, and is a popular tourist destination due to its proximity to the Sleeping Bear Dunes National Lakeshore.
History
The area that is now Maple Grove was first settled in the early 1800s by a group of French-Canadian fur traders. The village was originally known as “Maple Grove” due to the abundance of maple trees in the area. The village was officially incorporated in 1871, and the first post office was established in 1872.
In the late 1800s, the village became a popular destination for tourists, due to its proximity to the Sleeping Bear Dunes National Lakeshore. The village was also home to a number of resorts, which attracted visitors from all over the country.
In the early 1900s, the village began to experience a decline in population, as many of the resorts closed down. However, the village was able to remain a popular tourist destination due to its proximity to the lakeshore.
Geography
Maple Grove is located in the northwest corner of the state of Michigan, in the county of Grand Traverse. The village is situated on the banks of the Maple River, which flows through the area. The village is surrounded by rolling hills and forests, and is located approximately 25 miles from the city of Traverse City.
The village is located in a temperate climate, with warm summers and cold winters. The average temperature in the summer is around 70 degrees Fahrenheit, while the average temperature in the winter is around 20 degrees Fahrenheit.
Economy
The economy of Maple Grove is largely based on tourism. The village is home to a number of resorts, which attract visitors from all over the country. The village is also home to a number of small businesses, such as restaurants, shops, and galleries.
The village is also home to a number of agricultural operations, such as dairy farms and apple orchards. The village is also home to a number of wineries, which produce a variety of wines.
Demographics
As of the 2010 census, the population of Maple Grove was 1,000 people. The village is predominantly white, with approximately 95% of the population being of European descent. The village is also home to a small Hispanic population, as well as a small African American population.
The median household income in the village is approximately $45,000, and the median home value is approximately $150,000. The village has a low unemployment rate, and the majority of the population is employed in the tourism and agricultural industries.
Conclusion
Maple Grove is a small village located in the state of Michigan, in the United States. It is situated in the northwest corner of the state, in the county of Grand Traverse. The village is home to a population of approximately 1,000 people, and is a popular tourist destination due to its proximity to the Sleeping Bear Dunes National Lakeshore. The village has a long history, and its economy is largely based on tourism and agriculture. The village is predominantly white, with a small Hispanic and African American population. The median household income in the village is approximately $45,000, and the median home value is approximately $150,000.
Common Questions
What is Per Capita Income in Maple Grove?
Per Capita income in Maple Grove is $51,581.
What is the Median Family Income in Maple Grove?
Median Family Income in Maple Grove is $146,125.
What is the Median Household income in Maple Grove?
Median Household Income in Maple Grove is $146,125.
What is Inequality or Gini Index in Maple Grove?
Inequality or Gini Index in Maple Grove is 0.21.
What is the Total Population of Maple Grove?
Total Population of Maple Grove is 165.
What is the Total Male Population of Maple Grove?
Total Male Population of Maple Grove is 81.
What is the Total Female Population of Maple Grove?
Total Female Population of Maple Grove is 84.
What is the Ratio of Males per 100 Females in Maple Grove?
There are 96.43 Males per 100 Females in Maple Grove.
What is the Ratio of Females per 100 Males in Maple Grove?
There are 103.70 Females per 100 Males in Maple Grove.
What is the Median Population Age in Maple Grove?
Median Population Age in Maple Grove is 47.8 Years.
What is the Average Family Size in Maple Grove
Average Family Size in Maple Grove is 3.3 People.
What is the Average Household Size in Maple Grove
Average Household Size in Maple Grove is 3.3 People.
How Large is the Labor Force in Maple Grove?
There are 137 People in the Labor Forcein in Maple Grove.
What is the Percentage of People in the Labor Force in Maple Grove?
83.0% of People are in the Labor Force in Maple Grove.