Gwinn, MI Map & Demographics
Gwinn Map
Gwinn Overview
$27,115
PER CAPITA INCOME
$82,784
AVG FAMILY INCOME
$49,539
AVG HOUSEHOLD INCOME
37.7%
WAGE / INCOME GAP [ % ]
62.3¢/ $1
WAGE / INCOME GAP [ $ ]
0.33
INEQUALITY / GINI INDEX
1,370
TOTAL POPULATION
599
MALE POPULATION
771
FEMALE POPULATION
77.69
MALES / 100 FEMALES
128.71
FEMALES / 100 MALES
42.0
MEDIAN AGE
3.1
AVG FAMILY SIZE
2.3
AVG HOUSEHOLD SIZE
481
LABOR FORCE [ PEOPLE ]
45.5%
PERCENT IN LABOR FORCE
3.7%
UNEMPLOYMENT RATE
Gwinn Zip Codes
Gwinn Area Codes
Income in Gwinn
Income Overview in Gwinn
Per Capita Income in Gwinn is $27,115, while median incomes of families and households are $82,784 and $49,539 respectively.
| Characteristic | Number | Measure |
| Per Capita Income | 1,370 | $27,115 |
| Median Family Income | 349 | $82,784 |
| Mean Family Income | 349 | $81,212 |
| Median Household Income | 594 | $49,539 |
| Mean Household Income | 594 | $62,548 |
| Income Deficit | 349 | $0 |
| Wage / Income Gap (%) | 1,370 | 37.71% |
| Wage / Income Gap ($) | 1,370 | 62.29¢ per $1 |
| Gini / Inequality Index | 1,370 | 0.33 |
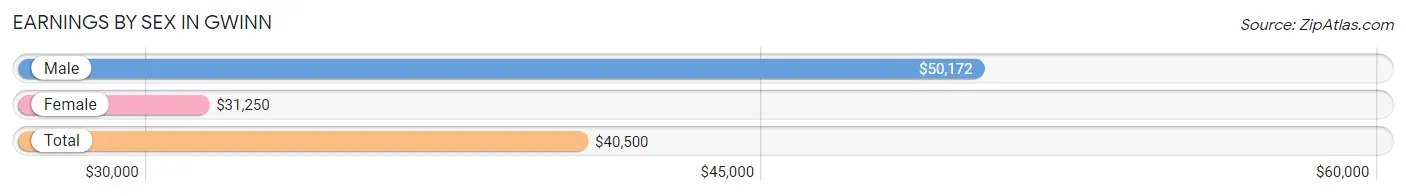
Earnings by Sex in Gwinn
Average Earnings in Gwinn are $40,500, $50,172 for men and $31,250 for women, a difference of 37.7%.
| Sex | Number | Average Earnings |
| Male | 296 (49.7%) | $50,172 |
| Female | 300 (50.3%) | $31,250 |
| Total | 596 (100.0%) | $40,500 |
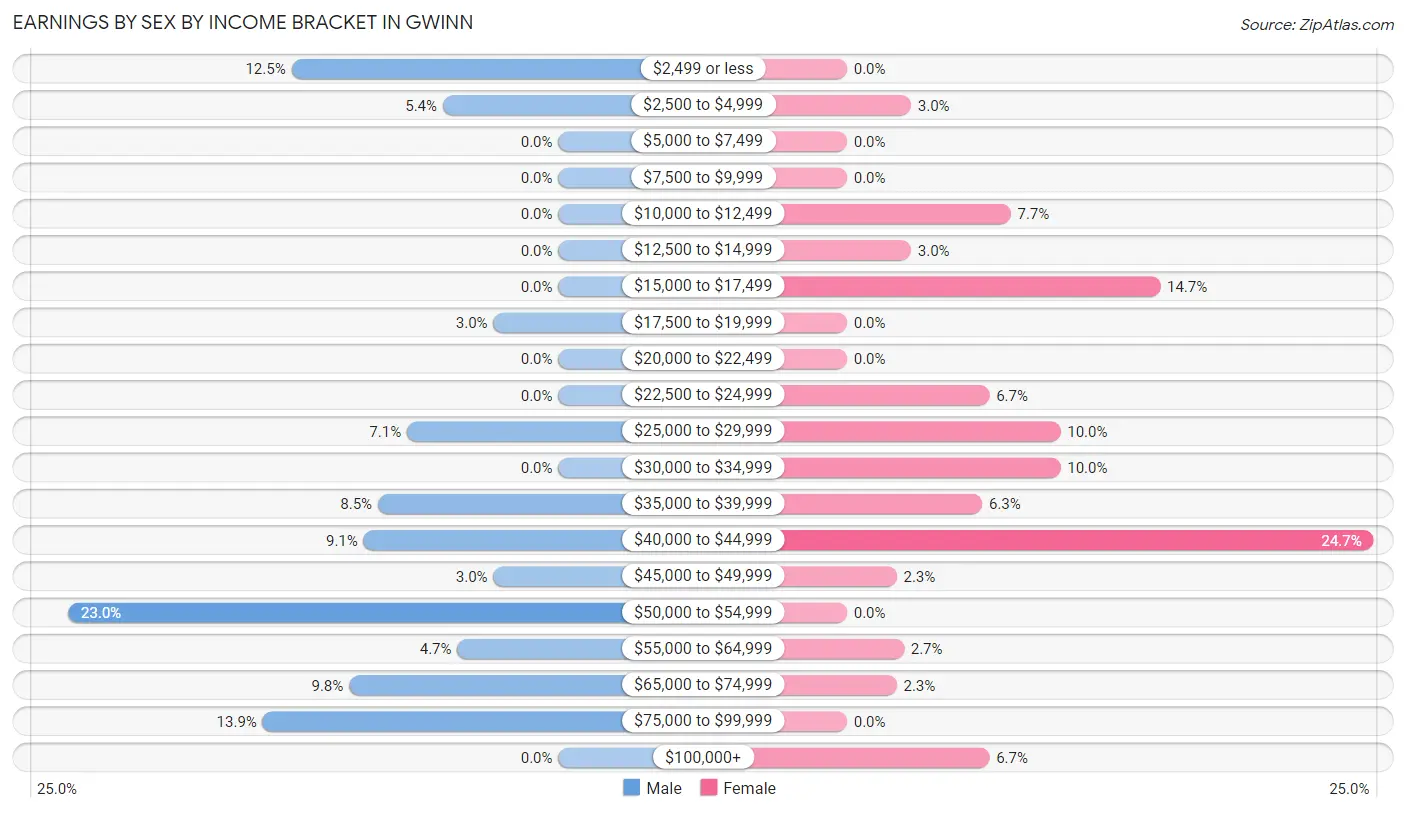
Earnings by Sex by Income Bracket in Gwinn
The most common earnings brackets in Gwinn are $50,000 to $54,999 for men (68 | 23.0%) and $40,000 to $44,999 for women (74 | 24.7%).
| Income | Male | Female |
| $2,499 or less | 37 (12.5%) | 0 (0.0%) |
| $2,500 to $4,999 | 16 (5.4%) | 9 (3.0%) |
| $5,000 to $7,499 | 0 (0.0%) | 0 (0.0%) |
| $7,500 to $9,999 | 0 (0.0%) | 0 (0.0%) |
| $10,000 to $12,499 | 0 (0.0%) | 23 (7.7%) |
| $12,500 to $14,999 | 0 (0.0%) | 9 (3.0%) |
| $15,000 to $17,499 | 0 (0.0%) | 44 (14.7%) |
| $17,500 to $19,999 | 9 (3.0%) | 0 (0.0%) |
| $20,000 to $22,499 | 0 (0.0%) | 0 (0.0%) |
| $22,500 to $24,999 | 0 (0.0%) | 20 (6.7%) |
| $25,000 to $29,999 | 21 (7.1%) | 30 (10.0%) |
| $30,000 to $34,999 | 0 (0.0%) | 30 (10.0%) |
| $35,000 to $39,999 | 25 (8.5%) | 19 (6.3%) |
| $40,000 to $44,999 | 27 (9.1%) | 74 (24.7%) |
| $45,000 to $49,999 | 9 (3.0%) | 7 (2.3%) |
| $50,000 to $54,999 | 68 (23.0%) | 0 (0.0%) |
| $55,000 to $64,999 | 14 (4.7%) | 8 (2.7%) |
| $65,000 to $74,999 | 29 (9.8%) | 7 (2.3%) |
| $75,000 to $99,999 | 41 (13.9%) | 0 (0.0%) |
| $100,000+ | 0 (0.0%) | 20 (6.7%) |
| Total | 296 (100.0%) | 300 (100.0%) |
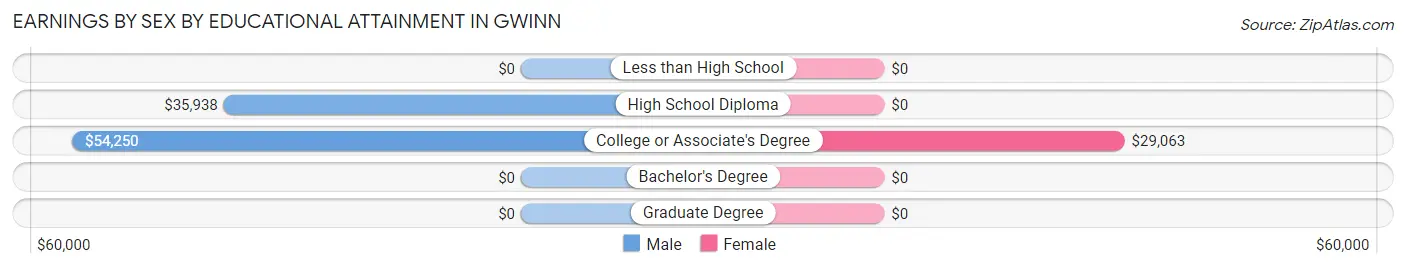
Earnings by Sex by Educational Attainment in Gwinn
Average earnings in Gwinn are $44,485 for men and $26,181 for women, a difference of 41.1%. Men with an educational attainment of college or associate's degree enjoy the highest average annual earnings of $54,250, while those with high school diploma education earn the least with $35,938. Women with an educational attainment of college or associate's degree earn the most with the average annual earnings of $29,063, while those with college or associate's degree education have the smallest earnings of $29,063.
| Educational Attainment | Male Income | Female Income |
| Less than High School | - | - |
| High School Diploma | $35,938 | $0 |
| College or Associate's Degree | $54,250 | $29,063 |
| Bachelor's Degree | - | - |
| Graduate Degree | - | - |
| Total | $44,485 | $26,181 |
Family Income in Gwinn
Family Income Brackets in Gwinn
According to the Gwinn family income data, there are 143 families falling into the $75,000 to $99,999 income range, which is the most common income bracket and makes up 41.0% of all families.
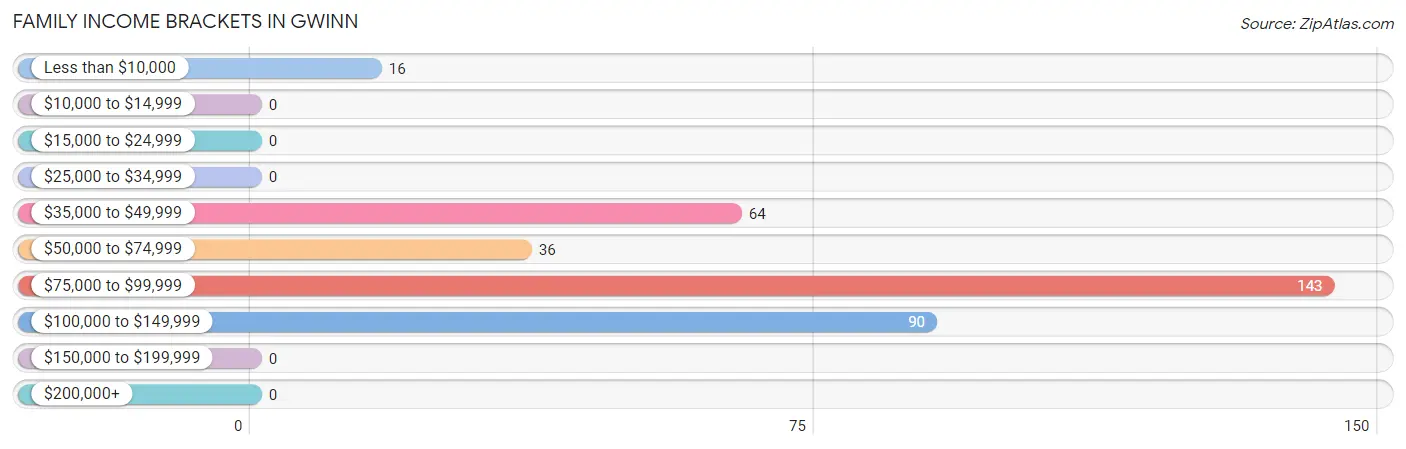
| Income Bracket | # Families | % Families |
| Less than $10,000 | 16 | 4.6% |
| $10,000 to $14,999 | 0 | 0.0% |
| $15,000 to $24,999 | 0 | 0.0% |
| $25,000 to $34,999 | 0 | 0.0% |
| $35,000 to $49,999 | 64 | 18.3% |
| $50,000 to $74,999 | 36 | 10.3% |
| $75,000 to $99,999 | 143 | 41.0% |
| $100,000 to $149,999 | 90 | 25.8% |
| $150,000 to $199,999 | 0 | 0.0% |
| $200,000+ | 0 | 0.0% |
Family Income by Famaliy Size in Gwinn
3-person families (66 | 18.9%) account for the highest median family income in Gwinn with $106,429 per family, while 2-person families (157 | 45.0%) have the highest median income of $45,027 per family member.
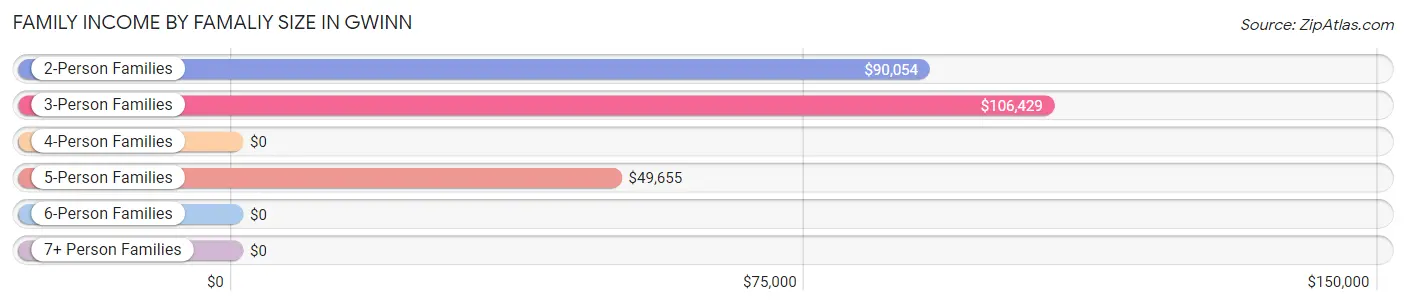
| Income Bracket | # Families | Median Income |
| 2-Person Families | 157 (45.0%) | $90,054 |
| 3-Person Families | 66 (18.9%) | $106,429 |
| 4-Person Families | 44 (12.6%) | $0 |
| 5-Person Families | 82 (23.5%) | $49,655 |
| 6-Person Families | 0 (0.0%) | $0 |
| 7+ Person Families | 0 (0.0%) | $0 |
| Total | 349 (100.0%) | $82,784 |
Family Income by Number of Earners in Gwinn
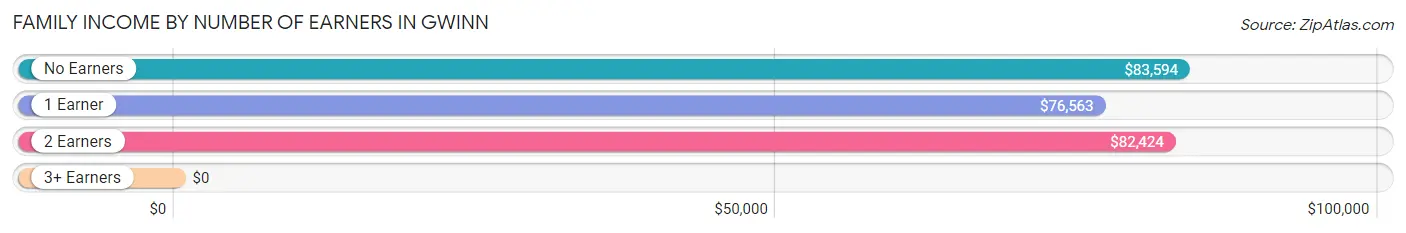
| Number of Earners | # Families | Median Income |
| No Earners | 23 (6.6%) | $83,594 |
| 1 Earner | 175 (50.1%) | $76,563 |
| 2 Earners | 142 (40.7%) | $82,424 |
| 3+ Earners | 9 (2.6%) | $0 |
| Total | 349 (100.0%) | $82,784 |
Household Income in Gwinn
Household Income Brackets in Gwinn
With 170 households falling in the category, the $35,000 to $49,999 income range is the most frequent in Gwinn, accounting for 28.6% of all households.
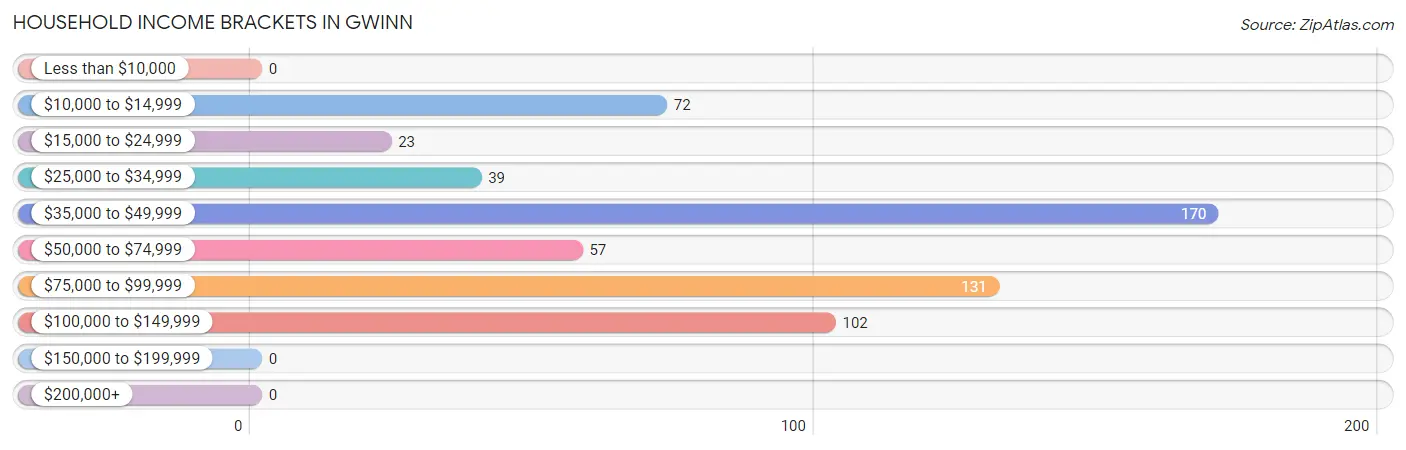
| Income Bracket | # Households | % Households |
| Less than $10,000 | 0 | 0.0% |
| $10,000 to $14,999 | 72 | 12.1% |
| $15,000 to $24,999 | 23 | 3.9% |
| $25,000 to $34,999 | 39 | 6.6% |
| $35,000 to $49,999 | 170 | 28.6% |
| $50,000 to $74,999 | 57 | 9.6% |
| $75,000 to $99,999 | 131 | 22.1% |
| $100,000 to $149,999 | 102 | 17.2% |
| $150,000 to $199,999 | 0 | 0.0% |
| $200,000+ | 0 | 0.0% |
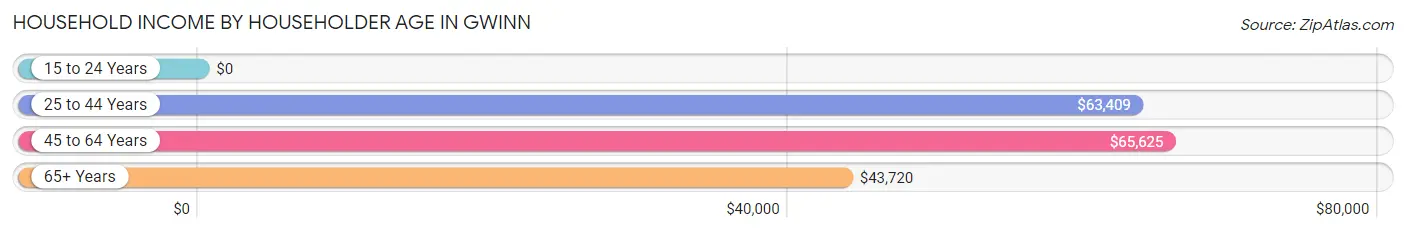
Household Income by Householder Age in Gwinn
The median household income in Gwinn is $49,539, with the highest median household income of $65,625 found in the 45 to 64 years age bracket for the primary householder. A total of 213 households (35.9%) fall into this category. Meanwhile, the 15 to 24 years age bracket for the primary householder has the lowest median household income of $0, with 76 households (12.8%) in this group.
| Income Bracket | # Households | Median Income |
| 15 to 24 Years | 76 (12.8%) | $0 |
| 25 to 44 Years | 64 (10.8%) | $63,409 |
| 45 to 64 Years | 213 (35.9%) | $65,625 |
| 65+ Years | 241 (40.6%) | $43,720 |
| Total | 594 (100.0%) | $49,539 |
Poverty in Gwinn
Income Below Poverty by Sex and Age in Gwinn
With 5.2% poverty level for males and 16.2% for females among the residents of Gwinn, 25 to 34 year old males and under 5 year old females are the most vulnerable to poverty, with 16 males (29.1%) and 30 females (42.9%) in their respective age groups living below the poverty level.
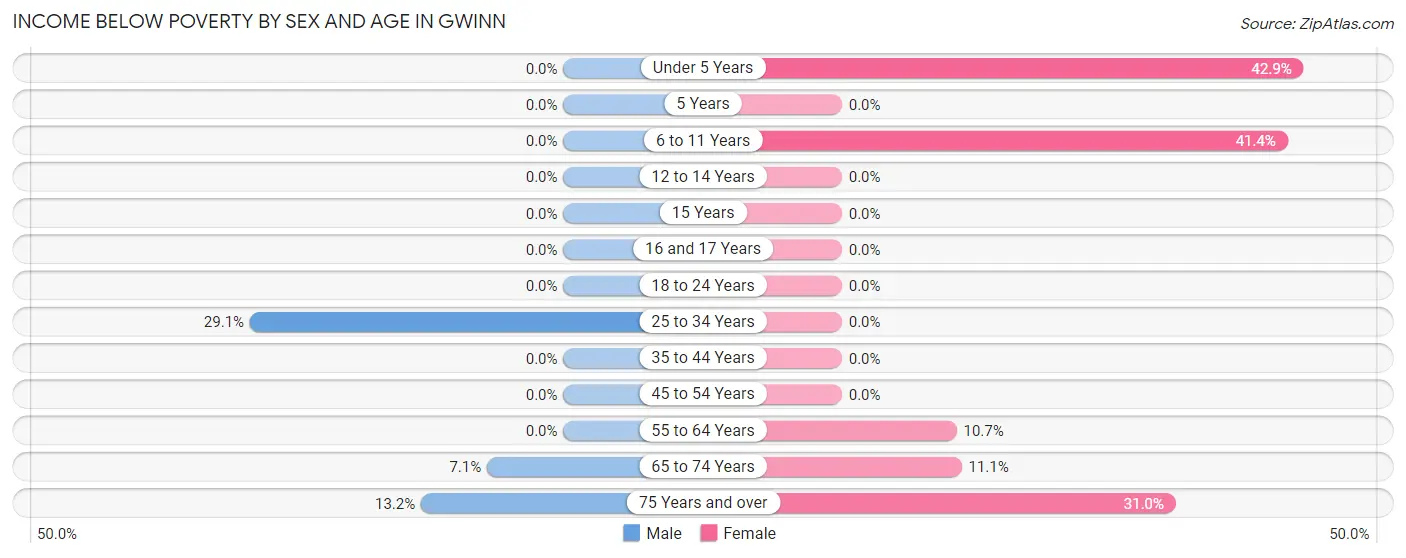
| Age Bracket | Male | Female |
| Under 5 Years | 0 (0.0%) | 30 (42.9%) |
| 5 Years | 0 (0.0%) | 0 (0.0%) |
| 6 to 11 Years | 0 (0.0%) | 36 (41.4%) |
| 12 to 14 Years | 0 (0.0%) | 0 (0.0%) |
| 15 Years | 0 (0.0%) | 0 (0.0%) |
| 16 and 17 Years | 0 (0.0%) | 0 (0.0%) |
| 18 to 24 Years | 0 (0.0%) | 0 (0.0%) |
| 25 to 34 Years | 16 (29.1%) | 0 (0.0%) |
| 35 to 44 Years | 0 (0.0%) | 0 (0.0%) |
| 45 to 54 Years | 0 (0.0%) | 0 (0.0%) |
| 55 to 64 Years | 0 (0.0%) | 18 (10.6%) |
| 65 to 74 Years | 8 (7.1%) | 8 (11.1%) |
| 75 Years and over | 7 (13.2%) | 31 (31.0%) |
| Total | 31 (5.2%) | 123 (16.2%) |
Income Above Poverty by Sex and Age in Gwinn
According to the poverty statistics in Gwinn, males aged under 5 years and females aged 16 and 17 years are the age groups that are most secure financially, with 100.0% of males and 100.0% of females in these age groups living above the poverty line.
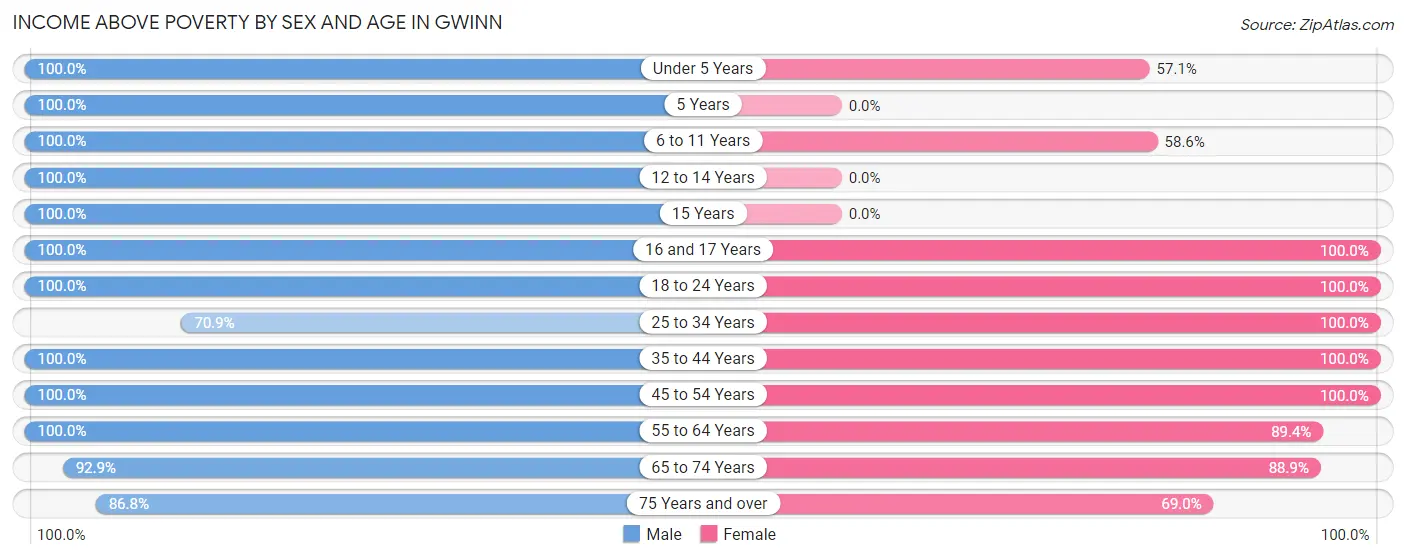
| Age Bracket | Male | Female |
| Under 5 Years | 22 (100.0%) | 40 (57.1%) |
| 5 Years | 10 (100.0%) | 0 (0.0%) |
| 6 to 11 Years | 36 (100.0%) | 51 (58.6%) |
| 12 to 14 Years | 52 (100.0%) | 0 (0.0%) |
| 15 Years | 25 (100.0%) | 0 (0.0%) |
| 16 and 17 Years | 12 (100.0%) | 31 (100.0%) |
| 18 to 24 Years | 33 (100.0%) | 112 (100.0%) |
| 25 to 34 Years | 39 (70.9%) | 28 (100.0%) |
| 35 to 44 Years | 22 (100.0%) | 80 (100.0%) |
| 45 to 54 Years | 26 (100.0%) | 11 (100.0%) |
| 55 to 64 Years | 138 (100.0%) | 151 (89.3%) |
| 65 to 74 Years | 105 (92.9%) | 64 (88.9%) |
| 75 Years and over | 46 (86.8%) | 69 (69.0%) |
| Total | 566 (94.8%) | 637 (83.8%) |
Income Below Poverty Among Married-Couple Families in Gwinn
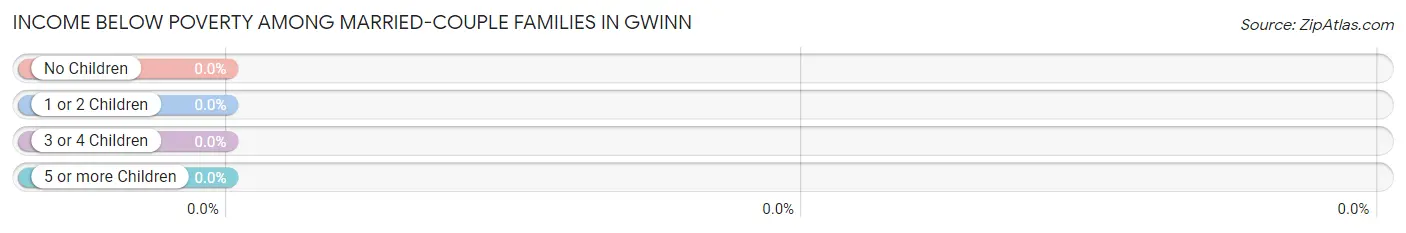
| Children | Above Poverty | Below Poverty |
| No Children | 146 (100.0%) | 0 (0.0%) |
| 1 or 2 Children | 122 (100.0%) | 0 (0.0%) |
| 3 or 4 Children | 37 (100.0%) | 0 (0.0%) |
| 5 or more Children | 0 (0.0%) | 0 (0.0%) |
| Total | 305 (100.0%) | 0 (0.0%) |
Income Below Poverty Among Single-Parent Households in Gwinn
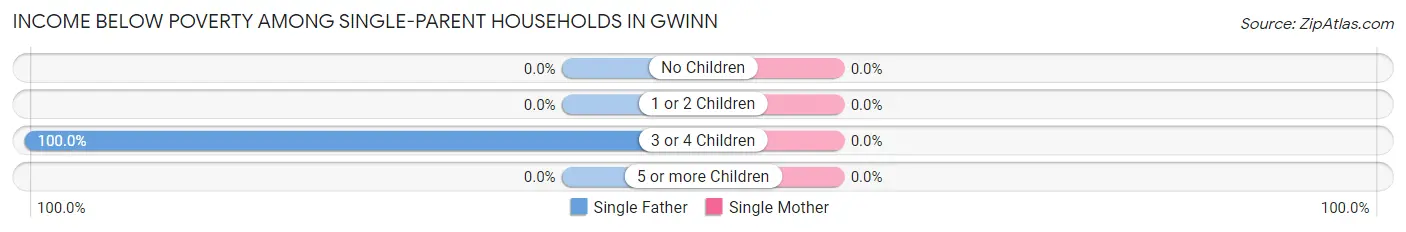
| Children | Single Father | Single Mother |
| No Children | 0 (0.0%) | 0 (0.0%) |
| 1 or 2 Children | 0 (0.0%) | 0 (0.0%) |
| 3 or 4 Children | 16 (100.0%) | 0 (0.0%) |
| 5 or more Children | 0 (0.0%) | 0 (0.0%) |
| Total | 16 (57.1%) | 0 (0.0%) |
Income Below Poverty Among Married-Couple vs Single-Parent Households in Gwinn
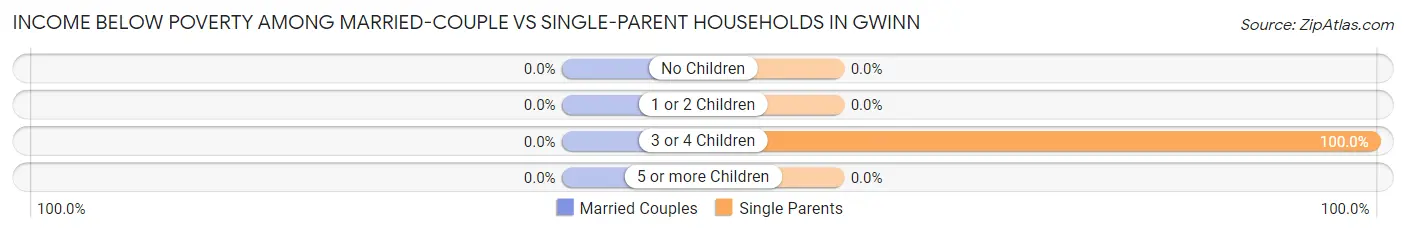
| Children | Married-Couple Families | Single-Parent Households |
| No Children | 0 (0.0%) | 0 (0.0%) |
| 1 or 2 Children | 0 (0.0%) | 0 (0.0%) |
| 3 or 4 Children | 0 (0.0%) | 16 (100.0%) |
| 5 or more Children | 0 (0.0%) | 0 (0.0%) |
| Total | 0 (0.0%) | 16 (36.4%) |
Race in Gwinn
The most populous races in Gwinn are White / Caucasian (1,266 | 92.4%), Two or more Races (63 | 4.6%), and Asian (26 | 1.9%).
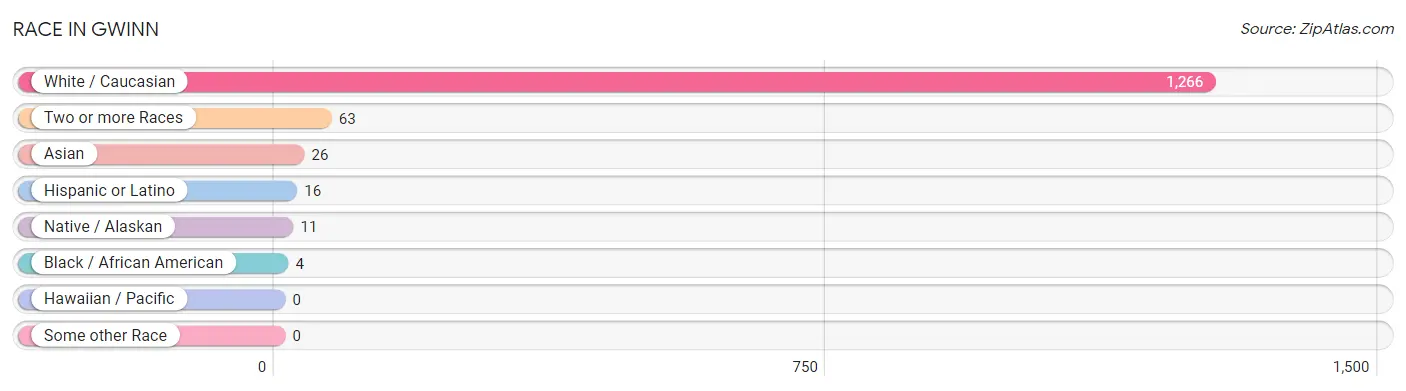
| Race | # Population | % Population |
| Asian | 26 | 1.9% |
| Black / African American | 4 | 0.3% |
| Hawaiian / Pacific | 0 | 0.0% |
| Hispanic or Latino | 16 | 1.2% |
| Native / Alaskan | 11 | 0.8% |
| White / Caucasian | 1,266 | 92.4% |
| Two or more Races | 63 | 4.6% |
| Some other Race | 0 | 0.0% |
| Total | 1,370 | 100.0% |
Ancestry in Gwinn
The most populous ancestries reported in Gwinn are Irish (259 | 18.9%), Finnish (221 | 16.1%), Italian (195 | 14.2%), English (190 | 13.9%), and German (157 | 11.5%), together accounting for 74.6% of all Gwinn residents.
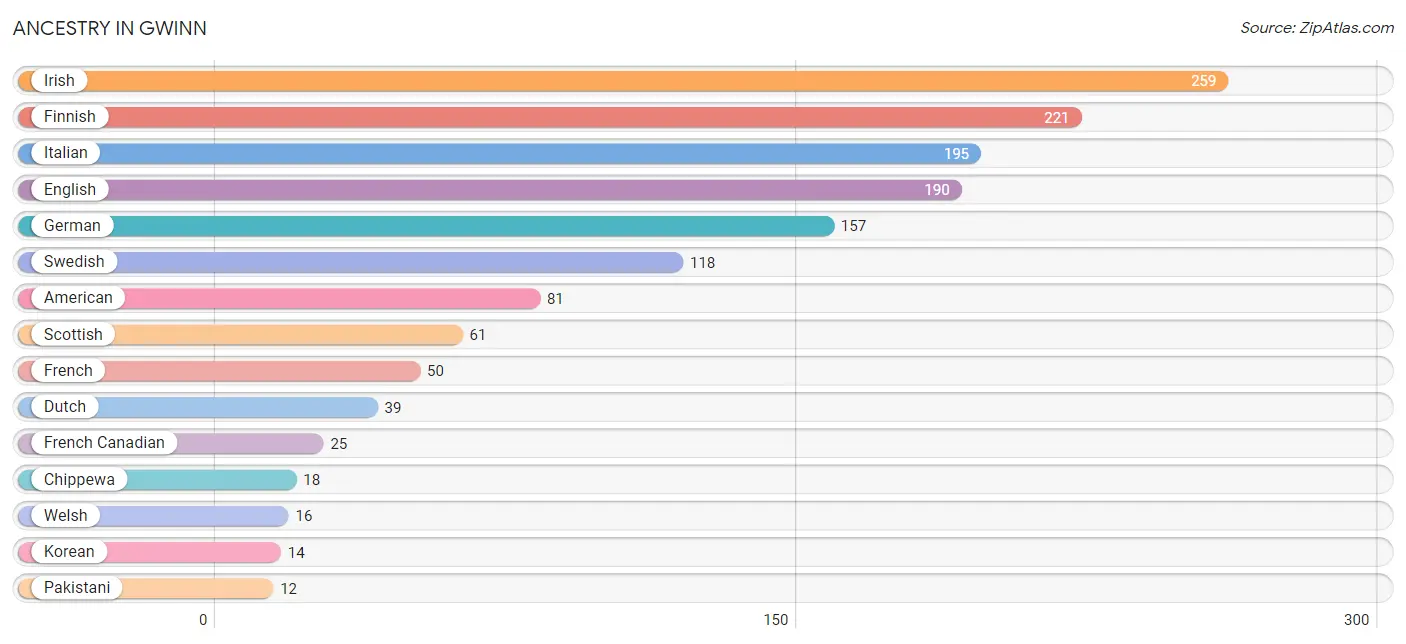
| Ancestry | # Population | % Population |
| American | 81 | 5.9% |
| Belgian | 10 | 0.7% |
| Bhutanese | 11 | 0.8% |
| Central American | 7 | 0.5% |
| Chippewa | 18 | 1.3% |
| Dutch | 39 | 2.9% |
| English | 190 | 13.9% |
| Finnish | 221 | 16.1% |
| French | 50 | 3.6% |
| French Canadian | 25 | 1.8% |
| German | 157 | 11.5% |
| Irish | 259 | 18.9% |
| Italian | 195 | 14.2% |
| Korean | 14 | 1.0% |
| Mexican | 9 | 0.7% |
| Norwegian | 9 | 0.7% |
| Pakistani | 12 | 0.9% |
| Panamanian | 7 | 0.5% |
| Polish | 9 | 0.7% |
| Scandinavian | 10 | 0.7% |
| Scottish | 61 | 4.4% |
| Swedish | 118 | 8.6% |
| Swiss | 7 | 0.5% |
| Welsh | 16 | 1.2% | View All 24 Rows |
Immigrants in Gwinn
The most numerous immigrant groups reported in Gwinn came from Asia (26 | 1.9%), South Eastern Asia (26 | 1.9%), Philippines (14 | 1.0%), and Thailand (12 | 0.9%), together accounting for 5.7% of all Gwinn residents.
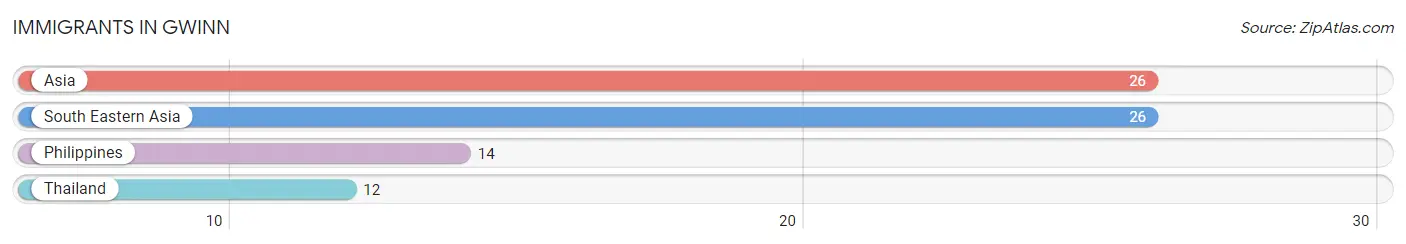
| Immigration Origin | # Population | % Population |
| Asia | 26 | 1.9% |
| Philippines | 14 | 1.0% |
| South Eastern Asia | 26 | 1.9% |
| Thailand | 12 | 0.9% | View All 4 Rows |
Sex and Age in Gwinn
Sex and Age in Gwinn
The most populous age groups in Gwinn are 10 to 14 Years (76 | 12.7%) for men and 55 to 59 Years (104 | 13.5%) for women.
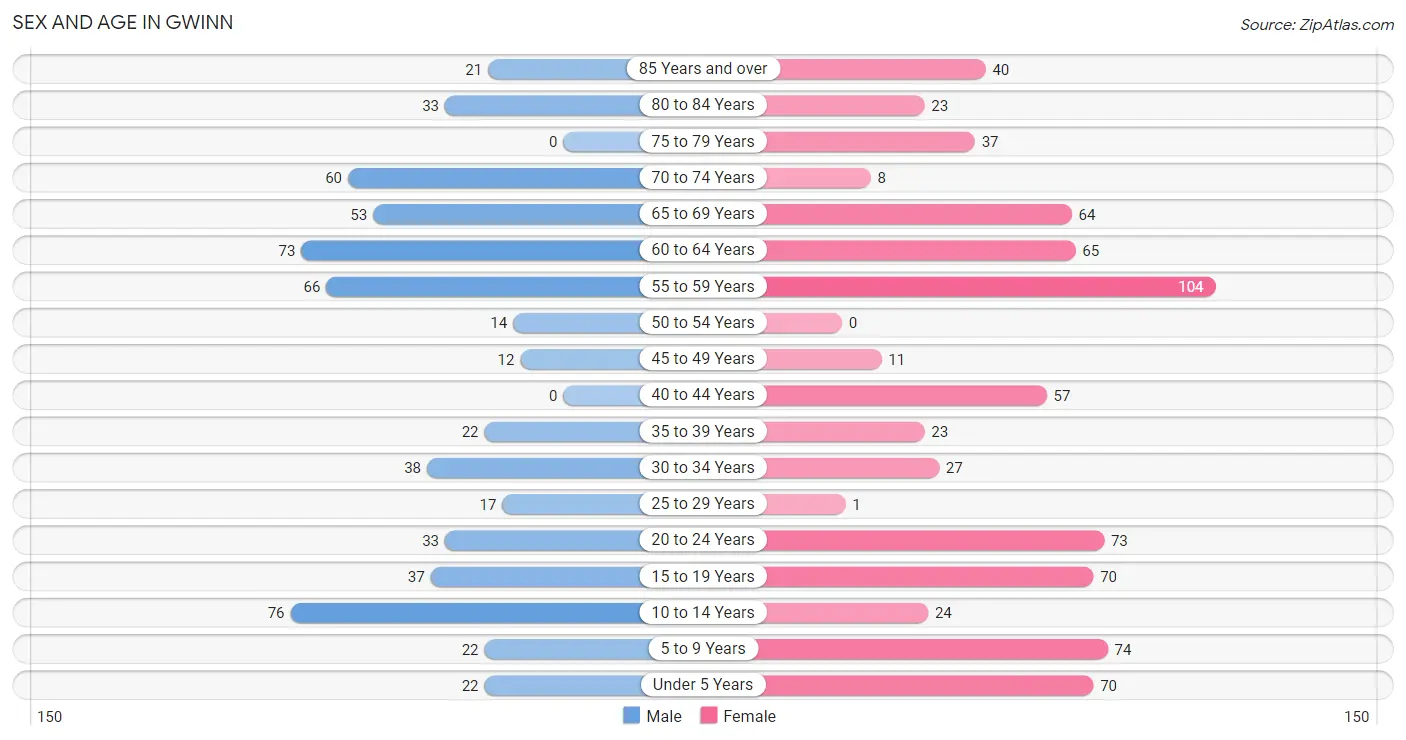
| Age Bracket | Male | Female |
| Under 5 Years | 22 (3.7%) | 70 (9.1%) |
| 5 to 9 Years | 22 (3.7%) | 74 (9.6%) |
| 10 to 14 Years | 76 (12.7%) | 24 (3.1%) |
| 15 to 19 Years | 37 (6.2%) | 70 (9.1%) |
| 20 to 24 Years | 33 (5.5%) | 73 (9.5%) |
| 25 to 29 Years | 17 (2.8%) | 1 (0.1%) |
| 30 to 34 Years | 38 (6.3%) | 27 (3.5%) |
| 35 to 39 Years | 22 (3.7%) | 23 (3.0%) |
| 40 to 44 Years | 0 (0.0%) | 57 (7.4%) |
| 45 to 49 Years | 12 (2.0%) | 11 (1.4%) |
| 50 to 54 Years | 14 (2.3%) | 0 (0.0%) |
| 55 to 59 Years | 66 (11.0%) | 104 (13.5%) |
| 60 to 64 Years | 73 (12.2%) | 65 (8.4%) |
| 65 to 69 Years | 53 (8.8%) | 64 (8.3%) |
| 70 to 74 Years | 60 (10.0%) | 8 (1.0%) |
| 75 to 79 Years | 0 (0.0%) | 37 (4.8%) |
| 80 to 84 Years | 33 (5.5%) | 23 (3.0%) |
| 85 Years and over | 21 (3.5%) | 40 (5.2%) |
| Total | 599 (100.0%) | 771 (100.0%) |
Families and Households in Gwinn
Median Family Size in Gwinn
The median family size in Gwinn is 3.13 persons per family, with single male/father families (28 | 8.0%) accounting for the largest median family size of 3.79 persons per family. On the other hand, single female/mother families (16 | 4.6%) represent the smallest median family size with 1.56 persons per family.
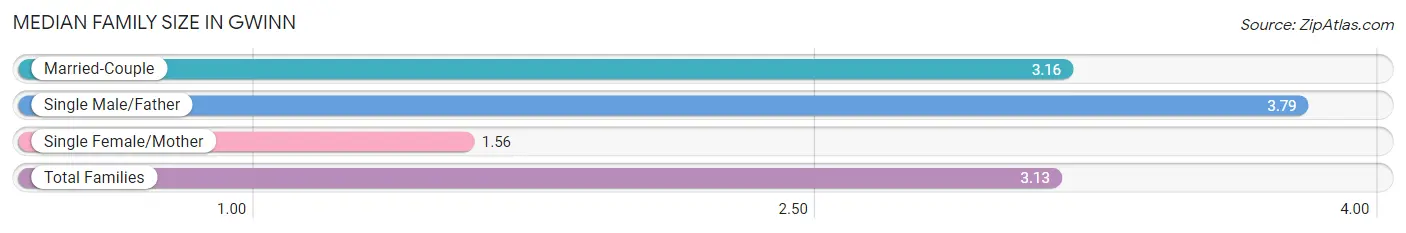
| Family Type | # Families | Family Size |
| Married-Couple | 305 (87.4%) | 3.16 |
| Single Male/Father | 28 (8.0%) | 3.79 |
| Single Female/Mother | 16 (4.6%) | 1.56 |
| Total Families | 349 (100.0%) | 3.13 |
Median Household Size in Gwinn
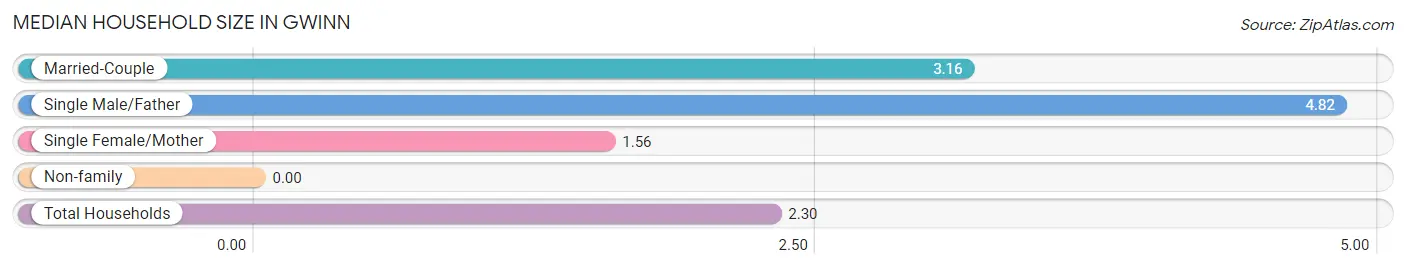
| Household Type | # Households | Household Size |
| Married-Couple | 305 (51.3%) | 3.16 |
| Single Male/Father | 28 (4.7%) | 4.82 |
| Single Female/Mother | 16 (2.7%) | 1.56 |
| Non-family | 245 (41.2%) | - |
| Total Households | 594 (100.0%) | 2.30 |
Household Size by Marriage Status in Gwinn
Out of a total of 594 households in Gwinn, 349 (58.8%) are family households, while 245 (41.2%) are nonfamily households. The most numerous type of family households are 2-person households, comprising 145, and the most common type of nonfamily households are 1-person households, comprising 245.
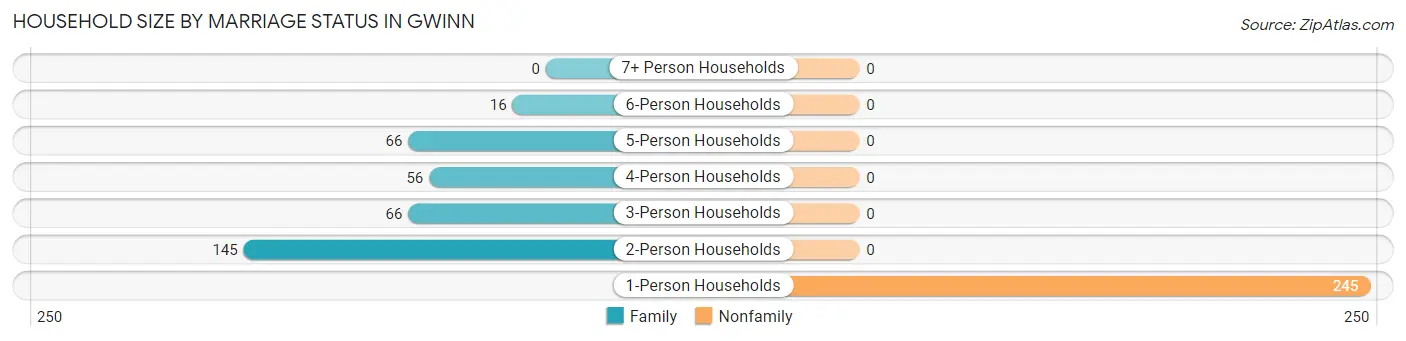
| Household Size | Family Households | Nonfamily Households |
| 1-Person Households | - | 245 (41.2%) |
| 2-Person Households | 145 (24.4%) | 0 (0.0%) |
| 3-Person Households | 66 (11.1%) | 0 (0.0%) |
| 4-Person Households | 56 (9.4%) | 0 (0.0%) |
| 5-Person Households | 66 (11.1%) | 0 (0.0%) |
| 6-Person Households | 16 (2.7%) | 0 (0.0%) |
| 7+ Person Households | 0 (0.0%) | 0 (0.0%) |
| Total | 349 (58.8%) | 245 (41.2%) |
Female Fertility in Gwinn
Fertility by Age in Gwinn
Average fertility rate in Gwinn is 115.0 births per 1,000 women. Women in the age bracket of 20 to 34 years have the highest fertility rate with 297.0 births per 1,000 women. Women in the age bracket of 20 to 34 years acount for 100.0% of all women with births.
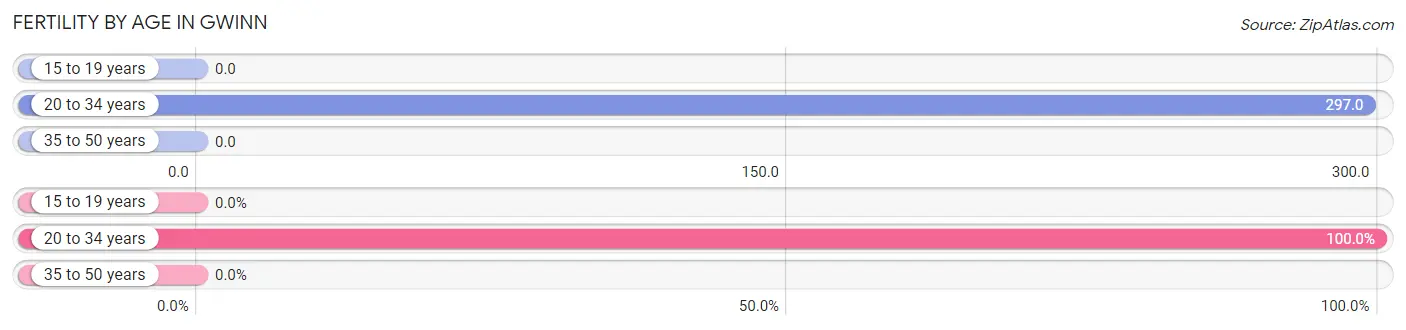
| Age Bracket | Women with Births | Births / 1,000 Women |
| 15 to 19 years | 0 (0.0%) | 0.0 |
| 20 to 34 years | 30 (100.0%) | 297.0 |
| 35 to 50 years | 0 (0.0%) | 0.0 |
| Total | 30 (100.0%) | 115.0 |
Fertility by Age by Marriage Status in Gwinn
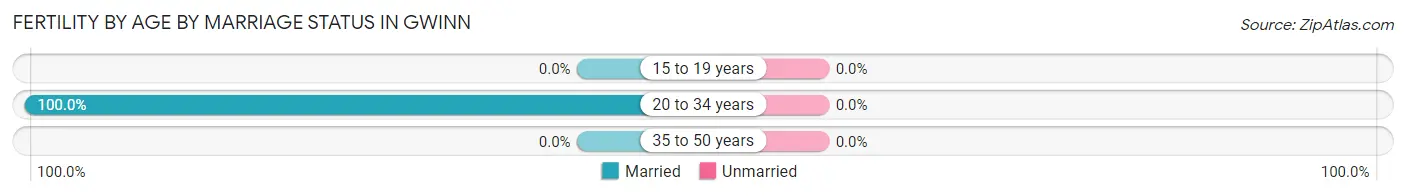
| Age Bracket | Married | Unmarried |
| 15 to 19 years | 0 (0.0%) | 0 (0.0%) |
| 20 to 34 years | 30 (100.0%) | 0 (0.0%) |
| 35 to 50 years | 0 (0.0%) | 0 (0.0%) |
| Total | 30 (100.0%) | 0 (0.0%) |
Fertility by Education in Gwinn
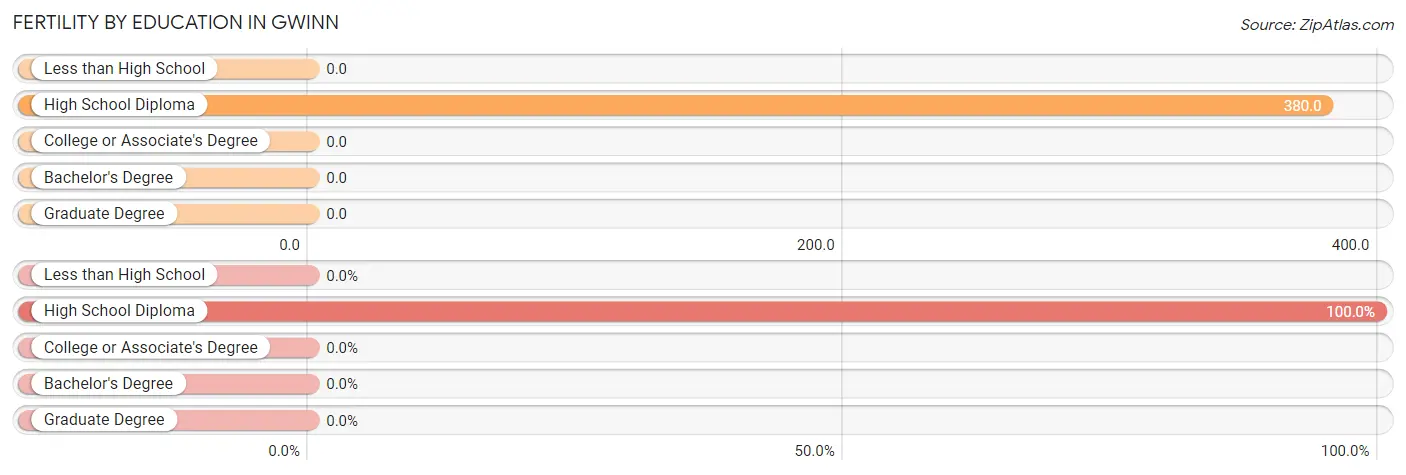
| Educational Attainment | Women with Births | Births / 1,000 Women |
| Less than High School | 0 (0.0%) | 0.0 |
| High School Diploma | 30 (100.0%) | 380.0 |
| College or Associate's Degree | 0 (0.0%) | 0.0 |
| Bachelor's Degree | 0 (0.0%) | 0.0 |
| Graduate Degree | 0 (0.0%) | 0.0 |
| Total | 30 (100.0%) | 115.0 |
Fertility by Education by Marriage Status in Gwinn
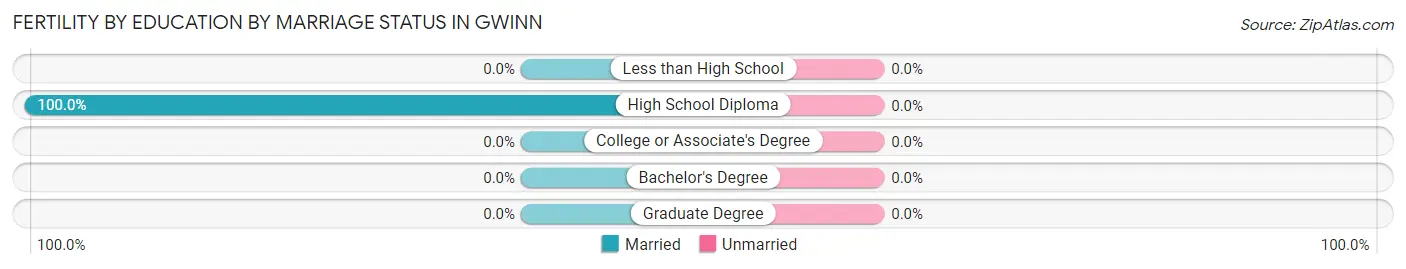
| Educational Attainment | Married | Unmarried |
| Less than High School | 0 (0.0%) | 0 (0.0%) |
| High School Diploma | 30 (100.0%) | 0 (0.0%) |
| College or Associate's Degree | 0 (0.0%) | 0 (0.0%) |
| Bachelor's Degree | 0 (0.0%) | 0 (0.0%) |
| Graduate Degree | 0 (0.0%) | 0 (0.0%) |
| Total | 30 (100.0%) | 0 (0.0%) |
Employment Characteristics in Gwinn
Employment by Class of Employer in Gwinn
Among the 429 employed individuals in Gwinn, private company employees (311 | 72.5%), local government employees (64 | 14.9%), and not-for-profit organizations (20 | 4.7%) make up the most common classes of employment.
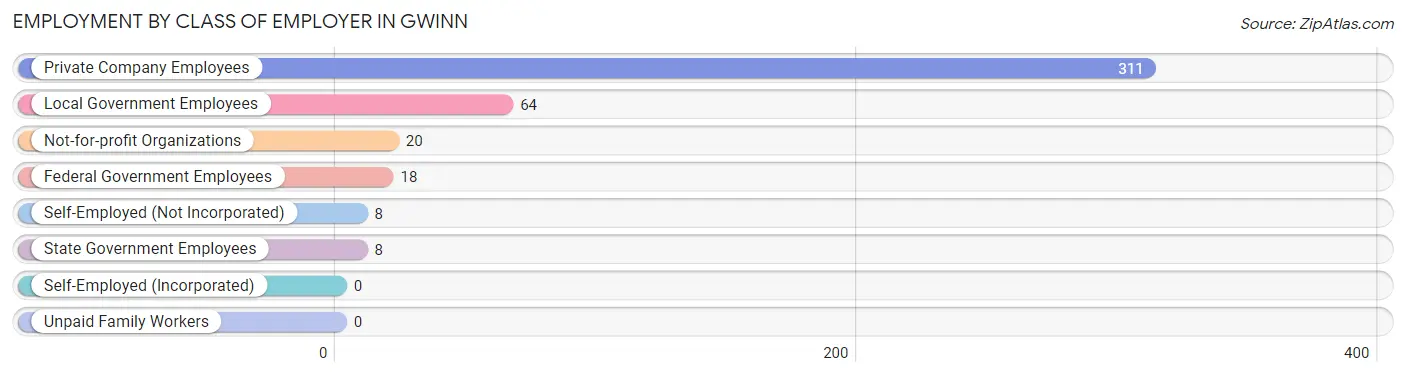
| Employer Class | # Employees | % Employees |
| Private Company Employees | 311 | 72.5% |
| Self-Employed (Incorporated) | 0 | 0.0% |
| Self-Employed (Not Incorporated) | 8 | 1.9% |
| Not-for-profit Organizations | 20 | 4.7% |
| Local Government Employees | 64 | 14.9% |
| State Government Employees | 8 | 1.9% |
| Federal Government Employees | 18 | 4.2% |
| Unpaid Family Workers | 0 | 0.0% |
| Total | 429 | 100.0% |
Employment Status by Age in Gwinn
According to the labor force statistics for Gwinn, out of the total population over 16 years of age (1,057), 45.5% or 481 individuals are in the labor force, with 3.7% or 18 of them unemployed. The age group with the highest labor force participation rate is 30 to 34 years, with 100.0% or 65 individuals in the labor force. Within the labor force, the 35 to 44 years age range has the highest percentage of unemployed individuals, with 9.1% or 8 of them being unemployed.
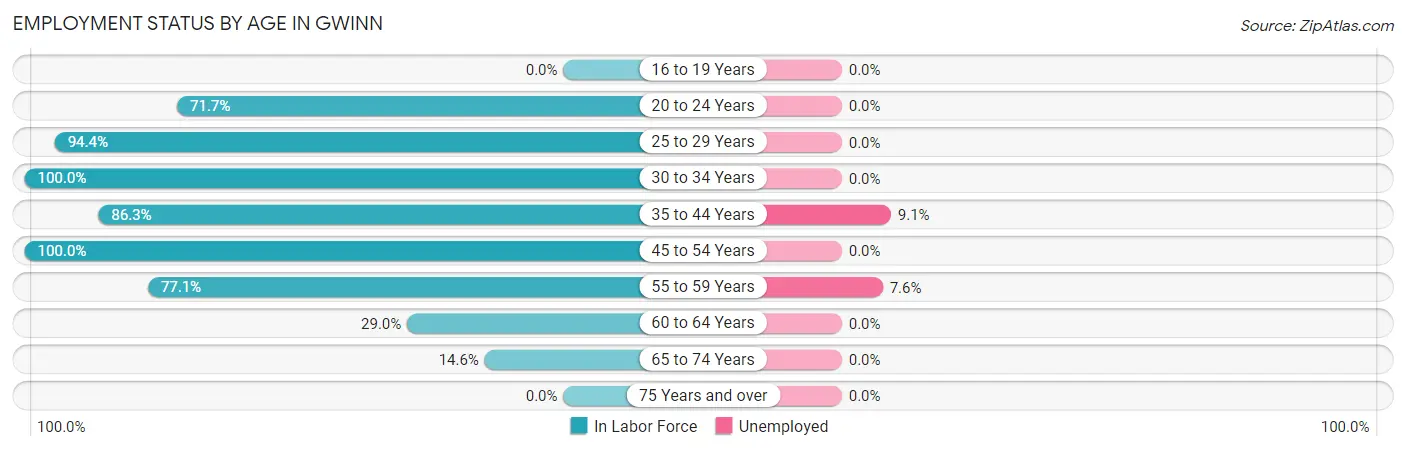
| Age Bracket | In Labor Force | Unemployed |
| 16 to 19 Years | 0 (0.0%) | 0 (0.0%) |
| 20 to 24 Years | 76 (71.7%) | 0 (0.0%) |
| 25 to 29 Years | 17 (94.4%) | 0 (0.0%) |
| 30 to 34 Years | 65 (100.0%) | 0 (0.0%) |
| 35 to 44 Years | 88 (86.3%) | 8 (9.1%) |
| 45 to 54 Years | 37 (100.0%) | 0 (0.0%) |
| 55 to 59 Years | 131 (77.1%) | 10 (7.6%) |
| 60 to 64 Years | 40 (29.0%) | 0 (0.0%) |
| 65 to 74 Years | 27 (14.6%) | 0 (0.0%) |
| 75 Years and over | 0 (0.0%) | 0 (0.0%) |
| Total | 481 (45.5%) | 18 (3.7%) |
Employment Status by Educational Attainment in Gwinn
According to labor force statistics for Gwinn, 71.3% of individuals (378) out of the total population between 25 and 64 years of age (530) are in the labor force, with 4.8% or 18 of them being unemployed. The group with the highest labor force participation rate are those with the educational attainment of college / associate degree, with 94.3% or 197 individuals in the labor force. Within the labor force, individuals with high school diploma education have the highest percentage of unemployment, with 13.3% or 8 of them being unemployed.
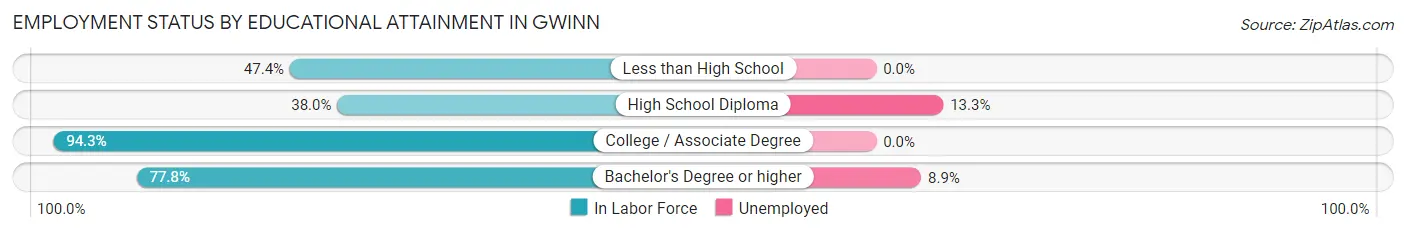
| Educational Attainment | In Labor Force | Unemployed |
| Less than High School | 9 (47.4%) | 0 (0.0%) |
| High School Diploma | 60 (38.0%) | 21 (13.3%) |
| College / Associate Degree | 197 (94.3%) | 0 (0.0%) |
| Bachelor's Degree or higher | 112 (77.8%) | 13 (8.9%) |
| Total | 378 (71.3%) | 25 (4.8%) |
Employment Occupations by Sex in Gwinn
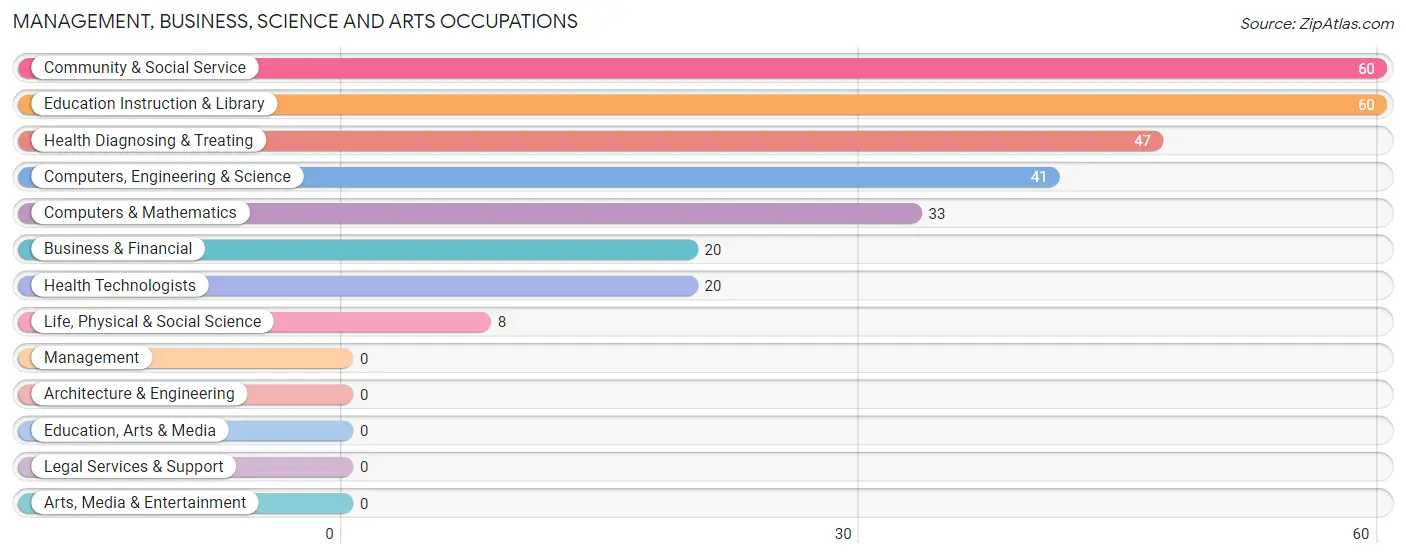
Management, Business, Science and Arts Occupations
The most common Management, Business, Science and Arts occupations in Gwinn are Community & Social Service (60 | 13.0%), Education Instruction & Library (60 | 13.0%), Health Diagnosing & Treating (47 | 10.2%), Computers, Engineering & Science (41 | 8.9%), and Computers & Mathematics (33 | 7.1%).
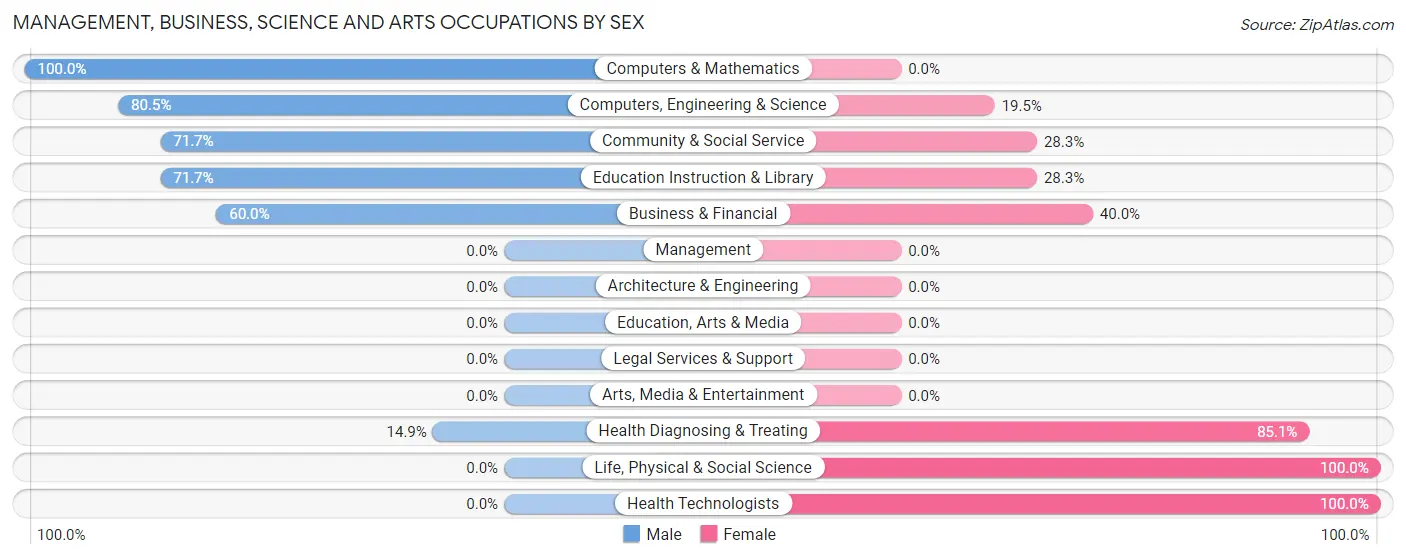
Management, Business, Science and Arts Occupations by Sex
Within the Management, Business, Science and Arts occupations in Gwinn, the most male-oriented occupations are Computers & Mathematics (100.0%), Computers, Engineering & Science (80.5%), and Community & Social Service (71.7%), while the most female-oriented occupations are Life, Physical & Social Science (100.0%), Health Technologists (100.0%), and Health Diagnosing & Treating (85.1%).
| Occupation | Male | Female |
| Management | 0 (0.0%) | 0 (0.0%) |
| Business & Financial | 12 (60.0%) | 8 (40.0%) |
| Computers, Engineering & Science | 33 (80.5%) | 8 (19.5%) |
| Computers & Mathematics | 33 (100.0%) | 0 (0.0%) |
| Architecture & Engineering | 0 (0.0%) | 0 (0.0%) |
| Life, Physical & Social Science | 0 (0.0%) | 8 (100.0%) |
| Community & Social Service | 43 (71.7%) | 17 (28.3%) |
| Education, Arts & Media | 0 (0.0%) | 0 (0.0%) |
| Legal Services & Support | 0 (0.0%) | 0 (0.0%) |
| Education Instruction & Library | 43 (71.7%) | 17 (28.3%) |
| Arts, Media & Entertainment | 0 (0.0%) | 0 (0.0%) |
| Health Diagnosing & Treating | 7 (14.9%) | 40 (85.1%) |
| Health Technologists | 0 (0.0%) | 20 (100.0%) |
| Total (Category) | 95 (56.6%) | 73 (43.4%) |
| Total (Overall) | 207 (44.7%) | 256 (55.3%) |
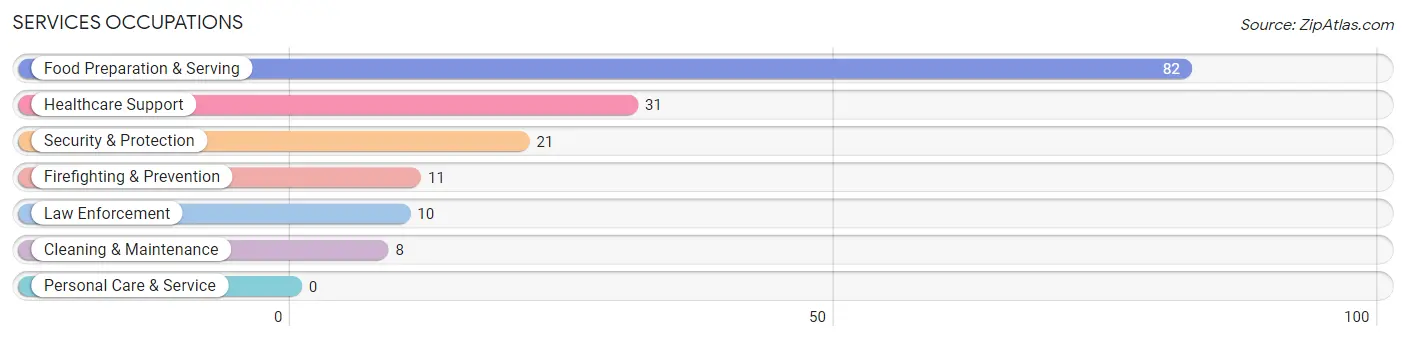
Services Occupations
The most common Services occupations in Gwinn are Food Preparation & Serving (82 | 17.7%), Healthcare Support (31 | 6.7%), Security & Protection (21 | 4.5%), Firefighting & Prevention (11 | 2.4%), and Law Enforcement (10 | 2.2%).
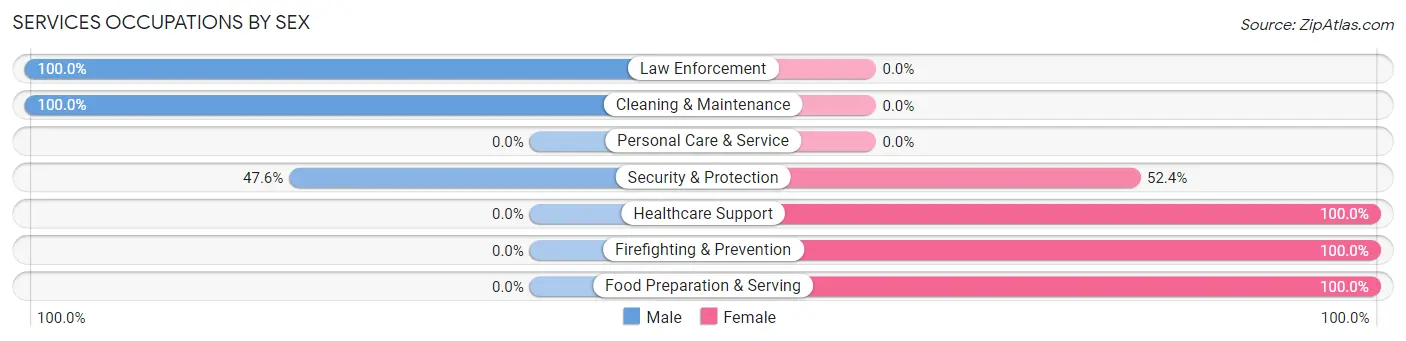
Services Occupations by Sex
Within the Services occupations in Gwinn, the most male-oriented occupations are Law Enforcement (100.0%), Cleaning & Maintenance (100.0%), and Security & Protection (47.6%), while the most female-oriented occupations are Healthcare Support (100.0%), Firefighting & Prevention (100.0%), and Food Preparation & Serving (100.0%).
| Occupation | Male | Female |
| Healthcare Support | 0 (0.0%) | 31 (100.0%) |
| Security & Protection | 10 (47.6%) | 11 (52.4%) |
| Firefighting & Prevention | 0 (0.0%) | 11 (100.0%) |
| Law Enforcement | 10 (100.0%) | 0 (0.0%) |
| Food Preparation & Serving | 0 (0.0%) | 82 (100.0%) |
| Cleaning & Maintenance | 8 (100.0%) | 0 (0.0%) |
| Personal Care & Service | 0 (0.0%) | 0 (0.0%) |
| Total (Category) | 18 (12.7%) | 124 (87.3%) |
| Total (Overall) | 207 (44.7%) | 256 (55.3%) |
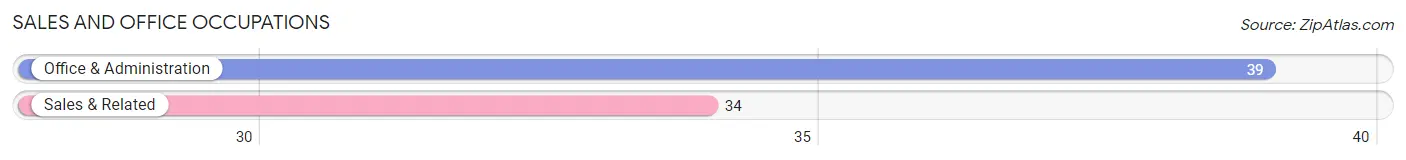
Sales and Office Occupations
The most common Sales and Office occupations in Gwinn are Office & Administration (39 | 8.4%), and Sales & Related (34 | 7.3%).
Sales and Office Occupations by Sex
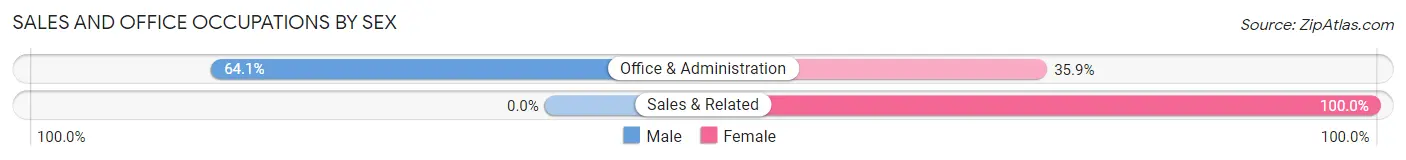
| Occupation | Male | Female |
| Sales & Related | 0 (0.0%) | 34 (100.0%) |
| Office & Administration | 25 (64.1%) | 14 (35.9%) |
| Total (Category) | 25 (34.3%) | 48 (65.7%) |
| Total (Overall) | 207 (44.7%) | 256 (55.3%) |
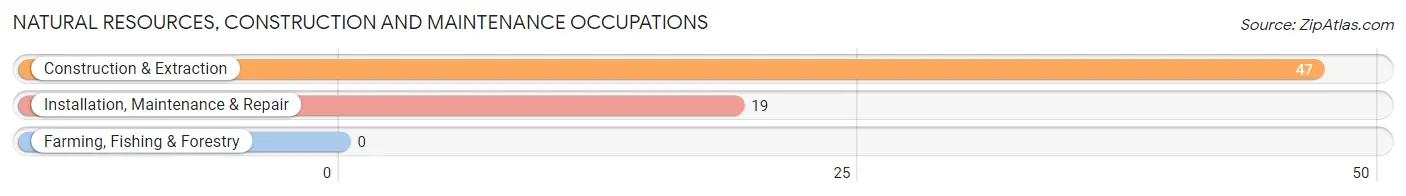
Natural Resources, Construction and Maintenance Occupations
The most common Natural Resources, Construction and Maintenance occupations in Gwinn are Construction & Extraction (47 | 10.2%), and Installation, Maintenance & Repair (19 | 4.1%).
Natural Resources, Construction and Maintenance Occupations by Sex
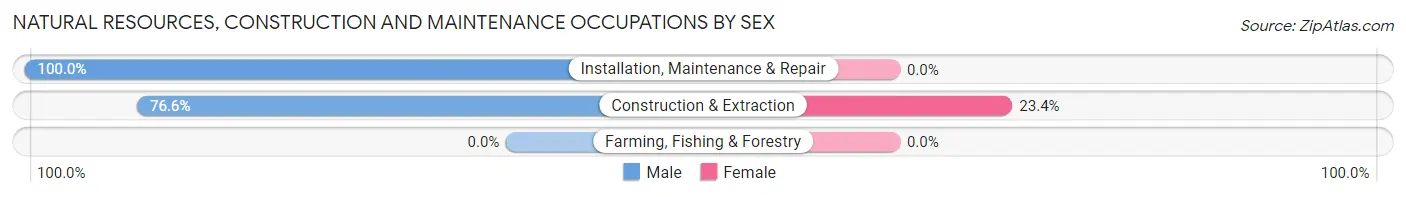
| Occupation | Male | Female |
| Farming, Fishing & Forestry | 0 (0.0%) | 0 (0.0%) |
| Construction & Extraction | 36 (76.6%) | 11 (23.4%) |
| Installation, Maintenance & Repair | 19 (100.0%) | 0 (0.0%) |
| Total (Category) | 55 (83.3%) | 11 (16.7%) |
| Total (Overall) | 207 (44.7%) | 256 (55.3%) |
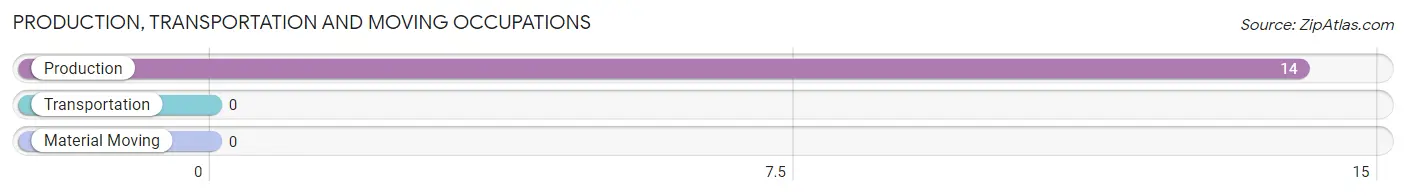
Production, Transportation and Moving Occupations
The most common Production, Transportation and Moving occupations in Gwinn are , and Production (14 | 3.0%).
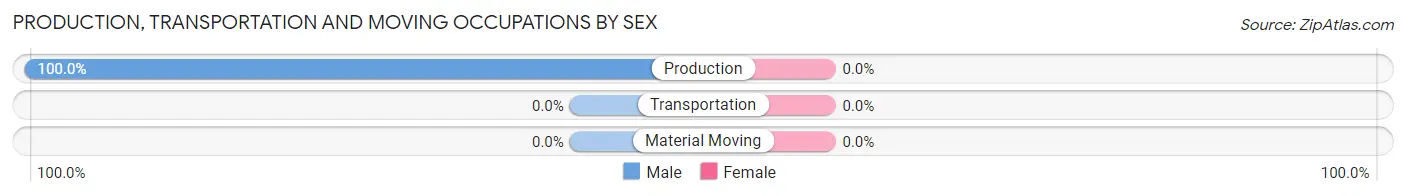
Production, Transportation and Moving Occupations by Sex
| Occupation | Male | Female |
| Production | 14 (100.0%) | 0 (0.0%) |
| Transportation | 0 (0.0%) | 0 (0.0%) |
| Material Moving | 0 (0.0%) | 0 (0.0%) |
| Total (Category) | 14 (100.0%) | 0 (0.0%) |
| Total (Overall) | 207 (44.7%) | 256 (55.3%) |
Employment Industries by Sex in Gwinn
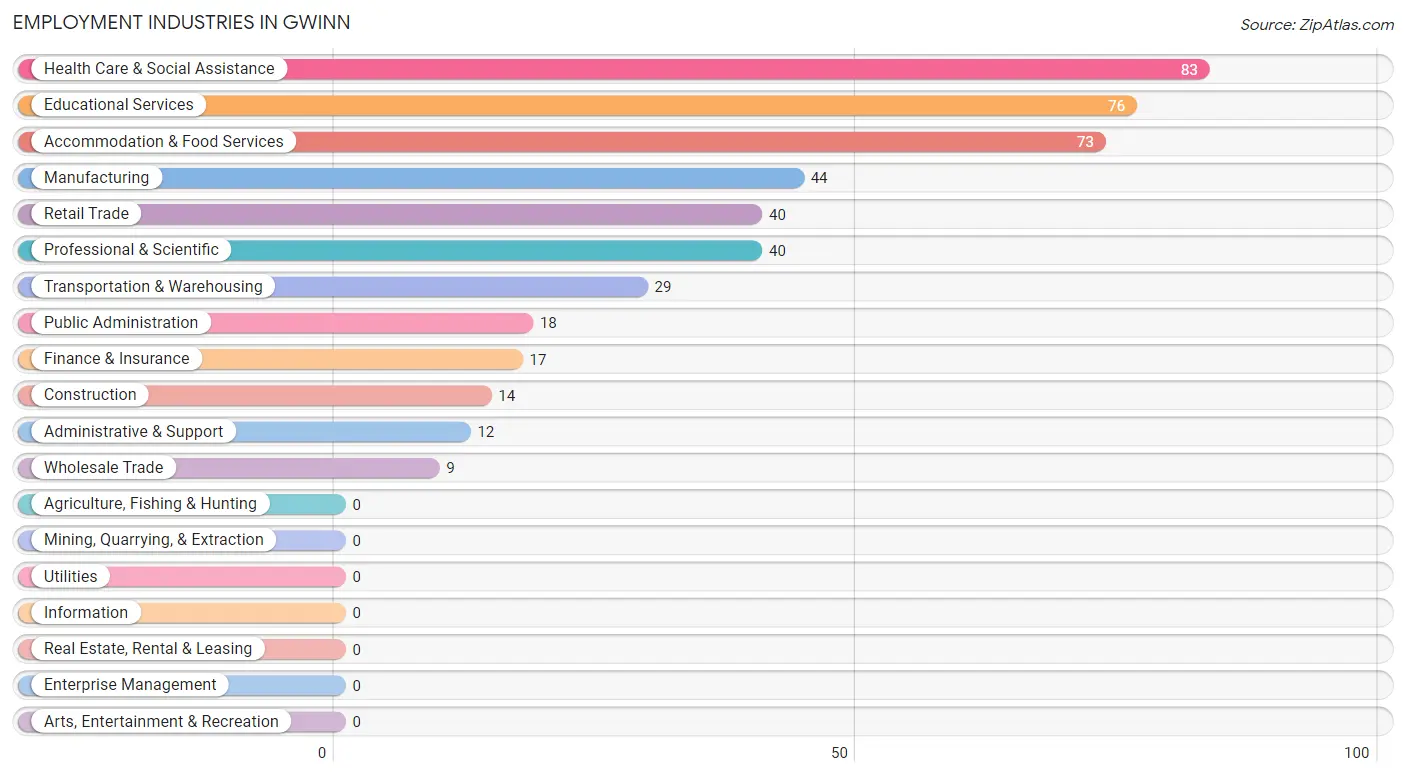
Employment Industries in Gwinn
The major employment industries in Gwinn include Health Care & Social Assistance (83 | 17.9%), Educational Services (76 | 16.4%), Accommodation & Food Services (73 | 15.8%), Manufacturing (44 | 9.5%), and Retail Trade (40 | 8.6%).
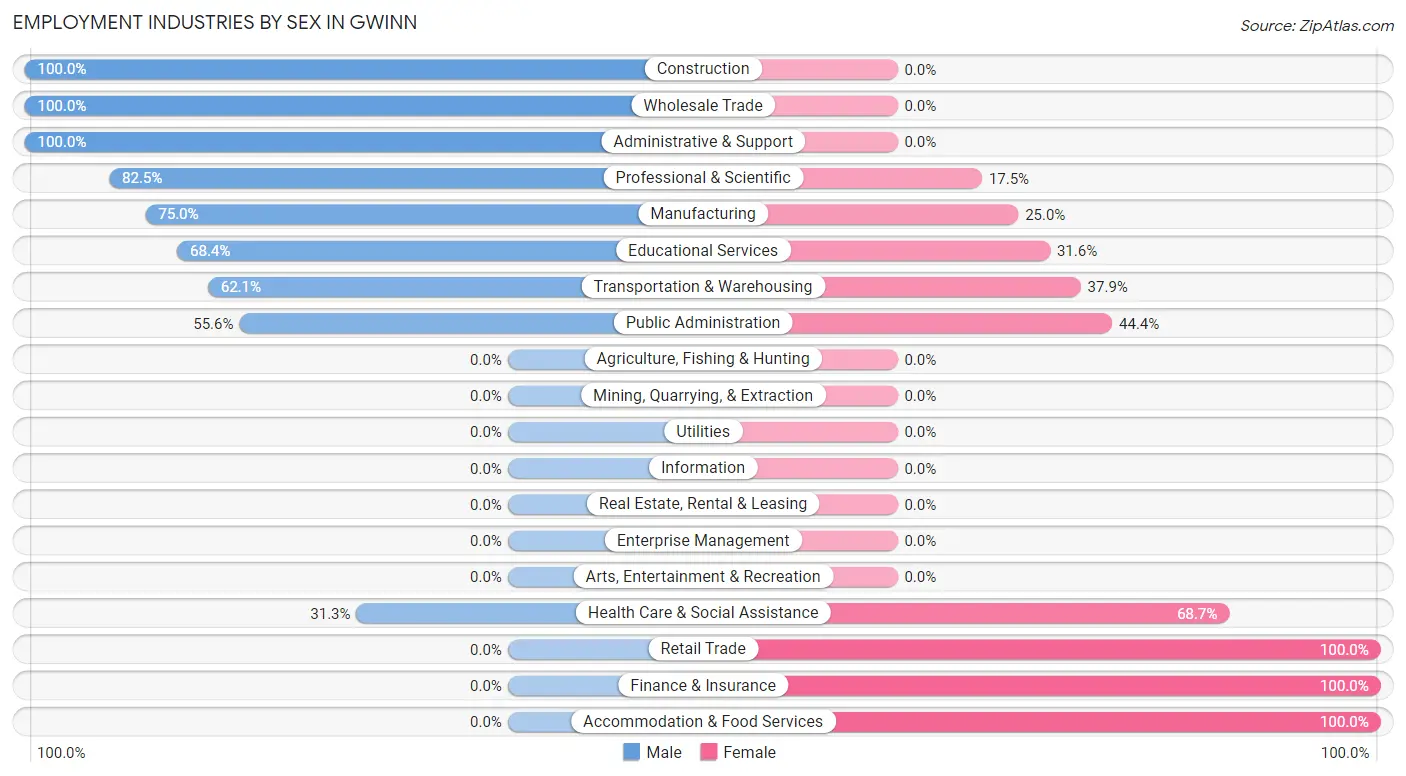
Employment Industries by Sex in Gwinn
The Gwinn industries that see more men than women are Construction (100.0%), Wholesale Trade (100.0%), and Administrative & Support (100.0%), whereas the industries that tend to have a higher number of women are Retail Trade (100.0%), Finance & Insurance (100.0%), and Accommodation & Food Services (100.0%).
| Industry | Male | Female |
| Agriculture, Fishing & Hunting | 0 (0.0%) | 0 (0.0%) |
| Mining, Quarrying, & Extraction | 0 (0.0%) | 0 (0.0%) |
| Construction | 14 (100.0%) | 0 (0.0%) |
| Manufacturing | 33 (75.0%) | 11 (25.0%) |
| Wholesale Trade | 9 (100.0%) | 0 (0.0%) |
| Retail Trade | 0 (0.0%) | 40 (100.0%) |
| Transportation & Warehousing | 18 (62.1%) | 11 (37.9%) |
| Utilities | 0 (0.0%) | 0 (0.0%) |
| Information | 0 (0.0%) | 0 (0.0%) |
| Finance & Insurance | 0 (0.0%) | 17 (100.0%) |
| Real Estate, Rental & Leasing | 0 (0.0%) | 0 (0.0%) |
| Professional & Scientific | 33 (82.5%) | 7 (17.5%) |
| Enterprise Management | 0 (0.0%) | 0 (0.0%) |
| Administrative & Support | 12 (100.0%) | 0 (0.0%) |
| Educational Services | 52 (68.4%) | 24 (31.6%) |
| Health Care & Social Assistance | 26 (31.3%) | 57 (68.7%) |
| Arts, Entertainment & Recreation | 0 (0.0%) | 0 (0.0%) |
| Accommodation & Food Services | 0 (0.0%) | 73 (100.0%) |
| Public Administration | 10 (55.6%) | 8 (44.4%) |
| Total | 207 (44.7%) | 256 (55.3%) |
Education in Gwinn
School Enrollment in Gwinn
The most common levels of schooling among the 286 students in Gwinn are middle school (88 | 30.8%), elementary school (80 | 28.0%), and high school (68 | 23.8%).
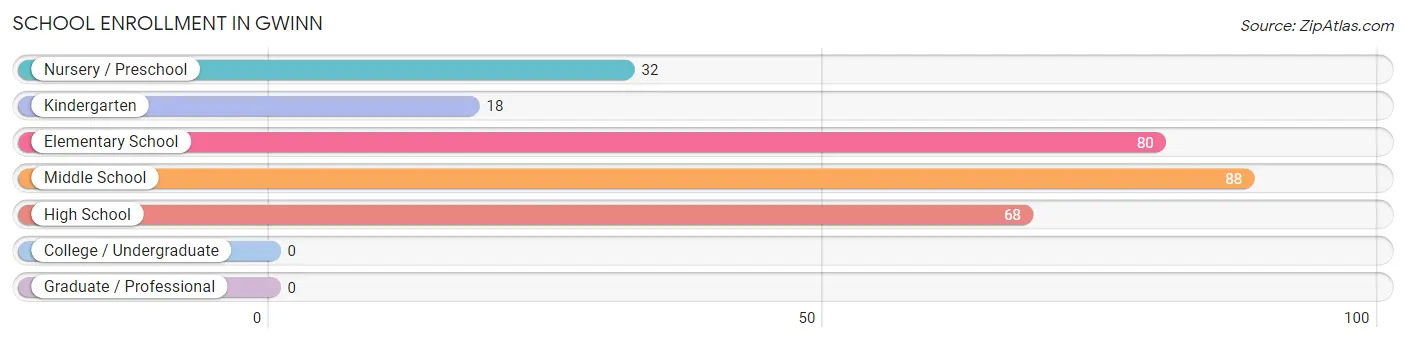
| School Level | # Students | % Students |
| Nursery / Preschool | 32 | 11.2% |
| Kindergarten | 18 | 6.3% |
| Elementary School | 80 | 28.0% |
| Middle School | 88 | 30.8% |
| High School | 68 | 23.8% |
| College / Undergraduate | 0 | 0.0% |
| Graduate / Professional | 0 | 0.0% |
| Total | 286 | 100.0% |
School Enrollment by Age by Funding Source in Gwinn
Out of a total of 286 students who are enrolled in schools in Gwinn, 32 (11.2%) attend a private institution, while the remaining 254 (88.8%) are enrolled in public schools. The age group of 3 to 4 year olds has the highest likelihood of being enrolled in private schools, with 22 (100.0% in the age bracket) enrolled. Conversely, the age group of 10 to 14 year olds has the lowest likelihood of being enrolled in a private school, with 100 (100.0% in the age bracket) attending a public institution.
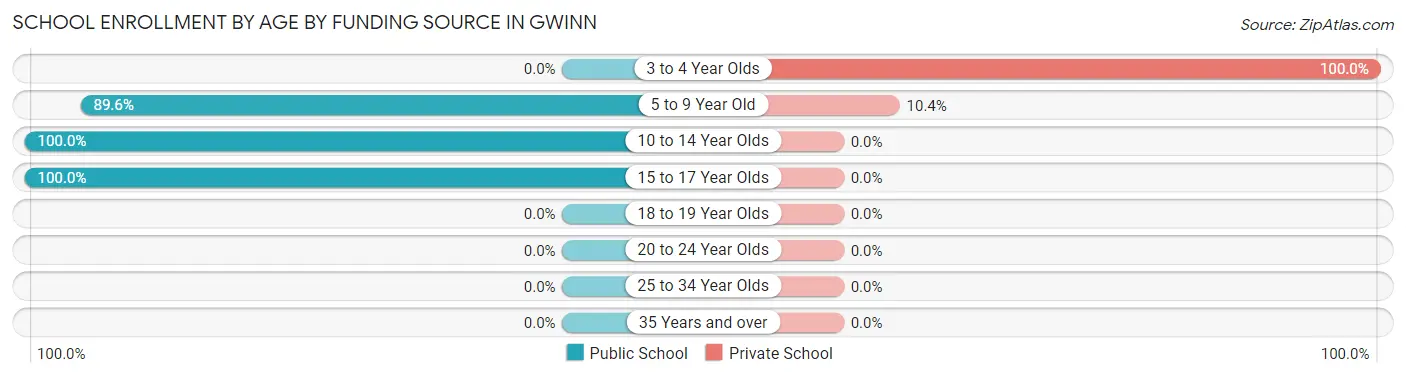
| Age Bracket | Public School | Private School |
| 3 to 4 Year Olds | 0 (0.0%) | 22 (100.0%) |
| 5 to 9 Year Old | 86 (89.6%) | 10 (10.4%) |
| 10 to 14 Year Olds | 100 (100.0%) | 0 (0.0%) |
| 15 to 17 Year Olds | 68 (100.0%) | 0 (0.0%) |
| 18 to 19 Year Olds | 0 (0.0%) | 0 (0.0%) |
| 20 to 24 Year Olds | 0 (0.0%) | 0 (0.0%) |
| 25 to 34 Year Olds | 0 (0.0%) | 0 (0.0%) |
| 35 Years and over | 0 (0.0%) | 0 (0.0%) |
| Total | 254 (88.8%) | 32 (11.2%) |
Educational Attainment by Field of Study in Gwinn
Business (63 | 24.9%), education (59 | 23.3%), science & technology (36 | 14.2%), arts & humanities (33 | 13.0%), and computers & mathematics (24 | 9.5%) are the most common fields of study among 253 individuals in Gwinn who have obtained a bachelor's degree or higher.
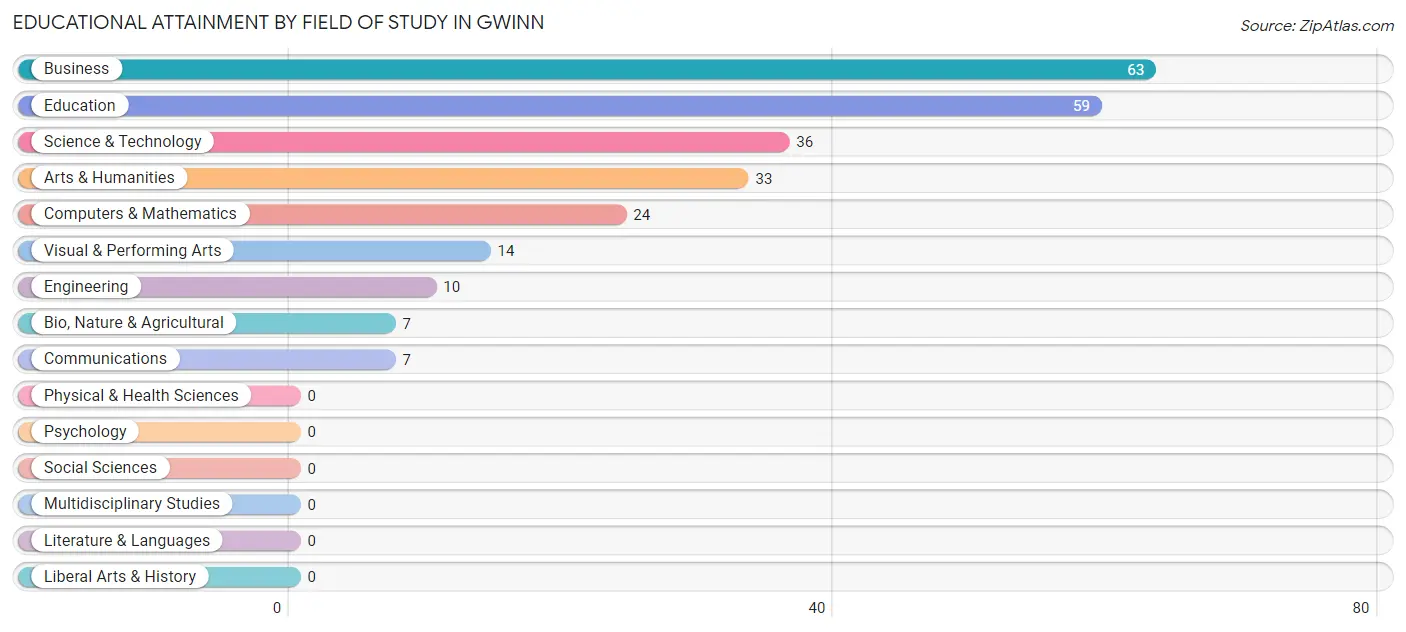
| Field of Study | # Graduates | % Graduates |
| Computers & Mathematics | 24 | 9.5% |
| Bio, Nature & Agricultural | 7 | 2.8% |
| Physical & Health Sciences | 0 | 0.0% |
| Psychology | 0 | 0.0% |
| Social Sciences | 0 | 0.0% |
| Engineering | 10 | 4.0% |
| Multidisciplinary Studies | 0 | 0.0% |
| Science & Technology | 36 | 14.2% |
| Business | 63 | 24.9% |
| Education | 59 | 23.3% |
| Literature & Languages | 0 | 0.0% |
| Liberal Arts & History | 0 | 0.0% |
| Visual & Performing Arts | 14 | 5.5% |
| Communications | 7 | 2.8% |
| Arts & Humanities | 33 | 13.0% |
| Total | 253 | 100.0% |
Transportation & Commute in Gwinn
Vehicle Availability by Sex in Gwinn
The most prevalent vehicle ownership categories in Gwinn are males with 3 vehicles (71, accounting for 41.0%) and females with 3 vehicles (48, making up 27.7%).
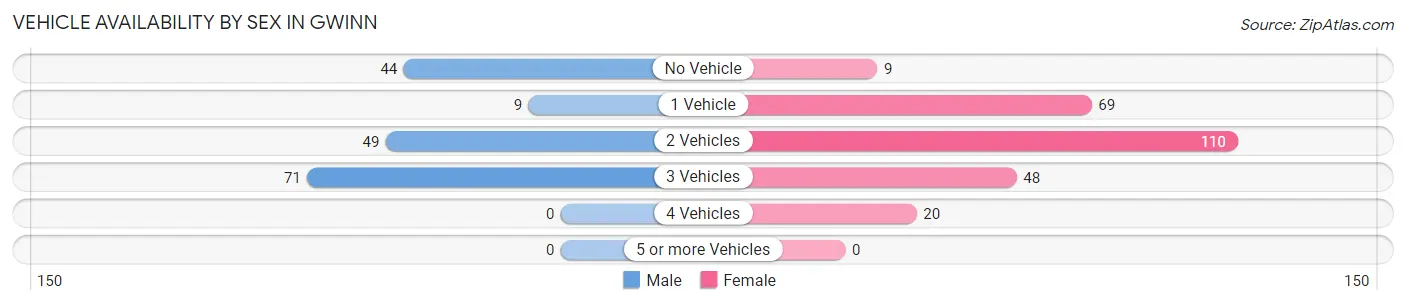
| Vehicles Available | Male | Female |
| No Vehicle | 44 (25.4%) | 9 (3.5%) |
| 1 Vehicle | 9 (5.2%) | 69 (27.0%) |
| 2 Vehicles | 49 (28.3%) | 110 (43.0%) |
| 3 Vehicles | 71 (41.0%) | 48 (18.8%) |
| 4 Vehicles | 0 (0.0%) | 20 (7.8%) |
| 5 or more Vehicles | 0 (0.0%) | 0 (0.0%) |
| Total | 173 (100.0%) | 256 (100.0%) |
Commute Time in Gwinn
The most frequently occuring commute durations in Gwinn are 30 to 34 minutes (144 commuters, 37.3%), 25 to 29 minutes (54 commuters, 14.0%), and 5 to 9 minutes (44 commuters, 11.4%).
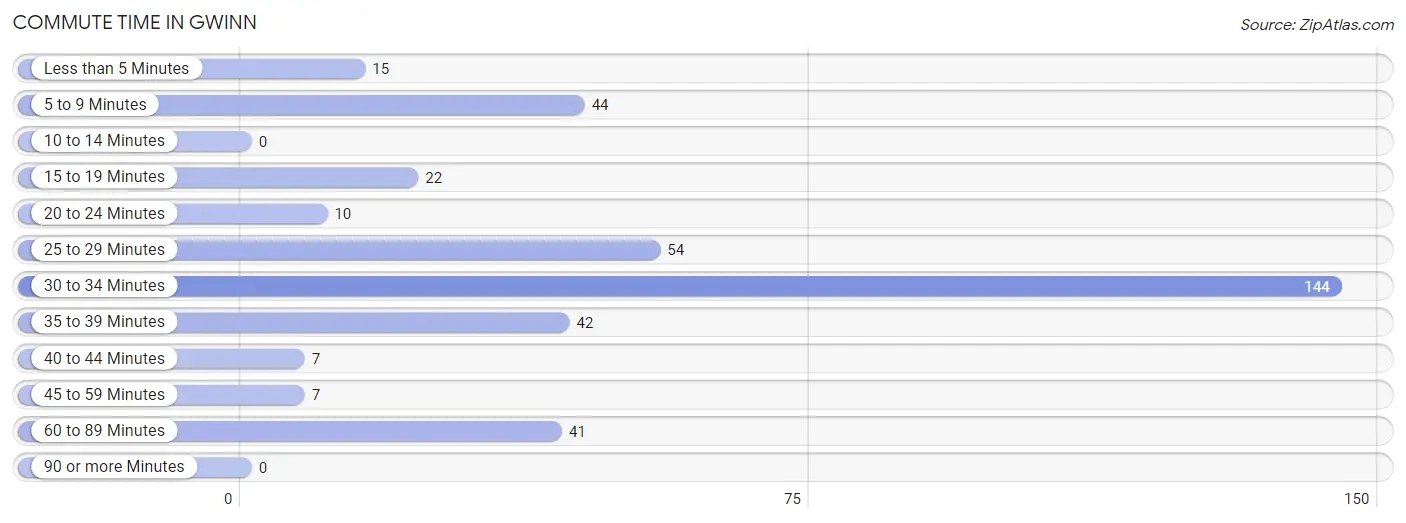
| Commute Time | # Commuters | % Commuters |
| Less than 5 Minutes | 15 | 3.9% |
| 5 to 9 Minutes | 44 | 11.4% |
| 10 to 14 Minutes | 0 | 0.0% |
| 15 to 19 Minutes | 22 | 5.7% |
| 20 to 24 Minutes | 10 | 2.6% |
| 25 to 29 Minutes | 54 | 14.0% |
| 30 to 34 Minutes | 144 | 37.3% |
| 35 to 39 Minutes | 42 | 10.9% |
| 40 to 44 Minutes | 7 | 1.8% |
| 45 to 59 Minutes | 7 | 1.8% |
| 60 to 89 Minutes | 41 | 10.6% |
| 90 or more Minutes | 0 | 0.0% |
Commute Time by Sex in Gwinn
The most common commute times in Gwinn are 30 to 34 minutes (39 commuters, 27.9%) for males and 30 to 34 minutes (105 commuters, 42.7%) for females.
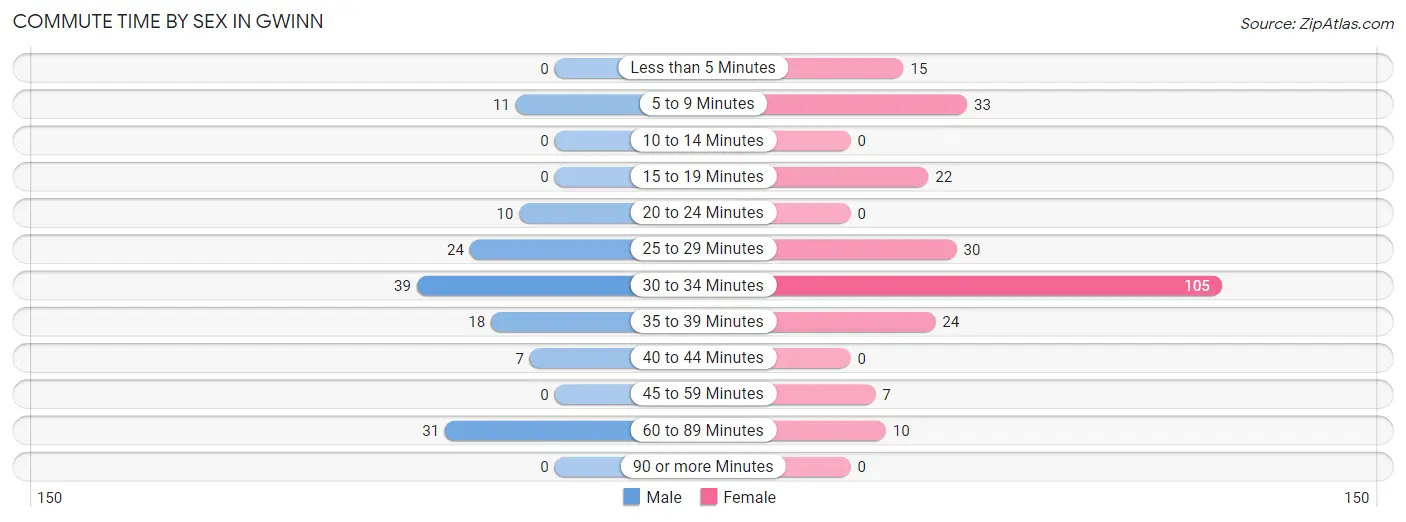
| Commute Time | Male | Female |
| Less than 5 Minutes | 0 (0.0%) | 15 (6.1%) |
| 5 to 9 Minutes | 11 (7.9%) | 33 (13.4%) |
| 10 to 14 Minutes | 0 (0.0%) | 0 (0.0%) |
| 15 to 19 Minutes | 0 (0.0%) | 22 (8.9%) |
| 20 to 24 Minutes | 10 (7.1%) | 0 (0.0%) |
| 25 to 29 Minutes | 24 (17.1%) | 30 (12.2%) |
| 30 to 34 Minutes | 39 (27.9%) | 105 (42.7%) |
| 35 to 39 Minutes | 18 (12.9%) | 24 (9.8%) |
| 40 to 44 Minutes | 7 (5.0%) | 0 (0.0%) |
| 45 to 59 Minutes | 0 (0.0%) | 7 (2.9%) |
| 60 to 89 Minutes | 31 (22.1%) | 10 (4.1%) |
| 90 or more Minutes | 0 (0.0%) | 0 (0.0%) |
Time of Departure to Work by Sex in Gwinn
The most frequent times of departure to work in Gwinn are 6:00 AM to 6:29 AM (34, 24.3%) for males and 12:00 PM to 3:59 PM (63, 25.6%) for females.
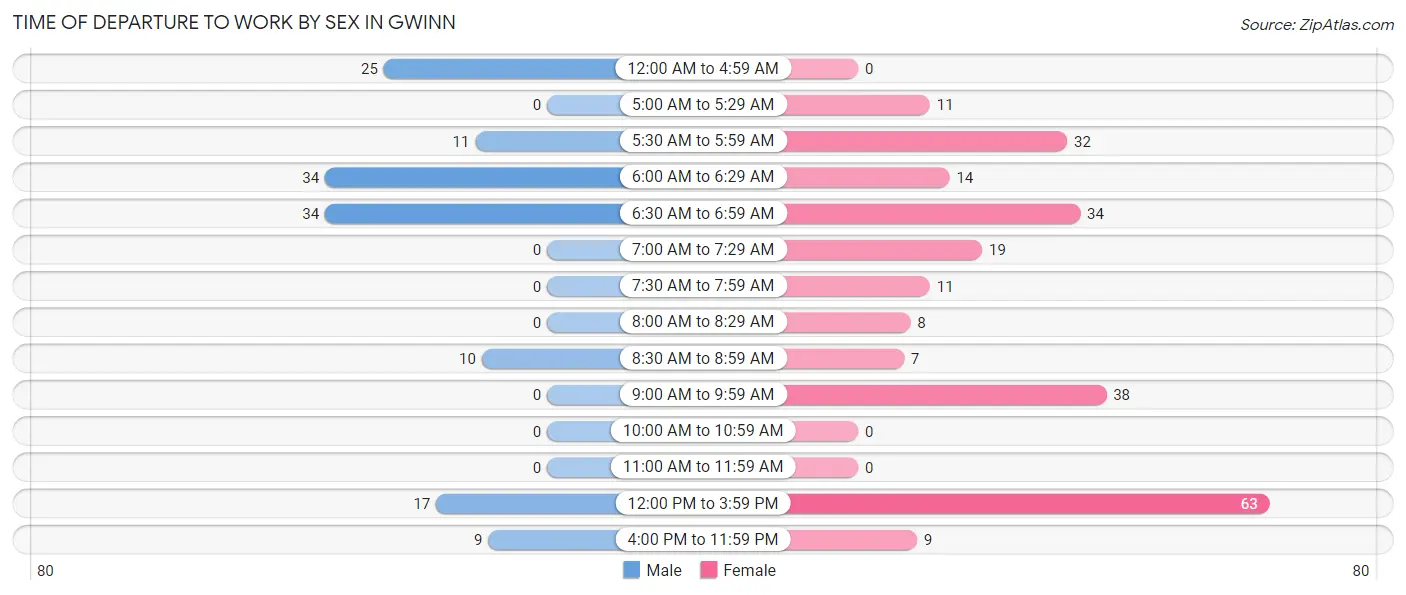
| Time of Departure | Male | Female |
| 12:00 AM to 4:59 AM | 25 (17.9%) | 0 (0.0%) |
| 5:00 AM to 5:29 AM | 0 (0.0%) | 11 (4.5%) |
| 5:30 AM to 5:59 AM | 11 (7.9%) | 32 (13.0%) |
| 6:00 AM to 6:29 AM | 34 (24.3%) | 14 (5.7%) |
| 6:30 AM to 6:59 AM | 34 (24.3%) | 34 (13.8%) |
| 7:00 AM to 7:29 AM | 0 (0.0%) | 19 (7.7%) |
| 7:30 AM to 7:59 AM | 0 (0.0%) | 11 (4.5%) |
| 8:00 AM to 8:29 AM | 0 (0.0%) | 8 (3.3%) |
| 8:30 AM to 8:59 AM | 10 (7.1%) | 7 (2.9%) |
| 9:00 AM to 9:59 AM | 0 (0.0%) | 38 (15.4%) |
| 10:00 AM to 10:59 AM | 0 (0.0%) | 0 (0.0%) |
| 11:00 AM to 11:59 AM | 0 (0.0%) | 0 (0.0%) |
| 12:00 PM to 3:59 PM | 17 (12.1%) | 63 (25.6%) |
| 4:00 PM to 11:59 PM | 9 (6.4%) | 9 (3.7%) |
| Total | 140 (100.0%) | 246 (100.0%) |
Housing Occupancy in Gwinn
Occupancy by Ownership in Gwinn
Of the total 594 dwellings in Gwinn, owner-occupied units account for 486 (81.8%), while renter-occupied units make up 108 (18.2%).
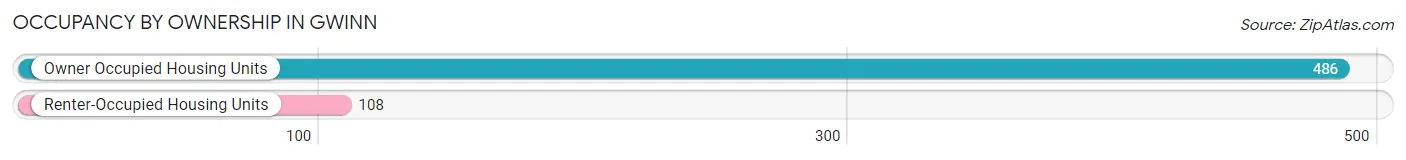
| Occupancy | # Housing Units | % Housing Units |
| Owner Occupied Housing Units | 486 | 81.8% |
| Renter-Occupied Housing Units | 108 | 18.2% |
| Total Occupied Housing Units | 594 | 100.0% |
Occupancy by Household Size in Gwinn
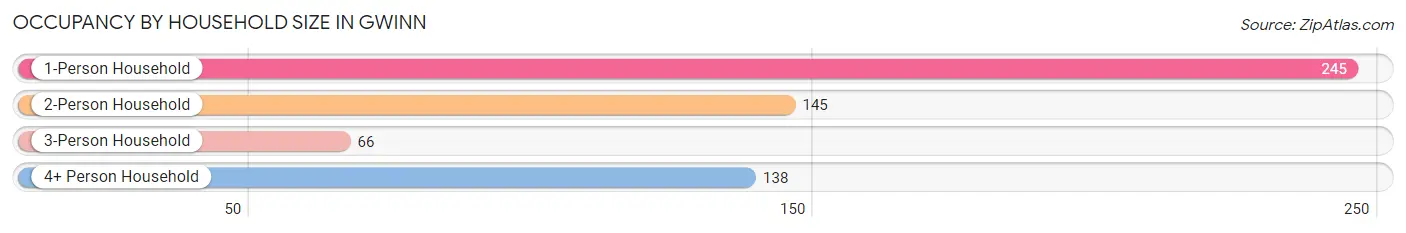
| Household Size | # Housing Units | % Housing Units |
| 1-Person Household | 245 | 41.2% |
| 2-Person Household | 145 | 24.4% |
| 3-Person Household | 66 | 11.1% |
| 4+ Person Household | 138 | 23.2% |
| Total Housing Units | 594 | 100.0% |
Occupancy by Ownership by Household Size in Gwinn
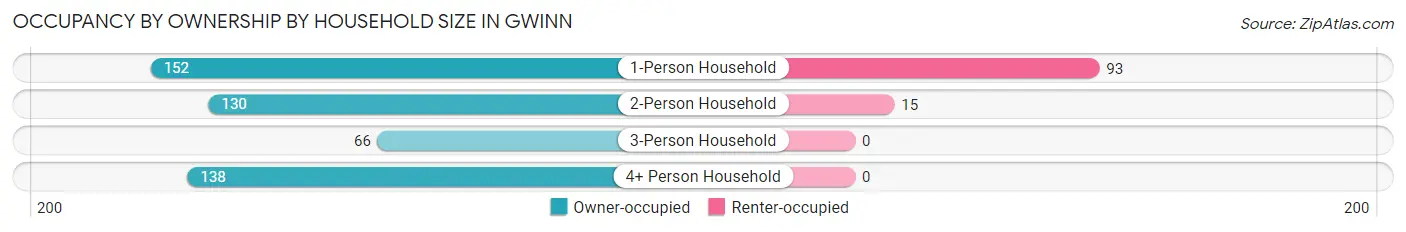
| Household Size | Owner-occupied | Renter-occupied |
| 1-Person Household | 152 (62.0%) | 93 (38.0%) |
| 2-Person Household | 130 (89.7%) | 15 (10.3%) |
| 3-Person Household | 66 (100.0%) | 0 (0.0%) |
| 4+ Person Household | 138 (100.0%) | 0 (0.0%) |
| Total Housing Units | 486 (81.8%) | 108 (18.2%) |
Occupancy by Educational Attainment in Gwinn
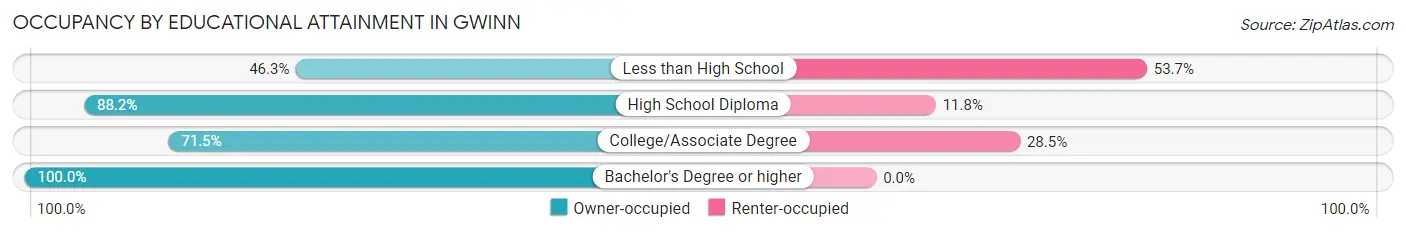
| Household Size | Owner-occupied | Renter-occupied |
| Less than High School | 19 (46.3%) | 22 (53.7%) |
| High School Diploma | 127 (88.2%) | 17 (11.8%) |
| College/Associate Degree | 173 (71.5%) | 69 (28.5%) |
| Bachelor's Degree or higher | 167 (100.0%) | 0 (0.0%) |
Occupancy by Age of Householder in Gwinn
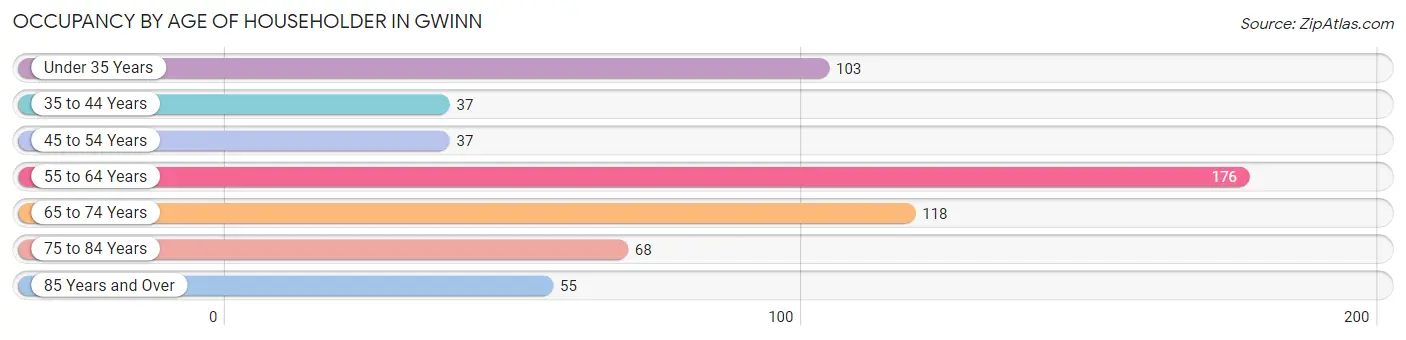
| Age Bracket | # Households | % Households |
| Under 35 Years | 103 | 17.3% |
| 35 to 44 Years | 37 | 6.2% |
| 45 to 54 Years | 37 | 6.2% |
| 55 to 64 Years | 176 | 29.6% |
| 65 to 74 Years | 118 | 19.9% |
| 75 to 84 Years | 68 | 11.5% |
| 85 Years and Over | 55 | 9.3% |
| Total | 594 | 100.0% |
Housing Finances in Gwinn
Median Income by Occupancy in Gwinn
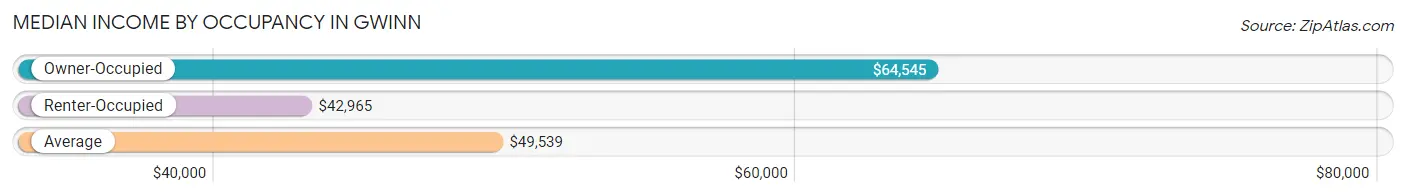
| Occupancy Type | # Households | Median Income |
| Owner-Occupied | 486 (81.8%) | $64,545 |
| Renter-Occupied | 108 (18.2%) | $42,965 |
| Average | 594 (100.0%) | $49,539 |
Occupancy by Householder Income Bracket in Gwinn
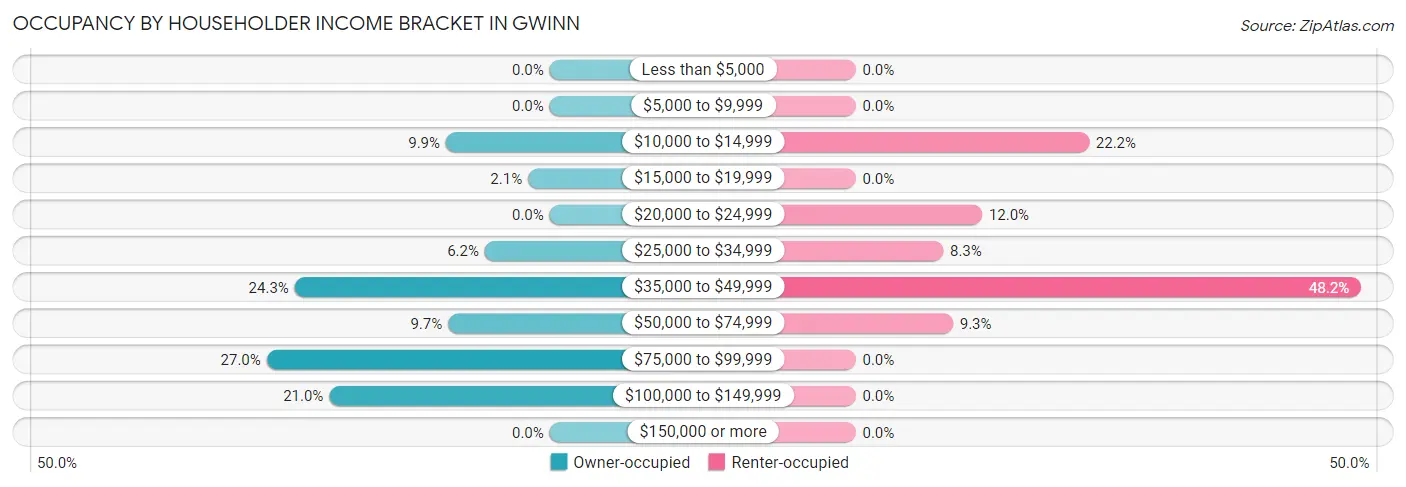
| Income Bracket | Owner-occupied | Renter-occupied |
| Less than $5,000 | 0 (0.0%) | 0 (0.0%) |
| $5,000 to $9,999 | 0 (0.0%) | 0 (0.0%) |
| $10,000 to $14,999 | 48 (9.9%) | 24 (22.2%) |
| $15,000 to $19,999 | 10 (2.1%) | 0 (0.0%) |
| $20,000 to $24,999 | 0 (0.0%) | 13 (12.0%) |
| $25,000 to $34,999 | 30 (6.2%) | 9 (8.3%) |
| $35,000 to $49,999 | 118 (24.3%) | 52 (48.1%) |
| $50,000 to $74,999 | 47 (9.7%) | 10 (9.3%) |
| $75,000 to $99,999 | 131 (27.0%) | 0 (0.0%) |
| $100,000 to $149,999 | 102 (21.0%) | 0 (0.0%) |
| $150,000 or more | 0 (0.0%) | 0 (0.0%) |
| Total | 486 (100.0%) | 108 (100.0%) |
Monthly Housing Cost Tiers in Gwinn
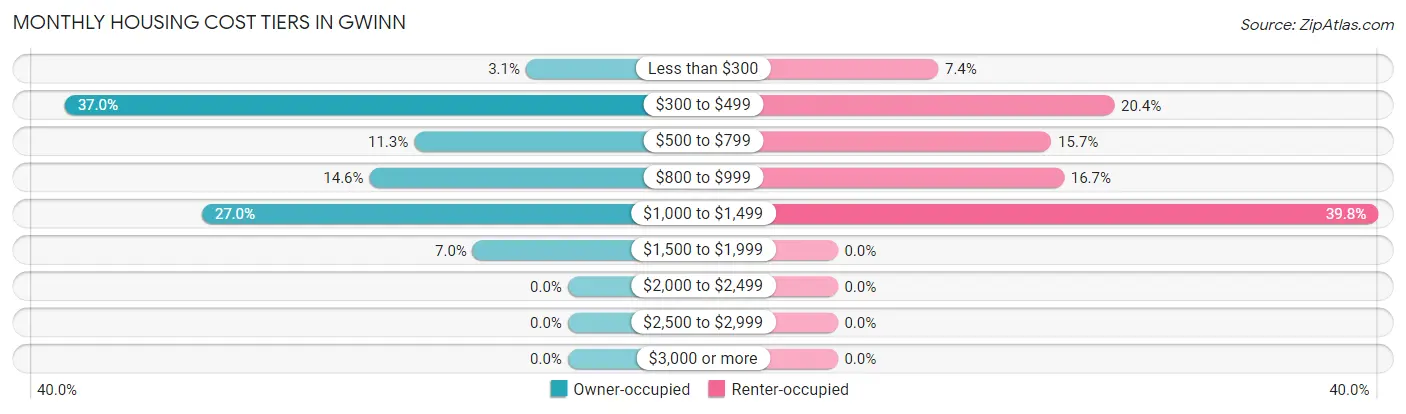
| Monthly Cost | Owner-occupied | Renter-occupied |
| Less than $300 | 15 (3.1%) | 8 (7.4%) |
| $300 to $499 | 180 (37.0%) | 22 (20.4%) |
| $500 to $799 | 55 (11.3%) | 17 (15.7%) |
| $800 to $999 | 71 (14.6%) | 18 (16.7%) |
| $1,000 to $1,499 | 131 (27.0%) | 43 (39.8%) |
| $1,500 to $1,999 | 34 (7.0%) | 0 (0.0%) |
| $2,000 to $2,499 | 0 (0.0%) | 0 (0.0%) |
| $2,500 to $2,999 | 0 (0.0%) | 0 (0.0%) |
| $3,000 or more | 0 (0.0%) | 0 (0.0%) |
| Total | 486 (100.0%) | 108 (100.0%) |
Physical Housing Characteristics in Gwinn
Housing Structures in Gwinn
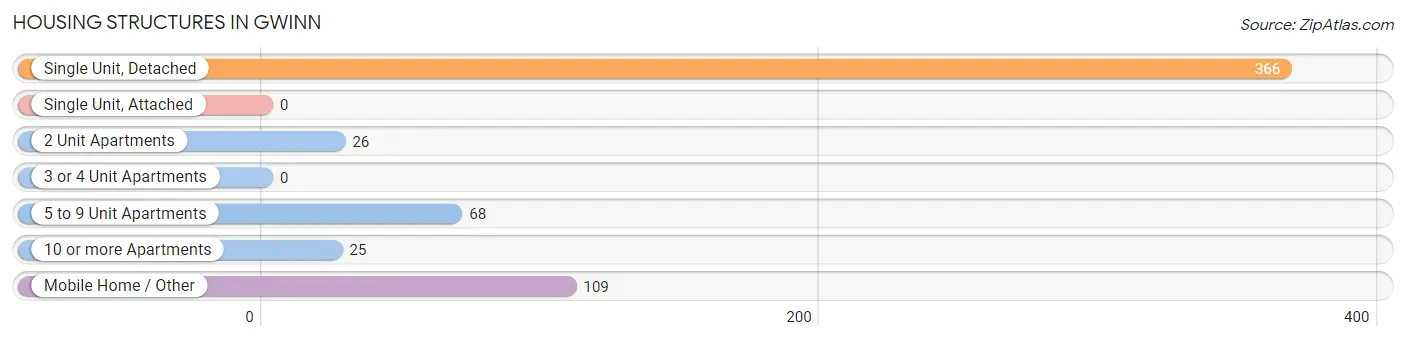
| Structure Type | # Housing Units | % Housing Units |
| Single Unit, Detached | 366 | 61.6% |
| Single Unit, Attached | 0 | 0.0% |
| 2 Unit Apartments | 26 | 4.4% |
| 3 or 4 Unit Apartments | 0 | 0.0% |
| 5 to 9 Unit Apartments | 68 | 11.5% |
| 10 or more Apartments | 25 | 4.2% |
| Mobile Home / Other | 109 | 18.3% |
| Total | 594 | 100.0% |
Housing Structures by Occupancy in Gwinn
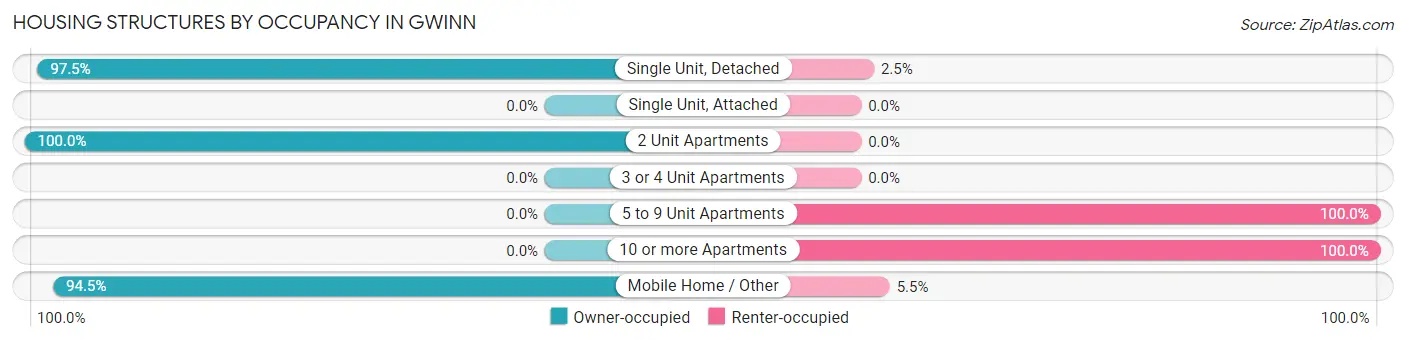
| Structure Type | Owner-occupied | Renter-occupied |
| Single Unit, Detached | 357 (97.5%) | 9 (2.5%) |
| Single Unit, Attached | 0 (0.0%) | 0 (0.0%) |
| 2 Unit Apartments | 26 (100.0%) | 0 (0.0%) |
| 3 or 4 Unit Apartments | 0 (0.0%) | 0 (0.0%) |
| 5 to 9 Unit Apartments | 0 (0.0%) | 68 (100.0%) |
| 10 or more Apartments | 0 (0.0%) | 25 (100.0%) |
| Mobile Home / Other | 103 (94.5%) | 6 (5.5%) |
| Total | 486 (81.8%) | 108 (18.2%) |
Housing Structures by Number of Rooms in Gwinn
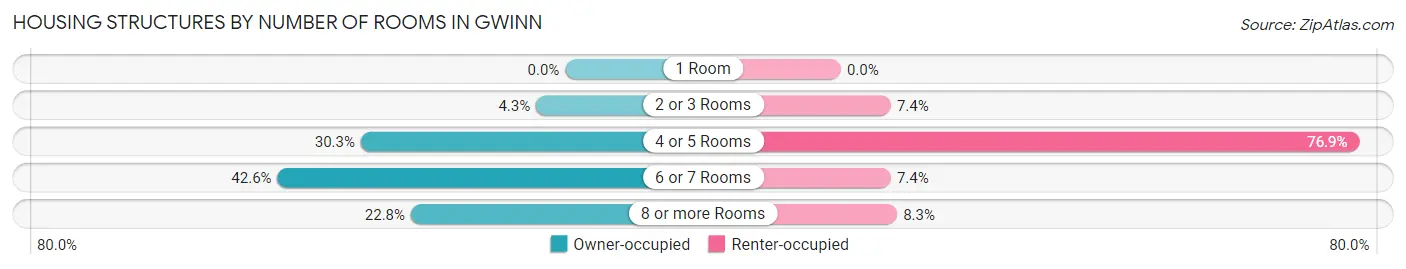
| Number of Rooms | Owner-occupied | Renter-occupied |
| 1 Room | 0 (0.0%) | 0 (0.0%) |
| 2 or 3 Rooms | 21 (4.3%) | 8 (7.4%) |
| 4 or 5 Rooms | 147 (30.2%) | 83 (76.8%) |
| 6 or 7 Rooms | 207 (42.6%) | 8 (7.4%) |
| 8 or more Rooms | 111 (22.8%) | 9 (8.3%) |
| Total | 486 (100.0%) | 108 (100.0%) |
Housing Structure by Heating Type in Gwinn
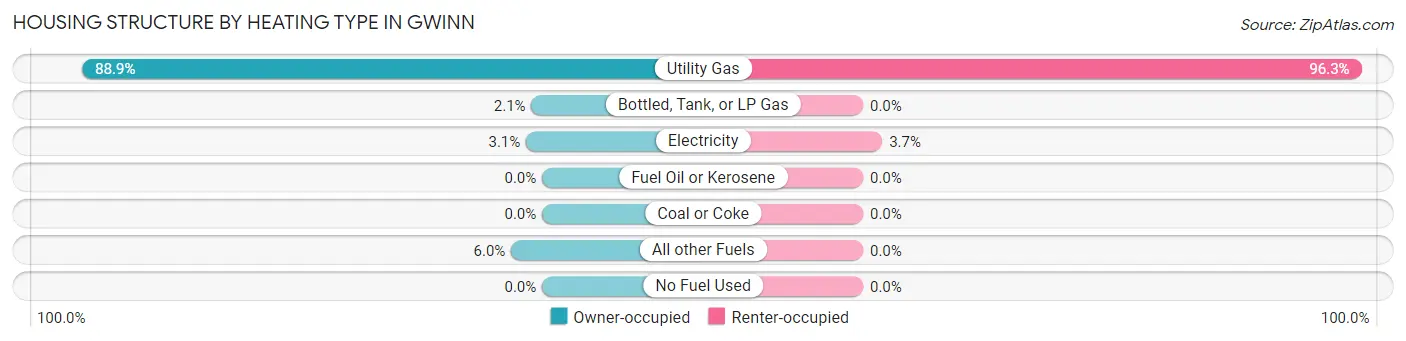
| Heating Type | Owner-occupied | Renter-occupied |
| Utility Gas | 432 (88.9%) | 104 (96.3%) |
| Bottled, Tank, or LP Gas | 10 (2.1%) | 0 (0.0%) |
| Electricity | 15 (3.1%) | 4 (3.7%) |
| Fuel Oil or Kerosene | 0 (0.0%) | 0 (0.0%) |
| Coal or Coke | 0 (0.0%) | 0 (0.0%) |
| All other Fuels | 29 (6.0%) | 0 (0.0%) |
| No Fuel Used | 0 (0.0%) | 0 (0.0%) |
| Total | 486 (100.0%) | 108 (100.0%) |
Household Vehicle Usage in Gwinn
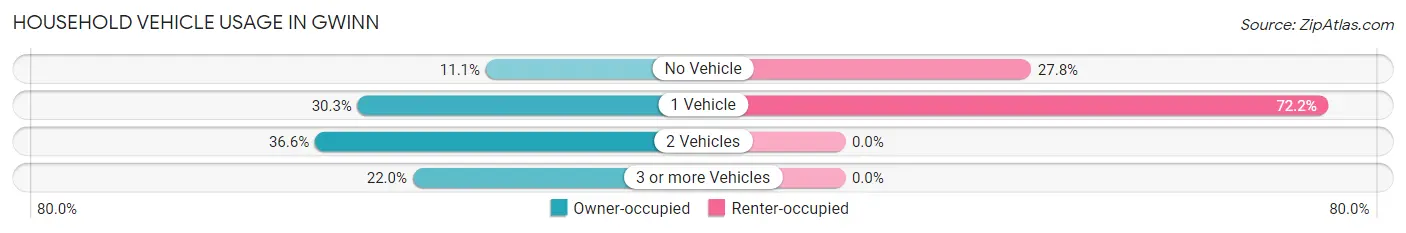
| Vehicles per Household | Owner-occupied | Renter-occupied |
| No Vehicle | 54 (11.1%) | 30 (27.8%) |
| 1 Vehicle | 147 (30.2%) | 78 (72.2%) |
| 2 Vehicles | 178 (36.6%) | 0 (0.0%) |
| 3 or more Vehicles | 107 (22.0%) | 0 (0.0%) |
| Total | 486 (100.0%) | 108 (100.0%) |
Real Estate & Mortgages in Gwinn
Real Estate and Mortgage Overview in Gwinn
| Characteristic | Without Mortgage | With Mortgage |
| Housing Units | 266 | 220 |
| Median Property Value | $68,800 | $131,100 |
| Median Household Income | $44,632 | $0 |
| Monthly Housing Costs | $446 | $0 |
| Real Estate Taxes | $1,127 | $11 |
Property Value by Mortgage Status in Gwinn
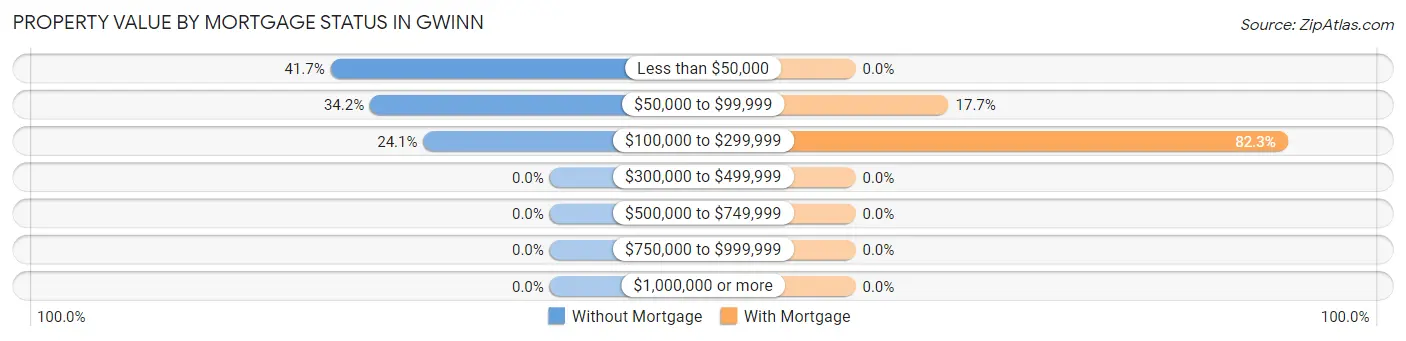
| Property Value | Without Mortgage | With Mortgage |
| Less than $50,000 | 111 (41.7%) | 0 (0.0%) |
| $50,000 to $99,999 | 91 (34.2%) | 39 (17.7%) |
| $100,000 to $299,999 | 64 (24.1%) | 181 (82.3%) |
| $300,000 to $499,999 | 0 (0.0%) | 0 (0.0%) |
| $500,000 to $749,999 | 0 (0.0%) | 0 (0.0%) |
| $750,000 to $999,999 | 0 (0.0%) | 0 (0.0%) |
| $1,000,000 or more | 0 (0.0%) | 0 (0.0%) |
| Total | 266 (100.0%) | 220 (100.0%) |
Household Income by Mortgage Status in Gwinn
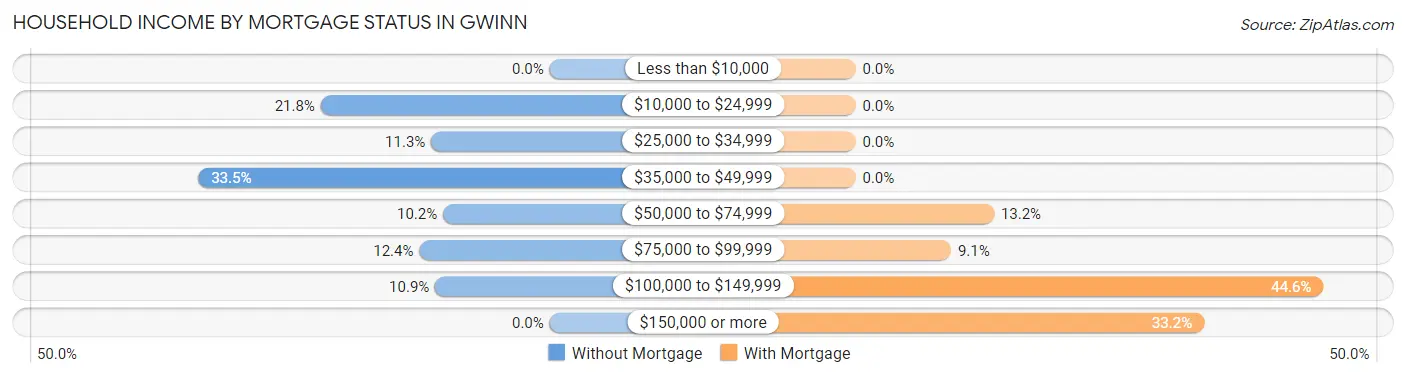
| Household Income | Without Mortgage | With Mortgage |
| Less than $10,000 | 0 (0.0%) | 0 (0.0%) |
| $10,000 to $24,999 | 58 (21.8%) | 0 (0.0%) |
| $25,000 to $34,999 | 30 (11.3%) | 0 (0.0%) |
| $35,000 to $49,999 | 89 (33.5%) | 0 (0.0%) |
| $50,000 to $74,999 | 27 (10.2%) | 29 (13.2%) |
| $75,000 to $99,999 | 33 (12.4%) | 20 (9.1%) |
| $100,000 to $149,999 | 29 (10.9%) | 98 (44.6%) |
| $150,000 or more | 0 (0.0%) | 73 (33.2%) |
| Total | 266 (100.0%) | 220 (100.0%) |
Property Value to Household Income Ratio in Gwinn
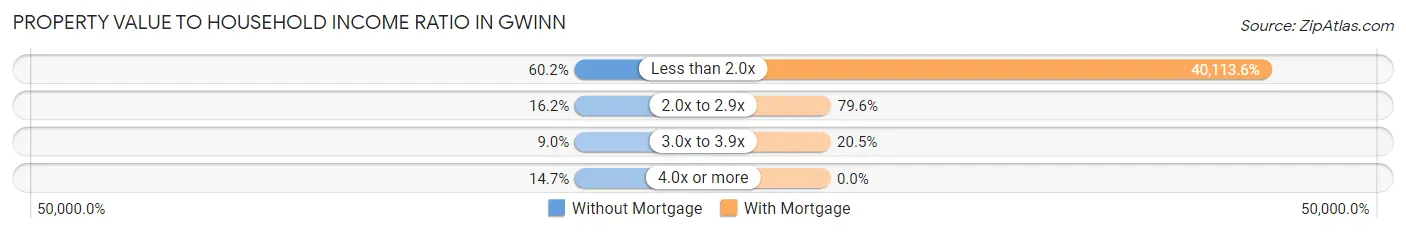
| Value-to-Income Ratio | Without Mortgage | With Mortgage |
| Less than 2.0x | 160 (60.2%) | 88,250 (40,113.6%) |
| 2.0x to 2.9x | 43 (16.2%) | 175 (79.5%) |
| 3.0x to 3.9x | 24 (9.0%) | 45 (20.4%) |
| 4.0x or more | 39 (14.7%) | 0 (0.0%) |
| Total | 266 (100.0%) | 220 (100.0%) |
Real Estate Taxes by Mortgage Status in Gwinn
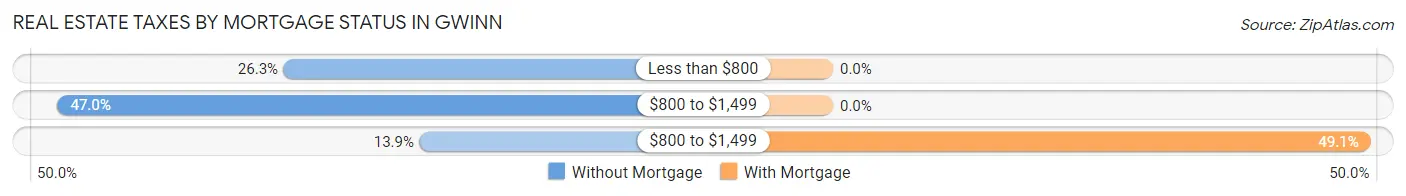
| Property Taxes | Without Mortgage | With Mortgage |
| Less than $800 | 70 (26.3%) | 0 (0.0%) |
| $800 to $1,499 | 125 (47.0%) | 0 (0.0%) |
| $800 to $1,499 | 37 (13.9%) | 108 (49.1%) |
| Total | 266 (100.0%) | 220 (100.0%) |
Health & Disability in Gwinn
Health Insurance Coverage by Age in Gwinn
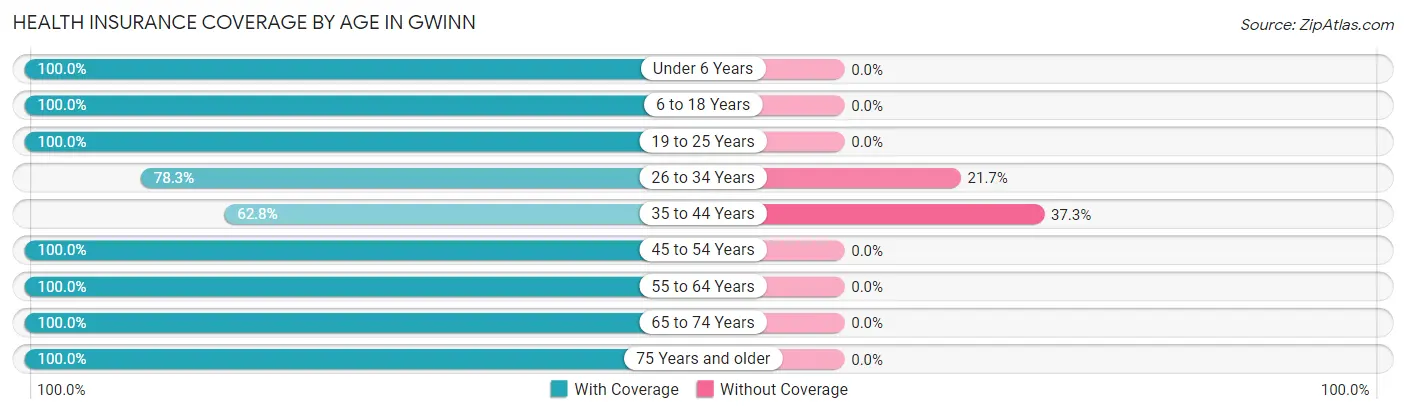
| Age Bracket | With Coverage | Without Coverage |
| Under 6 Years | 102 (100.0%) | 0 (0.0%) |
| 6 to 18 Years | 293 (100.0%) | 0 (0.0%) |
| 19 to 25 Years | 106 (100.0%) | 0 (0.0%) |
| 26 to 34 Years | 65 (78.3%) | 18 (21.7%) |
| 35 to 44 Years | 64 (62.7%) | 38 (37.2%) |
| 45 to 54 Years | 37 (100.0%) | 0 (0.0%) |
| 55 to 64 Years | 307 (100.0%) | 0 (0.0%) |
| 65 to 74 Years | 185 (100.0%) | 0 (0.0%) |
| 75 Years and older | 153 (100.0%) | 0 (0.0%) |
| Total | 1,312 (95.9%) | 56 (4.1%) |
Health Insurance Coverage by Citizenship Status in Gwinn
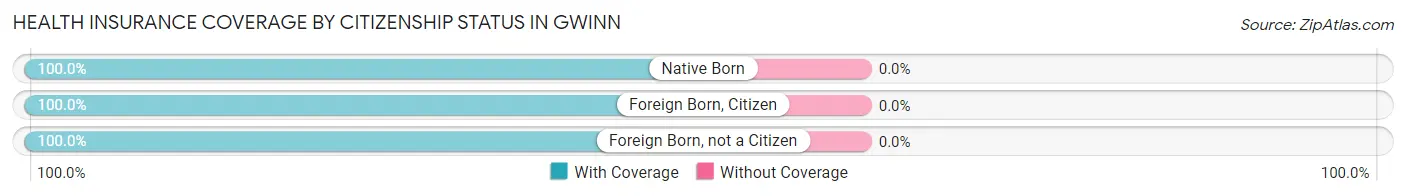
| Citizenship Status | With Coverage | Without Coverage |
| Native Born | 102 (100.0%) | 0 (0.0%) |
| Foreign Born, Citizen | 293 (100.0%) | 0 (0.0%) |
| Foreign Born, not a Citizen | 106 (100.0%) | 0 (0.0%) |
Health Insurance Coverage by Household Income in Gwinn
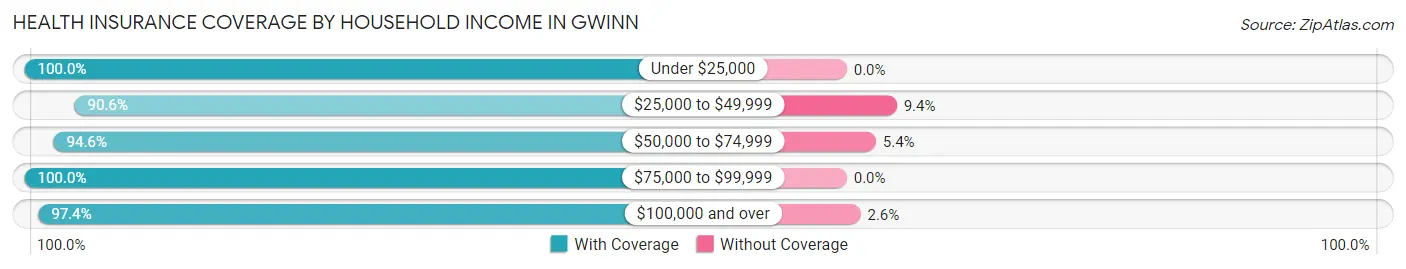
| Household Income | With Coverage | Without Coverage |
| Under $25,000 | 95 (100.0%) | 0 (0.0%) |
| $25,000 to $49,999 | 397 (90.6%) | 41 (9.4%) |
| $50,000 to $74,999 | 139 (94.6%) | 8 (5.4%) |
| $75,000 to $99,999 | 416 (100.0%) | 0 (0.0%) |
| $100,000 and over | 265 (97.4%) | 7 (2.6%) |
Public vs Private Health Insurance Coverage by Age in Gwinn
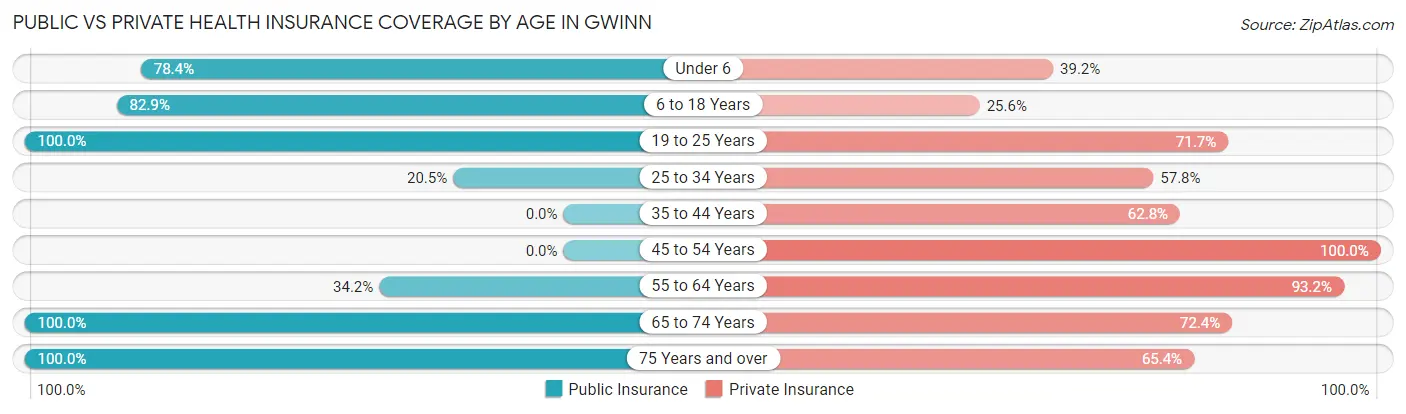
| Age Bracket | Public Insurance | Private Insurance |
| Under 6 | 80 (78.4%) | 40 (39.2%) |
| 6 to 18 Years | 243 (82.9%) | 75 (25.6%) |
| 19 to 25 Years | 106 (100.0%) | 76 (71.7%) |
| 25 to 34 Years | 17 (20.5%) | 48 (57.8%) |
| 35 to 44 Years | 0 (0.0%) | 64 (62.7%) |
| 45 to 54 Years | 0 (0.0%) | 37 (100.0%) |
| 55 to 64 Years | 105 (34.2%) | 286 (93.2%) |
| 65 to 74 Years | 185 (100.0%) | 134 (72.4%) |
| 75 Years and over | 153 (100.0%) | 100 (65.4%) |
| Total | 889 (65.0%) | 860 (62.9%) |
Disability Status by Sex by Age in Gwinn
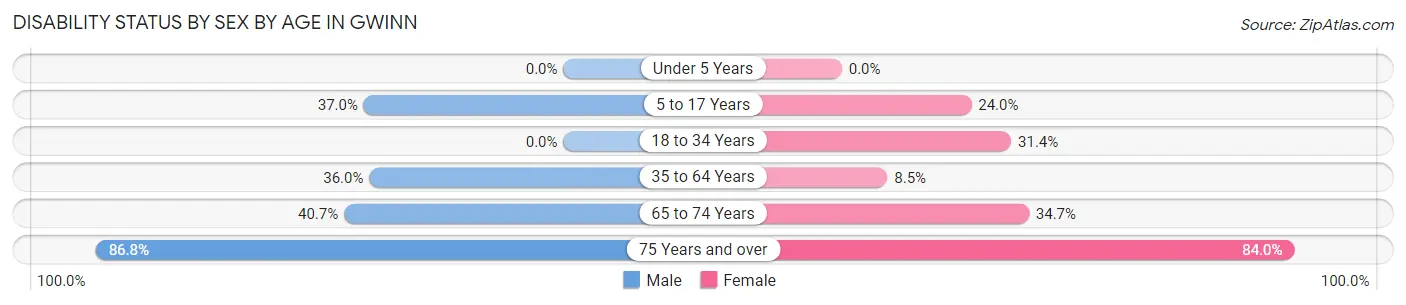
| Age Bracket | Male | Female |
| Under 5 Years | 0 (0.0%) | 0 (0.0%) |
| 5 to 17 Years | 50 (37.0%) | 31 (24.0%) |
| 18 to 34 Years | 0 (0.0%) | 44 (31.4%) |
| 35 to 64 Years | 67 (36.0%) | 22 (8.5%) |
| 65 to 74 Years | 46 (40.7%) | 25 (34.7%) |
| 75 Years and over | 46 (86.8%) | 84 (84.0%) |
Disability Class by Sex by Age in Gwinn
Disability Class: Hearing Difficulty
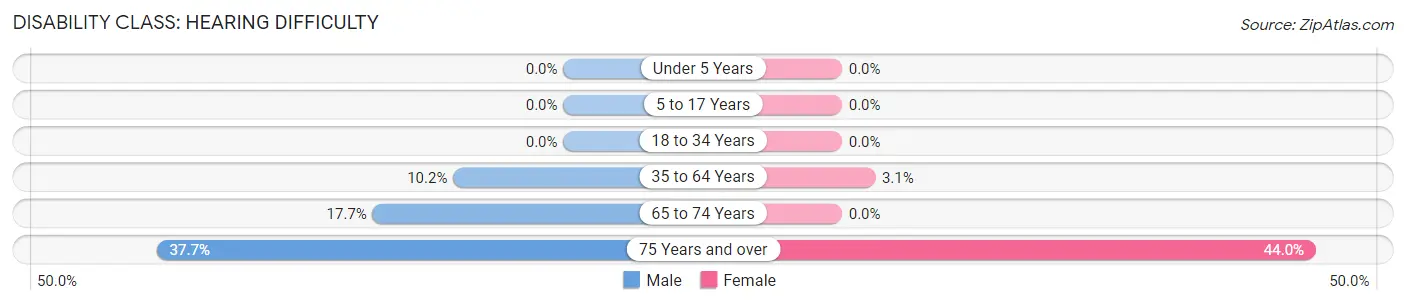
| Age Bracket | Male | Female |
| Under 5 Years | 0 (0.0%) | 0 (0.0%) |
| 5 to 17 Years | 0 (0.0%) | 0 (0.0%) |
| 18 to 34 Years | 0 (0.0%) | 0 (0.0%) |
| 35 to 64 Years | 19 (10.2%) | 8 (3.1%) |
| 65 to 74 Years | 20 (17.7%) | 0 (0.0%) |
| 75 Years and over | 20 (37.7%) | 44 (44.0%) |
Disability Class: Vision Difficulty
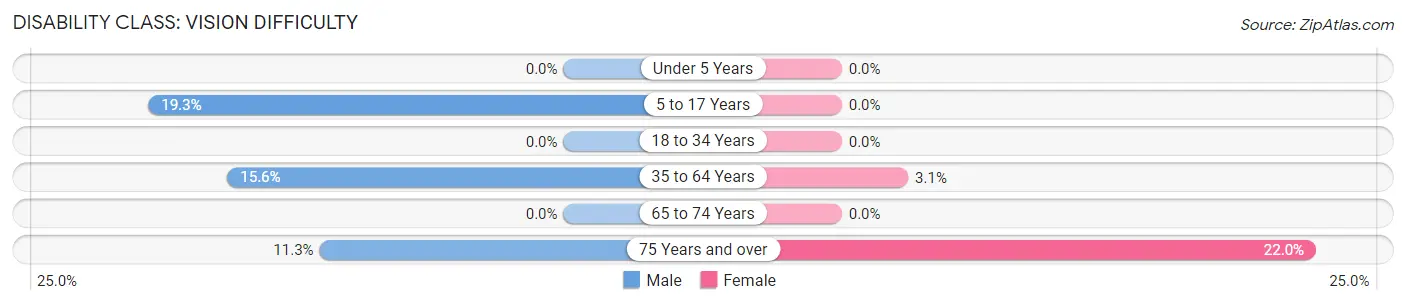
| Age Bracket | Male | Female |
| Under 5 Years | 0 (0.0%) | 0 (0.0%) |
| 5 to 17 Years | 26 (19.3%) | 0 (0.0%) |
| 18 to 34 Years | 0 (0.0%) | 0 (0.0%) |
| 35 to 64 Years | 29 (15.6%) | 8 (3.1%) |
| 65 to 74 Years | 0 (0.0%) | 0 (0.0%) |
| 75 Years and over | 6 (11.3%) | 22 (22.0%) |
Disability Class: Cognitive Difficulty
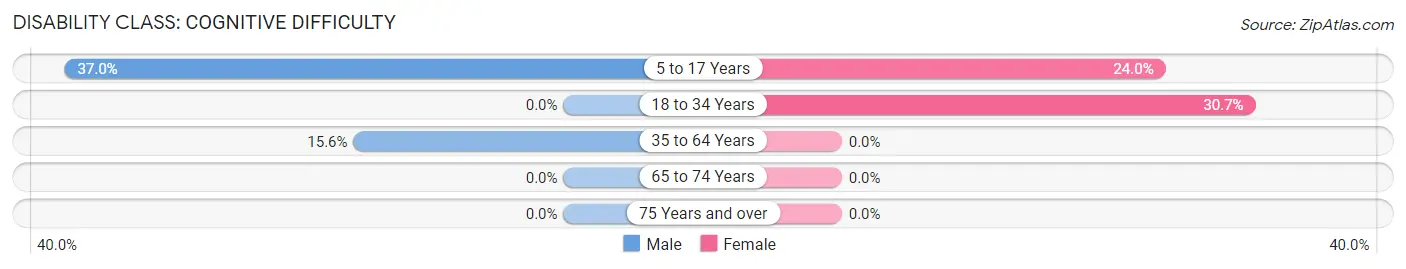
| Age Bracket | Male | Female |
| 5 to 17 Years | 50 (37.0%) | 31 (24.0%) |
| 18 to 34 Years | 0 (0.0%) | 43 (30.7%) |
| 35 to 64 Years | 29 (15.6%) | 0 (0.0%) |
| 65 to 74 Years | 0 (0.0%) | 0 (0.0%) |
| 75 Years and over | 0 (0.0%) | 0 (0.0%) |
Disability Class: Ambulatory Difficulty
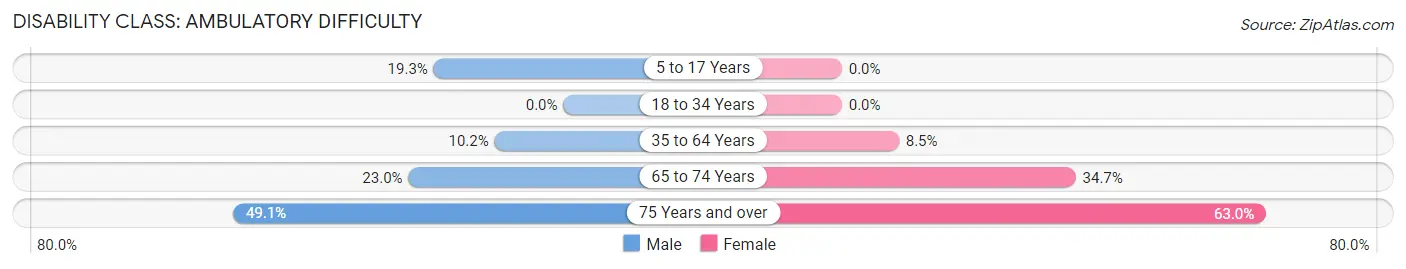
| Age Bracket | Male | Female |
| 5 to 17 Years | 26 (19.3%) | 0 (0.0%) |
| 18 to 34 Years | 0 (0.0%) | 0 (0.0%) |
| 35 to 64 Years | 19 (10.2%) | 22 (8.5%) |
| 65 to 74 Years | 26 (23.0%) | 25 (34.7%) |
| 75 Years and over | 26 (49.1%) | 63 (63.0%) |
Disability Class: Self-Care Difficulty
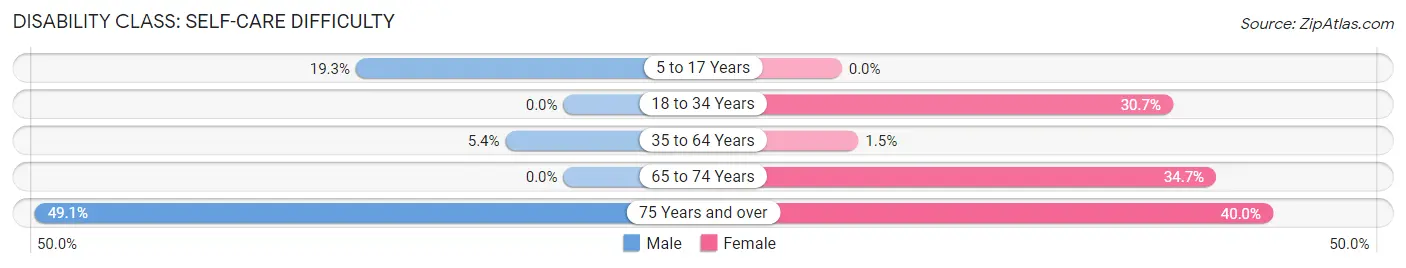
| Age Bracket | Male | Female |
| 5 to 17 Years | 26 (19.3%) | 0 (0.0%) |
| 18 to 34 Years | 0 (0.0%) | 43 (30.7%) |
| 35 to 64 Years | 10 (5.4%) | 4 (1.5%) |
| 65 to 74 Years | 0 (0.0%) | 25 (34.7%) |
| 75 Years and over | 26 (49.1%) | 40 (40.0%) |
Technology Access in Gwinn
Computing Device Access in Gwinn
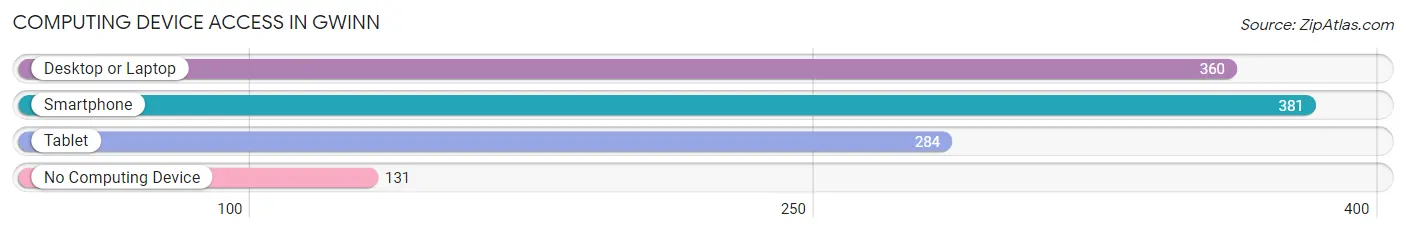
| Device Type | # Households | % Households |
| Desktop or Laptop | 360 | 60.6% |
| Smartphone | 381 | 64.1% |
| Tablet | 284 | 47.8% |
| No Computing Device | 131 | 22.1% |
| Total | 594 | 100.0% |
Internet Access in Gwinn
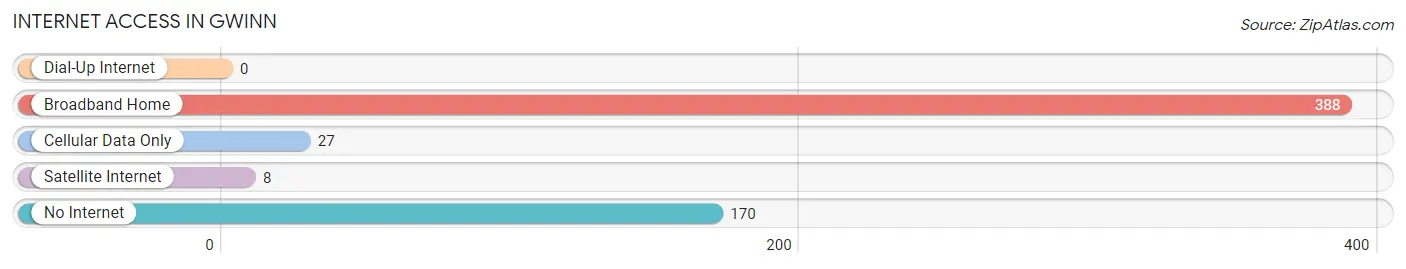
| Internet Type | # Households | % Households |
| Dial-Up Internet | 0 | 0.0% |
| Broadband Home | 388 | 65.3% |
| Cellular Data Only | 27 | 4.5% |
| Satellite Internet | 8 | 1.3% |
| No Internet | 170 | 28.6% |
| Total | 594 | 100.0% |
Gwinn Summary
Gwinn is a small unincorporated community located in the Upper Peninsula of Michigan, in Marquette County. It is situated on the northern shore of Lake Superior, about 20 miles west of Marquette. The population of Gwinn was 1,845 at the 2010 census.
History
Gwinn was first settled in the late 1800s by Finnish immigrants. The town was named after John Gwinn, a lumberman who owned a sawmill in the area. The town was incorporated in 1891 and was home to a variety of businesses, including a hotel, a general store, a blacksmith shop, and a post office.
In the early 1900s, Gwinn was a thriving lumber town. The town was home to several sawmills, a planing mill, and a shingle mill. The lumber industry was the main source of employment for the town’s residents.
In the 1920s, the lumber industry began to decline and the town’s population began to decline as well. The Great Depression further exacerbated the decline of the town. In the 1940s, the town’s population had dropped to just over 500.
In the 1950s, the town began to experience a resurgence. The town was home to a variety of businesses, including a grocery store, a hardware store, a gas station, and a restaurant. The town also had a movie theater and a bowling alley.
In the 1960s, the town experienced a period of growth. The population increased to over 1,000 and the town was home to a variety of businesses, including a bank, a library, a hospital, and a school.
Geography
Gwinn is located in the Upper Peninsula of Michigan, in Marquette County. It is situated on the northern shore of Lake Superior, about 20 miles west of Marquette. The town is surrounded by forests and is home to a variety of wildlife, including deer, bear, and moose.
Economy
The economy of Gwinn is largely based on tourism. The town is home to a variety of attractions, including the Gwinn Historical Museum, the Gwinn Nature Center, and the Gwinn Logging Museum. The town is also home to a variety of outdoor activities, including fishing, hunting, and camping.
The town is also home to a variety of businesses, including restaurants, retail stores, and lodging. The town is also home to a variety of manufacturing businesses, including a furniture factory and a paper mill.
Demographics
As of the 2010 census, the population of Gwinn was 1,845. The racial makeup of the town was 97.3% White, 0.3% African American, 0.2% Native American, 0.2% Asian, 0.1% Pacific Islander, 0.7% from other races, and 1.2% from two or more races. Hispanic or Latino of any race were 1.7% of the population.
The median income for a household in Gwinn was $37,917, and the median income for a family was $45,000. The per capita income for the town was $19,945. About 11.2% of families and 14.3% of the population were below the poverty line, including 19.2% of those under age 18 and 8.3% of those age 65 or over.
Common Questions
What is Per Capita Income in Gwinn?
Per Capita income in Gwinn is $27,115.
What is the Median Family Income in Gwinn?
Median Family Income in Gwinn is $82,784.
What is the Median Household income in Gwinn?
Median Household Income in Gwinn is $49,539.
What is Income or Wage Gap in Gwinn?
Income or Wage Gap in Gwinn is 37.7%.
Women in Gwinn earn 62.3 cents for every dollar earned by a man.
What is Inequality or Gini Index in Gwinn?
Inequality or Gini Index in Gwinn is 0.33.
What is the Total Population of Gwinn?
Total Population of Gwinn is 1,370.
What is the Total Male Population of Gwinn?
Total Male Population of Gwinn is 599.
What is the Total Female Population of Gwinn?
Total Female Population of Gwinn is 771.
What is the Ratio of Males per 100 Females in Gwinn?
There are 77.69 Males per 100 Females in Gwinn.
What is the Ratio of Females per 100 Males in Gwinn?
There are 128.71 Females per 100 Males in Gwinn.
What is the Median Population Age in Gwinn?
Median Population Age in Gwinn is 42.0 Years.
What is the Average Family Size in Gwinn
Average Family Size in Gwinn is 3.1 People.
What is the Average Household Size in Gwinn
Average Household Size in Gwinn is 2.3 People.
How Large is the Labor Force in Gwinn?
There are 481 People in the Labor Forcein in Gwinn.
What is the Percentage of People in the Labor Force in Gwinn?
45.5% of People are in the Labor Force in Gwinn.
What is the Unemployment Rate in Gwinn?
Unemployment Rate in Gwinn is 3.7%.