Zip Codes with the Highest Percentage of Population Employed in Security & Protection in Muskegon, MI
RELATED REPORTS & OPTIONS
Security & Protection
Muskegon
Compare Zip Codes
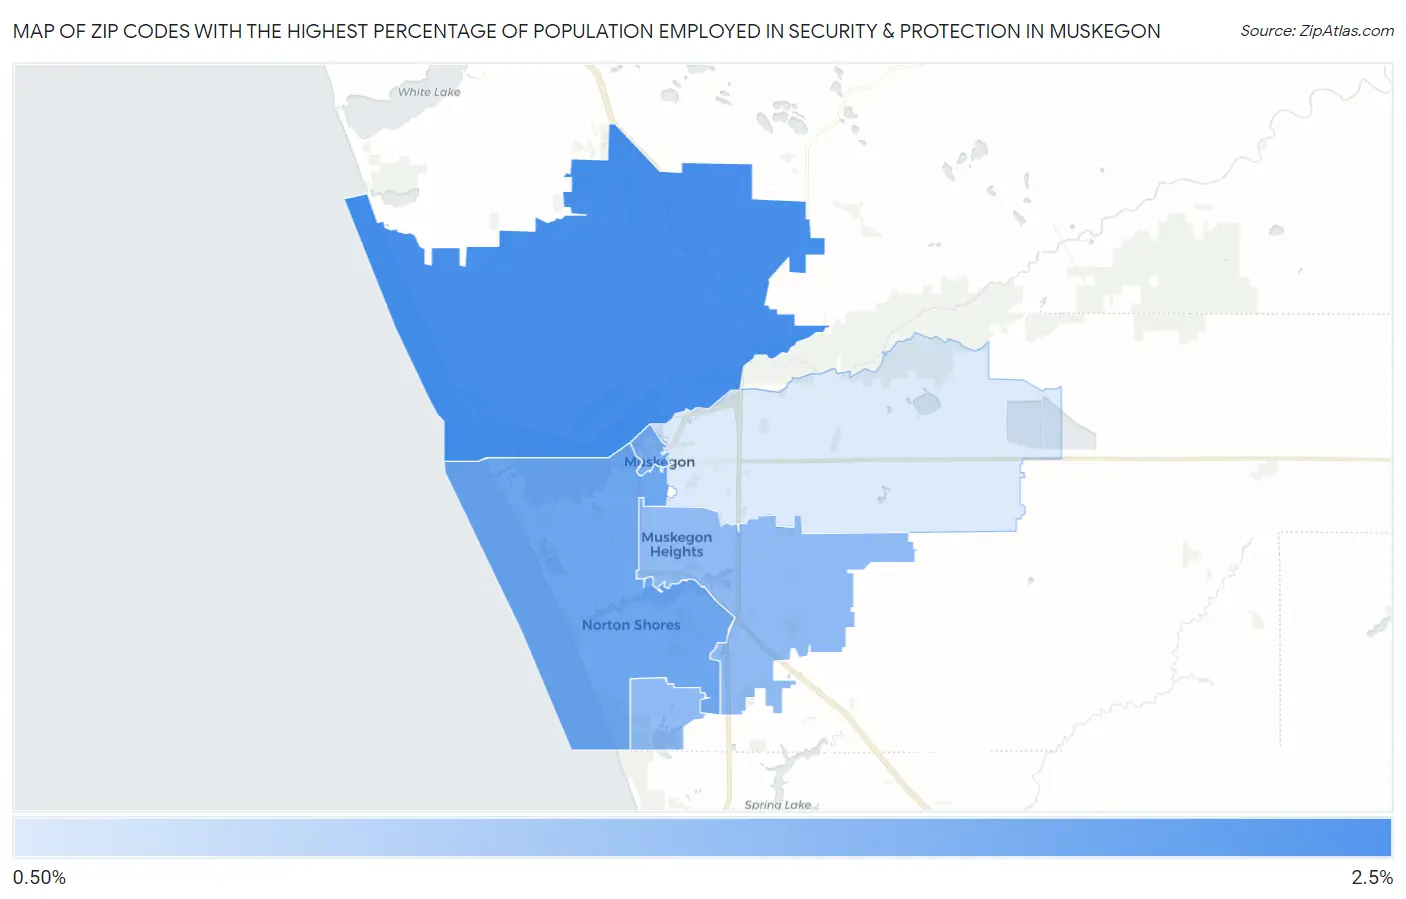
Map of Zip Codes with the Highest Percentage of Population Employed in Security & Protection in Muskegon
0.90%
2.2%
Zip Codes with the Highest Percentage of Population Employed in Security & Protection in Muskegon, MI
| Zip Code | % Employed | vs State | vs National | |
| 1. | 49445 | 2.2% | 1.6%(+0.575)#240 | 2.1%(+0.069)#11,151 |
| 2. | 49441 | 1.9% | 1.6%(+0.235)#328 | 2.1%(-0.271)#13,392 |
| 3. | 49440 | 1.8% | 1.6%(+0.155)#351 | 2.1%(-0.352)#13,976 |
| 4. | 49444 | 1.6% | 1.6%(-0.054)#422 | 2.1%(-0.561)#15,499 |
| 5. | 49442 | 0.90% | 1.6%(-0.738)#652 | 2.1%(-1.24)#20,767 |
1
Common Questions
What are the Top 3 Zip Codes with the Highest Percentage of Population Employed in Security & Protection in Muskegon, MI?
Top 3 Zip Codes with the Highest Percentage of Population Employed in Security & Protection in Muskegon, MI are:
What zip code has the Highest Percentage of Population Employed in Security & Protection in Muskegon, MI?
49445 has the Highest Percentage of Population Employed in Security & Protection in Muskegon, MI with 2.2%.
What is the Percentage of Population Employed in Security & Protection in Muskegon, MI?
Percentage of Population Employed in Security & Protection in Muskegon is 1.2%.
What is the Percentage of Population Employed in Security & Protection in Michigan?
Percentage of Population Employed in Security & Protection in Michigan is 1.6%.
What is the Percentage of Population Employed in Security & Protection in the United States?
Percentage of Population Employed in Security & Protection in the United States is 2.1%.