Zip Codes with the Highest Percentage of Population Employed in Security & Protection in Midland, MI
RELATED REPORTS & OPTIONS
Security & Protection
Midland
Compare Zip Codes
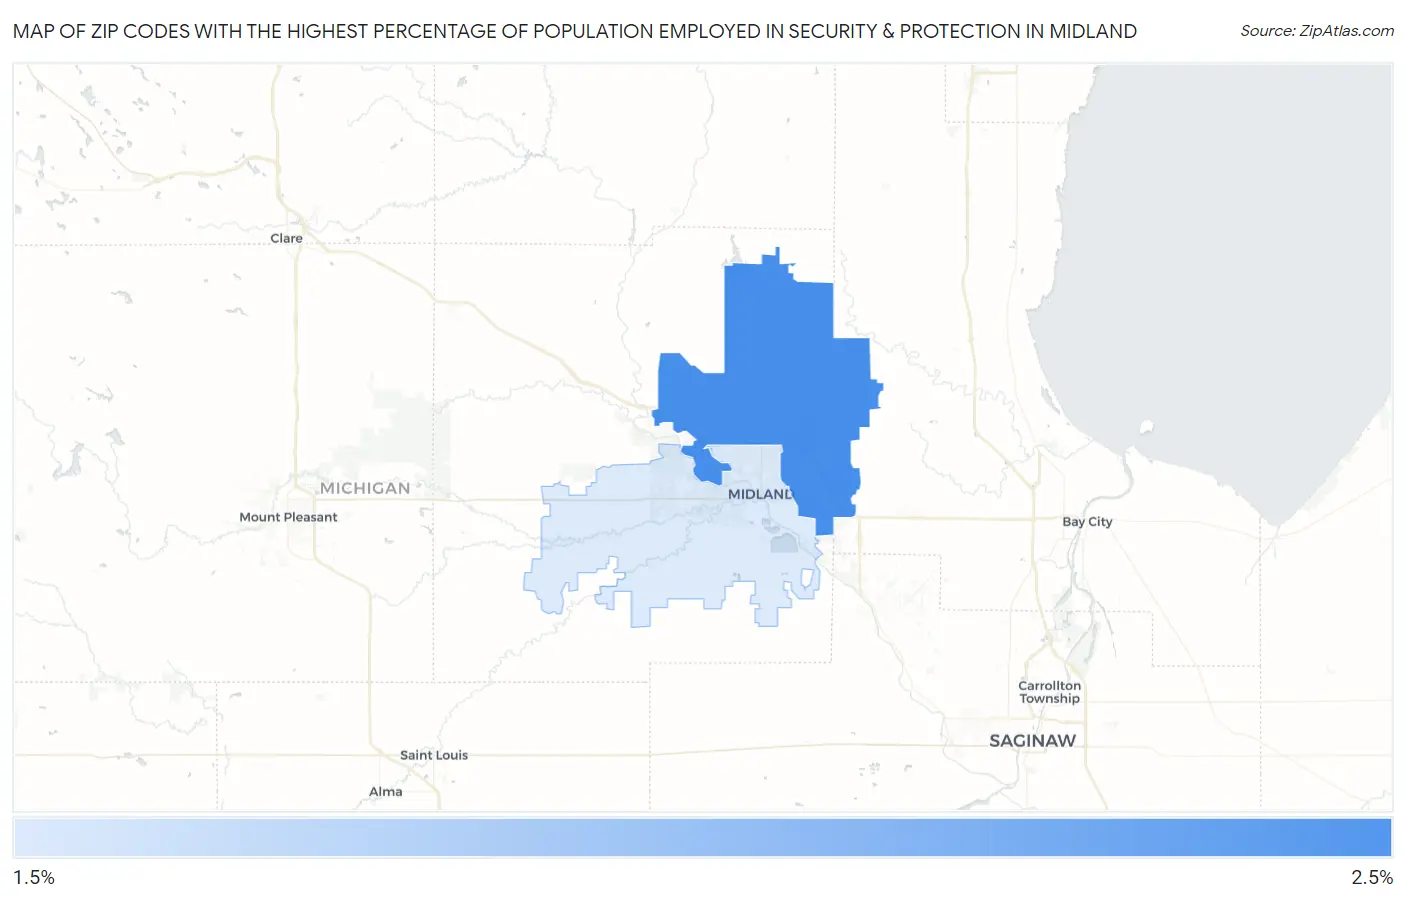
Map of Zip Codes with the Highest Percentage of Population Employed in Security & Protection in Midland
2.0%
2.1%
Zip Codes with the Highest Percentage of Population Employed in Security & Protection in Midland, MI
| Zip Code | % Employed | vs State | vs National | |
| 1. | 48642 | 2.1% | 1.6%(+0.445)#272 | 2.1%(-0.061)#11,998 |
| 2. | 48640 | 2.0% | 1.6%(+0.313)#301 | 2.1%(-0.193)#12,857 |
1
Common Questions
What are the Top Zip Codes with the Highest Percentage of Population Employed in Security & Protection in Midland, MI?
Top Zip Codes with the Highest Percentage of Population Employed in Security & Protection in Midland, MI are:
What zip code has the Highest Percentage of Population Employed in Security & Protection in Midland, MI?
48642 has the Highest Percentage of Population Employed in Security & Protection in Midland, MI with 2.1%.
What is the Percentage of Population Employed in Security & Protection in Midland, MI?
Percentage of Population Employed in Security & Protection in Midland is 2.3%.
What is the Percentage of Population Employed in Security & Protection in Michigan?
Percentage of Population Employed in Security & Protection in Michigan is 1.6%.
What is the Percentage of Population Employed in Security & Protection in the United States?
Percentage of Population Employed in Security & Protection in the United States is 2.1%.