Baraga, MI Map & Demographics
Baraga Map
Baraga Overview
$13,066
PER CAPITA INCOME
$55,313
AVG FAMILY INCOME
$32,569
AVG HOUSEHOLD INCOME
6.1%
WAGE / INCOME GAP [ % ]
93.9¢/ $1
WAGE / INCOME GAP [ $ ]
0.46
INEQUALITY / GINI INDEX
2,020
TOTAL POPULATION
1,417
MALE POPULATION
603
FEMALE POPULATION
234.99
MALES / 100 FEMALES
42.55
FEMALES / 100 MALES
35.7
MEDIAN AGE
2.8
AVG FAMILY SIZE
2.0
AVG HOUSEHOLD SIZE
451
LABOR FORCE [ PEOPLE ]
25.3%
PERCENT IN LABOR FORCE
4.4%
UNEMPLOYMENT RATE
Baraga Zip Codes
Baraga Area Codes
Income in Baraga
Income Overview in Baraga
Per Capita Income in Baraga is $13,066, while median incomes of families and households are $55,313 and $32,569 respectively.
| Characteristic | Number | Measure |
| Per Capita Income | 2,020 | $13,066 |
| Median Family Income | 259 | $55,313 |
| Mean Family Income | 259 | $61,545 |
| Median Household Income | 563 | $32,569 |
| Mean Household Income | 563 | $44,948 |
| Income Deficit | 259 | $0 |
| Wage / Income Gap (%) | 2,020 | 6.05% |
| Wage / Income Gap ($) | 2,020 | 93.95¢ per $1 |
| Gini / Inequality Index | 2,020 | 0.46 |
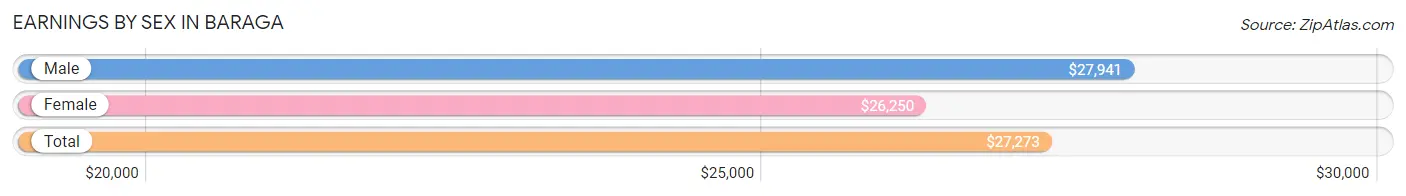
Earnings by Sex in Baraga
Average Earnings in Baraga are $27,273, $27,941 for men and $26,250 for women, a difference of 6.0%.
| Sex | Number | Average Earnings |
| Male | 228 (45.6%) | $27,941 |
| Female | 272 (54.4%) | $26,250 |
| Total | 500 (100.0%) | $27,273 |
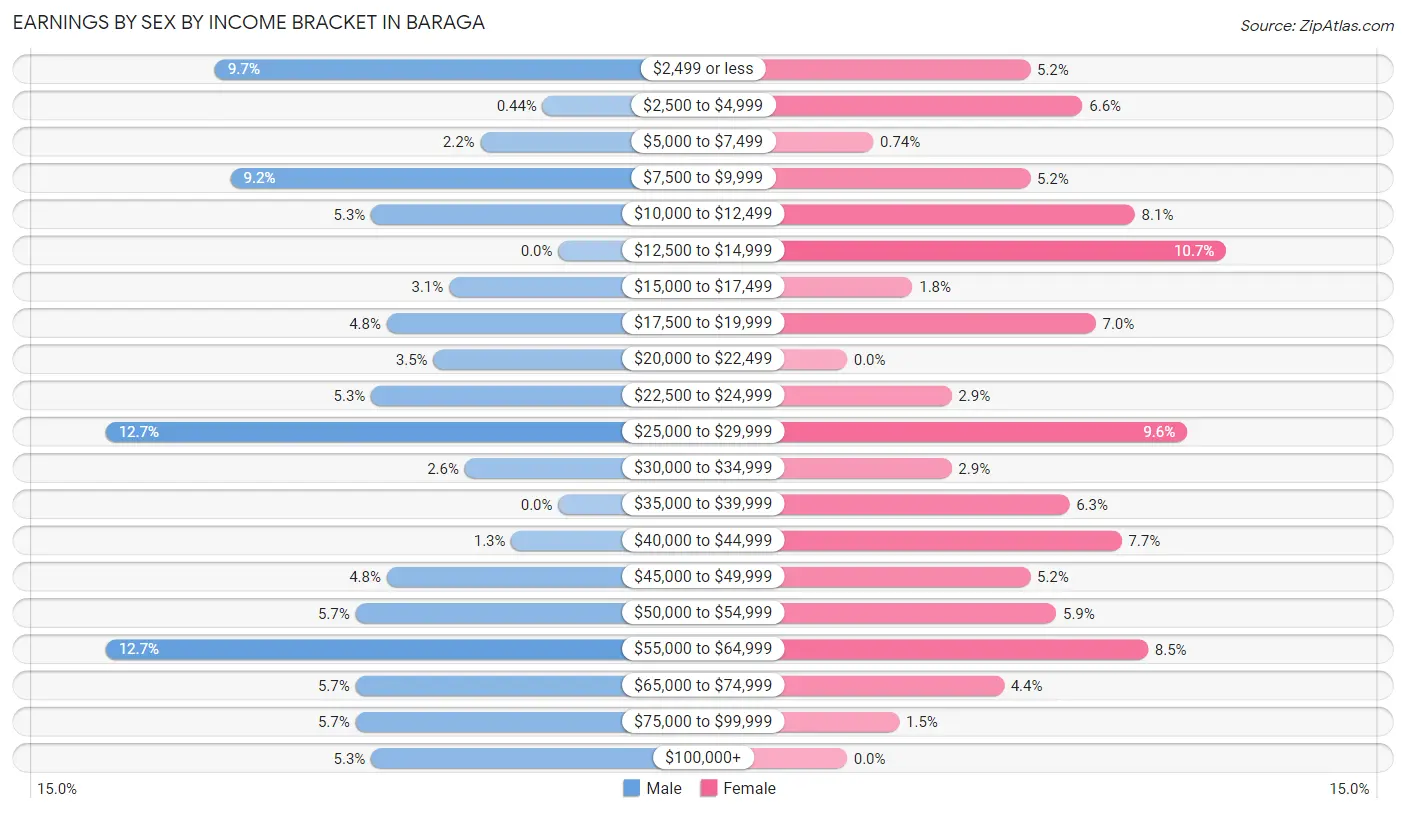
Earnings by Sex by Income Bracket in Baraga
The most common earnings brackets in Baraga are $25,000 to $29,999 for men (29 | 12.7%) and $12,500 to $14,999 for women (29 | 10.7%).
| Income | Male | Female |
| $2,499 or less | 22 (9.7%) | 14 (5.1%) |
| $2,500 to $4,999 | 1 (0.4%) | 18 (6.6%) |
| $5,000 to $7,499 | 5 (2.2%) | 2 (0.7%) |
| $7,500 to $9,999 | 21 (9.2%) | 14 (5.1%) |
| $10,000 to $12,499 | 12 (5.3%) | 22 (8.1%) |
| $12,500 to $14,999 | 0 (0.0%) | 29 (10.7%) |
| $15,000 to $17,499 | 7 (3.1%) | 5 (1.8%) |
| $17,500 to $19,999 | 11 (4.8%) | 19 (7.0%) |
| $20,000 to $22,499 | 8 (3.5%) | 0 (0.0%) |
| $22,500 to $24,999 | 12 (5.3%) | 8 (2.9%) |
| $25,000 to $29,999 | 29 (12.7%) | 26 (9.6%) |
| $30,000 to $34,999 | 6 (2.6%) | 8 (2.9%) |
| $35,000 to $39,999 | 0 (0.0%) | 17 (6.2%) |
| $40,000 to $44,999 | 3 (1.3%) | 21 (7.7%) |
| $45,000 to $49,999 | 11 (4.8%) | 14 (5.1%) |
| $50,000 to $54,999 | 13 (5.7%) | 16 (5.9%) |
| $55,000 to $64,999 | 29 (12.7%) | 23 (8.5%) |
| $65,000 to $74,999 | 13 (5.7%) | 12 (4.4%) |
| $75,000 to $99,999 | 13 (5.7%) | 4 (1.5%) |
| $100,000+ | 12 (5.3%) | 0 (0.0%) |
| Total | 228 (100.0%) | 272 (100.0%) |
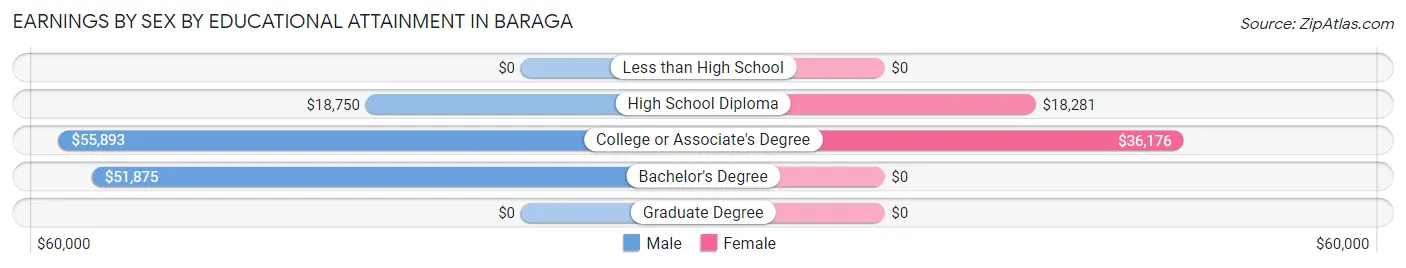
Earnings by Sex by Educational Attainment in Baraga
| Educational Attainment | Male Income | Female Income |
| Less than High School | - | - |
| High School Diploma | $18,750 | $18,281 |
| College or Associate's Degree | $55,893 | $36,176 |
| Bachelor's Degree | $51,875 | $0 |
| Graduate Degree | - | - |
| Total | - | - |
Family Income in Baraga
Family Income Brackets in Baraga
According to the Baraga family income data, there are 64 families falling into the $50,000 to $74,999 income range, which is the most common income bracket and makes up 24.7% of all families.
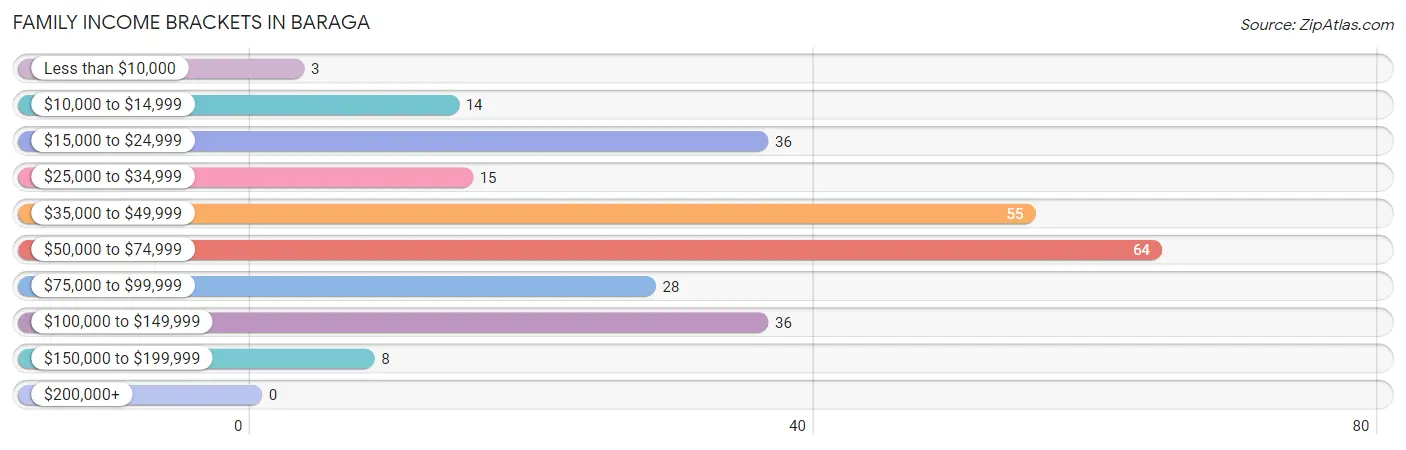
| Income Bracket | # Families | % Families |
| Less than $10,000 | 3 | 1.2% |
| $10,000 to $14,999 | 14 | 5.4% |
| $15,000 to $24,999 | 36 | 13.9% |
| $25,000 to $34,999 | 15 | 5.8% |
| $35,000 to $49,999 | 55 | 21.2% |
| $50,000 to $74,999 | 64 | 24.7% |
| $75,000 to $99,999 | 28 | 10.8% |
| $100,000 to $149,999 | 36 | 13.9% |
| $150,000 to $199,999 | 8 | 3.1% |
| $200,000+ | 0 | 0.0% |
Family Income by Famaliy Size in Baraga
4-person families (30 | 11.6%) account for the highest median family income in Baraga with $56,667 per family, while 2-person families (154 | 59.5%) have the highest median income of $27,500 per family member.
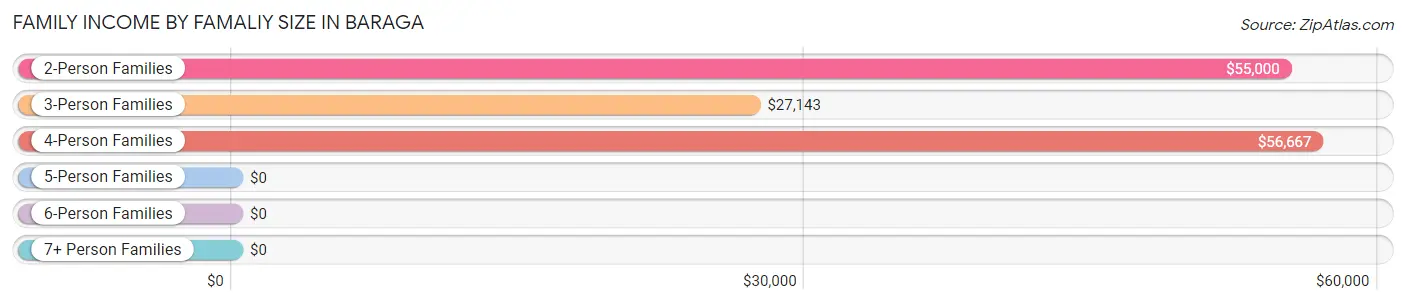
| Income Bracket | # Families | Median Income |
| 2-Person Families | 154 (59.5%) | $55,000 |
| 3-Person Families | 40 (15.4%) | $27,143 |
| 4-Person Families | 30 (11.6%) | $56,667 |
| 5-Person Families | 30 (11.6%) | $0 |
| 6-Person Families | 0 (0.0%) | $0 |
| 7+ Person Families | 5 (1.9%) | $0 |
| Total | 259 (100.0%) | $55,313 |
Family Income by Number of Earners in Baraga
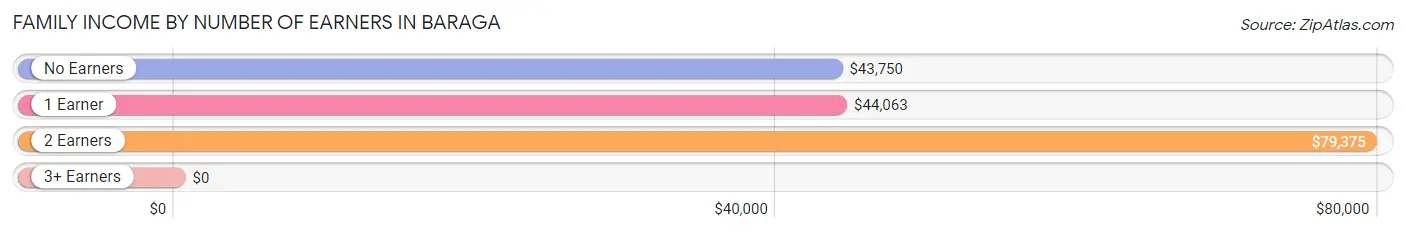
| Number of Earners | # Families | Median Income |
| No Earners | 79 (30.5%) | $43,750 |
| 1 Earner | 105 (40.5%) | $44,063 |
| 2 Earners | 67 (25.9%) | $79,375 |
| 3+ Earners | 8 (3.1%) | $0 |
| Total | 259 (100.0%) | $55,313 |
Household Income in Baraga
Household Income Brackets in Baraga
With 124 households falling in the category, the $15,000 to $24,999 income range is the most frequent in Baraga, accounting for 22.0% of all households.
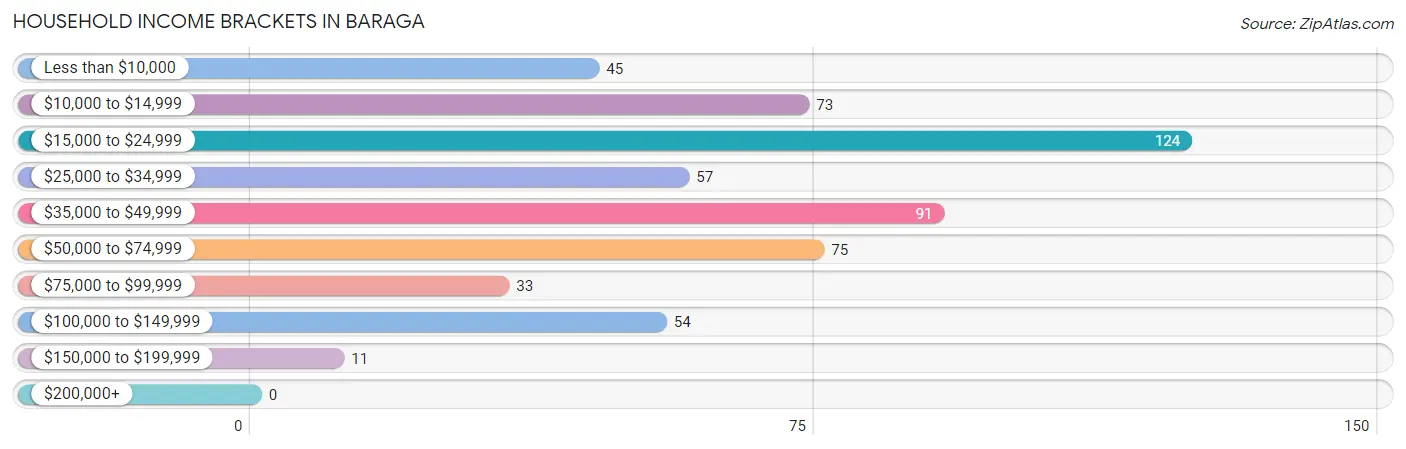
| Income Bracket | # Households | % Households |
| Less than $10,000 | 45 | 8.0% |
| $10,000 to $14,999 | 73 | 13.0% |
| $15,000 to $24,999 | 124 | 22.0% |
| $25,000 to $34,999 | 57 | 10.1% |
| $35,000 to $49,999 | 91 | 16.2% |
| $50,000 to $74,999 | 75 | 13.3% |
| $75,000 to $99,999 | 33 | 5.9% |
| $100,000 to $149,999 | 54 | 9.6% |
| $150,000 to $199,999 | 11 | 2.0% |
| $200,000+ | 0 | 0.0% |
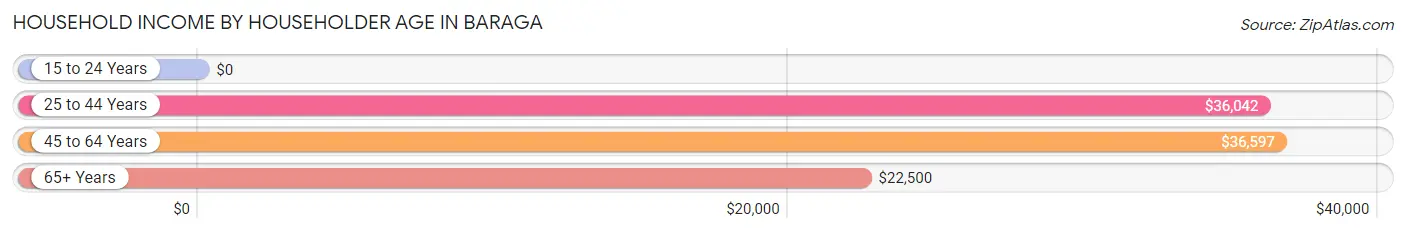
Household Income by Householder Age in Baraga
The median household income in Baraga is $32,569, with the highest median household income of $36,597 found in the 45 to 64 years age bracket for the primary householder. A total of 183 households (32.5%) fall into this category. Meanwhile, the 15 to 24 years age bracket for the primary householder has the lowest median household income of $0, with 17 households (3.0%) in this group.
| Income Bracket | # Households | Median Income |
| 15 to 24 Years | 17 (3.0%) | $0 |
| 25 to 44 Years | 149 (26.5%) | $36,042 |
| 45 to 64 Years | 183 (32.5%) | $36,597 |
| 65+ Years | 214 (38.0%) | $22,500 |
| Total | 563 (100.0%) | $32,569 |
Poverty in Baraga
Income Below Poverty by Sex and Age in Baraga
With 12.8% poverty level for males and 21.9% for females among the residents of Baraga, 16 and 17 year old males and 5 year old females are the most vulnerable to poverty, with 16 males (80.0%) and 3 females (100.0%) in their respective age groups living below the poverty level.
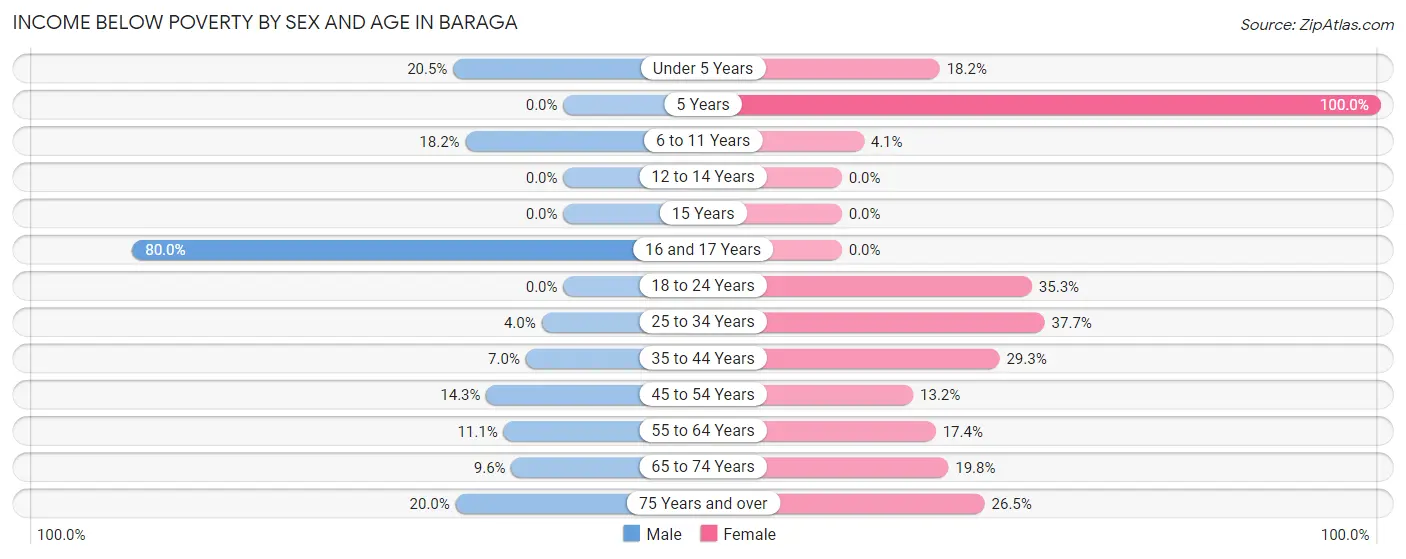
| Age Bracket | Male | Female |
| Under 5 Years | 9 (20.4%) | 8 (18.2%) |
| 5 Years | 0 (0.0%) | 3 (100.0%) |
| 6 to 11 Years | 6 (18.2%) | 2 (4.1%) |
| 12 to 14 Years | 0 (0.0%) | 0 (0.0%) |
| 15 Years | 0 (0.0%) | 0 (0.0%) |
| 16 and 17 Years | 16 (80.0%) | 0 (0.0%) |
| 18 to 24 Years | 0 (0.0%) | 12 (35.3%) |
| 25 to 34 Years | 4 (4.0%) | 32 (37.7%) |
| 35 to 44 Years | 3 (7.0%) | 12 (29.3%) |
| 45 to 54 Years | 6 (14.3%) | 9 (13.2%) |
| 55 to 64 Years | 7 (11.1%) | 15 (17.4%) |
| 65 to 74 Years | 8 (9.6%) | 17 (19.8%) |
| 75 Years and over | 5 (20.0%) | 22 (26.5%) |
| Total | 64 (12.8%) | 132 (21.9%) |
Income Above Poverty by Sex and Age in Baraga
According to the poverty statistics in Baraga, males aged 12 to 14 years and females aged 12 to 14 years are the age groups that are most secure financially, with 100.0% of males and 100.0% of females in these age groups living above the poverty line.
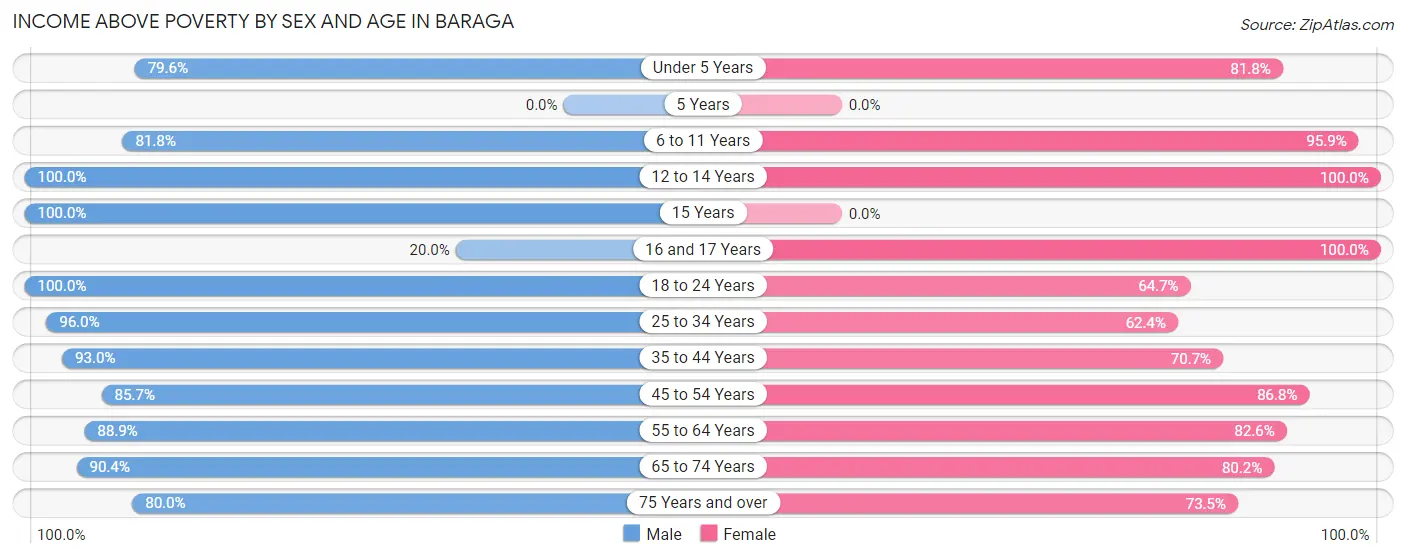
| Age Bracket | Male | Female |
| Under 5 Years | 35 (79.5%) | 36 (81.8%) |
| 5 Years | 0 (0.0%) | 0 (0.0%) |
| 6 to 11 Years | 27 (81.8%) | 47 (95.9%) |
| 12 to 14 Years | 28 (100.0%) | 16 (100.0%) |
| 15 Years | 7 (100.0%) | 0 (0.0%) |
| 16 and 17 Years | 4 (20.0%) | 8 (100.0%) |
| 18 to 24 Years | 14 (100.0%) | 22 (64.7%) |
| 25 to 34 Years | 95 (96.0%) | 53 (62.4%) |
| 35 to 44 Years | 40 (93.0%) | 29 (70.7%) |
| 45 to 54 Years | 36 (85.7%) | 59 (86.8%) |
| 55 to 64 Years | 56 (88.9%) | 71 (82.6%) |
| 65 to 74 Years | 75 (90.4%) | 69 (80.2%) |
| 75 Years and over | 20 (80.0%) | 61 (73.5%) |
| Total | 437 (87.2%) | 471 (78.1%) |
Income Below Poverty Among Married-Couple Families in Baraga
The poverty statistics for married-couple families in Baraga show that 7.2% or 12 of the total 166 families live below the poverty line. Families with 3 or 4 children have the highest poverty rate of 30.8%, comprising of 4 families. On the other hand, families with 1 or 2 children have the lowest poverty rate of 0.0%, which includes 0 families.
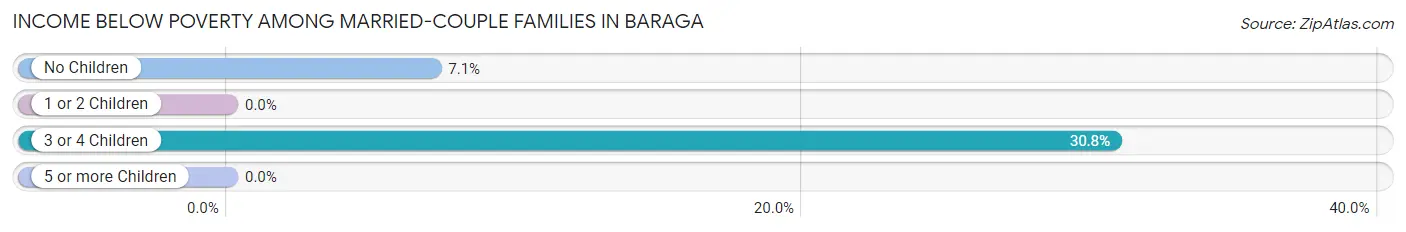
| Children | Above Poverty | Below Poverty |
| No Children | 105 (92.9%) | 8 (7.1%) |
| 1 or 2 Children | 35 (100.0%) | 0 (0.0%) |
| 3 or 4 Children | 9 (69.2%) | 4 (30.8%) |
| 5 or more Children | 5 (100.0%) | 0 (0.0%) |
| Total | 154 (92.8%) | 12 (7.2%) |
Income Below Poverty Among Single-Parent Households in Baraga
According to the poverty data in Baraga, 9.5% or 2 single-father households and 23.6% or 17 single-mother households are living below the poverty line. Among single-father households, those with 1 or 2 children have the highest poverty rate, with 2 households (15.4%) experiencing poverty. Likewise, among single-mother households, those with 3 or 4 children have the highest poverty rate, with 6 households (60.0%) falling below the poverty line.
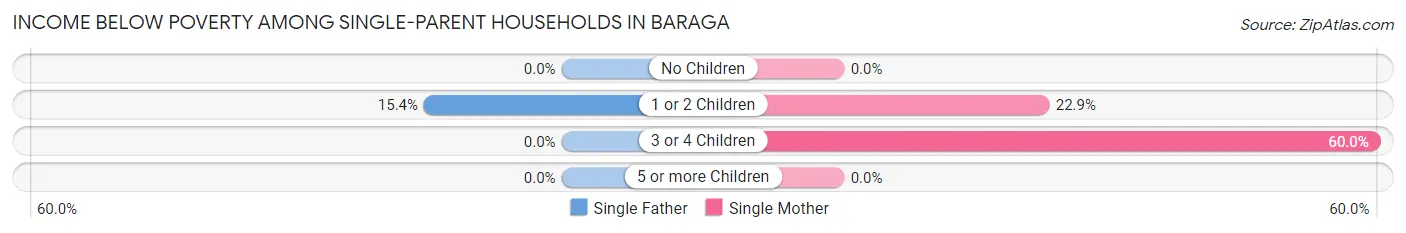
| Children | Single Father | Single Mother |
| No Children | 0 (0.0%) | 0 (0.0%) |
| 1 or 2 Children | 2 (15.4%) | 11 (22.9%) |
| 3 or 4 Children | 0 (0.0%) | 6 (60.0%) |
| 5 or more Children | 0 (0.0%) | 0 (0.0%) |
| Total | 2 (9.5%) | 17 (23.6%) |
Income Below Poverty Among Married-Couple vs Single-Parent Households in Baraga
The poverty data for Baraga shows that 12 of the married-couple family households (7.2%) and 19 of the single-parent households (20.4%) are living below the poverty level. Within the married-couple family households, those with 3 or 4 children have the highest poverty rate, with 4 households (30.8%) falling below the poverty line. Among the single-parent households, those with 3 or 4 children have the highest poverty rate, with 6 household (60.0%) living below poverty.
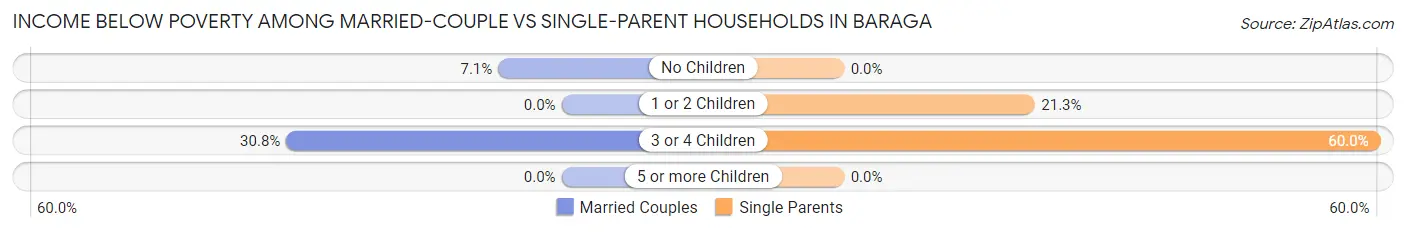
| Children | Married-Couple Families | Single-Parent Households |
| No Children | 8 (7.1%) | 0 (0.0%) |
| 1 or 2 Children | 0 (0.0%) | 13 (21.3%) |
| 3 or 4 Children | 4 (30.8%) | 6 (60.0%) |
| 5 or more Children | 0 (0.0%) | 0 (0.0%) |
| Total | 12 (7.2%) | 19 (20.4%) |
Race in Baraga
The most populous races in Baraga are White / Caucasian (895 | 44.3%), Black / African American (603 | 29.8%), and Native / Alaskan (304 | 15.0%).
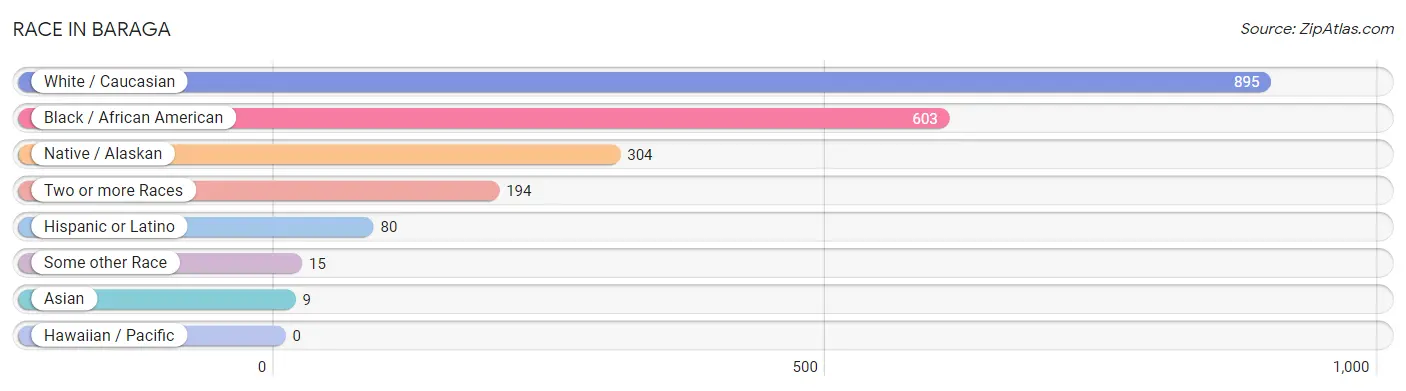
| Race | # Population | % Population |
| Asian | 9 | 0.4% |
| Black / African American | 603 | 29.8% |
| Hawaiian / Pacific | 0 | 0.0% |
| Hispanic or Latino | 80 | 4.0% |
| Native / Alaskan | 304 | 15.0% |
| White / Caucasian | 895 | 44.3% |
| Two or more Races | 194 | 9.6% |
| Some other Race | 15 | 0.7% |
| Total | 2,020 | 100.0% |
Ancestry in Baraga
The most populous ancestries reported in Baraga are Chippewa (346 | 17.1%), Finnish (196 | 9.7%), German (136 | 6.7%), American (107 | 5.3%), and French (102 | 5.1%), together accounting for 43.9% of all Baraga residents.
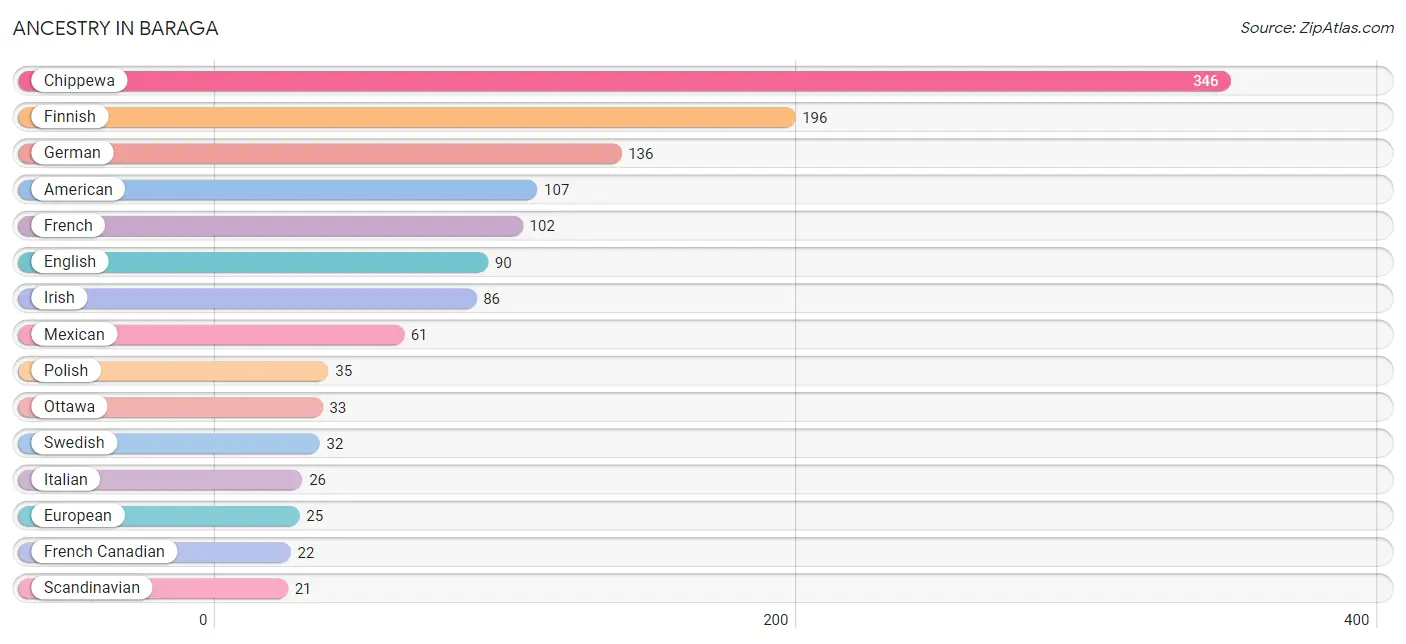
| Ancestry | # Population | % Population |
| African | 14 | 0.7% |
| American | 107 | 5.3% |
| Austrian | 7 | 0.4% |
| Bangladeshi | 2 | 0.1% |
| Blackfeet | 6 | 0.3% |
| Burmese | 11 | 0.5% |
| Canadian | 10 | 0.5% |
| Cherokee | 16 | 0.8% |
| Chippewa | 346 | 17.1% |
| Choctaw | 6 | 0.3% |
| Cuban | 10 | 0.5% |
| Dutch | 8 | 0.4% |
| Eastern European | 8 | 0.4% |
| English | 90 | 4.5% |
| European | 25 | 1.2% |
| Finnish | 196 | 9.7% |
| French | 102 | 5.1% |
| French Canadian | 22 | 1.1% |
| German | 136 | 6.7% |
| Irish | 86 | 4.3% |
| Italian | 26 | 1.3% |
| Korean | 3 | 0.2% |
| Mexican | 61 | 3.0% |
| Norwegian | 12 | 0.6% |
| Ottawa | 33 | 1.6% |
| Polish | 35 | 1.7% |
| Puerto Rican | 6 | 0.3% |
| Samoan | 14 | 0.7% |
| Scandinavian | 21 | 1.0% |
| Scottish | 11 | 0.5% |
| Subsaharan African | 14 | 0.7% |
| Swedish | 32 | 1.6% |
| Ukrainian | 3 | 0.2% | View All 33 Rows |
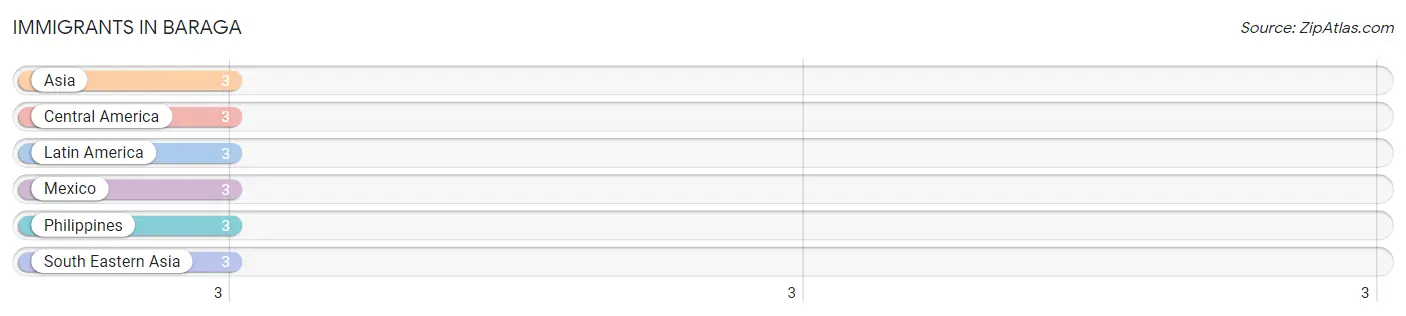
Immigrants in Baraga
The most numerous immigrant groups reported in Baraga came from Asia (3 | 0.2%), Central America (3 | 0.2%), Latin America (3 | 0.2%), Mexico (3 | 0.2%), and Philippines (3 | 0.2%), together accounting for 0.7% of all Baraga residents.
| Immigration Origin | # Population | % Population |
| Asia | 3 | 0.2% |
| Central America | 3 | 0.2% |
| Latin America | 3 | 0.2% |
| Mexico | 3 | 0.2% |
| Philippines | 3 | 0.2% |
| South Eastern Asia | 3 | 0.2% | View All 6 Rows |
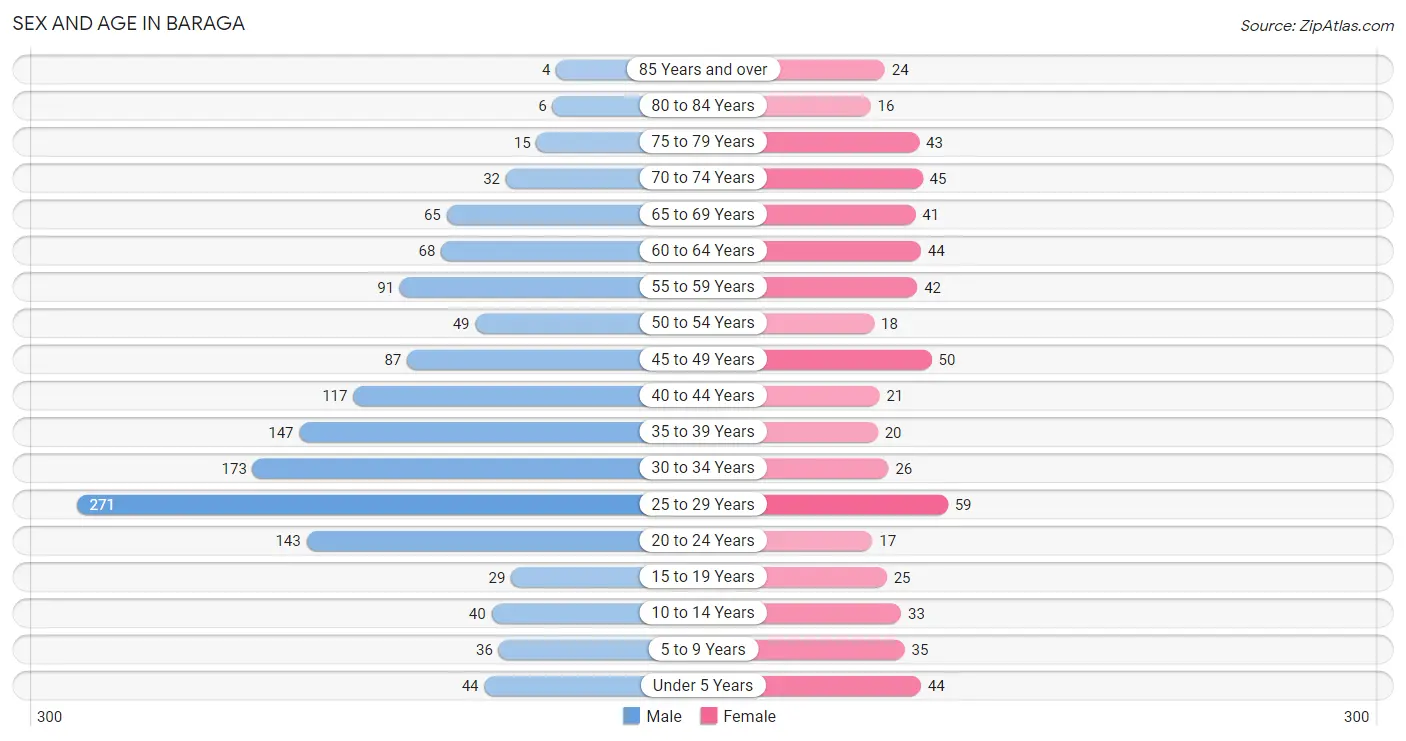
Sex and Age in Baraga
Sex and Age in Baraga
The most populous age groups in Baraga are 25 to 29 Years (271 | 19.1%) for men and 25 to 29 Years (59 | 9.8%) for women.
| Age Bracket | Male | Female |
| Under 5 Years | 44 (3.1%) | 44 (7.3%) |
| 5 to 9 Years | 36 (2.5%) | 35 (5.8%) |
| 10 to 14 Years | 40 (2.8%) | 33 (5.5%) |
| 15 to 19 Years | 29 (2.1%) | 25 (4.2%) |
| 20 to 24 Years | 143 (10.1%) | 17 (2.8%) |
| 25 to 29 Years | 271 (19.1%) | 59 (9.8%) |
| 30 to 34 Years | 173 (12.2%) | 26 (4.3%) |
| 35 to 39 Years | 147 (10.4%) | 20 (3.3%) |
| 40 to 44 Years | 117 (8.3%) | 21 (3.5%) |
| 45 to 49 Years | 87 (6.1%) | 50 (8.3%) |
| 50 to 54 Years | 49 (3.5%) | 18 (3.0%) |
| 55 to 59 Years | 91 (6.4%) | 42 (7.0%) |
| 60 to 64 Years | 68 (4.8%) | 44 (7.3%) |
| 65 to 69 Years | 65 (4.6%) | 41 (6.8%) |
| 70 to 74 Years | 32 (2.3%) | 45 (7.5%) |
| 75 to 79 Years | 15 (1.1%) | 43 (7.1%) |
| 80 to 84 Years | 6 (0.4%) | 16 (2.6%) |
| 85 Years and over | 4 (0.3%) | 24 (4.0%) |
| Total | 1,417 (100.0%) | 603 (100.0%) |
Families and Households in Baraga
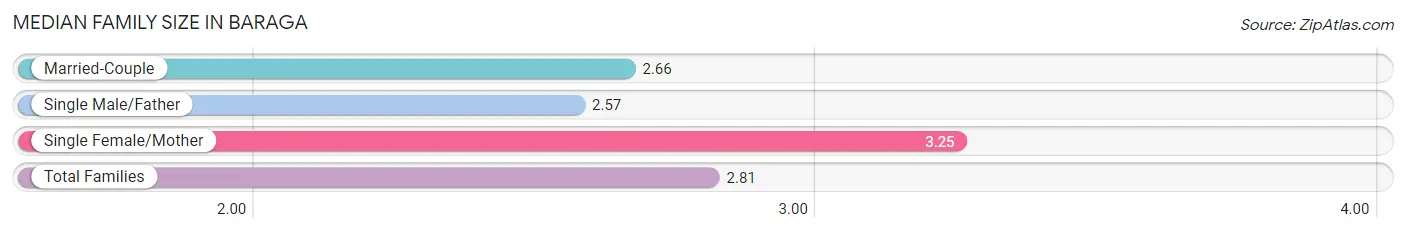
Median Family Size in Baraga
The median family size in Baraga is 2.81 persons per family, with single female/mother families (72 | 27.8%) accounting for the largest median family size of 3.25 persons per family. On the other hand, single male/father families (21 | 8.1%) represent the smallest median family size with 2.57 persons per family.
| Family Type | # Families | Family Size |
| Married-Couple | 166 (64.1%) | 2.66 |
| Single Male/Father | 21 (8.1%) | 2.57 |
| Single Female/Mother | 72 (27.8%) | 3.25 |
| Total Families | 259 (100.0%) | 2.81 |
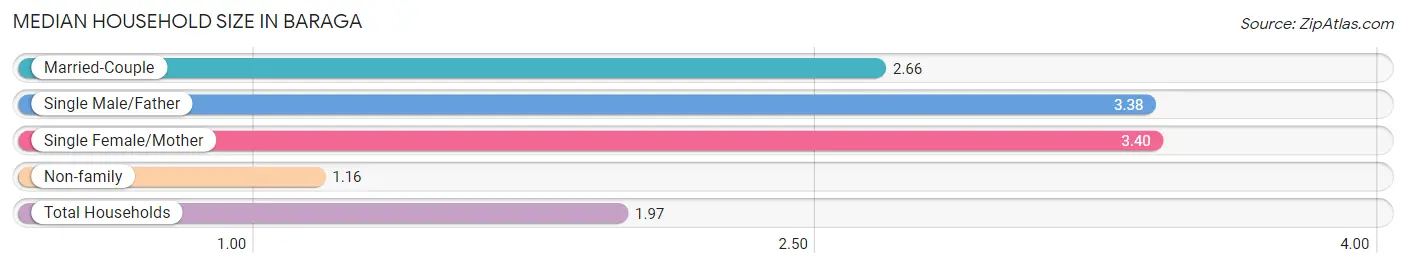
Median Household Size in Baraga
The median household size in Baraga is 1.97 persons per household, with single female/mother households (72 | 12.8%) accounting for the largest median household size of 3.4 persons per household. non-family households (304 | 54.0%) represent the smallest median household size with 1.16 persons per household.
| Household Type | # Households | Household Size |
| Married-Couple | 166 (29.5%) | 2.66 |
| Single Male/Father | 21 (3.7%) | 3.38 |
| Single Female/Mother | 72 (12.8%) | 3.40 |
| Non-family | 304 (54.0%) | 1.16 |
| Total Households | 563 (100.0%) | 1.97 |
Household Size by Marriage Status in Baraga
Out of a total of 563 households in Baraga, 259 (46.0%) are family households, while 304 (54.0%) are nonfamily households. The most numerous type of family households are 2-person households, comprising 148, and the most common type of nonfamily households are 1-person households, comprising 290.
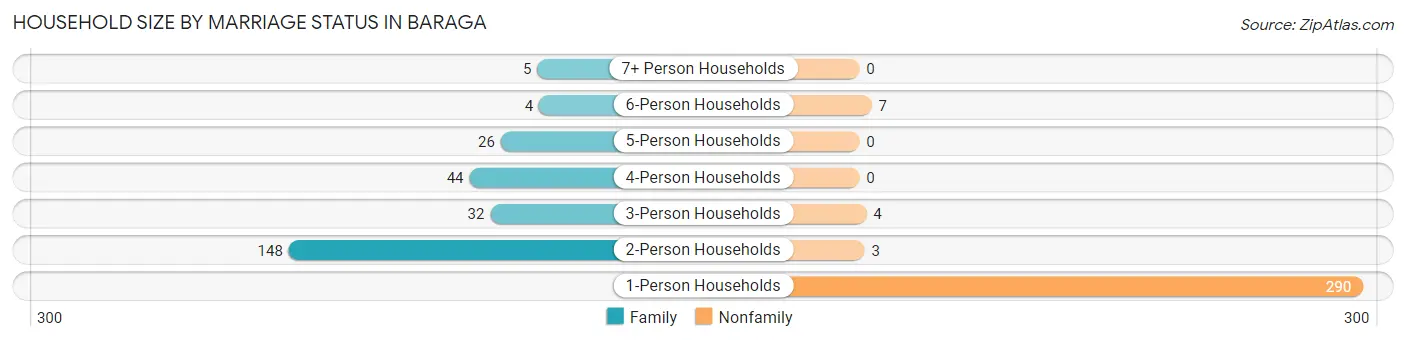
| Household Size | Family Households | Nonfamily Households |
| 1-Person Households | - | 290 (51.5%) |
| 2-Person Households | 148 (26.3%) | 3 (0.5%) |
| 3-Person Households | 32 (5.7%) | 4 (0.7%) |
| 4-Person Households | 44 (7.8%) | 0 (0.0%) |
| 5-Person Households | 26 (4.6%) | 0 (0.0%) |
| 6-Person Households | 4 (0.7%) | 7 (1.2%) |
| 7+ Person Households | 5 (0.9%) | 0 (0.0%) |
| Total | 259 (46.0%) | 304 (54.0%) |
Female Fertility in Baraga
Fertility by Age in Baraga
Average fertility rate in Baraga is 78.0 births per 1,000 women. Women in the age bracket of 20 to 34 years have the highest fertility rate with 167.0 births per 1,000 women. Women in the age bracket of 20 to 34 years acount for 100.0% of all women with births.
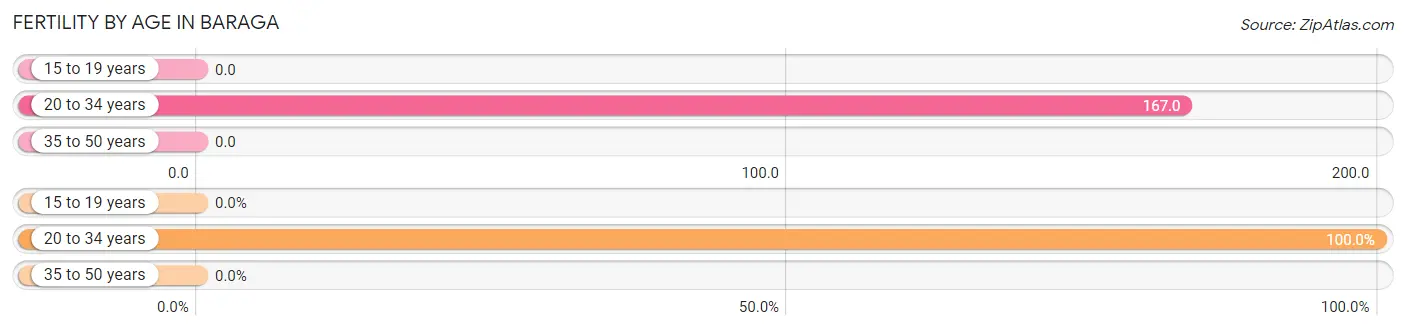
| Age Bracket | Women with Births | Births / 1,000 Women |
| 15 to 19 years | 0 (0.0%) | 0.0 |
| 20 to 34 years | 17 (100.0%) | 167.0 |
| 35 to 50 years | 0 (0.0%) | 0.0 |
| Total | 17 (100.0%) | 78.0 |
Fertility by Age by Marriage Status in Baraga
41.2% of women with births (17) in Baraga are married. The highest percentage of unmarried women with births falls into 20 to 34 years age bracket with 58.8% of them unmarried at the time of birth, while the lowest percentage of unmarried women with births belong to 20 to 34 years age bracket with 58.8% of them unmarried.
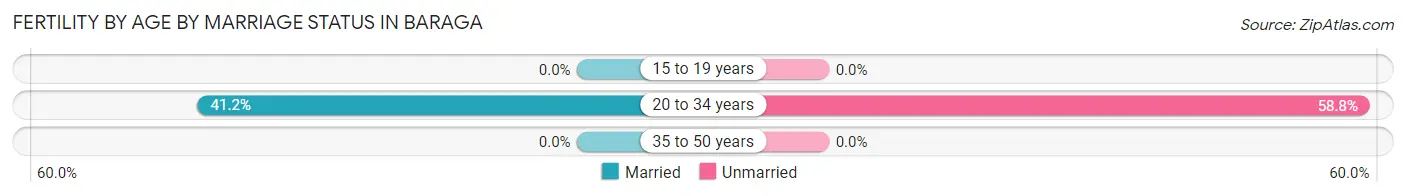
| Age Bracket | Married | Unmarried |
| 15 to 19 years | 0 (0.0%) | 0 (0.0%) |
| 20 to 34 years | 7 (41.2%) | 10 (58.8%) |
| 35 to 50 years | 0 (0.0%) | 0 (0.0%) |
| Total | 7 (41.2%) | 10 (58.8%) |
Fertility by Education in Baraga
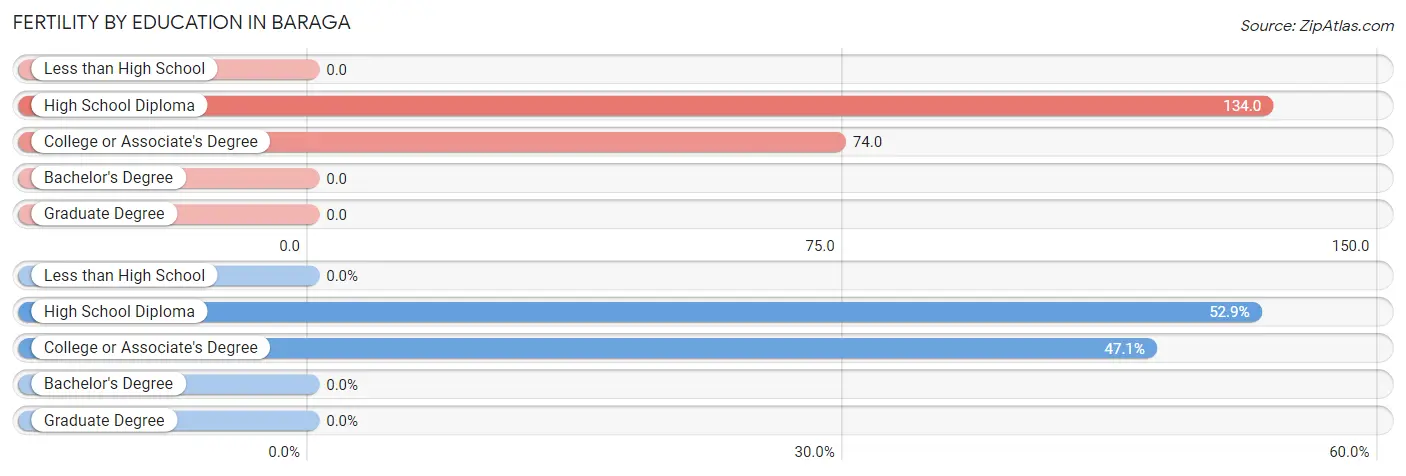
| Educational Attainment | Women with Births | Births / 1,000 Women |
| Less than High School | 0 (0.0%) | 0.0 |
| High School Diploma | 9 (52.9%) | 134.0 |
| College or Associate's Degree | 8 (47.1%) | 74.0 |
| Bachelor's Degree | 0 (0.0%) | 0.0 |
| Graduate Degree | 0 (0.0%) | 0.0 |
| Total | 17 (100.0%) | 78.0 |
Fertility by Education by Marriage Status in Baraga
58.8% of women with births in Baraga are unmarried. Women with the educational attainment of high school diploma are most likely to be married with 55.6% of them married at childbirth, while women with the educational attainment of college or associate's degree are least likely to be married with 75.0% of them unmarried at childbirth.
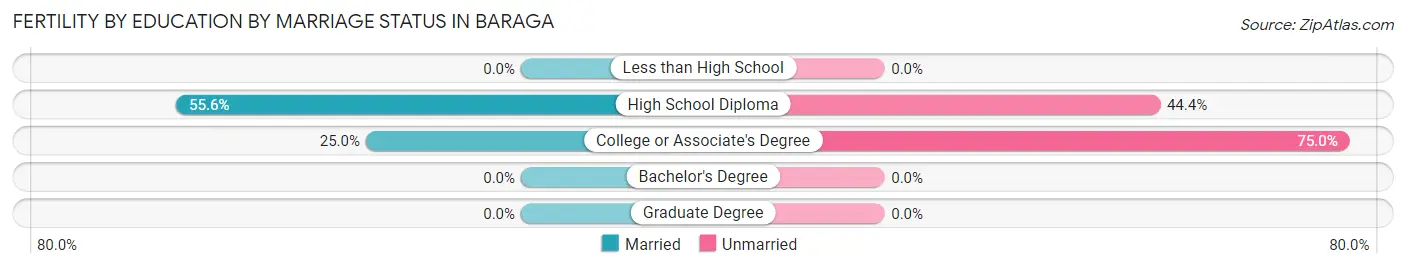
| Educational Attainment | Married | Unmarried |
| Less than High School | 0 (0.0%) | 0 (0.0%) |
| High School Diploma | 5 (55.6%) | 4 (44.4%) |
| College or Associate's Degree | 2 (25.0%) | 6 (75.0%) |
| Bachelor's Degree | 0 (0.0%) | 0 (0.0%) |
| Graduate Degree | 0 (0.0%) | 0 (0.0%) |
| Total | 7 (41.2%) | 10 (58.8%) |
Employment Characteristics in Baraga
Employment by Class of Employer in Baraga
Among the 420 employed individuals in Baraga, private company employees (246 | 58.6%), local government employees (56 | 13.3%), and federal government employees (37 | 8.8%) make up the most common classes of employment.
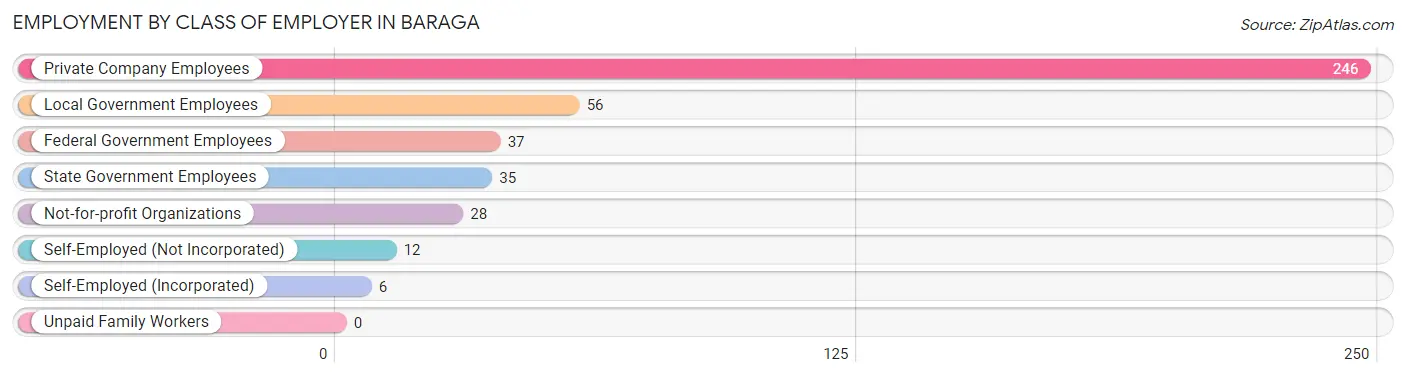
| Employer Class | # Employees | % Employees |
| Private Company Employees | 246 | 58.6% |
| Self-Employed (Incorporated) | 6 | 1.4% |
| Self-Employed (Not Incorporated) | 12 | 2.9% |
| Not-for-profit Organizations | 28 | 6.7% |
| Local Government Employees | 56 | 13.3% |
| State Government Employees | 35 | 8.3% |
| Federal Government Employees | 37 | 8.8% |
| Unpaid Family Workers | 0 | 0.0% |
| Total | 420 | 100.0% |
Employment Status by Age in Baraga
According to the labor force statistics for Baraga, out of the total population over 16 years of age (1,781), 25.3% or 451 individuals are in the labor force, with 4.4% or 20 of them unemployed. The age group with the highest labor force participation rate is 55 to 59 years, with 42.1% or 56 individuals in the labor force. Within the labor force, the 35 to 44 years age range has the highest percentage of unemployed individuals, with 12.7% or 9 of them being unemployed.
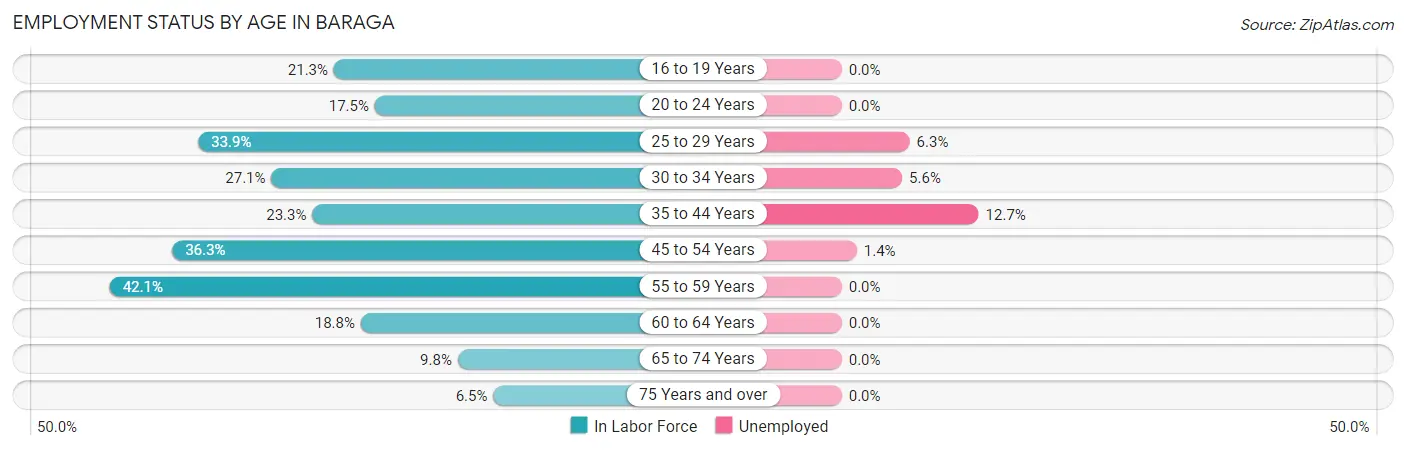
| Age Bracket | In Labor Force | Unemployed |
| 16 to 19 Years | 10 (21.3%) | 0 (0.0%) |
| 20 to 24 Years | 28 (17.5%) | 0 (0.0%) |
| 25 to 29 Years | 112 (33.9%) | 7 (6.3%) |
| 30 to 34 Years | 54 (27.1%) | 3 (5.6%) |
| 35 to 44 Years | 71 (23.3%) | 9 (12.7%) |
| 45 to 54 Years | 74 (36.3%) | 1 (1.4%) |
| 55 to 59 Years | 56 (42.1%) | 0 (0.0%) |
| 60 to 64 Years | 21 (18.8%) | 0 (0.0%) |
| 65 to 74 Years | 18 (9.8%) | 0 (0.0%) |
| 75 Years and over | 7 (6.5%) | 0 (0.0%) |
| Total | 451 (25.3%) | 20 (4.4%) |
Employment Status by Educational Attainment in Baraga
According to labor force statistics for Baraga, 30.2% of individuals (387) out of the total population between 25 and 64 years of age (1,283) are in the labor force, with 5.2% or 20 of them being unemployed. The group with the highest labor force participation rate are those with the educational attainment of college / associate degree, with 62.3% or 198 individuals in the labor force. Within the labor force, individuals with less than high school education have the highest percentage of unemployment, with 80.0% or 12 of them being unemployed.
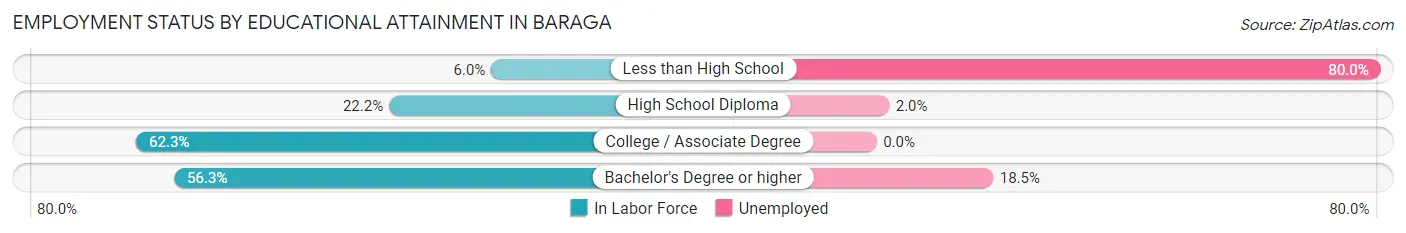
| Educational Attainment | In Labor Force | Unemployed |
| Less than High School | 15 (6.0%) | 200 (80.0%) |
| High School Diploma | 148 (22.2%) | 13 (2.0%) |
| College / Associate Degree | 198 (62.3%) | 0 (0.0%) |
| Bachelor's Degree or higher | 27 (56.3%) | 9 (18.5%) |
| Total | 387 (30.2%) | 67 (5.2%) |
Employment Occupations by Sex in Baraga
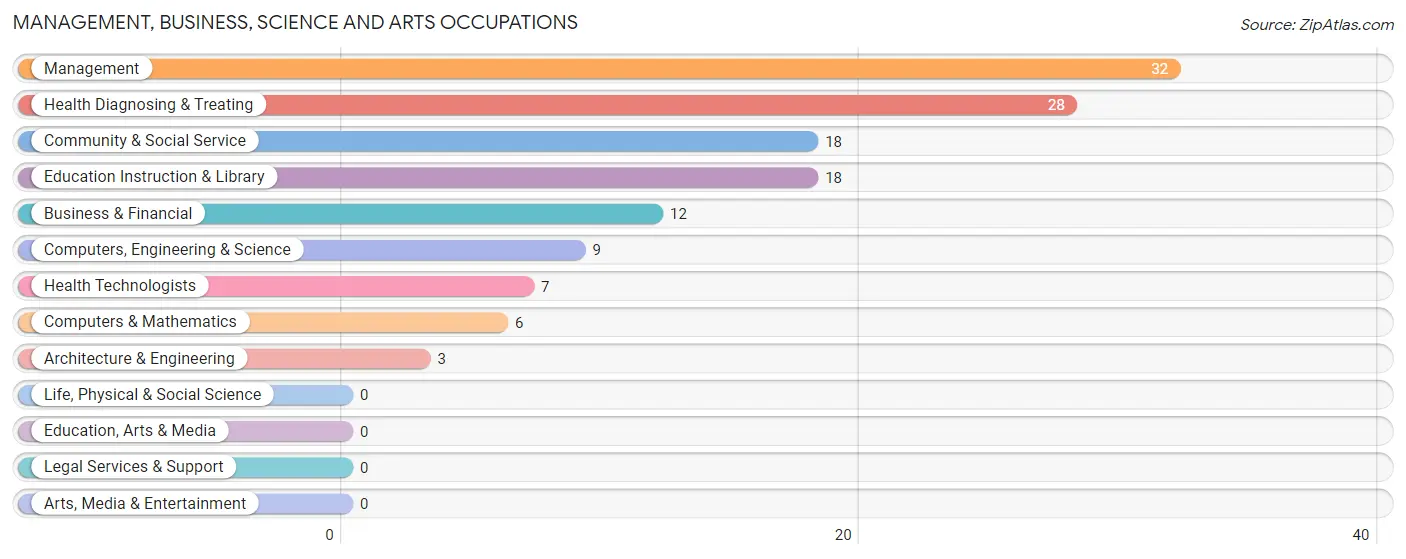
Management, Business, Science and Arts Occupations
The most common Management, Business, Science and Arts occupations in Baraga are Management (32 | 7.4%), Health Diagnosing & Treating (28 | 6.5%), Community & Social Service (18 | 4.2%), Education Instruction & Library (18 | 4.2%), and Business & Financial (12 | 2.8%).
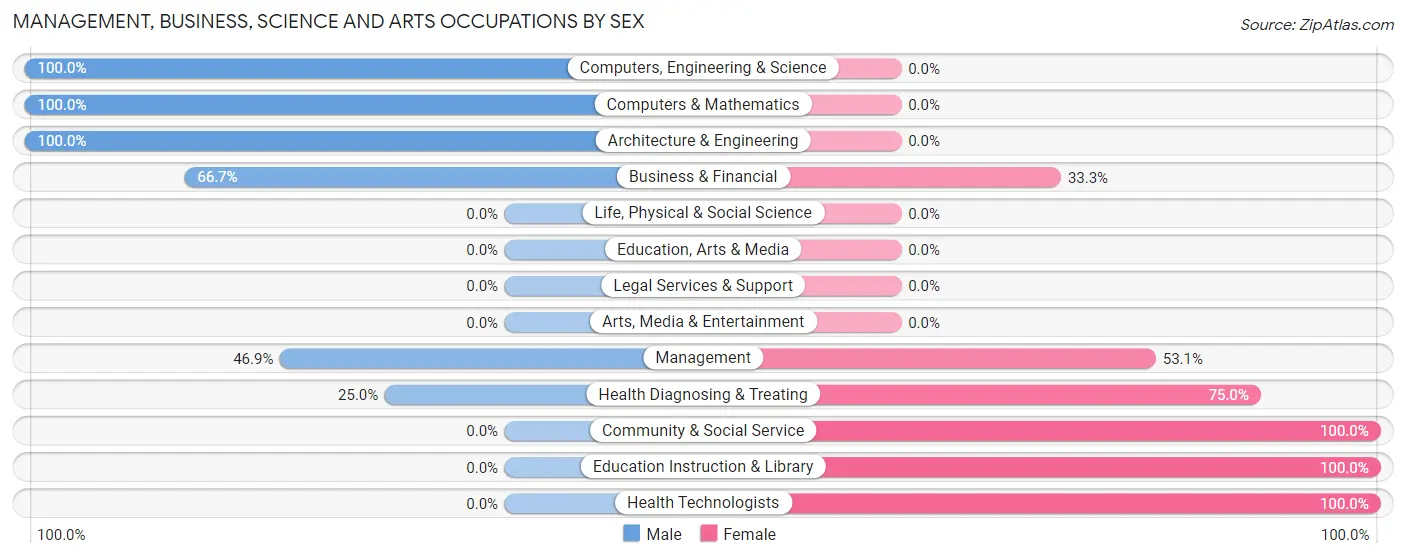
Management, Business, Science and Arts Occupations by Sex
Within the Management, Business, Science and Arts occupations in Baraga, the most male-oriented occupations are Computers, Engineering & Science (100.0%), Computers & Mathematics (100.0%), and Architecture & Engineering (100.0%), while the most female-oriented occupations are Community & Social Service (100.0%), Education Instruction & Library (100.0%), and Health Technologists (100.0%).
| Occupation | Male | Female |
| Management | 15 (46.9%) | 17 (53.1%) |
| Business & Financial | 8 (66.7%) | 4 (33.3%) |
| Computers, Engineering & Science | 9 (100.0%) | 0 (0.0%) |
| Computers & Mathematics | 6 (100.0%) | 0 (0.0%) |
| Architecture & Engineering | 3 (100.0%) | 0 (0.0%) |
| Life, Physical & Social Science | 0 (0.0%) | 0 (0.0%) |
| Community & Social Service | 0 (0.0%) | 18 (100.0%) |
| Education, Arts & Media | 0 (0.0%) | 0 (0.0%) |
| Legal Services & Support | 0 (0.0%) | 0 (0.0%) |
| Education Instruction & Library | 0 (0.0%) | 18 (100.0%) |
| Arts, Media & Entertainment | 0 (0.0%) | 0 (0.0%) |
| Health Diagnosing & Treating | 7 (25.0%) | 21 (75.0%) |
| Health Technologists | 0 (0.0%) | 7 (100.0%) |
| Total (Category) | 39 (39.4%) | 60 (60.6%) |
| Total (Overall) | 177 (41.1%) | 254 (58.9%) |
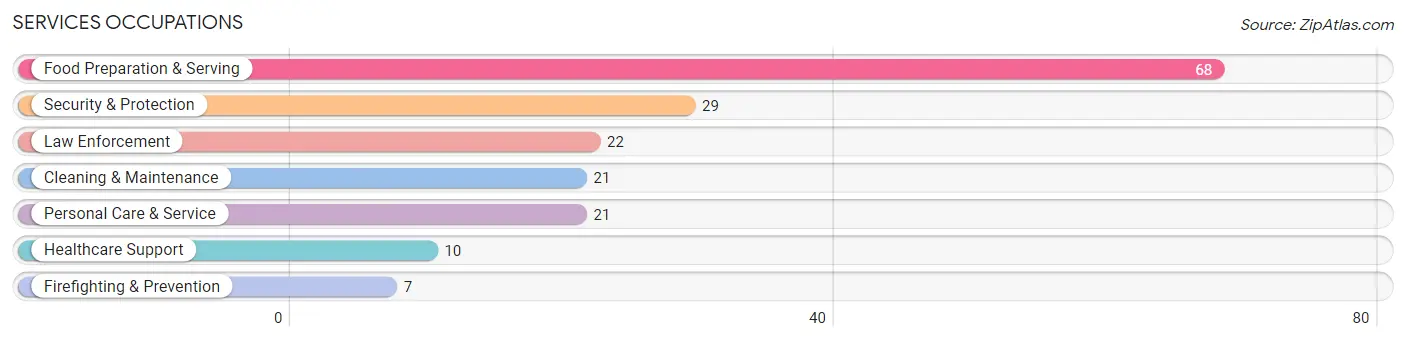
Services Occupations
The most common Services occupations in Baraga are Food Preparation & Serving (68 | 15.8%), Security & Protection (29 | 6.7%), Law Enforcement (22 | 5.1%), Cleaning & Maintenance (21 | 4.9%), and Personal Care & Service (21 | 4.9%).
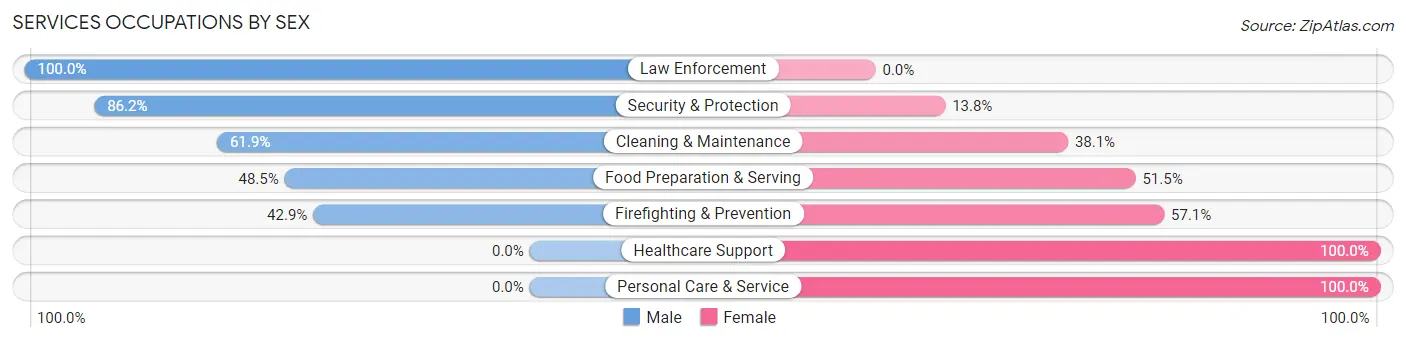
Services Occupations by Sex
Within the Services occupations in Baraga, the most male-oriented occupations are Law Enforcement (100.0%), Security & Protection (86.2%), and Cleaning & Maintenance (61.9%), while the most female-oriented occupations are Healthcare Support (100.0%), Personal Care & Service (100.0%), and Firefighting & Prevention (57.1%).
| Occupation | Male | Female |
| Healthcare Support | 0 (0.0%) | 10 (100.0%) |
| Security & Protection | 25 (86.2%) | 4 (13.8%) |
| Firefighting & Prevention | 3 (42.9%) | 4 (57.1%) |
| Law Enforcement | 22 (100.0%) | 0 (0.0%) |
| Food Preparation & Serving | 33 (48.5%) | 35 (51.5%) |
| Cleaning & Maintenance | 13 (61.9%) | 8 (38.1%) |
| Personal Care & Service | 0 (0.0%) | 21 (100.0%) |
| Total (Category) | 71 (47.6%) | 78 (52.3%) |
| Total (Overall) | 177 (41.1%) | 254 (58.9%) |
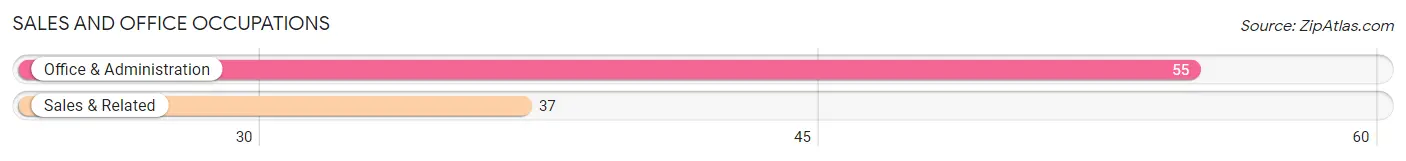
Sales and Office Occupations
The most common Sales and Office occupations in Baraga are Office & Administration (55 | 12.8%), and Sales & Related (37 | 8.6%).
Sales and Office Occupations by Sex
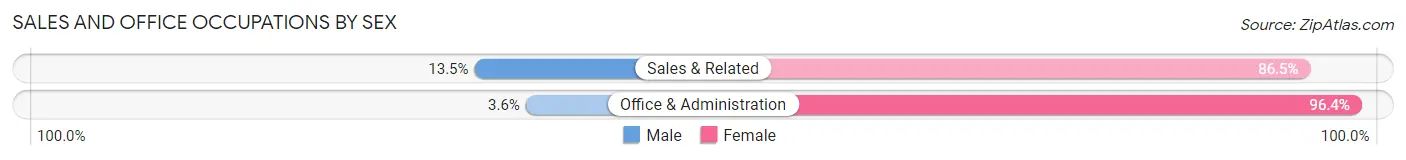
| Occupation | Male | Female |
| Sales & Related | 5 (13.5%) | 32 (86.5%) |
| Office & Administration | 2 (3.6%) | 53 (96.4%) |
| Total (Category) | 7 (7.6%) | 85 (92.4%) |
| Total (Overall) | 177 (41.1%) | 254 (58.9%) |
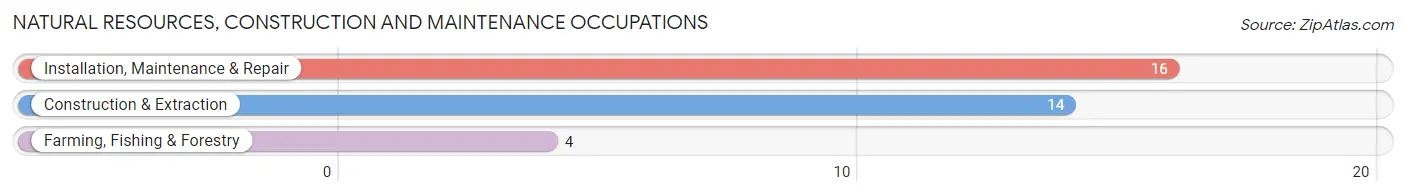
Natural Resources, Construction and Maintenance Occupations
The most common Natural Resources, Construction and Maintenance occupations in Baraga are Installation, Maintenance & Repair (16 | 3.7%), Construction & Extraction (14 | 3.3%), and Farming, Fishing & Forestry (4 | 0.9%).
Natural Resources, Construction and Maintenance Occupations by Sex
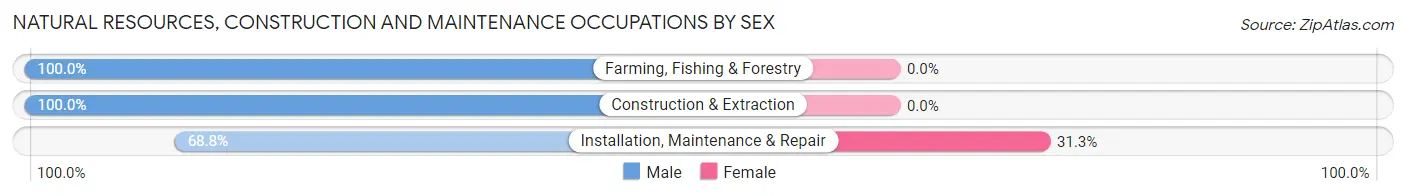
| Occupation | Male | Female |
| Farming, Fishing & Forestry | 4 (100.0%) | 0 (0.0%) |
| Construction & Extraction | 14 (100.0%) | 0 (0.0%) |
| Installation, Maintenance & Repair | 11 (68.8%) | 5 (31.2%) |
| Total (Category) | 29 (85.3%) | 5 (14.7%) |
| Total (Overall) | 177 (41.1%) | 254 (58.9%) |
Production, Transportation and Moving Occupations
The most common Production, Transportation and Moving occupations in Baraga are Production (30 | 7.0%), Transportation (16 | 3.7%), and Material Moving (11 | 2.5%).
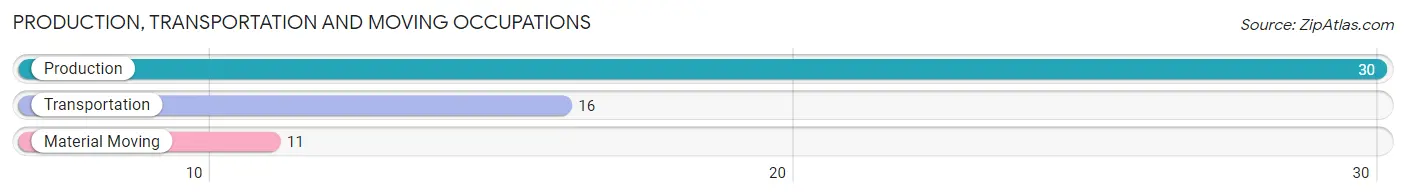
Production, Transportation and Moving Occupations by Sex
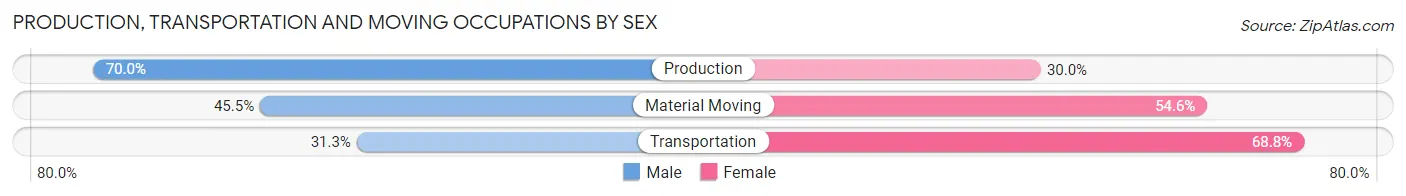
| Occupation | Male | Female |
| Production | 21 (70.0%) | 9 (30.0%) |
| Transportation | 5 (31.2%) | 11 (68.8%) |
| Material Moving | 5 (45.5%) | 6 (54.5%) |
| Total (Category) | 31 (54.4%) | 26 (45.6%) |
| Total (Overall) | 177 (41.1%) | 254 (58.9%) |
Employment Industries by Sex in Baraga
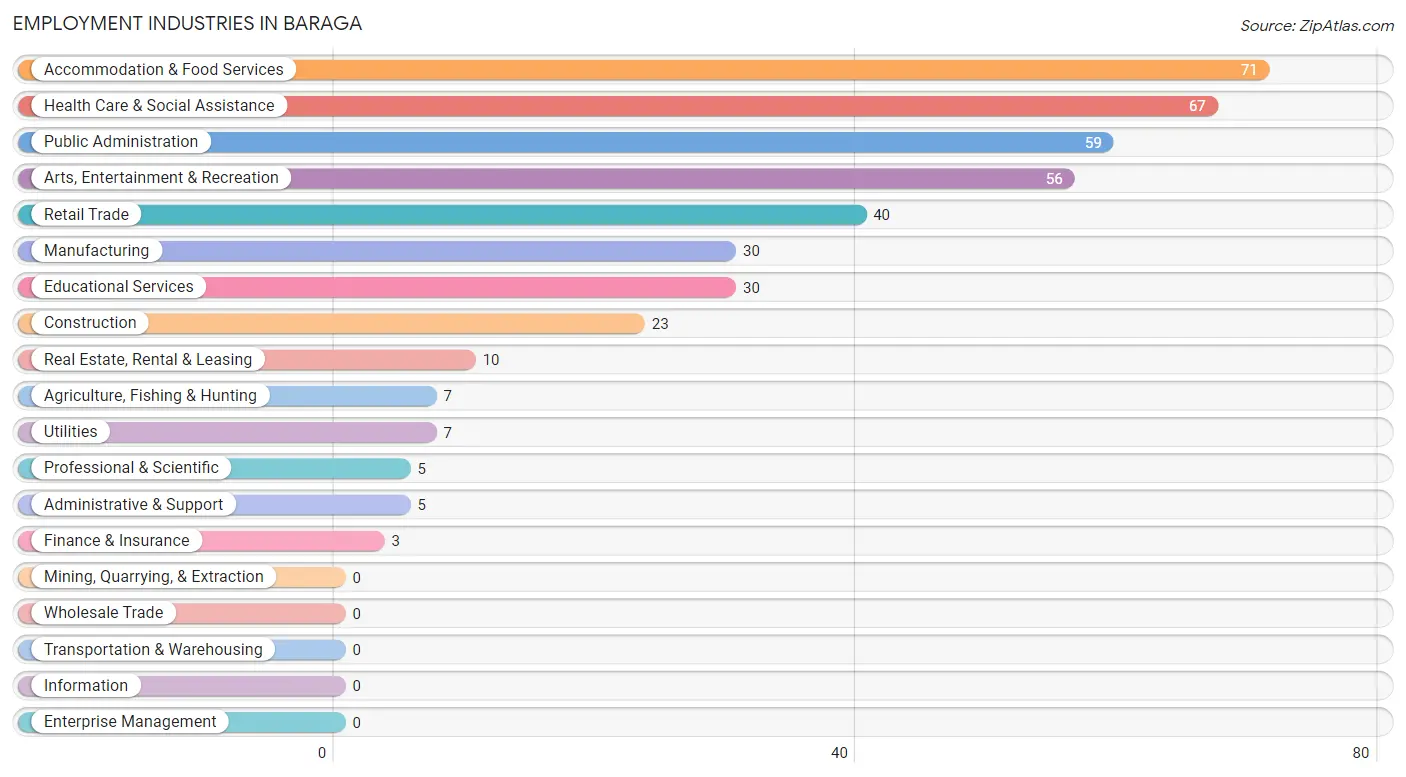
Employment Industries in Baraga
The major employment industries in Baraga include Accommodation & Food Services (71 | 16.5%), Health Care & Social Assistance (67 | 15.5%), Public Administration (59 | 13.7%), Arts, Entertainment & Recreation (56 | 13.0%), and Retail Trade (40 | 9.3%).
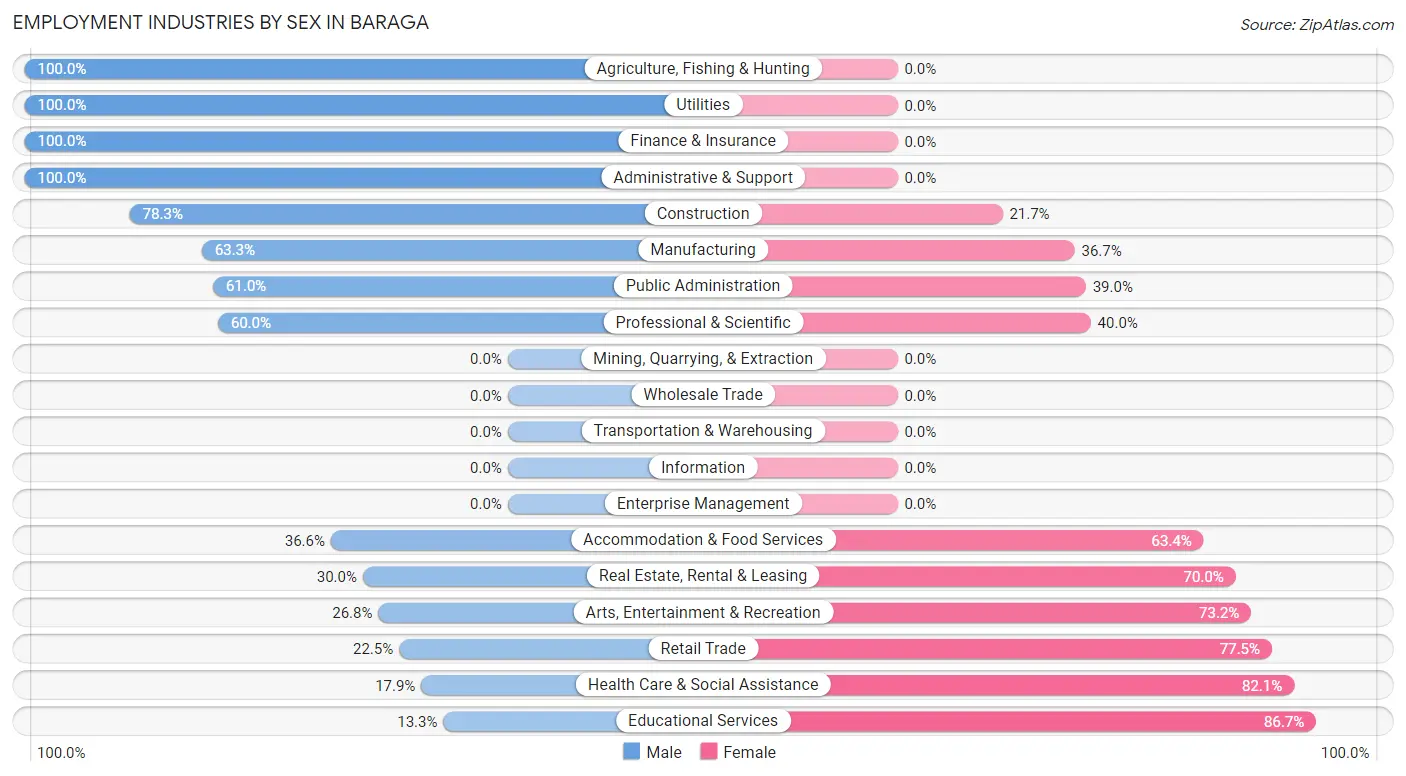
Employment Industries by Sex in Baraga
The Baraga industries that see more men than women are Agriculture, Fishing & Hunting (100.0%), Utilities (100.0%), and Finance & Insurance (100.0%), whereas the industries that tend to have a higher number of women are Educational Services (86.7%), Health Care & Social Assistance (82.1%), and Retail Trade (77.5%).
| Industry | Male | Female |
| Agriculture, Fishing & Hunting | 7 (100.0%) | 0 (0.0%) |
| Mining, Quarrying, & Extraction | 0 (0.0%) | 0 (0.0%) |
| Construction | 18 (78.3%) | 5 (21.7%) |
| Manufacturing | 19 (63.3%) | 11 (36.7%) |
| Wholesale Trade | 0 (0.0%) | 0 (0.0%) |
| Retail Trade | 9 (22.5%) | 31 (77.5%) |
| Transportation & Warehousing | 0 (0.0%) | 0 (0.0%) |
| Utilities | 7 (100.0%) | 0 (0.0%) |
| Information | 0 (0.0%) | 0 (0.0%) |
| Finance & Insurance | 3 (100.0%) | 0 (0.0%) |
| Real Estate, Rental & Leasing | 3 (30.0%) | 7 (70.0%) |
| Professional & Scientific | 3 (60.0%) | 2 (40.0%) |
| Enterprise Management | 0 (0.0%) | 0 (0.0%) |
| Administrative & Support | 5 (100.0%) | 0 (0.0%) |
| Educational Services | 4 (13.3%) | 26 (86.7%) |
| Health Care & Social Assistance | 12 (17.9%) | 55 (82.1%) |
| Arts, Entertainment & Recreation | 15 (26.8%) | 41 (73.2%) |
| Accommodation & Food Services | 26 (36.6%) | 45 (63.4%) |
| Public Administration | 36 (61.0%) | 23 (39.0%) |
| Total | 177 (41.1%) | 254 (58.9%) |
Education in Baraga
School Enrollment in Baraga
The most common levels of schooling among the 259 students in Baraga are high school (62 | 23.9%), elementary school (61 | 23.5%), and middle school (60 | 23.2%).
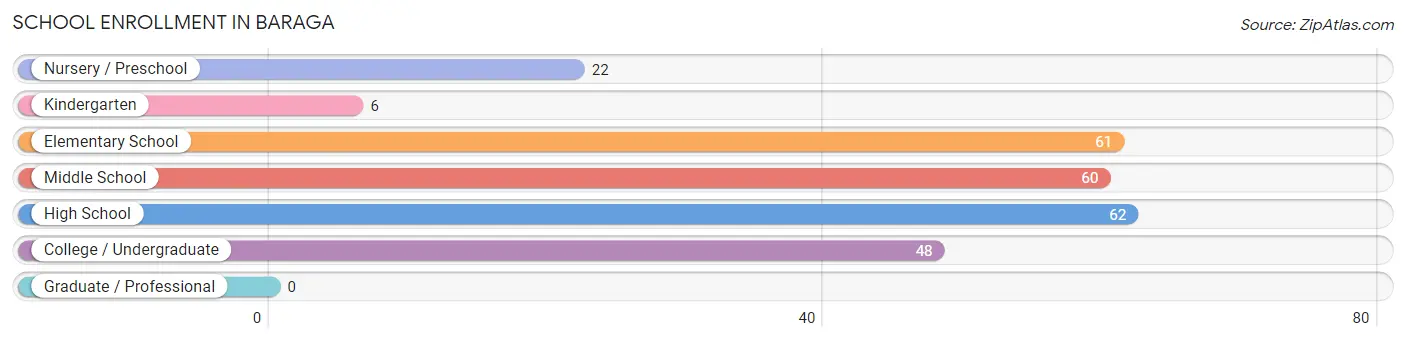
| School Level | # Students | % Students |
| Nursery / Preschool | 22 | 8.5% |
| Kindergarten | 6 | 2.3% |
| Elementary School | 61 | 23.5% |
| Middle School | 60 | 23.2% |
| High School | 62 | 23.9% |
| College / Undergraduate | 48 | 18.5% |
| Graduate / Professional | 0 | 0.0% |
| Total | 259 | 100.0% |
School Enrollment by Age by Funding Source in Baraga
Out of a total of 259 students who are enrolled in schools in Baraga, 4 (1.5%) attend a private institution, while the remaining 255 (98.5%) are enrolled in public schools. The age group of 35 years and over has the highest likelihood of being enrolled in private schools, with 4 (10.3% in the age bracket) enrolled. Conversely, the age group of 3 to 4 year olds has the lowest likelihood of being enrolled in a private school, with 17 (100.0% in the age bracket) attending a public institution.
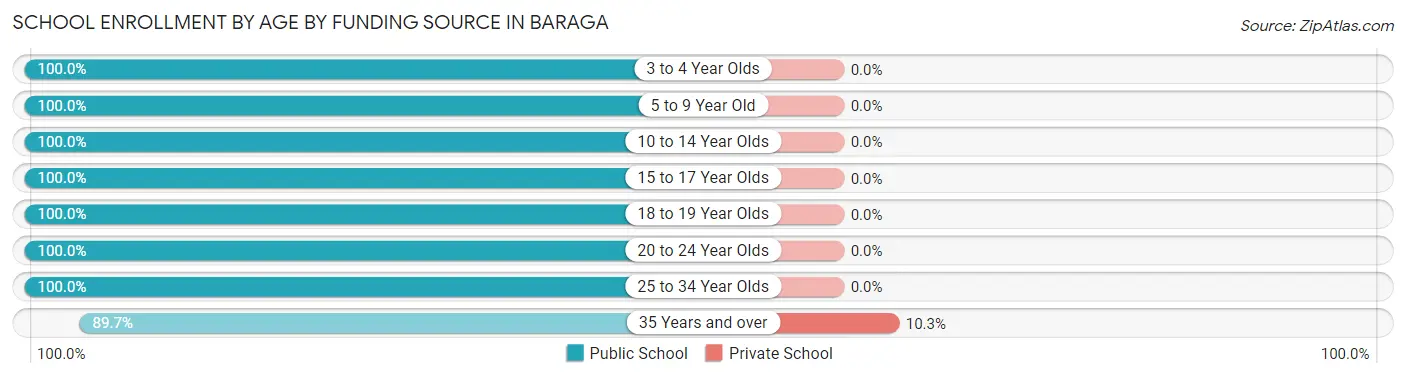
| Age Bracket | Public School | Private School |
| 3 to 4 Year Olds | 17 (100.0%) | 0 (0.0%) |
| 5 to 9 Year Old | 66 (100.0%) | 0 (0.0%) |
| 10 to 14 Year Olds | 73 (100.0%) | 0 (0.0%) |
| 15 to 17 Year Olds | 23 (100.0%) | 0 (0.0%) |
| 18 to 19 Year Olds | 19 (100.0%) | 0 (0.0%) |
| 20 to 24 Year Olds | 4 (100.0%) | 0 (0.0%) |
| 25 to 34 Year Olds | 18 (100.0%) | 0 (0.0%) |
| 35 Years and over | 35 (89.7%) | 4 (10.3%) |
| Total | 255 (98.5%) | 4 (1.5%) |
Educational Attainment by Field of Study in Baraga
Education (17 | 18.3%), business (15 | 16.1%), bio, nature & agricultural (13 | 14.0%), psychology (11 | 11.8%), and engineering (9 | 9.7%) are the most common fields of study among 93 individuals in Baraga who have obtained a bachelor's degree or higher.
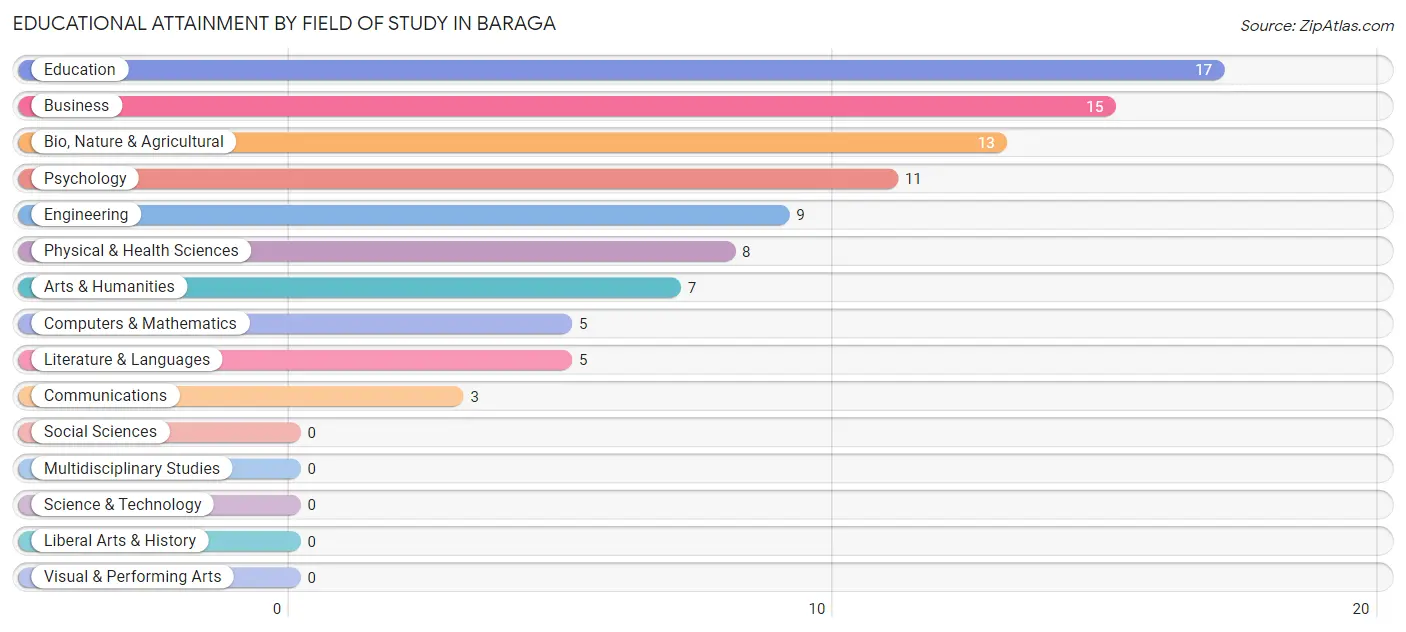
| Field of Study | # Graduates | % Graduates |
| Computers & Mathematics | 5 | 5.4% |
| Bio, Nature & Agricultural | 13 | 14.0% |
| Physical & Health Sciences | 8 | 8.6% |
| Psychology | 11 | 11.8% |
| Social Sciences | 0 | 0.0% |
| Engineering | 9 | 9.7% |
| Multidisciplinary Studies | 0 | 0.0% |
| Science & Technology | 0 | 0.0% |
| Business | 15 | 16.1% |
| Education | 17 | 18.3% |
| Literature & Languages | 5 | 5.4% |
| Liberal Arts & History | 0 | 0.0% |
| Visual & Performing Arts | 0 | 0.0% |
| Communications | 3 | 3.2% |
| Arts & Humanities | 7 | 7.5% |
| Total | 93 | 100.0% |
Transportation & Commute in Baraga
Vehicle Availability by Sex in Baraga
The most prevalent vehicle ownership categories in Baraga are males with 2 vehicles (91, accounting for 52.0%) and females with 2 vehicles (94, making up 37.4%).
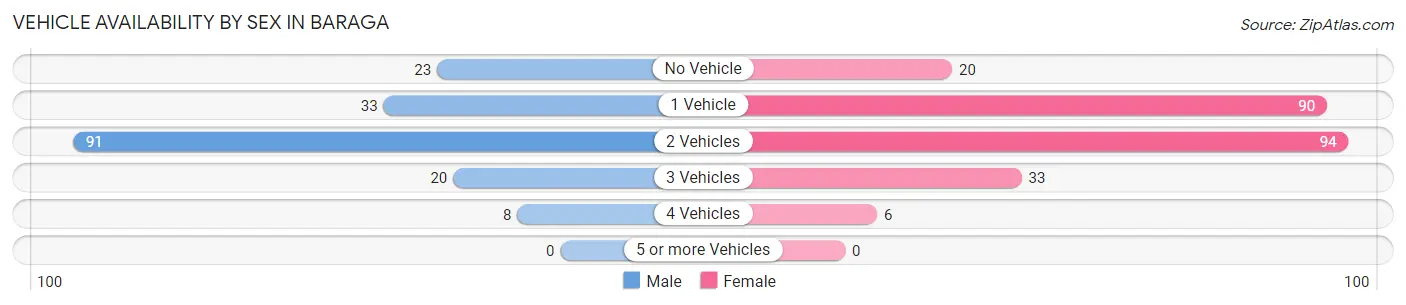
| Vehicles Available | Male | Female |
| No Vehicle | 23 (13.1%) | 20 (8.2%) |
| 1 Vehicle | 33 (18.9%) | 90 (37.0%) |
| 2 Vehicles | 91 (52.0%) | 94 (38.7%) |
| 3 Vehicles | 20 (11.4%) | 33 (13.6%) |
| 4 Vehicles | 8 (4.6%) | 6 (2.5%) |
| 5 or more Vehicles | 0 (0.0%) | 0 (0.0%) |
| Total | 175 (100.0%) | 243 (100.0%) |
Commute Time in Baraga
The most frequently occuring commute durations in Baraga are less than 5 minutes (162 commuters, 39.9%), 5 to 9 minutes (78 commuters, 19.2%), and 10 to 14 minutes (73 commuters, 18.0%).
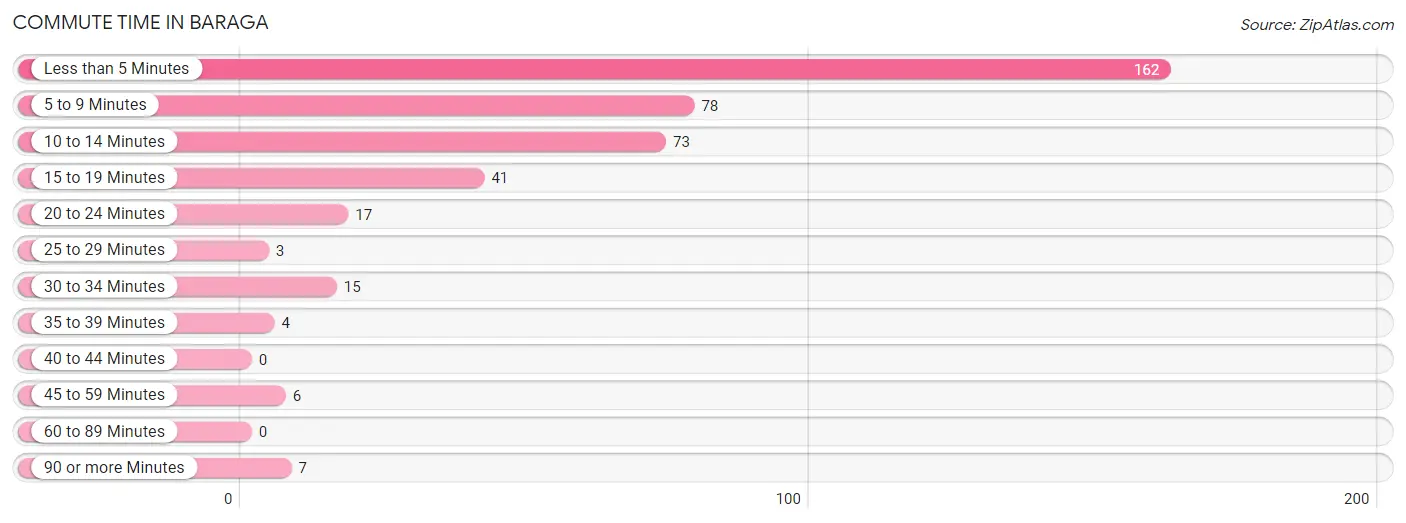
| Commute Time | # Commuters | % Commuters |
| Less than 5 Minutes | 162 | 39.9% |
| 5 to 9 Minutes | 78 | 19.2% |
| 10 to 14 Minutes | 73 | 18.0% |
| 15 to 19 Minutes | 41 | 10.1% |
| 20 to 24 Minutes | 17 | 4.2% |
| 25 to 29 Minutes | 3 | 0.7% |
| 30 to 34 Minutes | 15 | 3.7% |
| 35 to 39 Minutes | 4 | 1.0% |
| 40 to 44 Minutes | 0 | 0.0% |
| 45 to 59 Minutes | 6 | 1.5% |
| 60 to 89 Minutes | 0 | 0.0% |
| 90 or more Minutes | 7 | 1.7% |
Commute Time by Sex in Baraga
The most common commute times in Baraga are less than 5 minutes (55 commuters, 33.7%) for males and less than 5 minutes (107 commuters, 44.0%) for females.
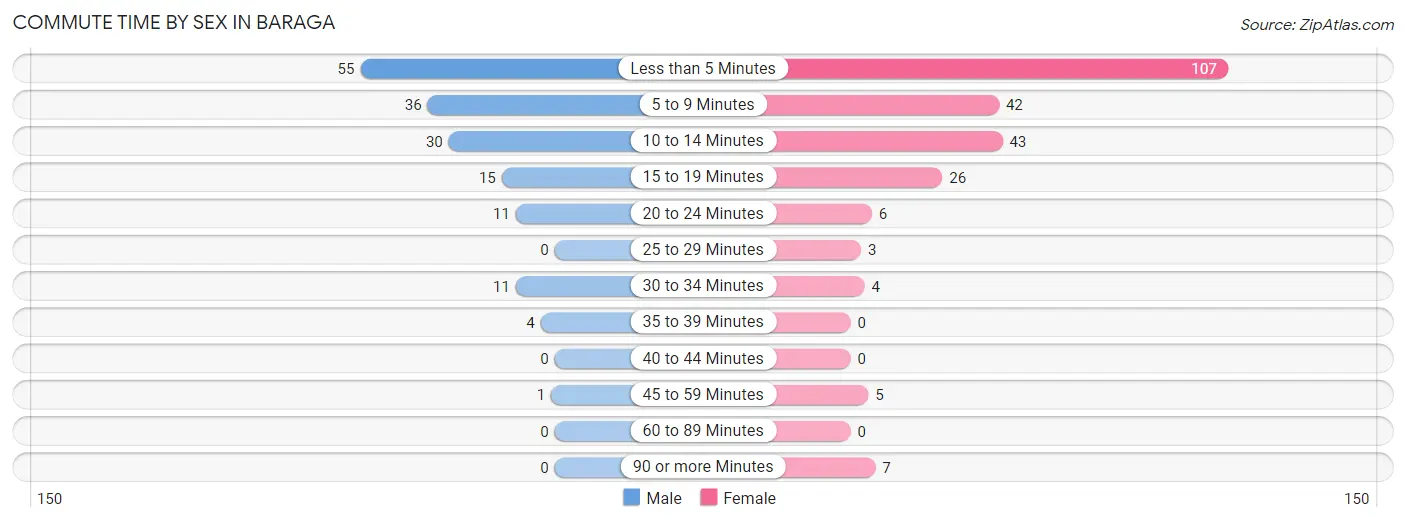
| Commute Time | Male | Female |
| Less than 5 Minutes | 55 (33.7%) | 107 (44.0%) |
| 5 to 9 Minutes | 36 (22.1%) | 42 (17.3%) |
| 10 to 14 Minutes | 30 (18.4%) | 43 (17.7%) |
| 15 to 19 Minutes | 15 (9.2%) | 26 (10.7%) |
| 20 to 24 Minutes | 11 (6.8%) | 6 (2.5%) |
| 25 to 29 Minutes | 0 (0.0%) | 3 (1.2%) |
| 30 to 34 Minutes | 11 (6.8%) | 4 (1.7%) |
| 35 to 39 Minutes | 4 (2.5%) | 0 (0.0%) |
| 40 to 44 Minutes | 0 (0.0%) | 0 (0.0%) |
| 45 to 59 Minutes | 1 (0.6%) | 5 (2.1%) |
| 60 to 89 Minutes | 0 (0.0%) | 0 (0.0%) |
| 90 or more Minutes | 0 (0.0%) | 7 (2.9%) |
Time of Departure to Work by Sex in Baraga
The most frequent times of departure to work in Baraga are 7:30 AM to 7:59 AM (34, 20.9%) for males and 7:30 AM to 7:59 AM (46, 18.9%) for females.
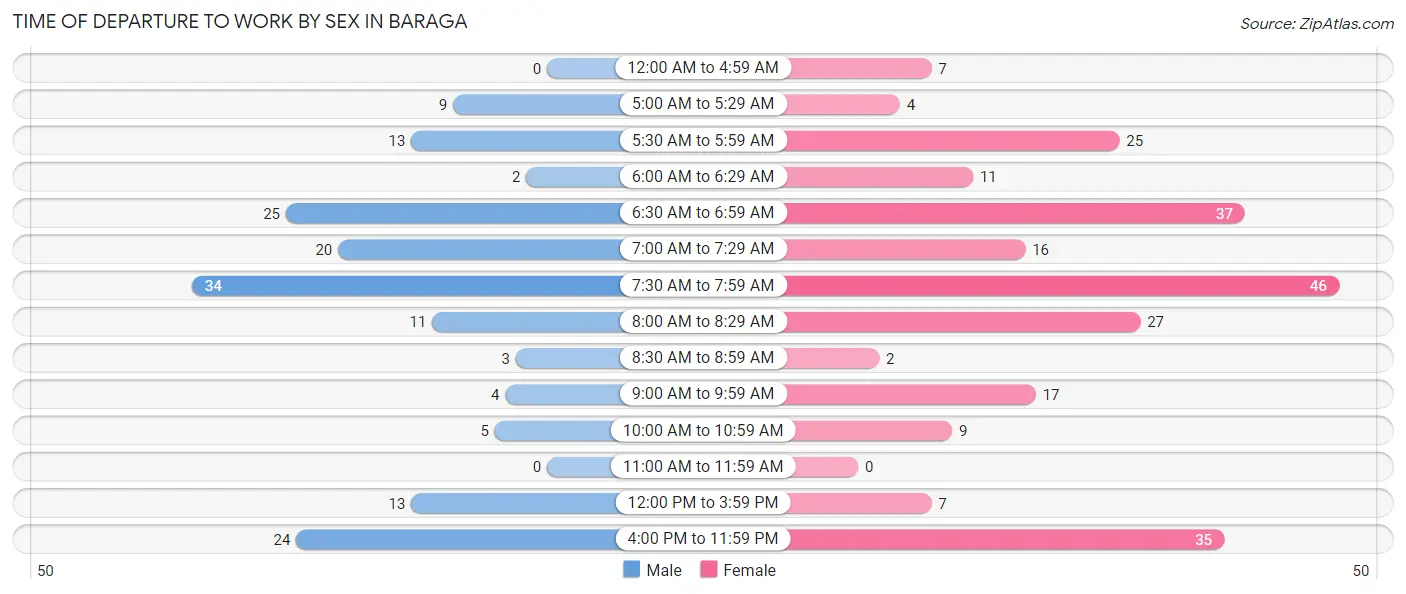
| Time of Departure | Male | Female |
| 12:00 AM to 4:59 AM | 0 (0.0%) | 7 (2.9%) |
| 5:00 AM to 5:29 AM | 9 (5.5%) | 4 (1.7%) |
| 5:30 AM to 5:59 AM | 13 (8.0%) | 25 (10.3%) |
| 6:00 AM to 6:29 AM | 2 (1.2%) | 11 (4.5%) |
| 6:30 AM to 6:59 AM | 25 (15.3%) | 37 (15.2%) |
| 7:00 AM to 7:29 AM | 20 (12.3%) | 16 (6.6%) |
| 7:30 AM to 7:59 AM | 34 (20.9%) | 46 (18.9%) |
| 8:00 AM to 8:29 AM | 11 (6.8%) | 27 (11.1%) |
| 8:30 AM to 8:59 AM | 3 (1.8%) | 2 (0.8%) |
| 9:00 AM to 9:59 AM | 4 (2.5%) | 17 (7.0%) |
| 10:00 AM to 10:59 AM | 5 (3.1%) | 9 (3.7%) |
| 11:00 AM to 11:59 AM | 0 (0.0%) | 0 (0.0%) |
| 12:00 PM to 3:59 PM | 13 (8.0%) | 7 (2.9%) |
| 4:00 PM to 11:59 PM | 24 (14.7%) | 35 (14.4%) |
| Total | 163 (100.0%) | 243 (100.0%) |
Housing Occupancy in Baraga
Occupancy by Ownership in Baraga
Of the total 563 dwellings in Baraga, owner-occupied units account for 294 (52.2%), while renter-occupied units make up 269 (47.8%).
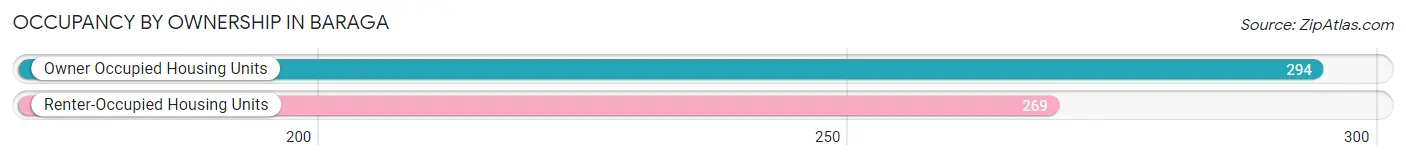
| Occupancy | # Housing Units | % Housing Units |
| Owner Occupied Housing Units | 294 | 52.2% |
| Renter-Occupied Housing Units | 269 | 47.8% |
| Total Occupied Housing Units | 563 | 100.0% |
Occupancy by Household Size in Baraga
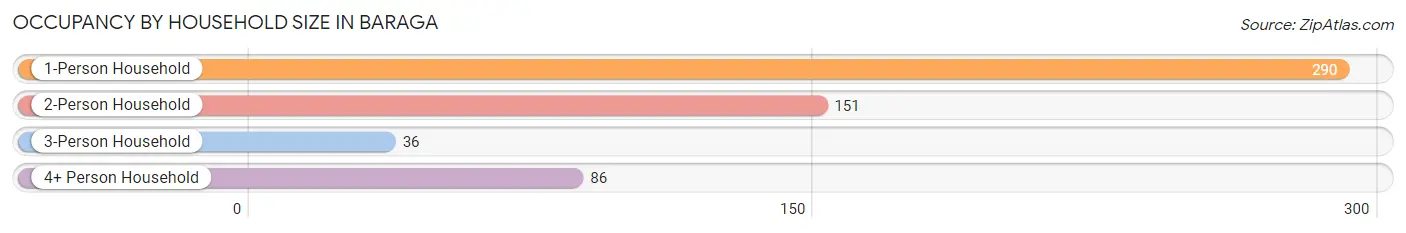
| Household Size | # Housing Units | % Housing Units |
| 1-Person Household | 290 | 51.5% |
| 2-Person Household | 151 | 26.8% |
| 3-Person Household | 36 | 6.4% |
| 4+ Person Household | 86 | 15.3% |
| Total Housing Units | 563 | 100.0% |
Occupancy by Ownership by Household Size in Baraga
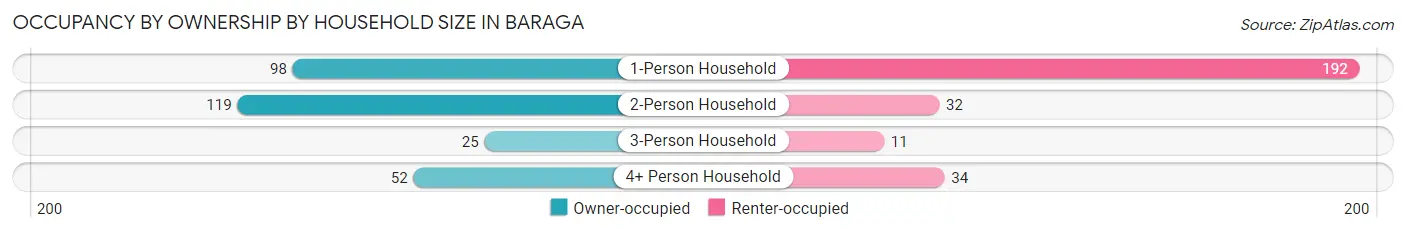
| Household Size | Owner-occupied | Renter-occupied |
| 1-Person Household | 98 (33.8%) | 192 (66.2%) |
| 2-Person Household | 119 (78.8%) | 32 (21.2%) |
| 3-Person Household | 25 (69.4%) | 11 (30.6%) |
| 4+ Person Household | 52 (60.5%) | 34 (39.5%) |
| Total Housing Units | 294 (52.2%) | 269 (47.8%) |
Occupancy by Educational Attainment in Baraga
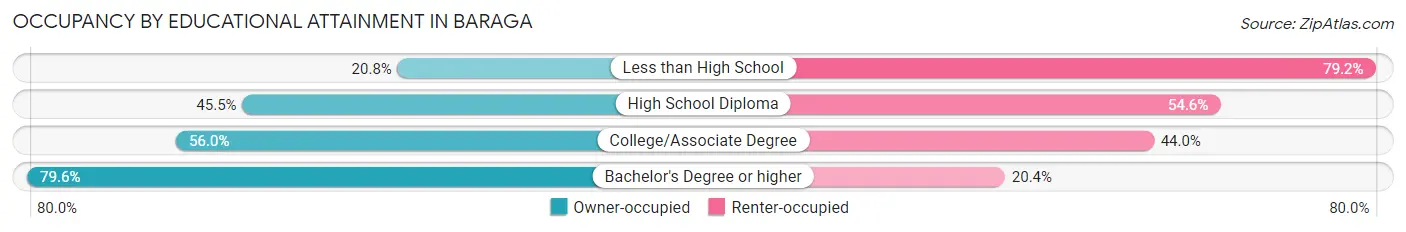
| Household Size | Owner-occupied | Renter-occupied |
| Less than High School | 5 (20.8%) | 19 (79.2%) |
| High School Diploma | 105 (45.5%) | 126 (54.5%) |
| College/Associate Degree | 145 (56.0%) | 114 (44.0%) |
| Bachelor's Degree or higher | 39 (79.6%) | 10 (20.4%) |
Occupancy by Age of Householder in Baraga
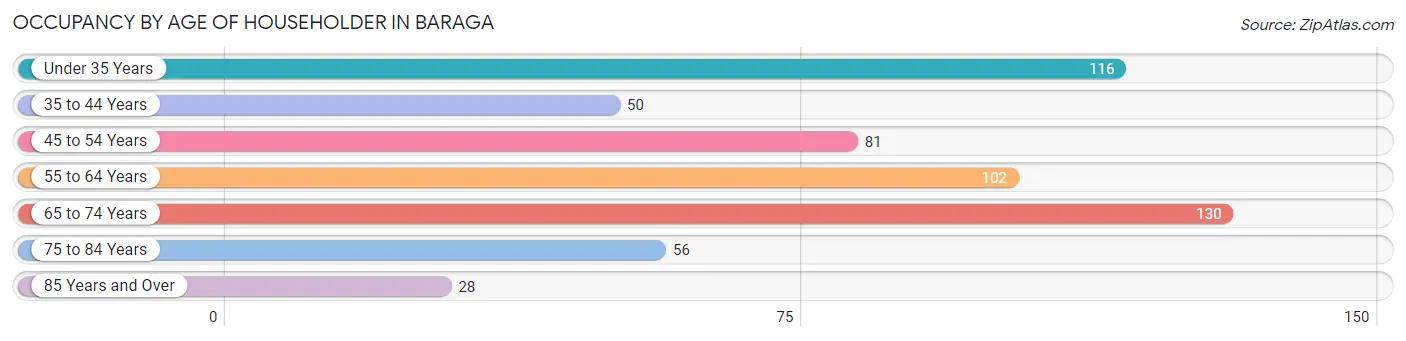
| Age Bracket | # Households | % Households |
| Under 35 Years | 116 | 20.6% |
| 35 to 44 Years | 50 | 8.9% |
| 45 to 54 Years | 81 | 14.4% |
| 55 to 64 Years | 102 | 18.1% |
| 65 to 74 Years | 130 | 23.1% |
| 75 to 84 Years | 56 | 10.0% |
| 85 Years and Over | 28 | 5.0% |
| Total | 563 | 100.0% |
Housing Finances in Baraga
Median Income by Occupancy in Baraga
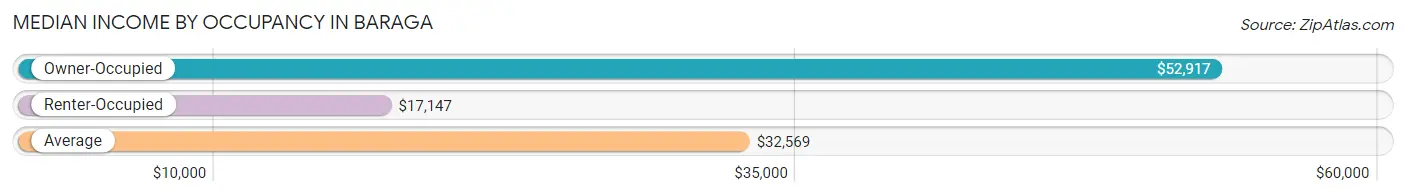
| Occupancy Type | # Households | Median Income |
| Owner-Occupied | 294 (52.2%) | $52,917 |
| Renter-Occupied | 269 (47.8%) | $17,147 |
| Average | 563 (100.0%) | $32,569 |
Occupancy by Householder Income Bracket in Baraga
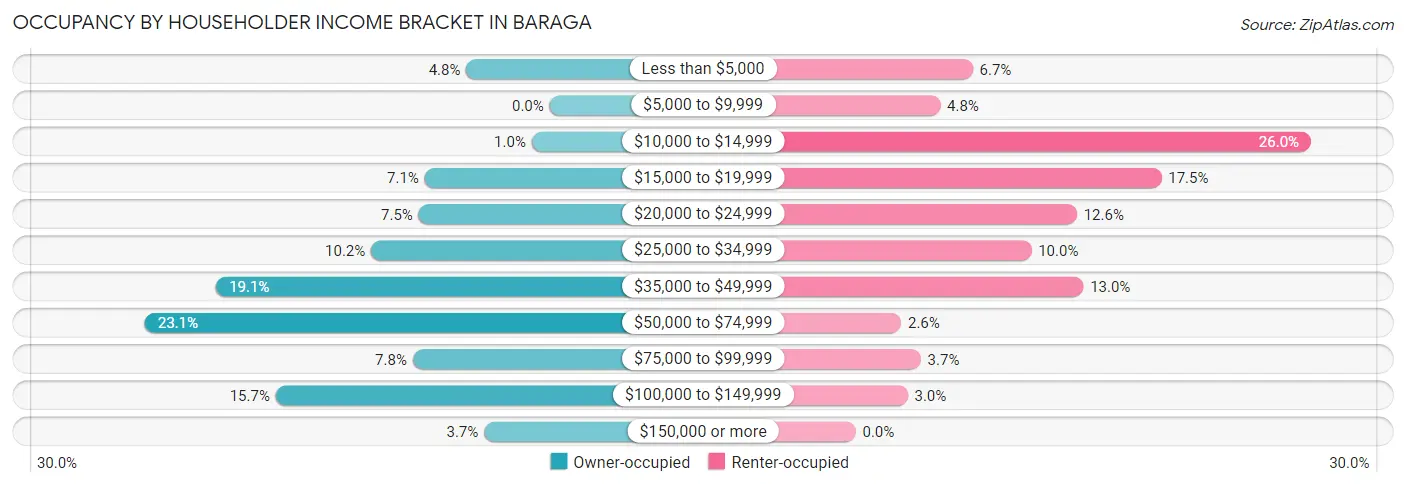
| Income Bracket | Owner-occupied | Renter-occupied |
| Less than $5,000 | 14 (4.8%) | 18 (6.7%) |
| $5,000 to $9,999 | 0 (0.0%) | 13 (4.8%) |
| $10,000 to $14,999 | 3 (1.0%) | 70 (26.0%) |
| $15,000 to $19,999 | 21 (7.1%) | 47 (17.5%) |
| $20,000 to $24,999 | 22 (7.5%) | 34 (12.6%) |
| $25,000 to $34,999 | 30 (10.2%) | 27 (10.0%) |
| $35,000 to $49,999 | 56 (19.1%) | 35 (13.0%) |
| $50,000 to $74,999 | 68 (23.1%) | 7 (2.6%) |
| $75,000 to $99,999 | 23 (7.8%) | 10 (3.7%) |
| $100,000 to $149,999 | 46 (15.7%) | 8 (3.0%) |
| $150,000 or more | 11 (3.7%) | 0 (0.0%) |
| Total | 294 (100.0%) | 269 (100.0%) |
Monthly Housing Cost Tiers in Baraga
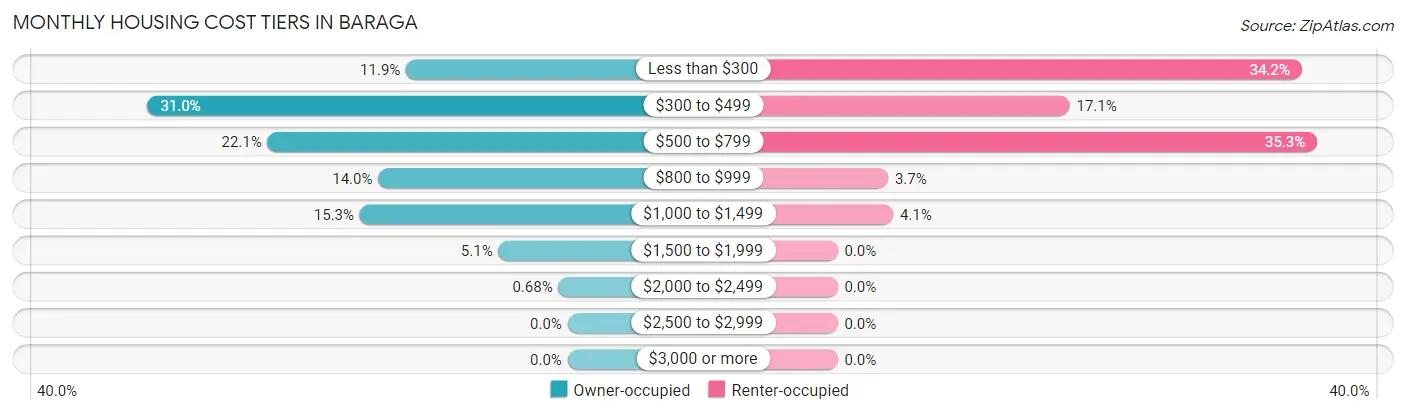
| Monthly Cost | Owner-occupied | Renter-occupied |
| Less than $300 | 35 (11.9%) | 92 (34.2%) |
| $300 to $499 | 91 (30.9%) | 46 (17.1%) |
| $500 to $799 | 65 (22.1%) | 95 (35.3%) |
| $800 to $999 | 41 (14.0%) | 10 (3.7%) |
| $1,000 to $1,499 | 45 (15.3%) | 11 (4.1%) |
| $1,500 to $1,999 | 15 (5.1%) | 0 (0.0%) |
| $2,000 to $2,499 | 2 (0.7%) | 0 (0.0%) |
| $2,500 to $2,999 | 0 (0.0%) | 0 (0.0%) |
| $3,000 or more | 0 (0.0%) | 0 (0.0%) |
| Total | 294 (100.0%) | 269 (100.0%) |
Physical Housing Characteristics in Baraga
Housing Structures in Baraga
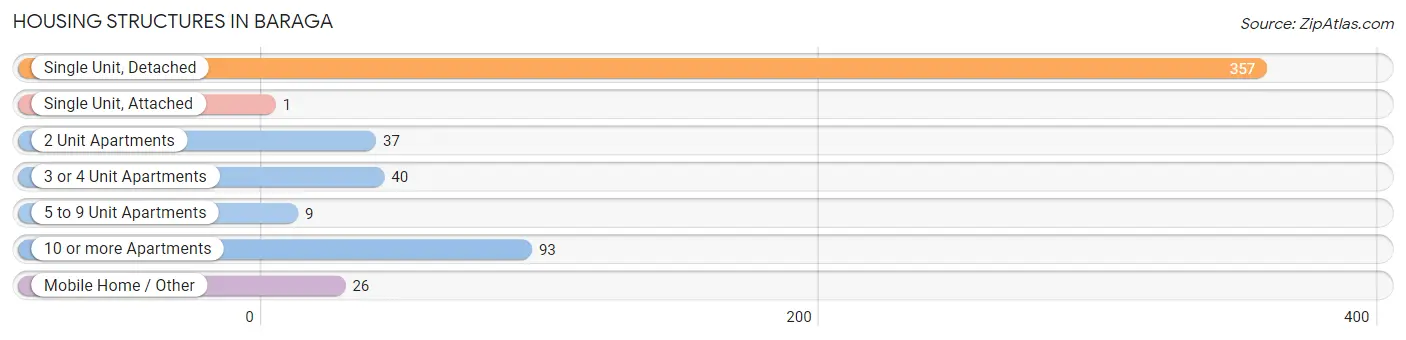
| Structure Type | # Housing Units | % Housing Units |
| Single Unit, Detached | 357 | 63.4% |
| Single Unit, Attached | 1 | 0.2% |
| 2 Unit Apartments | 37 | 6.6% |
| 3 or 4 Unit Apartments | 40 | 7.1% |
| 5 to 9 Unit Apartments | 9 | 1.6% |
| 10 or more Apartments | 93 | 16.5% |
| Mobile Home / Other | 26 | 4.6% |
| Total | 563 | 100.0% |
Housing Structures by Occupancy in Baraga
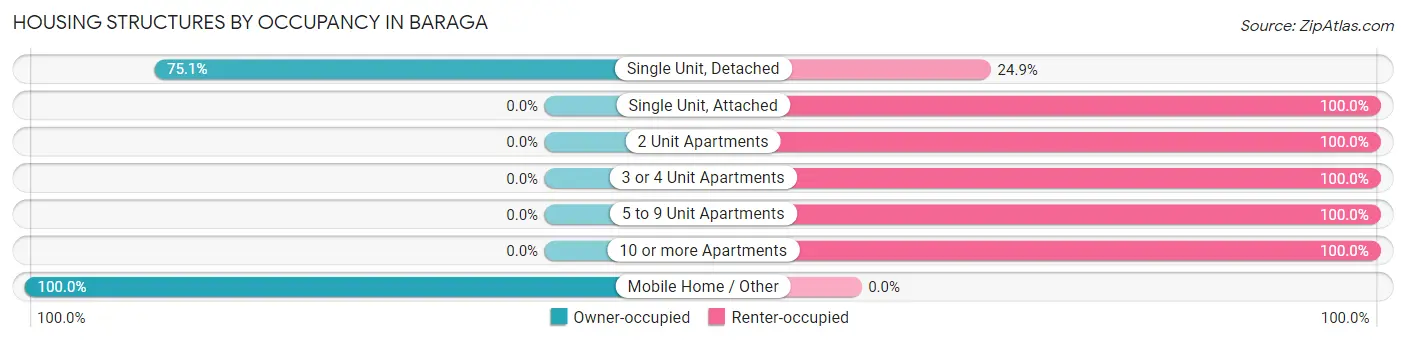
| Structure Type | Owner-occupied | Renter-occupied |
| Single Unit, Detached | 268 (75.1%) | 89 (24.9%) |
| Single Unit, Attached | 0 (0.0%) | 1 (100.0%) |
| 2 Unit Apartments | 0 (0.0%) | 37 (100.0%) |
| 3 or 4 Unit Apartments | 0 (0.0%) | 40 (100.0%) |
| 5 to 9 Unit Apartments | 0 (0.0%) | 9 (100.0%) |
| 10 or more Apartments | 0 (0.0%) | 93 (100.0%) |
| Mobile Home / Other | 26 (100.0%) | 0 (0.0%) |
| Total | 294 (52.2%) | 269 (47.8%) |
Housing Structures by Number of Rooms in Baraga
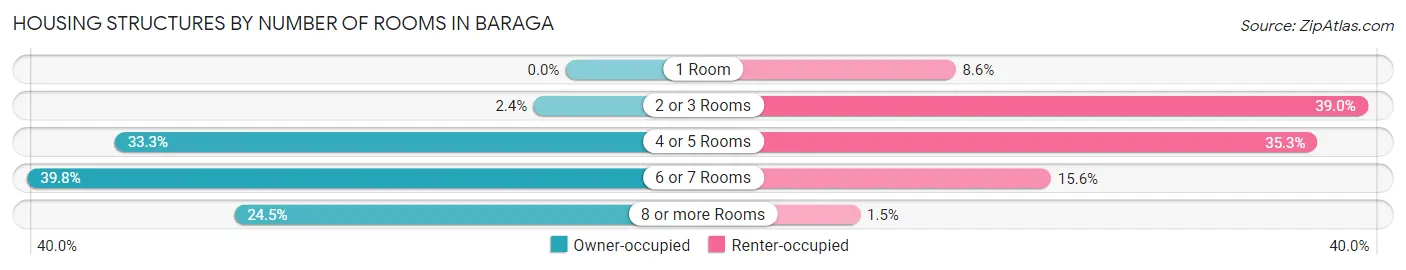
| Number of Rooms | Owner-occupied | Renter-occupied |
| 1 Room | 0 (0.0%) | 23 (8.6%) |
| 2 or 3 Rooms | 7 (2.4%) | 105 (39.0%) |
| 4 or 5 Rooms | 98 (33.3%) | 95 (35.3%) |
| 6 or 7 Rooms | 117 (39.8%) | 42 (15.6%) |
| 8 or more Rooms | 72 (24.5%) | 4 (1.5%) |
| Total | 294 (100.0%) | 269 (100.0%) |
Housing Structure by Heating Type in Baraga
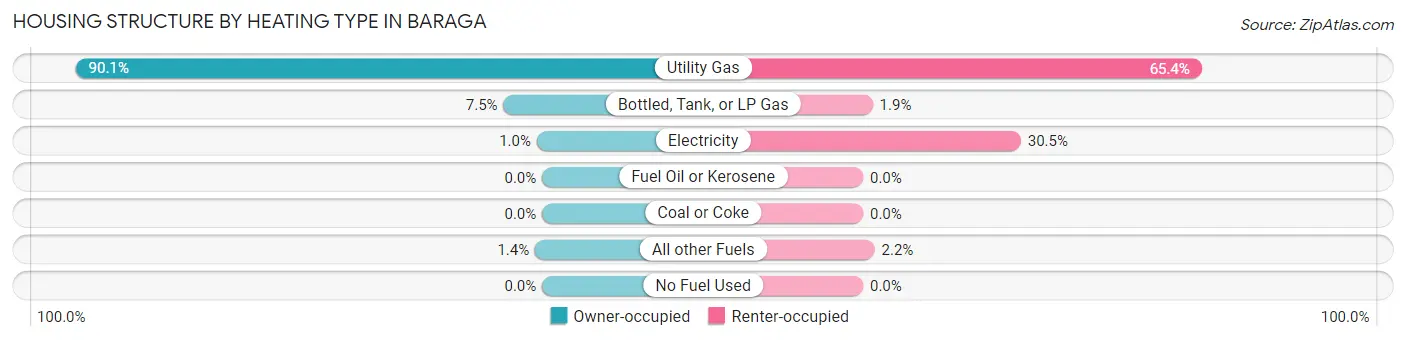
| Heating Type | Owner-occupied | Renter-occupied |
| Utility Gas | 265 (90.1%) | 176 (65.4%) |
| Bottled, Tank, or LP Gas | 22 (7.5%) | 5 (1.9%) |
| Electricity | 3 (1.0%) | 82 (30.5%) |
| Fuel Oil or Kerosene | 0 (0.0%) | 0 (0.0%) |
| Coal or Coke | 0 (0.0%) | 0 (0.0%) |
| All other Fuels | 4 (1.4%) | 6 (2.2%) |
| No Fuel Used | 0 (0.0%) | 0 (0.0%) |
| Total | 294 (100.0%) | 269 (100.0%) |
Household Vehicle Usage in Baraga
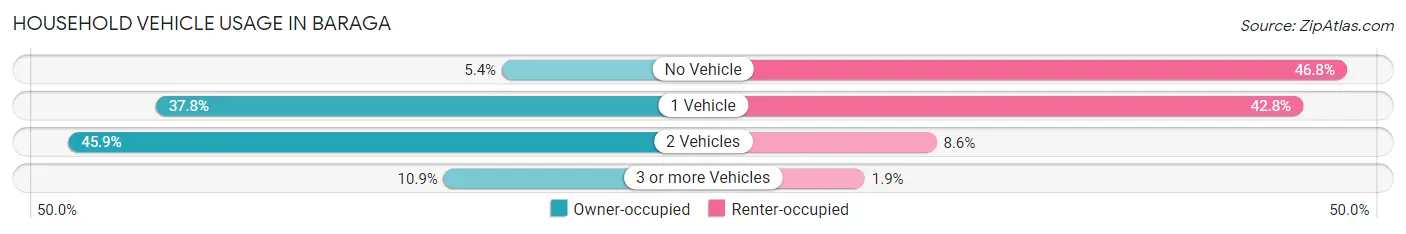
| Vehicles per Household | Owner-occupied | Renter-occupied |
| No Vehicle | 16 (5.4%) | 126 (46.8%) |
| 1 Vehicle | 111 (37.8%) | 115 (42.7%) |
| 2 Vehicles | 135 (45.9%) | 23 (8.6%) |
| 3 or more Vehicles | 32 (10.9%) | 5 (1.9%) |
| Total | 294 (100.0%) | 269 (100.0%) |
Real Estate & Mortgages in Baraga
Real Estate and Mortgage Overview in Baraga
| Characteristic | Without Mortgage | With Mortgage |
| Housing Units | 150 | 144 |
| Median Property Value | $80,700 | $100,000 |
| Median Household Income | $37,273 | $3 |
| Monthly Housing Costs | $428 | $0 |
| Real Estate Taxes | $1,407 | $64 |
Property Value by Mortgage Status in Baraga
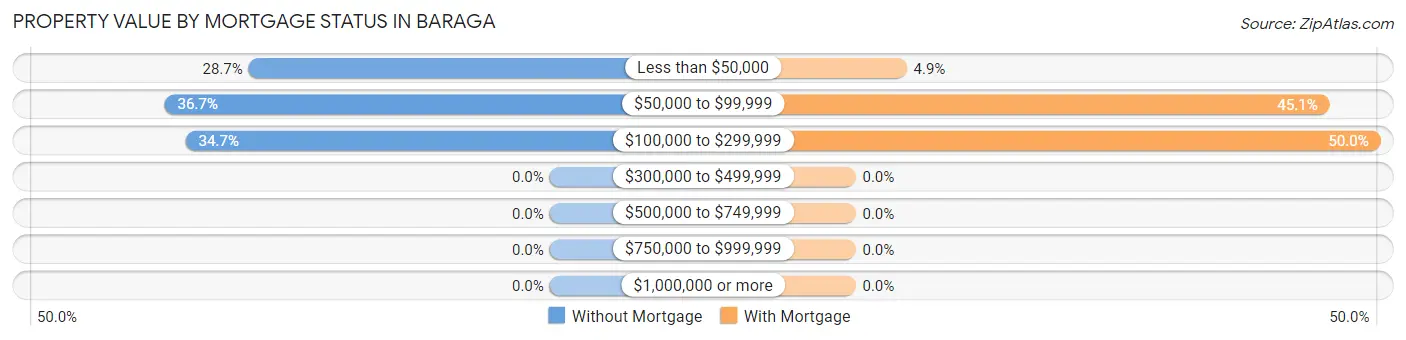
| Property Value | Without Mortgage | With Mortgage |
| Less than $50,000 | 43 (28.7%) | 7 (4.9%) |
| $50,000 to $99,999 | 55 (36.7%) | 65 (45.1%) |
| $100,000 to $299,999 | 52 (34.7%) | 72 (50.0%) |
| $300,000 to $499,999 | 0 (0.0%) | 0 (0.0%) |
| $500,000 to $749,999 | 0 (0.0%) | 0 (0.0%) |
| $750,000 to $999,999 | 0 (0.0%) | 0 (0.0%) |
| $1,000,000 or more | 0 (0.0%) | 0 (0.0%) |
| Total | 150 (100.0%) | 144 (100.0%) |
Household Income by Mortgage Status in Baraga
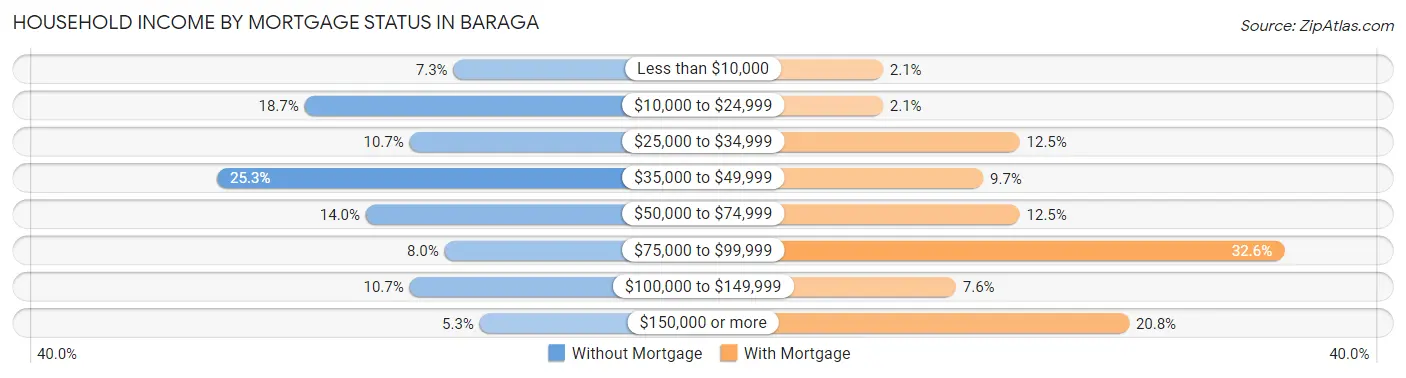
| Household Income | Without Mortgage | With Mortgage |
| Less than $10,000 | 11 (7.3%) | 3 (2.1%) |
| $10,000 to $24,999 | 28 (18.7%) | 3 (2.1%) |
| $25,000 to $34,999 | 16 (10.7%) | 18 (12.5%) |
| $35,000 to $49,999 | 38 (25.3%) | 14 (9.7%) |
| $50,000 to $74,999 | 21 (14.0%) | 18 (12.5%) |
| $75,000 to $99,999 | 12 (8.0%) | 47 (32.6%) |
| $100,000 to $149,999 | 16 (10.7%) | 11 (7.6%) |
| $150,000 or more | 8 (5.3%) | 30 (20.8%) |
| Total | 150 (100.0%) | 144 (100.0%) |
Property Value to Household Income Ratio in Baraga
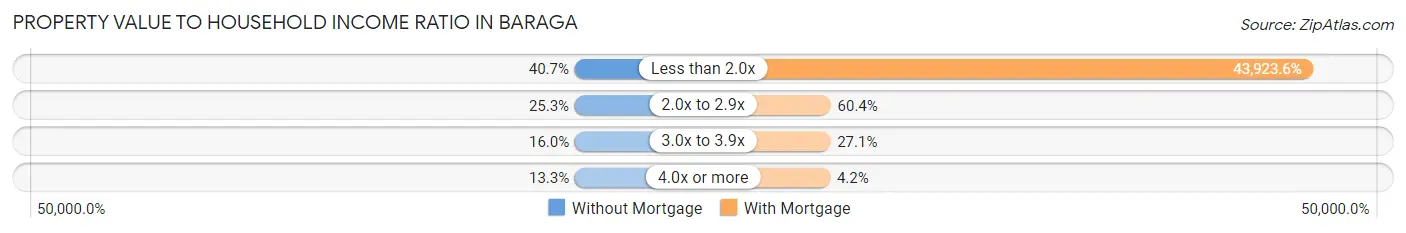
| Value-to-Income Ratio | Without Mortgage | With Mortgage |
| Less than 2.0x | 61 (40.7%) | 63,250 (43,923.6%) |
| 2.0x to 2.9x | 38 (25.3%) | 87 (60.4%) |
| 3.0x to 3.9x | 24 (16.0%) | 39 (27.1%) |
| 4.0x or more | 20 (13.3%) | 6 (4.2%) |
| Total | 150 (100.0%) | 144 (100.0%) |
Real Estate Taxes by Mortgage Status in Baraga
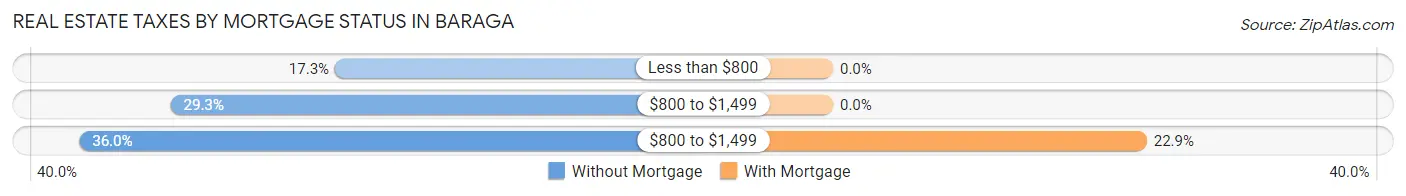
| Property Taxes | Without Mortgage | With Mortgage |
| Less than $800 | 26 (17.3%) | 0 (0.0%) |
| $800 to $1,499 | 44 (29.3%) | 0 (0.0%) |
| $800 to $1,499 | 54 (36.0%) | 33 (22.9%) |
| Total | 150 (100.0%) | 144 (100.0%) |
Health & Disability in Baraga
Health Insurance Coverage by Age in Baraga
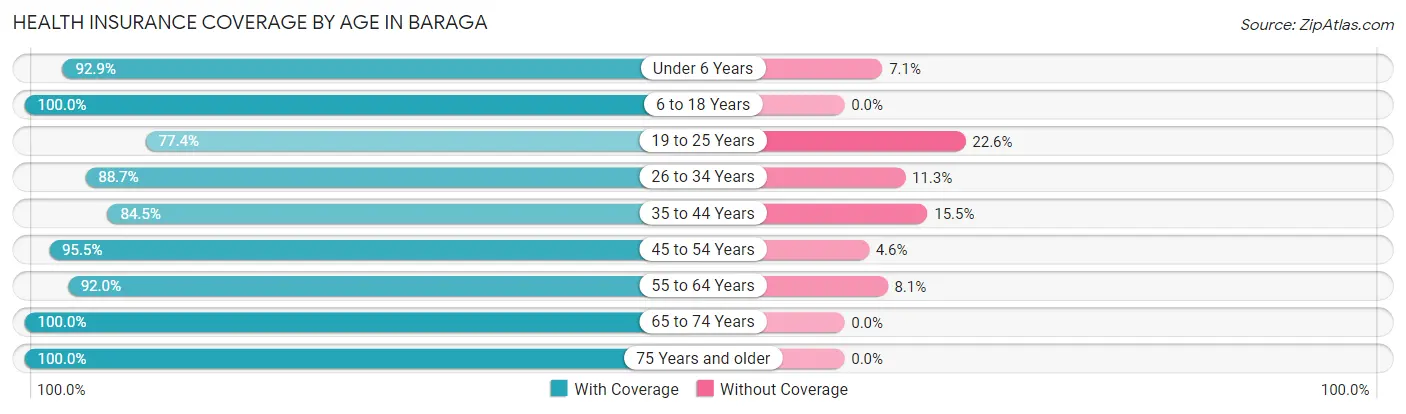
| Age Bracket | With Coverage | Without Coverage |
| Under 6 Years | 92 (92.9%) | 7 (7.1%) |
| 6 to 18 Years | 179 (100.0%) | 0 (0.0%) |
| 19 to 25 Years | 48 (77.4%) | 14 (22.6%) |
| 26 to 34 Years | 141 (88.7%) | 18 (11.3%) |
| 35 to 44 Years | 71 (84.5%) | 13 (15.5%) |
| 45 to 54 Years | 105 (95.5%) | 5 (4.5%) |
| 55 to 64 Years | 137 (91.9%) | 12 (8.1%) |
| 65 to 74 Years | 169 (100.0%) | 0 (0.0%) |
| 75 Years and older | 108 (100.0%) | 0 (0.0%) |
| Total | 1,050 (93.8%) | 69 (6.2%) |
Health Insurance Coverage by Citizenship Status in Baraga
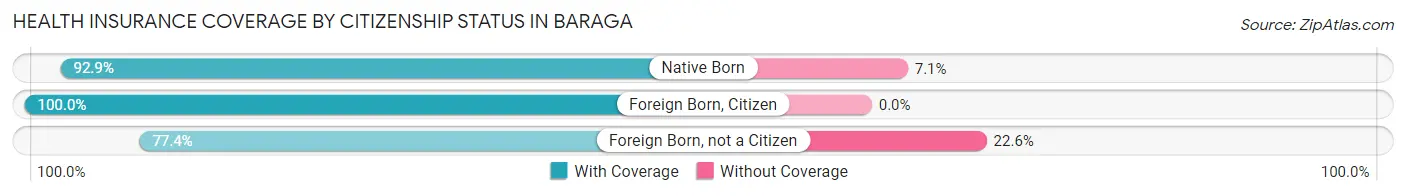
| Citizenship Status | With Coverage | Without Coverage |
| Native Born | 92 (92.9%) | 7 (7.1%) |
| Foreign Born, Citizen | 179 (100.0%) | 0 (0.0%) |
| Foreign Born, not a Citizen | 48 (77.4%) | 14 (22.6%) |
Health Insurance Coverage by Household Income in Baraga
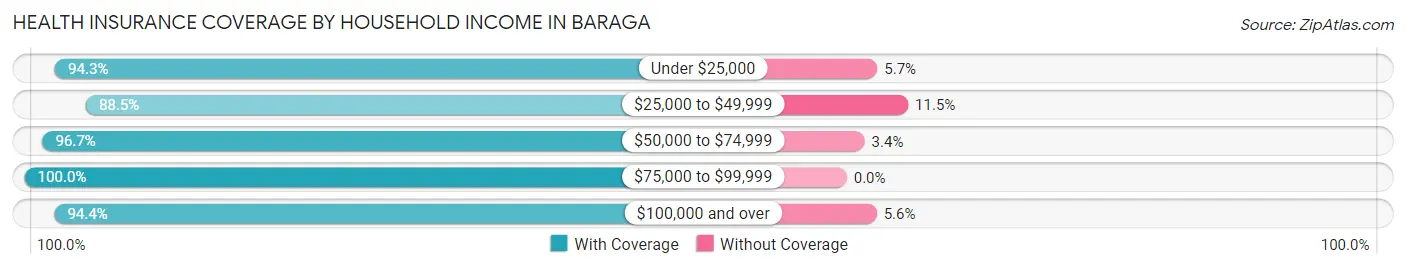
| Household Income | With Coverage | Without Coverage |
| Under $25,000 | 263 (94.3%) | 16 (5.7%) |
| $25,000 to $49,999 | 254 (88.5%) | 33 (11.5%) |
| $50,000 to $74,999 | 202 (96.7%) | 7 (3.4%) |
| $75,000 to $99,999 | 103 (100.0%) | 0 (0.0%) |
| $100,000 and over | 219 (94.4%) | 13 (5.6%) |
Public vs Private Health Insurance Coverage by Age in Baraga
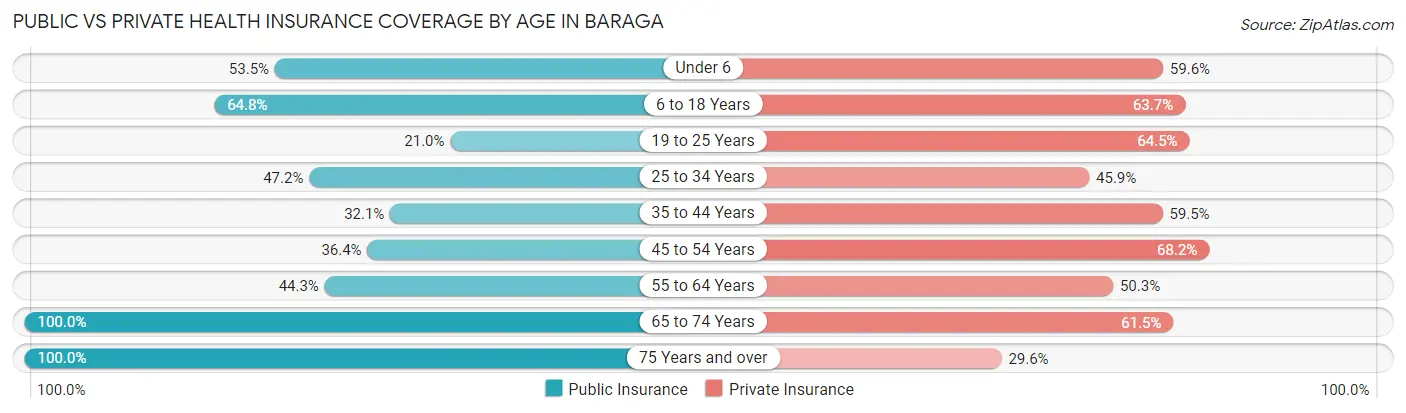
| Age Bracket | Public Insurance | Private Insurance |
| Under 6 | 53 (53.5%) | 59 (59.6%) |
| 6 to 18 Years | 116 (64.8%) | 114 (63.7%) |
| 19 to 25 Years | 13 (21.0%) | 40 (64.5%) |
| 25 to 34 Years | 75 (47.2%) | 73 (45.9%) |
| 35 to 44 Years | 27 (32.1%) | 50 (59.5%) |
| 45 to 54 Years | 40 (36.4%) | 75 (68.2%) |
| 55 to 64 Years | 66 (44.3%) | 75 (50.3%) |
| 65 to 74 Years | 169 (100.0%) | 104 (61.5%) |
| 75 Years and over | 108 (100.0%) | 32 (29.6%) |
| Total | 667 (59.6%) | 622 (55.6%) |
Disability Status by Sex by Age in Baraga
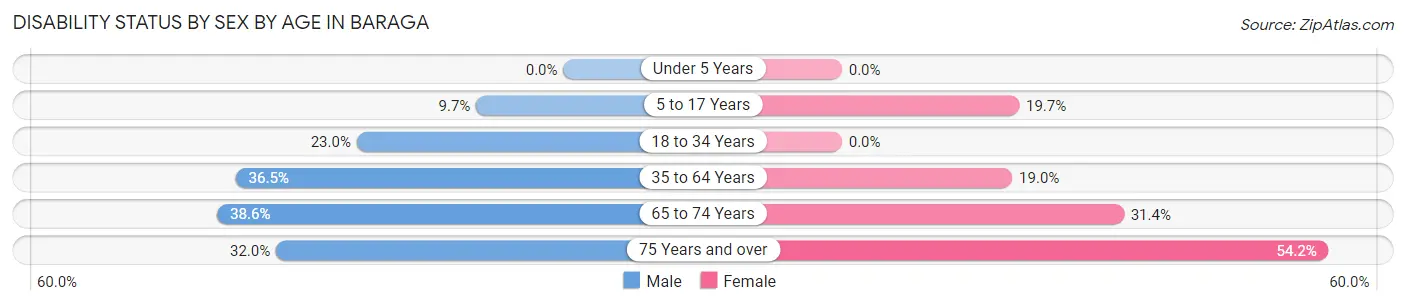
| Age Bracket | Male | Female |
| Under 5 Years | 0 (0.0%) | 0 (0.0%) |
| 5 to 17 Years | 10 (9.7%) | 15 (19.7%) |
| 18 to 34 Years | 26 (23.0%) | 0 (0.0%) |
| 35 to 64 Years | 54 (36.5%) | 37 (19.0%) |
| 65 to 74 Years | 32 (38.6%) | 27 (31.4%) |
| 75 Years and over | 8 (32.0%) | 45 (54.2%) |
Disability Class by Sex by Age in Baraga
Disability Class: Hearing Difficulty
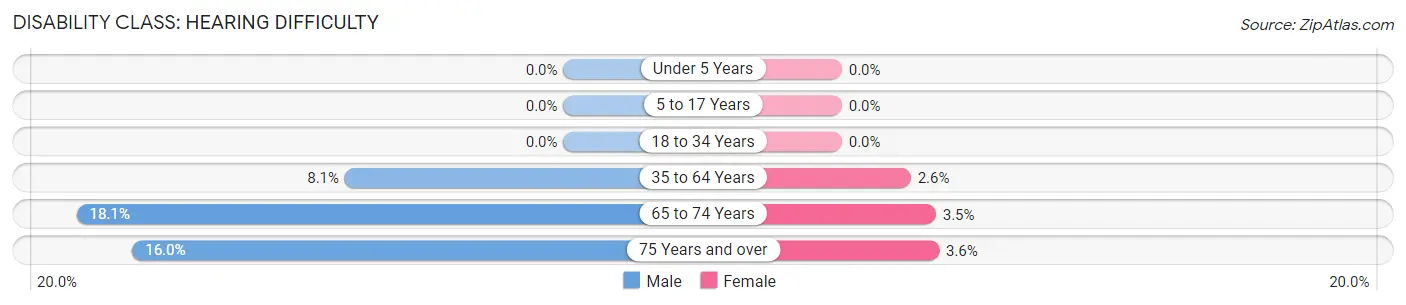
| Age Bracket | Male | Female |
| Under 5 Years | 0 (0.0%) | 0 (0.0%) |
| 5 to 17 Years | 0 (0.0%) | 0 (0.0%) |
| 18 to 34 Years | 0 (0.0%) | 0 (0.0%) |
| 35 to 64 Years | 12 (8.1%) | 5 (2.6%) |
| 65 to 74 Years | 15 (18.1%) | 3 (3.5%) |
| 75 Years and over | 4 (16.0%) | 3 (3.6%) |
Disability Class: Vision Difficulty
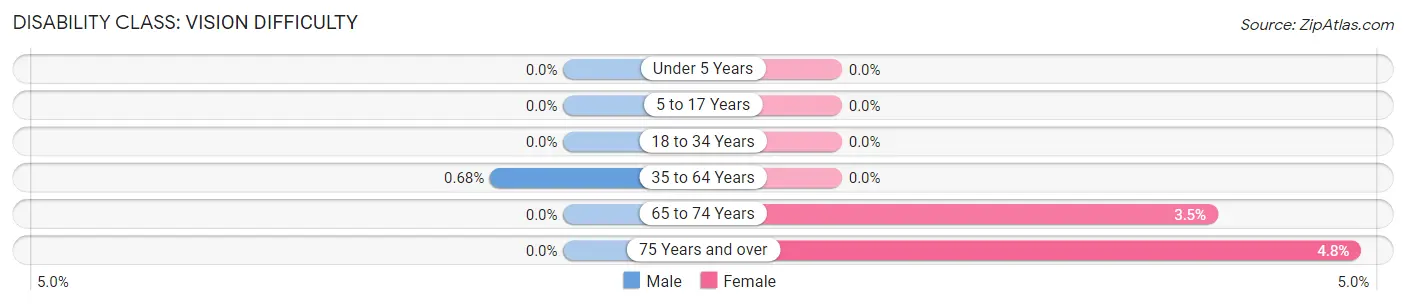
| Age Bracket | Male | Female |
| Under 5 Years | 0 (0.0%) | 0 (0.0%) |
| 5 to 17 Years | 0 (0.0%) | 0 (0.0%) |
| 18 to 34 Years | 0 (0.0%) | 0 (0.0%) |
| 35 to 64 Years | 1 (0.7%) | 0 (0.0%) |
| 65 to 74 Years | 0 (0.0%) | 3 (3.5%) |
| 75 Years and over | 0 (0.0%) | 4 (4.8%) |
Disability Class: Cognitive Difficulty
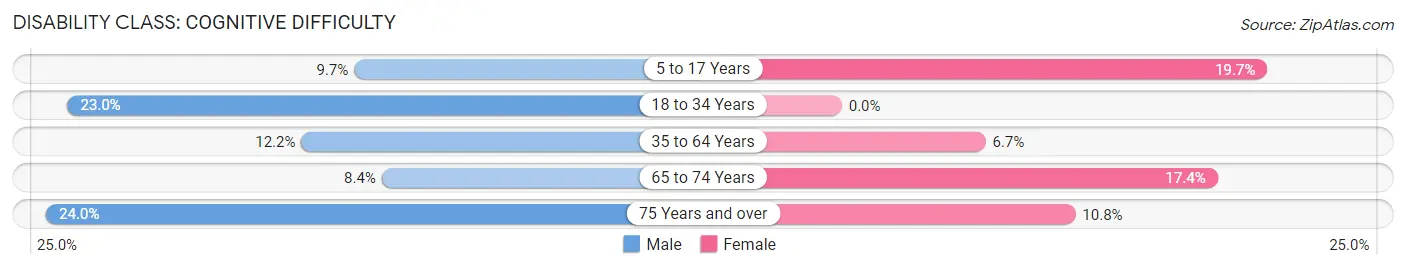
| Age Bracket | Male | Female |
| 5 to 17 Years | 10 (9.7%) | 15 (19.7%) |
| 18 to 34 Years | 26 (23.0%) | 0 (0.0%) |
| 35 to 64 Years | 18 (12.2%) | 13 (6.7%) |
| 65 to 74 Years | 7 (8.4%) | 15 (17.4%) |
| 75 Years and over | 6 (24.0%) | 9 (10.8%) |
Disability Class: Ambulatory Difficulty

| Age Bracket | Male | Female |
| 5 to 17 Years | 0 (0.0%) | 0 (0.0%) |
| 18 to 34 Years | 0 (0.0%) | 0 (0.0%) |
| 35 to 64 Years | 24 (16.2%) | 20 (10.3%) |
| 65 to 74 Years | 16 (19.3%) | 14 (16.3%) |
| 75 Years and over | 2 (8.0%) | 41 (49.4%) |
Disability Class: Self-Care Difficulty
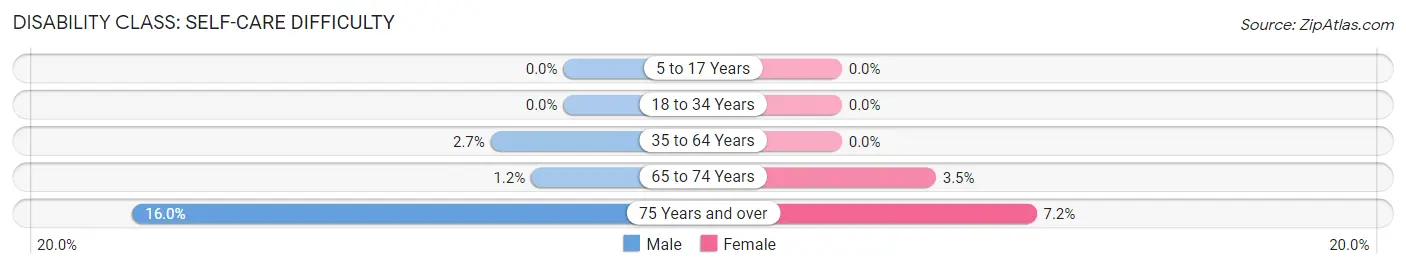
| Age Bracket | Male | Female |
| 5 to 17 Years | 0 (0.0%) | 0 (0.0%) |
| 18 to 34 Years | 0 (0.0%) | 0 (0.0%) |
| 35 to 64 Years | 4 (2.7%) | 0 (0.0%) |
| 65 to 74 Years | 1 (1.2%) | 3 (3.5%) |
| 75 Years and over | 4 (16.0%) | 6 (7.2%) |
Technology Access in Baraga
Computing Device Access in Baraga
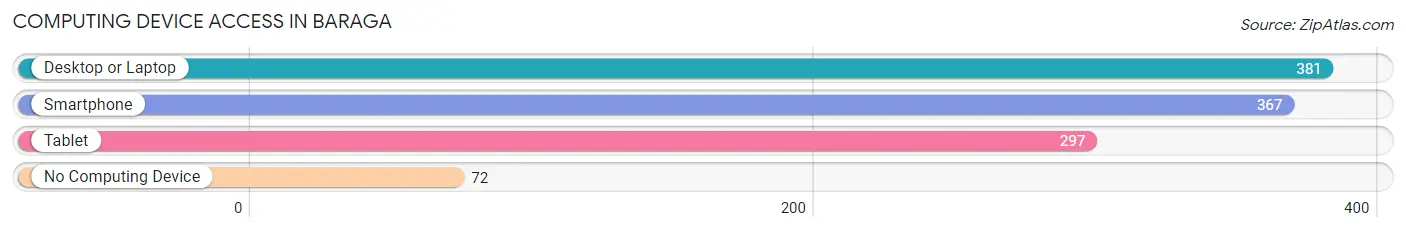
| Device Type | # Households | % Households |
| Desktop or Laptop | 381 | 67.7% |
| Smartphone | 367 | 65.2% |
| Tablet | 297 | 52.7% |
| No Computing Device | 72 | 12.8% |
| Total | 563 | 100.0% |
Internet Access in Baraga
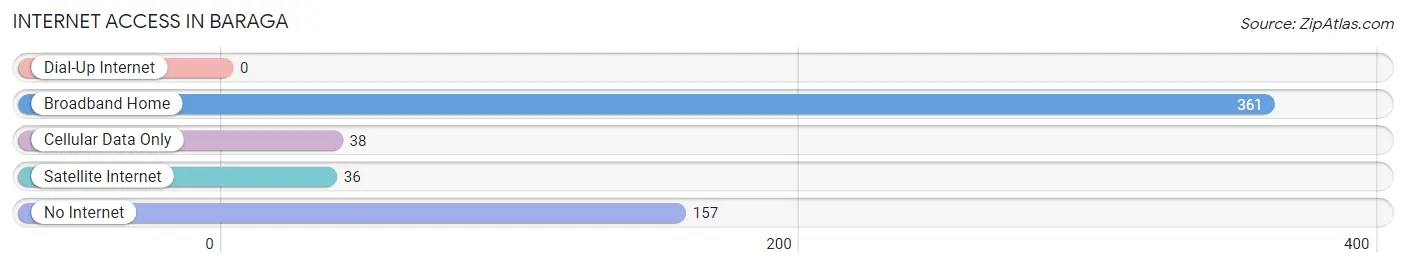
| Internet Type | # Households | % Households |
| Dial-Up Internet | 0 | 0.0% |
| Broadband Home | 361 | 64.1% |
| Cellular Data Only | 38 | 6.8% |
| Satellite Internet | 36 | 6.4% |
| No Internet | 157 | 27.9% |
| Total | 563 | 100.0% |
Baraga Summary
Baraga, Michigan is a small town located in the Upper Peninsula of Michigan. It is the county seat of Baraga County and is situated on the shores of Lake Superior. The town has a population of 1,074 people, according to the 2010 census.
History
Baraga was founded in 1875 by Father Frederic Baraga, a Slovenian missionary priest. He was sent to the area by the Bishop of Detroit to minister to the local Native American population. Father Baraga established a mission and school in the area, which eventually grew into the town of Baraga.
The town was named after Father Baraga and was incorporated in 1883. It was the first incorporated town in Baraga County.
Geography
Baraga is located in the Upper Peninsula of Michigan, on the shores of Lake Superior. It is situated in the northern part of the state, about 30 miles east of Marquette. The town is surrounded by forests and lakes, and is home to several state parks and recreation areas.
The climate in Baraga is typical of the Upper Peninsula, with cold winters and warm summers. The average temperature in January is around 10 degrees Fahrenheit, while the average temperature in July is around 70 degrees Fahrenheit.
Economy
The economy of Baraga is largely based on tourism and natural resources. The town is home to several state parks and recreation areas, which attract visitors from all over the country. The town is also home to several logging and mining operations, which provide jobs for many of the town's residents.
The town is also home to several small businesses, including restaurants, shops, and other services. The town is also home to a small hospital and several medical clinics.
Demographics
According to the 2010 census, the population of Baraga was 1,074. The racial makeup of the town was 97.2% White, 0.7% Native American, 0.2% Asian, 0.1% from other races, and 1.8% from two or more races.
The median household income in Baraga was $35,938, and the median family income was $41,250. The per capita income was $17,945. About 16.2% of the population was below the poverty line.
Baraga is a small town with a rich history and a strong sense of community. The town is home to several state parks and recreation areas, and is a popular destination for tourists. The town is also home to several small businesses, which provide jobs for many of the town's residents.
Common Questions
What is Per Capita Income in Baraga?
Per Capita income in Baraga is $13,066.
What is the Median Family Income in Baraga?
Median Family Income in Baraga is $55,313.
What is the Median Household income in Baraga?
Median Household Income in Baraga is $32,569.
What is Income or Wage Gap in Baraga?
Income or Wage Gap in Baraga is 6.1%.
Women in Baraga earn 93.9 cents for every dollar earned by a man.
What is Inequality or Gini Index in Baraga?
Inequality or Gini Index in Baraga is 0.46.
What is the Total Population of Baraga?
Total Population of Baraga is 2,020.
What is the Total Male Population of Baraga?
Total Male Population of Baraga is 1,417.
What is the Total Female Population of Baraga?
Total Female Population of Baraga is 603.
What is the Ratio of Males per 100 Females in Baraga?
There are 234.99 Males per 100 Females in Baraga.
What is the Ratio of Females per 100 Males in Baraga?
There are 42.55 Females per 100 Males in Baraga.
What is the Median Population Age in Baraga?
Median Population Age in Baraga is 35.7 Years.
What is the Average Family Size in Baraga
Average Family Size in Baraga is 2.8 People.
What is the Average Household Size in Baraga
Average Household Size in Baraga is 2.0 People.
How Large is the Labor Force in Baraga?
There are 451 People in the Labor Forcein in Baraga.
What is the Percentage of People in the Labor Force in Baraga?
25.3% of People are in the Labor Force in Baraga.
What is the Unemployment Rate in Baraga?
Unemployment Rate in Baraga is 4.4%.