West Ishpeming, MI Map & Demographics
West Ishpeming Map
West Ishpeming Overview
$35,266
PER CAPITA INCOME
$90,386
AVG FAMILY INCOME
$78,750
AVG HOUSEHOLD INCOME
17.6%
WAGE / INCOME GAP [ % ]
82.4¢/ $1
WAGE / INCOME GAP [ $ ]
0.38
INEQUALITY / GINI INDEX
2,713
TOTAL POPULATION
1,499
MALE POPULATION
1,214
FEMALE POPULATION
123.48
MALES / 100 FEMALES
80.99
FEMALES / 100 MALES
41.8
MEDIAN AGE
2.8
AVG FAMILY SIZE
2.4
AVG HOUSEHOLD SIZE
1,274
LABOR FORCE [ PEOPLE ]
56.7%
PERCENT IN LABOR FORCE
5.3%
UNEMPLOYMENT RATE
Income in West Ishpeming
Income Overview in West Ishpeming
Per Capita Income in West Ishpeming is $35,266, while median incomes of families and households are $90,386 and $78,750 respectively.
| Characteristic | Number | Measure |
| Per Capita Income | 2,713 | $35,266 |
| Median Family Income | 835 | $90,386 |
| Mean Family Income | 835 | $95,248 |
| Median Household Income | 1,100 | $78,750 |
| Mean Household Income | 1,100 | $87,155 |
| Income Deficit | 835 | $0 |
| Wage / Income Gap (%) | 2,713 | 17.55% |
| Wage / Income Gap ($) | 2,713 | 82.45¢ per $1 |
| Gini / Inequality Index | 2,713 | 0.38 |
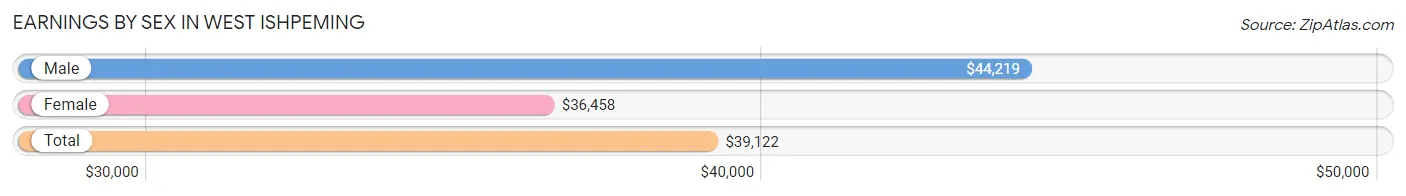
Earnings by Sex in West Ishpeming
Average Earnings in West Ishpeming are $39,122, $44,219 for men and $36,458 for women, a difference of 17.5%.
| Sex | Number | Average Earnings |
| Male | 801 (57.9%) | $44,219 |
| Female | 583 (42.1%) | $36,458 |
| Total | 1,384 (100.0%) | $39,122 |
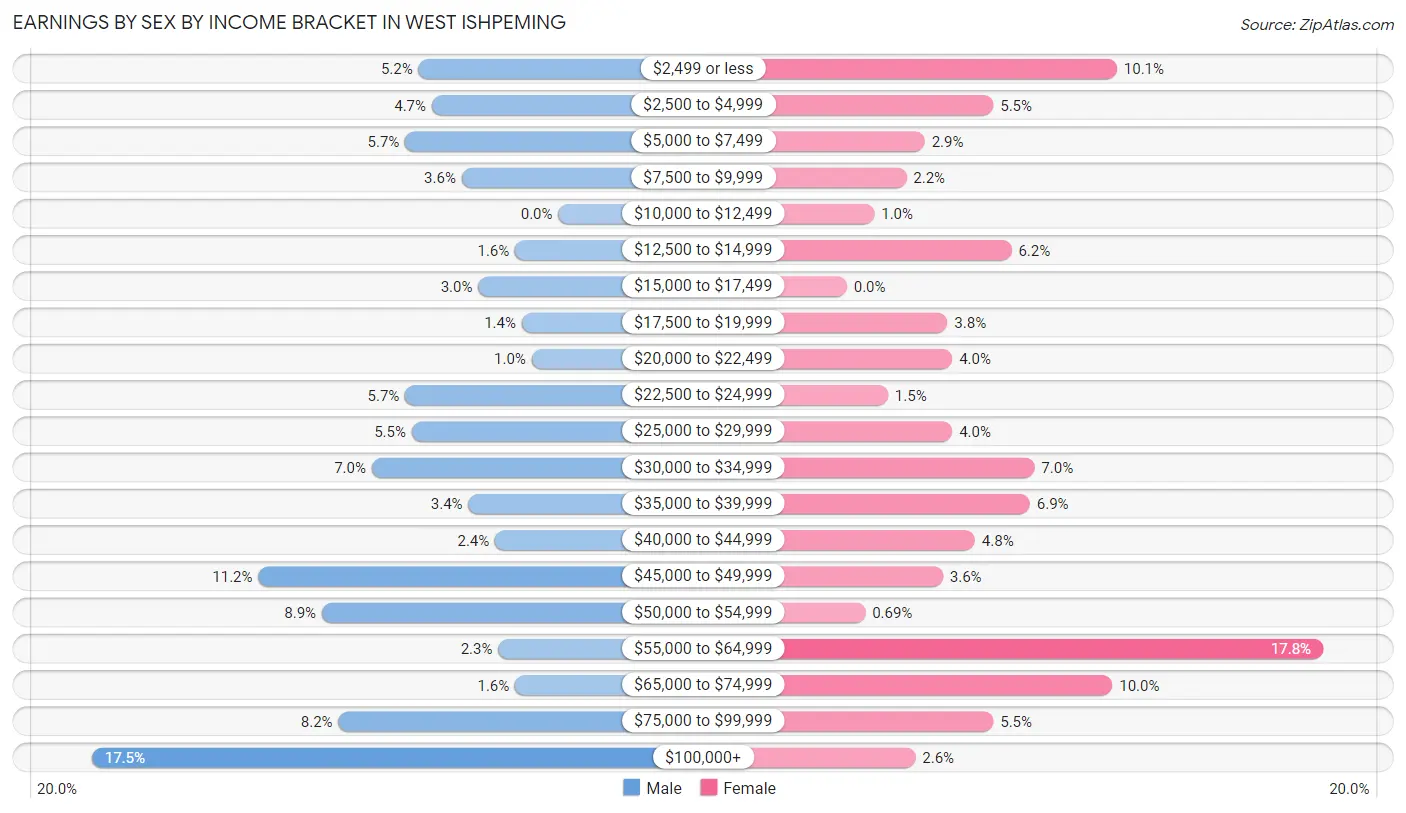
Earnings by Sex by Income Bracket in West Ishpeming
The most common earnings brackets in West Ishpeming are $100,000+ for men (140 | 17.5%) and $55,000 to $64,999 for women (104 | 17.8%).
| Income | Male | Female |
| $2,499 or less | 42 (5.2%) | 59 (10.1%) |
| $2,500 to $4,999 | 38 (4.7%) | 32 (5.5%) |
| $5,000 to $7,499 | 46 (5.7%) | 17 (2.9%) |
| $7,500 to $9,999 | 29 (3.6%) | 13 (2.2%) |
| $10,000 to $12,499 | 0 (0.0%) | 6 (1.0%) |
| $12,500 to $14,999 | 13 (1.6%) | 36 (6.2%) |
| $15,000 to $17,499 | 24 (3.0%) | 0 (0.0%) |
| $17,500 to $19,999 | 11 (1.4%) | 22 (3.8%) |
| $20,000 to $22,499 | 8 (1.0%) | 23 (4.0%) |
| $22,500 to $24,999 | 46 (5.7%) | 9 (1.5%) |
| $25,000 to $29,999 | 44 (5.5%) | 23 (4.0%) |
| $30,000 to $34,999 | 56 (7.0%) | 41 (7.0%) |
| $35,000 to $39,999 | 27 (3.4%) | 40 (6.9%) |
| $40,000 to $44,999 | 19 (2.4%) | 28 (4.8%) |
| $45,000 to $49,999 | 90 (11.2%) | 21 (3.6%) |
| $50,000 to $54,999 | 71 (8.9%) | 4 (0.7%) |
| $55,000 to $64,999 | 18 (2.2%) | 104 (17.8%) |
| $65,000 to $74,999 | 13 (1.6%) | 58 (10.0%) |
| $75,000 to $99,999 | 66 (8.2%) | 32 (5.5%) |
| $100,000+ | 140 (17.5%) | 15 (2.6%) |
| Total | 801 (100.0%) | 583 (100.0%) |
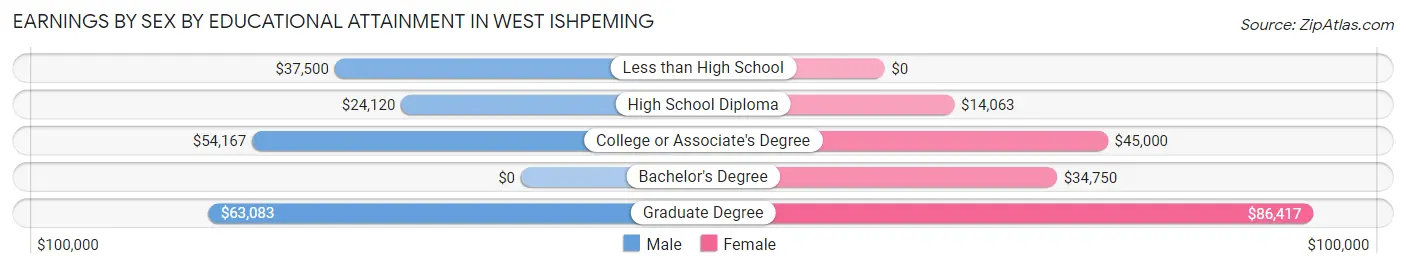
Earnings by Sex by Educational Attainment in West Ishpeming
Average earnings in West Ishpeming are $46,589 for men and $43,083 for women, a difference of 7.5%. Men with an educational attainment of graduate degree enjoy the highest average annual earnings of $63,083, while those with high school diploma education earn the least with $24,120. Women with an educational attainment of graduate degree earn the most with the average annual earnings of $86,417, while those with high school diploma education have the smallest earnings of $14,063.
| Educational Attainment | Male Income | Female Income |
| Less than High School | $37,500 | $0 |
| High School Diploma | $24,120 | $14,063 |
| College or Associate's Degree | $54,167 | $45,000 |
| Bachelor's Degree | - | - |
| Graduate Degree | $63,083 | $86,417 |
| Total | $46,589 | $43,083 |
Family Income in West Ishpeming
Family Income Brackets in West Ishpeming
According to the West Ishpeming family income data, there are 230 families falling into the $100,000 to $149,999 income range, which is the most common income bracket and makes up 27.5% of all families.
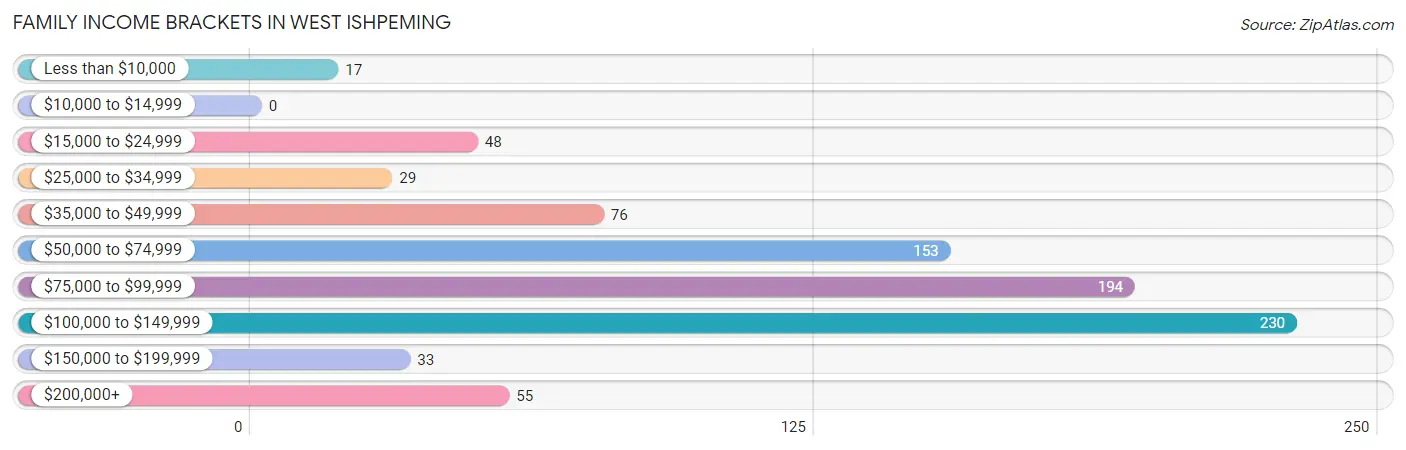
| Income Bracket | # Families | % Families |
| Less than $10,000 | 17 | 2.0% |
| $10,000 to $14,999 | 0 | 0.0% |
| $15,000 to $24,999 | 48 | 5.7% |
| $25,000 to $34,999 | 29 | 3.5% |
| $35,000 to $49,999 | 76 | 9.1% |
| $50,000 to $74,999 | 153 | 18.3% |
| $75,000 to $99,999 | 194 | 23.2% |
| $100,000 to $149,999 | 230 | 27.5% |
| $150,000 to $199,999 | 33 | 4.0% |
| $200,000+ | 55 | 6.6% |
Family Income by Famaliy Size in West Ishpeming
5-person families (47 | 5.6%) account for the highest median family income in West Ishpeming with $143,011 per family, while 2-person families (491 | 58.8%) have the highest median income of $35,542 per family member.
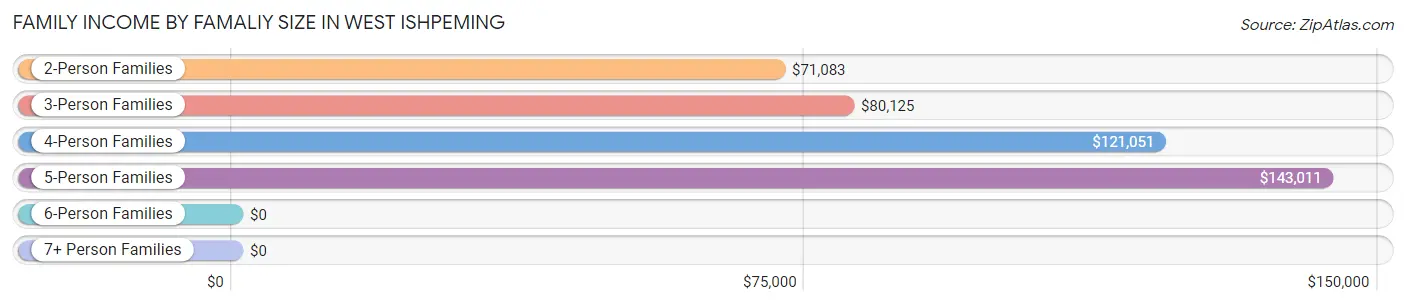
| Income Bracket | # Families | Median Income |
| 2-Person Families | 491 (58.8%) | $71,083 |
| 3-Person Families | 122 (14.6%) | $80,125 |
| 4-Person Families | 163 (19.5%) | $121,051 |
| 5-Person Families | 47 (5.6%) | $143,011 |
| 6-Person Families | 0 (0.0%) | $0 |
| 7+ Person Families | 12 (1.4%) | $0 |
| Total | 835 (100.0%) | $90,386 |
Family Income by Number of Earners in West Ishpeming
The median family income in West Ishpeming is $90,386, with families comprising 3+ earners (71) having the highest median family income of $121,750, while families with no earners (186) have the lowest median family income of $55,833, accounting for 8.5% and 22.3% of families, respectively.
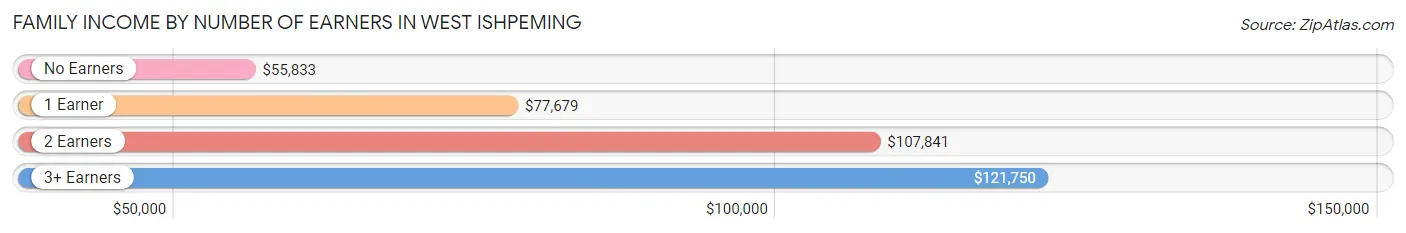
| Number of Earners | # Families | Median Income |
| No Earners | 186 (22.3%) | $55,833 |
| 1 Earner | 207 (24.8%) | $77,679 |
| 2 Earners | 371 (44.4%) | $107,841 |
| 3+ Earners | 71 (8.5%) | $121,750 |
| Total | 835 (100.0%) | $90,386 |
Household Income in West Ishpeming
Household Income Brackets in West Ishpeming
With 270 households falling in the category, the $100,000 to $149,999 income range is the most frequent in West Ishpeming, accounting for 24.5% of all households. In contrast, only 26 households (2.4%) fall into the $10,000 to $14,999 income bracket, making it the least populous group.
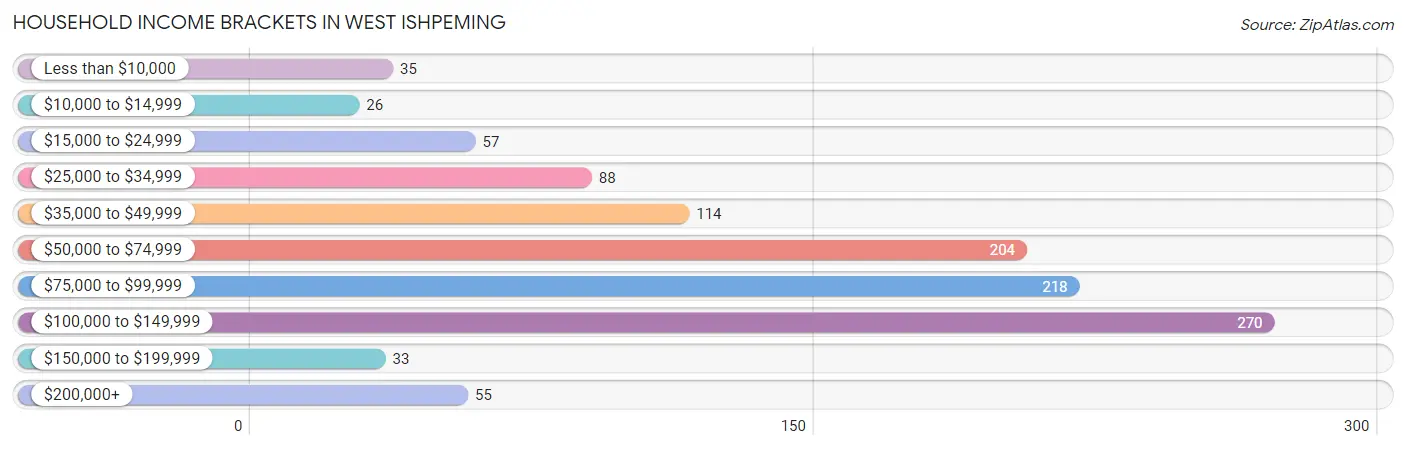
| Income Bracket | # Households | % Households |
| Less than $10,000 | 35 | 3.2% |
| $10,000 to $14,999 | 26 | 2.4% |
| $15,000 to $24,999 | 57 | 5.2% |
| $25,000 to $34,999 | 88 | 8.0% |
| $35,000 to $49,999 | 114 | 10.4% |
| $50,000 to $74,999 | 204 | 18.5% |
| $75,000 to $99,999 | 218 | 19.8% |
| $100,000 to $149,999 | 270 | 24.5% |
| $150,000 to $199,999 | 33 | 3.0% |
| $200,000+ | 55 | 5.0% |
Household Income by Householder Age in West Ishpeming
The median household income in West Ishpeming is $78,750, with the highest median household income of $103,370 found in the 25 to 44 years age bracket for the primary householder. A total of 338 households (30.7%) fall into this category. Meanwhile, the 15 to 24 years age bracket for the primary householder has the lowest median household income of $0, with 46 households (4.2%) in this group.
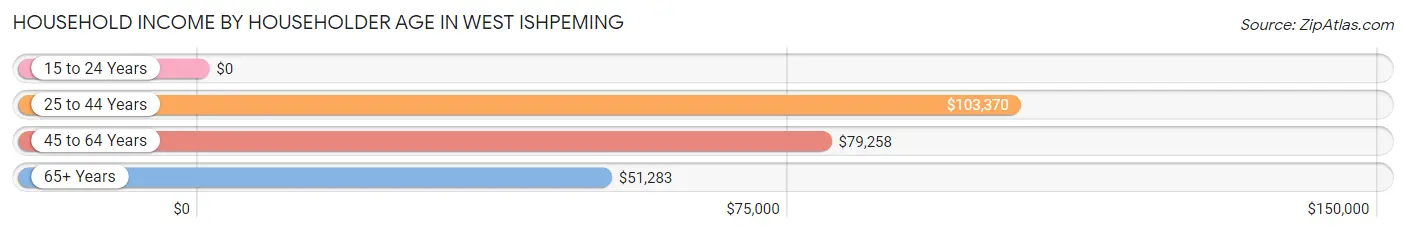
| Income Bracket | # Households | Median Income |
| 15 to 24 Years | 46 (4.2%) | $0 |
| 25 to 44 Years | 338 (30.7%) | $103,370 |
| 45 to 64 Years | 361 (32.8%) | $79,258 |
| 65+ Years | 355 (32.3%) | $51,283 |
| Total | 1,100 (100.0%) | $78,750 |
Poverty in West Ishpeming
Income Below Poverty by Sex and Age in West Ishpeming
With 5.0% poverty level for males and 6.5% for females among the residents of West Ishpeming, 25 to 34 year old males and 45 to 54 year old females are the most vulnerable to poverty, with 22 males (17.7%) and 32 females (26.5%) in their respective age groups living below the poverty level.
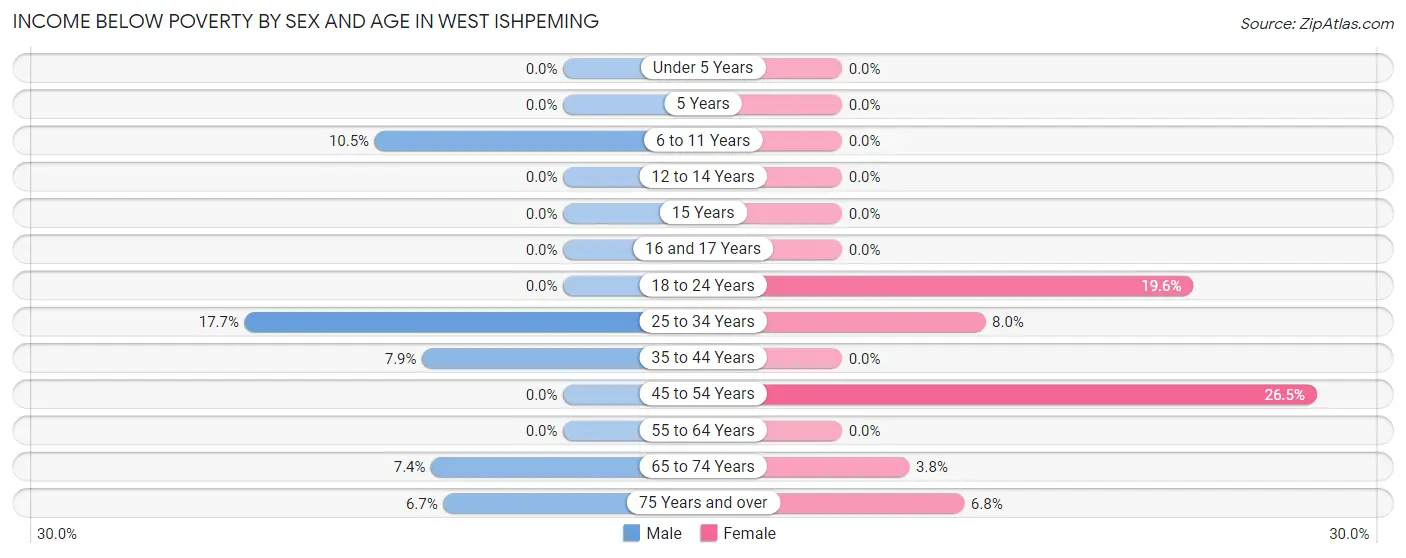
| Age Bracket | Male | Female |
| Under 5 Years | 0 (0.0%) | 0 (0.0%) |
| 5 Years | 0 (0.0%) | 0 (0.0%) |
| 6 to 11 Years | 15 (10.5%) | 0 (0.0%) |
| 12 to 14 Years | 0 (0.0%) | 0 (0.0%) |
| 15 Years | 0 (0.0%) | 0 (0.0%) |
| 16 and 17 Years | 0 (0.0%) | 0 (0.0%) |
| 18 to 24 Years | 0 (0.0%) | 18 (19.6%) |
| 25 to 34 Years | 22 (17.7%) | 13 (8.0%) |
| 35 to 44 Years | 15 (7.9%) | 0 (0.0%) |
| 45 to 54 Years | 0 (0.0%) | 32 (26.5%) |
| 55 to 64 Years | 0 (0.0%) | 0 (0.0%) |
| 65 to 74 Years | 15 (7.3%) | 6 (3.7%) |
| 75 Years and over | 7 (6.7%) | 7 (6.8%) |
| Total | 74 (5.0%) | 76 (6.5%) |
Income Above Poverty by Sex and Age in West Ishpeming
According to the poverty statistics in West Ishpeming, males aged under 5 years and females aged under 5 years are the age groups that are most secure financially, with 100.0% of males and 100.0% of females in these age groups living above the poverty line.
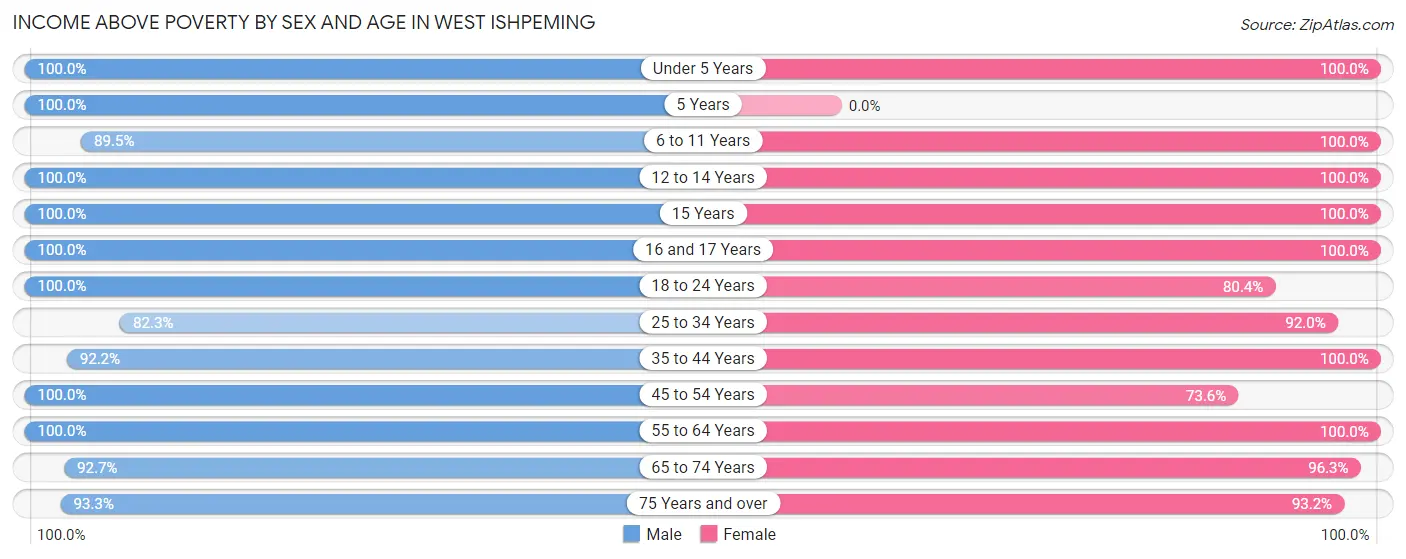
| Age Bracket | Male | Female |
| Under 5 Years | 69 (100.0%) | 45 (100.0%) |
| 5 Years | 21 (100.0%) | 0 (0.0%) |
| 6 to 11 Years | 128 (89.5%) | 35 (100.0%) |
| 12 to 14 Years | 72 (100.0%) | 32 (100.0%) |
| 15 Years | 36 (100.0%) | 13 (100.0%) |
| 16 and 17 Years | 47 (100.0%) | 54 (100.0%) |
| 18 to 24 Years | 135 (100.0%) | 74 (80.4%) |
| 25 to 34 Years | 102 (82.3%) | 150 (92.0%) |
| 35 to 44 Years | 176 (92.1%) | 174 (100.0%) |
| 45 to 54 Years | 136 (100.0%) | 89 (73.6%) |
| 55 to 64 Years | 189 (100.0%) | 176 (100.0%) |
| 65 to 74 Years | 189 (92.6%) | 154 (96.3%) |
| 75 Years and over | 98 (93.3%) | 96 (93.2%) |
| Total | 1,398 (95.0%) | 1,092 (93.5%) |
Income Below Poverty Among Married-Couple Families in West Ishpeming
The poverty statistics for married-couple families in West Ishpeming show that 3.3% or 23 of the total 693 families live below the poverty line. Families with no children have the highest poverty rate of 4.9%, comprising of 23 families. On the other hand, families with 1 or 2 children have the lowest poverty rate of 0.0%, which includes 0 families.
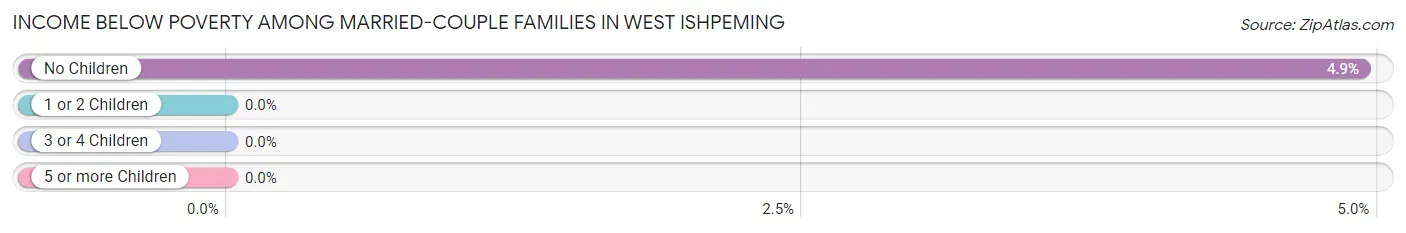
| Children | Above Poverty | Below Poverty |
| No Children | 444 (95.1%) | 23 (4.9%) |
| 1 or 2 Children | 173 (100.0%) | 0 (0.0%) |
| 3 or 4 Children | 53 (100.0%) | 0 (0.0%) |
| 5 or more Children | 0 (0.0%) | 0 (0.0%) |
| Total | 670 (96.7%) | 23 (3.3%) |
Income Below Poverty Among Single-Parent Households in West Ishpeming
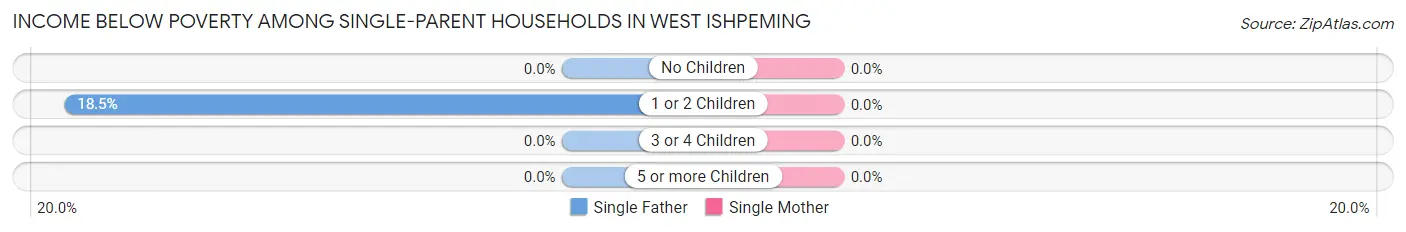
| Children | Single Father | Single Mother |
| No Children | 0 (0.0%) | 0 (0.0%) |
| 1 or 2 Children | 15 (18.5%) | 0 (0.0%) |
| 3 or 4 Children | 0 (0.0%) | 0 (0.0%) |
| 5 or more Children | 0 (0.0%) | 0 (0.0%) |
| Total | 15 (12.9%) | 0 (0.0%) |
Income Below Poverty Among Married-Couple vs Single-Parent Households in West Ishpeming
The poverty data for West Ishpeming shows that 23 of the married-couple family households (3.3%) and 15 of the single-parent households (10.6%) are living below the poverty level. Within the married-couple family households, those with no children have the highest poverty rate, with 23 households (4.9%) falling below the poverty line. Among the single-parent households, those with 1 or 2 children have the highest poverty rate, with 15 household (15.3%) living below poverty.
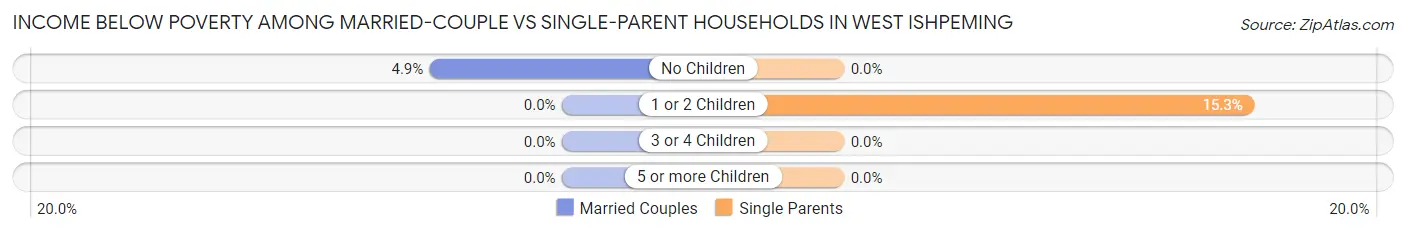
| Children | Married-Couple Families | Single-Parent Households |
| No Children | 23 (4.9%) | 0 (0.0%) |
| 1 or 2 Children | 0 (0.0%) | 15 (15.3%) |
| 3 or 4 Children | 0 (0.0%) | 0 (0.0%) |
| 5 or more Children | 0 (0.0%) | 0 (0.0%) |
| Total | 23 (3.3%) | 15 (10.6%) |
Race in West Ishpeming
The most populous races in West Ishpeming are White / Caucasian (2,446 | 90.2%), Hispanic or Latino (117 | 4.3%), and Two or more Races (117 | 4.3%).
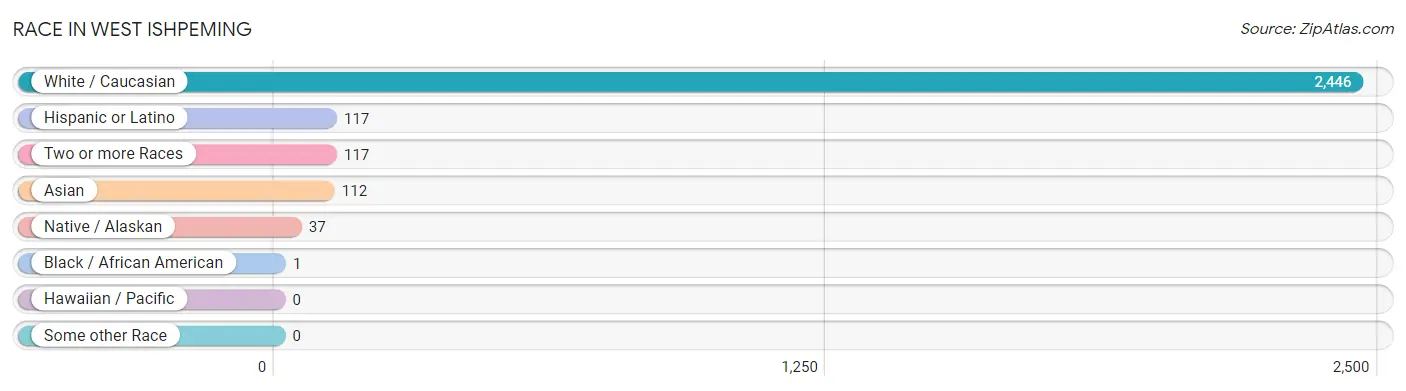
| Race | # Population | % Population |
| Asian | 112 | 4.1% |
| Black / African American | 1 | 0.0% |
| Hawaiian / Pacific | 0 | 0.0% |
| Hispanic or Latino | 117 | 4.3% |
| Native / Alaskan | 37 | 1.4% |
| White / Caucasian | 2,446 | 90.2% |
| Two or more Races | 117 | 4.3% |
| Some other Race | 0 | 0.0% |
| Total | 2,713 | 100.0% |
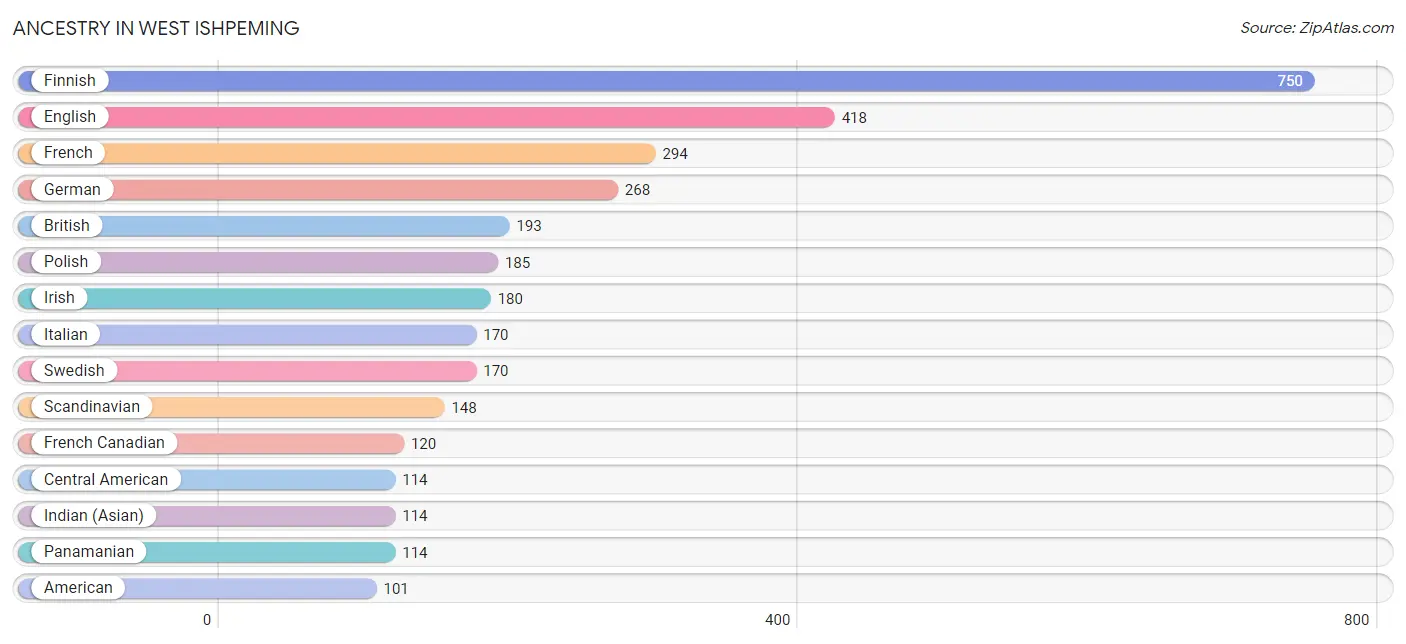
Ancestry in West Ishpeming
The most populous ancestries reported in West Ishpeming are Finnish (750 | 27.6%), English (418 | 15.4%), French (294 | 10.8%), German (268 | 9.9%), and British (193 | 7.1%), together accounting for 70.9% of all West Ishpeming residents.
| Ancestry | # Population | % Population |
| American | 101 | 3.7% |
| British | 193 | 7.1% |
| Burmese | 54 | 2.0% |
| Central American | 114 | 4.2% |
| Chippewa | 37 | 1.4% |
| Croatian | 10 | 0.4% |
| Czech | 21 | 0.8% |
| Dutch | 14 | 0.5% |
| Eastern European | 3 | 0.1% |
| English | 418 | 15.4% |
| Finnish | 750 | 27.6% |
| French | 294 | 10.8% |
| French Canadian | 120 | 4.4% |
| German | 268 | 9.9% |
| Indian (Asian) | 114 | 4.2% |
| Irish | 180 | 6.6% |
| Italian | 170 | 6.3% |
| Mexican | 3 | 0.1% |
| Northern European | 1 | 0.0% |
| Norwegian | 43 | 1.6% |
| Panamanian | 114 | 4.2% |
| Polish | 185 | 6.8% |
| Scandinavian | 148 | 5.5% |
| Scotch-Irish | 10 | 0.4% |
| Scottish | 23 | 0.9% |
| Slovak | 25 | 0.9% |
| Swedish | 170 | 6.3% |
| Thai | 58 | 2.1% |
| Welsh | 12 | 0.4% | View All 29 Rows |
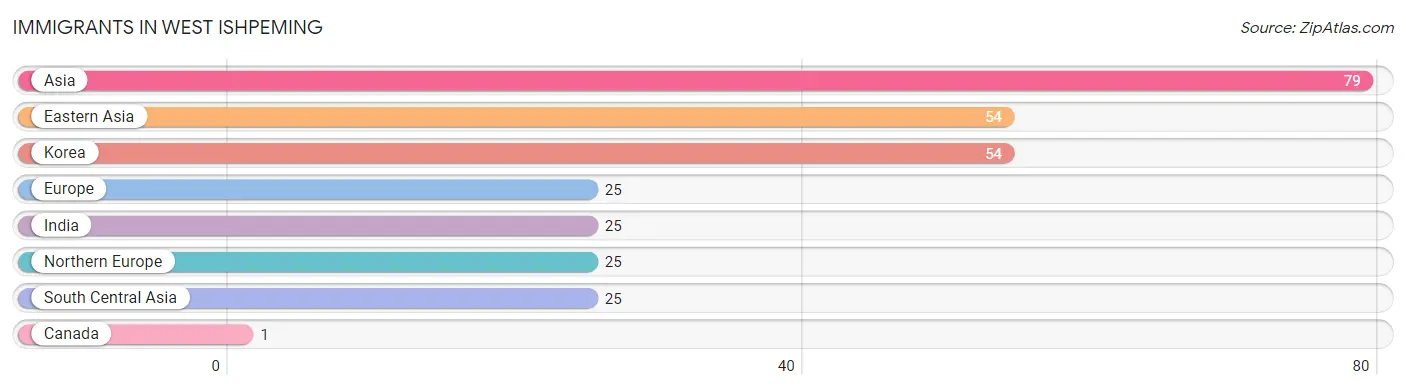
Immigrants in West Ishpeming
The most numerous immigrant groups reported in West Ishpeming came from Asia (79 | 2.9%), Eastern Asia (54 | 2.0%), Korea (54 | 2.0%), Europe (25 | 0.9%), and India (25 | 0.9%), together accounting for 8.7% of all West Ishpeming residents.
| Immigration Origin | # Population | % Population |
| Asia | 79 | 2.9% |
| Canada | 1 | 0.0% |
| Eastern Asia | 54 | 2.0% |
| Europe | 25 | 0.9% |
| India | 25 | 0.9% |
| Korea | 54 | 2.0% |
| Northern Europe | 25 | 0.9% |
| South Central Asia | 25 | 0.9% | View All 8 Rows |
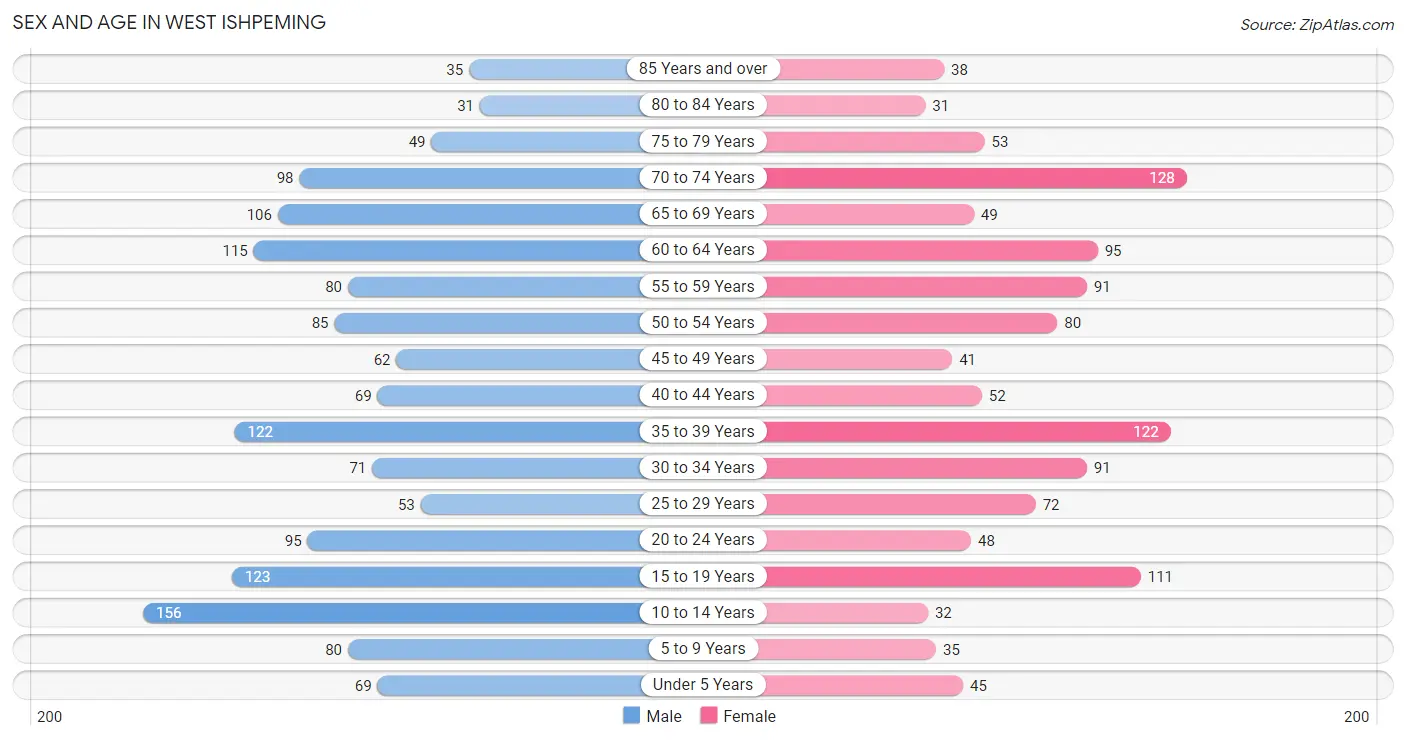
Sex and Age in West Ishpeming
Sex and Age in West Ishpeming
The most populous age groups in West Ishpeming are 10 to 14 Years (156 | 10.4%) for men and 70 to 74 Years (128 | 10.5%) for women.
| Age Bracket | Male | Female |
| Under 5 Years | 69 (4.6%) | 45 (3.7%) |
| 5 to 9 Years | 80 (5.3%) | 35 (2.9%) |
| 10 to 14 Years | 156 (10.4%) | 32 (2.6%) |
| 15 to 19 Years | 123 (8.2%) | 111 (9.1%) |
| 20 to 24 Years | 95 (6.3%) | 48 (4.0%) |
| 25 to 29 Years | 53 (3.5%) | 72 (5.9%) |
| 30 to 34 Years | 71 (4.7%) | 91 (7.5%) |
| 35 to 39 Years | 122 (8.1%) | 122 (10.1%) |
| 40 to 44 Years | 69 (4.6%) | 52 (4.3%) |
| 45 to 49 Years | 62 (4.1%) | 41 (3.4%) |
| 50 to 54 Years | 85 (5.7%) | 80 (6.6%) |
| 55 to 59 Years | 80 (5.3%) | 91 (7.5%) |
| 60 to 64 Years | 115 (7.7%) | 95 (7.8%) |
| 65 to 69 Years | 106 (7.1%) | 49 (4.0%) |
| 70 to 74 Years | 98 (6.5%) | 128 (10.5%) |
| 75 to 79 Years | 49 (3.3%) | 53 (4.4%) |
| 80 to 84 Years | 31 (2.1%) | 31 (2.5%) |
| 85 Years and over | 35 (2.3%) | 38 (3.1%) |
| Total | 1,499 (100.0%) | 1,214 (100.0%) |
Families and Households in West Ishpeming
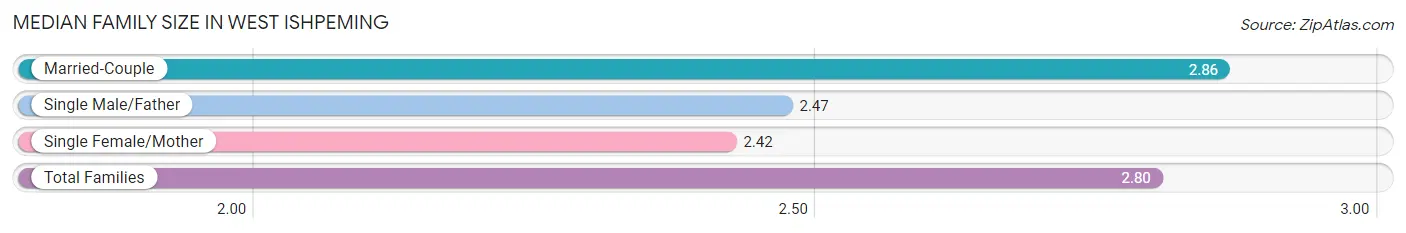
Median Family Size in West Ishpeming
The median family size in West Ishpeming is 2.80 persons per family, with married-couple families (693 | 83.0%) accounting for the largest median family size of 2.86 persons per family. On the other hand, single female/mother families (26 | 3.1%) represent the smallest median family size with 2.42 persons per family.
| Family Type | # Families | Family Size |
| Married-Couple | 693 (83.0%) | 2.86 |
| Single Male/Father | 116 (13.9%) | 2.47 |
| Single Female/Mother | 26 (3.1%) | 2.42 |
| Total Families | 835 (100.0%) | 2.80 |
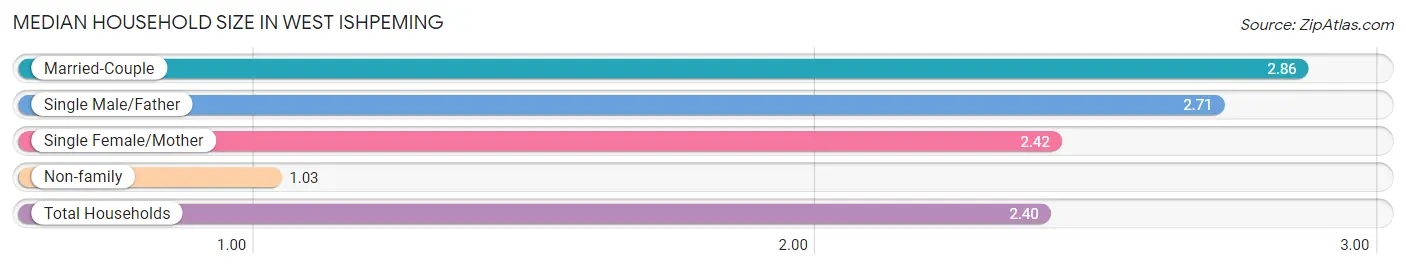
Median Household Size in West Ishpeming
The median household size in West Ishpeming is 2.40 persons per household, with married-couple households (693 | 63.0%) accounting for the largest median household size of 2.86 persons per household. non-family households (265 | 24.1%) represent the smallest median household size with 1.03 persons per household.
| Household Type | # Households | Household Size |
| Married-Couple | 693 (63.0%) | 2.86 |
| Single Male/Father | 116 (10.5%) | 2.71 |
| Single Female/Mother | 26 (2.4%) | 2.42 |
| Non-family | 265 (24.1%) | 1.03 |
| Total Households | 1,100 (100.0%) | 2.40 |
Household Size by Marriage Status in West Ishpeming
Out of a total of 1,100 households in West Ishpeming, 835 (75.9%) are family households, while 265 (24.1%) are nonfamily households. The most numerous type of family households are 2-person households, comprising 461, and the most common type of nonfamily households are 1-person households, comprising 257.
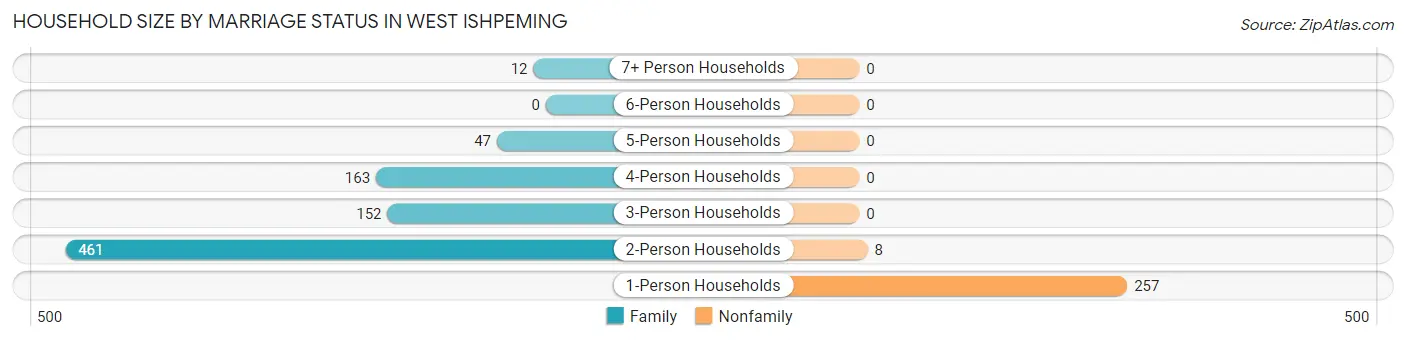
| Household Size | Family Households | Nonfamily Households |
| 1-Person Households | - | 257 (23.4%) |
| 2-Person Households | 461 (41.9%) | 8 (0.7%) |
| 3-Person Households | 152 (13.8%) | 0 (0.0%) |
| 4-Person Households | 163 (14.8%) | 0 (0.0%) |
| 5-Person Households | 47 (4.3%) | 0 (0.0%) |
| 6-Person Households | 0 (0.0%) | 0 (0.0%) |
| 7+ Person Households | 12 (1.1%) | 0 (0.0%) |
| Total | 835 (75.9%) | 265 (24.1%) |
Female Fertility in West Ishpeming
Fertility by Age in West Ishpeming
| Age Bracket | Women with Births | Births / 1,000 Women |
| 15 to 19 years | 0 (0.0%) | 0.0 |
| 20 to 34 years | 0 (0.0%) | 0.0 |
| 35 to 50 years | 0 (0.0%) | 0.0 |
| Total | 0 (0.0%) | 0.0 |
Fertility by Age by Marriage Status in West Ishpeming
| Age Bracket | Married | Unmarried |
| 15 to 19 years | 0 (0.0%) | 0 (0.0%) |
| 20 to 34 years | 0 (0.0%) | 0 (0.0%) |
| 35 to 50 years | 0 (0.0%) | 0 (0.0%) |
| Total | 0 (0.0%) | 0 (0.0%) |
Fertility by Education in West Ishpeming
| Educational Attainment | Women with Births | Births / 1,000 Women |
| Less than High School | 0 (0.0%) | 0.0 |
| High School Diploma | 0 (0.0%) | 0.0 |
| College or Associate's Degree | 0 (0.0%) | 0.0 |
| Bachelor's Degree | 0 (0.0%) | 0.0 |
| Graduate Degree | 0 (0.0%) | 0.0 |
| Total | 0 (0.0%) | 0.0 |
Fertility by Education by Marriage Status in West Ishpeming
| Educational Attainment | Married | Unmarried |
| Less than High School | 0 (0.0%) | 0 (0.0%) |
| High School Diploma | 0 (0.0%) | 0 (0.0%) |
| College or Associate's Degree | 0 (0.0%) | 0 (0.0%) |
| Bachelor's Degree | 0 (0.0%) | 0 (0.0%) |
| Graduate Degree | 0 (0.0%) | 0 (0.0%) |
| Total | 0 (0.0%) | 0 (0.0%) |
Employment Characteristics in West Ishpeming
Employment by Class of Employer in West Ishpeming
Among the 1,197 employed individuals in West Ishpeming, private company employees (957 | 79.9%), local government employees (144 | 12.0%), and state government employees (34 | 2.8%) make up the most common classes of employment.
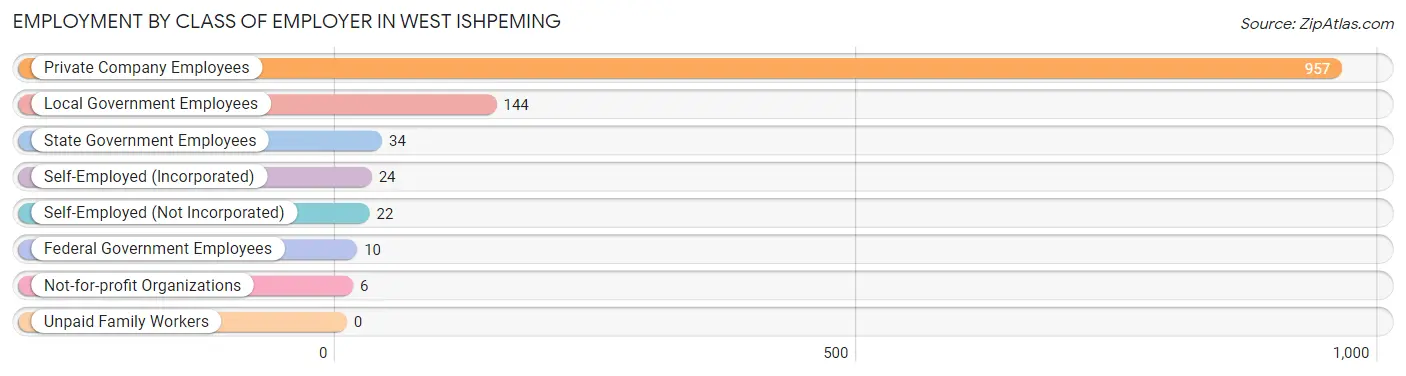
| Employer Class | # Employees | % Employees |
| Private Company Employees | 957 | 79.9% |
| Self-Employed (Incorporated) | 24 | 2.0% |
| Self-Employed (Not Incorporated) | 22 | 1.8% |
| Not-for-profit Organizations | 6 | 0.5% |
| Local Government Employees | 144 | 12.0% |
| State Government Employees | 34 | 2.8% |
| Federal Government Employees | 10 | 0.8% |
| Unpaid Family Workers | 0 | 0.0% |
| Total | 1,197 | 100.0% |
Employment Status by Age in West Ishpeming
According to the labor force statistics for West Ishpeming, out of the total population over 16 years of age (2,247), 56.7% or 1,274 individuals are in the labor force, with 5.3% or 68 of them unemployed. The age group with the highest labor force participation rate is 35 to 44 years, with 97.8% or 357 individuals in the labor force. Within the labor force, the 16 to 19 years age range has the highest percentage of unemployed individuals, with 24.3% or 17 of them being unemployed.
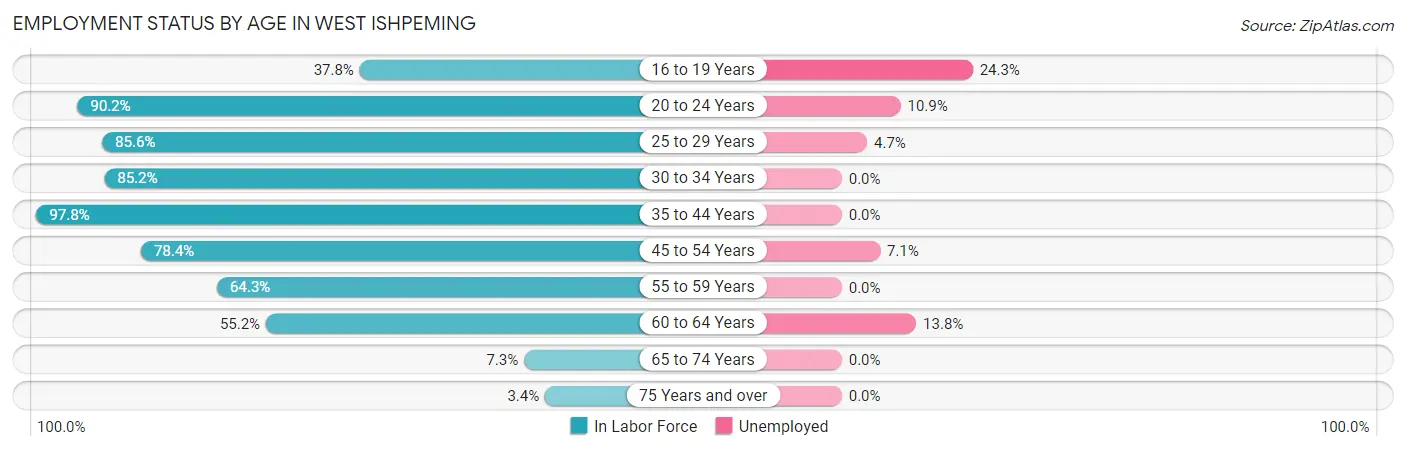
| Age Bracket | In Labor Force | Unemployed |
| 16 to 19 Years | 70 (37.8%) | 17 (24.3%) |
| 20 to 24 Years | 129 (90.2%) | 14 (10.9%) |
| 25 to 29 Years | 107 (85.6%) | 5 (4.7%) |
| 30 to 34 Years | 138 (85.2%) | 0 (0.0%) |
| 35 to 44 Years | 357 (97.8%) | 0 (0.0%) |
| 45 to 54 Years | 210 (78.4%) | 15 (7.1%) |
| 55 to 59 Years | 110 (64.3%) | 0 (0.0%) |
| 60 to 64 Years | 116 (55.2%) | 16 (13.8%) |
| 65 to 74 Years | 28 (7.3%) | 0 (0.0%) |
| 75 Years and over | 8 (3.4%) | 0 (0.0%) |
| Total | 1,274 (56.7%) | 68 (5.3%) |
Employment Status by Educational Attainment in West Ishpeming
According to labor force statistics for West Ishpeming, 79.8% of individuals (1,038) out of the total population between 25 and 64 years of age (1,301) are in the labor force, with 3.5% or 36 of them being unemployed. The group with the highest labor force participation rate are those with the educational attainment of bachelor's degree or higher, with 90.0% or 342 individuals in the labor force. Within the labor force, individuals with high school diploma education have the highest percentage of unemployment, with 8.2% or 16 of them being unemployed.
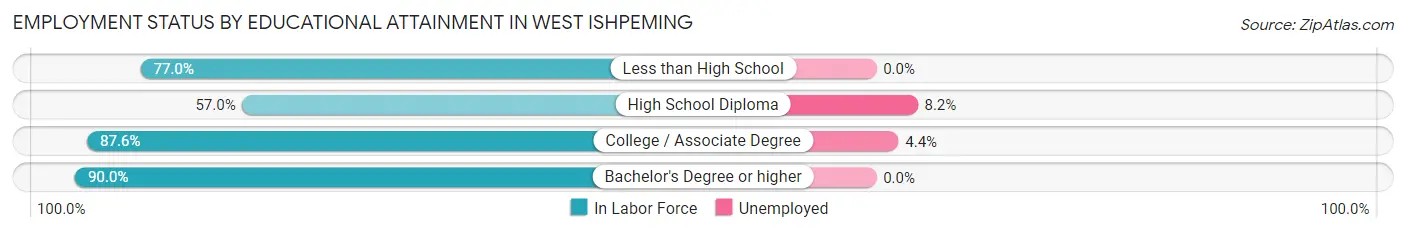
| Educational Attainment | In Labor Force | Unemployed |
| Less than High School | 47 (77.0%) | 0 (0.0%) |
| High School Diploma | 195 (57.0%) | 28 (8.2%) |
| College / Associate Degree | 454 (87.6%) | 23 (4.4%) |
| Bachelor's Degree or higher | 342 (90.0%) | 0 (0.0%) |
| Total | 1,038 (79.8%) | 46 (3.5%) |
Employment Occupations by Sex in West Ishpeming
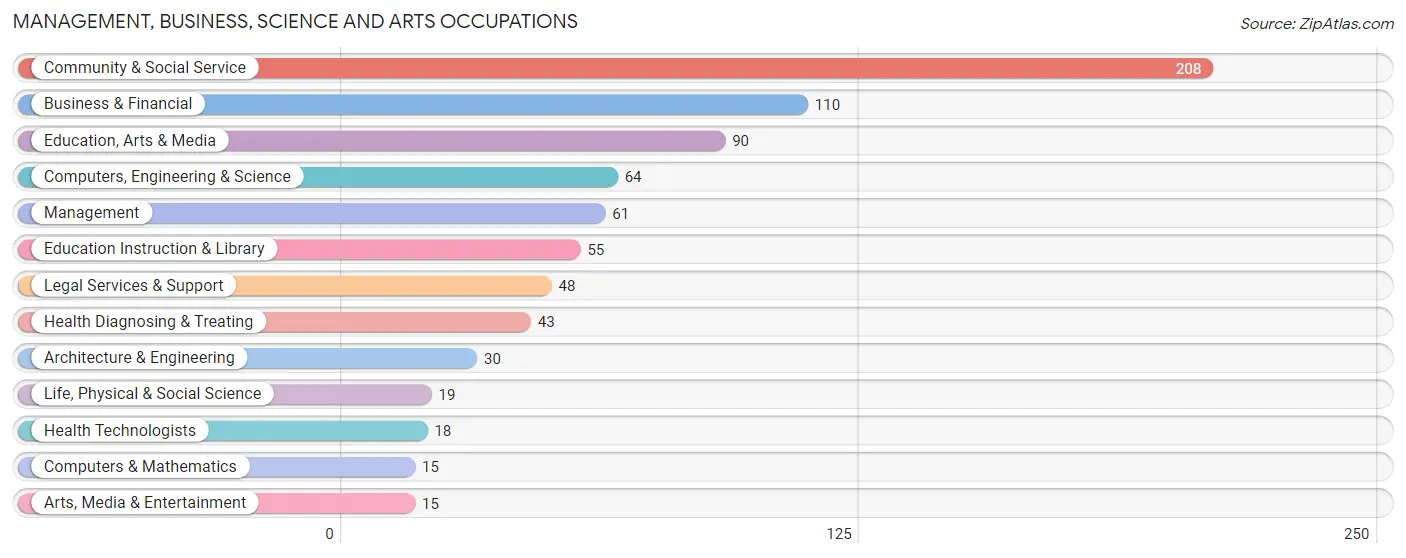
Management, Business, Science and Arts Occupations
The most common Management, Business, Science and Arts occupations in West Ishpeming are Community & Social Service (208 | 17.2%), Business & Financial (110 | 9.1%), Education, Arts & Media (90 | 7.5%), Computers, Engineering & Science (64 | 5.3%), and Management (61 | 5.1%).
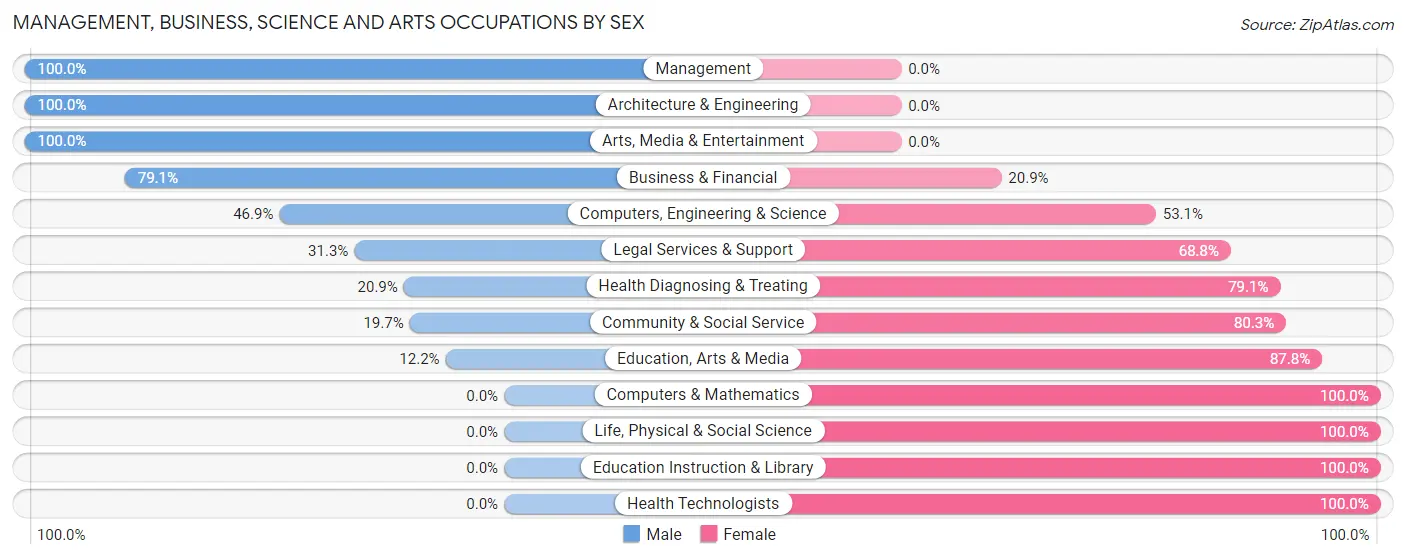
Management, Business, Science and Arts Occupations by Sex
Within the Management, Business, Science and Arts occupations in West Ishpeming, the most male-oriented occupations are Management (100.0%), Architecture & Engineering (100.0%), and Arts, Media & Entertainment (100.0%), while the most female-oriented occupations are Computers & Mathematics (100.0%), Life, Physical & Social Science (100.0%), and Education Instruction & Library (100.0%).
| Occupation | Male | Female |
| Management | 61 (100.0%) | 0 (0.0%) |
| Business & Financial | 87 (79.1%) | 23 (20.9%) |
| Computers, Engineering & Science | 30 (46.9%) | 34 (53.1%) |
| Computers & Mathematics | 0 (0.0%) | 15 (100.0%) |
| Architecture & Engineering | 30 (100.0%) | 0 (0.0%) |
| Life, Physical & Social Science | 0 (0.0%) | 19 (100.0%) |
| Community & Social Service | 41 (19.7%) | 167 (80.3%) |
| Education, Arts & Media | 11 (12.2%) | 79 (87.8%) |
| Legal Services & Support | 15 (31.2%) | 33 (68.8%) |
| Education Instruction & Library | 0 (0.0%) | 55 (100.0%) |
| Arts, Media & Entertainment | 15 (100.0%) | 0 (0.0%) |
| Health Diagnosing & Treating | 9 (20.9%) | 34 (79.1%) |
| Health Technologists | 0 (0.0%) | 18 (100.0%) |
| Total (Category) | 228 (46.9%) | 258 (53.1%) |
| Total (Overall) | 710 (58.9%) | 496 (41.1%) |
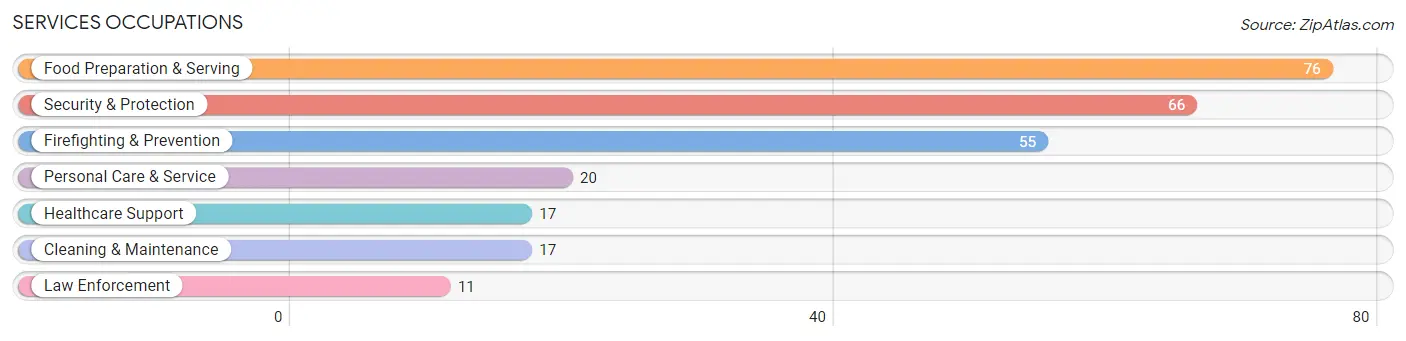
Services Occupations
The most common Services occupations in West Ishpeming are Food Preparation & Serving (76 | 6.3%), Security & Protection (66 | 5.5%), Firefighting & Prevention (55 | 4.6%), Personal Care & Service (20 | 1.7%), and Healthcare Support (17 | 1.4%).
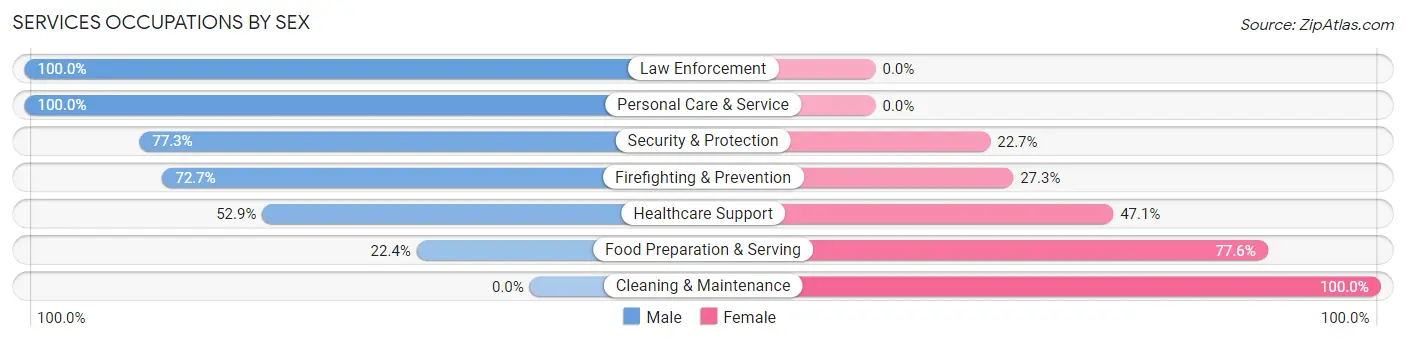
Services Occupations by Sex
Within the Services occupations in West Ishpeming, the most male-oriented occupations are Law Enforcement (100.0%), Personal Care & Service (100.0%), and Security & Protection (77.3%), while the most female-oriented occupations are Cleaning & Maintenance (100.0%), Food Preparation & Serving (77.6%), and Healthcare Support (47.1%).
| Occupation | Male | Female |
| Healthcare Support | 9 (52.9%) | 8 (47.1%) |
| Security & Protection | 51 (77.3%) | 15 (22.7%) |
| Firefighting & Prevention | 40 (72.7%) | 15 (27.3%) |
| Law Enforcement | 11 (100.0%) | 0 (0.0%) |
| Food Preparation & Serving | 17 (22.4%) | 59 (77.6%) |
| Cleaning & Maintenance | 0 (0.0%) | 17 (100.0%) |
| Personal Care & Service | 20 (100.0%) | 0 (0.0%) |
| Total (Category) | 97 (49.5%) | 99 (50.5%) |
| Total (Overall) | 710 (58.9%) | 496 (41.1%) |
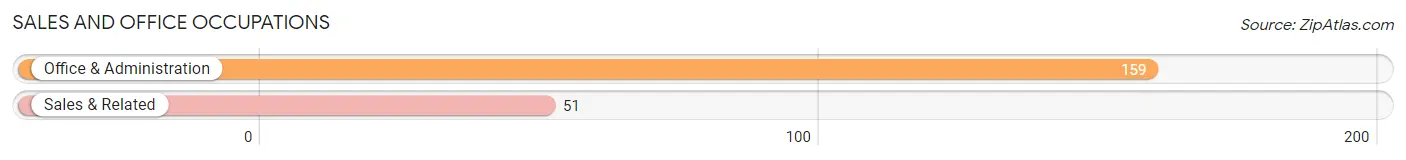
Sales and Office Occupations
The most common Sales and Office occupations in West Ishpeming are Office & Administration (159 | 13.2%), and Sales & Related (51 | 4.2%).
Sales and Office Occupations by Sex
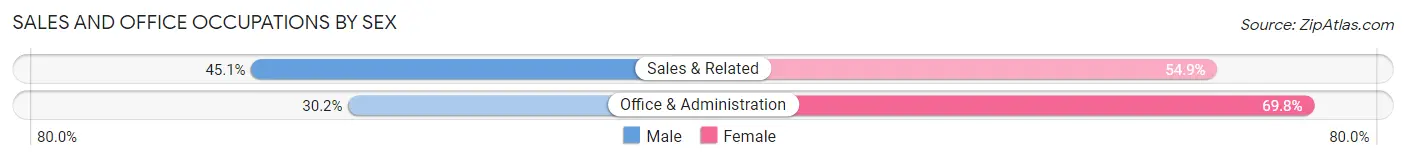
| Occupation | Male | Female |
| Sales & Related | 23 (45.1%) | 28 (54.9%) |
| Office & Administration | 48 (30.2%) | 111 (69.8%) |
| Total (Category) | 71 (33.8%) | 139 (66.2%) |
| Total (Overall) | 710 (58.9%) | 496 (41.1%) |
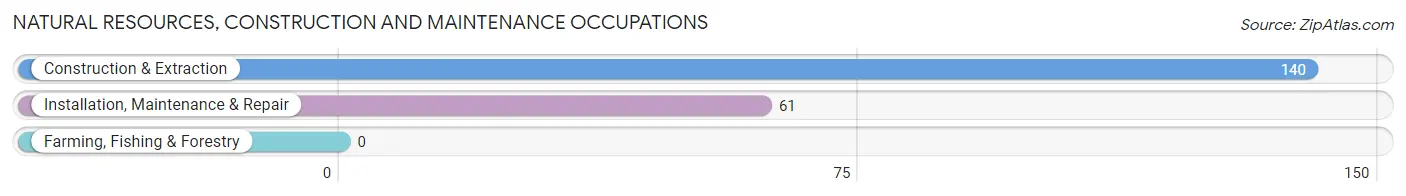
Natural Resources, Construction and Maintenance Occupations
The most common Natural Resources, Construction and Maintenance occupations in West Ishpeming are Construction & Extraction (140 | 11.6%), and Installation, Maintenance & Repair (61 | 5.1%).
Natural Resources, Construction and Maintenance Occupations by Sex
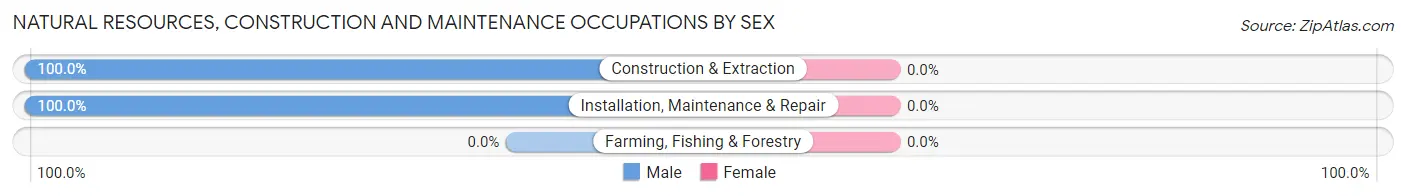
| Occupation | Male | Female |
| Farming, Fishing & Forestry | 0 (0.0%) | 0 (0.0%) |
| Construction & Extraction | 140 (100.0%) | 0 (0.0%) |
| Installation, Maintenance & Repair | 61 (100.0%) | 0 (0.0%) |
| Total (Category) | 201 (100.0%) | 0 (0.0%) |
| Total (Overall) | 710 (58.9%) | 496 (41.1%) |
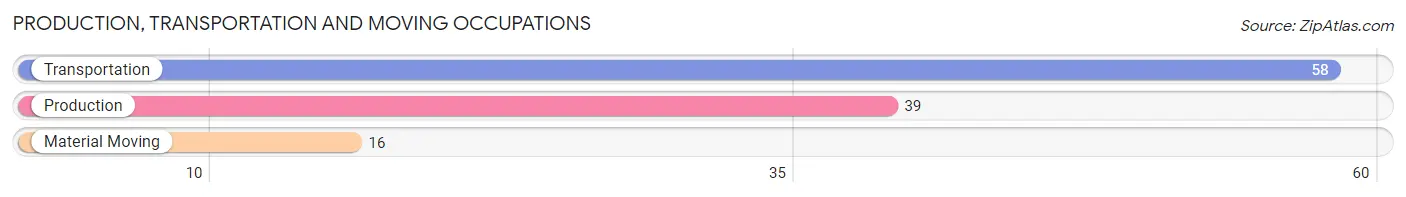
Production, Transportation and Moving Occupations
The most common Production, Transportation and Moving occupations in West Ishpeming are Transportation (58 | 4.8%), Production (39 | 3.2%), and Material Moving (16 | 1.3%).
Production, Transportation and Moving Occupations by Sex
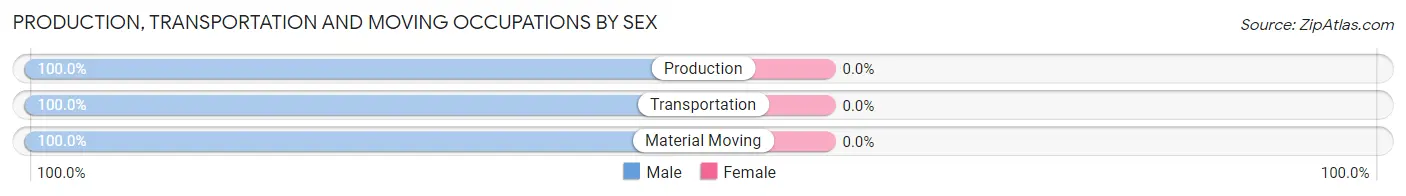
| Occupation | Male | Female |
| Production | 39 (100.0%) | 0 (0.0%) |
| Transportation | 58 (100.0%) | 0 (0.0%) |
| Material Moving | 16 (100.0%) | 0 (0.0%) |
| Total (Category) | 113 (100.0%) | 0 (0.0%) |
| Total (Overall) | 710 (58.9%) | 496 (41.1%) |
Employment Industries by Sex in West Ishpeming
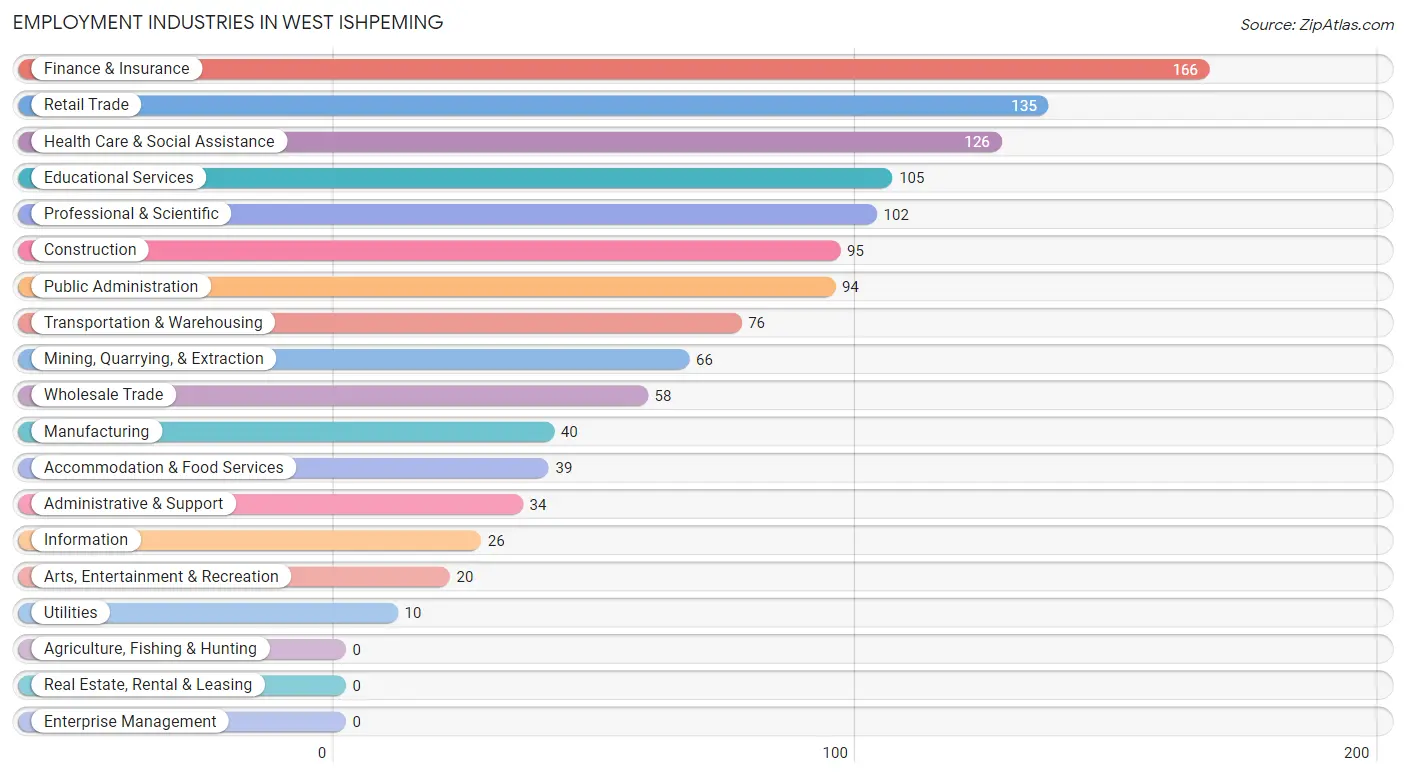
Employment Industries in West Ishpeming
The major employment industries in West Ishpeming include Finance & Insurance (166 | 13.8%), Retail Trade (135 | 11.2%), Health Care & Social Assistance (126 | 10.4%), Educational Services (105 | 8.7%), and Professional & Scientific (102 | 8.5%).
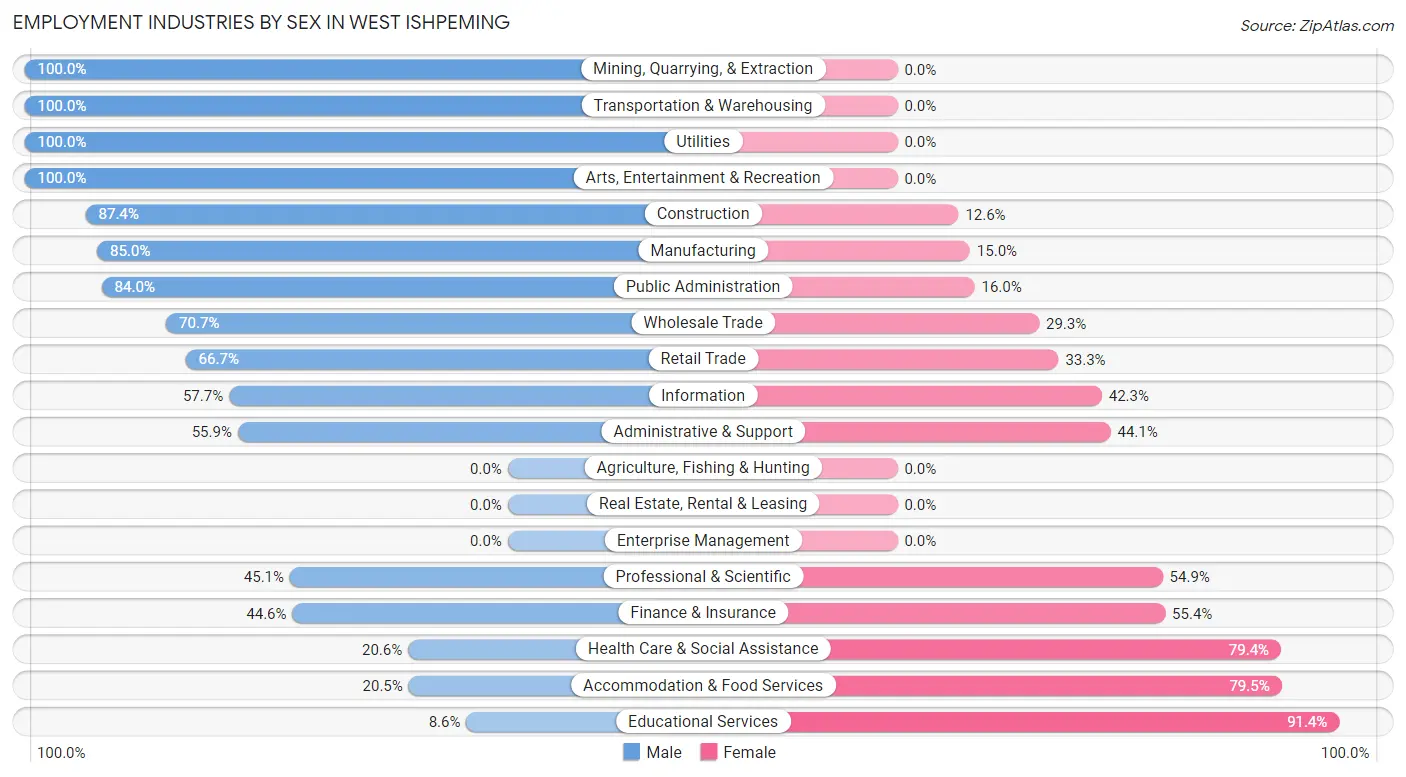
Employment Industries by Sex in West Ishpeming
The West Ishpeming industries that see more men than women are Mining, Quarrying, & Extraction (100.0%), Transportation & Warehousing (100.0%), and Utilities (100.0%), whereas the industries that tend to have a higher number of women are Educational Services (91.4%), Accommodation & Food Services (79.5%), and Health Care & Social Assistance (79.4%).
| Industry | Male | Female |
| Agriculture, Fishing & Hunting | 0 (0.0%) | 0 (0.0%) |
| Mining, Quarrying, & Extraction | 66 (100.0%) | 0 (0.0%) |
| Construction | 83 (87.4%) | 12 (12.6%) |
| Manufacturing | 34 (85.0%) | 6 (15.0%) |
| Wholesale Trade | 41 (70.7%) | 17 (29.3%) |
| Retail Trade | 90 (66.7%) | 45 (33.3%) |
| Transportation & Warehousing | 76 (100.0%) | 0 (0.0%) |
| Utilities | 10 (100.0%) | 0 (0.0%) |
| Information | 15 (57.7%) | 11 (42.3%) |
| Finance & Insurance | 74 (44.6%) | 92 (55.4%) |
| Real Estate, Rental & Leasing | 0 (0.0%) | 0 (0.0%) |
| Professional & Scientific | 46 (45.1%) | 56 (54.9%) |
| Enterprise Management | 0 (0.0%) | 0 (0.0%) |
| Administrative & Support | 19 (55.9%) | 15 (44.1%) |
| Educational Services | 9 (8.6%) | 96 (91.4%) |
| Health Care & Social Assistance | 26 (20.6%) | 100 (79.4%) |
| Arts, Entertainment & Recreation | 20 (100.0%) | 0 (0.0%) |
| Accommodation & Food Services | 8 (20.5%) | 31 (79.5%) |
| Public Administration | 79 (84.0%) | 15 (16.0%) |
| Total | 710 (58.9%) | 496 (41.1%) |
Education in West Ishpeming
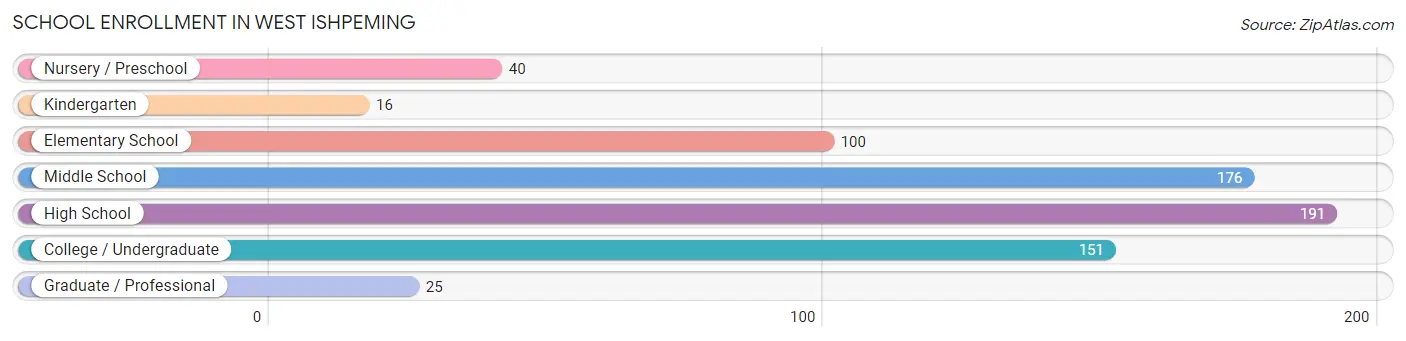
School Enrollment in West Ishpeming
The most common levels of schooling among the 699 students in West Ishpeming are high school (191 | 27.3%), middle school (176 | 25.2%), and college / undergraduate (151 | 21.6%).
| School Level | # Students | % Students |
| Nursery / Preschool | 40 | 5.7% |
| Kindergarten | 16 | 2.3% |
| Elementary School | 100 | 14.3% |
| Middle School | 176 | 25.2% |
| High School | 191 | 27.3% |
| College / Undergraduate | 151 | 21.6% |
| Graduate / Professional | 25 | 3.6% |
| Total | 699 | 100.0% |
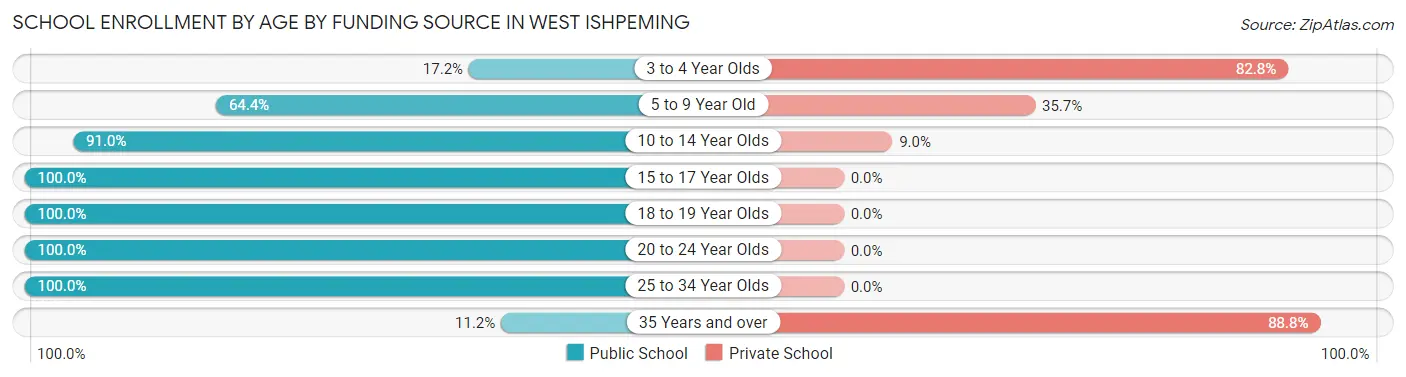
School Enrollment by Age by Funding Source in West Ishpeming
Out of a total of 699 students who are enrolled in schools in West Ishpeming, 161 (23.0%) attend a private institution, while the remaining 538 (77.0%) are enrolled in public schools. The age group of 35 years and over has the highest likelihood of being enrolled in private schools, with 79 (88.8% in the age bracket) enrolled. Conversely, the age group of 15 to 17 year olds has the lowest likelihood of being enrolled in a private school, with 150 (100.0% in the age bracket) attending a public institution.
| Age Bracket | Public School | Private School |
| 3 to 4 Year Olds | 5 (17.2%) | 24 (82.8%) |
| 5 to 9 Year Old | 74 (64.3%) | 41 (35.6%) |
| 10 to 14 Year Olds | 171 (91.0%) | 17 (9.0%) |
| 15 to 17 Year Olds | 150 (100.0%) | 0 (0.0%) |
| 18 to 19 Year Olds | 74 (100.0%) | 0 (0.0%) |
| 20 to 24 Year Olds | 39 (100.0%) | 0 (0.0%) |
| 25 to 34 Year Olds | 15 (100.0%) | 0 (0.0%) |
| 35 Years and over | 10 (11.2%) | 79 (88.8%) |
| Total | 538 (77.0%) | 161 (23.0%) |
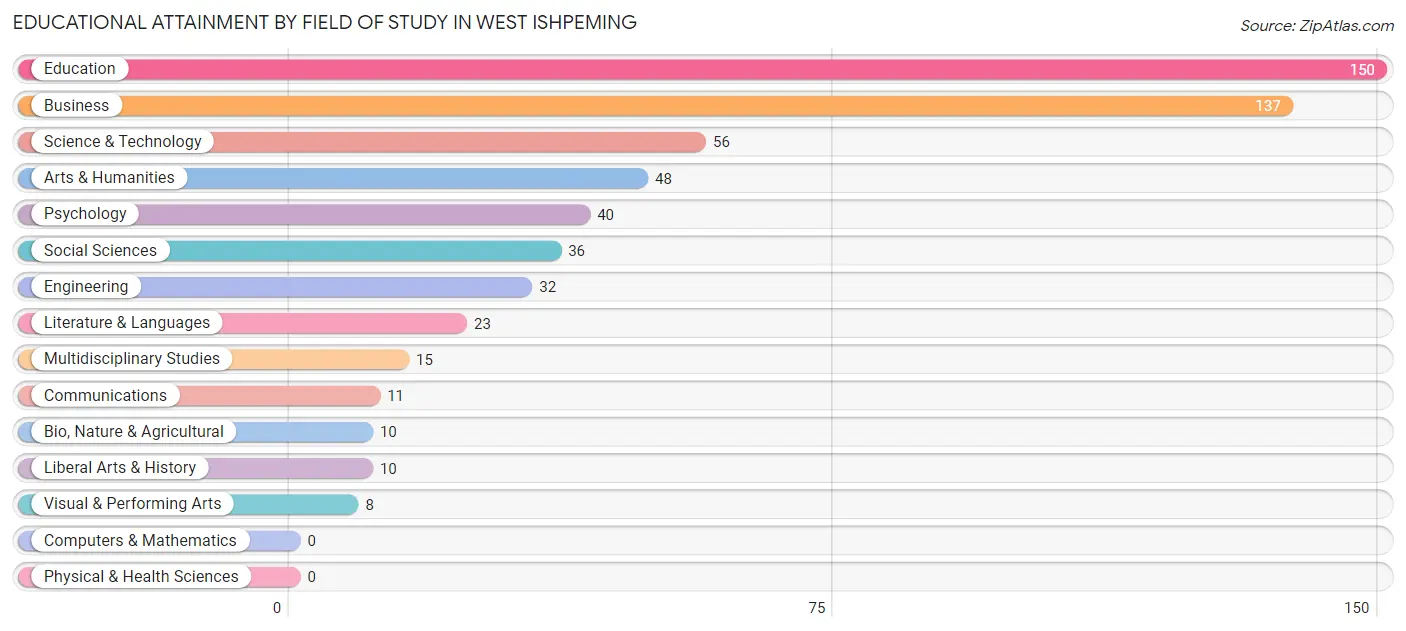
Educational Attainment by Field of Study in West Ishpeming
Education (150 | 26.0%), business (137 | 23.8%), science & technology (56 | 9.7%), arts & humanities (48 | 8.3%), and psychology (40 | 6.9%) are the most common fields of study among 576 individuals in West Ishpeming who have obtained a bachelor's degree or higher.
| Field of Study | # Graduates | % Graduates |
| Computers & Mathematics | 0 | 0.0% |
| Bio, Nature & Agricultural | 10 | 1.7% |
| Physical & Health Sciences | 0 | 0.0% |
| Psychology | 40 | 6.9% |
| Social Sciences | 36 | 6.2% |
| Engineering | 32 | 5.6% |
| Multidisciplinary Studies | 15 | 2.6% |
| Science & Technology | 56 | 9.7% |
| Business | 137 | 23.8% |
| Education | 150 | 26.0% |
| Literature & Languages | 23 | 4.0% |
| Liberal Arts & History | 10 | 1.7% |
| Visual & Performing Arts | 8 | 1.4% |
| Communications | 11 | 1.9% |
| Arts & Humanities | 48 | 8.3% |
| Total | 576 | 100.0% |
Transportation & Commute in West Ishpeming
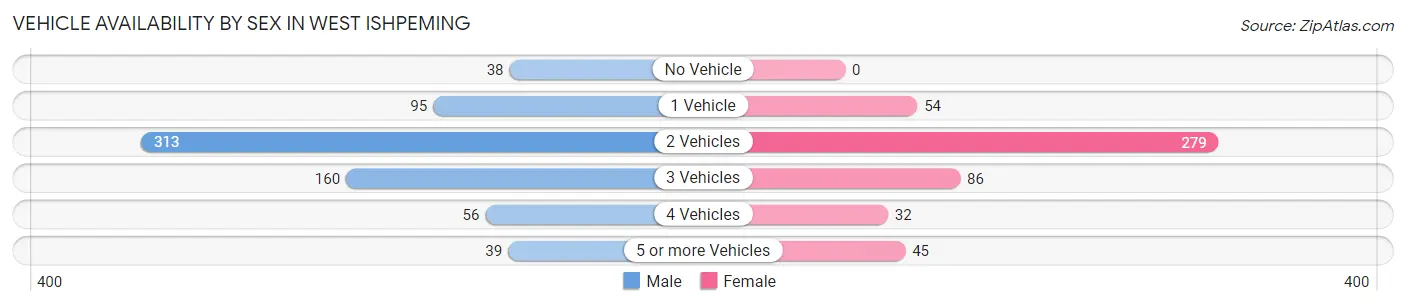
Vehicle Availability by Sex in West Ishpeming
The most prevalent vehicle ownership categories in West Ishpeming are males with 2 vehicles (313, accounting for 44.7%) and females with 2 vehicles (279, making up 63.1%).
| Vehicles Available | Male | Female |
| No Vehicle | 38 (5.4%) | 0 (0.0%) |
| 1 Vehicle | 95 (13.6%) | 54 (10.9%) |
| 2 Vehicles | 313 (44.7%) | 279 (56.2%) |
| 3 Vehicles | 160 (22.8%) | 86 (17.3%) |
| 4 Vehicles | 56 (8.0%) | 32 (6.5%) |
| 5 or more Vehicles | 39 (5.6%) | 45 (9.1%) |
| Total | 701 (100.0%) | 496 (100.0%) |
Commute Time in West Ishpeming
The most frequently occuring commute durations in West Ishpeming are 5 to 9 minutes (243 commuters, 20.8%), 10 to 14 minutes (238 commuters, 20.4%), and 20 to 24 minutes (198 commuters, 17.0%).
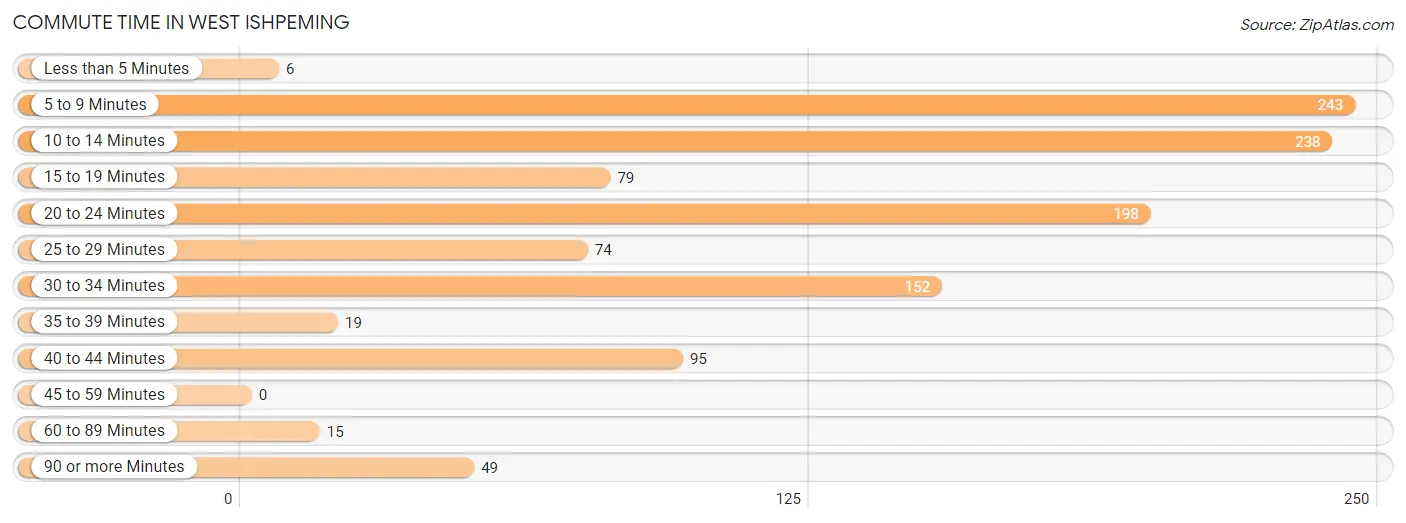
| Commute Time | # Commuters | % Commuters |
| Less than 5 Minutes | 6 | 0.5% |
| 5 to 9 Minutes | 243 | 20.8% |
| 10 to 14 Minutes | 238 | 20.4% |
| 15 to 19 Minutes | 79 | 6.8% |
| 20 to 24 Minutes | 198 | 17.0% |
| 25 to 29 Minutes | 74 | 6.3% |
| 30 to 34 Minutes | 152 | 13.0% |
| 35 to 39 Minutes | 19 | 1.6% |
| 40 to 44 Minutes | 95 | 8.1% |
| 45 to 59 Minutes | 0 | 0.0% |
| 60 to 89 Minutes | 15 | 1.3% |
| 90 or more Minutes | 49 | 4.2% |
Commute Time by Sex in West Ishpeming
The most common commute times in West Ishpeming are 20 to 24 minutes (155 commuters, 23.0%) for males and 10 to 14 minutes (165 commuters, 33.5%) for females.
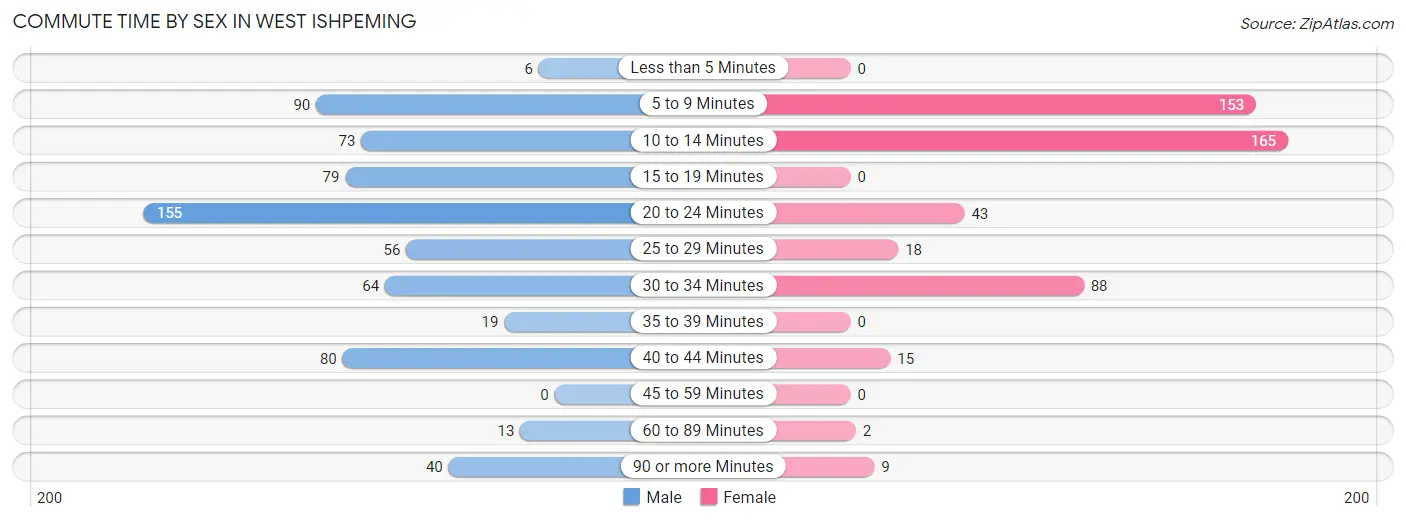
| Commute Time | Male | Female |
| Less than 5 Minutes | 6 (0.9%) | 0 (0.0%) |
| 5 to 9 Minutes | 90 (13.3%) | 153 (31.0%) |
| 10 to 14 Minutes | 73 (10.8%) | 165 (33.5%) |
| 15 to 19 Minutes | 79 (11.7%) | 0 (0.0%) |
| 20 to 24 Minutes | 155 (23.0%) | 43 (8.7%) |
| 25 to 29 Minutes | 56 (8.3%) | 18 (3.6%) |
| 30 to 34 Minutes | 64 (9.5%) | 88 (17.8%) |
| 35 to 39 Minutes | 19 (2.8%) | 0 (0.0%) |
| 40 to 44 Minutes | 80 (11.8%) | 15 (3.0%) |
| 45 to 59 Minutes | 0 (0.0%) | 0 (0.0%) |
| 60 to 89 Minutes | 13 (1.9%) | 2 (0.4%) |
| 90 or more Minutes | 40 (5.9%) | 9 (1.8%) |
Time of Departure to Work by Sex in West Ishpeming
The most frequent times of departure to work in West Ishpeming are 7:00 AM to 7:29 AM (161, 23.8%) for males and 7:00 AM to 7:29 AM (117, 23.7%) for females.
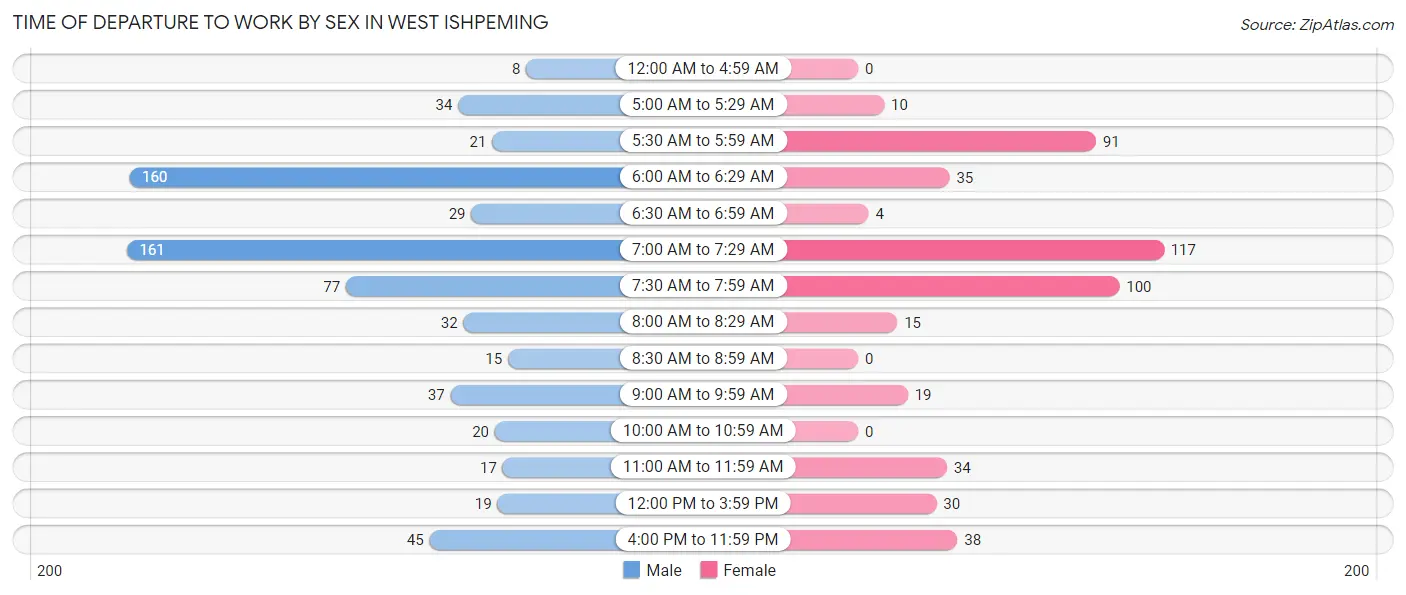
| Time of Departure | Male | Female |
| 12:00 AM to 4:59 AM | 8 (1.2%) | 0 (0.0%) |
| 5:00 AM to 5:29 AM | 34 (5.0%) | 10 (2.0%) |
| 5:30 AM to 5:59 AM | 21 (3.1%) | 91 (18.5%) |
| 6:00 AM to 6:29 AM | 160 (23.7%) | 35 (7.1%) |
| 6:30 AM to 6:59 AM | 29 (4.3%) | 4 (0.8%) |
| 7:00 AM to 7:29 AM | 161 (23.8%) | 117 (23.7%) |
| 7:30 AM to 7:59 AM | 77 (11.4%) | 100 (20.3%) |
| 8:00 AM to 8:29 AM | 32 (4.7%) | 15 (3.0%) |
| 8:30 AM to 8:59 AM | 15 (2.2%) | 0 (0.0%) |
| 9:00 AM to 9:59 AM | 37 (5.5%) | 19 (3.8%) |
| 10:00 AM to 10:59 AM | 20 (3.0%) | 0 (0.0%) |
| 11:00 AM to 11:59 AM | 17 (2.5%) | 34 (6.9%) |
| 12:00 PM to 3:59 PM | 19 (2.8%) | 30 (6.1%) |
| 4:00 PM to 11:59 PM | 45 (6.7%) | 38 (7.7%) |
| Total | 675 (100.0%) | 493 (100.0%) |
Housing Occupancy in West Ishpeming
Occupancy by Ownership in West Ishpeming
Of the total 1,100 dwellings in West Ishpeming, owner-occupied units account for 943 (85.7%), while renter-occupied units make up 157 (14.3%).
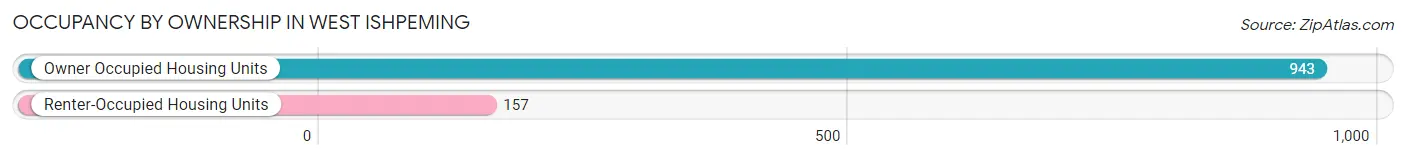
| Occupancy | # Housing Units | % Housing Units |
| Owner Occupied Housing Units | 943 | 85.7% |
| Renter-Occupied Housing Units | 157 | 14.3% |
| Total Occupied Housing Units | 1,100 | 100.0% |
Occupancy by Household Size in West Ishpeming
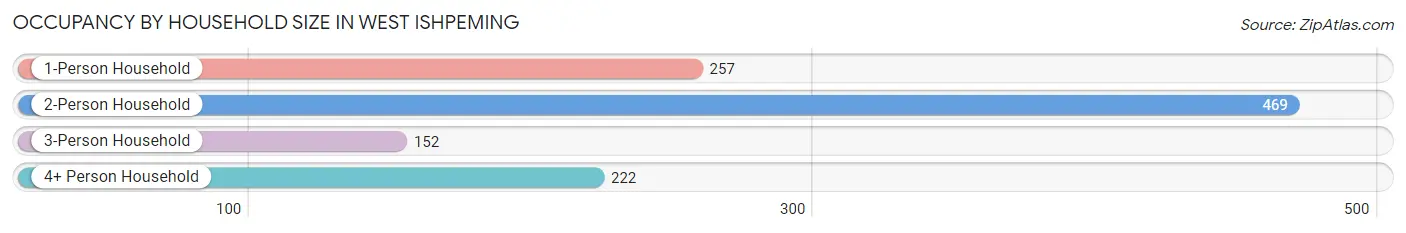
| Household Size | # Housing Units | % Housing Units |
| 1-Person Household | 257 | 23.4% |
| 2-Person Household | 469 | 42.6% |
| 3-Person Household | 152 | 13.8% |
| 4+ Person Household | 222 | 20.2% |
| Total Housing Units | 1,100 | 100.0% |
Occupancy by Ownership by Household Size in West Ishpeming
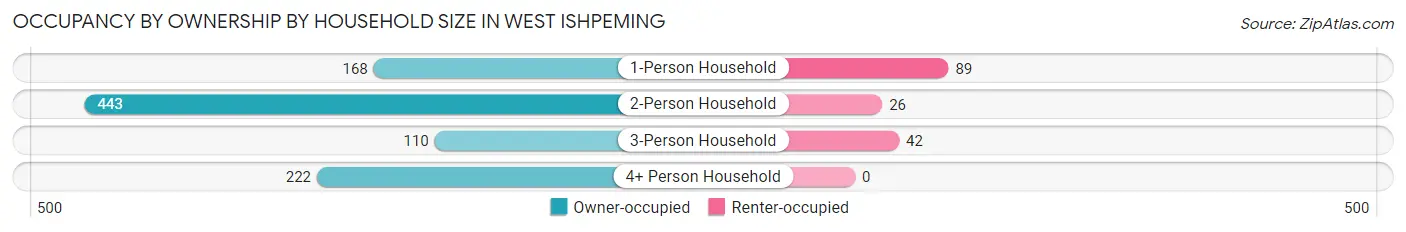
| Household Size | Owner-occupied | Renter-occupied |
| 1-Person Household | 168 (65.4%) | 89 (34.6%) |
| 2-Person Household | 443 (94.5%) | 26 (5.5%) |
| 3-Person Household | 110 (72.4%) | 42 (27.6%) |
| 4+ Person Household | 222 (100.0%) | 0 (0.0%) |
| Total Housing Units | 943 (85.7%) | 157 (14.3%) |
Occupancy by Educational Attainment in West Ishpeming
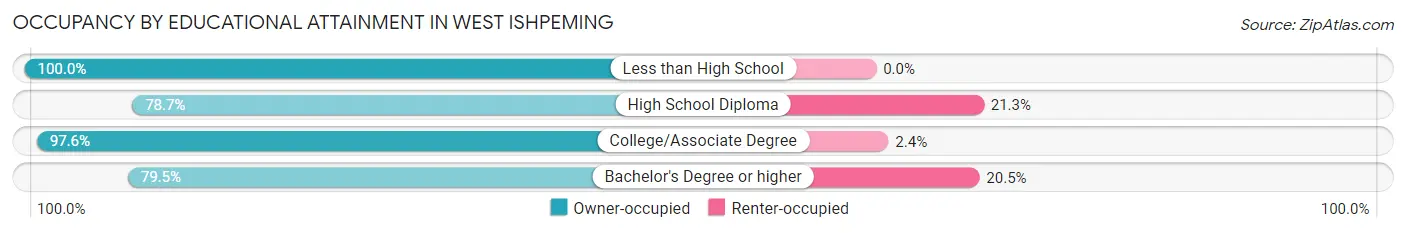
| Household Size | Owner-occupied | Renter-occupied |
| Less than High School | 21 (100.0%) | 0 (0.0%) |
| High School Diploma | 258 (78.7%) | 70 (21.3%) |
| College/Associate Degree | 361 (97.6%) | 9 (2.4%) |
| Bachelor's Degree or higher | 303 (79.5%) | 78 (20.5%) |
Occupancy by Age of Householder in West Ishpeming
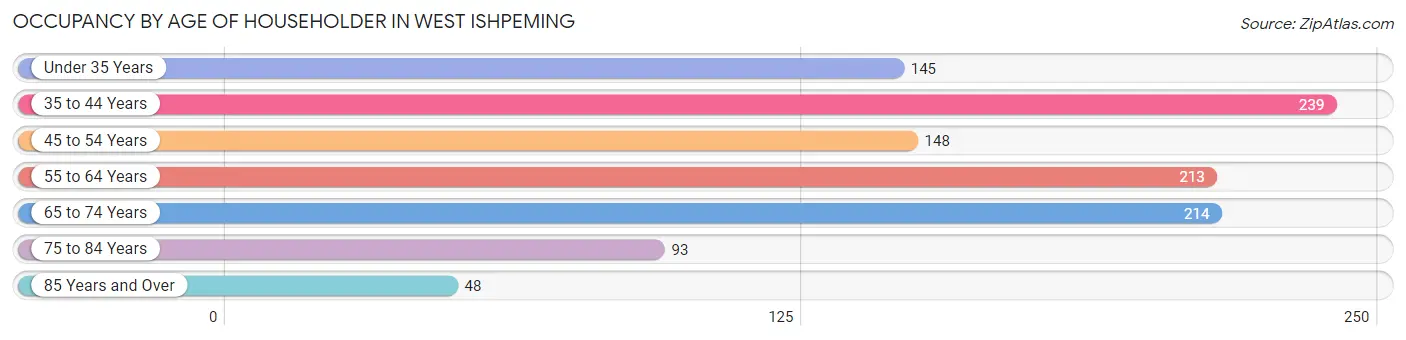
| Age Bracket | # Households | % Households |
| Under 35 Years | 145 | 13.2% |
| 35 to 44 Years | 239 | 21.7% |
| 45 to 54 Years | 148 | 13.5% |
| 55 to 64 Years | 213 | 19.4% |
| 65 to 74 Years | 214 | 19.5% |
| 75 to 84 Years | 93 | 8.5% |
| 85 Years and Over | 48 | 4.4% |
| Total | 1,100 | 100.0% |
Housing Finances in West Ishpeming
Median Income by Occupancy in West Ishpeming
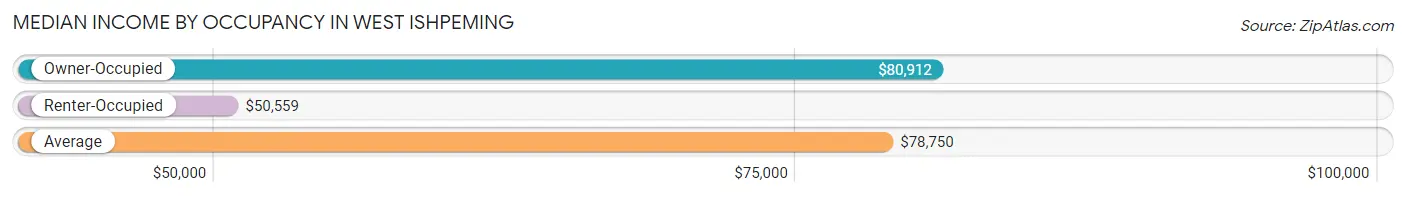
| Occupancy Type | # Households | Median Income |
| Owner-Occupied | 943 (85.7%) | $80,912 |
| Renter-Occupied | 157 (14.3%) | $50,559 |
| Average | 1,100 (100.0%) | $78,750 |
Occupancy by Householder Income Bracket in West Ishpeming
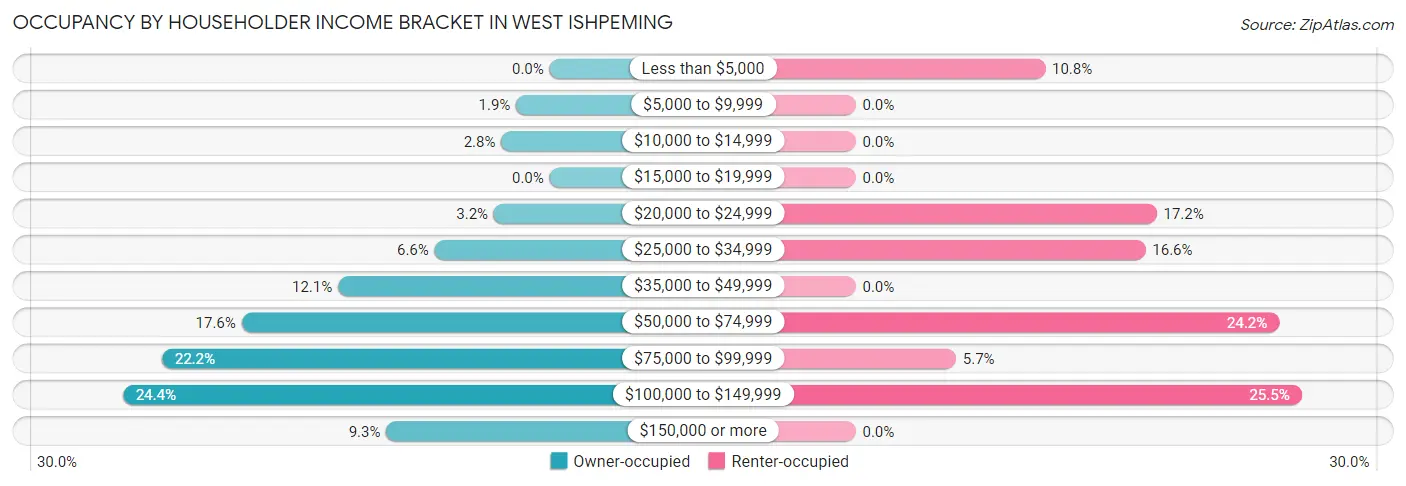
| Income Bracket | Owner-occupied | Renter-occupied |
| Less than $5,000 | 0 (0.0%) | 17 (10.8%) |
| $5,000 to $9,999 | 18 (1.9%) | 0 (0.0%) |
| $10,000 to $14,999 | 26 (2.8%) | 0 (0.0%) |
| $15,000 to $19,999 | 0 (0.0%) | 0 (0.0%) |
| $20,000 to $24,999 | 30 (3.2%) | 27 (17.2%) |
| $25,000 to $34,999 | 62 (6.6%) | 26 (16.6%) |
| $35,000 to $49,999 | 114 (12.1%) | 0 (0.0%) |
| $50,000 to $74,999 | 166 (17.6%) | 38 (24.2%) |
| $75,000 to $99,999 | 209 (22.2%) | 9 (5.7%) |
| $100,000 to $149,999 | 230 (24.4%) | 40 (25.5%) |
| $150,000 or more | 88 (9.3%) | 0 (0.0%) |
| Total | 943 (100.0%) | 157 (100.0%) |
Monthly Housing Cost Tiers in West Ishpeming
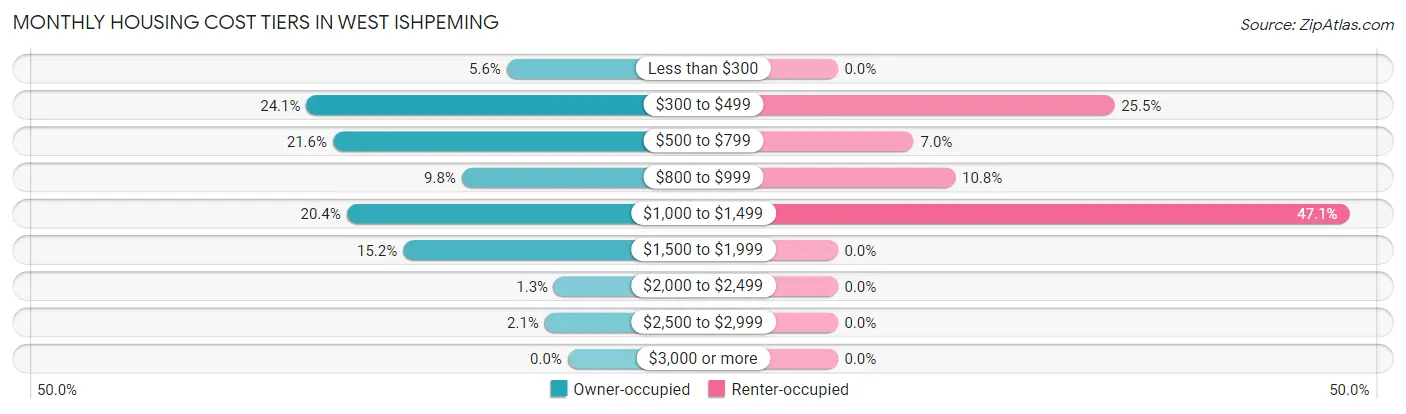
| Monthly Cost | Owner-occupied | Renter-occupied |
| Less than $300 | 53 (5.6%) | 0 (0.0%) |
| $300 to $499 | 227 (24.1%) | 40 (25.5%) |
| $500 to $799 | 204 (21.6%) | 11 (7.0%) |
| $800 to $999 | 92 (9.8%) | 17 (10.8%) |
| $1,000 to $1,499 | 192 (20.4%) | 74 (47.1%) |
| $1,500 to $1,999 | 143 (15.2%) | 0 (0.0%) |
| $2,000 to $2,499 | 12 (1.3%) | 0 (0.0%) |
| $2,500 to $2,999 | 20 (2.1%) | 0 (0.0%) |
| $3,000 or more | 0 (0.0%) | 0 (0.0%) |
| Total | 943 (100.0%) | 157 (100.0%) |
Physical Housing Characteristics in West Ishpeming
Housing Structures in West Ishpeming
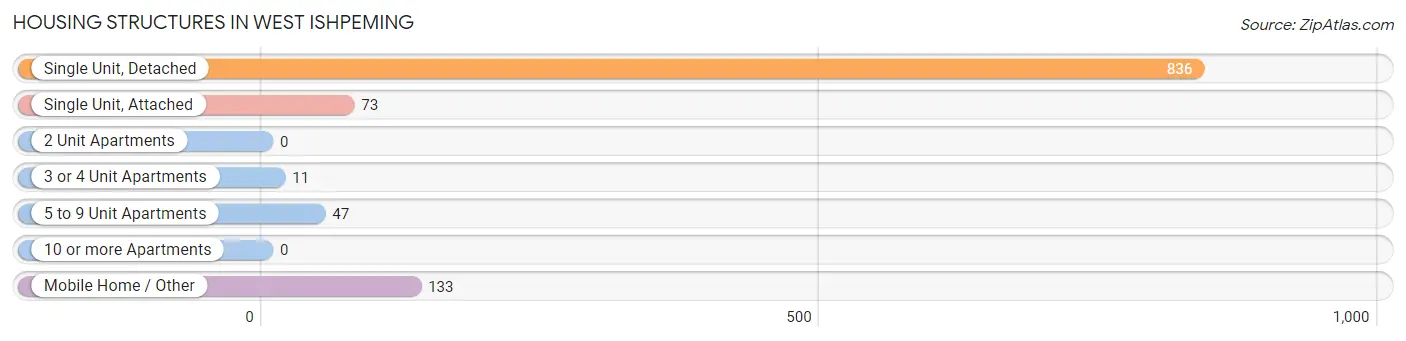
| Structure Type | # Housing Units | % Housing Units |
| Single Unit, Detached | 836 | 76.0% |
| Single Unit, Attached | 73 | 6.6% |
| 2 Unit Apartments | 0 | 0.0% |
| 3 or 4 Unit Apartments | 11 | 1.0% |
| 5 to 9 Unit Apartments | 47 | 4.3% |
| 10 or more Apartments | 0 | 0.0% |
| Mobile Home / Other | 133 | 12.1% |
| Total | 1,100 | 100.0% |
Housing Structures by Occupancy in West Ishpeming
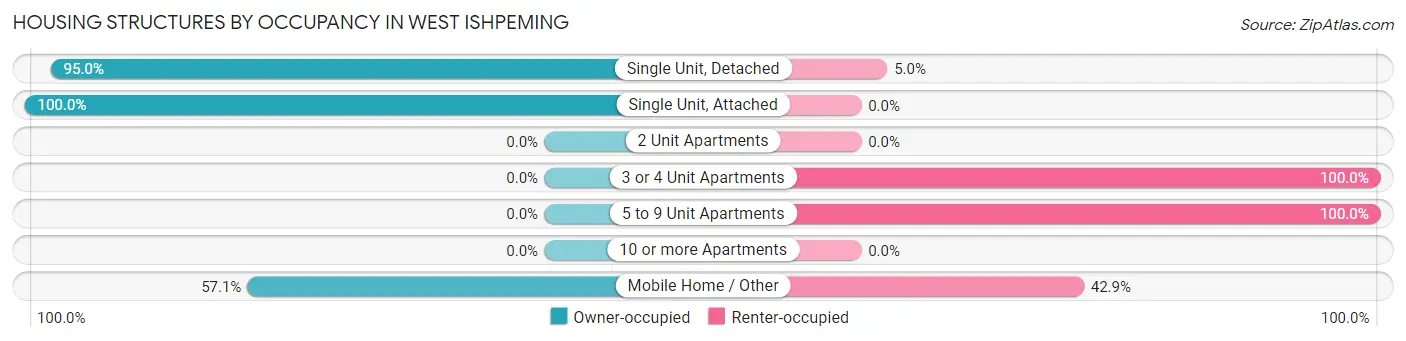
| Structure Type | Owner-occupied | Renter-occupied |
| Single Unit, Detached | 794 (95.0%) | 42 (5.0%) |
| Single Unit, Attached | 73 (100.0%) | 0 (0.0%) |
| 2 Unit Apartments | 0 (0.0%) | 0 (0.0%) |
| 3 or 4 Unit Apartments | 0 (0.0%) | 11 (100.0%) |
| 5 to 9 Unit Apartments | 0 (0.0%) | 47 (100.0%) |
| 10 or more Apartments | 0 (0.0%) | 0 (0.0%) |
| Mobile Home / Other | 76 (57.1%) | 57 (42.9%) |
| Total | 943 (85.7%) | 157 (14.3%) |
Housing Structures by Number of Rooms in West Ishpeming
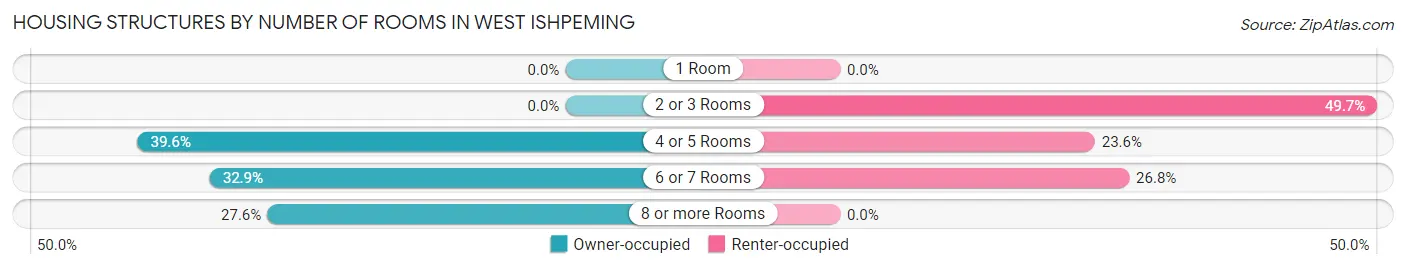
| Number of Rooms | Owner-occupied | Renter-occupied |
| 1 Room | 0 (0.0%) | 0 (0.0%) |
| 2 or 3 Rooms | 0 (0.0%) | 78 (49.7%) |
| 4 or 5 Rooms | 373 (39.6%) | 37 (23.6%) |
| 6 or 7 Rooms | 310 (32.9%) | 42 (26.8%) |
| 8 or more Rooms | 260 (27.6%) | 0 (0.0%) |
| Total | 943 (100.0%) | 157 (100.0%) |
Housing Structure by Heating Type in West Ishpeming
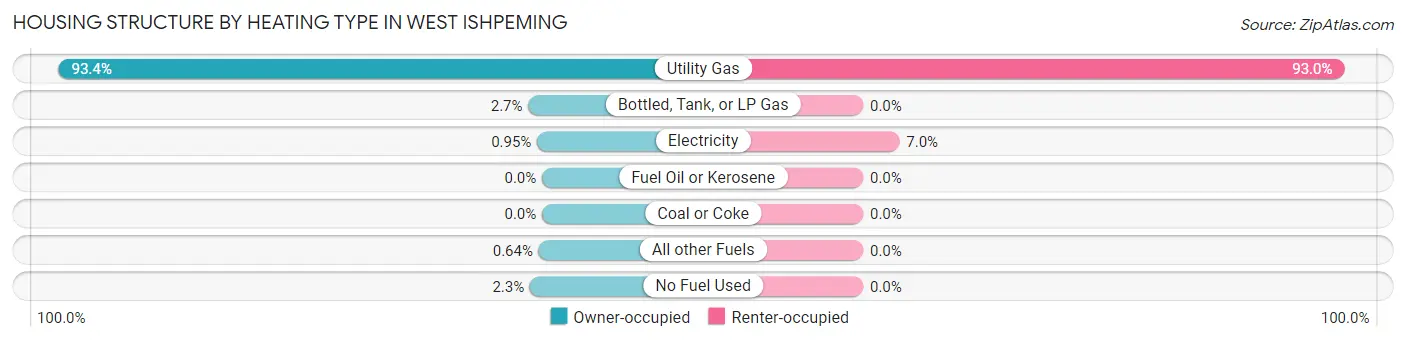
| Heating Type | Owner-occupied | Renter-occupied |
| Utility Gas | 881 (93.4%) | 146 (93.0%) |
| Bottled, Tank, or LP Gas | 25 (2.6%) | 0 (0.0%) |
| Electricity | 9 (0.9%) | 11 (7.0%) |
| Fuel Oil or Kerosene | 0 (0.0%) | 0 (0.0%) |
| Coal or Coke | 0 (0.0%) | 0 (0.0%) |
| All other Fuels | 6 (0.6%) | 0 (0.0%) |
| No Fuel Used | 22 (2.3%) | 0 (0.0%) |
| Total | 943 (100.0%) | 157 (100.0%) |
Household Vehicle Usage in West Ishpeming
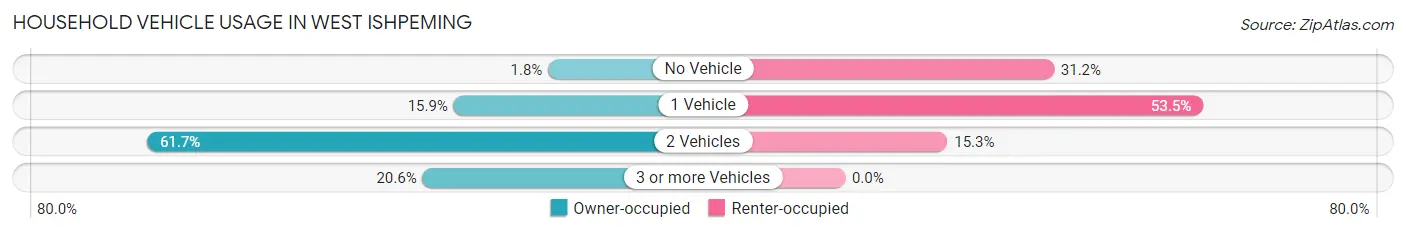
| Vehicles per Household | Owner-occupied | Renter-occupied |
| No Vehicle | 17 (1.8%) | 49 (31.2%) |
| 1 Vehicle | 150 (15.9%) | 84 (53.5%) |
| 2 Vehicles | 582 (61.7%) | 24 (15.3%) |
| 3 or more Vehicles | 194 (20.6%) | 0 (0.0%) |
| Total | 943 (100.0%) | 157 (100.0%) |
Real Estate & Mortgages in West Ishpeming
Real Estate and Mortgage Overview in West Ishpeming
| Characteristic | Without Mortgage | With Mortgage |
| Housing Units | 411 | 532 |
| Median Property Value | $108,800 | $184,700 |
| Median Household Income | $58,550 | $88 |
| Monthly Housing Costs | $412 | $0 |
| Real Estate Taxes | $1,058 | $20 |
Property Value by Mortgage Status in West Ishpeming
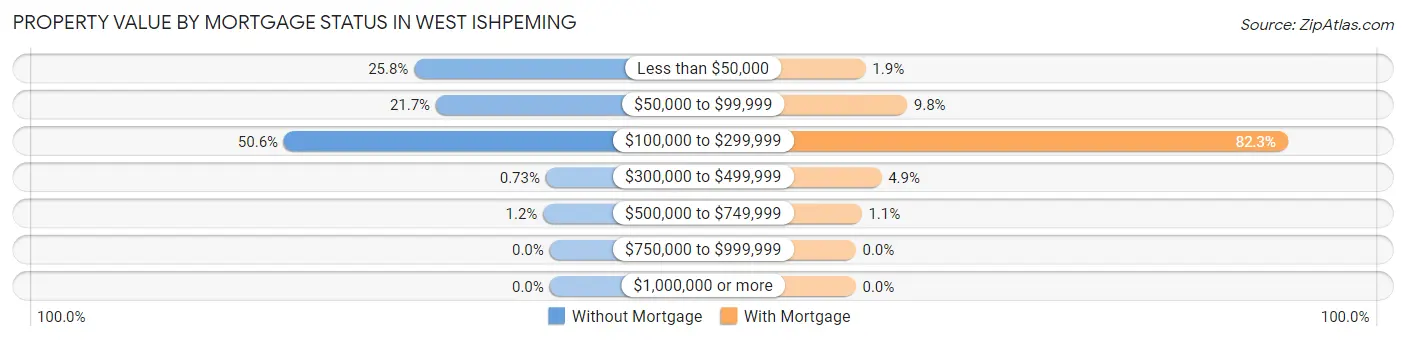
| Property Value | Without Mortgage | With Mortgage |
| Less than $50,000 | 106 (25.8%) | 10 (1.9%) |
| $50,000 to $99,999 | 89 (21.6%) | 52 (9.8%) |
| $100,000 to $299,999 | 208 (50.6%) | 438 (82.3%) |
| $300,000 to $499,999 | 3 (0.7%) | 26 (4.9%) |
| $500,000 to $749,999 | 5 (1.2%) | 6 (1.1%) |
| $750,000 to $999,999 | 0 (0.0%) | 0 (0.0%) |
| $1,000,000 or more | 0 (0.0%) | 0 (0.0%) |
| Total | 411 (100.0%) | 532 (100.0%) |
Household Income by Mortgage Status in West Ishpeming
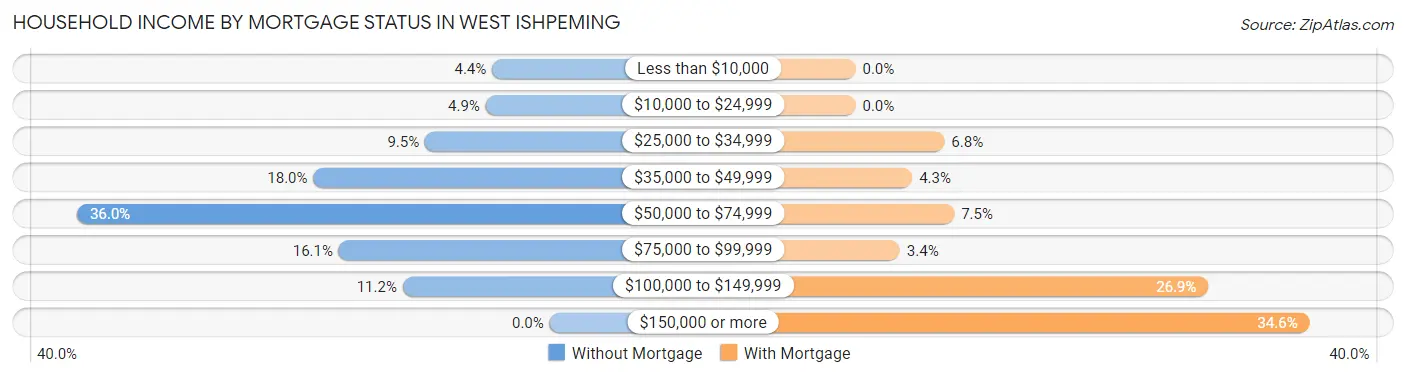
| Household Income | Without Mortgage | With Mortgage |
| Less than $10,000 | 18 (4.4%) | 0 (0.0%) |
| $10,000 to $24,999 | 20 (4.9%) | 0 (0.0%) |
| $25,000 to $34,999 | 39 (9.5%) | 36 (6.8%) |
| $35,000 to $49,999 | 74 (18.0%) | 23 (4.3%) |
| $50,000 to $74,999 | 148 (36.0%) | 40 (7.5%) |
| $75,000 to $99,999 | 66 (16.1%) | 18 (3.4%) |
| $100,000 to $149,999 | 46 (11.2%) | 143 (26.9%) |
| $150,000 or more | 0 (0.0%) | 184 (34.6%) |
| Total | 411 (100.0%) | 532 (100.0%) |
Property Value to Household Income Ratio in West Ishpeming
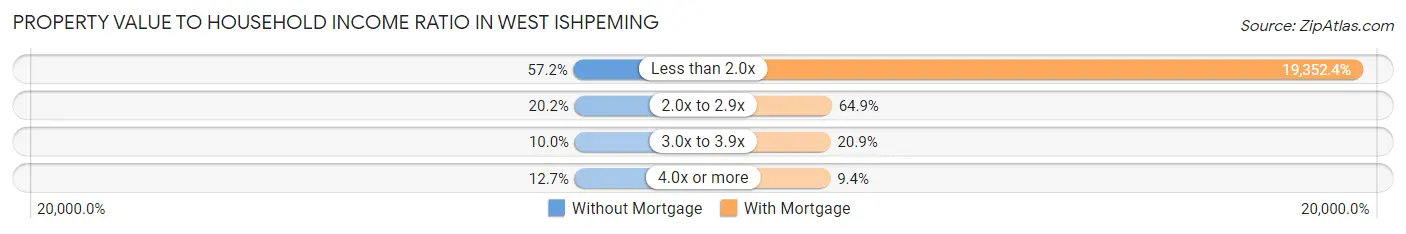
| Value-to-Income Ratio | Without Mortgage | With Mortgage |
| Less than 2.0x | 235 (57.2%) | 102,955 (19,352.4%) |
| 2.0x to 2.9x | 83 (20.2%) | 345 (64.8%) |
| 3.0x to 3.9x | 41 (10.0%) | 111 (20.9%) |
| 4.0x or more | 52 (12.7%) | 50 (9.4%) |
| Total | 411 (100.0%) | 532 (100.0%) |
Real Estate Taxes by Mortgage Status in West Ishpeming
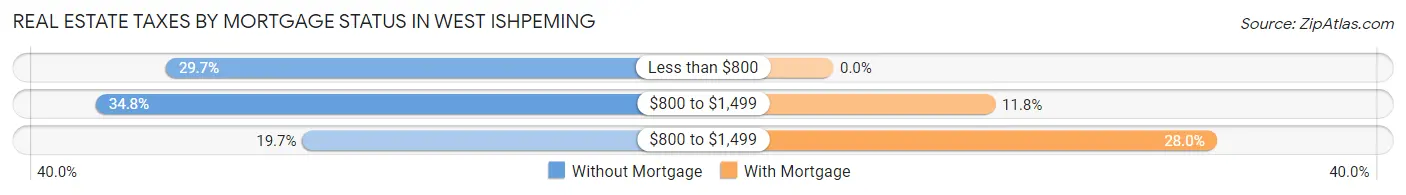
| Property Taxes | Without Mortgage | With Mortgage |
| Less than $800 | 122 (29.7%) | 0 (0.0%) |
| $800 to $1,499 | 143 (34.8%) | 63 (11.8%) |
| $800 to $1,499 | 81 (19.7%) | 149 (28.0%) |
| Total | 411 (100.0%) | 532 (100.0%) |
Health & Disability in West Ishpeming
Health Insurance Coverage by Age in West Ishpeming
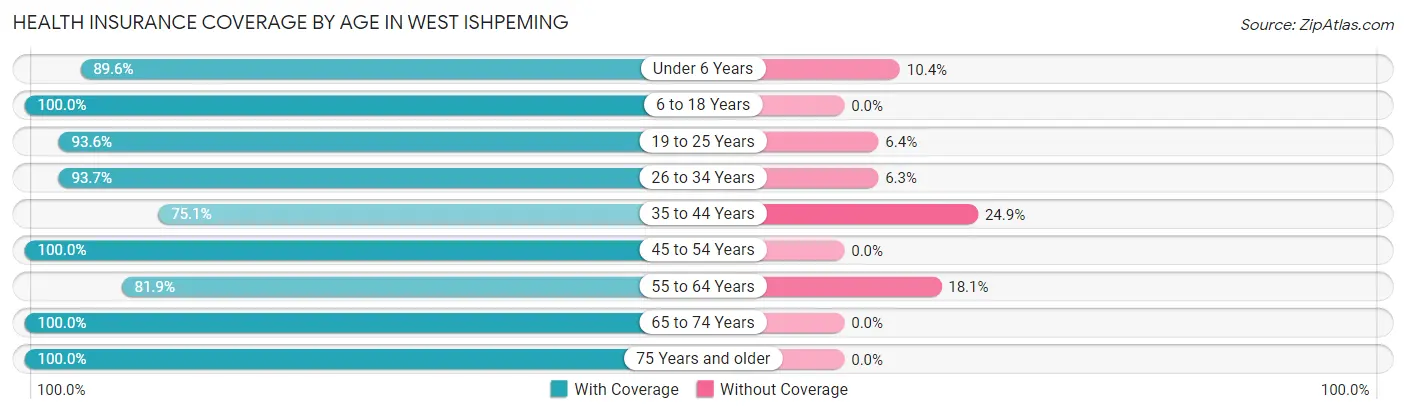
| Age Bracket | With Coverage | Without Coverage |
| Under 6 Years | 121 (89.6%) | 14 (10.4%) |
| 6 to 18 Years | 489 (100.0%) | 0 (0.0%) |
| 19 to 25 Years | 206 (93.6%) | 14 (6.4%) |
| 26 to 34 Years | 222 (93.7%) | 15 (6.3%) |
| 35 to 44 Years | 274 (75.1%) | 91 (24.9%) |
| 45 to 54 Years | 257 (100.0%) | 0 (0.0%) |
| 55 to 64 Years | 299 (81.9%) | 66 (18.1%) |
| 65 to 74 Years | 364 (100.0%) | 0 (0.0%) |
| 75 Years and older | 208 (100.0%) | 0 (0.0%) |
| Total | 2,440 (92.4%) | 200 (7.6%) |
Health Insurance Coverage by Citizenship Status in West Ishpeming
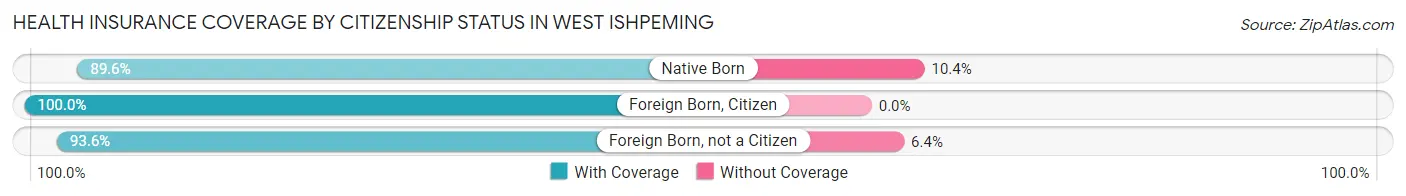
| Citizenship Status | With Coverage | Without Coverage |
| Native Born | 121 (89.6%) | 14 (10.4%) |
| Foreign Born, Citizen | 489 (100.0%) | 0 (0.0%) |
| Foreign Born, not a Citizen | 206 (93.6%) | 14 (6.4%) |
Health Insurance Coverage by Household Income in West Ishpeming
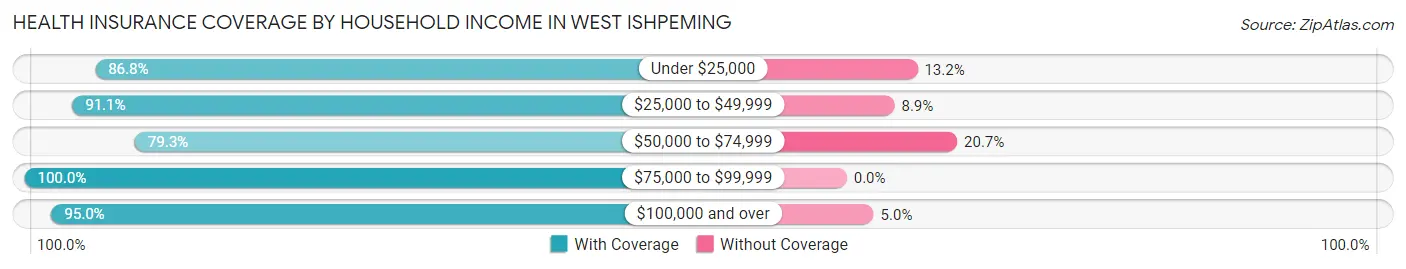
| Household Income | With Coverage | Without Coverage |
| Under $25,000 | 177 (86.8%) | 27 (13.2%) |
| $25,000 to $49,999 | 326 (91.1%) | 32 (8.9%) |
| $50,000 to $74,999 | 330 (79.3%) | 86 (20.7%) |
| $75,000 to $99,999 | 564 (100.0%) | 0 (0.0%) |
| $100,000 and over | 1,038 (95.0%) | 55 (5.0%) |
Public vs Private Health Insurance Coverage by Age in West Ishpeming
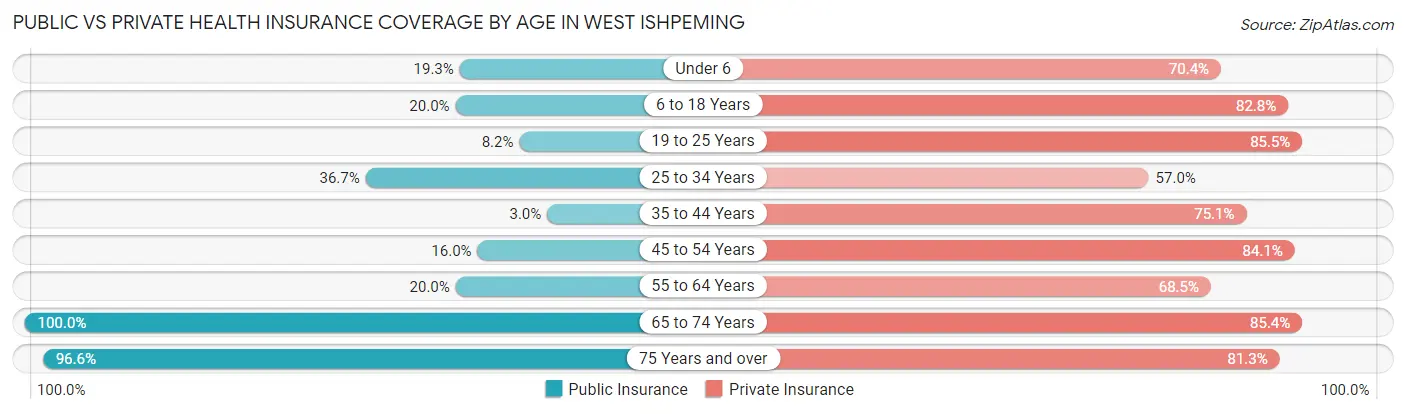
| Age Bracket | Public Insurance | Private Insurance |
| Under 6 | 26 (19.3%) | 95 (70.4%) |
| 6 to 18 Years | 98 (20.0%) | 405 (82.8%) |
| 19 to 25 Years | 18 (8.2%) | 188 (85.5%) |
| 25 to 34 Years | 87 (36.7%) | 135 (57.0%) |
| 35 to 44 Years | 11 (3.0%) | 274 (75.1%) |
| 45 to 54 Years | 41 (16.0%) | 216 (84.1%) |
| 55 to 64 Years | 73 (20.0%) | 250 (68.5%) |
| 65 to 74 Years | 364 (100.0%) | 311 (85.4%) |
| 75 Years and over | 201 (96.6%) | 169 (81.2%) |
| Total | 919 (34.8%) | 2,043 (77.4%) |
Disability Status by Sex by Age in West Ishpeming
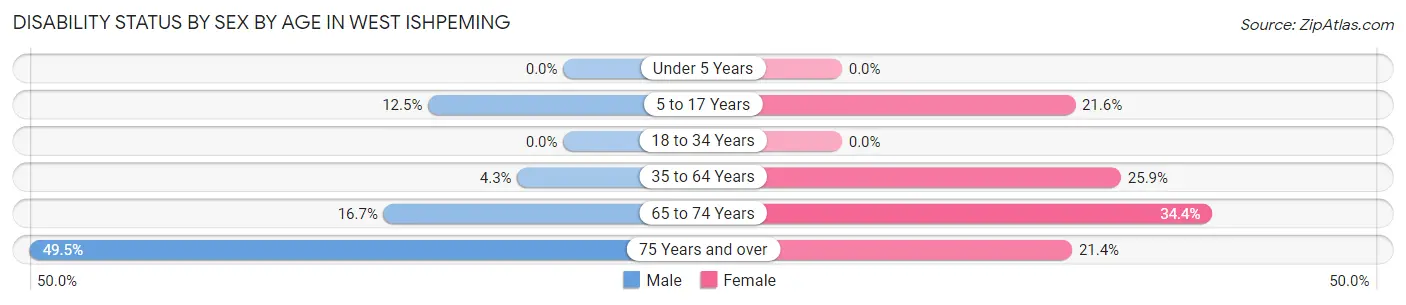
| Age Bracket | Male | Female |
| Under 5 Years | 0 (0.0%) | 0 (0.0%) |
| 5 to 17 Years | 40 (12.5%) | 29 (21.6%) |
| 18 to 34 Years | 0 (0.0%) | 0 (0.0%) |
| 35 to 64 Years | 22 (4.3%) | 122 (25.9%) |
| 65 to 74 Years | 34 (16.7%) | 55 (34.4%) |
| 75 Years and over | 52 (49.5%) | 22 (21.4%) |
Disability Class by Sex by Age in West Ishpeming
Disability Class: Hearing Difficulty
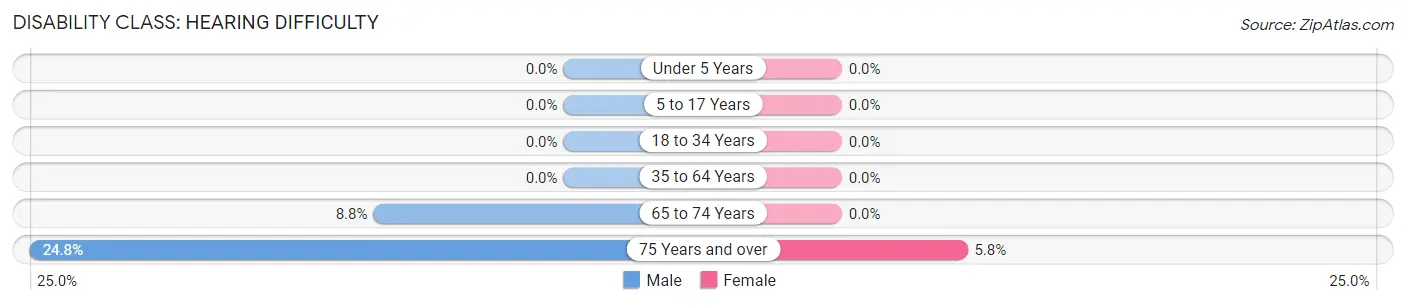
| Age Bracket | Male | Female |
| Under 5 Years | 0 (0.0%) | 0 (0.0%) |
| 5 to 17 Years | 0 (0.0%) | 0 (0.0%) |
| 18 to 34 Years | 0 (0.0%) | 0 (0.0%) |
| 35 to 64 Years | 0 (0.0%) | 0 (0.0%) |
| 65 to 74 Years | 18 (8.8%) | 0 (0.0%) |
| 75 Years and over | 26 (24.8%) | 6 (5.8%) |
Disability Class: Vision Difficulty
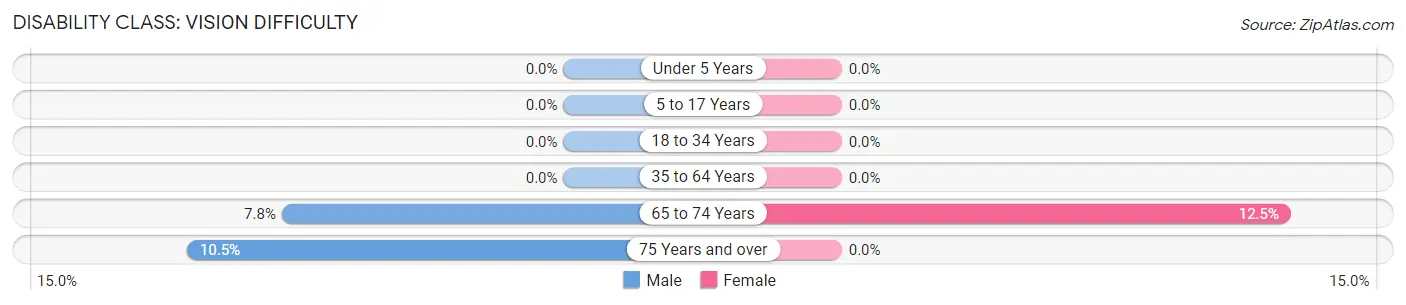
| Age Bracket | Male | Female |
| Under 5 Years | 0 (0.0%) | 0 (0.0%) |
| 5 to 17 Years | 0 (0.0%) | 0 (0.0%) |
| 18 to 34 Years | 0 (0.0%) | 0 (0.0%) |
| 35 to 64 Years | 0 (0.0%) | 0 (0.0%) |
| 65 to 74 Years | 16 (7.8%) | 20 (12.5%) |
| 75 Years and over | 11 (10.5%) | 0 (0.0%) |
Disability Class: Cognitive Difficulty
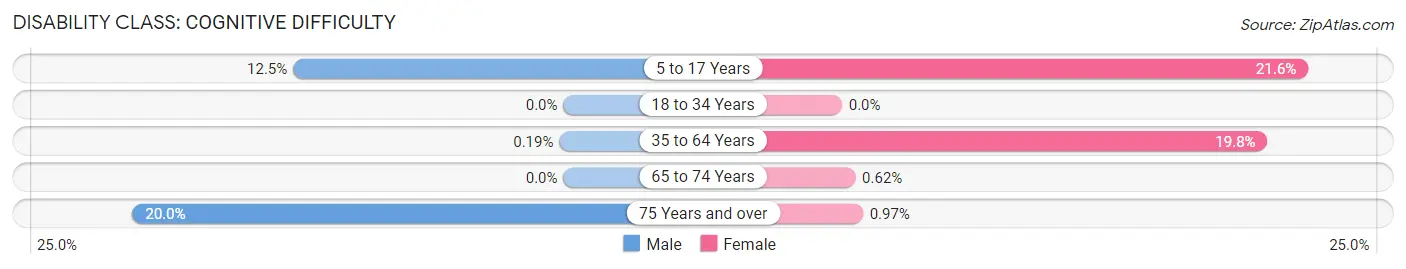
| Age Bracket | Male | Female |
| 5 to 17 Years | 40 (12.5%) | 29 (21.6%) |
| 18 to 34 Years | 0 (0.0%) | 0 (0.0%) |
| 35 to 64 Years | 1 (0.2%) | 93 (19.8%) |
| 65 to 74 Years | 0 (0.0%) | 1 (0.6%) |
| 75 Years and over | 21 (20.0%) | 1 (1.0%) |
Disability Class: Ambulatory Difficulty
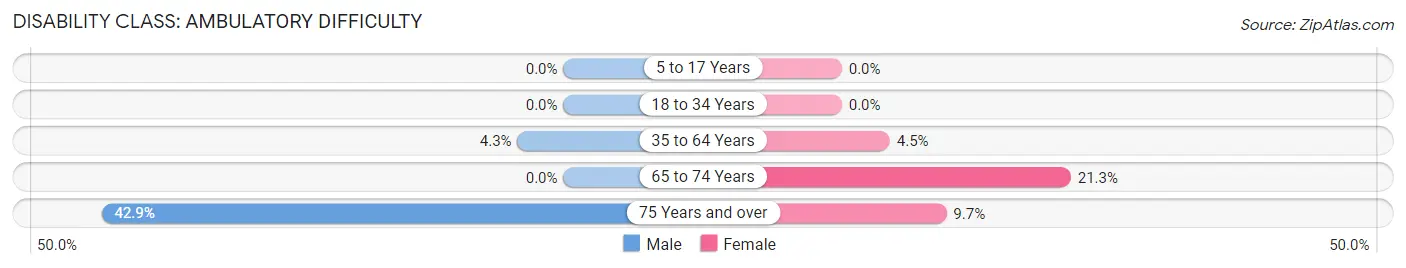
| Age Bracket | Male | Female |
| 5 to 17 Years | 0 (0.0%) | 0 (0.0%) |
| 18 to 34 Years | 0 (0.0%) | 0 (0.0%) |
| 35 to 64 Years | 22 (4.3%) | 21 (4.5%) |
| 65 to 74 Years | 0 (0.0%) | 34 (21.2%) |
| 75 Years and over | 45 (42.9%) | 10 (9.7%) |
Disability Class: Self-Care Difficulty
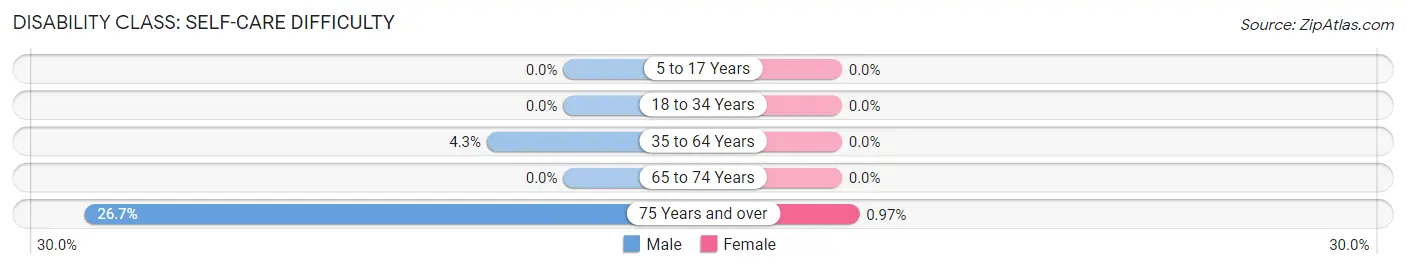
| Age Bracket | Male | Female |
| 5 to 17 Years | 0 (0.0%) | 0 (0.0%) |
| 18 to 34 Years | 0 (0.0%) | 0 (0.0%) |
| 35 to 64 Years | 22 (4.3%) | 0 (0.0%) |
| 65 to 74 Years | 0 (0.0%) | 0 (0.0%) |
| 75 Years and over | 28 (26.7%) | 1 (1.0%) |
Technology Access in West Ishpeming
Computing Device Access in West Ishpeming
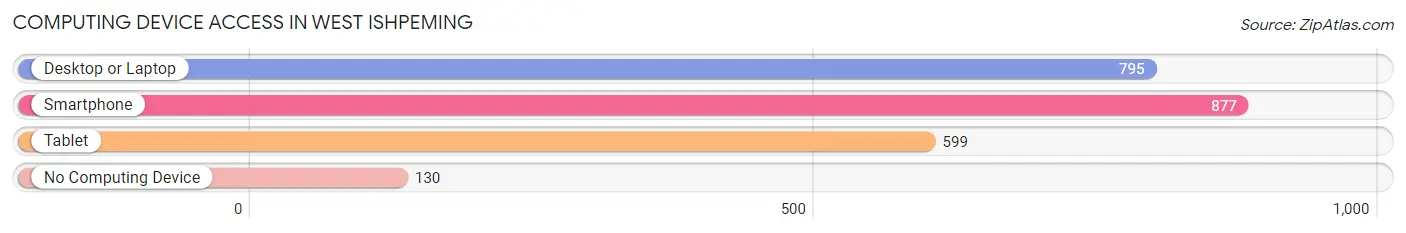
| Device Type | # Households | % Households |
| Desktop or Laptop | 795 | 72.3% |
| Smartphone | 877 | 79.7% |
| Tablet | 599 | 54.4% |
| No Computing Device | 130 | 11.8% |
| Total | 1,100 | 100.0% |
Internet Access in West Ishpeming
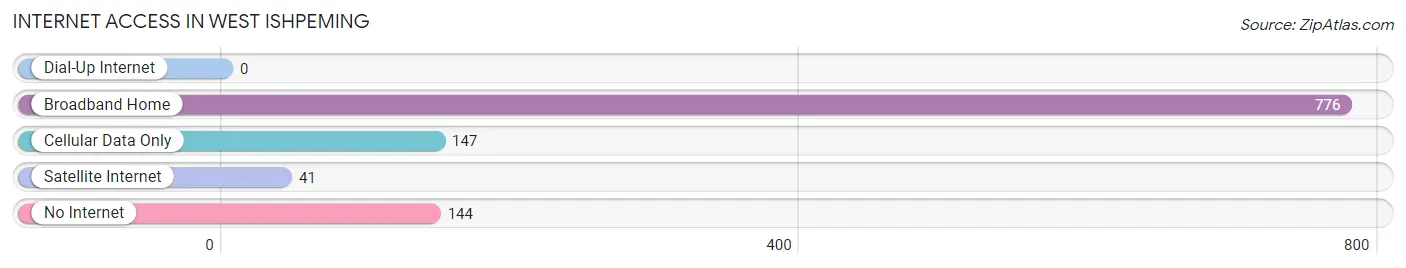
| Internet Type | # Households | % Households |
| Dial-Up Internet | 0 | 0.0% |
| Broadband Home | 776 | 70.6% |
| Cellular Data Only | 147 | 13.4% |
| Satellite Internet | 41 | 3.7% |
| No Internet | 144 | 13.1% |
| Total | 1,100 | 100.0% |
West Ishpeming Summary
Ishpeming is a city located in the Upper Peninsula of Michigan. It is the county seat of Marquette County and is located in the center of the Upper Peninsula. The city is situated on the west side of the Marquette Iron Range, which is a major iron ore mining region. The city is home to a population of approximately 7,000 people and is the largest city in the Upper Peninsula.
History
Ishpeming was first settled in 1853 by a group of miners from Cornwall, England. The miners were looking for iron ore and were attracted to the area due to its abundance of natural resources. The city was officially incorporated in 1871 and was named after the Ojibwe word for “high ground”.
The city quickly grew as a result of the mining industry and by the late 19th century, Ishpeming was the largest city in the Upper Peninsula. The city was home to a number of iron ore mines, including the Negaunee Mine, which was the largest iron ore mine in the world at the time. The city was also home to a number of other industries, including lumber, paper, and textiles.
Geography
Ishpeming is located in the Upper Peninsula of Michigan, in the center of the state. The city is situated on the west side of the Marquette Iron Range, which is a major iron ore mining region. The city is located on the banks of the Carp River and is surrounded by forests and lakes. The city is located approximately 30 miles west of Marquette and is approximately 200 miles north of Detroit.
The city has a total area of 4.2 square miles, of which 4.1 square miles is land and 0.1 square miles is water. The city has a humid continental climate, with cold winters and warm summers.
Economy
Ishpeming’s economy is largely based on the mining industry. The city is home to a number of iron ore mines, including the Negaunee Mine, which is the largest iron ore mine in the world. The city is also home to a number of other industries, including lumber, paper, and textiles.
The city is also home to a number of businesses, including restaurants, retail stores, and hotels. The city is also home to a number of educational institutions, including Northern Michigan University and the Ishpeming Public Schools.
Demographics
As of the 2010 census, the city had a population of 7,000 people. The racial makeup of the city was 95.3% White, 0.7% African American, 0.3% Native American, 0.7% Asian, 0.1% Pacific Islander, 0.7% from other races, and 2.0% from two or more races. Hispanic or Latino of any race were 2.3% of the population.
The median income for a household in the city was $37,500 and the median income for a family was $45,000. The per capita income for the city was $19,000. About 11.3% of families and 14.2% of the population were below the poverty line, including 18.2% of those under age 18 and 8.3% of those age 65 or over.
Common Questions
What is Per Capita Income in West Ishpeming?
Per Capita income in West Ishpeming is $35,266.
What is the Median Family Income in West Ishpeming?
Median Family Income in West Ishpeming is $90,386.
What is the Median Household income in West Ishpeming?
Median Household Income in West Ishpeming is $78,750.
What is Income or Wage Gap in West Ishpeming?
Income or Wage Gap in West Ishpeming is 17.6%.
Women in West Ishpeming earn 82.4 cents for every dollar earned by a man.
What is Inequality or Gini Index in West Ishpeming?
Inequality or Gini Index in West Ishpeming is 0.38.
What is the Total Population of West Ishpeming?
Total Population of West Ishpeming is 2,713.
What is the Total Male Population of West Ishpeming?
Total Male Population of West Ishpeming is 1,499.
What is the Total Female Population of West Ishpeming?
Total Female Population of West Ishpeming is 1,214.
What is the Ratio of Males per 100 Females in West Ishpeming?
There are 123.48 Males per 100 Females in West Ishpeming.
What is the Ratio of Females per 100 Males in West Ishpeming?
There are 80.99 Females per 100 Males in West Ishpeming.
What is the Median Population Age in West Ishpeming?
Median Population Age in West Ishpeming is 41.8 Years.
What is the Average Family Size in West Ishpeming
Average Family Size in West Ishpeming is 2.8 People.
What is the Average Household Size in West Ishpeming
Average Household Size in West Ishpeming is 2.4 People.
How Large is the Labor Force in West Ishpeming?
There are 1,274 People in the Labor Forcein in West Ishpeming.
What is the Percentage of People in the Labor Force in West Ishpeming?
56.7% of People are in the Labor Force in West Ishpeming.
What is the Unemployment Rate in West Ishpeming?
Unemployment Rate in West Ishpeming is 5.3%.