Zip Codes with the Highest Percentage of Population Employed in Security & Protection in Howell, MI
RELATED REPORTS & OPTIONS
Security & Protection
Howell
Compare Zip Codes
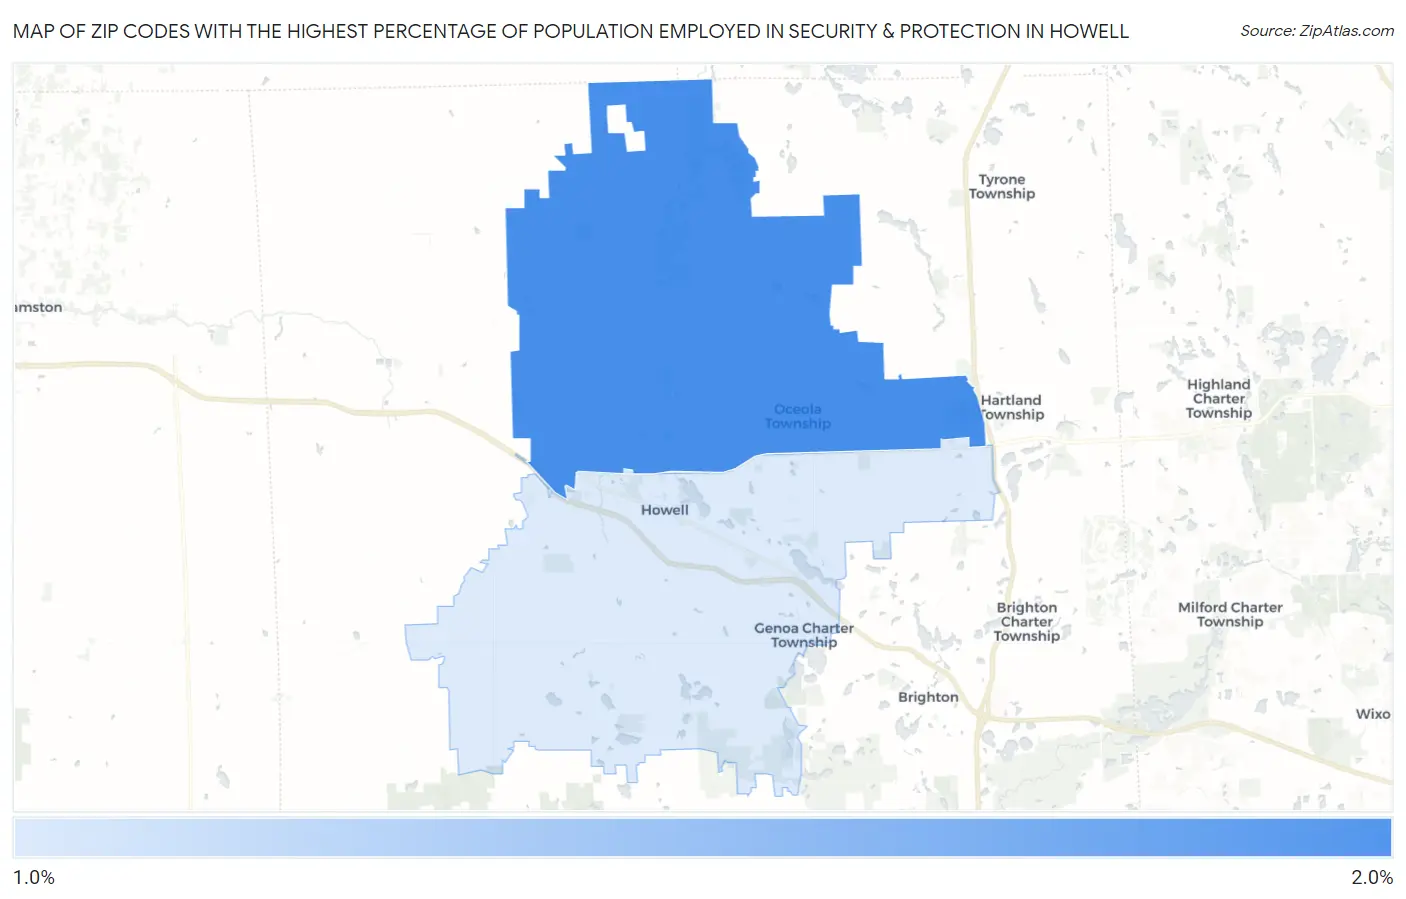
Map of Zip Codes with the Highest Percentage of Population Employed in Security & Protection in Howell
1.4%
1.9%
Zip Codes with the Highest Percentage of Population Employed in Security & Protection in Howell, MI
| Zip Code | % Employed | vs State | vs National | |
| 1. | 48855 | 1.9% | 1.6%(+0.291)#308 | 2.1%(-0.216)#13,006 |
| 2. | 48843 | 1.4% | 1.6%(-0.224)#470 | 2.1%(-0.731)#16,820 |
1
Common Questions
What are the Top Zip Codes with the Highest Percentage of Population Employed in Security & Protection in Howell, MI?
Top Zip Codes with the Highest Percentage of Population Employed in Security & Protection in Howell, MI are:
What zip code has the Highest Percentage of Population Employed in Security & Protection in Howell, MI?
48855 has the Highest Percentage of Population Employed in Security & Protection in Howell, MI with 1.9%.
What is the Percentage of Population Employed in Security & Protection in Howell, MI?
Percentage of Population Employed in Security & Protection in Howell is 1.3%.
What is the Percentage of Population Employed in Security & Protection in Michigan?
Percentage of Population Employed in Security & Protection in Michigan is 1.6%.
What is the Percentage of Population Employed in Security & Protection in the United States?
Percentage of Population Employed in Security & Protection in the United States is 2.1%.