Jasper, MI Map & Demographics
Jasper Map
Jasper Overview
$27,349
PER CAPITA INCOME
$67,813
AVG FAMILY INCOME
$56,250
AVG HOUSEHOLD INCOME
0.36
INEQUALITY / GINI INDEX
344
TOTAL POPULATION
141
MALE POPULATION
203
FEMALE POPULATION
69.46
MALES / 100 FEMALES
143.97
FEMALES / 100 MALES
32.3
MEDIAN AGE
3.2
AVG FAMILY SIZE
2.8
AVG HOUSEHOLD SIZE
208
LABOR FORCE [ PEOPLE ]
68.9%
PERCENT IN LABOR FORCE
10.1%
UNEMPLOYMENT RATE
Jasper Zip Codes
Jasper Area Codes
Income in Jasper
Income Overview in Jasper
Per Capita Income in Jasper is $27,349, while median incomes of families and households are $67,813 and $56,250 respectively.
| Characteristic | Number | Measure |
| Per Capita Income | 344 | $27,349 |
| Median Family Income | 88 | $67,813 |
| Mean Family Income | 88 | $73,391 |
| Median Household Income | 121 | $56,250 |
| Mean Household Income | 121 | $70,395 |
| Income Deficit | 88 | $0 |
| Wage / Income Gap (%) | 344 | 0.00% |
| Wage / Income Gap ($) | 344 | 100.00¢ per $1 |
| Gini / Inequality Index | 344 | 0.36 |
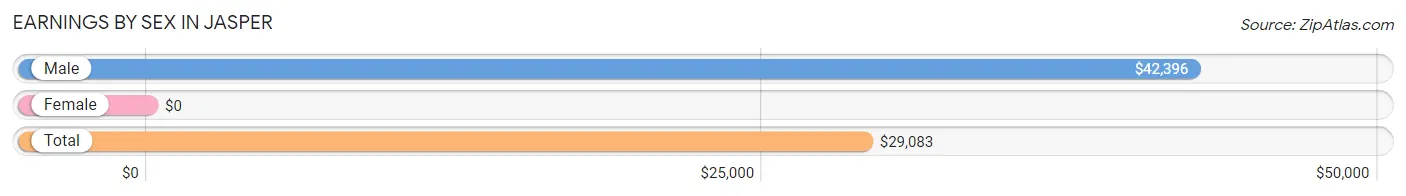
Earnings by Sex in Jasper
| Sex | Number | Average Earnings |
| Male | 101 (48.3%) | $42,396 |
| Female | 108 (51.7%) | $0 |
| Total | 209 (100.0%) | $29,083 |
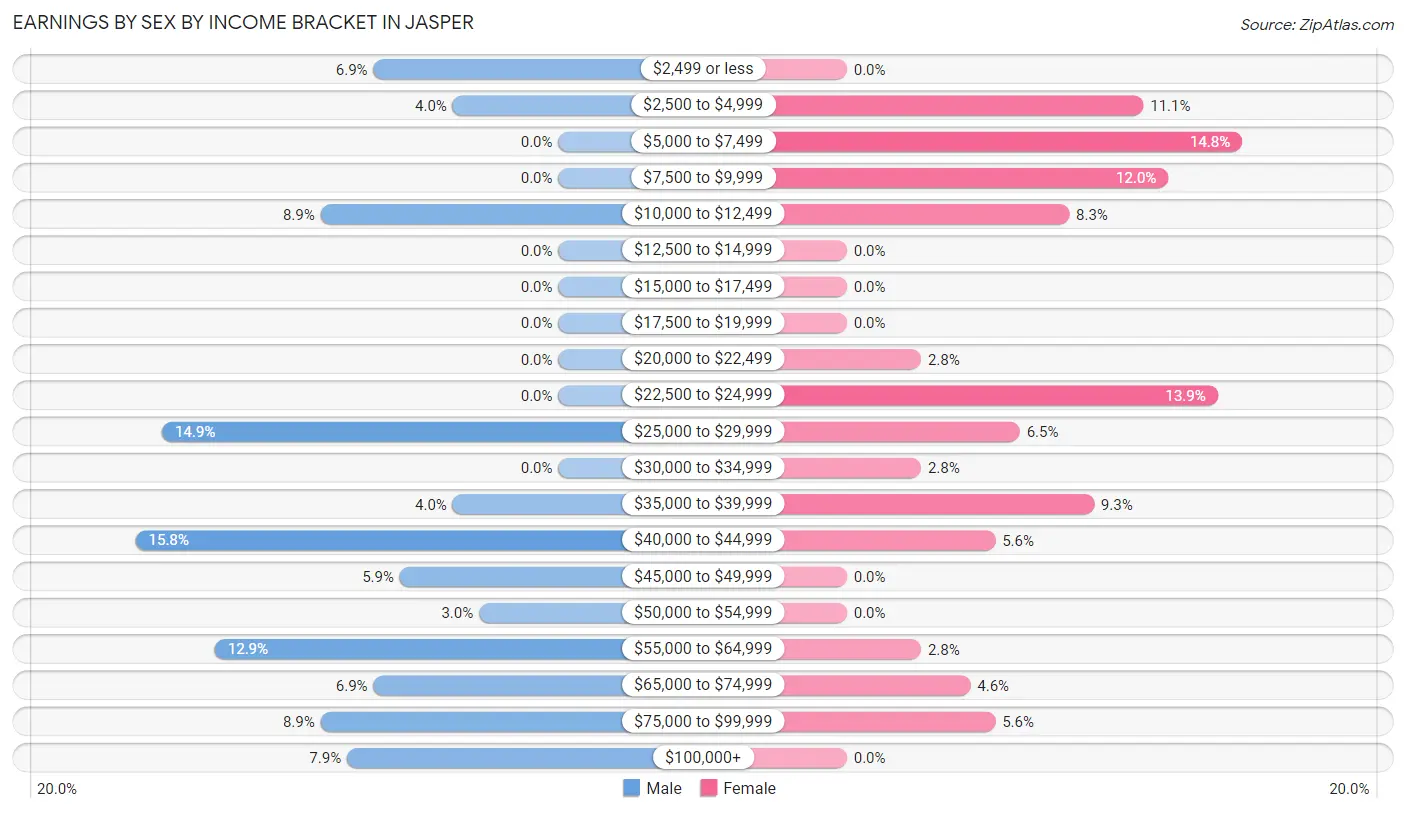
Earnings by Sex by Income Bracket in Jasper
The most common earnings brackets in Jasper are $40,000 to $44,999 for men (16 | 15.8%) and $5,000 to $7,499 for women (16 | 14.8%).
| Income | Male | Female |
| $2,499 or less | 7 (6.9%) | 0 (0.0%) |
| $2,500 to $4,999 | 4 (4.0%) | 12 (11.1%) |
| $5,000 to $7,499 | 0 (0.0%) | 16 (14.8%) |
| $7,500 to $9,999 | 0 (0.0%) | 13 (12.0%) |
| $10,000 to $12,499 | 9 (8.9%) | 9 (8.3%) |
| $12,500 to $14,999 | 0 (0.0%) | 0 (0.0%) |
| $15,000 to $17,499 | 0 (0.0%) | 0 (0.0%) |
| $17,500 to $19,999 | 0 (0.0%) | 0 (0.0%) |
| $20,000 to $22,499 | 0 (0.0%) | 3 (2.8%) |
| $22,500 to $24,999 | 0 (0.0%) | 15 (13.9%) |
| $25,000 to $29,999 | 15 (14.8%) | 7 (6.5%) |
| $30,000 to $34,999 | 0 (0.0%) | 3 (2.8%) |
| $35,000 to $39,999 | 4 (4.0%) | 10 (9.3%) |
| $40,000 to $44,999 | 16 (15.8%) | 6 (5.6%) |
| $45,000 to $49,999 | 6 (5.9%) | 0 (0.0%) |
| $50,000 to $54,999 | 3 (3.0%) | 0 (0.0%) |
| $55,000 to $64,999 | 13 (12.9%) | 3 (2.8%) |
| $65,000 to $74,999 | 7 (6.9%) | 5 (4.6%) |
| $75,000 to $99,999 | 9 (8.9%) | 6 (5.6%) |
| $100,000+ | 8 (7.9%) | 0 (0.0%) |
| Total | 101 (100.0%) | 108 (100.0%) |
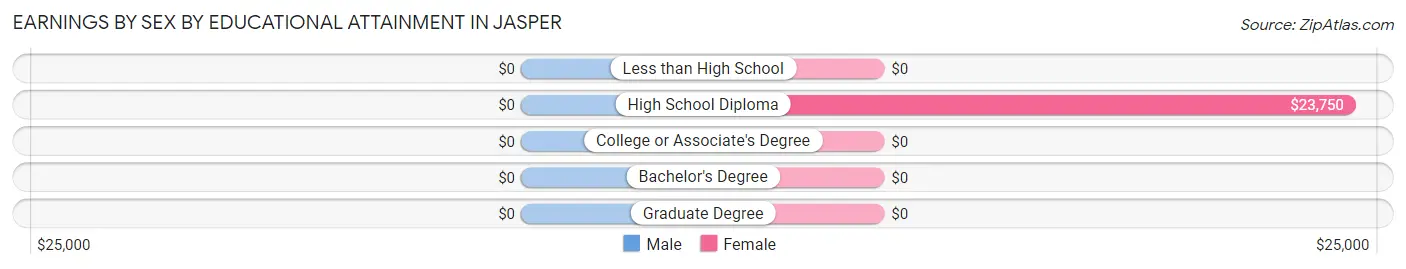
Earnings by Sex by Educational Attainment in Jasper
| Educational Attainment | Male Income | Female Income |
| Less than High School | - | - |
| High School Diploma | - | - |
| College or Associate's Degree | - | - |
| Bachelor's Degree | - | - |
| Graduate Degree | - | - |
| Total | $51,250 | $26,667 |
Family Income in Jasper
Family Income Brackets in Jasper
According to the Jasper family income data, there are 19 families falling into the $50,000 to $74,999 income range, which is the most common income bracket and makes up 21.6% of all families.
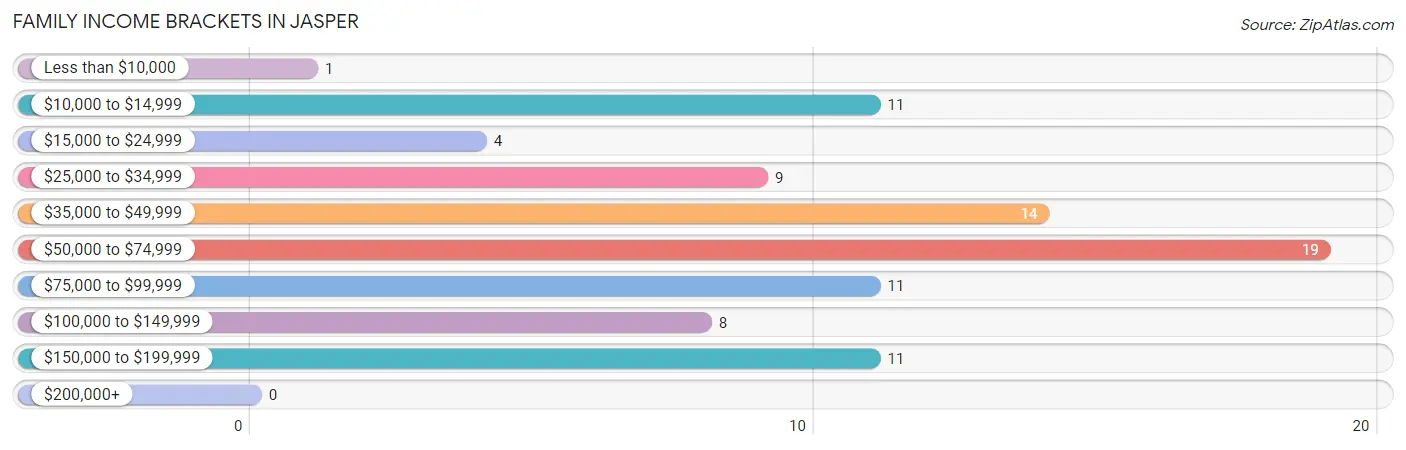
| Income Bracket | # Families | % Families |
| Less than $10,000 | 1 | 1.1% |
| $10,000 to $14,999 | 11 | 12.5% |
| $15,000 to $24,999 | 4 | 4.5% |
| $25,000 to $34,999 | 9 | 10.2% |
| $35,000 to $49,999 | 14 | 15.9% |
| $50,000 to $74,999 | 19 | 21.6% |
| $75,000 to $99,999 | 11 | 12.5% |
| $100,000 to $149,999 | 8 | 9.1% |
| $150,000 to $199,999 | 11 | 12.5% |
| $200,000+ | 0 | 0.0% |
Family Income by Famaliy Size in Jasper
4-person families (28 | 31.8%) account for the highest median family income in Jasper with $68,846 per family, while 2-person families (39 | 44.3%) have the highest median income of $22,875 per family member.
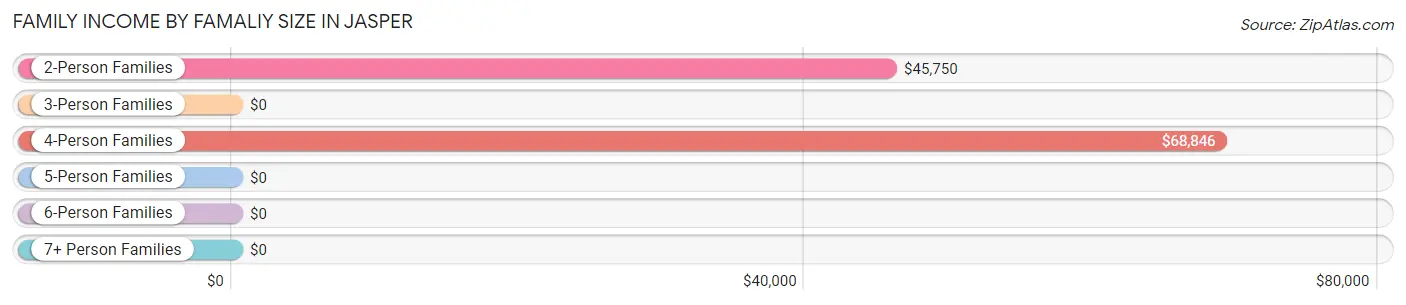
| Income Bracket | # Families | Median Income |
| 2-Person Families | 39 (44.3%) | $45,750 |
| 3-Person Families | 17 (19.3%) | $0 |
| 4-Person Families | 28 (31.8%) | $68,846 |
| 5-Person Families | 4 (4.5%) | $0 |
| 6-Person Families | 0 (0.0%) | $0 |
| 7+ Person Families | 0 (0.0%) | $0 |
| Total | 88 (100.0%) | $67,813 |
Family Income by Number of Earners in Jasper
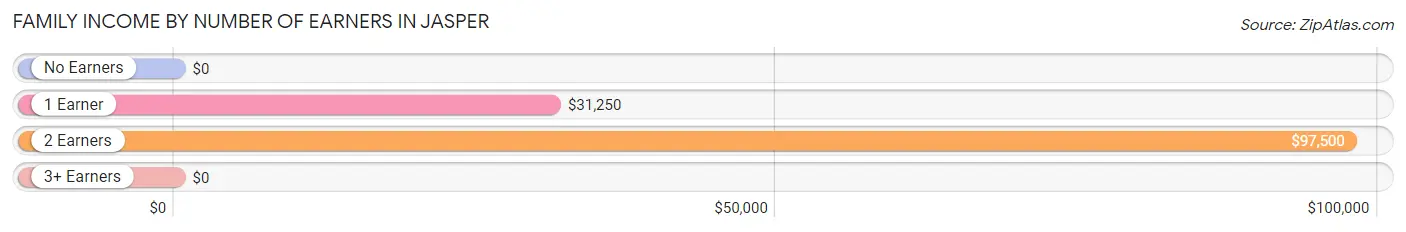
| Number of Earners | # Families | Median Income |
| No Earners | 6 (6.8%) | $0 |
| 1 Earner | 37 (42.0%) | $31,250 |
| 2 Earners | 24 (27.3%) | $97,500 |
| 3+ Earners | 21 (23.9%) | $0 |
| Total | 88 (100.0%) | $67,813 |
Household Income in Jasper
Household Income Brackets in Jasper
With 34 households falling in the category, the $50,000 to $74,999 income range is the most frequent in Jasper, accounting for 28.1% of all households.
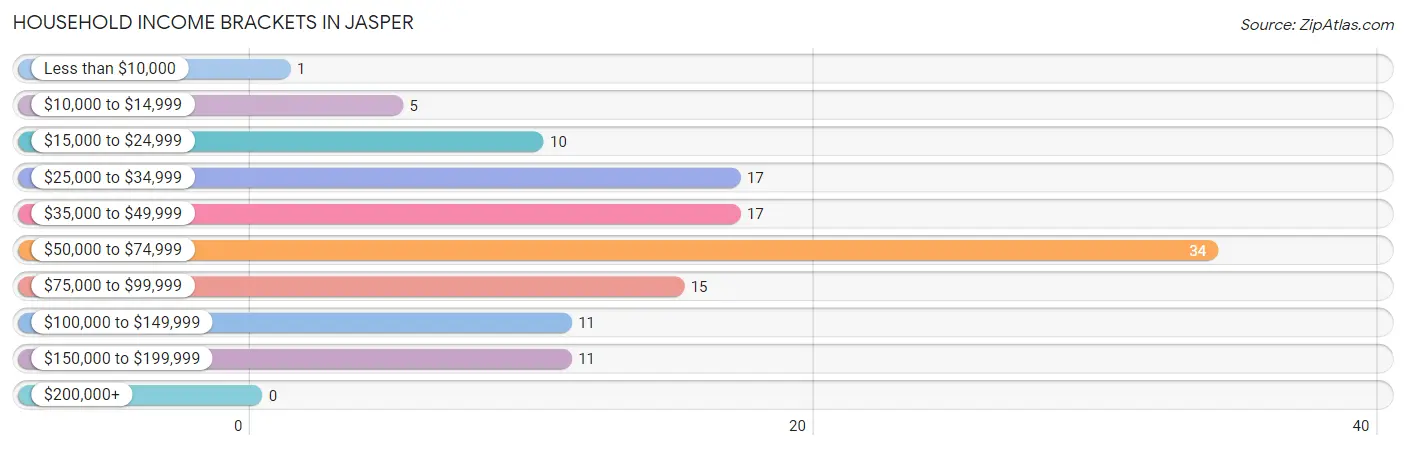
| Income Bracket | # Households | % Households |
| Less than $10,000 | 1 | 0.8% |
| $10,000 to $14,999 | 5 | 4.1% |
| $15,000 to $24,999 | 10 | 8.3% |
| $25,000 to $34,999 | 17 | 14.0% |
| $35,000 to $49,999 | 17 | 14.0% |
| $50,000 to $74,999 | 34 | 28.1% |
| $75,000 to $99,999 | 15 | 12.4% |
| $100,000 to $149,999 | 11 | 9.1% |
| $150,000 to $199,999 | 11 | 9.1% |
| $200,000+ | 0 | 0.0% |
Household Income by Householder Age in Jasper
The median household income in Jasper is $56,250, with the highest median household income of $77,500 found in the 25 to 44 years age bracket for the primary householder. A total of 26 households (21.5%) fall into this category. Meanwhile, the 65+ years age bracket for the primary householder has the lowest median household income of $28,438, with 28 households (23.1%) in this group.
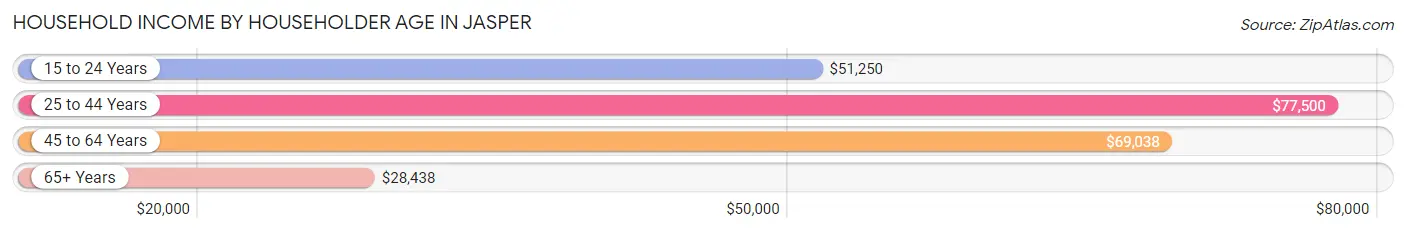
| Income Bracket | # Households | Median Income |
| 15 to 24 Years | 21 (17.4%) | $51,250 |
| 25 to 44 Years | 26 (21.5%) | $77,500 |
| 45 to 64 Years | 46 (38.0%) | $69,038 |
| 65+ Years | 28 (23.1%) | $28,438 |
| Total | 121 (100.0%) | $56,250 |
Poverty in Jasper
Income Below Poverty by Sex and Age in Jasper
With 13.5% poverty level for males and 13.8% for females among the residents of Jasper, 6 to 11 year old males and 6 to 11 year old females are the most vulnerable to poverty, with 3 males (50.0%) and 4 females (50.0%) in their respective age groups living below the poverty level.
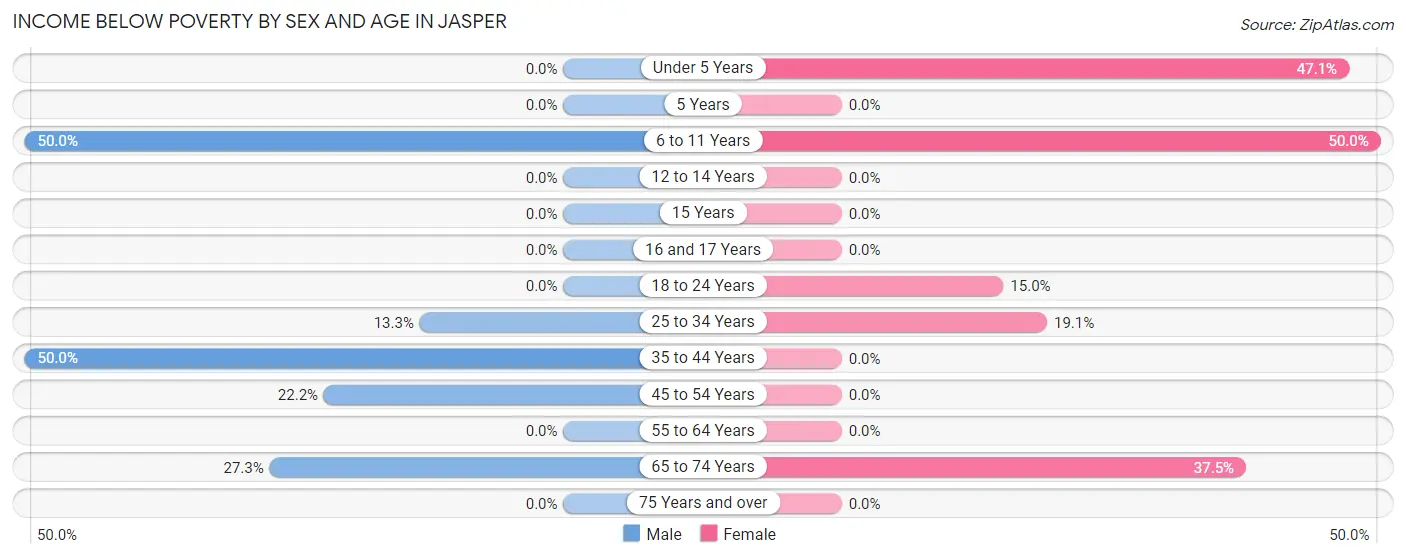
| Age Bracket | Male | Female |
| Under 5 Years | 0 (0.0%) | 8 (47.1%) |
| 5 Years | 0 (0.0%) | 0 (0.0%) |
| 6 to 11 Years | 3 (50.0%) | 4 (50.0%) |
| 12 to 14 Years | 0 (0.0%) | 0 (0.0%) |
| 15 Years | 0 (0.0%) | 0 (0.0%) |
| 16 and 17 Years | 0 (0.0%) | 0 (0.0%) |
| 18 to 24 Years | 0 (0.0%) | 9 (15.0%) |
| 25 to 34 Years | 4 (13.3%) | 4 (19.1%) |
| 35 to 44 Years | 3 (50.0%) | 0 (0.0%) |
| 45 to 54 Years | 6 (22.2%) | 0 (0.0%) |
| 55 to 64 Years | 0 (0.0%) | 0 (0.0%) |
| 65 to 74 Years | 3 (27.3%) | 3 (37.5%) |
| 75 Years and over | 0 (0.0%) | 0 (0.0%) |
| Total | 19 (13.5%) | 28 (13.8%) |
Income Above Poverty by Sex and Age in Jasper
According to the poverty statistics in Jasper, males aged under 5 years and females aged 16 and 17 years are the age groups that are most secure financially, with 100.0% of males and 100.0% of females in these age groups living above the poverty line.
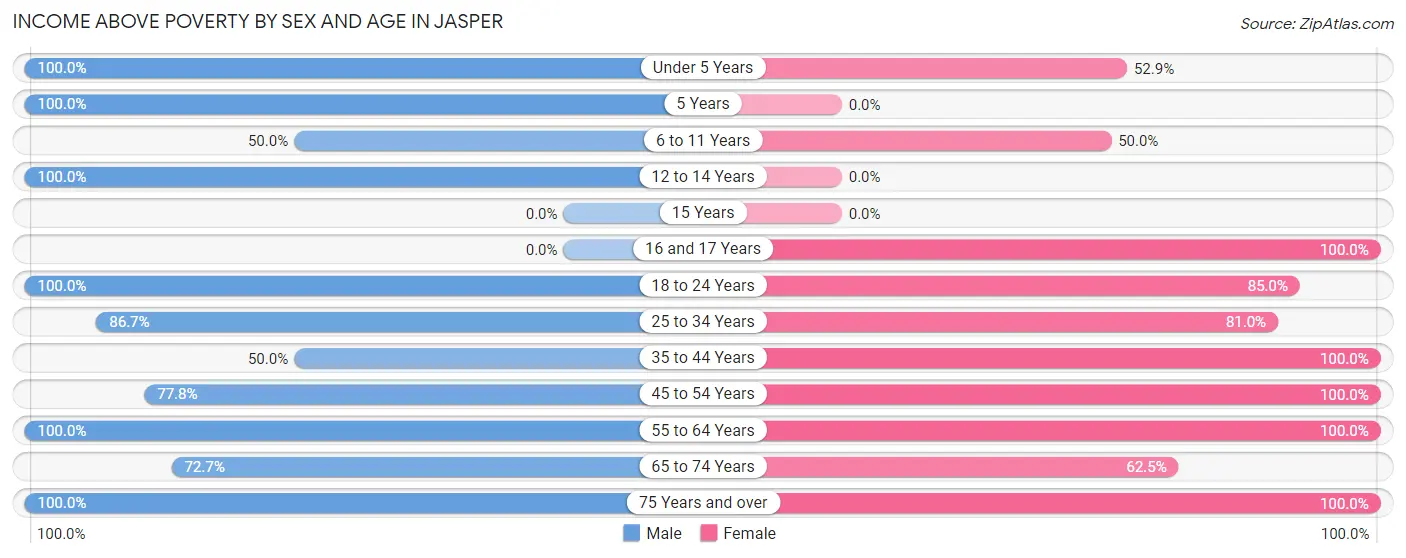
| Age Bracket | Male | Female |
| Under 5 Years | 6 (100.0%) | 9 (52.9%) |
| 5 Years | 2 (100.0%) | 0 (0.0%) |
| 6 to 11 Years | 3 (50.0%) | 4 (50.0%) |
| 12 to 14 Years | 3 (100.0%) | 0 (0.0%) |
| 15 Years | 0 (0.0%) | 0 (0.0%) |
| 16 and 17 Years | 0 (0.0%) | 8 (100.0%) |
| 18 to 24 Years | 28 (100.0%) | 51 (85.0%) |
| 25 to 34 Years | 26 (86.7%) | 17 (80.9%) |
| 35 to 44 Years | 3 (50.0%) | 3 (100.0%) |
| 45 to 54 Years | 21 (77.8%) | 29 (100.0%) |
| 55 to 64 Years | 17 (100.0%) | 17 (100.0%) |
| 65 to 74 Years | 8 (72.7%) | 5 (62.5%) |
| 75 Years and over | 5 (100.0%) | 32 (100.0%) |
| Total | 122 (86.5%) | 175 (86.2%) |
Income Below Poverty Among Married-Couple Families in Jasper
The poverty statistics for married-couple families in Jasper show that 4.7% or 3 of the total 64 families live below the poverty line. Families with no children have the highest poverty rate of 5.8%, comprising of 3 families. On the other hand, families with 1 or 2 children have the lowest poverty rate of 0.0%, which includes 0 families.
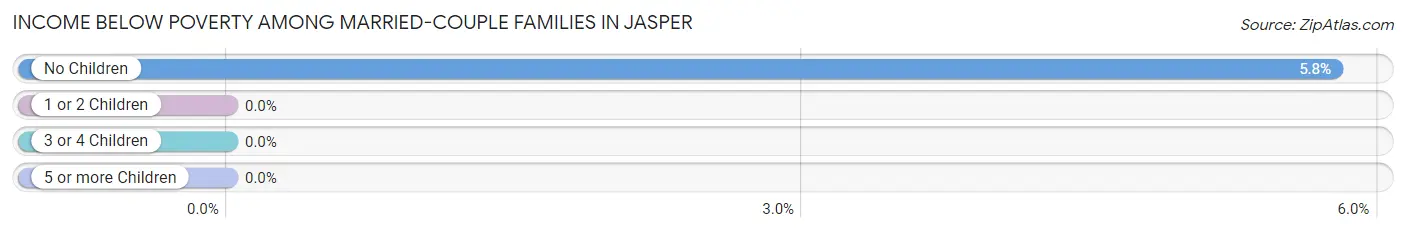
| Children | Above Poverty | Below Poverty |
| No Children | 49 (94.2%) | 3 (5.8%) |
| 1 or 2 Children | 12 (100.0%) | 0 (0.0%) |
| 3 or 4 Children | 0 (0.0%) | 0 (0.0%) |
| 5 or more Children | 0 (0.0%) | 0 (0.0%) |
| Total | 61 (95.3%) | 3 (4.7%) |
Income Below Poverty Among Single-Parent Households in Jasper
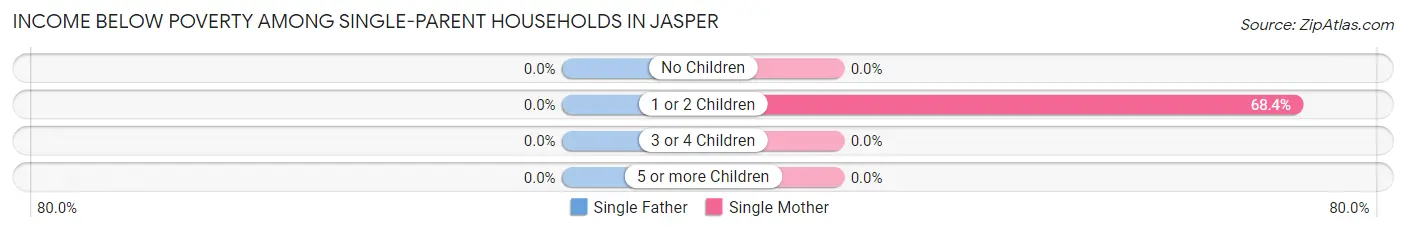
| Children | Single Father | Single Mother |
| No Children | 0 (0.0%) | 0 (0.0%) |
| 1 or 2 Children | 0 (0.0%) | 13 (68.4%) |
| 3 or 4 Children | 0 (0.0%) | 0 (0.0%) |
| 5 or more Children | 0 (0.0%) | 0 (0.0%) |
| Total | 0 (0.0%) | 13 (54.2%) |
Income Below Poverty Among Married-Couple vs Single-Parent Households in Jasper
The poverty data for Jasper shows that 3 of the married-couple family households (4.7%) and 13 of the single-parent households (54.2%) are living below the poverty level. Within the married-couple family households, those with no children have the highest poverty rate, with 3 households (5.8%) falling below the poverty line. Among the single-parent households, those with 1 or 2 children have the highest poverty rate, with 13 household (68.4%) living below poverty.
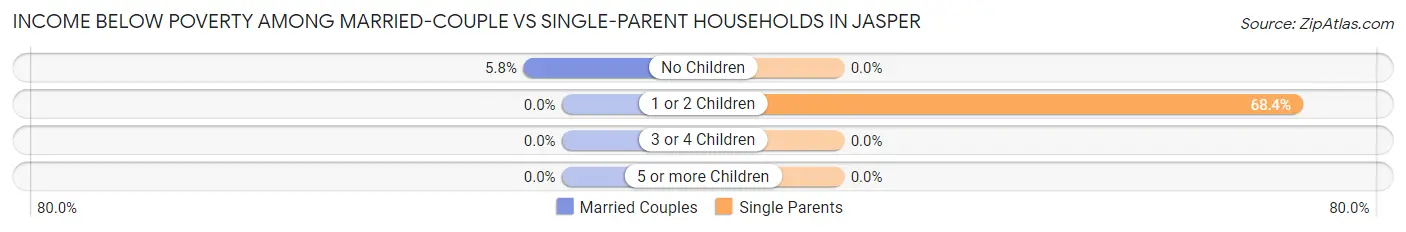
| Children | Married-Couple Families | Single-Parent Households |
| No Children | 3 (5.8%) | 0 (0.0%) |
| 1 or 2 Children | 0 (0.0%) | 13 (68.4%) |
| 3 or 4 Children | 0 (0.0%) | 0 (0.0%) |
| 5 or more Children | 0 (0.0%) | 0 (0.0%) |
| Total | 3 (4.7%) | 13 (54.2%) |
Race in Jasper
The most populous races in Jasper are White / Caucasian (335 | 97.4%), Hispanic or Latino (18 | 5.2%), and Two or more Races (5 | 1.5%).
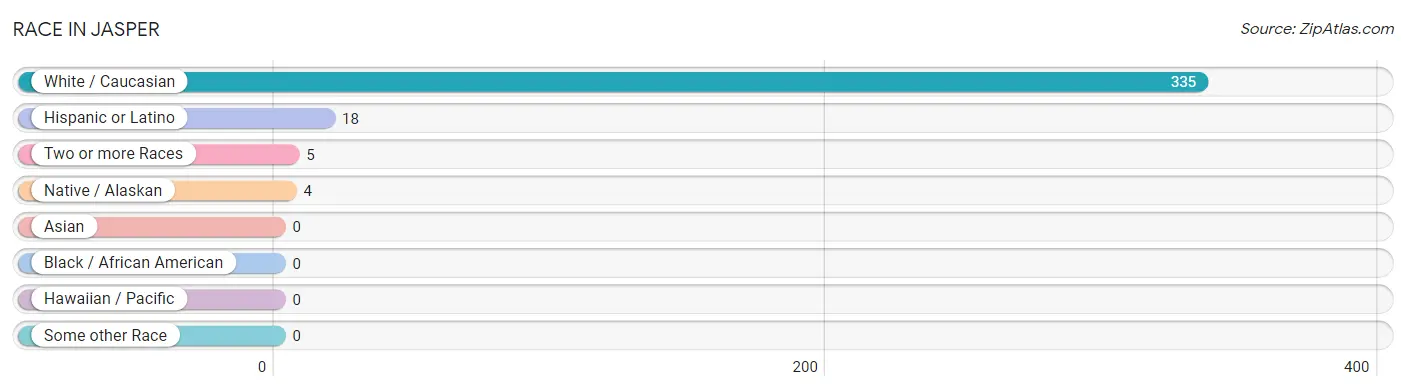
| Race | # Population | % Population |
| Asian | 0 | 0.0% |
| Black / African American | 0 | 0.0% |
| Hawaiian / Pacific | 0 | 0.0% |
| Hispanic or Latino | 18 | 5.2% |
| Native / Alaskan | 4 | 1.2% |
| White / Caucasian | 335 | 97.4% |
| Two or more Races | 5 | 1.5% |
| Some other Race | 0 | 0.0% |
| Total | 344 | 100.0% |
Ancestry in Jasper
The most populous ancestries reported in Jasper are German (80 | 23.3%), Irish (61 | 17.7%), American (33 | 9.6%), British (16 | 4.6%), and Mexican (15 | 4.4%), together accounting for 59.6% of all Jasper residents.
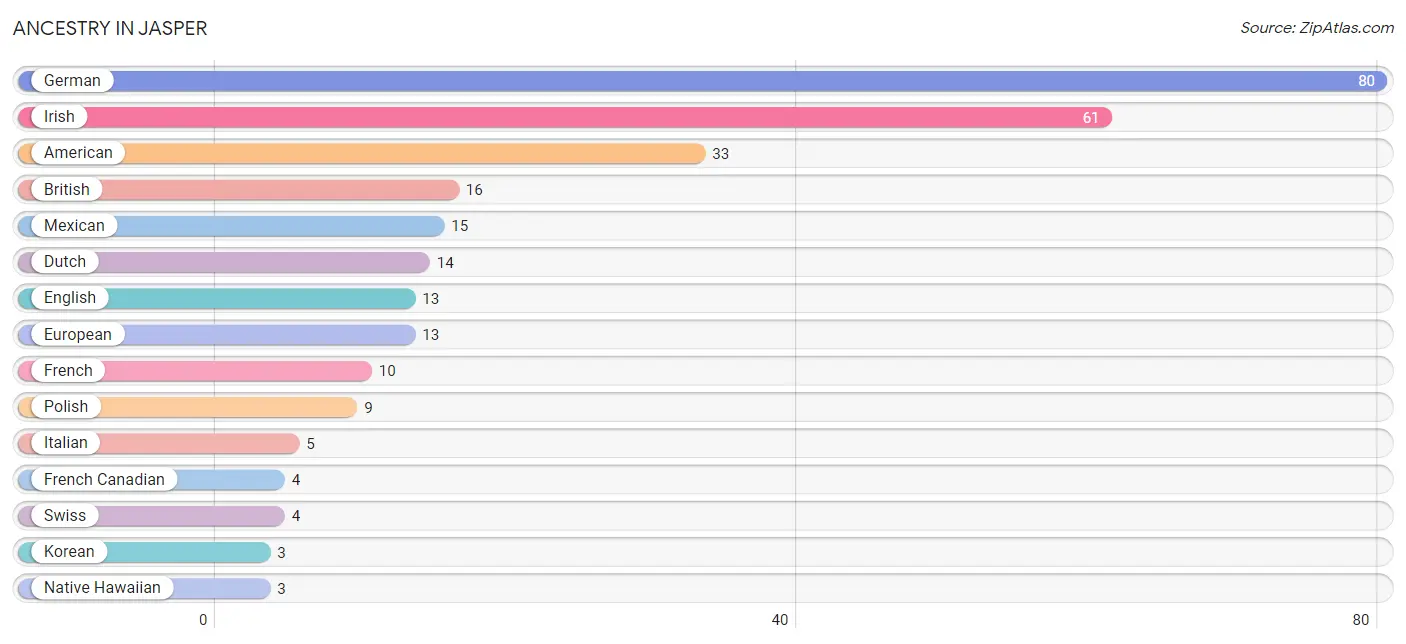
| Ancestry | # Population | % Population |
| American | 33 | 9.6% |
| British | 16 | 4.6% |
| Dutch | 14 | 4.1% |
| English | 13 | 3.8% |
| European | 13 | 3.8% |
| French | 10 | 2.9% |
| French Canadian | 4 | 1.2% |
| German | 80 | 23.3% |
| Irish | 61 | 17.7% |
| Italian | 5 | 1.5% |
| Korean | 3 | 0.9% |
| Mexican | 15 | 4.4% |
| Native Hawaiian | 3 | 0.9% |
| Polish | 9 | 2.6% |
| Spaniard | 3 | 0.9% |
| Swiss | 4 | 1.2% | View All 16 Rows |
Immigrants in Jasper

| Immigration Origin | # Population | % Population | View All 0 Rows |
Sex and Age in Jasper
Sex and Age in Jasper
The most populous age groups in Jasper are 20 to 24 Years (28 | 19.9%) for men and 20 to 24 Years (36 | 17.7%) for women.
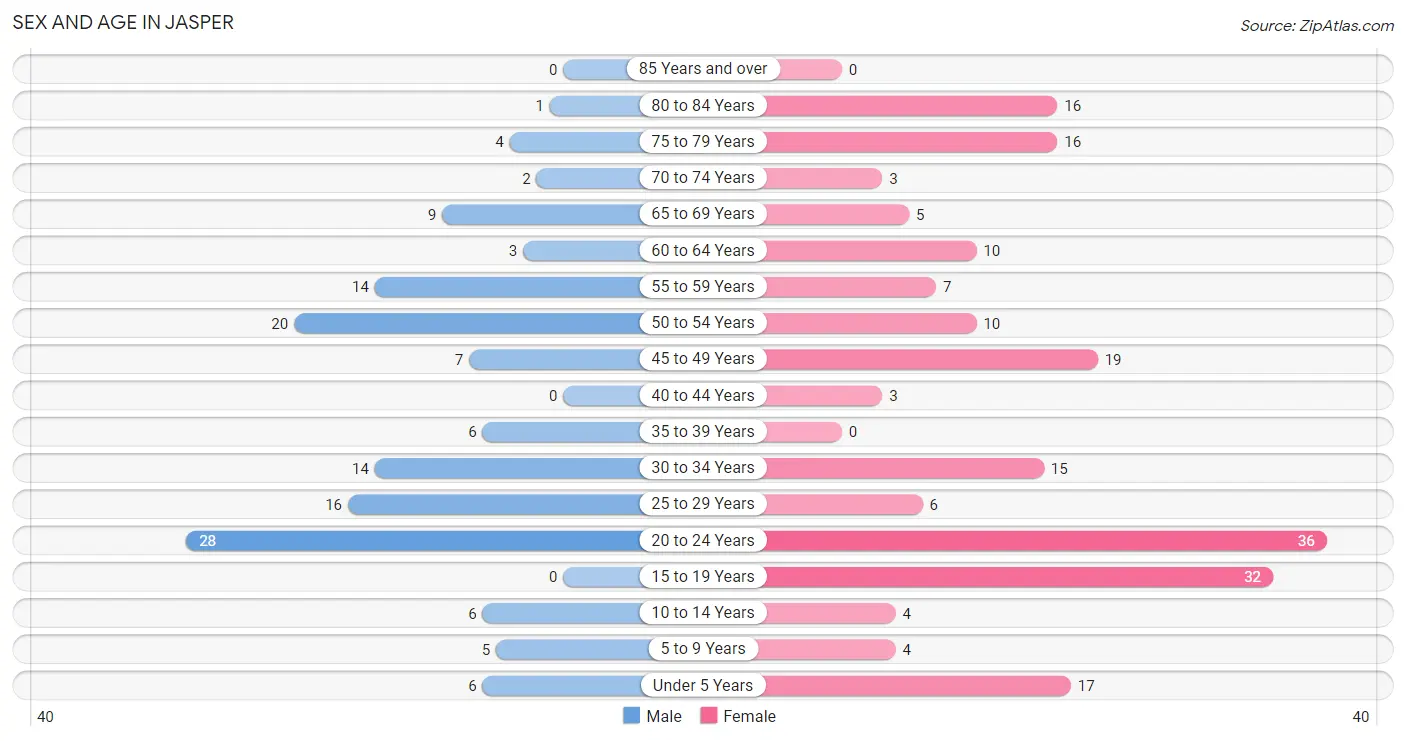
| Age Bracket | Male | Female |
| Under 5 Years | 6 (4.3%) | 17 (8.4%) |
| 5 to 9 Years | 5 (3.5%) | 4 (2.0%) |
| 10 to 14 Years | 6 (4.3%) | 4 (2.0%) |
| 15 to 19 Years | 0 (0.0%) | 32 (15.8%) |
| 20 to 24 Years | 28 (19.9%) | 36 (17.7%) |
| 25 to 29 Years | 16 (11.4%) | 6 (3.0%) |
| 30 to 34 Years | 14 (9.9%) | 15 (7.4%) |
| 35 to 39 Years | 6 (4.3%) | 0 (0.0%) |
| 40 to 44 Years | 0 (0.0%) | 3 (1.5%) |
| 45 to 49 Years | 7 (5.0%) | 19 (9.4%) |
| 50 to 54 Years | 20 (14.2%) | 10 (4.9%) |
| 55 to 59 Years | 14 (9.9%) | 7 (3.5%) |
| 60 to 64 Years | 3 (2.1%) | 10 (4.9%) |
| 65 to 69 Years | 9 (6.4%) | 5 (2.5%) |
| 70 to 74 Years | 2 (1.4%) | 3 (1.5%) |
| 75 to 79 Years | 4 (2.8%) | 16 (7.9%) |
| 80 to 84 Years | 1 (0.7%) | 16 (7.9%) |
| 85 Years and over | 0 (0.0%) | 0 (0.0%) |
| Total | 141 (100.0%) | 203 (100.0%) |
Families and Households in Jasper
Median Family Size in Jasper
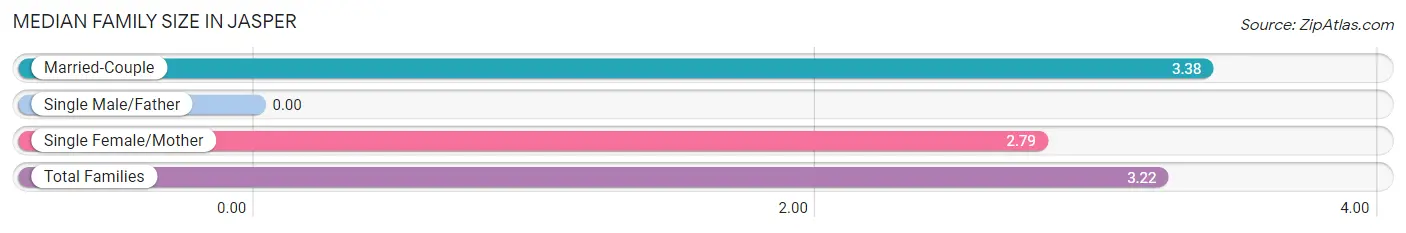
| Family Type | # Families | Family Size |
| Married-Couple | 64 (72.7%) | 3.38 |
| Single Male/Father | 0 (0.0%) | - |
| Single Female/Mother | 24 (27.3%) | 2.79 |
| Total Families | 88 (100.0%) | 3.22 |
Median Household Size in Jasper
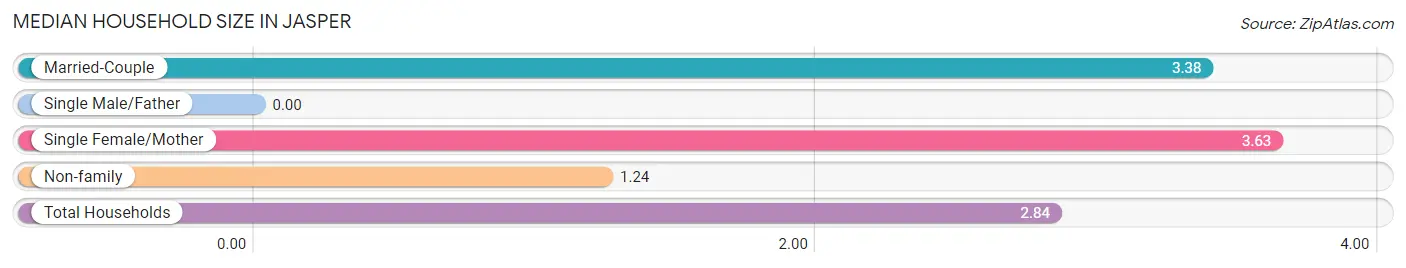
| Household Type | # Households | Household Size |
| Married-Couple | 64 (52.9%) | 3.38 |
| Single Male/Father | 0 (0.0%) | - |
| Single Female/Mother | 24 (19.8%) | 3.63 |
| Non-family | 33 (27.3%) | 1.24 |
| Total Households | 121 (100.0%) | 2.84 |
Household Size by Marriage Status in Jasper
Out of a total of 121 households in Jasper, 88 (72.7%) are family households, while 33 (27.3%) are nonfamily households. The most numerous type of family households are 2-person households, comprising 30, and the most common type of nonfamily households are 1-person households, comprising 27.
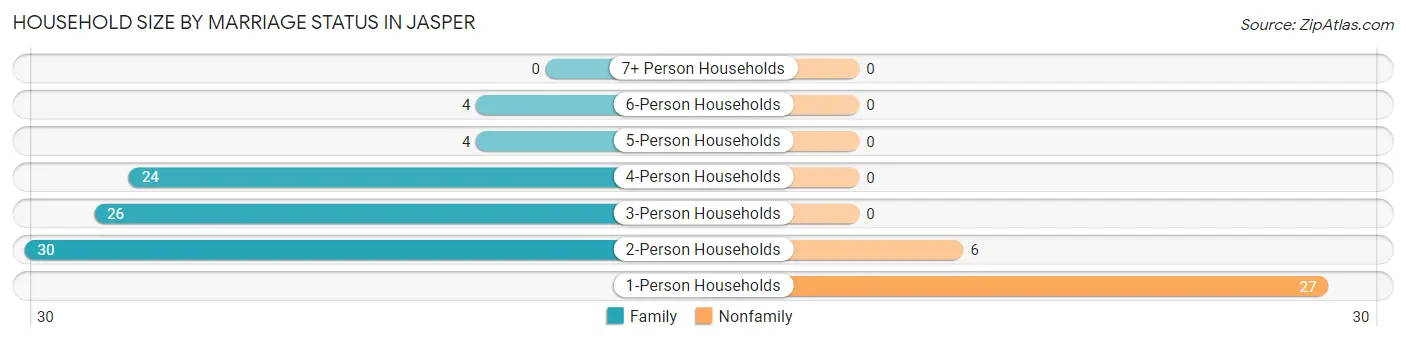
| Household Size | Family Households | Nonfamily Households |
| 1-Person Households | - | 27 (22.3%) |
| 2-Person Households | 30 (24.8%) | 6 (5.0%) |
| 3-Person Households | 26 (21.5%) | 0 (0.0%) |
| 4-Person Households | 24 (19.8%) | 0 (0.0%) |
| 5-Person Households | 4 (3.3%) | 0 (0.0%) |
| 6-Person Households | 4 (3.3%) | 0 (0.0%) |
| 7+ Person Households | 0 (0.0%) | 0 (0.0%) |
| Total | 88 (72.7%) | 33 (27.3%) |
Female Fertility in Jasper
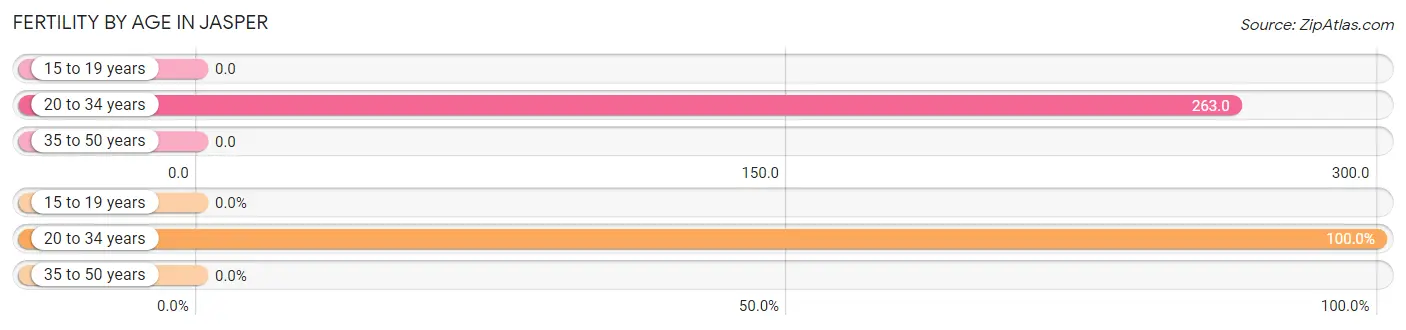
Fertility by Age in Jasper
Average fertility rate in Jasper is 135.0 births per 1,000 women. Women in the age bracket of 20 to 34 years have the highest fertility rate with 263.0 births per 1,000 women. Women in the age bracket of 20 to 34 years acount for 100.0% of all women with births.
| Age Bracket | Women with Births | Births / 1,000 Women |
| 15 to 19 years | 0 (0.0%) | 0.0 |
| 20 to 34 years | 15 (100.0%) | 263.0 |
| 35 to 50 years | 0 (0.0%) | 0.0 |
| Total | 15 (100.0%) | 135.0 |
Fertility by Age by Marriage Status in Jasper
40.0% of women with births (15) in Jasper are married. The highest percentage of unmarried women with births falls into 20 to 34 years age bracket with 60.0% of them unmarried at the time of birth, while the lowest percentage of unmarried women with births belong to 20 to 34 years age bracket with 60.0% of them unmarried.

| Age Bracket | Married | Unmarried |
| 15 to 19 years | 0 (0.0%) | 0 (0.0%) |
| 20 to 34 years | 6 (40.0%) | 9 (60.0%) |
| 35 to 50 years | 0 (0.0%) | 0 (0.0%) |
| Total | 6 (40.0%) | 9 (60.0%) |
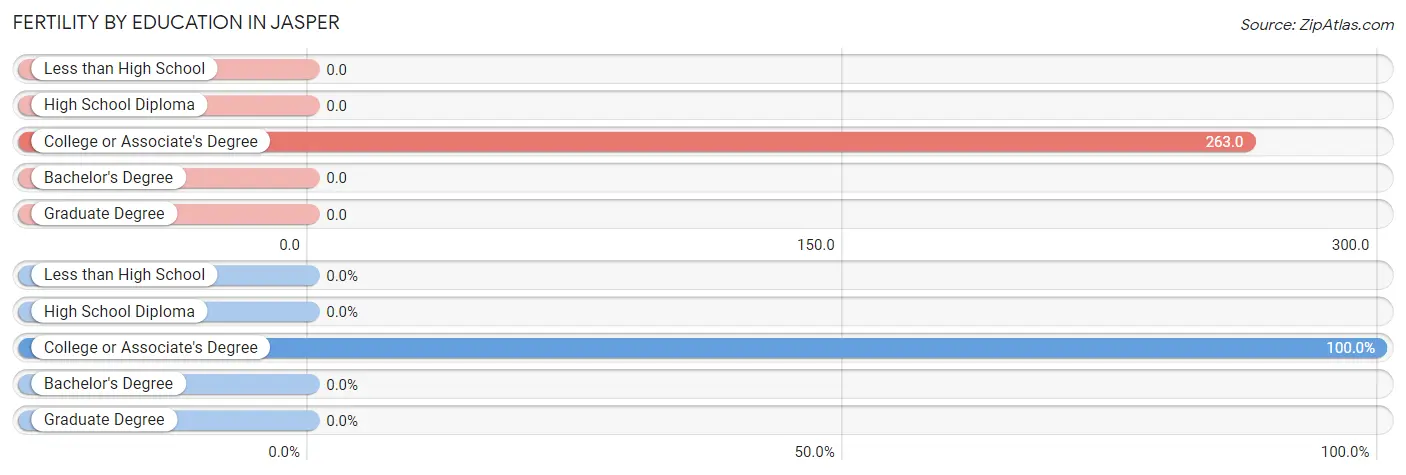
Fertility by Education in Jasper
| Educational Attainment | Women with Births | Births / 1,000 Women |
| Less than High School | 0 (0.0%) | 0.0 |
| High School Diploma | 0 (0.0%) | 0.0 |
| College or Associate's Degree | 15 (100.0%) | 263.0 |
| Bachelor's Degree | 0 (0.0%) | 0.0 |
| Graduate Degree | 0 (0.0%) | 0.0 |
| Total | 15 (100.0%) | 135.0 |
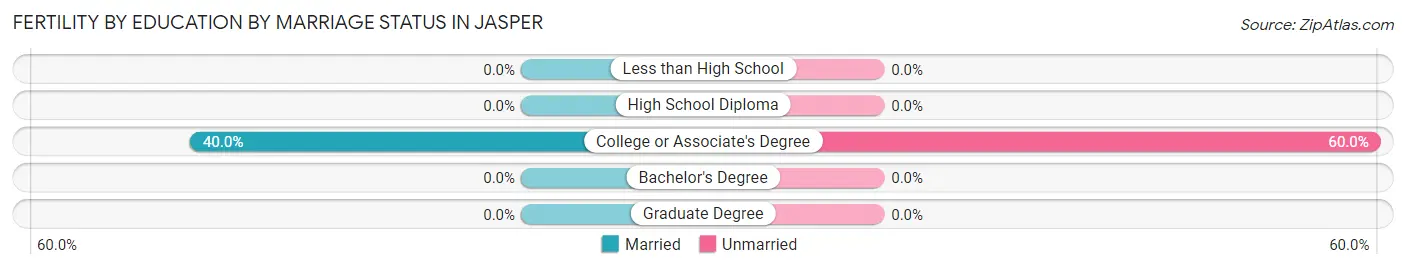
Fertility by Education by Marriage Status in Jasper
60.0% of women with births in Jasper are unmarried. Women with the educational attainment of college or associate's degree are most likely to be married with 40.0% of them married at childbirth, while women with the educational attainment of college or associate's degree are least likely to be married with 60.0% of them unmarried at childbirth.
| Educational Attainment | Married | Unmarried |
| Less than High School | 0 (0.0%) | 0 (0.0%) |
| High School Diploma | 0 (0.0%) | 0 (0.0%) |
| College or Associate's Degree | 6 (40.0%) | 9 (60.0%) |
| Bachelor's Degree | 0 (0.0%) | 0 (0.0%) |
| Graduate Degree | 0 (0.0%) | 0 (0.0%) |
| Total | 6 (40.0%) | 9 (60.0%) |
Employment Characteristics in Jasper
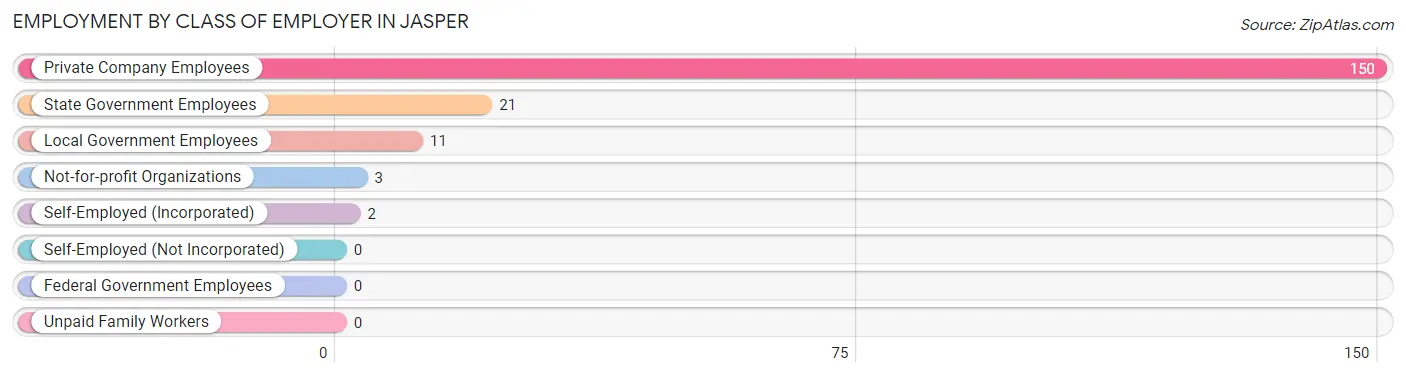
Employment by Class of Employer in Jasper
Among the 187 employed individuals in Jasper, private company employees (150 | 80.2%), state government employees (21 | 11.2%), and local government employees (11 | 5.9%) make up the most common classes of employment.
| Employer Class | # Employees | % Employees |
| Private Company Employees | 150 | 80.2% |
| Self-Employed (Incorporated) | 2 | 1.1% |
| Self-Employed (Not Incorporated) | 0 | 0.0% |
| Not-for-profit Organizations | 3 | 1.6% |
| Local Government Employees | 11 | 5.9% |
| State Government Employees | 21 | 11.2% |
| Federal Government Employees | 0 | 0.0% |
| Unpaid Family Workers | 0 | 0.0% |
| Total | 187 | 100.0% |
Employment Status by Age in Jasper
According to the labor force statistics for Jasper, out of the total population over 16 years of age (302), 68.9% or 208 individuals are in the labor force, with 10.1% or 21 of them unemployed. The age group with the highest labor force participation rate is 30 to 34 years, with 100.0% or 29 individuals in the labor force. Within the labor force, the 16 to 19 years age range has the highest percentage of unemployed individuals, with 54.2% or 13 of them being unemployed.
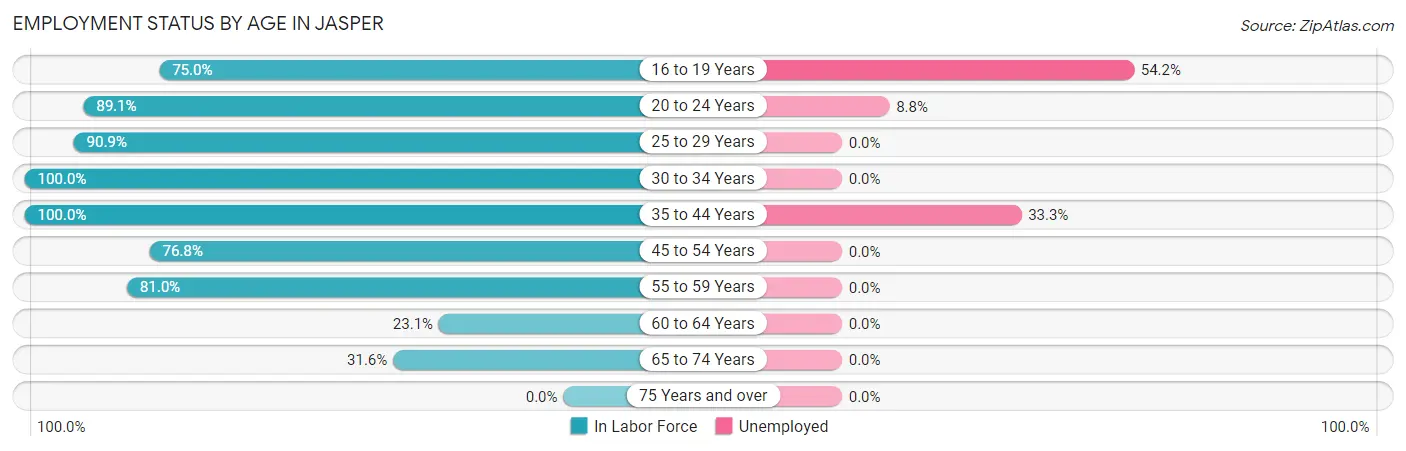
| Age Bracket | In Labor Force | Unemployed |
| 16 to 19 Years | 24 (75.0%) | 13 (54.2%) |
| 20 to 24 Years | 57 (89.1%) | 5 (8.8%) |
| 25 to 29 Years | 20 (90.9%) | 0 (0.0%) |
| 30 to 34 Years | 29 (100.0%) | 0 (0.0%) |
| 35 to 44 Years | 9 (100.0%) | 3 (33.3%) |
| 45 to 54 Years | 43 (76.8%) | 0 (0.0%) |
| 55 to 59 Years | 17 (81.0%) | 0 (0.0%) |
| 60 to 64 Years | 3 (23.1%) | 0 (0.0%) |
| 65 to 74 Years | 6 (31.6%) | 0 (0.0%) |
| 75 Years and over | 0 (0.0%) | 0 (0.0%) |
| Total | 208 (68.9%) | 21 (10.1%) |
Employment Status by Educational Attainment in Jasper
According to labor force statistics for Jasper, 80.7% of individuals (121) out of the total population between 25 and 64 years of age (150) are in the labor force, with 2.5% or 3 of them being unemployed. The group with the highest labor force participation rate are those with the educational attainment of bachelor's degree or higher, with 100.0% or 16 individuals in the labor force. Within the labor force, individuals with college / associate degree education have the highest percentage of unemployment, with 4.2% or 3 of them being unemployed.
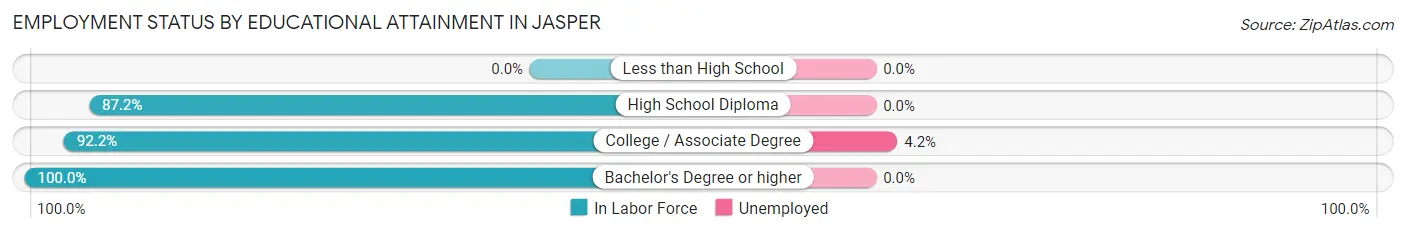
| Educational Attainment | In Labor Force | Unemployed |
| Less than High School | 0 (0.0%) | 0 (0.0%) |
| High School Diploma | 34 (87.2%) | 0 (0.0%) |
| College / Associate Degree | 71 (92.2%) | 3 (4.2%) |
| Bachelor's Degree or higher | 16 (100.0%) | 0 (0.0%) |
| Total | 121 (80.7%) | 4 (2.5%) |
Employment Occupations by Sex in Jasper
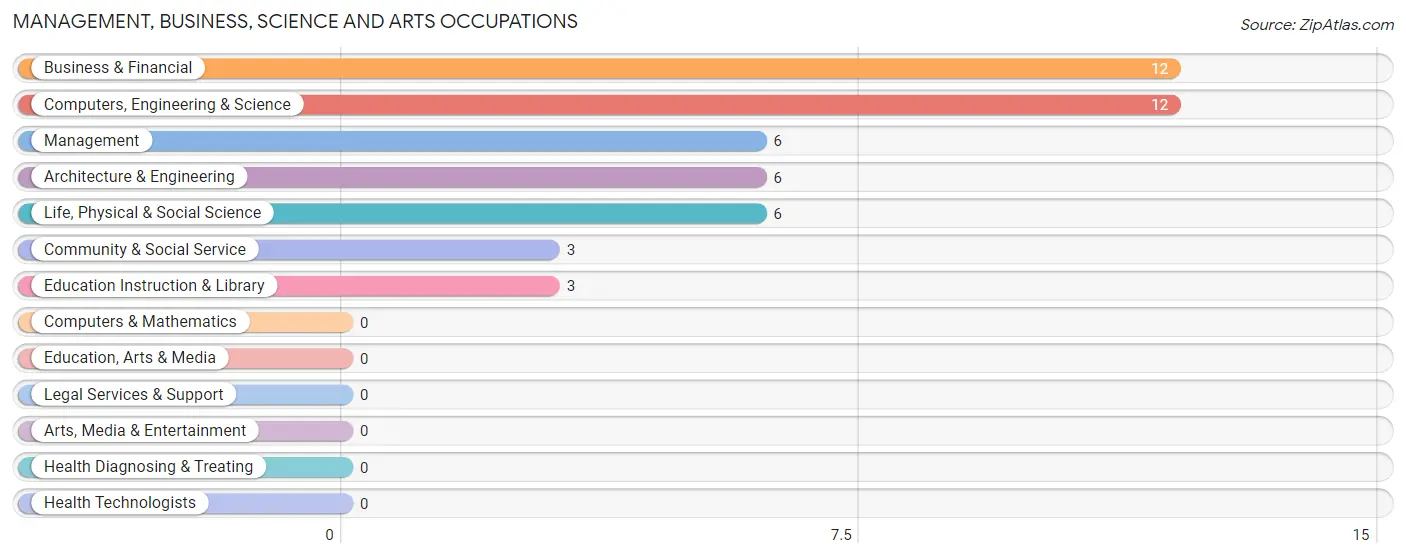
Management, Business, Science and Arts Occupations
The most common Management, Business, Science and Arts occupations in Jasper are Business & Financial (12 | 6.4%), Computers, Engineering & Science (12 | 6.4%), Management (6 | 3.2%), Architecture & Engineering (6 | 3.2%), and Life, Physical & Social Science (6 | 3.2%).
Management, Business, Science and Arts Occupations by Sex
Within the Management, Business, Science and Arts occupations in Jasper, the most male-oriented occupations are Architecture & Engineering (100.0%), and Computers, Engineering & Science (50.0%), while the most female-oriented occupations are Management (100.0%), Business & Financial (100.0%), and Life, Physical & Social Science (100.0%).
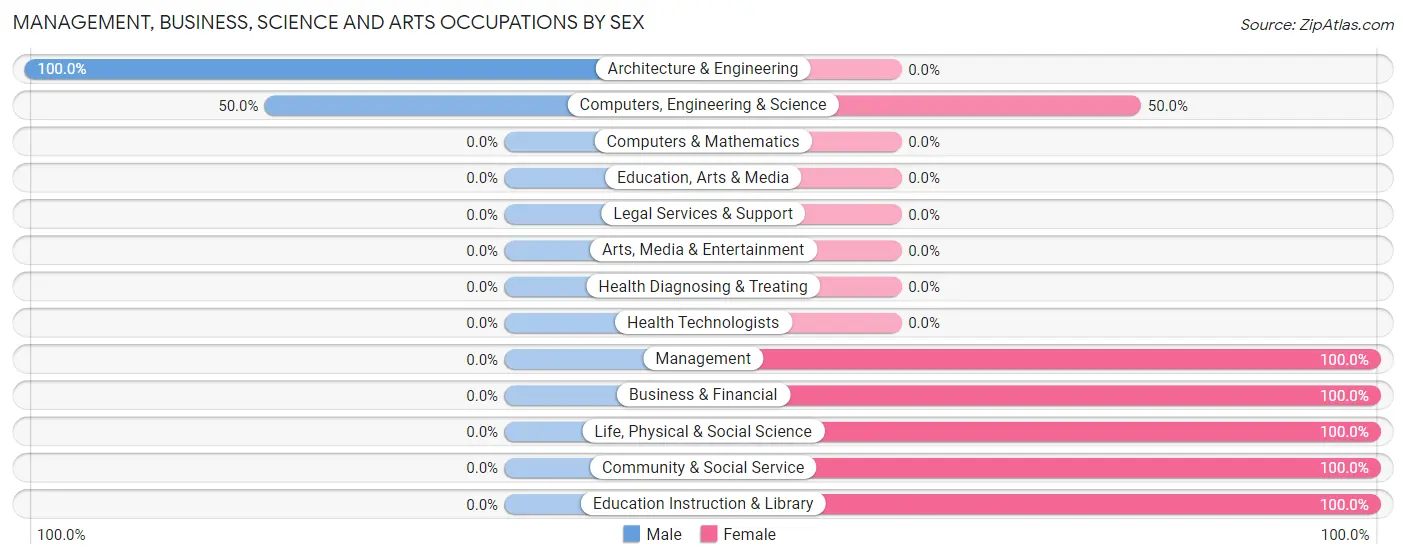
| Occupation | Male | Female |
| Management | 0 (0.0%) | 6 (100.0%) |
| Business & Financial | 0 (0.0%) | 12 (100.0%) |
| Computers, Engineering & Science | 6 (50.0%) | 6 (50.0%) |
| Computers & Mathematics | 0 (0.0%) | 0 (0.0%) |
| Architecture & Engineering | 6 (100.0%) | 0 (0.0%) |
| Life, Physical & Social Science | 0 (0.0%) | 6 (100.0%) |
| Community & Social Service | 0 (0.0%) | 3 (100.0%) |
| Education, Arts & Media | 0 (0.0%) | 0 (0.0%) |
| Legal Services & Support | 0 (0.0%) | 0 (0.0%) |
| Education Instruction & Library | 0 (0.0%) | 3 (100.0%) |
| Arts, Media & Entertainment | 0 (0.0%) | 0 (0.0%) |
| Health Diagnosing & Treating | 0 (0.0%) | 0 (0.0%) |
| Health Technologists | 0 (0.0%) | 0 (0.0%) |
| Total (Category) | 6 (18.2%) | 27 (81.8%) |
| Total (Overall) | 94 (50.3%) | 93 (49.7%) |
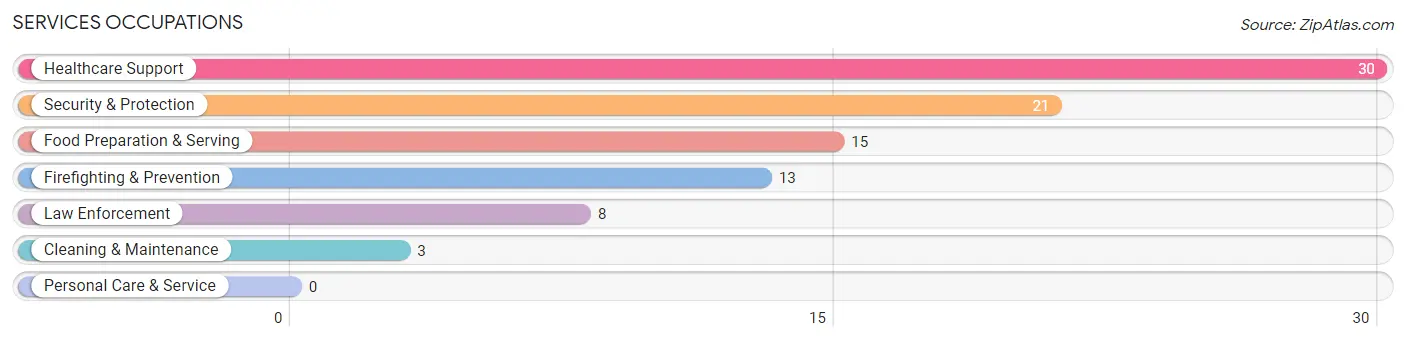
Services Occupations
The most common Services occupations in Jasper are Healthcare Support (30 | 16.0%), Security & Protection (21 | 11.2%), Food Preparation & Serving (15 | 8.0%), Firefighting & Prevention (13 | 7.0%), and Law Enforcement (8 | 4.3%).
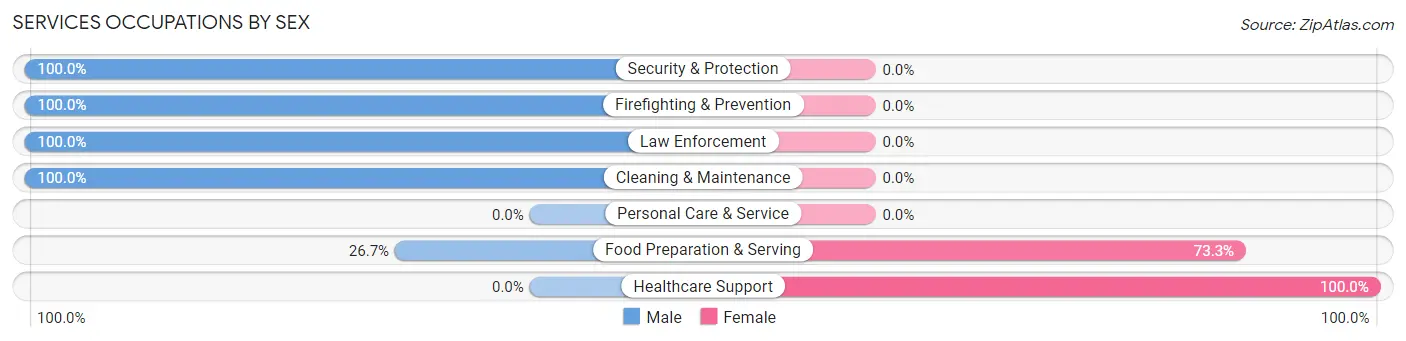
Services Occupations by Sex
Within the Services occupations in Jasper, the most male-oriented occupations are Security & Protection (100.0%), Firefighting & Prevention (100.0%), and Law Enforcement (100.0%), while the most female-oriented occupations are Healthcare Support (100.0%), and Food Preparation & Serving (73.3%).
| Occupation | Male | Female |
| Healthcare Support | 0 (0.0%) | 30 (100.0%) |
| Security & Protection | 21 (100.0%) | 0 (0.0%) |
| Firefighting & Prevention | 13 (100.0%) | 0 (0.0%) |
| Law Enforcement | 8 (100.0%) | 0 (0.0%) |
| Food Preparation & Serving | 4 (26.7%) | 11 (73.3%) |
| Cleaning & Maintenance | 3 (100.0%) | 0 (0.0%) |
| Personal Care & Service | 0 (0.0%) | 0 (0.0%) |
| Total (Category) | 28 (40.6%) | 41 (59.4%) |
| Total (Overall) | 94 (50.3%) | 93 (49.7%) |
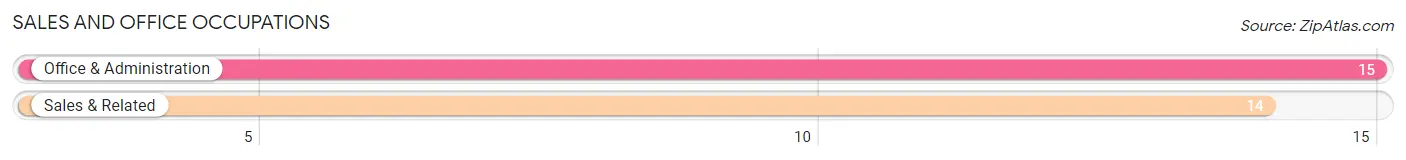
Sales and Office Occupations
The most common Sales and Office occupations in Jasper are Office & Administration (15 | 8.0%), and Sales & Related (14 | 7.5%).
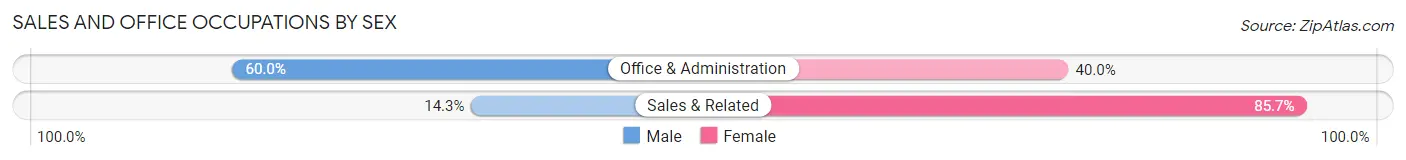
Sales and Office Occupations by Sex
| Occupation | Male | Female |
| Sales & Related | 2 (14.3%) | 12 (85.7%) |
| Office & Administration | 9 (60.0%) | 6 (40.0%) |
| Total (Category) | 11 (37.9%) | 18 (62.1%) |
| Total (Overall) | 94 (50.3%) | 93 (49.7%) |
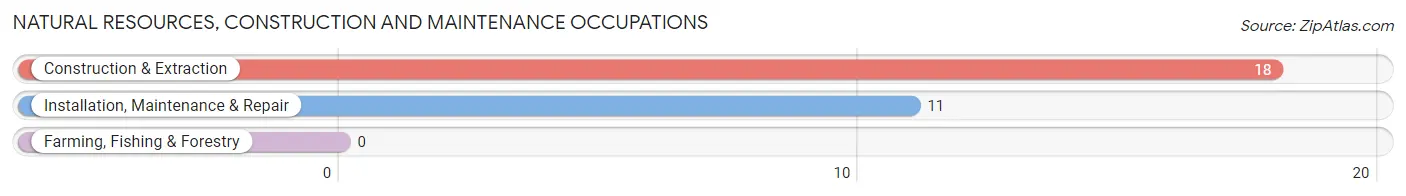
Natural Resources, Construction and Maintenance Occupations
The most common Natural Resources, Construction and Maintenance occupations in Jasper are Construction & Extraction (18 | 9.6%), and Installation, Maintenance & Repair (11 | 5.9%).
Natural Resources, Construction and Maintenance Occupations by Sex
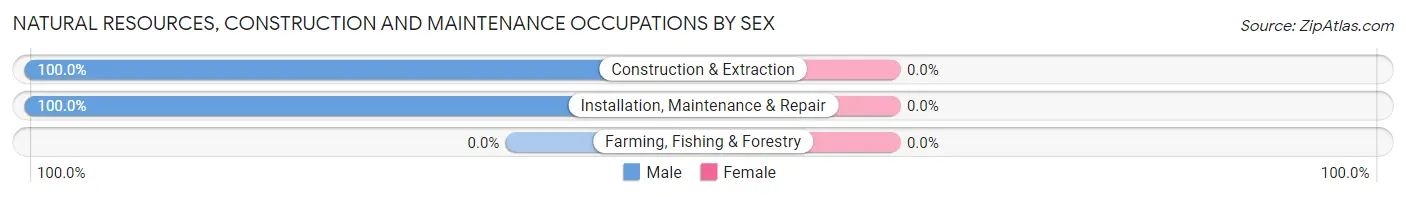
| Occupation | Male | Female |
| Farming, Fishing & Forestry | 0 (0.0%) | 0 (0.0%) |
| Construction & Extraction | 18 (100.0%) | 0 (0.0%) |
| Installation, Maintenance & Repair | 11 (100.0%) | 0 (0.0%) |
| Total (Category) | 29 (100.0%) | 0 (0.0%) |
| Total (Overall) | 94 (50.3%) | 93 (49.7%) |
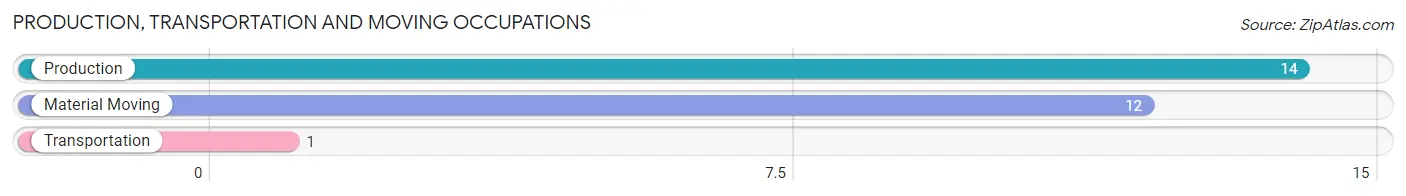
Production, Transportation and Moving Occupations
The most common Production, Transportation and Moving occupations in Jasper are Production (14 | 7.5%), Material Moving (12 | 6.4%), and Transportation (1 | 0.5%).
Production, Transportation and Moving Occupations by Sex
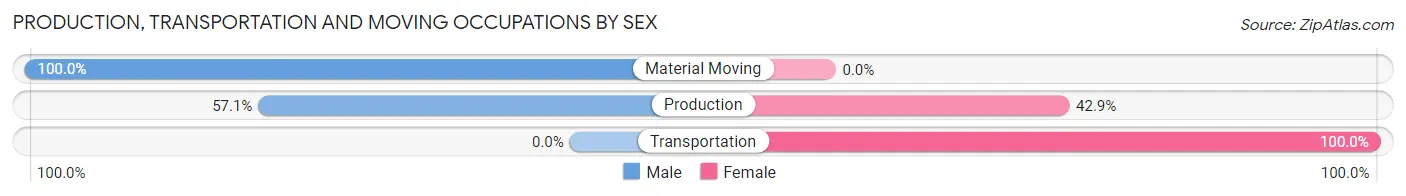
| Occupation | Male | Female |
| Production | 8 (57.1%) | 6 (42.9%) |
| Transportation | 0 (0.0%) | 1 (100.0%) |
| Material Moving | 12 (100.0%) | 0 (0.0%) |
| Total (Category) | 20 (74.1%) | 7 (25.9%) |
| Total (Overall) | 94 (50.3%) | 93 (49.7%) |
Employment Industries by Sex in Jasper
Employment Industries in Jasper
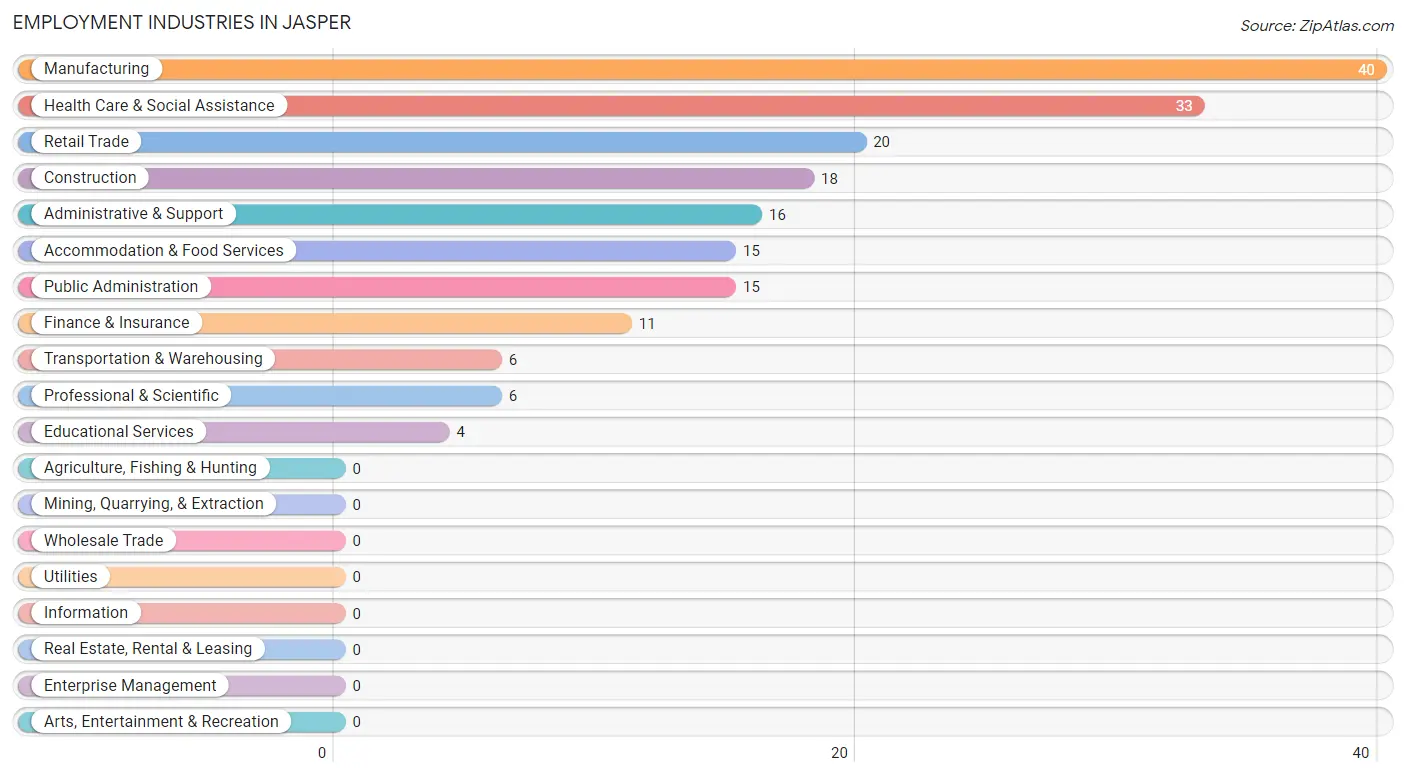
The major employment industries in Jasper include Manufacturing (40 | 21.4%), Health Care & Social Assistance (33 | 17.6%), Retail Trade (20 | 10.7%), Construction (18 | 9.6%), and Administrative & Support (16 | 8.6%).
Employment Industries by Sex in Jasper
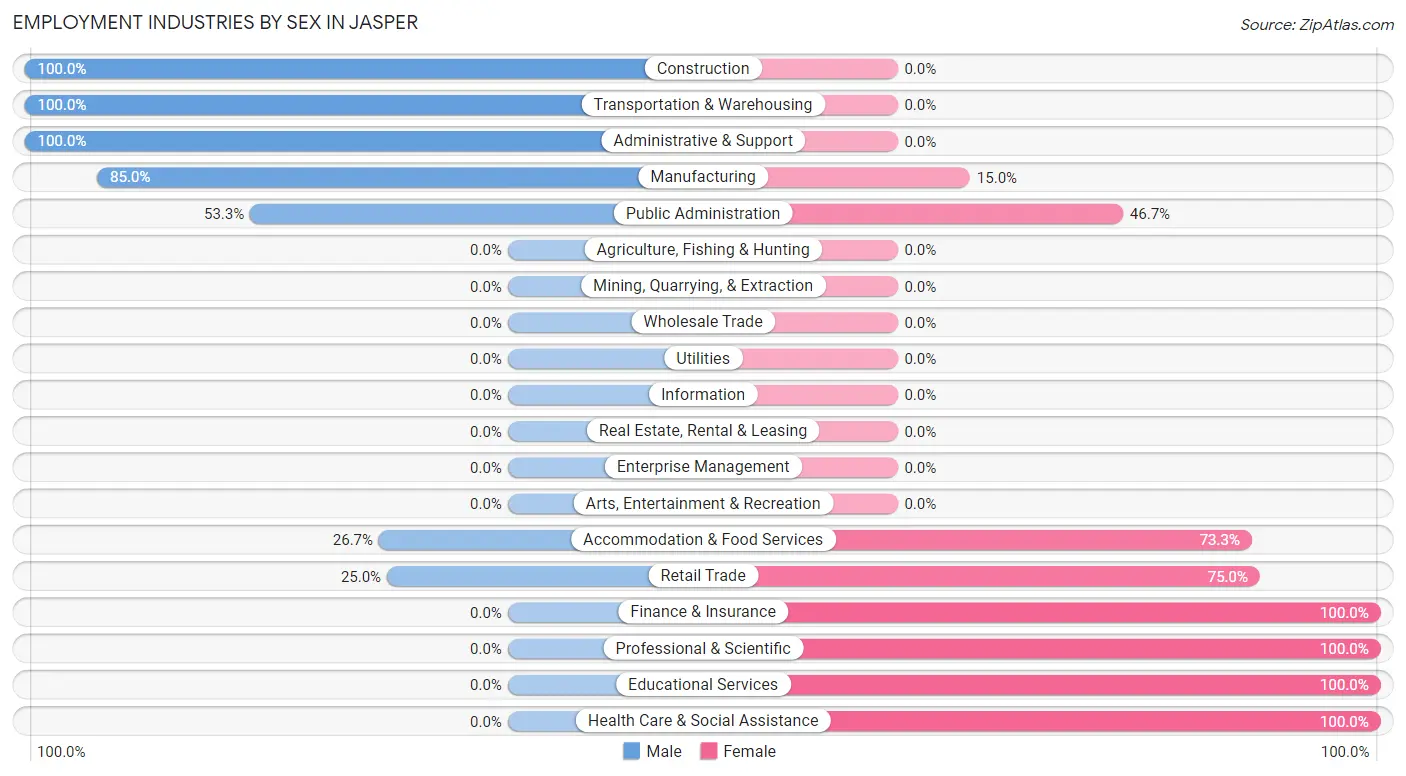
The Jasper industries that see more men than women are Construction (100.0%), Transportation & Warehousing (100.0%), and Administrative & Support (100.0%), whereas the industries that tend to have a higher number of women are Finance & Insurance (100.0%), Professional & Scientific (100.0%), and Educational Services (100.0%).
| Industry | Male | Female |
| Agriculture, Fishing & Hunting | 0 (0.0%) | 0 (0.0%) |
| Mining, Quarrying, & Extraction | 0 (0.0%) | 0 (0.0%) |
| Construction | 18 (100.0%) | 0 (0.0%) |
| Manufacturing | 34 (85.0%) | 6 (15.0%) |
| Wholesale Trade | 0 (0.0%) | 0 (0.0%) |
| Retail Trade | 5 (25.0%) | 15 (75.0%) |
| Transportation & Warehousing | 6 (100.0%) | 0 (0.0%) |
| Utilities | 0 (0.0%) | 0 (0.0%) |
| Information | 0 (0.0%) | 0 (0.0%) |
| Finance & Insurance | 0 (0.0%) | 11 (100.0%) |
| Real Estate, Rental & Leasing | 0 (0.0%) | 0 (0.0%) |
| Professional & Scientific | 0 (0.0%) | 6 (100.0%) |
| Enterprise Management | 0 (0.0%) | 0 (0.0%) |
| Administrative & Support | 16 (100.0%) | 0 (0.0%) |
| Educational Services | 0 (0.0%) | 4 (100.0%) |
| Health Care & Social Assistance | 0 (0.0%) | 33 (100.0%) |
| Arts, Entertainment & Recreation | 0 (0.0%) | 0 (0.0%) |
| Accommodation & Food Services | 4 (26.7%) | 11 (73.3%) |
| Public Administration | 8 (53.3%) | 7 (46.7%) |
| Total | 94 (50.3%) | 93 (49.7%) |
Education in Jasper
School Enrollment in Jasper
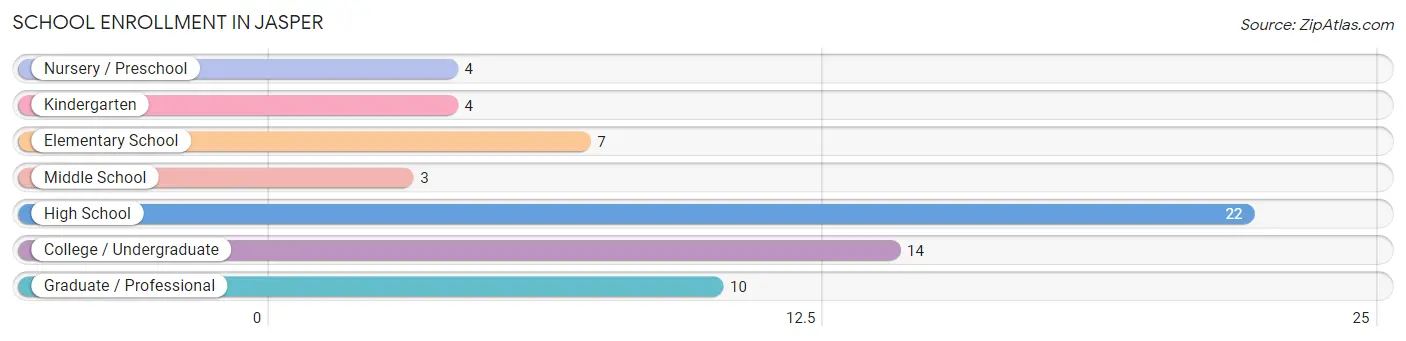
The most common levels of schooling among the 64 students in Jasper are high school (22 | 34.4%), college / undergraduate (14 | 21.9%), and graduate / professional (10 | 15.6%).
| School Level | # Students | % Students |
| Nursery / Preschool | 4 | 6.2% |
| Kindergarten | 4 | 6.2% |
| Elementary School | 7 | 10.9% |
| Middle School | 3 | 4.7% |
| High School | 22 | 34.4% |
| College / Undergraduate | 14 | 21.9% |
| Graduate / Professional | 10 | 15.6% |
| Total | 64 | 100.0% |
School Enrollment by Age by Funding Source in Jasper
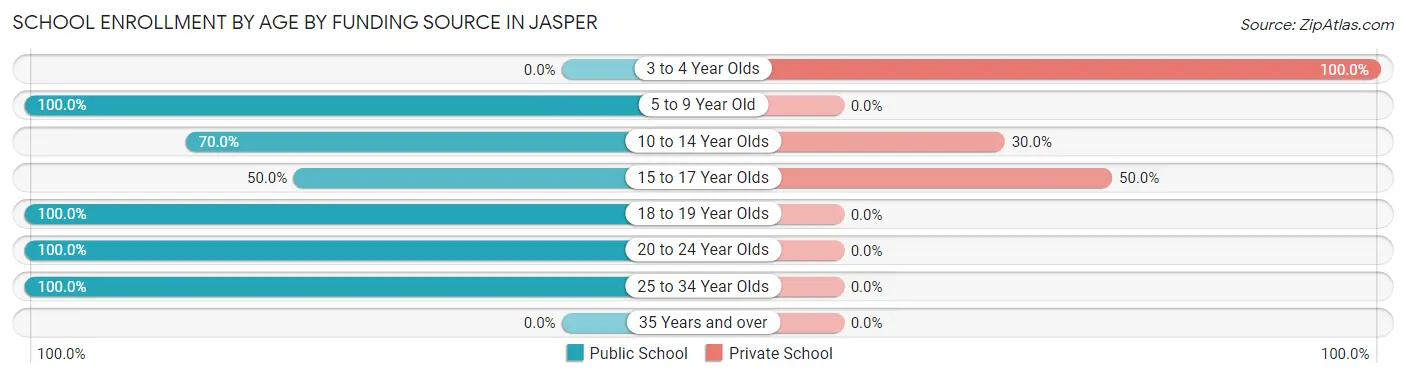
Out of a total of 64 students who are enrolled in schools in Jasper, 9 (14.1%) attend a private institution, while the remaining 55 (85.9%) are enrolled in public schools. The age group of 3 to 4 year olds has the highest likelihood of being enrolled in private schools, with 2 (100.0% in the age bracket) enrolled. Conversely, the age group of 5 to 9 year old has the lowest likelihood of being enrolled in a private school, with 9 (100.0% in the age bracket) attending a public institution.
| Age Bracket | Public School | Private School |
| 3 to 4 Year Olds | 0 (0.0%) | 2 (100.0%) |
| 5 to 9 Year Old | 9 (100.0%) | 0 (0.0%) |
| 10 to 14 Year Olds | 7 (70.0%) | 3 (30.0%) |
| 15 to 17 Year Olds | 4 (50.0%) | 4 (50.0%) |
| 18 to 19 Year Olds | 11 (100.0%) | 0 (0.0%) |
| 20 to 24 Year Olds | 14 (100.0%) | 0 (0.0%) |
| 25 to 34 Year Olds | 10 (100.0%) | 0 (0.0%) |
| 35 Years and over | 0 (0.0%) | 0 (0.0%) |
| Total | 55 (85.9%) | 9 (14.1%) |
Educational Attainment by Field of Study in Jasper
Social sciences (8 | 38.1%), science & technology (5 | 23.8%), arts & humanities (5 | 23.8%), and education (3 | 14.3%) are the most common fields of study among 21 individuals in Jasper who have obtained a bachelor's degree or higher.
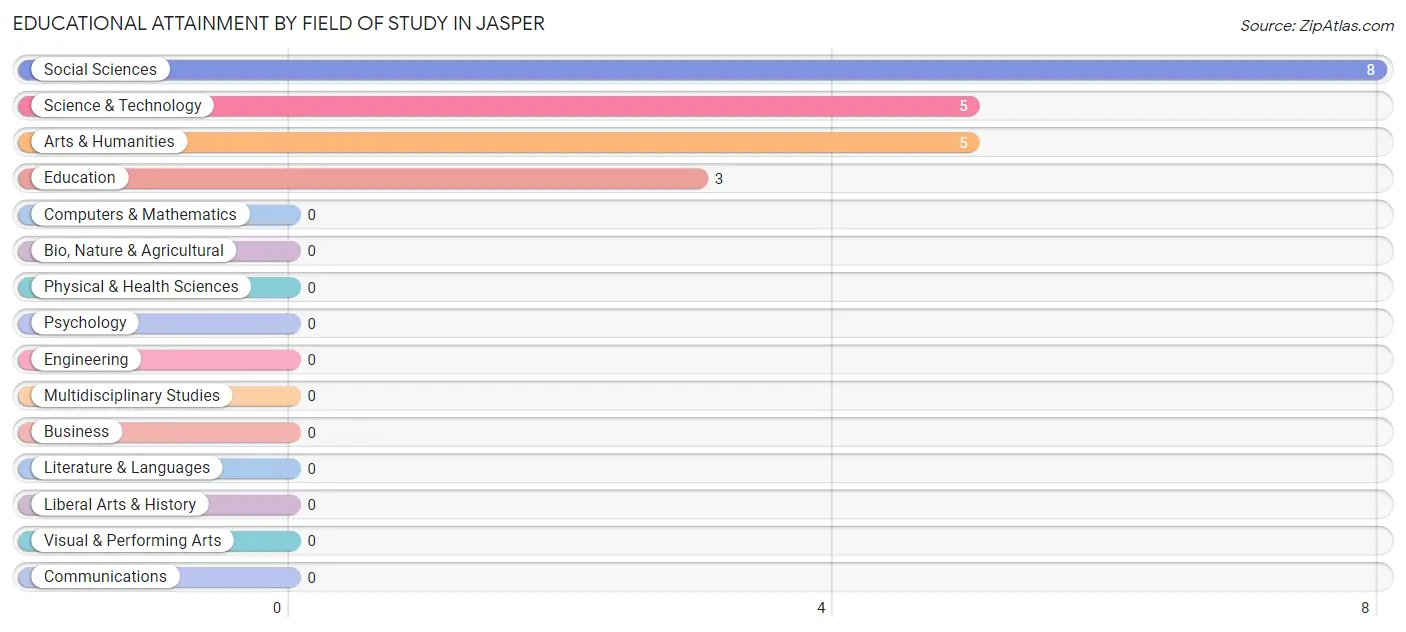
| Field of Study | # Graduates | % Graduates |
| Computers & Mathematics | 0 | 0.0% |
| Bio, Nature & Agricultural | 0 | 0.0% |
| Physical & Health Sciences | 0 | 0.0% |
| Psychology | 0 | 0.0% |
| Social Sciences | 8 | 38.1% |
| Engineering | 0 | 0.0% |
| Multidisciplinary Studies | 0 | 0.0% |
| Science & Technology | 5 | 23.8% |
| Business | 0 | 0.0% |
| Education | 3 | 14.3% |
| Literature & Languages | 0 | 0.0% |
| Liberal Arts & History | 0 | 0.0% |
| Visual & Performing Arts | 0 | 0.0% |
| Communications | 0 | 0.0% |
| Arts & Humanities | 5 | 23.8% |
| Total | 21 | 100.0% |
Transportation & Commute in Jasper
Vehicle Availability by Sex in Jasper
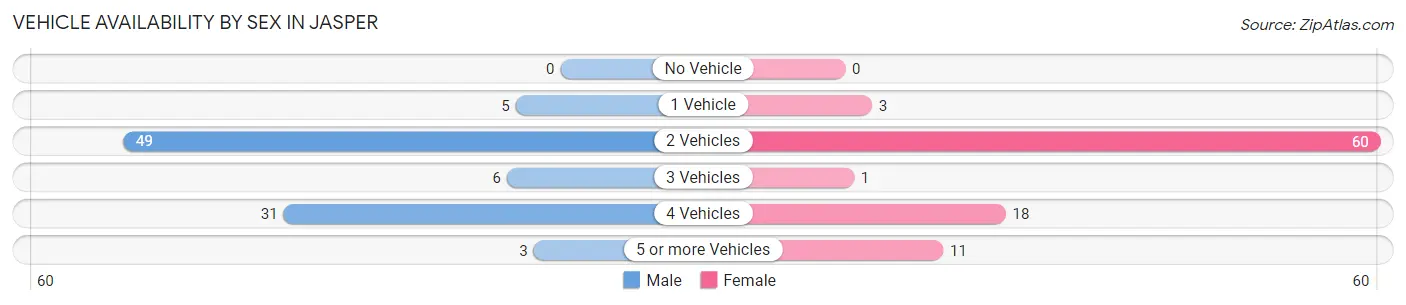
The most prevalent vehicle ownership categories in Jasper are males with 2 vehicles (49, accounting for 52.1%) and females with 2 vehicles (60, making up 52.7%).
| Vehicles Available | Male | Female |
| No Vehicle | 0 (0.0%) | 0 (0.0%) |
| 1 Vehicle | 5 (5.3%) | 3 (3.2%) |
| 2 Vehicles | 49 (52.1%) | 60 (64.5%) |
| 3 Vehicles | 6 (6.4%) | 1 (1.1%) |
| 4 Vehicles | 31 (33.0%) | 18 (19.4%) |
| 5 or more Vehicles | 3 (3.2%) | 11 (11.8%) |
| Total | 94 (100.0%) | 93 (100.0%) |
Commute Time in Jasper
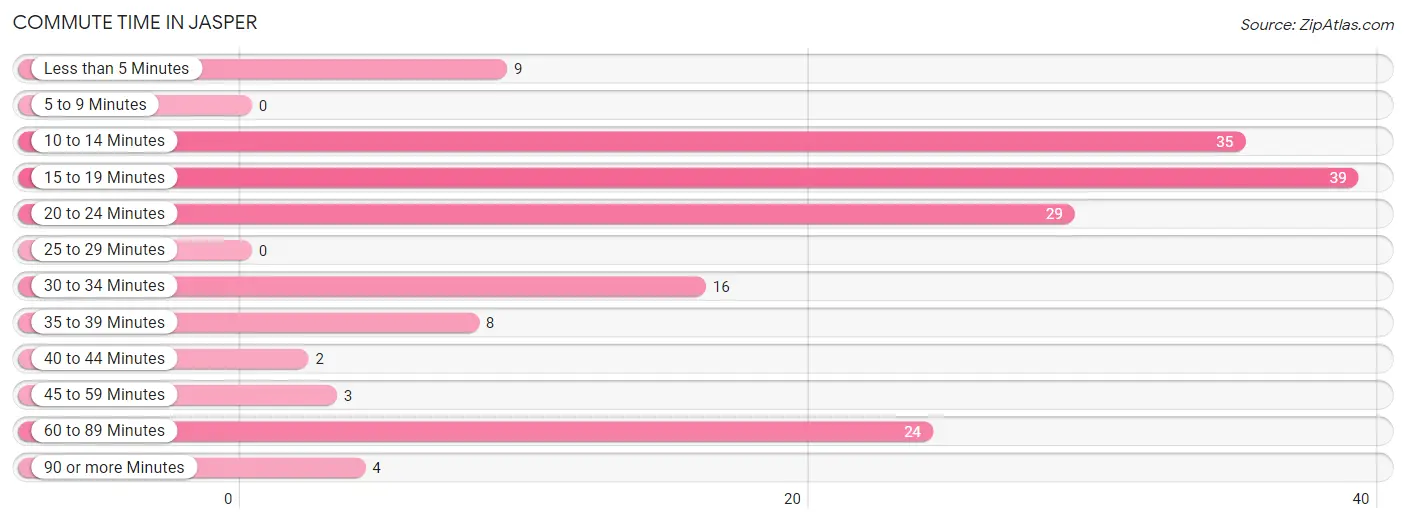
The most frequently occuring commute durations in Jasper are 15 to 19 minutes (39 commuters, 23.1%), 10 to 14 minutes (35 commuters, 20.7%), and 20 to 24 minutes (29 commuters, 17.2%).
| Commute Time | # Commuters | % Commuters |
| Less than 5 Minutes | 9 | 5.3% |
| 5 to 9 Minutes | 0 | 0.0% |
| 10 to 14 Minutes | 35 | 20.7% |
| 15 to 19 Minutes | 39 | 23.1% |
| 20 to 24 Minutes | 29 | 17.2% |
| 25 to 29 Minutes | 0 | 0.0% |
| 30 to 34 Minutes | 16 | 9.5% |
| 35 to 39 Minutes | 8 | 4.7% |
| 40 to 44 Minutes | 2 | 1.2% |
| 45 to 59 Minutes | 3 | 1.8% |
| 60 to 89 Minutes | 24 | 14.2% |
| 90 or more Minutes | 4 | 2.4% |
Commute Time by Sex in Jasper
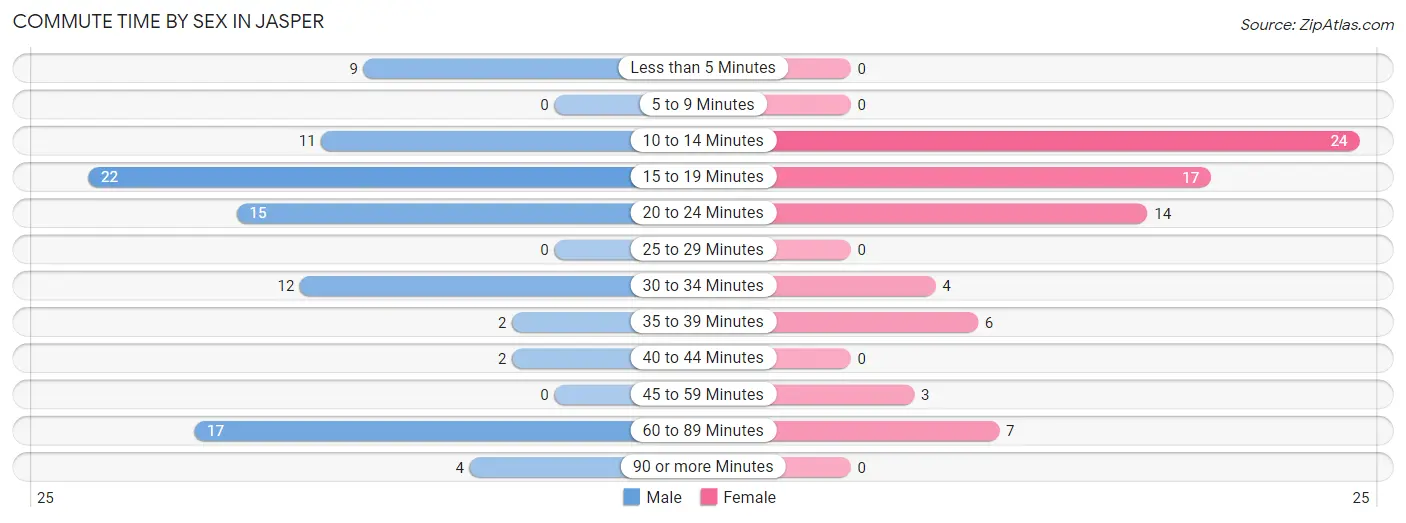
The most common commute times in Jasper are 15 to 19 minutes (22 commuters, 23.4%) for males and 10 to 14 minutes (24 commuters, 32.0%) for females.
| Commute Time | Male | Female |
| Less than 5 Minutes | 9 (9.6%) | 0 (0.0%) |
| 5 to 9 Minutes | 0 (0.0%) | 0 (0.0%) |
| 10 to 14 Minutes | 11 (11.7%) | 24 (32.0%) |
| 15 to 19 Minutes | 22 (23.4%) | 17 (22.7%) |
| 20 to 24 Minutes | 15 (16.0%) | 14 (18.7%) |
| 25 to 29 Minutes | 0 (0.0%) | 0 (0.0%) |
| 30 to 34 Minutes | 12 (12.8%) | 4 (5.3%) |
| 35 to 39 Minutes | 2 (2.1%) | 6 (8.0%) |
| 40 to 44 Minutes | 2 (2.1%) | 0 (0.0%) |
| 45 to 59 Minutes | 0 (0.0%) | 3 (4.0%) |
| 60 to 89 Minutes | 17 (18.1%) | 7 (9.3%) |
| 90 or more Minutes | 4 (4.3%) | 0 (0.0%) |
Time of Departure to Work by Sex in Jasper
The most frequent times of departure to work in Jasper are 5:00 AM to 5:29 AM (26, 27.7%) for males and 7:00 AM to 7:29 AM (19, 25.3%) for females.
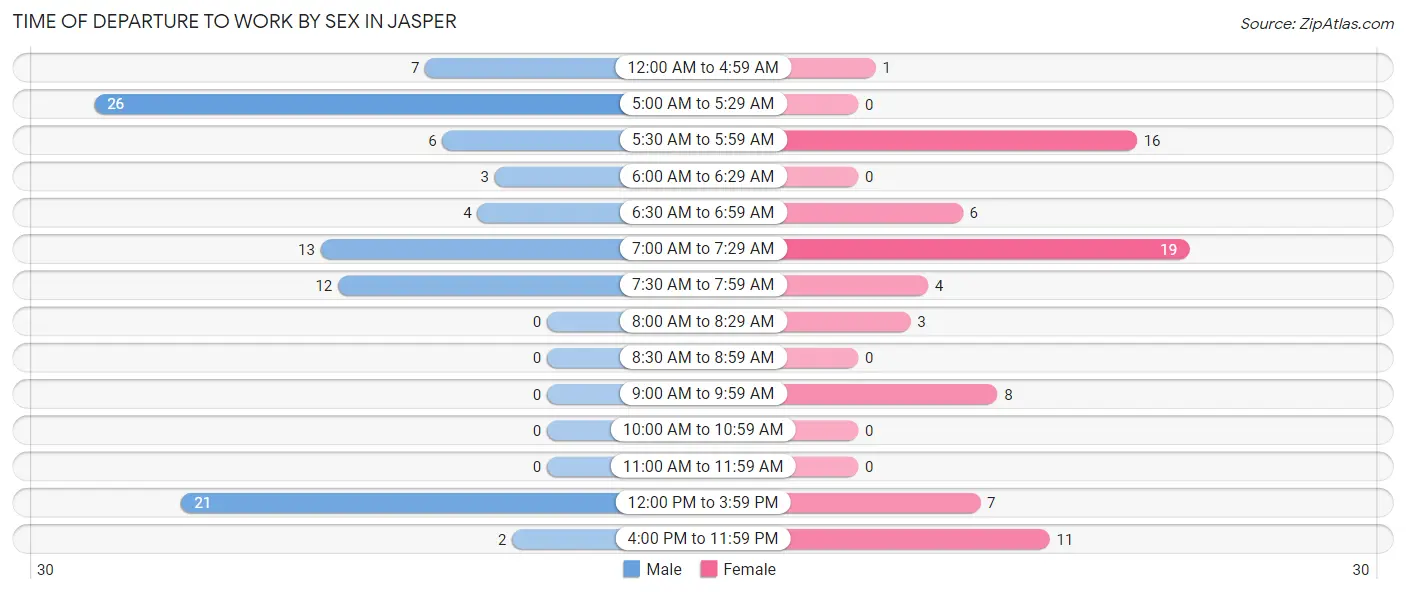
| Time of Departure | Male | Female |
| 12:00 AM to 4:59 AM | 7 (7.4%) | 1 (1.3%) |
| 5:00 AM to 5:29 AM | 26 (27.7%) | 0 (0.0%) |
| 5:30 AM to 5:59 AM | 6 (6.4%) | 16 (21.3%) |
| 6:00 AM to 6:29 AM | 3 (3.2%) | 0 (0.0%) |
| 6:30 AM to 6:59 AM | 4 (4.3%) | 6 (8.0%) |
| 7:00 AM to 7:29 AM | 13 (13.8%) | 19 (25.3%) |
| 7:30 AM to 7:59 AM | 12 (12.8%) | 4 (5.3%) |
| 8:00 AM to 8:29 AM | 0 (0.0%) | 3 (4.0%) |
| 8:30 AM to 8:59 AM | 0 (0.0%) | 0 (0.0%) |
| 9:00 AM to 9:59 AM | 0 (0.0%) | 8 (10.7%) |
| 10:00 AM to 10:59 AM | 0 (0.0%) | 0 (0.0%) |
| 11:00 AM to 11:59 AM | 0 (0.0%) | 0 (0.0%) |
| 12:00 PM to 3:59 PM | 21 (22.3%) | 7 (9.3%) |
| 4:00 PM to 11:59 PM | 2 (2.1%) | 11 (14.7%) |
| Total | 94 (100.0%) | 75 (100.0%) |
Housing Occupancy in Jasper
Occupancy by Ownership in Jasper
Of the total 121 dwellings in Jasper, owner-occupied units account for 93 (76.9%), while renter-occupied units make up 28 (23.1%).
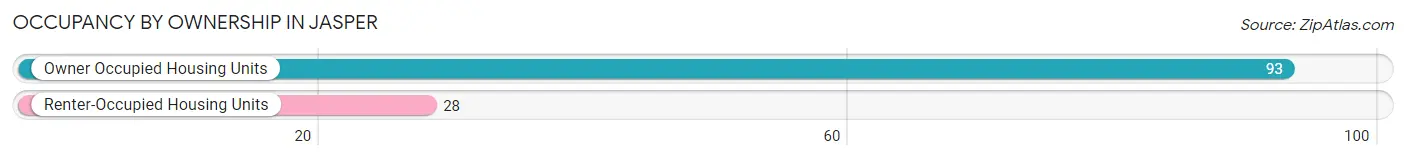
| Occupancy | # Housing Units | % Housing Units |
| Owner Occupied Housing Units | 93 | 76.9% |
| Renter-Occupied Housing Units | 28 | 23.1% |
| Total Occupied Housing Units | 121 | 100.0% |
Occupancy by Household Size in Jasper
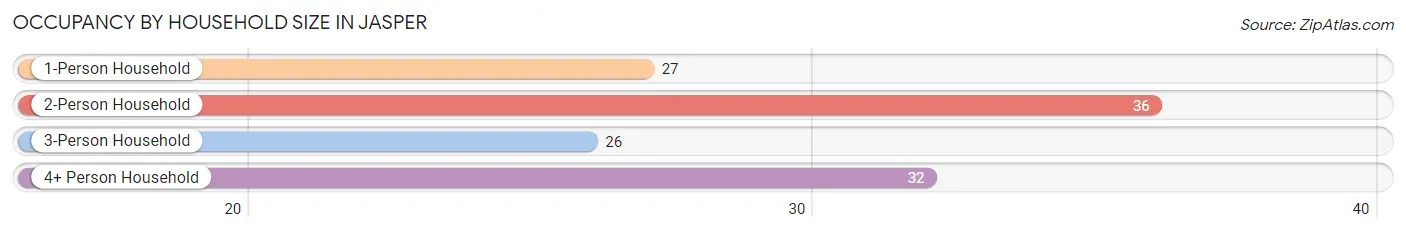
| Household Size | # Housing Units | % Housing Units |
| 1-Person Household | 27 | 22.3% |
| 2-Person Household | 36 | 29.7% |
| 3-Person Household | 26 | 21.5% |
| 4+ Person Household | 32 | 26.5% |
| Total Housing Units | 121 | 100.0% |
Occupancy by Ownership by Household Size in Jasper
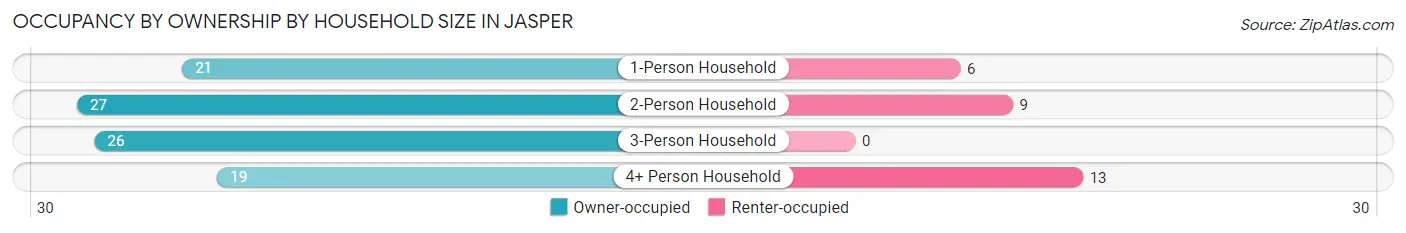
| Household Size | Owner-occupied | Renter-occupied |
| 1-Person Household | 21 (77.8%) | 6 (22.2%) |
| 2-Person Household | 27 (75.0%) | 9 (25.0%) |
| 3-Person Household | 26 (100.0%) | 0 (0.0%) |
| 4+ Person Household | 19 (59.4%) | 13 (40.6%) |
| Total Housing Units | 93 (76.9%) | 28 (23.1%) |
Occupancy by Educational Attainment in Jasper
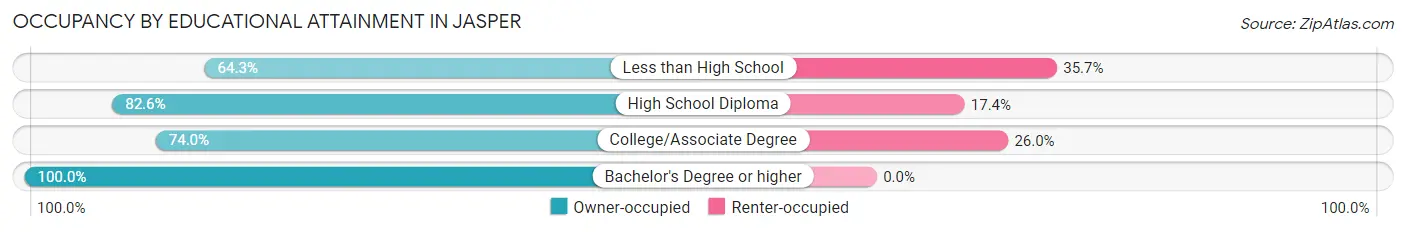
| Household Size | Owner-occupied | Renter-occupied |
| Less than High School | 9 (64.3%) | 5 (35.7%) |
| High School Diploma | 19 (82.6%) | 4 (17.4%) |
| College/Associate Degree | 54 (74.0%) | 19 (26.0%) |
| Bachelor's Degree or higher | 11 (100.0%) | 0 (0.0%) |
Occupancy by Age of Householder in Jasper
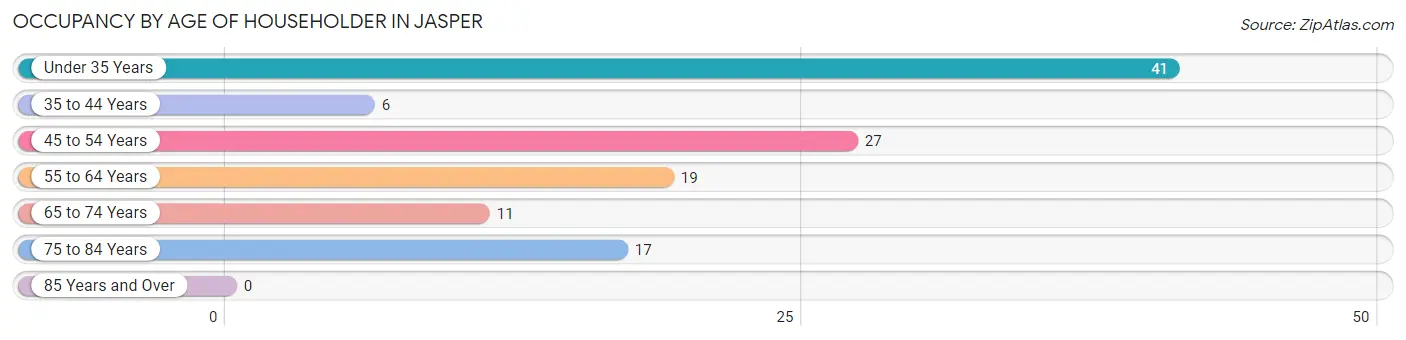
| Age Bracket | # Households | % Households |
| Under 35 Years | 41 | 33.9% |
| 35 to 44 Years | 6 | 5.0% |
| 45 to 54 Years | 27 | 22.3% |
| 55 to 64 Years | 19 | 15.7% |
| 65 to 74 Years | 11 | 9.1% |
| 75 to 84 Years | 17 | 14.1% |
| 85 Years and Over | 0 | 0.0% |
| Total | 121 | 100.0% |
Housing Finances in Jasper
Median Income by Occupancy in Jasper
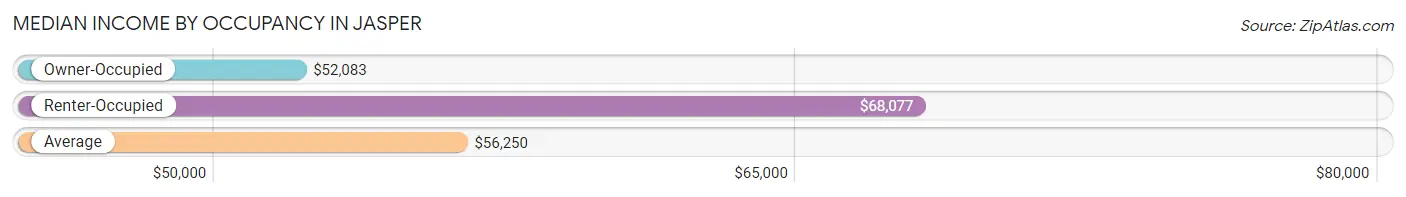
| Occupancy Type | # Households | Median Income |
| Owner-Occupied | 93 (76.9%) | $52,083 |
| Renter-Occupied | 28 (23.1%) | $68,077 |
| Average | 121 (100.0%) | $56,250 |
Occupancy by Householder Income Bracket in Jasper
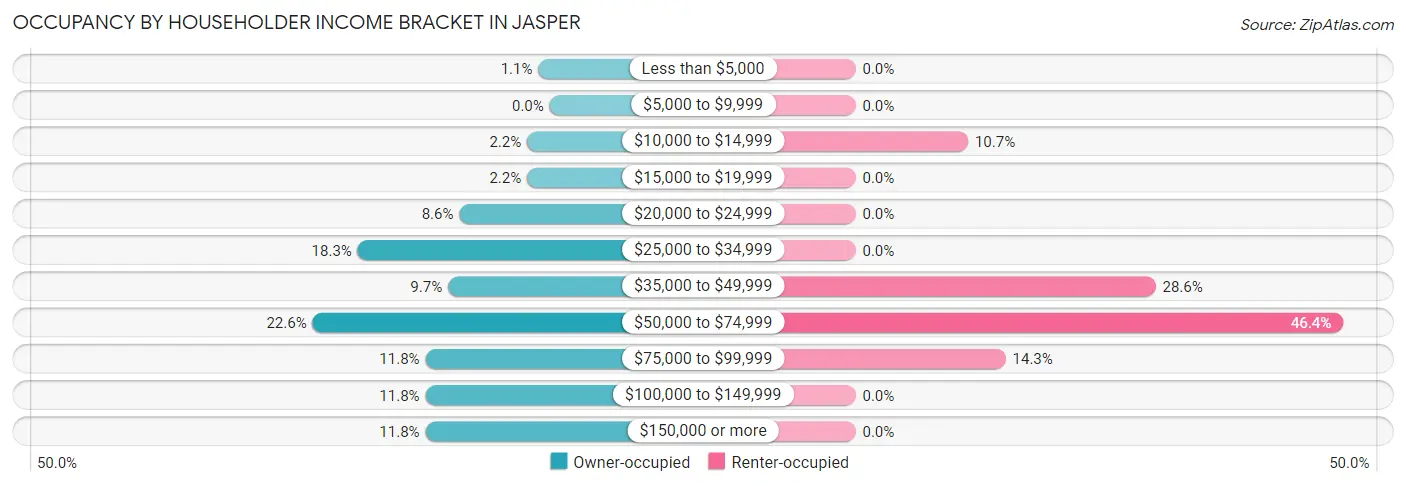
| Income Bracket | Owner-occupied | Renter-occupied |
| Less than $5,000 | 1 (1.1%) | 0 (0.0%) |
| $5,000 to $9,999 | 0 (0.0%) | 0 (0.0%) |
| $10,000 to $14,999 | 2 (2.1%) | 3 (10.7%) |
| $15,000 to $19,999 | 2 (2.1%) | 0 (0.0%) |
| $20,000 to $24,999 | 8 (8.6%) | 0 (0.0%) |
| $25,000 to $34,999 | 17 (18.3%) | 0 (0.0%) |
| $35,000 to $49,999 | 9 (9.7%) | 8 (28.6%) |
| $50,000 to $74,999 | 21 (22.6%) | 13 (46.4%) |
| $75,000 to $99,999 | 11 (11.8%) | 4 (14.3%) |
| $100,000 to $149,999 | 11 (11.8%) | 0 (0.0%) |
| $150,000 or more | 11 (11.8%) | 0 (0.0%) |
| Total | 93 (100.0%) | 28 (100.0%) |
Monthly Housing Cost Tiers in Jasper
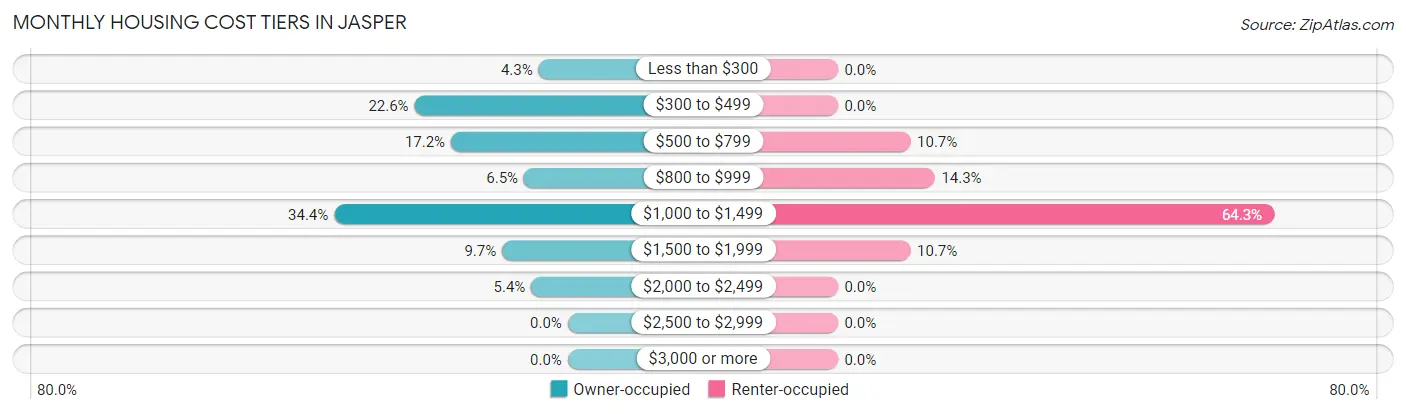
| Monthly Cost | Owner-occupied | Renter-occupied |
| Less than $300 | 4 (4.3%) | 0 (0.0%) |
| $300 to $499 | 21 (22.6%) | 0 (0.0%) |
| $500 to $799 | 16 (17.2%) | 3 (10.7%) |
| $800 to $999 | 6 (6.5%) | 4 (14.3%) |
| $1,000 to $1,499 | 32 (34.4%) | 18 (64.3%) |
| $1,500 to $1,999 | 9 (9.7%) | 3 (10.7%) |
| $2,000 to $2,499 | 5 (5.4%) | 0 (0.0%) |
| $2,500 to $2,999 | 0 (0.0%) | 0 (0.0%) |
| $3,000 or more | 0 (0.0%) | 0 (0.0%) |
| Total | 93 (100.0%) | 28 (100.0%) |
Physical Housing Characteristics in Jasper
Housing Structures in Jasper
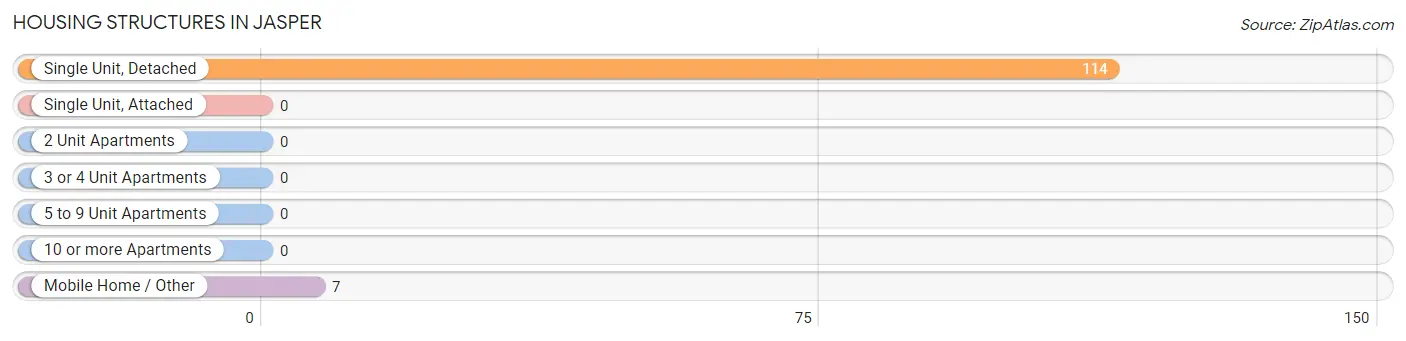
| Structure Type | # Housing Units | % Housing Units |
| Single Unit, Detached | 114 | 94.2% |
| Single Unit, Attached | 0 | 0.0% |
| 2 Unit Apartments | 0 | 0.0% |
| 3 or 4 Unit Apartments | 0 | 0.0% |
| 5 to 9 Unit Apartments | 0 | 0.0% |
| 10 or more Apartments | 0 | 0.0% |
| Mobile Home / Other | 7 | 5.8% |
| Total | 121 | 100.0% |
Housing Structures by Occupancy in Jasper
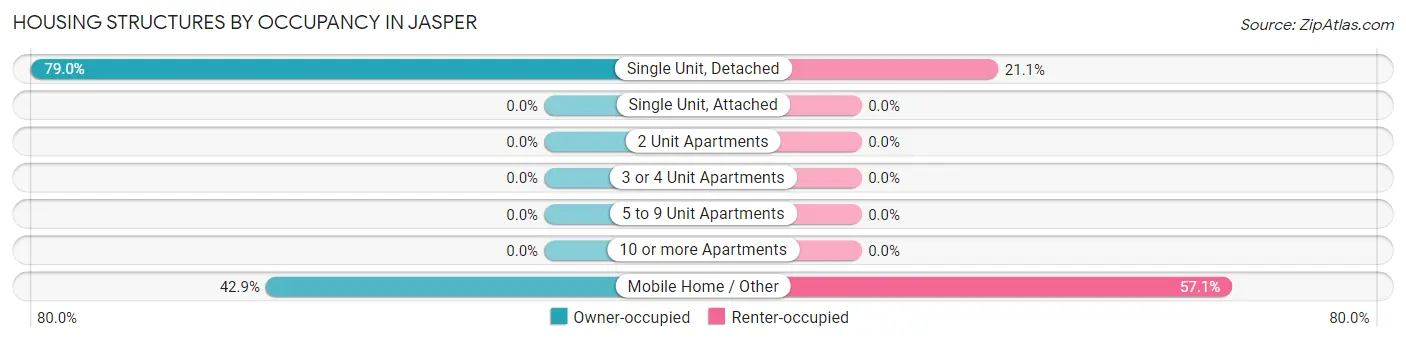
| Structure Type | Owner-occupied | Renter-occupied |
| Single Unit, Detached | 90 (78.9%) | 24 (21.0%) |
| Single Unit, Attached | 0 (0.0%) | 0 (0.0%) |
| 2 Unit Apartments | 0 (0.0%) | 0 (0.0%) |
| 3 or 4 Unit Apartments | 0 (0.0%) | 0 (0.0%) |
| 5 to 9 Unit Apartments | 0 (0.0%) | 0 (0.0%) |
| 10 or more Apartments | 0 (0.0%) | 0 (0.0%) |
| Mobile Home / Other | 3 (42.9%) | 4 (57.1%) |
| Total | 93 (76.9%) | 28 (23.1%) |
Housing Structures by Number of Rooms in Jasper
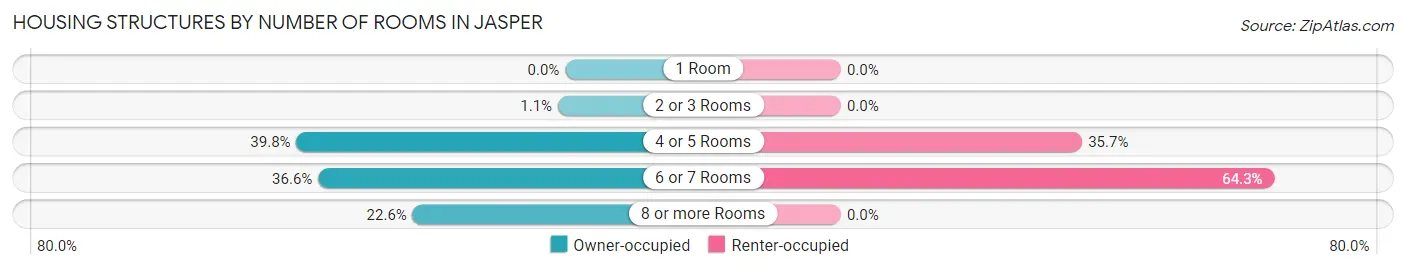
| Number of Rooms | Owner-occupied | Renter-occupied |
| 1 Room | 0 (0.0%) | 0 (0.0%) |
| 2 or 3 Rooms | 1 (1.1%) | 0 (0.0%) |
| 4 or 5 Rooms | 37 (39.8%) | 10 (35.7%) |
| 6 or 7 Rooms | 34 (36.6%) | 18 (64.3%) |
| 8 or more Rooms | 21 (22.6%) | 0 (0.0%) |
| Total | 93 (100.0%) | 28 (100.0%) |
Housing Structure by Heating Type in Jasper
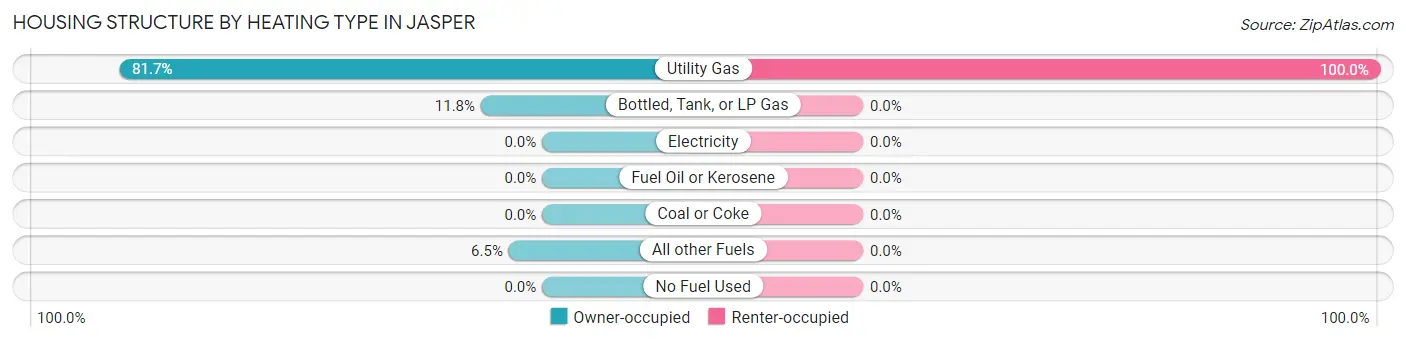
| Heating Type | Owner-occupied | Renter-occupied |
| Utility Gas | 76 (81.7%) | 28 (100.0%) |
| Bottled, Tank, or LP Gas | 11 (11.8%) | 0 (0.0%) |
| Electricity | 0 (0.0%) | 0 (0.0%) |
| Fuel Oil or Kerosene | 0 (0.0%) | 0 (0.0%) |
| Coal or Coke | 0 (0.0%) | 0 (0.0%) |
| All other Fuels | 6 (6.5%) | 0 (0.0%) |
| No Fuel Used | 0 (0.0%) | 0 (0.0%) |
| Total | 93 (100.0%) | 28 (100.0%) |
Household Vehicle Usage in Jasper
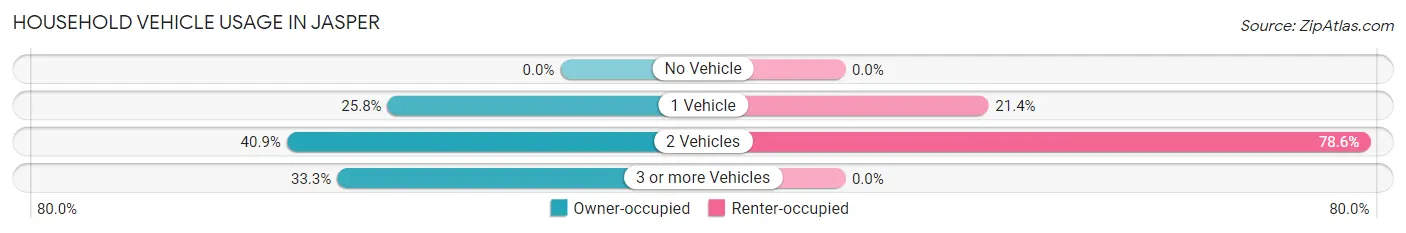
| Vehicles per Household | Owner-occupied | Renter-occupied |
| No Vehicle | 0 (0.0%) | 0 (0.0%) |
| 1 Vehicle | 24 (25.8%) | 6 (21.4%) |
| 2 Vehicles | 38 (40.9%) | 22 (78.6%) |
| 3 or more Vehicles | 31 (33.3%) | 0 (0.0%) |
| Total | 93 (100.0%) | 28 (100.0%) |
Real Estate & Mortgages in Jasper
Real Estate and Mortgage Overview in Jasper
| Characteristic | Without Mortgage | With Mortgage |
| Housing Units | 37 | 56 |
| Median Property Value | $137,500 | $125,000 |
| Median Household Income | - | - |
| Monthly Housing Costs | $419 | $0 |
| Real Estate Taxes | - | - |
Property Value by Mortgage Status in Jasper
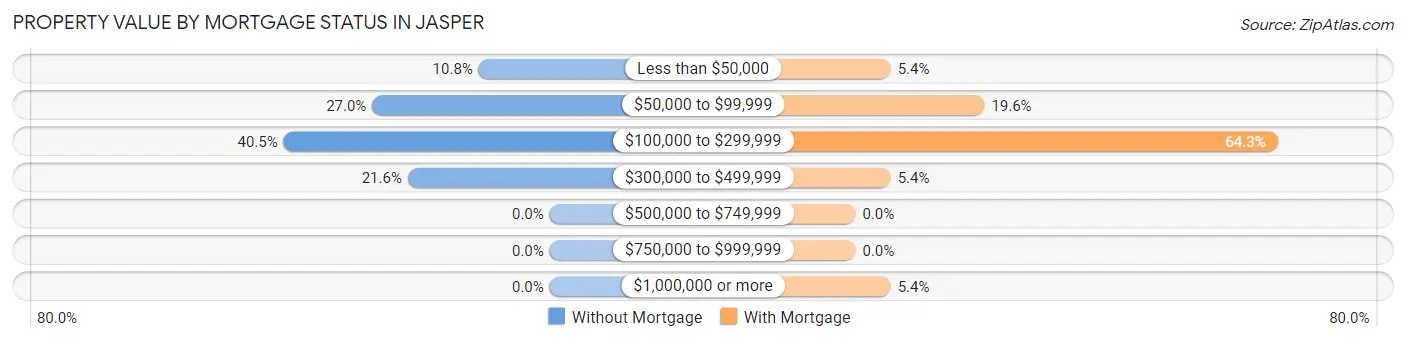
| Property Value | Without Mortgage | With Mortgage |
| Less than $50,000 | 4 (10.8%) | 3 (5.4%) |
| $50,000 to $99,999 | 10 (27.0%) | 11 (19.6%) |
| $100,000 to $299,999 | 15 (40.5%) | 36 (64.3%) |
| $300,000 to $499,999 | 8 (21.6%) | 3 (5.4%) |
| $500,000 to $749,999 | 0 (0.0%) | 0 (0.0%) |
| $750,000 to $999,999 | 0 (0.0%) | 0 (0.0%) |
| $1,000,000 or more | 0 (0.0%) | 3 (5.4%) |
| Total | 37 (100.0%) | 56 (100.0%) |
Household Income by Mortgage Status in Jasper
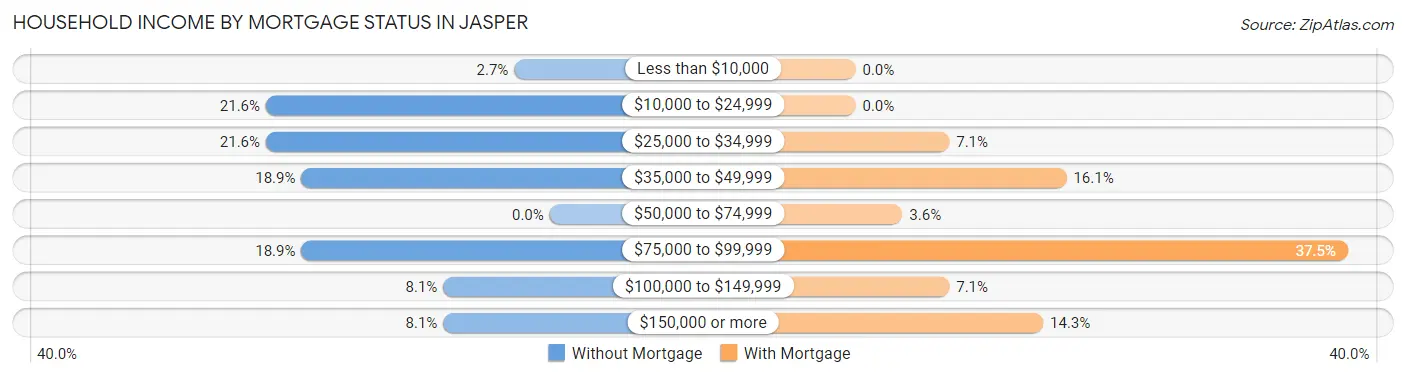
| Household Income | Without Mortgage | With Mortgage |
| Less than $10,000 | 1 (2.7%) | 0 (0.0%) |
| $10,000 to $24,999 | 8 (21.6%) | 0 (0.0%) |
| $25,000 to $34,999 | 8 (21.6%) | 4 (7.1%) |
| $35,000 to $49,999 | 7 (18.9%) | 9 (16.1%) |
| $50,000 to $74,999 | 0 (0.0%) | 2 (3.6%) |
| $75,000 to $99,999 | 7 (18.9%) | 21 (37.5%) |
| $100,000 to $149,999 | 3 (8.1%) | 4 (7.1%) |
| $150,000 or more | 3 (8.1%) | 8 (14.3%) |
| Total | 37 (100.0%) | 56 (100.0%) |
Property Value to Household Income Ratio in Jasper
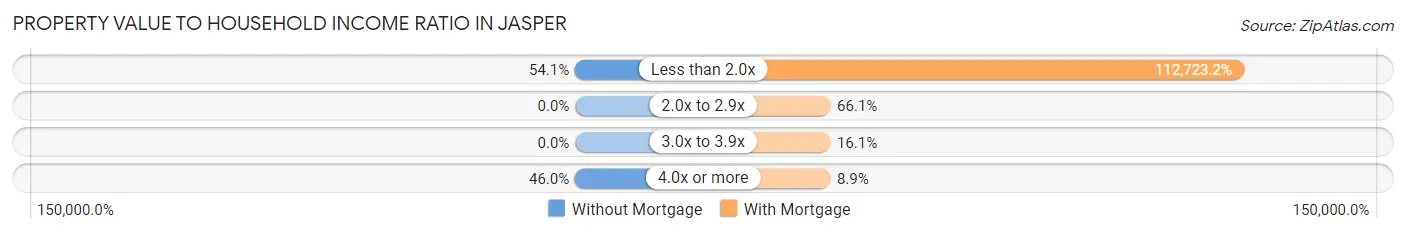
| Value-to-Income Ratio | Without Mortgage | With Mortgage |
| Less than 2.0x | 20 (54.0%) | 63,125 (112,723.2%) |
| 2.0x to 2.9x | 0 (0.0%) | 37 (66.1%) |
| 3.0x to 3.9x | 0 (0.0%) | 9 (16.1%) |
| 4.0x or more | 17 (46.0%) | 5 (8.9%) |
| Total | 37 (100.0%) | 56 (100.0%) |
Real Estate Taxes by Mortgage Status in Jasper
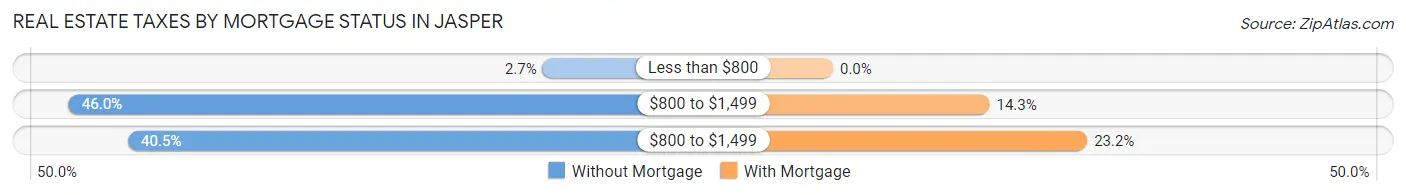
| Property Taxes | Without Mortgage | With Mortgage |
| Less than $800 | 1 (2.7%) | 0 (0.0%) |
| $800 to $1,499 | 17 (46.0%) | 8 (14.3%) |
| $800 to $1,499 | 15 (40.5%) | 13 (23.2%) |
| Total | 37 (100.0%) | 56 (100.0%) |
Health & Disability in Jasper
Health Insurance Coverage by Age in Jasper
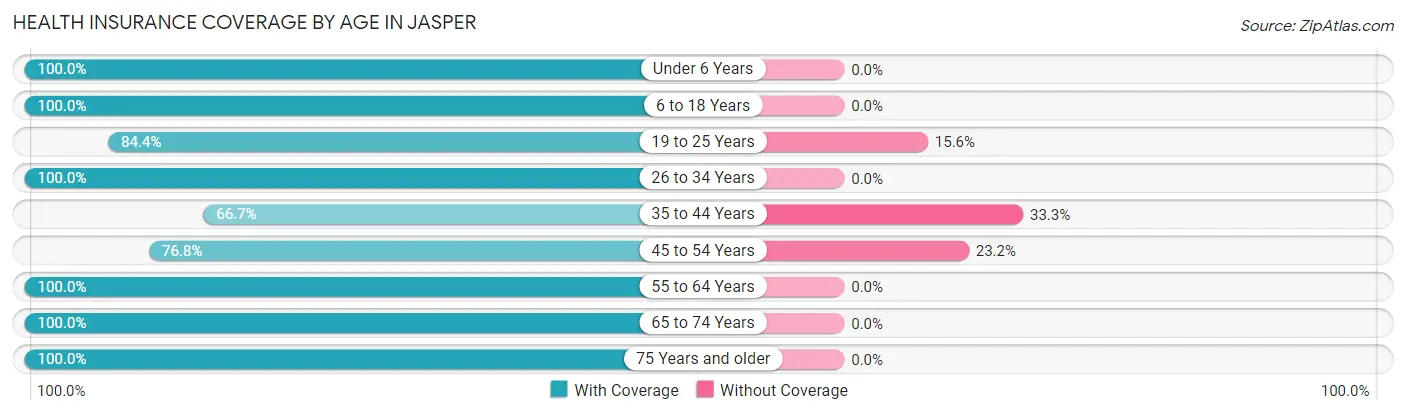
| Age Bracket | With Coverage | Without Coverage |
| Under 6 Years | 25 (100.0%) | 0 (0.0%) |
| 6 to 18 Years | 36 (100.0%) | 0 (0.0%) |
| 19 to 25 Years | 65 (84.4%) | 12 (15.6%) |
| 26 to 34 Years | 51 (100.0%) | 0 (0.0%) |
| 35 to 44 Years | 6 (66.7%) | 3 (33.3%) |
| 45 to 54 Years | 43 (76.8%) | 13 (23.2%) |
| 55 to 64 Years | 34 (100.0%) | 0 (0.0%) |
| 65 to 74 Years | 19 (100.0%) | 0 (0.0%) |
| 75 Years and older | 37 (100.0%) | 0 (0.0%) |
| Total | 316 (91.9%) | 28 (8.1%) |
Health Insurance Coverage by Citizenship Status in Jasper
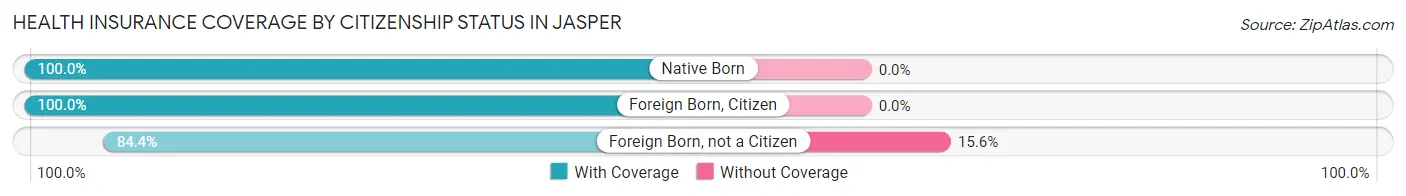
| Citizenship Status | With Coverage | Without Coverage |
| Native Born | 25 (100.0%) | 0 (0.0%) |
| Foreign Born, Citizen | 36 (100.0%) | 0 (0.0%) |
| Foreign Born, not a Citizen | 65 (84.4%) | 12 (15.6%) |
Health Insurance Coverage by Household Income in Jasper
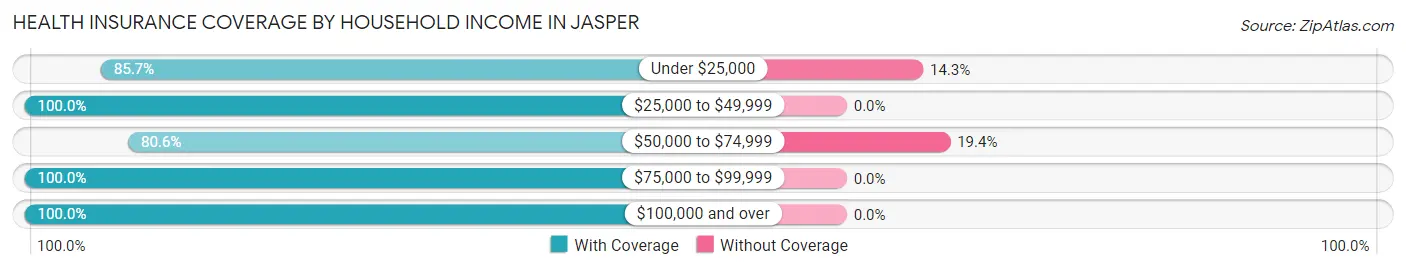
| Household Income | With Coverage | Without Coverage |
| Under $25,000 | 18 (85.7%) | 3 (14.3%) |
| $25,000 to $49,999 | 73 (100.0%) | 0 (0.0%) |
| $50,000 to $74,999 | 104 (80.6%) | 25 (19.4%) |
| $75,000 to $99,999 | 57 (100.0%) | 0 (0.0%) |
| $100,000 and over | 64 (100.0%) | 0 (0.0%) |
Public vs Private Health Insurance Coverage by Age in Jasper
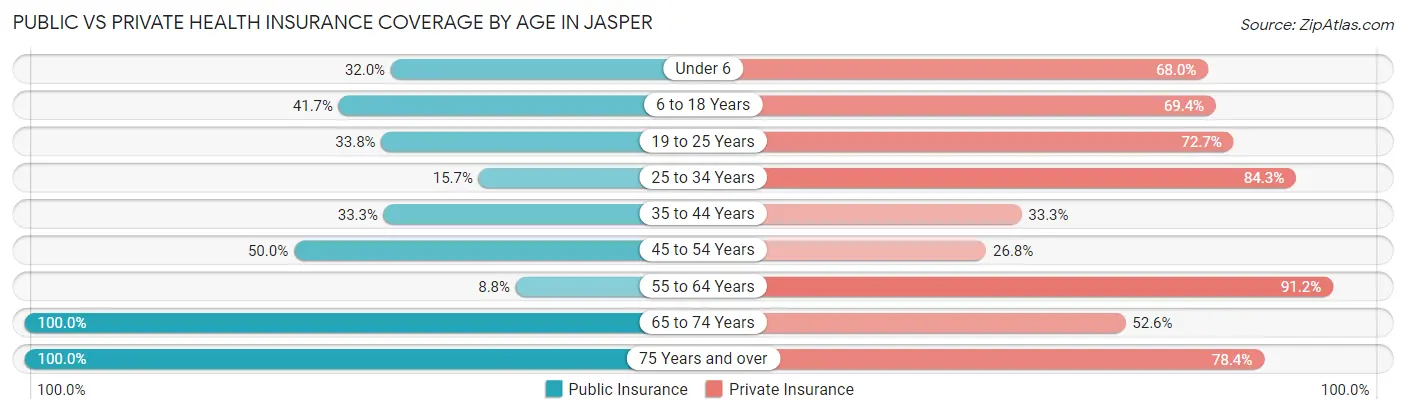
| Age Bracket | Public Insurance | Private Insurance |
| Under 6 | 8 (32.0%) | 17 (68.0%) |
| 6 to 18 Years | 15 (41.7%) | 25 (69.4%) |
| 19 to 25 Years | 26 (33.8%) | 56 (72.7%) |
| 25 to 34 Years | 8 (15.7%) | 43 (84.3%) |
| 35 to 44 Years | 3 (33.3%) | 3 (33.3%) |
| 45 to 54 Years | 28 (50.0%) | 15 (26.8%) |
| 55 to 64 Years | 3 (8.8%) | 31 (91.2%) |
| 65 to 74 Years | 19 (100.0%) | 10 (52.6%) |
| 75 Years and over | 37 (100.0%) | 29 (78.4%) |
| Total | 147 (42.7%) | 229 (66.6%) |
Disability Status by Sex by Age in Jasper
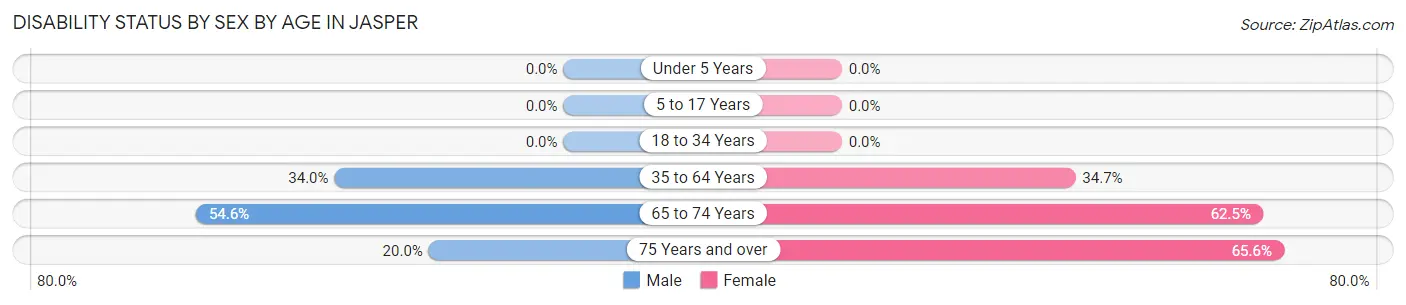
| Age Bracket | Male | Female |
| Under 5 Years | 0 (0.0%) | 0 (0.0%) |
| 5 to 17 Years | 0 (0.0%) | 0 (0.0%) |
| 18 to 34 Years | 0 (0.0%) | 0 (0.0%) |
| 35 to 64 Years | 17 (34.0%) | 17 (34.7%) |
| 65 to 74 Years | 6 (54.5%) | 5 (62.5%) |
| 75 Years and over | 1 (20.0%) | 21 (65.6%) |
Disability Class by Sex by Age in Jasper
Disability Class: Hearing Difficulty
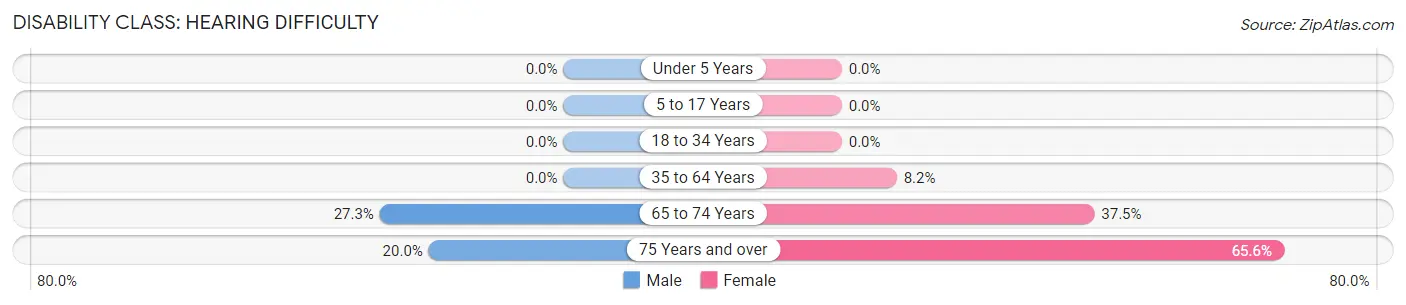
| Age Bracket | Male | Female |
| Under 5 Years | 0 (0.0%) | 0 (0.0%) |
| 5 to 17 Years | 0 (0.0%) | 0 (0.0%) |
| 18 to 34 Years | 0 (0.0%) | 0 (0.0%) |
| 35 to 64 Years | 0 (0.0%) | 4 (8.2%) |
| 65 to 74 Years | 3 (27.3%) | 3 (37.5%) |
| 75 Years and over | 1 (20.0%) | 21 (65.6%) |
Disability Class: Vision Difficulty
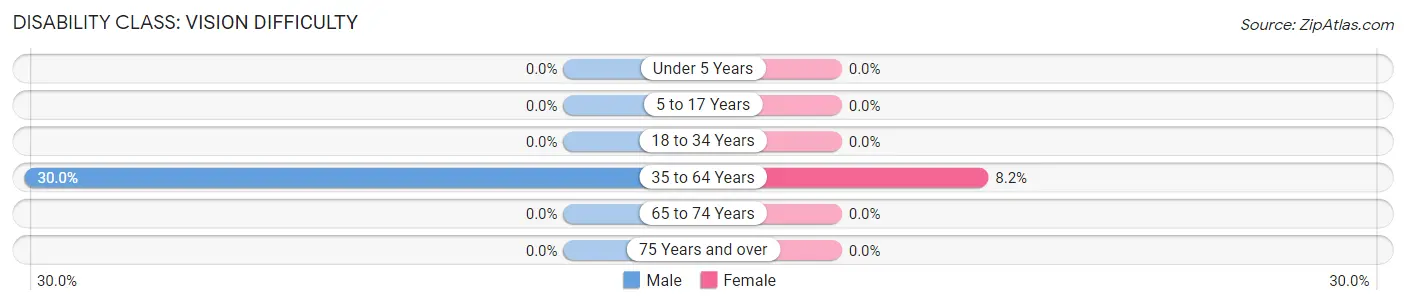
| Age Bracket | Male | Female |
| Under 5 Years | 0 (0.0%) | 0 (0.0%) |
| 5 to 17 Years | 0 (0.0%) | 0 (0.0%) |
| 18 to 34 Years | 0 (0.0%) | 0 (0.0%) |
| 35 to 64 Years | 15 (30.0%) | 4 (8.2%) |
| 65 to 74 Years | 0 (0.0%) | 0 (0.0%) |
| 75 Years and over | 0 (0.0%) | 0 (0.0%) |
Disability Class: Cognitive Difficulty
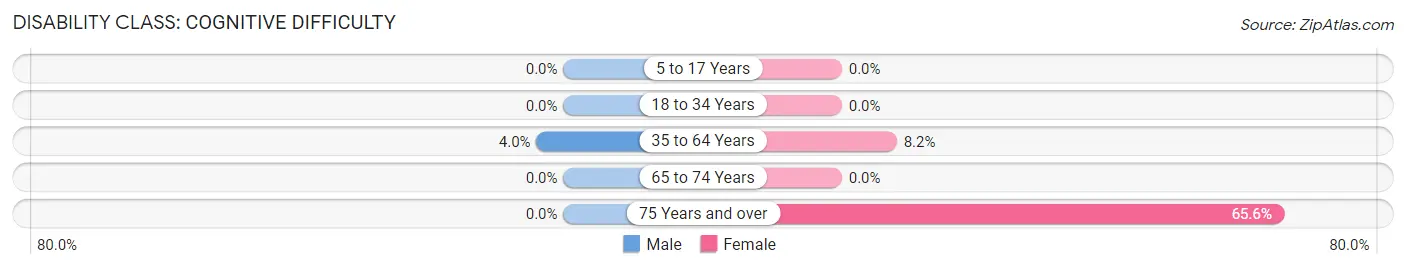
| Age Bracket | Male | Female |
| 5 to 17 Years | 0 (0.0%) | 0 (0.0%) |
| 18 to 34 Years | 0 (0.0%) | 0 (0.0%) |
| 35 to 64 Years | 2 (4.0%) | 4 (8.2%) |
| 65 to 74 Years | 0 (0.0%) | 0 (0.0%) |
| 75 Years and over | 0 (0.0%) | 21 (65.6%) |
Disability Class: Ambulatory Difficulty
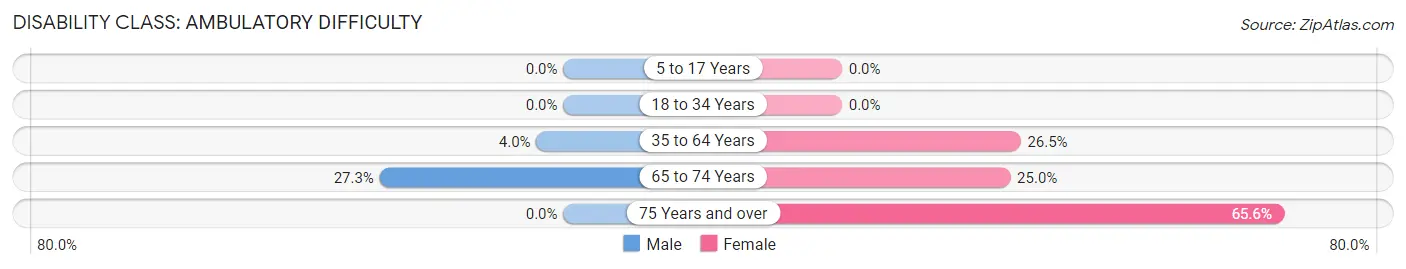
| Age Bracket | Male | Female |
| 5 to 17 Years | 0 (0.0%) | 0 (0.0%) |
| 18 to 34 Years | 0 (0.0%) | 0 (0.0%) |
| 35 to 64 Years | 2 (4.0%) | 13 (26.5%) |
| 65 to 74 Years | 3 (27.3%) | 2 (25.0%) |
| 75 Years and over | 0 (0.0%) | 21 (65.6%) |
Disability Class: Self-Care Difficulty
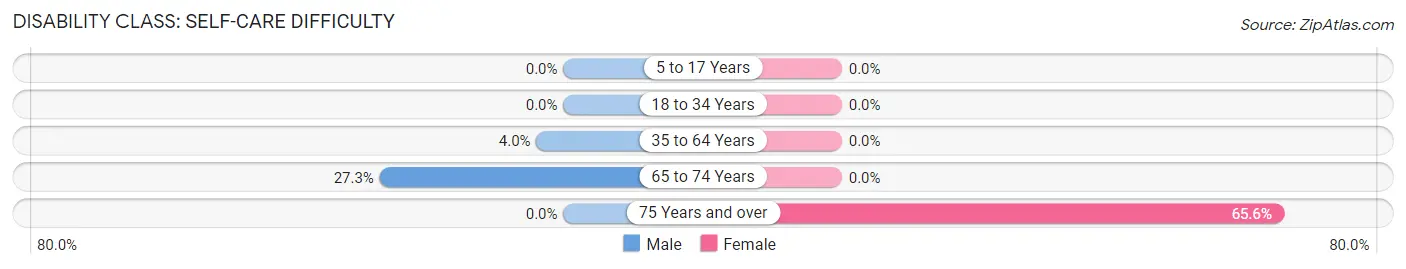
| Age Bracket | Male | Female |
| 5 to 17 Years | 0 (0.0%) | 0 (0.0%) |
| 18 to 34 Years | 0 (0.0%) | 0 (0.0%) |
| 35 to 64 Years | 2 (4.0%) | 0 (0.0%) |
| 65 to 74 Years | 3 (27.3%) | 0 (0.0%) |
| 75 Years and over | 0 (0.0%) | 21 (65.6%) |
Technology Access in Jasper
Computing Device Access in Jasper
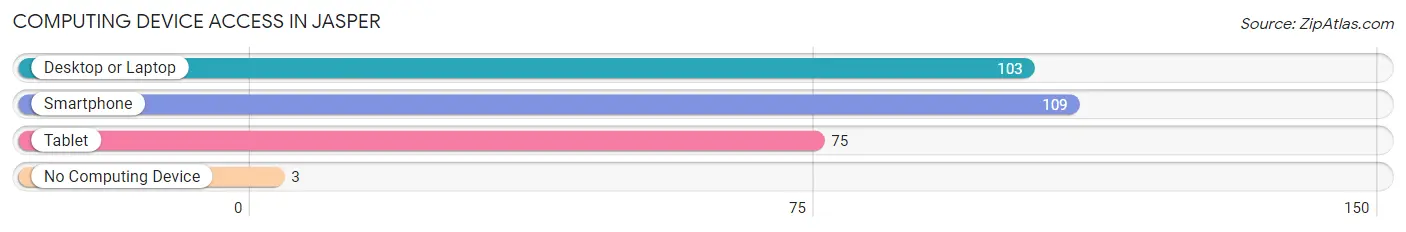
| Device Type | # Households | % Households |
| Desktop or Laptop | 103 | 85.1% |
| Smartphone | 109 | 90.1% |
| Tablet | 75 | 62.0% |
| No Computing Device | 3 | 2.5% |
| Total | 121 | 100.0% |
Internet Access in Jasper
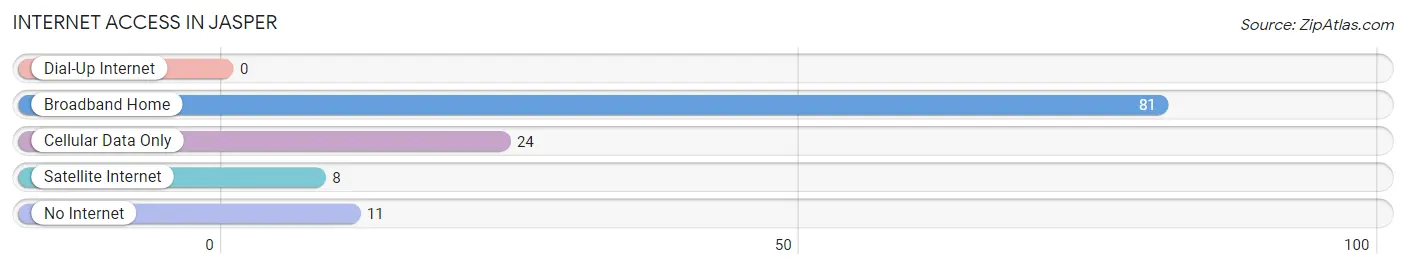
| Internet Type | # Households | % Households |
| Dial-Up Internet | 0 | 0.0% |
| Broadband Home | 81 | 66.9% |
| Cellular Data Only | 24 | 19.8% |
| Satellite Internet | 8 | 6.6% |
| No Internet | 11 | 9.1% |
| Total | 121 | 100.0% |
Jasper Summary
Jasper, Michigan is a small village located in the Upper Peninsula of Michigan. It is situated in the northwest corner of Marquette County, near the border of Alger County. The village is located on the banks of the Dead River, which is a tributary of the Escanaba River. The population of Jasper was estimated to be around 500 people in 2020.
Geography
Jasper is located in the Upper Peninsula of Michigan, near the border of Alger County. The village is situated on the banks of the Dead River, which is a tributary of the Escanaba River. The terrain of the area is mostly flat, with some rolling hills. The climate is humid continental, with cold winters and warm summers. The average annual temperature is around 40 degrees Fahrenheit.
History
Jasper was first settled in the late 1800s by Finnish immigrants. The village was originally known as “Finn Town”, and was home to a large Finnish population. The village was officially incorporated in 1891. In the early 1900s, the village was home to a number of businesses, including a sawmill, a grist mill, a blacksmith shop, and a general store.
In the mid-1900s, the village began to decline as the local economy shifted away from logging and farming. The population of Jasper decreased significantly, and the village became a virtual ghost town. In the late 1990s, the village began to experience a resurgence, as new businesses and residents moved into the area.
Economy
The economy of Jasper is largely based on tourism and outdoor recreation. The village is home to a number of tourist attractions, including the Dead River Falls, the Jasper Historical Museum, and the Jasper Nature Center. The village is also home to a number of outdoor recreation activities, such as fishing, hunting, and camping.
The village is also home to a number of small businesses, including restaurants, retail stores, and service providers. The village is also home to a number of manufacturing companies, including a furniture manufacturer and a metal fabrication company.
Demographics
The population of Jasper was estimated to be around 500 people in 2020. The racial makeup of the village is predominantly white, with a small percentage of African Americans, Native Americans, and other races. The median household income in Jasper is around $35,000, and the median home value is around $90,000.
Conclusion
Jasper, Michigan is a small village located in the Upper Peninsula of Michigan. It is situated on the banks of the Dead River, and is home to a population of around 500 people. The economy of Jasper is largely based on tourism and outdoor recreation, and the village is home to a number of small businesses. The racial makeup of the village is predominantly white, with a small percentage of African Americans, Native Americans, and other races.
Common Questions
What is Per Capita Income in Jasper?
Per Capita income in Jasper is $27,349.
What is the Median Family Income in Jasper?
Median Family Income in Jasper is $67,813.
What is the Median Household income in Jasper?
Median Household Income in Jasper is $56,250.
What is Inequality or Gini Index in Jasper?
Inequality or Gini Index in Jasper is 0.36.
What is the Total Population of Jasper?
Total Population of Jasper is 344.
What is the Total Male Population of Jasper?
Total Male Population of Jasper is 141.
What is the Total Female Population of Jasper?
Total Female Population of Jasper is 203.
What is the Ratio of Males per 100 Females in Jasper?
There are 69.46 Males per 100 Females in Jasper.
What is the Ratio of Females per 100 Males in Jasper?
There are 143.97 Females per 100 Males in Jasper.
What is the Median Population Age in Jasper?
Median Population Age in Jasper is 32.3 Years.
What is the Average Family Size in Jasper
Average Family Size in Jasper is 3.2 People.
What is the Average Household Size in Jasper
Average Household Size in Jasper is 2.8 People.
How Large is the Labor Force in Jasper?
There are 208 People in the Labor Forcein in Jasper.
What is the Percentage of People in the Labor Force in Jasper?
68.9% of People are in the Labor Force in Jasper.
What is the Unemployment Rate in Jasper?
Unemployment Rate in Jasper is 10.1%.