Zip Codes with the Highest Percentage of Population Employed in Security & Protection in Battle Creek, MI
RELATED REPORTS & OPTIONS
Security & Protection
Battle Creek
Compare Zip Codes
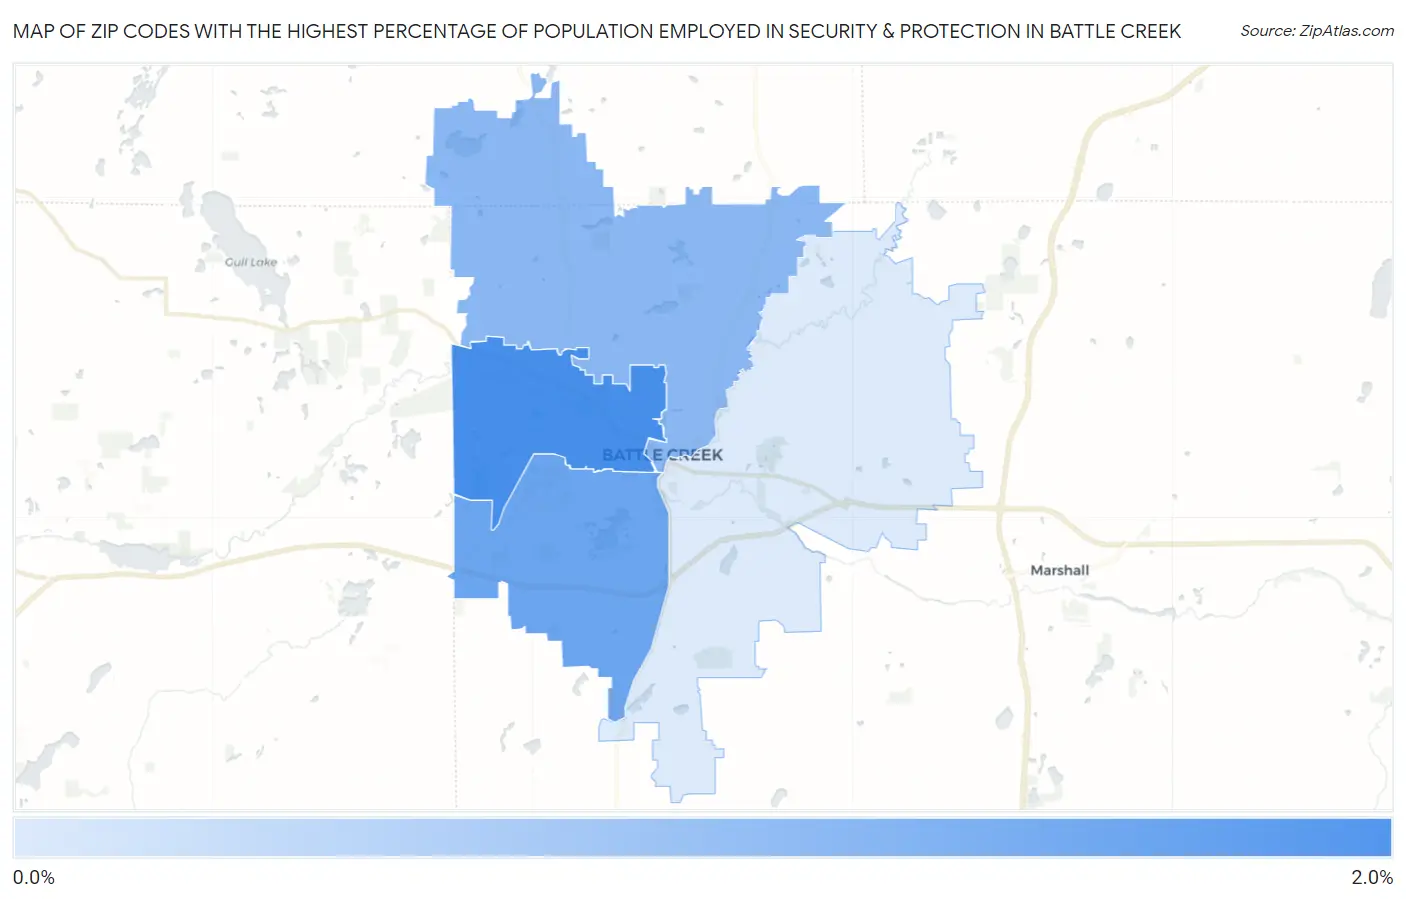
Map of Zip Codes with the Highest Percentage of Population Employed in Security & Protection in Battle Creek
0.98%
1.7%
Zip Codes with the Highest Percentage of Population Employed in Security & Protection in Battle Creek, MI
| Zip Code | % Employed | vs State | vs National | |
| 1. | 49037 | 1.7% | 1.6%(+0.035)#393 | 2.1%(-0.472)#14,853 |
| 2. | 49015 | 1.5% | 1.6%(-0.133)#451 | 2.1%(-0.640)#16,123 |
| 3. | 49017 | 1.4% | 1.6%(-0.278)#491 | 2.1%(-0.785)#17,228 |
| 4. | 49014 | 0.98% | 1.6%(-0.657)#621 | 2.1%(-1.16)#20,171 |
1
Common Questions
What are the Top 3 Zip Codes with the Highest Percentage of Population Employed in Security & Protection in Battle Creek, MI?
Top 3 Zip Codes with the Highest Percentage of Population Employed in Security & Protection in Battle Creek, MI are:
What zip code has the Highest Percentage of Population Employed in Security & Protection in Battle Creek, MI?
49037 has the Highest Percentage of Population Employed in Security & Protection in Battle Creek, MI with 1.7%.
What is the Percentage of Population Employed in Security & Protection in Battle Creek, MI?
Percentage of Population Employed in Security & Protection in Battle Creek is 1.8%.
What is the Percentage of Population Employed in Security & Protection in Michigan?
Percentage of Population Employed in Security & Protection in Michigan is 1.6%.
What is the Percentage of Population Employed in Security & Protection in the United States?
Percentage of Population Employed in Security & Protection in the United States is 2.1%.