Greenville, MI Map & Demographics
Greenville Map
Greenville Overview
$26,688
PER CAPITA INCOME
$60,859
AVG FAMILY INCOME
$50,332
AVG HOUSEHOLD INCOME
31.0%
WAGE / INCOME GAP [ % ]
69.0¢/ $1
WAGE / INCOME GAP [ $ ]
0.39
INEQUALITY / GINI INDEX
8,866
TOTAL POPULATION
4,127
MALE POPULATION
4,739
FEMALE POPULATION
87.09
MALES / 100 FEMALES
114.83
FEMALES / 100 MALES
37.3
MEDIAN AGE
3.1
AVG FAMILY SIZE
2.4
AVG HOUSEHOLD SIZE
4,174
LABOR FORCE [ PEOPLE ]
59.4%
PERCENT IN LABOR FORCE
5.8%
UNEMPLOYMENT RATE
Greenville Zip Codes
Greenville Area Codes
Income in Greenville
Income Overview in Greenville
Per Capita Income in Greenville is $26,688, while median incomes of families and households are $60,859 and $50,332 respectively.
| Characteristic | Number | Measure |
| Per Capita Income | 8,866 | $26,688 |
| Median Family Income | 2,132 | $60,859 |
| Mean Family Income | 2,132 | $70,402 |
| Median Household Income | 3,593 | $50,332 |
| Mean Household Income | 3,593 | $60,951 |
| Income Deficit | 2,132 | $0 |
| Wage / Income Gap (%) | 8,866 | 30.99% |
| Wage / Income Gap ($) | 8,866 | 69.01¢ per $1 |
| Gini / Inequality Index | 8,866 | 0.39 |
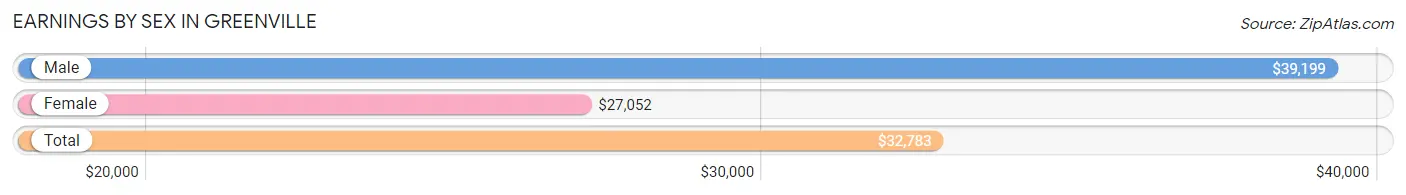
Earnings by Sex in Greenville
Average Earnings in Greenville are $32,783, $39,199 for men and $27,052 for women, a difference of 31.0%.
| Sex | Number | Average Earnings |
| Male | 2,344 (55.4%) | $39,199 |
| Female | 1,889 (44.6%) | $27,052 |
| Total | 4,233 (100.0%) | $32,783 |
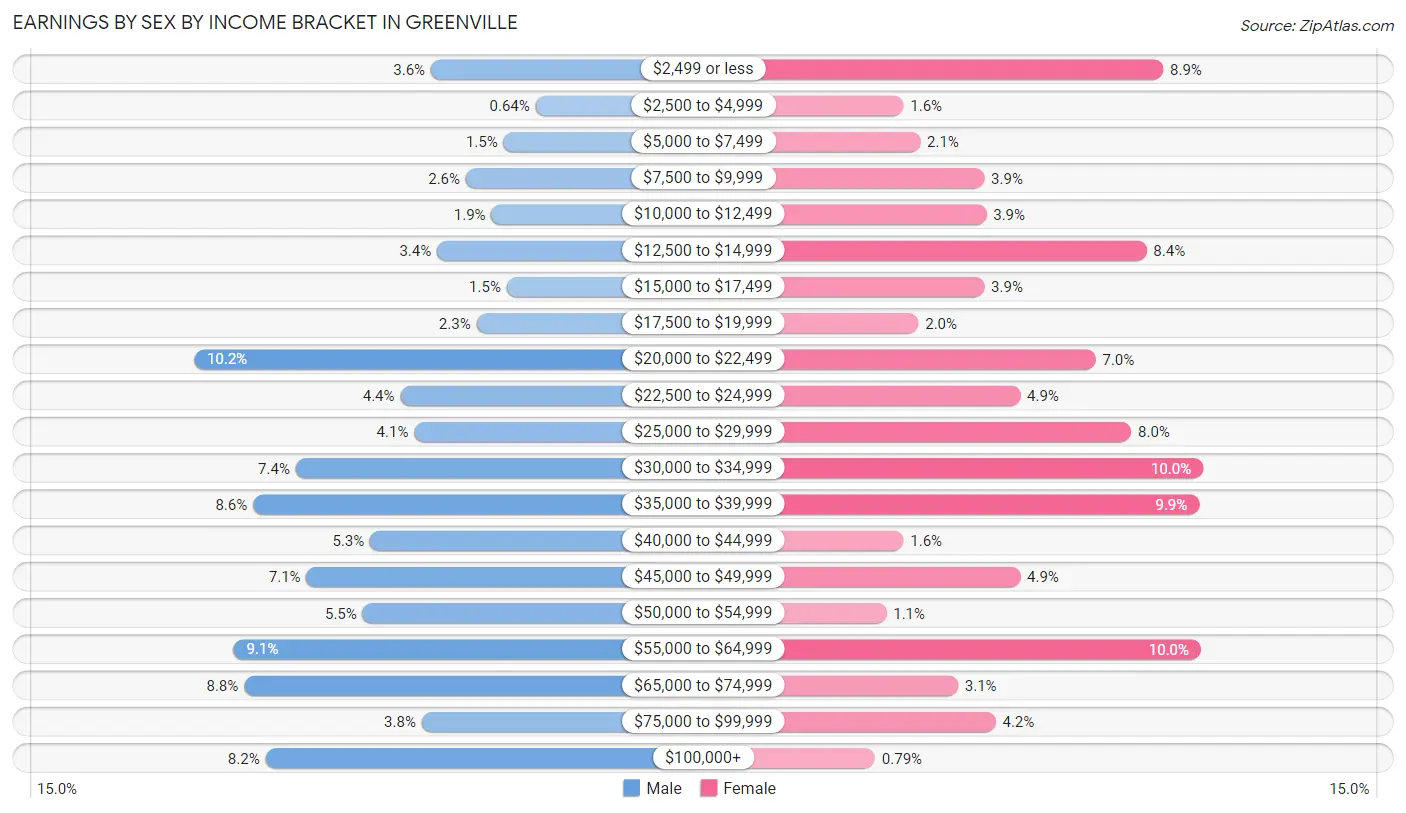
Earnings by Sex by Income Bracket in Greenville
The most common earnings brackets in Greenville are $20,000 to $22,499 for men (240 | 10.2%) and $30,000 to $34,999 for women (189 | 10.0%).
| Income | Male | Female |
| $2,499 or less | 84 (3.6%) | 168 (8.9%) |
| $2,500 to $4,999 | 15 (0.6%) | 30 (1.6%) |
| $5,000 to $7,499 | 36 (1.5%) | 39 (2.1%) |
| $7,500 to $9,999 | 61 (2.6%) | 73 (3.9%) |
| $10,000 to $12,499 | 44 (1.9%) | 74 (3.9%) |
| $12,500 to $14,999 | 80 (3.4%) | 159 (8.4%) |
| $15,000 to $17,499 | 34 (1.5%) | 73 (3.9%) |
| $17,500 to $19,999 | 54 (2.3%) | 38 (2.0%) |
| $20,000 to $22,499 | 240 (10.2%) | 132 (7.0%) |
| $22,500 to $24,999 | 104 (4.4%) | 92 (4.9%) |
| $25,000 to $29,999 | 95 (4.1%) | 151 (8.0%) |
| $30,000 to $34,999 | 173 (7.4%) | 189 (10.0%) |
| $35,000 to $39,999 | 201 (8.6%) | 187 (9.9%) |
| $40,000 to $44,999 | 124 (5.3%) | 30 (1.6%) |
| $45,000 to $49,999 | 166 (7.1%) | 92 (4.9%) |
| $50,000 to $54,999 | 129 (5.5%) | 21 (1.1%) |
| $55,000 to $64,999 | 214 (9.1%) | 188 (10.0%) |
| $65,000 to $74,999 | 207 (8.8%) | 59 (3.1%) |
| $75,000 to $99,999 | 90 (3.8%) | 79 (4.2%) |
| $100,000+ | 193 (8.2%) | 15 (0.8%) |
| Total | 2,344 (100.0%) | 1,889 (100.0%) |
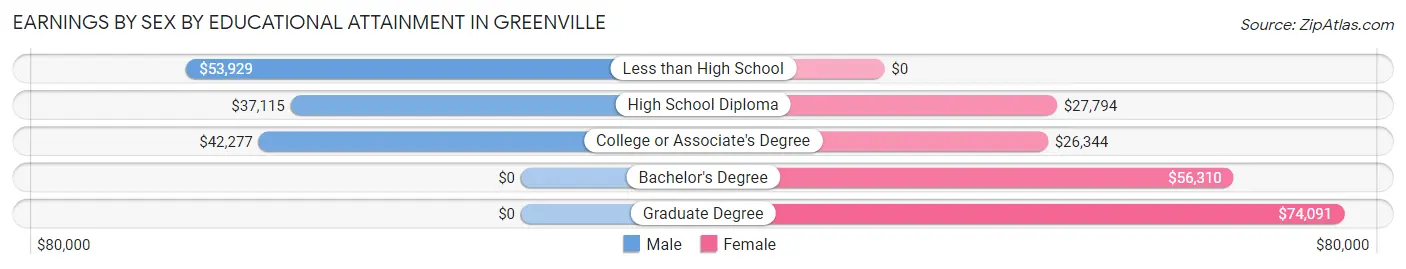
Earnings by Sex by Educational Attainment in Greenville
Average earnings in Greenville are $41,115 for men and $28,852 for women, a difference of 29.8%. Men with an educational attainment of less than high school enjoy the highest average annual earnings of $53,929, while those with high school diploma education earn the least with $37,115. Women with an educational attainment of graduate degree earn the most with the average annual earnings of $74,091, while those with college or associate's degree education have the smallest earnings of $26,344.
| Educational Attainment | Male Income | Female Income |
| Less than High School | $53,929 | $0 |
| High School Diploma | $37,115 | $27,794 |
| College or Associate's Degree | $42,277 | $26,344 |
| Bachelor's Degree | - | - |
| Graduate Degree | - | - |
| Total | $41,115 | $28,852 |
Family Income in Greenville
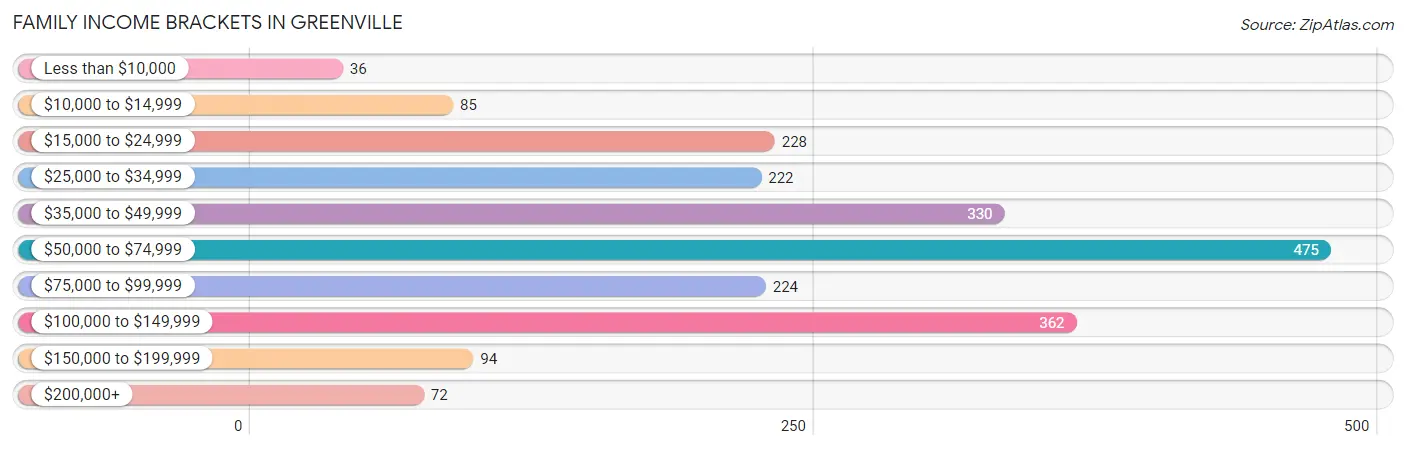
Family Income Brackets in Greenville
According to the Greenville family income data, there are 475 families falling into the $50,000 to $74,999 income range, which is the most common income bracket and makes up 22.3% of all families. Conversely, the less than $10,000 income bracket is the least frequent group with only 36 families (1.7%) belonging to this category.
| Income Bracket | # Families | % Families |
| Less than $10,000 | 36 | 1.7% |
| $10,000 to $14,999 | 85 | 4.0% |
| $15,000 to $24,999 | 228 | 10.7% |
| $25,000 to $34,999 | 222 | 10.4% |
| $35,000 to $49,999 | 330 | 15.5% |
| $50,000 to $74,999 | 475 | 22.3% |
| $75,000 to $99,999 | 224 | 10.5% |
| $100,000 to $149,999 | 362 | 17.0% |
| $150,000 to $199,999 | 94 | 4.4% |
| $200,000+ | 72 | 3.4% |
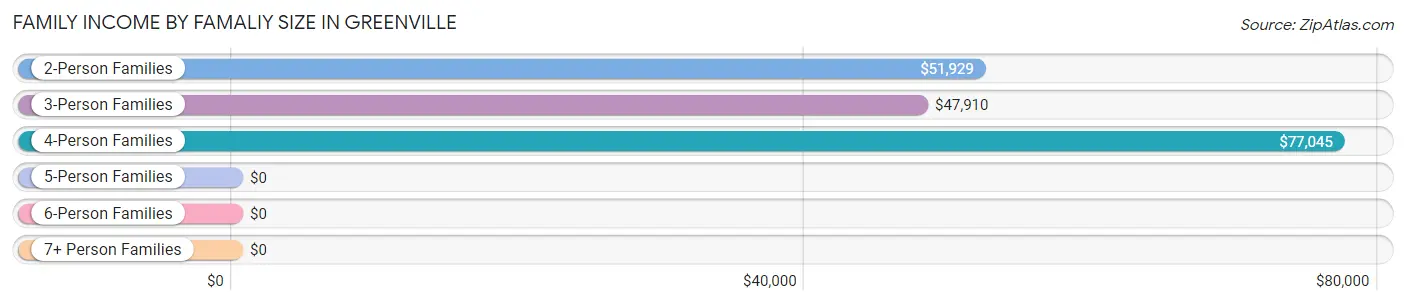
Family Income by Famaliy Size in Greenville
4-person families (372 | 17.4%) account for the highest median family income in Greenville with $77,045 per family, while 2-person families (1,112 | 52.2%) have the highest median income of $25,964 per family member.
| Income Bracket | # Families | Median Income |
| 2-Person Families | 1,112 (52.2%) | $51,929 |
| 3-Person Families | 524 (24.6%) | $47,910 |
| 4-Person Families | 372 (17.4%) | $77,045 |
| 5-Person Families | 32 (1.5%) | $0 |
| 6-Person Families | 14 (0.7%) | $0 |
| 7+ Person Families | 78 (3.7%) | $0 |
| Total | 2,132 (100.0%) | $60,859 |
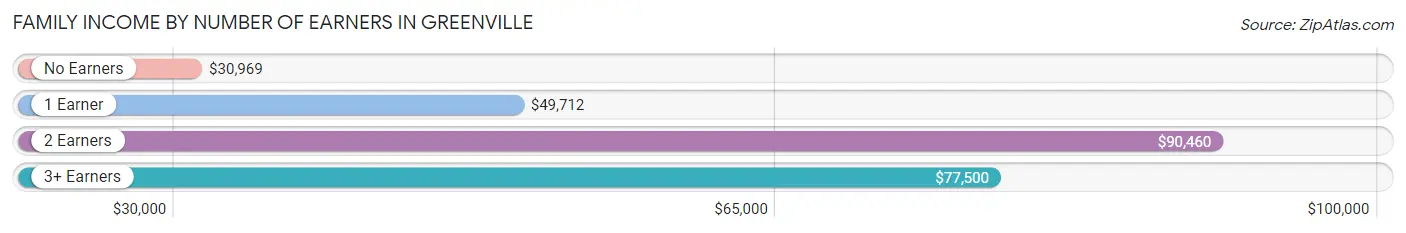
Family Income by Number of Earners in Greenville
The median family income in Greenville is $60,859, with families comprising 2 earners (812) having the highest median family income of $90,460, while families with no earners (428) have the lowest median family income of $30,969, accounting for 38.1% and 20.1% of families, respectively.
| Number of Earners | # Families | Median Income |
| No Earners | 428 (20.1%) | $30,969 |
| 1 Earner | 778 (36.5%) | $49,712 |
| 2 Earners | 812 (38.1%) | $90,460 |
| 3+ Earners | 114 (5.3%) | $77,500 |
| Total | 2,132 (100.0%) | $60,859 |
Household Income in Greenville
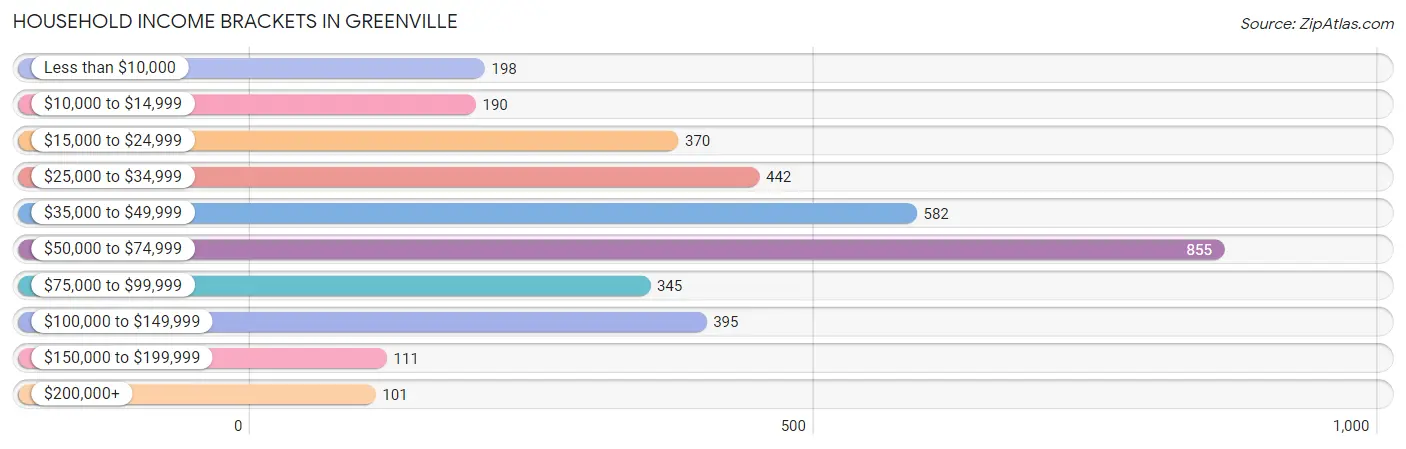
Household Income Brackets in Greenville
With 855 households falling in the category, the $50,000 to $74,999 income range is the most frequent in Greenville, accounting for 23.8% of all households. In contrast, only 101 households (2.8%) fall into the $200,000+ income bracket, making it the least populous group.
| Income Bracket | # Households | % Households |
| Less than $10,000 | 198 | 5.5% |
| $10,000 to $14,999 | 190 | 5.3% |
| $15,000 to $24,999 | 370 | 10.3% |
| $25,000 to $34,999 | 442 | 12.3% |
| $35,000 to $49,999 | 582 | 16.2% |
| $50,000 to $74,999 | 855 | 23.8% |
| $75,000 to $99,999 | 345 | 9.6% |
| $100,000 to $149,999 | 395 | 11.0% |
| $150,000 to $199,999 | 111 | 3.1% |
| $200,000+ | 101 | 2.8% |
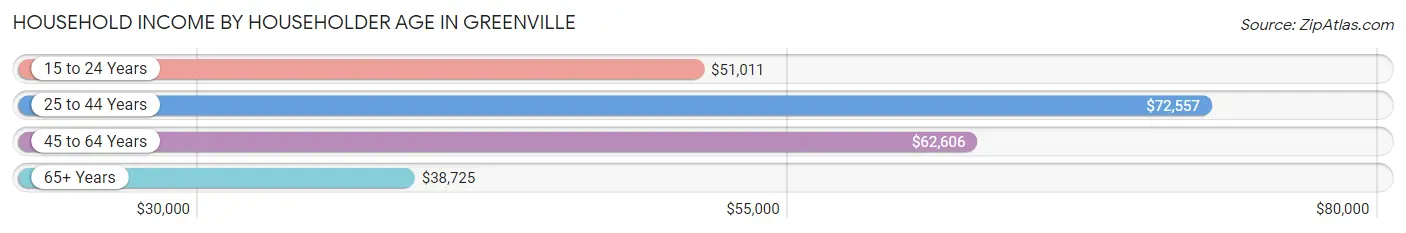
Household Income by Householder Age in Greenville
The median household income in Greenville is $50,332, with the highest median household income of $72,557 found in the 25 to 44 years age bracket for the primary householder. A total of 1,206 households (33.6%) fall into this category. Meanwhile, the 65+ years age bracket for the primary householder has the lowest median household income of $38,725, with 1,326 households (36.9%) in this group.
| Income Bracket | # Households | Median Income |
| 15 to 24 Years | 274 (7.6%) | $51,011 |
| 25 to 44 Years | 1,206 (33.6%) | $72,557 |
| 45 to 64 Years | 787 (21.9%) | $62,606 |
| 65+ Years | 1,326 (36.9%) | $38,725 |
| Total | 3,593 (100.0%) | $50,332 |
Poverty in Greenville
Income Below Poverty by Sex and Age in Greenville
With 6.5% poverty level for males and 13.7% for females among the residents of Greenville, 15 year old males and 15 year old females are the most vulnerable to poverty, with 25 males (100.0%) and 23 females (46.9%) in their respective age groups living below the poverty level.
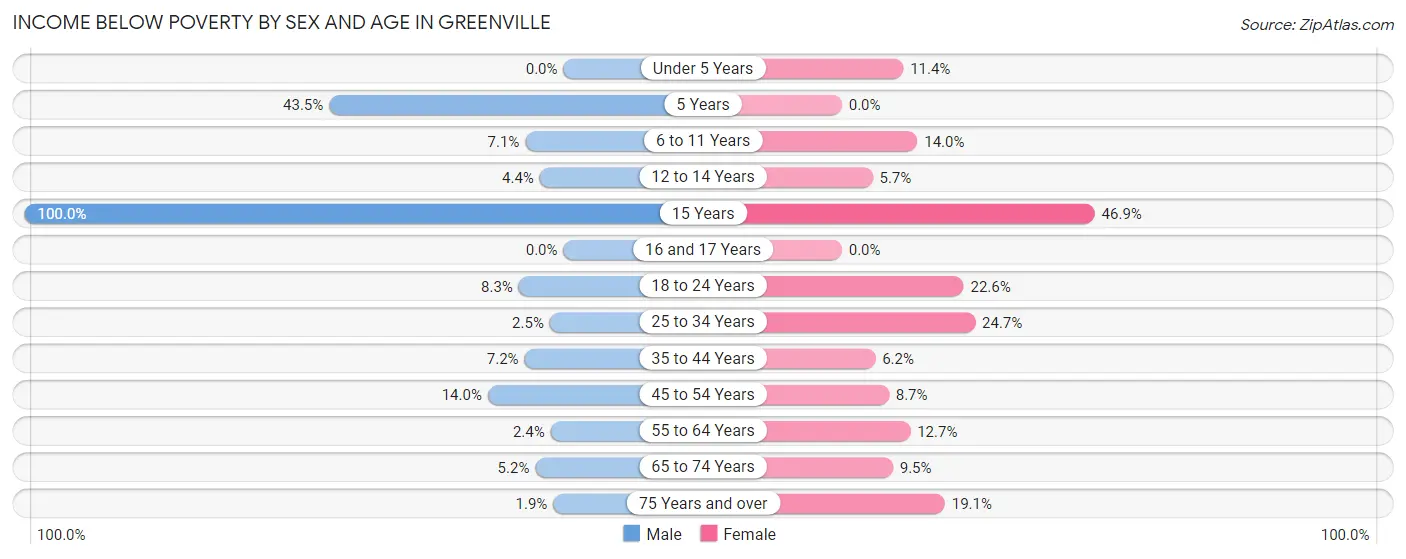
| Age Bracket | Male | Female |
| Under 5 Years | 0 (0.0%) | 53 (11.4%) |
| 5 Years | 20 (43.5%) | 0 (0.0%) |
| 6 to 11 Years | 16 (7.1%) | 52 (14.0%) |
| 12 to 14 Years | 10 (4.4%) | 9 (5.7%) |
| 15 Years | 25 (100.0%) | 23 (46.9%) |
| 16 and 17 Years | 0 (0.0%) | 0 (0.0%) |
| 18 to 24 Years | 33 (8.3%) | 80 (22.6%) |
| 25 to 34 Years | 15 (2.5%) | 145 (24.7%) |
| 35 to 44 Years | 59 (7.2%) | 36 (6.2%) |
| 45 to 54 Years | 41 (14.0%) | 47 (8.7%) |
| 55 to 64 Years | 8 (2.4%) | 48 (12.7%) |
| 65 to 74 Years | 34 (5.2%) | 44 (9.5%) |
| 75 Years and over | 4 (1.9%) | 96 (19.1%) |
| Total | 265 (6.5%) | 633 (13.7%) |
Income Above Poverty by Sex and Age in Greenville
According to the poverty statistics in Greenville, males aged under 5 years and females aged 5 years are the age groups that are most secure financially, with 100.0% of males and 100.0% of females in these age groups living above the poverty line.
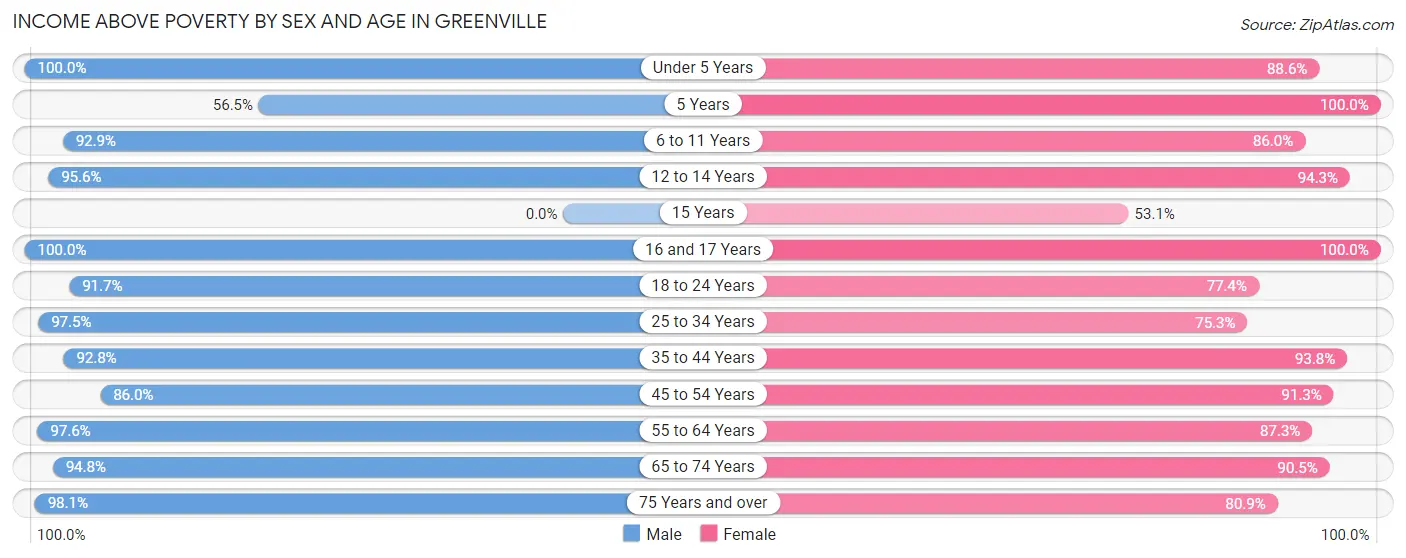
| Age Bracket | Male | Female |
| Under 5 Years | 208 (100.0%) | 412 (88.6%) |
| 5 Years | 26 (56.5%) | 23 (100.0%) |
| 6 to 11 Years | 210 (92.9%) | 319 (86.0%) |
| 12 to 14 Years | 218 (95.6%) | 149 (94.3%) |
| 15 Years | 0 (0.0%) | 26 (53.1%) |
| 16 and 17 Years | 36 (100.0%) | 162 (100.0%) |
| 18 to 24 Years | 365 (91.7%) | 274 (77.4%) |
| 25 to 34 Years | 579 (97.5%) | 441 (75.3%) |
| 35 to 44 Years | 758 (92.8%) | 544 (93.8%) |
| 45 to 54 Years | 251 (86.0%) | 492 (91.3%) |
| 55 to 64 Years | 328 (97.6%) | 330 (87.3%) |
| 65 to 74 Years | 617 (94.8%) | 421 (90.5%) |
| 75 Years and over | 208 (98.1%) | 406 (80.9%) |
| Total | 3,804 (93.5%) | 3,999 (86.3%) |
Income Below Poverty Among Married-Couple Families in Greenville
The poverty statistics for married-couple families in Greenville show that 4.7% or 55 of the total 1,169 families live below the poverty line. Families with 3 or 4 children have the highest poverty rate of 57.6%, comprising of 19 families. On the other hand, families with 5 or more children have the lowest poverty rate of 0.0%, which includes 0 families.
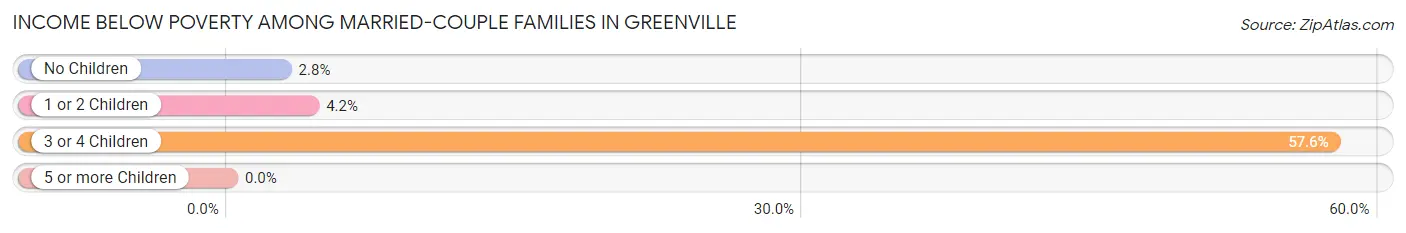
| Children | Above Poverty | Below Poverty |
| No Children | 625 (97.2%) | 18 (2.8%) |
| 1 or 2 Children | 407 (95.8%) | 18 (4.2%) |
| 3 or 4 Children | 14 (42.4%) | 19 (57.6%) |
| 5 or more Children | 68 (100.0%) | 0 (0.0%) |
| Total | 1,114 (95.3%) | 55 (4.7%) |
Income Below Poverty Among Single-Parent Households in Greenville
According to the poverty data in Greenville, 6.2% or 25 single-father households and 14.1% or 79 single-mother households are living below the poverty line. Among single-father households, those with 1 or 2 children have the highest poverty rate, with 25 households (12.4%) experiencing poverty. Likewise, among single-mother households, those with 1 or 2 children have the highest poverty rate, with 79 households (31.0%) falling below the poverty line.
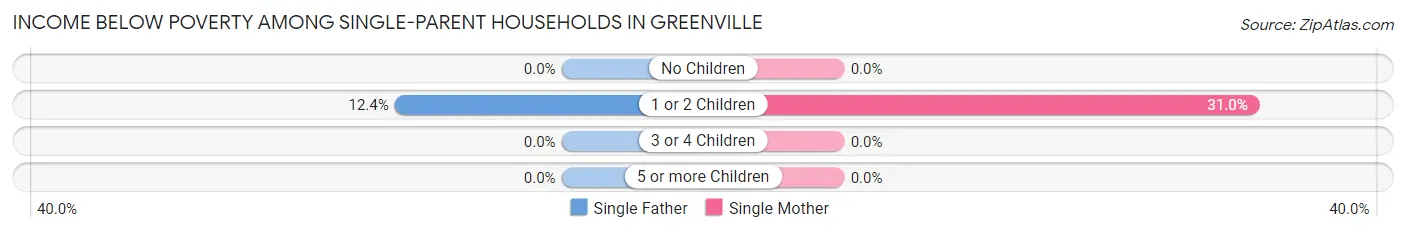
| Children | Single Father | Single Mother |
| No Children | 0 (0.0%) | 0 (0.0%) |
| 1 or 2 Children | 25 (12.4%) | 79 (31.0%) |
| 3 or 4 Children | 0 (0.0%) | 0 (0.0%) |
| 5 or more Children | 0 (0.0%) | 0 (0.0%) |
| Total | 25 (6.2%) | 79 (14.1%) |
Income Below Poverty Among Married-Couple vs Single-Parent Households in Greenville
The poverty data for Greenville shows that 55 of the married-couple family households (4.7%) and 104 of the single-parent households (10.8%) are living below the poverty level. Within the married-couple family households, those with 3 or 4 children have the highest poverty rate, with 19 households (57.6%) falling below the poverty line. Among the single-parent households, those with 1 or 2 children have the highest poverty rate, with 104 household (22.8%) living below poverty.
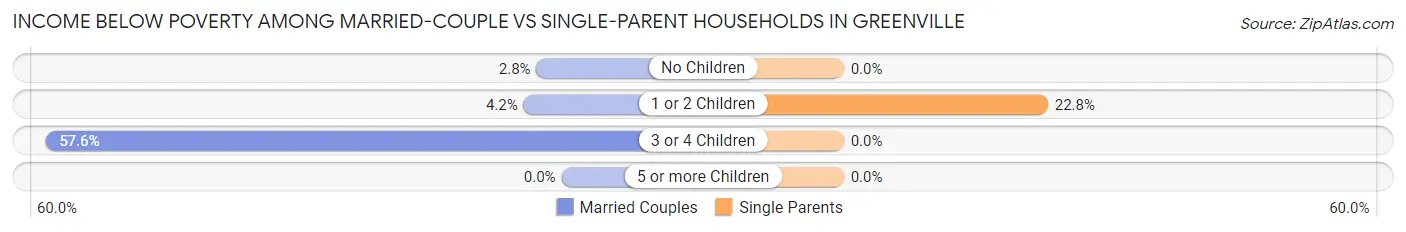
| Children | Married-Couple Families | Single-Parent Households |
| No Children | 18 (2.8%) | 0 (0.0%) |
| 1 or 2 Children | 18 (4.2%) | 104 (22.8%) |
| 3 or 4 Children | 19 (57.6%) | 0 (0.0%) |
| 5 or more Children | 0 (0.0%) | 0 (0.0%) |
| Total | 55 (4.7%) | 104 (10.8%) |
Race in Greenville
The most populous races in Greenville are White / Caucasian (8,017 | 90.4%), Two or more Races (520 | 5.9%), and Hispanic or Latino (445 | 5.0%).
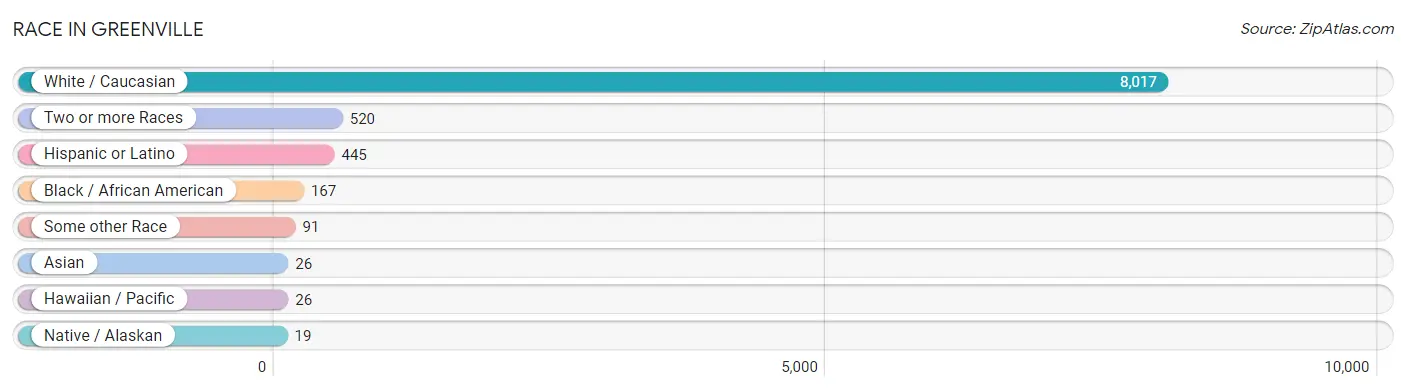
| Race | # Population | % Population |
| Asian | 26 | 0.3% |
| Black / African American | 167 | 1.9% |
| Hawaiian / Pacific | 26 | 0.3% |
| Hispanic or Latino | 445 | 5.0% |
| Native / Alaskan | 19 | 0.2% |
| White / Caucasian | 8,017 | 90.4% |
| Two or more Races | 520 | 5.9% |
| Some other Race | 91 | 1.0% |
| Total | 8,866 | 100.0% |
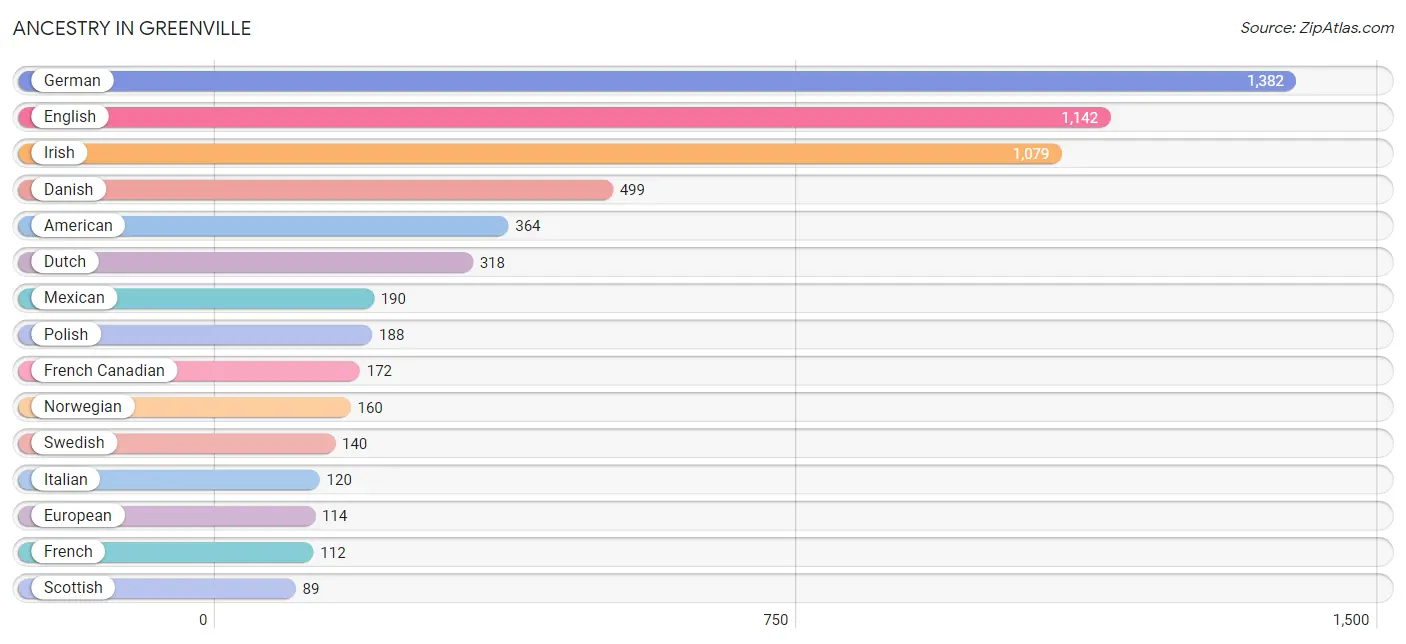
Ancestry in Greenville
The most populous ancestries reported in Greenville are German (1,382 | 15.6%), English (1,142 | 12.9%), Irish (1,079 | 12.2%), Danish (499 | 5.6%), and American (364 | 4.1%), together accounting for 50.4% of all Greenville residents.
| Ancestry | # Population | % Population |
| American | 364 | 4.1% |
| Arab | 61 | 0.7% |
| Austrian | 37 | 0.4% |
| Belgian | 56 | 0.6% |
| Bulgarian | 29 | 0.3% |
| Canadian | 11 | 0.1% |
| Cherokee | 3 | 0.0% |
| Chilean | 30 | 0.3% |
| Croatian | 44 | 0.5% |
| Czech | 41 | 0.5% |
| Czechoslovakian | 29 | 0.3% |
| Danish | 499 | 5.6% |
| Dutch | 318 | 3.6% |
| Eastern European | 14 | 0.2% |
| English | 1,142 | 12.9% |
| European | 114 | 1.3% |
| French | 112 | 1.3% |
| French Canadian | 172 | 1.9% |
| German | 1,382 | 15.6% |
| Irish | 1,079 | 12.2% |
| Italian | 120 | 1.3% |
| Korean | 34 | 0.4% |
| Lithuanian | 1 | 0.0% |
| Mexican | 190 | 2.1% |
| Native Hawaiian | 34 | 0.4% |
| Norwegian | 160 | 1.8% |
| Pennsylvania German | 17 | 0.2% |
| Polish | 188 | 2.1% |
| Puerto Rican | 58 | 0.6% |
| Scandinavian | 4 | 0.1% |
| Scotch-Irish | 11 | 0.1% |
| Scottish | 89 | 1.0% |
| South American | 30 | 0.3% |
| Sri Lankan | 26 | 0.3% |
| Swedish | 140 | 1.6% |
| Syrian | 61 | 0.7% |
| Ukrainian | 15 | 0.2% |
| Welsh | 18 | 0.2% |
| Yugoslavian | 44 | 0.5% | View All 39 Rows |
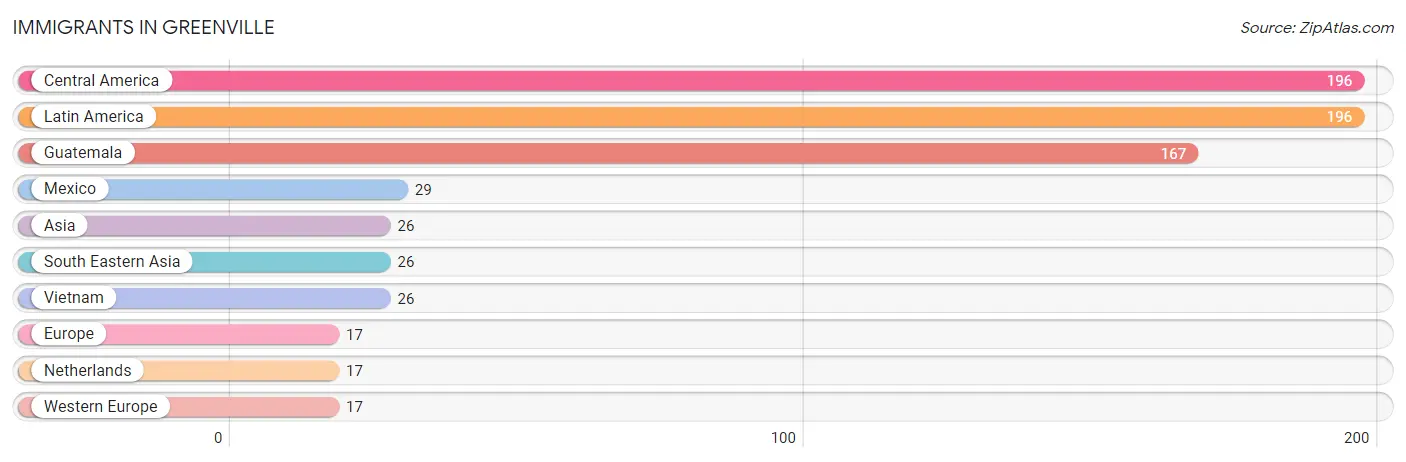
Immigrants in Greenville
The most numerous immigrant groups reported in Greenville came from Central America (196 | 2.2%), Latin America (196 | 2.2%), Guatemala (167 | 1.9%), Mexico (29 | 0.3%), and Asia (26 | 0.3%), together accounting for 6.9% of all Greenville residents.
| Immigration Origin | # Population | % Population |
| Asia | 26 | 0.3% |
| Central America | 196 | 2.2% |
| Europe | 17 | 0.2% |
| Guatemala | 167 | 1.9% |
| Latin America | 196 | 2.2% |
| Mexico | 29 | 0.3% |
| Netherlands | 17 | 0.2% |
| South Eastern Asia | 26 | 0.3% |
| Vietnam | 26 | 0.3% |
| Western Europe | 17 | 0.2% | View All 10 Rows |
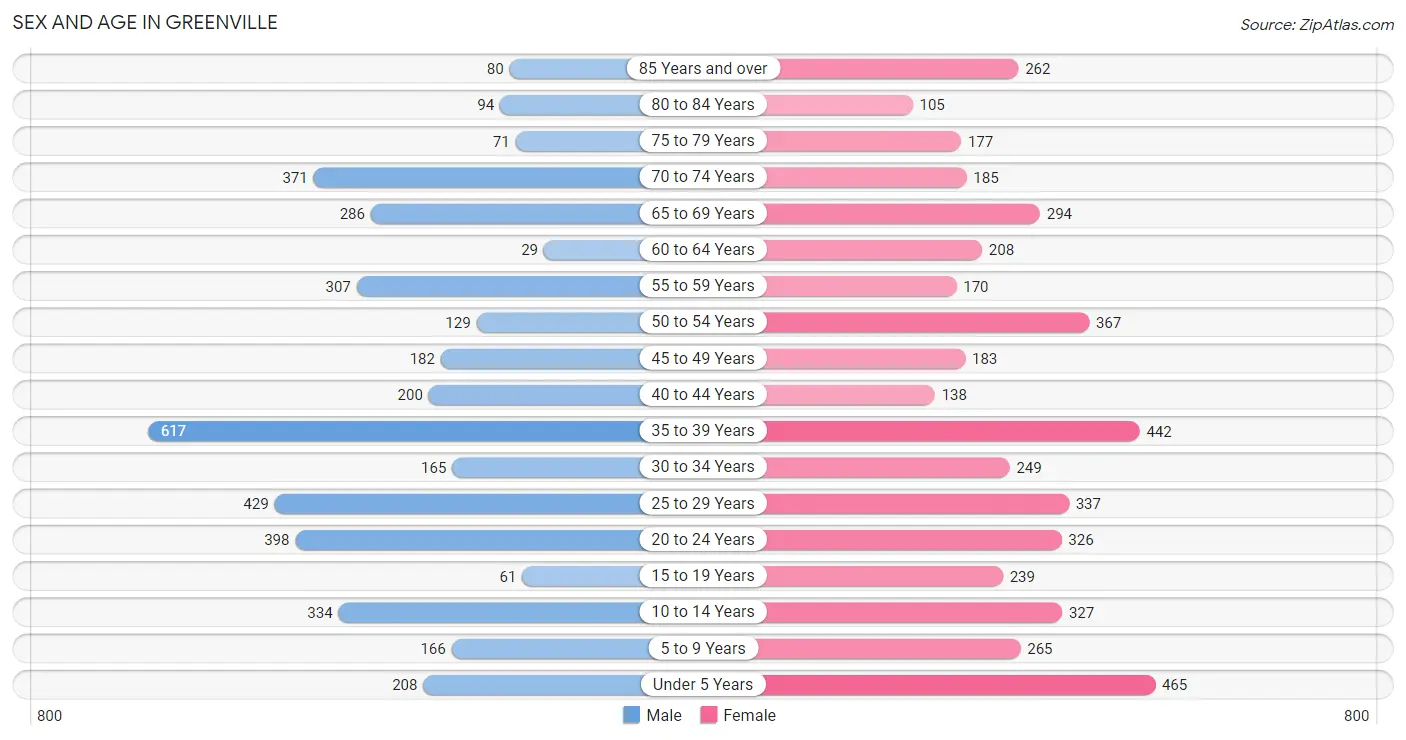
Sex and Age in Greenville
Sex and Age in Greenville
The most populous age groups in Greenville are 35 to 39 Years (617 | 14.9%) for men and Under 5 Years (465 | 9.8%) for women.
| Age Bracket | Male | Female |
| Under 5 Years | 208 (5.0%) | 465 (9.8%) |
| 5 to 9 Years | 166 (4.0%) | 265 (5.6%) |
| 10 to 14 Years | 334 (8.1%) | 327 (6.9%) |
| 15 to 19 Years | 61 (1.5%) | 239 (5.0%) |
| 20 to 24 Years | 398 (9.6%) | 326 (6.9%) |
| 25 to 29 Years | 429 (10.4%) | 337 (7.1%) |
| 30 to 34 Years | 165 (4.0%) | 249 (5.2%) |
| 35 to 39 Years | 617 (14.9%) | 442 (9.3%) |
| 40 to 44 Years | 200 (4.9%) | 138 (2.9%) |
| 45 to 49 Years | 182 (4.4%) | 183 (3.9%) |
| 50 to 54 Years | 129 (3.1%) | 367 (7.7%) |
| 55 to 59 Years | 307 (7.4%) | 170 (3.6%) |
| 60 to 64 Years | 29 (0.7%) | 208 (4.4%) |
| 65 to 69 Years | 286 (6.9%) | 294 (6.2%) |
| 70 to 74 Years | 371 (9.0%) | 185 (3.9%) |
| 75 to 79 Years | 71 (1.7%) | 177 (3.7%) |
| 80 to 84 Years | 94 (2.3%) | 105 (2.2%) |
| 85 Years and over | 80 (1.9%) | 262 (5.5%) |
| Total | 4,127 (100.0%) | 4,739 (100.0%) |
Families and Households in Greenville
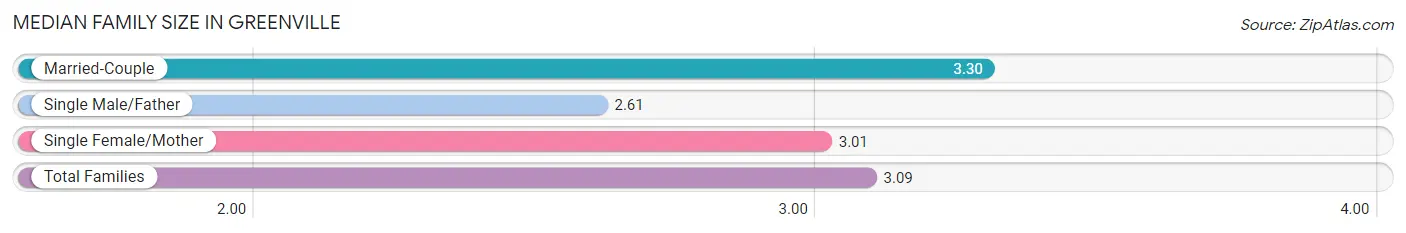
Median Family Size in Greenville
The median family size in Greenville is 3.09 persons per family, with married-couple families (1,169 | 54.8%) accounting for the largest median family size of 3.3 persons per family. On the other hand, single male/father families (403 | 18.9%) represent the smallest median family size with 2.61 persons per family.
| Family Type | # Families | Family Size |
| Married-Couple | 1,169 (54.8%) | 3.30 |
| Single Male/Father | 403 (18.9%) | 2.61 |
| Single Female/Mother | 560 (26.3%) | 3.01 |
| Total Families | 2,132 (100.0%) | 3.09 |
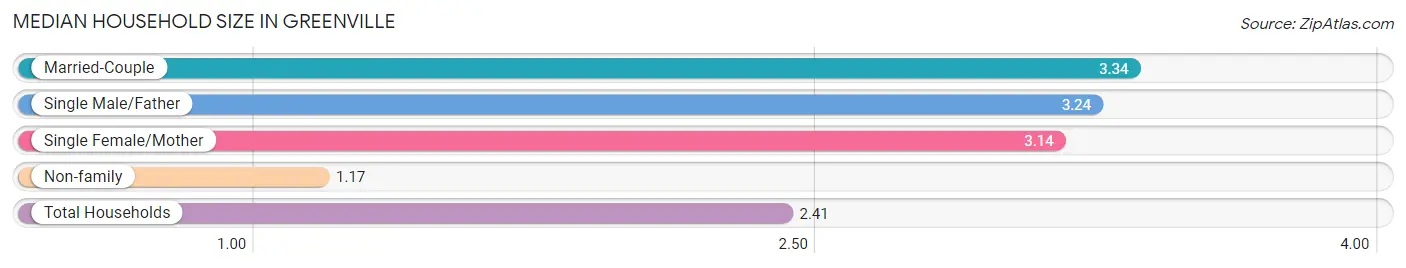
Median Household Size in Greenville
The median household size in Greenville is 2.41 persons per household, with married-couple households (1,169 | 32.5%) accounting for the largest median household size of 3.34 persons per household. non-family households (1,461 | 40.7%) represent the smallest median household size with 1.17 persons per household.
| Household Type | # Households | Household Size |
| Married-Couple | 1,169 (32.5%) | 3.34 |
| Single Male/Father | 403 (11.2%) | 3.24 |
| Single Female/Mother | 560 (15.6%) | 3.14 |
| Non-family | 1,461 (40.7%) | 1.17 |
| Total Households | 3,593 (100.0%) | 2.41 |
Household Size by Marriage Status in Greenville
Out of a total of 3,593 households in Greenville, 2,132 (59.3%) are family households, while 1,461 (40.7%) are nonfamily households. The most numerous type of family households are 2-person households, comprising 863, and the most common type of nonfamily households are 1-person households, comprising 1,282.
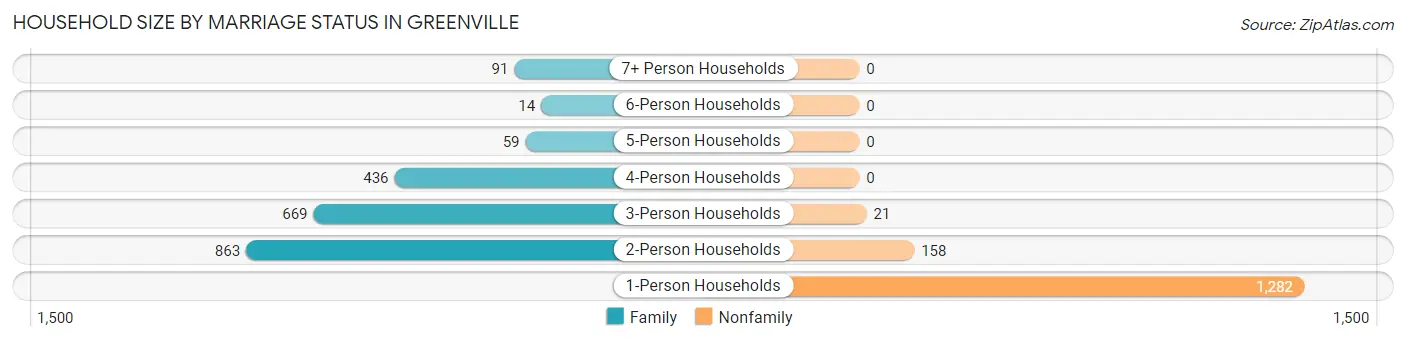
| Household Size | Family Households | Nonfamily Households |
| 1-Person Households | - | 1,282 (35.7%) |
| 2-Person Households | 863 (24.0%) | 158 (4.4%) |
| 3-Person Households | 669 (18.6%) | 21 (0.6%) |
| 4-Person Households | 436 (12.1%) | 0 (0.0%) |
| 5-Person Households | 59 (1.6%) | 0 (0.0%) |
| 6-Person Households | 14 (0.4%) | 0 (0.0%) |
| 7+ Person Households | 91 (2.5%) | 0 (0.0%) |
| Total | 2,132 (59.3%) | 1,461 (40.7%) |
Female Fertility in Greenville
Fertility by Age in Greenville
Average fertility rate in Greenville is 58.0 births per 1,000 women. Women in the age bracket of 35 to 50 years have the highest fertility rate with 87.0 births per 1,000 women. Women in the age bracket of 35 to 50 years acount for 64.1% of all women with births.
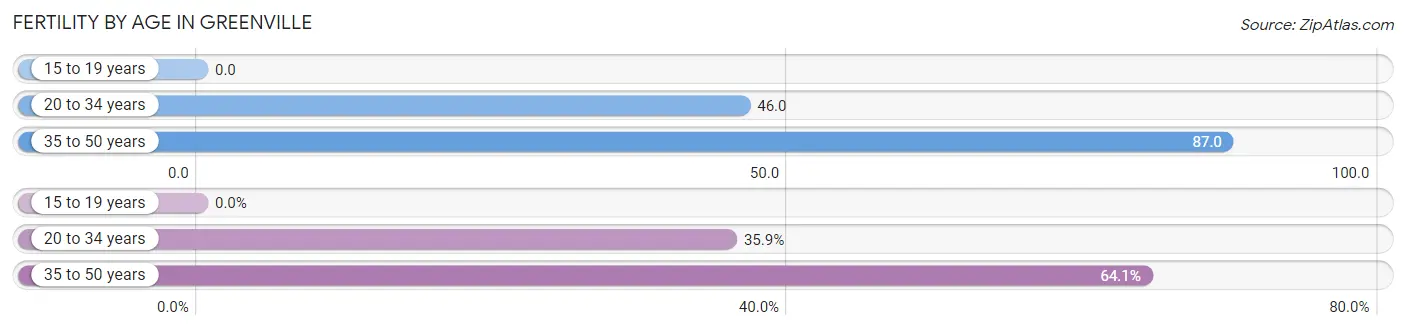
| Age Bracket | Women with Births | Births / 1,000 Women |
| 15 to 19 years | 0 (0.0%) | 0.0 |
| 20 to 34 years | 42 (35.9%) | 46.0 |
| 35 to 50 years | 75 (64.1%) | 87.0 |
| Total | 117 (100.0%) | 58.0 |
Fertility by Age by Marriage Status in Greenville
74.4% of women with births (117) in Greenville are married. The highest percentage of unmarried women with births falls into 20 to 34 years age bracket with 71.4% of them unmarried at the time of birth, while the lowest percentage of unmarried women with births belong to 35 to 50 years age bracket with 0.0% of them unmarried.
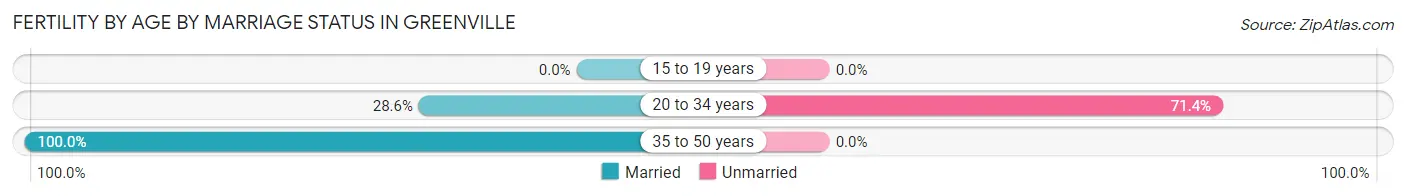
| Age Bracket | Married | Unmarried |
| 15 to 19 years | 0 (0.0%) | 0 (0.0%) |
| 20 to 34 years | 12 (28.6%) | 30 (71.4%) |
| 35 to 50 years | 75 (100.0%) | 0 (0.0%) |
| Total | 87 (74.4%) | 30 (25.6%) |
Fertility by Education in Greenville
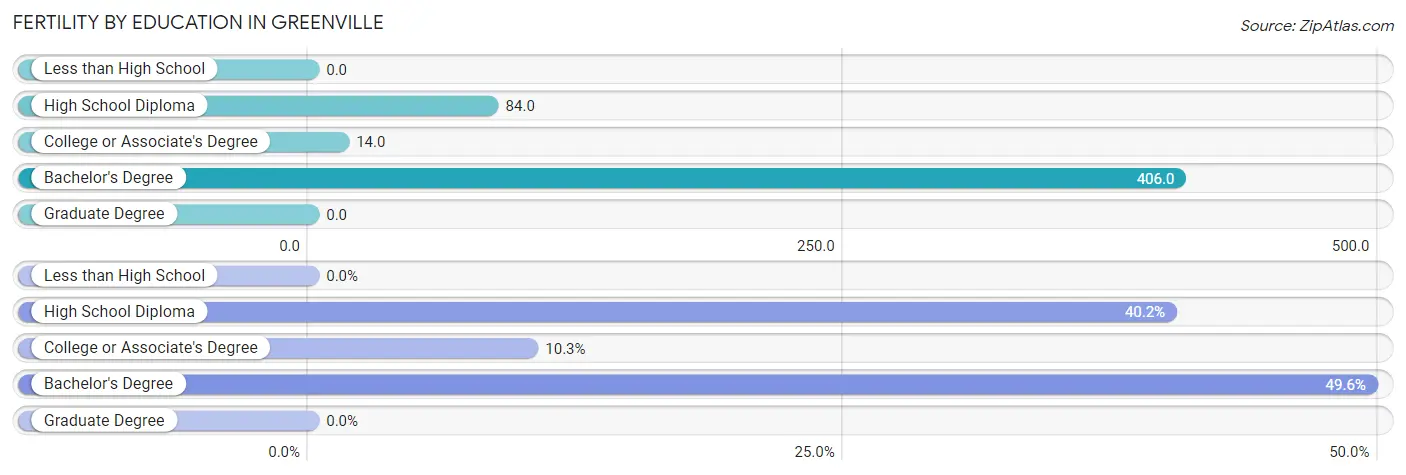
| Educational Attainment | Women with Births | Births / 1,000 Women |
| Less than High School | 0 (0.0%) | 0.0 |
| High School Diploma | 47 (40.2%) | 84.0 |
| College or Associate's Degree | 12 (10.3%) | 14.0 |
| Bachelor's Degree | 58 (49.6%) | 406.0 |
| Graduate Degree | 0 (0.0%) | 0.0 |
| Total | 117 (100.0%) | 58.0 |
Fertility by Education by Marriage Status in Greenville
25.6% of women with births in Greenville are unmarried. Women with the educational attainment of college or associate's degree are most likely to be married with 100.0% of them married at childbirth, while women with the educational attainment of high school diploma are least likely to be married with 63.8% of them unmarried at childbirth.
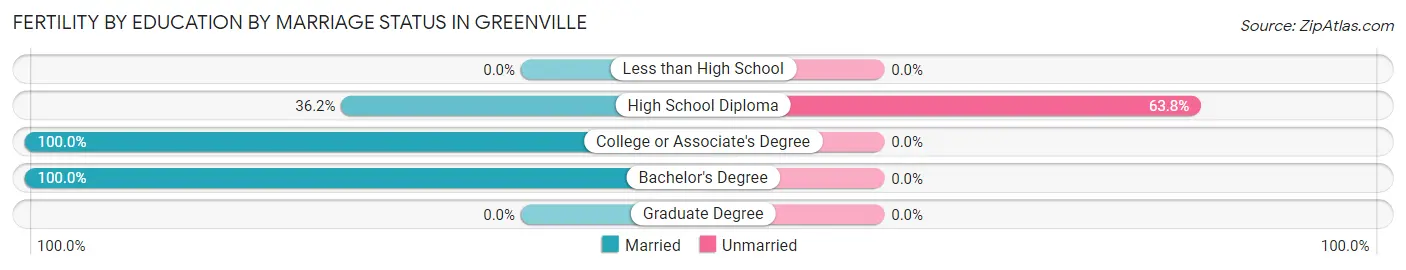
| Educational Attainment | Married | Unmarried |
| Less than High School | 0 (0.0%) | 0 (0.0%) |
| High School Diploma | 17 (36.2%) | 30 (63.8%) |
| College or Associate's Degree | 12 (100.0%) | 0 (0.0%) |
| Bachelor's Degree | 58 (100.0%) | 0 (0.0%) |
| Graduate Degree | 0 (0.0%) | 0 (0.0%) |
| Total | 87 (74.4%) | 30 (25.6%) |
Employment Characteristics in Greenville
Employment by Class of Employer in Greenville
Among the 3,921 employed individuals in Greenville, private company employees (3,128 | 79.8%), not-for-profit organizations (350 | 8.9%), and local government employees (271 | 6.9%) make up the most common classes of employment.
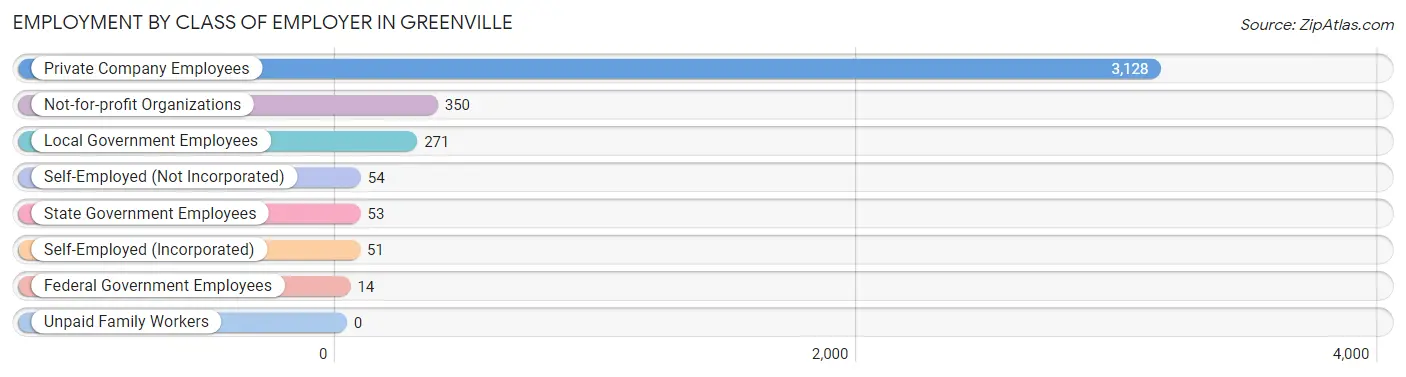
| Employer Class | # Employees | % Employees |
| Private Company Employees | 3,128 | 79.8% |
| Self-Employed (Incorporated) | 51 | 1.3% |
| Self-Employed (Not Incorporated) | 54 | 1.4% |
| Not-for-profit Organizations | 350 | 8.9% |
| Local Government Employees | 271 | 6.9% |
| State Government Employees | 53 | 1.3% |
| Federal Government Employees | 14 | 0.4% |
| Unpaid Family Workers | 0 | 0.0% |
| Total | 3,921 | 100.0% |
Employment Status by Age in Greenville
According to the labor force statistics for Greenville, out of the total population over 16 years of age (7,027), 59.4% or 4,174 individuals are in the labor force, with 5.8% or 242 of them unemployed. The age group with the highest labor force participation rate is 25 to 29 years, with 92.0% or 705 individuals in the labor force. Within the labor force, the 35 to 44 years age range has the highest percentage of unemployed individuals, with 14.6% or 160 of them being unemployed.
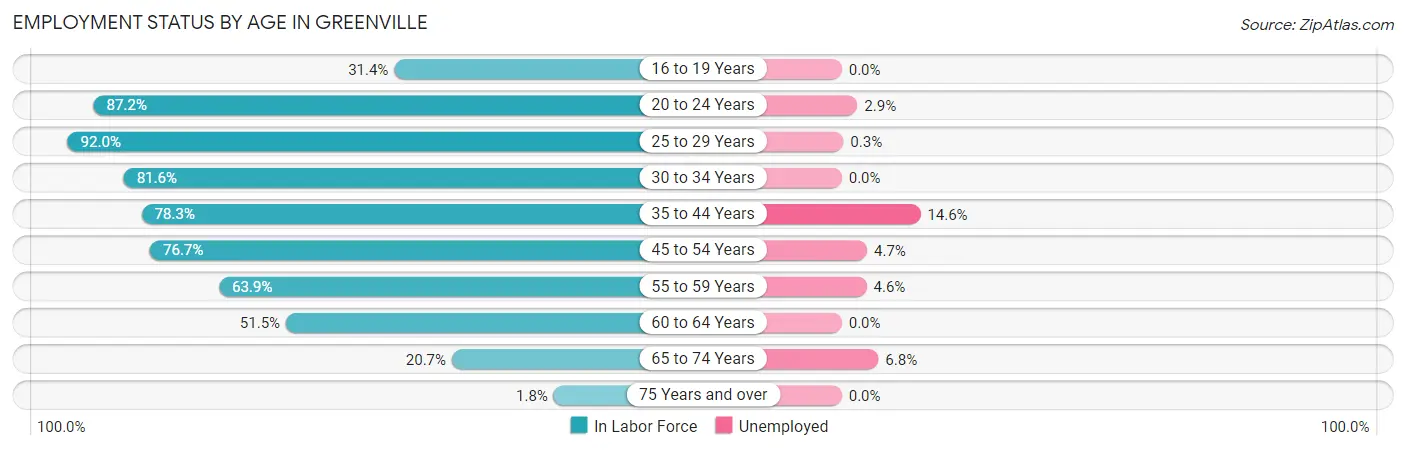
| Age Bracket | In Labor Force | Unemployed |
| 16 to 19 Years | 71 (31.4%) | 0 (0.0%) |
| 20 to 24 Years | 631 (87.2%) | 18 (2.9%) |
| 25 to 29 Years | 705 (92.0%) | 2 (0.3%) |
| 30 to 34 Years | 338 (81.6%) | 0 (0.0%) |
| 35 to 44 Years | 1,094 (78.3%) | 160 (14.6%) |
| 45 to 54 Years | 660 (76.7%) | 31 (4.7%) |
| 55 to 59 Years | 305 (63.9%) | 14 (4.6%) |
| 60 to 64 Years | 122 (51.5%) | 0 (0.0%) |
| 65 to 74 Years | 235 (20.7%) | 16 (6.8%) |
| 75 Years and over | 14 (1.8%) | 0 (0.0%) |
| Total | 4,174 (59.4%) | 242 (5.8%) |
Employment Status by Educational Attainment in Greenville
According to labor force statistics for Greenville, 77.6% of individuals (3,222) out of the total population between 25 and 64 years of age (4,152) are in the labor force, with 6.4% or 206 of them being unemployed. The group with the highest labor force participation rate are those with the educational attainment of college / associate degree, with 84.2% or 1,303 individuals in the labor force. Within the labor force, individuals with college / associate degree education have the highest percentage of unemployment, with 12.4% or 162 of them being unemployed.
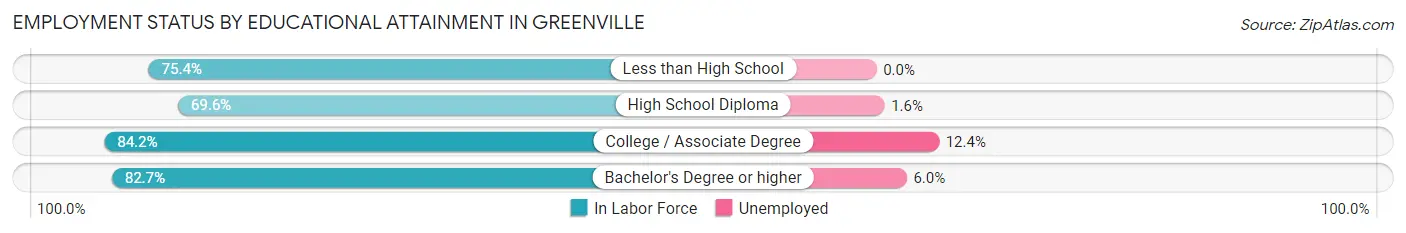
| Educational Attainment | In Labor Force | Unemployed |
| Less than High School | 410 (75.4%) | 0 (0.0%) |
| High School Diploma | 1,024 (69.6%) | 24 (1.6%) |
| College / Associate Degree | 1,303 (84.2%) | 192 (12.4%) |
| Bachelor's Degree or higher | 487 (82.7%) | 35 (6.0%) |
| Total | 3,222 (77.6%) | 266 (6.4%) |
Employment Occupations by Sex in Greenville
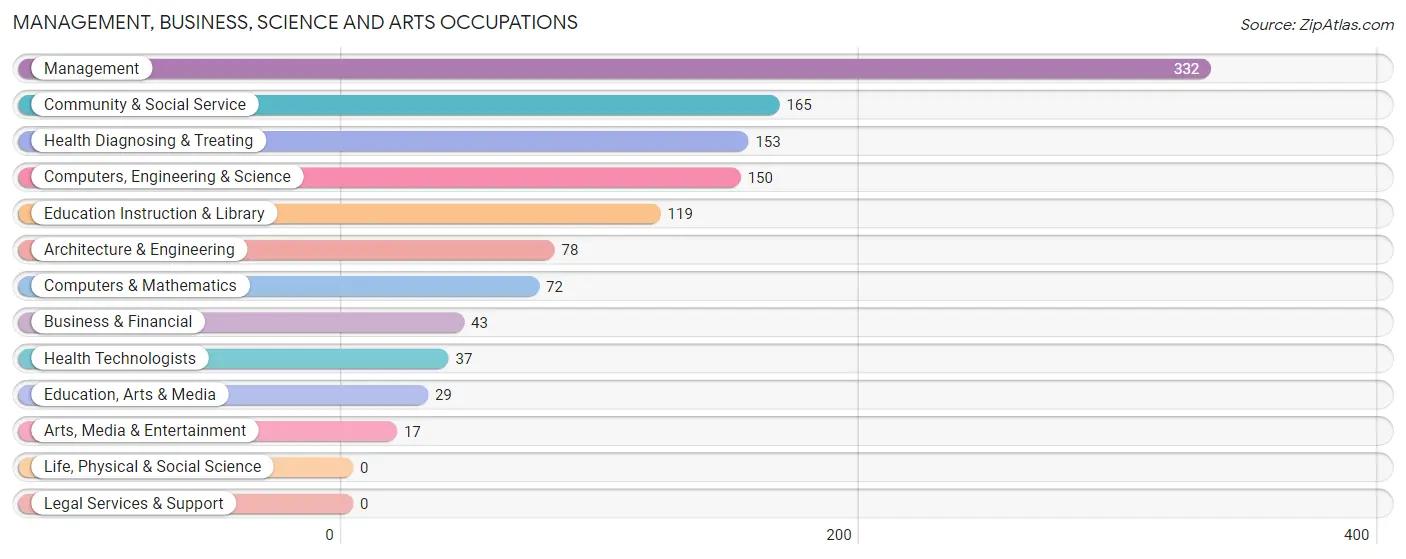
Management, Business, Science and Arts Occupations
The most common Management, Business, Science and Arts occupations in Greenville are Management (332 | 8.4%), Community & Social Service (165 | 4.2%), Health Diagnosing & Treating (153 | 3.9%), Computers, Engineering & Science (150 | 3.8%), and Education Instruction & Library (119 | 3.0%).
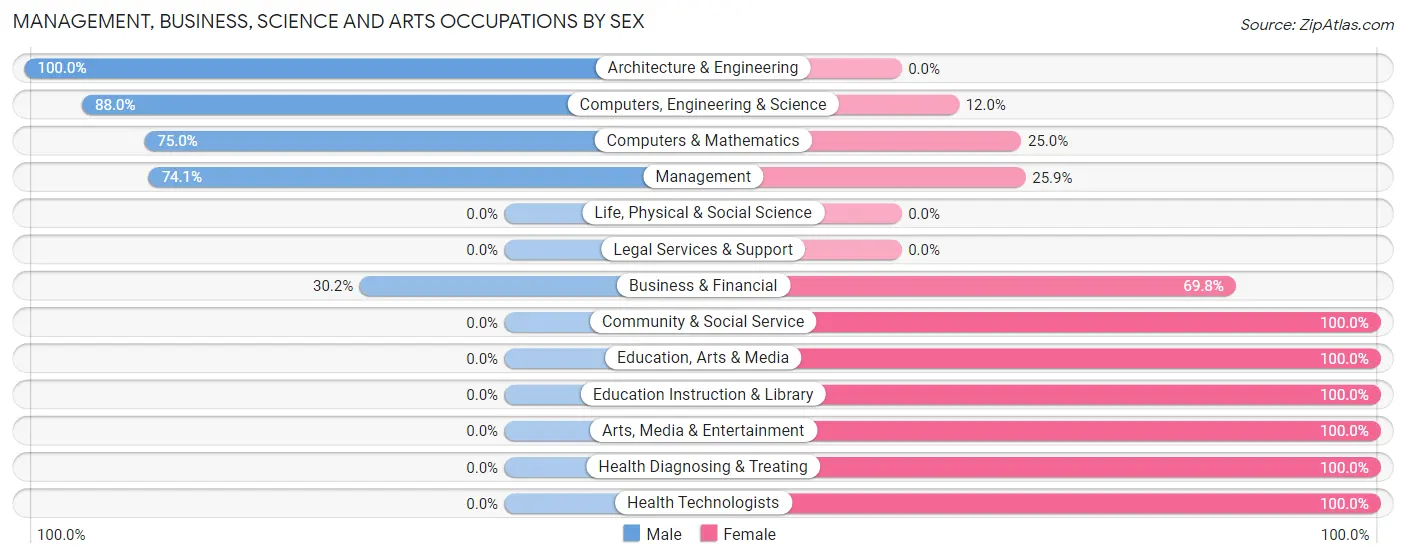
Management, Business, Science and Arts Occupations by Sex
Within the Management, Business, Science and Arts occupations in Greenville, the most male-oriented occupations are Architecture & Engineering (100.0%), Computers, Engineering & Science (88.0%), and Computers & Mathematics (75.0%), while the most female-oriented occupations are Community & Social Service (100.0%), Education, Arts & Media (100.0%), and Education Instruction & Library (100.0%).
| Occupation | Male | Female |
| Management | 246 (74.1%) | 86 (25.9%) |
| Business & Financial | 13 (30.2%) | 30 (69.8%) |
| Computers, Engineering & Science | 132 (88.0%) | 18 (12.0%) |
| Computers & Mathematics | 54 (75.0%) | 18 (25.0%) |
| Architecture & Engineering | 78 (100.0%) | 0 (0.0%) |
| Life, Physical & Social Science | 0 (0.0%) | 0 (0.0%) |
| Community & Social Service | 0 (0.0%) | 165 (100.0%) |
| Education, Arts & Media | 0 (0.0%) | 29 (100.0%) |
| Legal Services & Support | 0 (0.0%) | 0 (0.0%) |
| Education Instruction & Library | 0 (0.0%) | 119 (100.0%) |
| Arts, Media & Entertainment | 0 (0.0%) | 17 (100.0%) |
| Health Diagnosing & Treating | 0 (0.0%) | 153 (100.0%) |
| Health Technologists | 0 (0.0%) | 37 (100.0%) |
| Total (Category) | 391 (46.4%) | 452 (53.6%) |
| Total (Overall) | 2,194 (55.8%) | 1,740 (44.2%) |
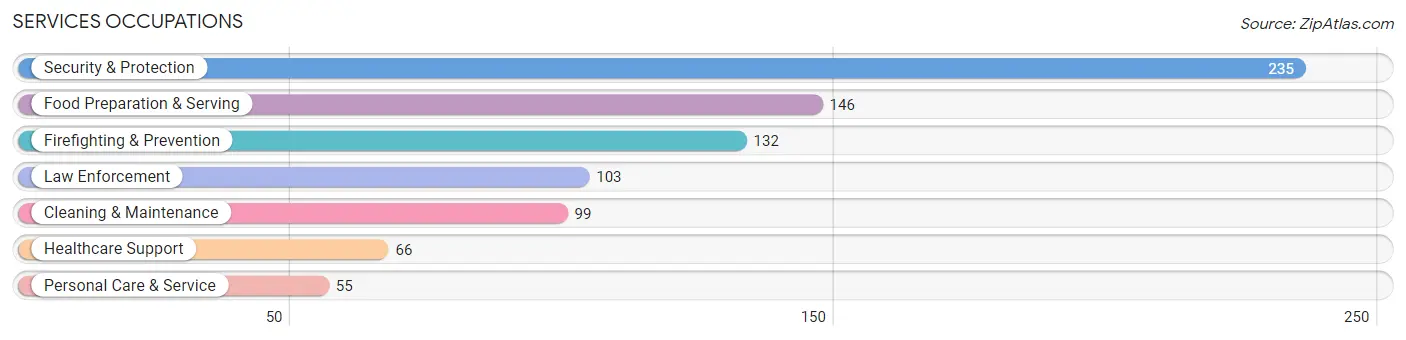
Services Occupations
The most common Services occupations in Greenville are Security & Protection (235 | 6.0%), Food Preparation & Serving (146 | 3.7%), Firefighting & Prevention (132 | 3.4%), Law Enforcement (103 | 2.6%), and Cleaning & Maintenance (99 | 2.5%).
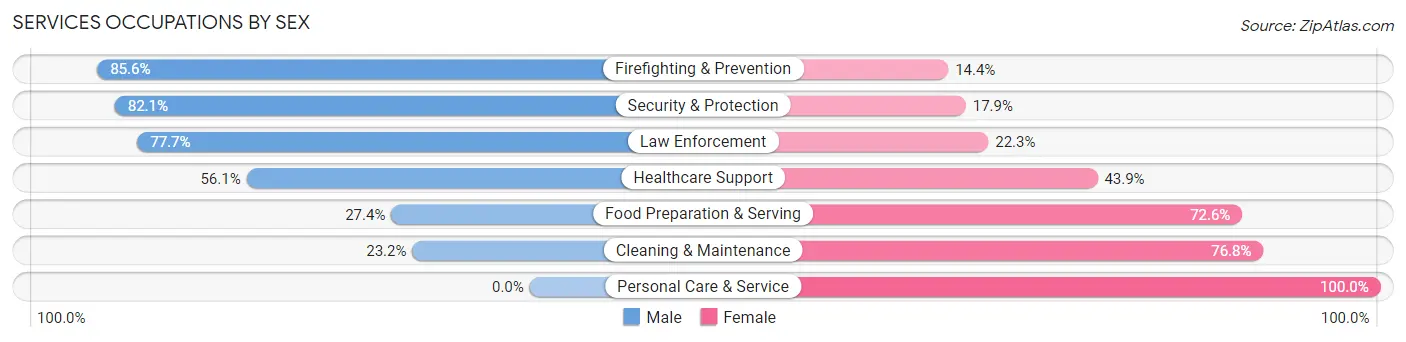
Services Occupations by Sex
Within the Services occupations in Greenville, the most male-oriented occupations are Firefighting & Prevention (85.6%), Security & Protection (82.1%), and Law Enforcement (77.7%), while the most female-oriented occupations are Personal Care & Service (100.0%), Cleaning & Maintenance (76.8%), and Food Preparation & Serving (72.6%).
| Occupation | Male | Female |
| Healthcare Support | 37 (56.1%) | 29 (43.9%) |
| Security & Protection | 193 (82.1%) | 42 (17.9%) |
| Firefighting & Prevention | 113 (85.6%) | 19 (14.4%) |
| Law Enforcement | 80 (77.7%) | 23 (22.3%) |
| Food Preparation & Serving | 40 (27.4%) | 106 (72.6%) |
| Cleaning & Maintenance | 23 (23.2%) | 76 (76.8%) |
| Personal Care & Service | 0 (0.0%) | 55 (100.0%) |
| Total (Category) | 293 (48.7%) | 308 (51.2%) |
| Total (Overall) | 2,194 (55.8%) | 1,740 (44.2%) |
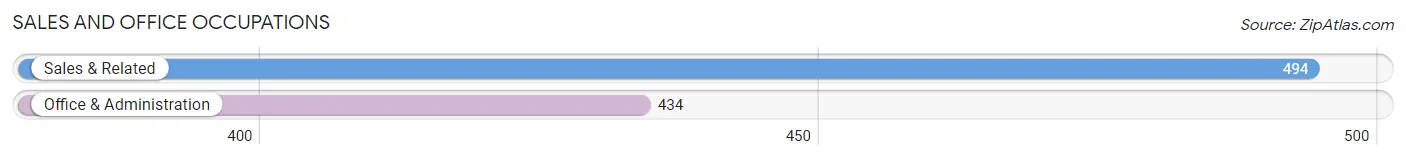
Sales and Office Occupations
The most common Sales and Office occupations in Greenville are Sales & Related (494 | 12.6%), and Office & Administration (434 | 11.0%).
Sales and Office Occupations by Sex
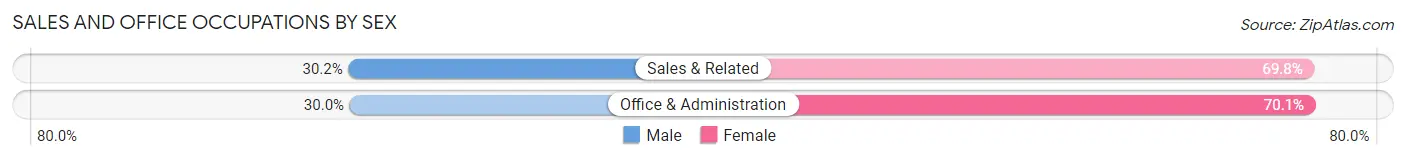
| Occupation | Male | Female |
| Sales & Related | 149 (30.2%) | 345 (69.8%) |
| Office & Administration | 130 (29.9%) | 304 (70.1%) |
| Total (Category) | 279 (30.1%) | 649 (69.9%) |
| Total (Overall) | 2,194 (55.8%) | 1,740 (44.2%) |
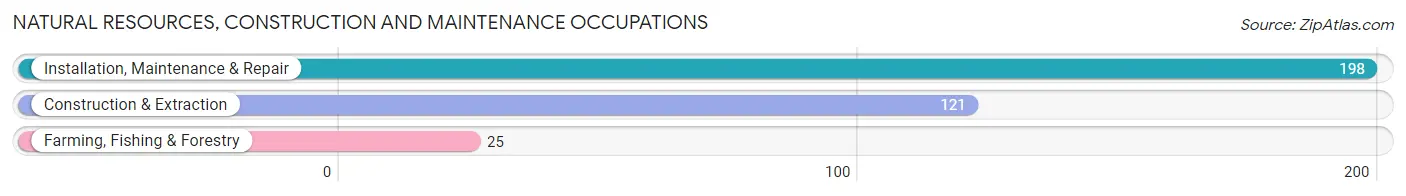
Natural Resources, Construction and Maintenance Occupations
The most common Natural Resources, Construction and Maintenance occupations in Greenville are Installation, Maintenance & Repair (198 | 5.0%), Construction & Extraction (121 | 3.1%), and Farming, Fishing & Forestry (25 | 0.6%).
Natural Resources, Construction and Maintenance Occupations by Sex
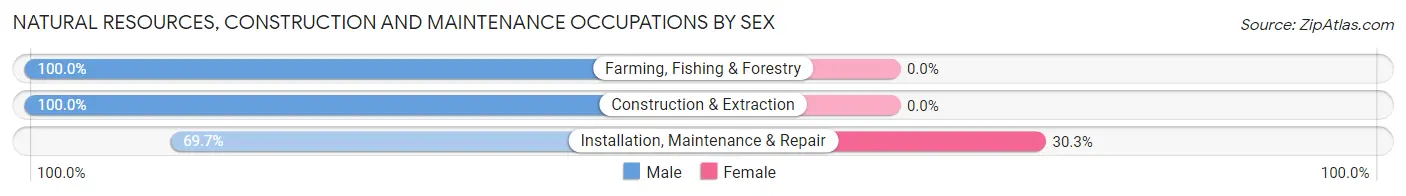
| Occupation | Male | Female |
| Farming, Fishing & Forestry | 25 (100.0%) | 0 (0.0%) |
| Construction & Extraction | 121 (100.0%) | 0 (0.0%) |
| Installation, Maintenance & Repair | 138 (69.7%) | 60 (30.3%) |
| Total (Category) | 284 (82.6%) | 60 (17.4%) |
| Total (Overall) | 2,194 (55.8%) | 1,740 (44.2%) |
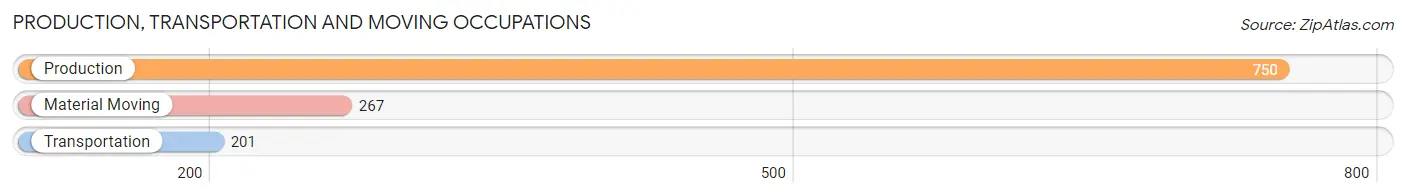
Production, Transportation and Moving Occupations
The most common Production, Transportation and Moving occupations in Greenville are Production (750 | 19.1%), Material Moving (267 | 6.8%), and Transportation (201 | 5.1%).
Production, Transportation and Moving Occupations by Sex
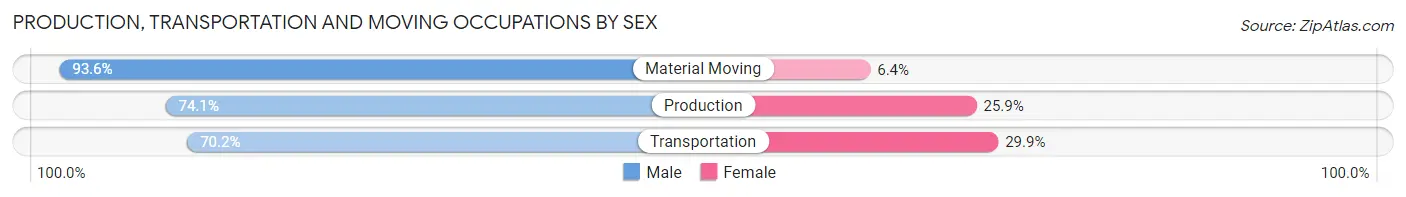
| Occupation | Male | Female |
| Production | 556 (74.1%) | 194 (25.9%) |
| Transportation | 141 (70.2%) | 60 (29.8%) |
| Material Moving | 250 (93.6%) | 17 (6.4%) |
| Total (Category) | 947 (77.7%) | 271 (22.3%) |
| Total (Overall) | 2,194 (55.8%) | 1,740 (44.2%) |
Employment Industries by Sex in Greenville
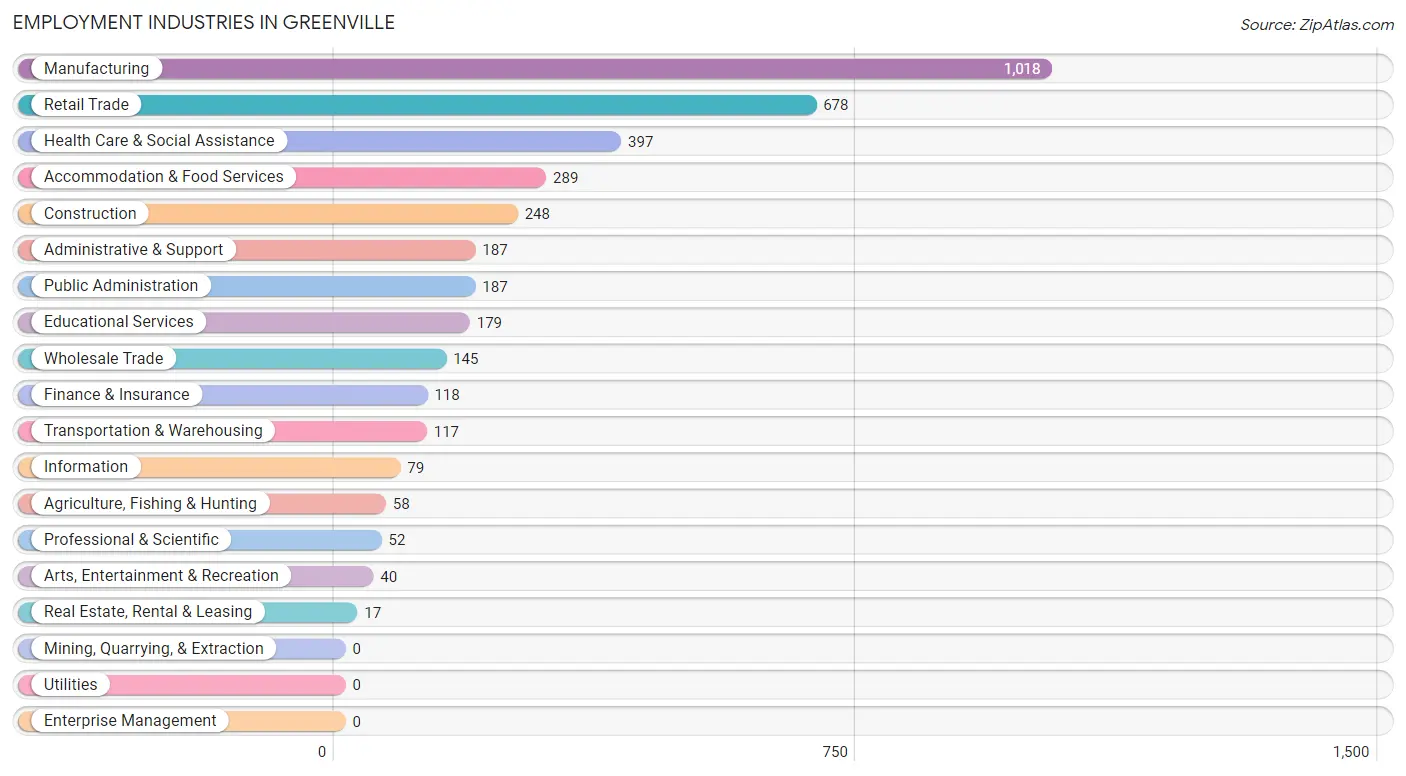
Employment Industries in Greenville
The major employment industries in Greenville include Manufacturing (1,018 | 25.9%), Retail Trade (678 | 17.2%), Health Care & Social Assistance (397 | 10.1%), Accommodation & Food Services (289 | 7.3%), and Construction (248 | 6.3%).
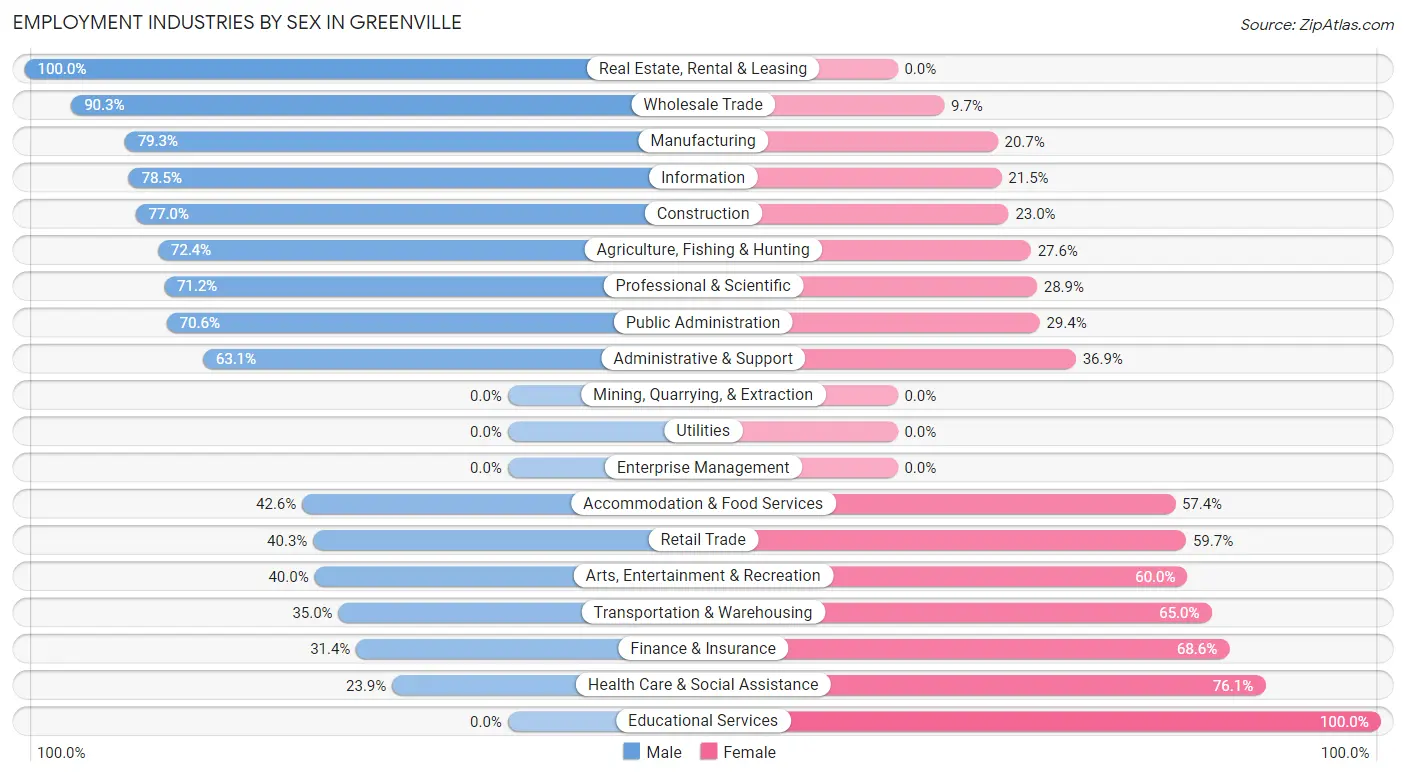
Employment Industries by Sex in Greenville
The Greenville industries that see more men than women are Real Estate, Rental & Leasing (100.0%), Wholesale Trade (90.3%), and Manufacturing (79.3%), whereas the industries that tend to have a higher number of women are Educational Services (100.0%), Health Care & Social Assistance (76.1%), and Finance & Insurance (68.6%).
| Industry | Male | Female |
| Agriculture, Fishing & Hunting | 42 (72.4%) | 16 (27.6%) |
| Mining, Quarrying, & Extraction | 0 (0.0%) | 0 (0.0%) |
| Construction | 191 (77.0%) | 57 (23.0%) |
| Manufacturing | 807 (79.3%) | 211 (20.7%) |
| Wholesale Trade | 131 (90.3%) | 14 (9.7%) |
| Retail Trade | 273 (40.3%) | 405 (59.7%) |
| Transportation & Warehousing | 41 (35.0%) | 76 (65.0%) |
| Utilities | 0 (0.0%) | 0 (0.0%) |
| Information | 62 (78.5%) | 17 (21.5%) |
| Finance & Insurance | 37 (31.4%) | 81 (68.6%) |
| Real Estate, Rental & Leasing | 17 (100.0%) | 0 (0.0%) |
| Professional & Scientific | 37 (71.2%) | 15 (28.8%) |
| Enterprise Management | 0 (0.0%) | 0 (0.0%) |
| Administrative & Support | 118 (63.1%) | 69 (36.9%) |
| Educational Services | 0 (0.0%) | 179 (100.0%) |
| Health Care & Social Assistance | 95 (23.9%) | 302 (76.1%) |
| Arts, Entertainment & Recreation | 16 (40.0%) | 24 (60.0%) |
| Accommodation & Food Services | 123 (42.6%) | 166 (57.4%) |
| Public Administration | 132 (70.6%) | 55 (29.4%) |
| Total | 2,194 (55.8%) | 1,740 (44.2%) |
Education in Greenville
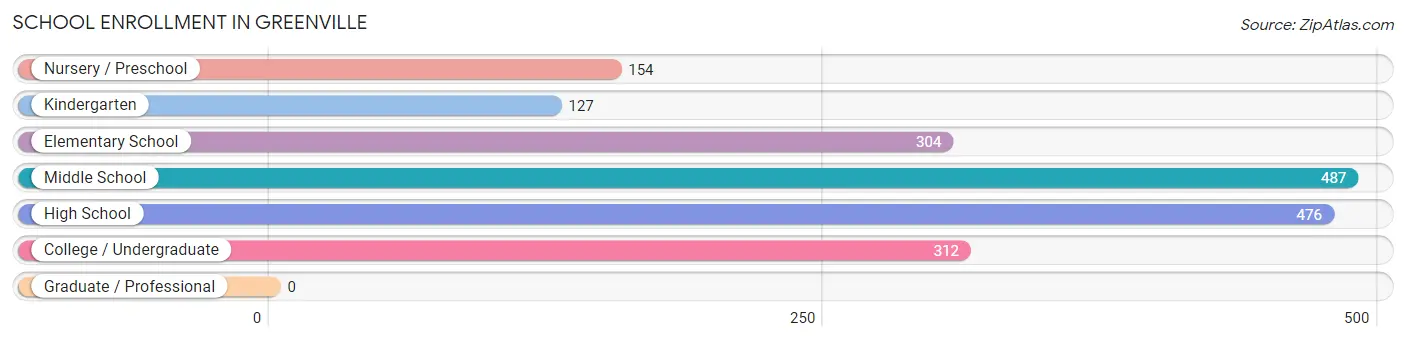
School Enrollment in Greenville
The most common levels of schooling among the 1,860 students in Greenville are middle school (487 | 26.2%), high school (476 | 25.6%), and college / undergraduate (312 | 16.8%).
| School Level | # Students | % Students |
| Nursery / Preschool | 154 | 8.3% |
| Kindergarten | 127 | 6.8% |
| Elementary School | 304 | 16.3% |
| Middle School | 487 | 26.2% |
| High School | 476 | 25.6% |
| College / Undergraduate | 312 | 16.8% |
| Graduate / Professional | 0 | 0.0% |
| Total | 1,860 | 100.0% |
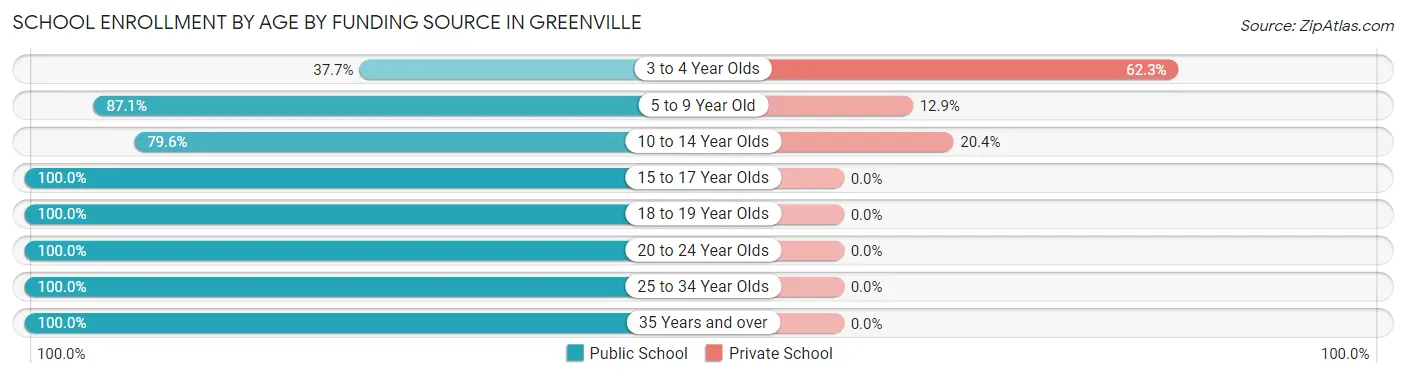
School Enrollment by Age by Funding Source in Greenville
Out of a total of 1,860 students who are enrolled in schools in Greenville, 281 (15.1%) attend a private institution, while the remaining 1,579 (84.9%) are enrolled in public schools. The age group of 3 to 4 year olds has the highest likelihood of being enrolled in private schools, with 96 (62.3% in the age bracket) enrolled. Conversely, the age group of 15 to 17 year olds has the lowest likelihood of being enrolled in a private school, with 272 (100.0% in the age bracket) attending a public institution.
| Age Bracket | Public School | Private School |
| 3 to 4 Year Olds | 58 (37.7%) | 96 (62.3%) |
| 5 to 9 Year Old | 332 (87.1%) | 49 (12.9%) |
| 10 to 14 Year Olds | 526 (79.6%) | 135 (20.4%) |
| 15 to 17 Year Olds | 272 (100.0%) | 0 (0.0%) |
| 18 to 19 Year Olds | 28 (100.0%) | 0 (0.0%) |
| 20 to 24 Year Olds | 171 (100.0%) | 0 (0.0%) |
| 25 to 34 Year Olds | 73 (100.0%) | 0 (0.0%) |
| 35 Years and over | 120 (100.0%) | 0 (0.0%) |
| Total | 1,579 (84.9%) | 281 (15.1%) |
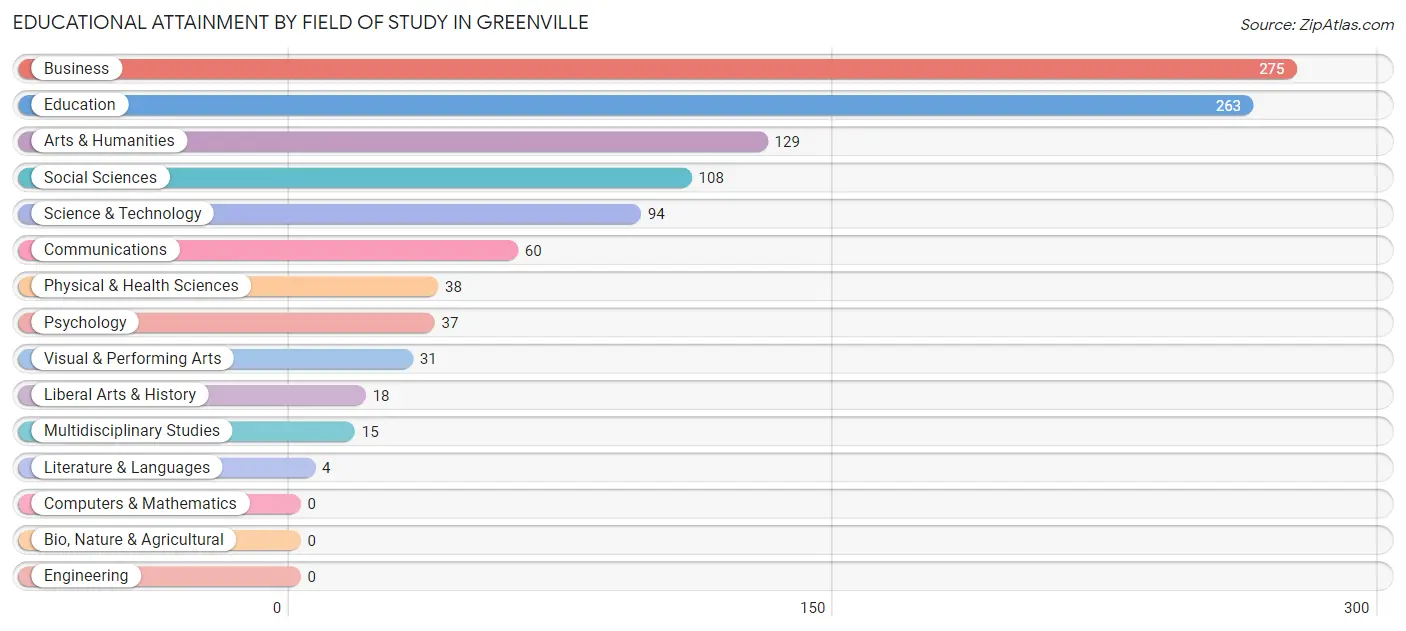
Educational Attainment by Field of Study in Greenville
Business (275 | 25.7%), education (263 | 24.5%), arts & humanities (129 | 12.0%), social sciences (108 | 10.1%), and science & technology (94 | 8.8%) are the most common fields of study among 1,072 individuals in Greenville who have obtained a bachelor's degree or higher.
| Field of Study | # Graduates | % Graduates |
| Computers & Mathematics | 0 | 0.0% |
| Bio, Nature & Agricultural | 0 | 0.0% |
| Physical & Health Sciences | 38 | 3.5% |
| Psychology | 37 | 3.5% |
| Social Sciences | 108 | 10.1% |
| Engineering | 0 | 0.0% |
| Multidisciplinary Studies | 15 | 1.4% |
| Science & Technology | 94 | 8.8% |
| Business | 275 | 25.7% |
| Education | 263 | 24.5% |
| Literature & Languages | 4 | 0.4% |
| Liberal Arts & History | 18 | 1.7% |
| Visual & Performing Arts | 31 | 2.9% |
| Communications | 60 | 5.6% |
| Arts & Humanities | 129 | 12.0% |
| Total | 1,072 | 100.0% |
Transportation & Commute in Greenville
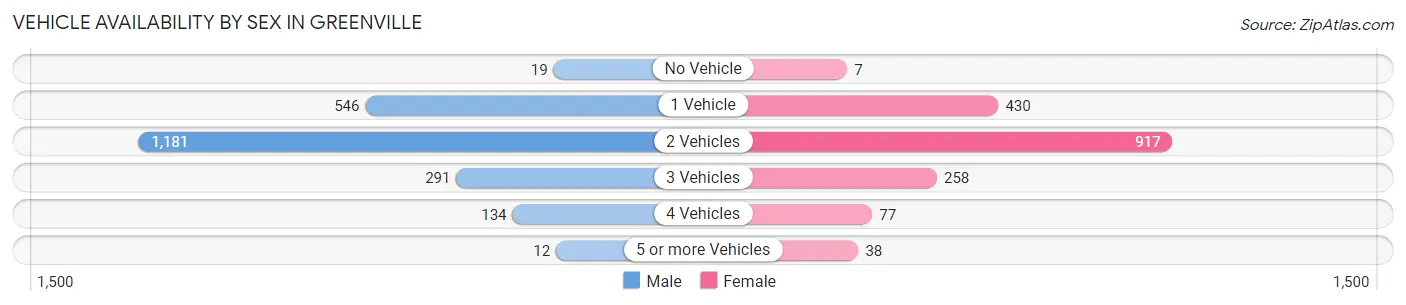
Vehicle Availability by Sex in Greenville
The most prevalent vehicle ownership categories in Greenville are males with 2 vehicles (1,181, accounting for 54.1%) and females with 2 vehicles (917, making up 68.4%).
| Vehicles Available | Male | Female |
| No Vehicle | 19 (0.9%) | 7 (0.4%) |
| 1 Vehicle | 546 (25.0%) | 430 (24.9%) |
| 2 Vehicles | 1,181 (54.1%) | 917 (53.1%) |
| 3 Vehicles | 291 (13.3%) | 258 (14.9%) |
| 4 Vehicles | 134 (6.1%) | 77 (4.5%) |
| 5 or more Vehicles | 12 (0.5%) | 38 (2.2%) |
| Total | 2,183 (100.0%) | 1,727 (100.0%) |
Commute Time in Greenville
The most frequently occuring commute durations in Greenville are 5 to 9 minutes (1,014 commuters, 26.6%), 45 to 59 minutes (658 commuters, 17.2%), and less than 5 minutes (531 commuters, 13.9%).
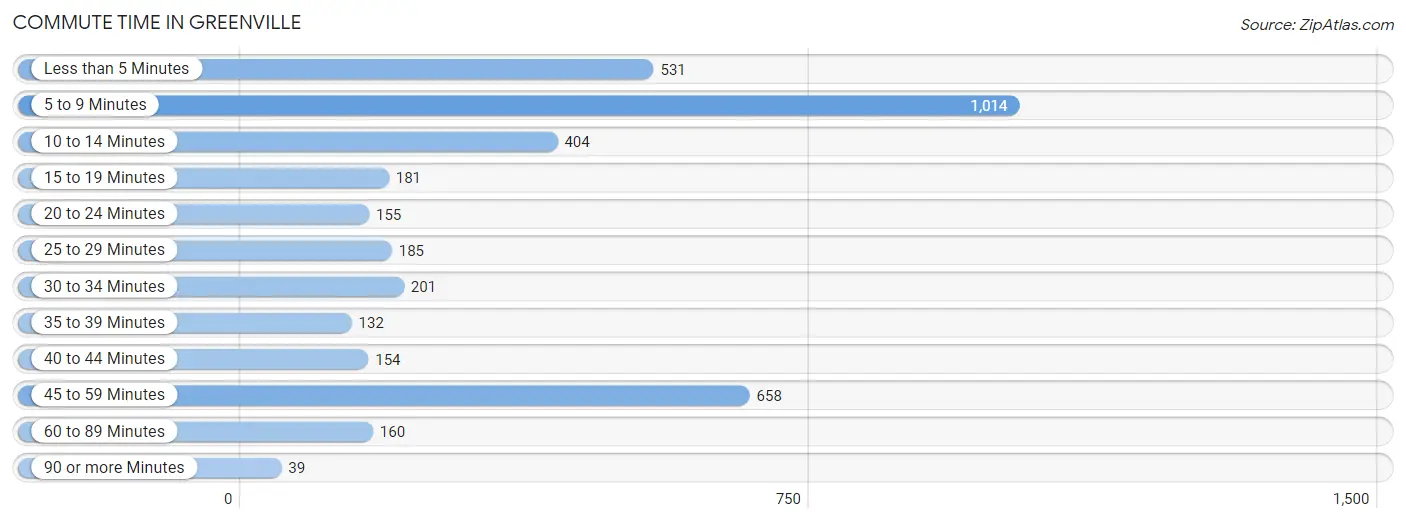
| Commute Time | # Commuters | % Commuters |
| Less than 5 Minutes | 531 | 13.9% |
| 5 to 9 Minutes | 1,014 | 26.6% |
| 10 to 14 Minutes | 404 | 10.6% |
| 15 to 19 Minutes | 181 | 4.8% |
| 20 to 24 Minutes | 155 | 4.1% |
| 25 to 29 Minutes | 185 | 4.9% |
| 30 to 34 Minutes | 201 | 5.3% |
| 35 to 39 Minutes | 132 | 3.5% |
| 40 to 44 Minutes | 154 | 4.0% |
| 45 to 59 Minutes | 658 | 17.2% |
| 60 to 89 Minutes | 160 | 4.2% |
| 90 or more Minutes | 39 | 1.0% |
Commute Time by Sex in Greenville
The most common commute times in Greenville are 5 to 9 minutes (558 commuters, 26.1%) for males and 5 to 9 minutes (456 commuters, 27.2%) for females.
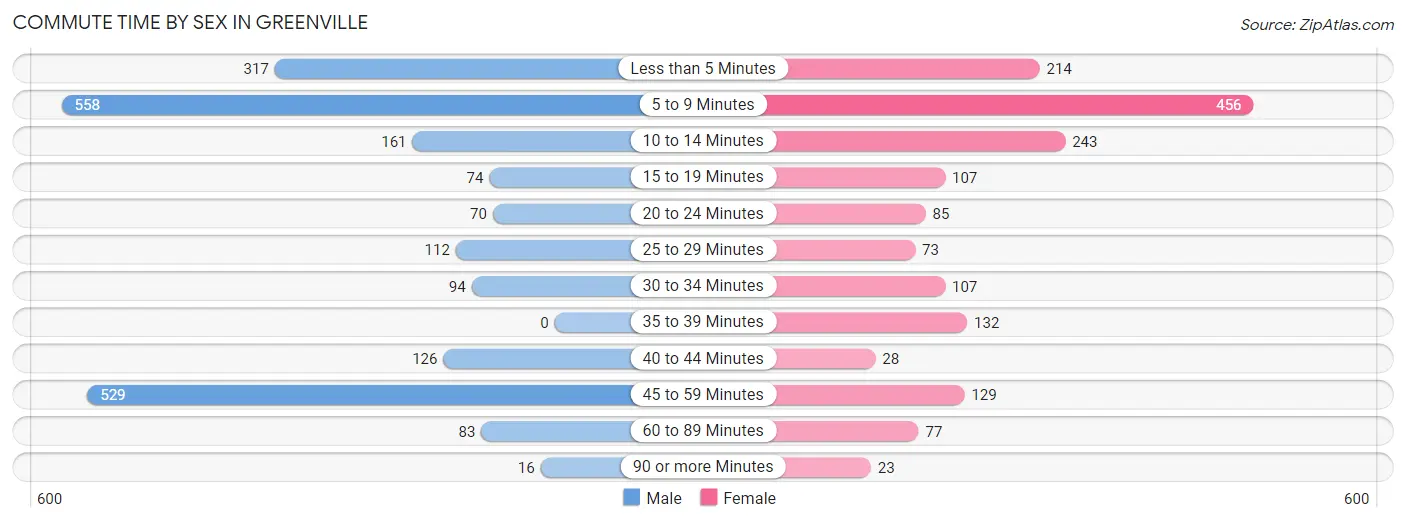
| Commute Time | Male | Female |
| Less than 5 Minutes | 317 (14.8%) | 214 (12.8%) |
| 5 to 9 Minutes | 558 (26.1%) | 456 (27.2%) |
| 10 to 14 Minutes | 161 (7.5%) | 243 (14.5%) |
| 15 to 19 Minutes | 74 (3.5%) | 107 (6.4%) |
| 20 to 24 Minutes | 70 (3.3%) | 85 (5.1%) |
| 25 to 29 Minutes | 112 (5.2%) | 73 (4.4%) |
| 30 to 34 Minutes | 94 (4.4%) | 107 (6.4%) |
| 35 to 39 Minutes | 0 (0.0%) | 132 (7.9%) |
| 40 to 44 Minutes | 126 (5.9%) | 28 (1.7%) |
| 45 to 59 Minutes | 529 (24.7%) | 129 (7.7%) |
| 60 to 89 Minutes | 83 (3.9%) | 77 (4.6%) |
| 90 or more Minutes | 16 (0.7%) | 23 (1.4%) |
Time of Departure to Work by Sex in Greenville
The most frequent times of departure to work in Greenville are 7:00 AM to 7:29 AM (308, 14.4%) for males and 7:00 AM to 7:29 AM (208, 12.4%) for females.
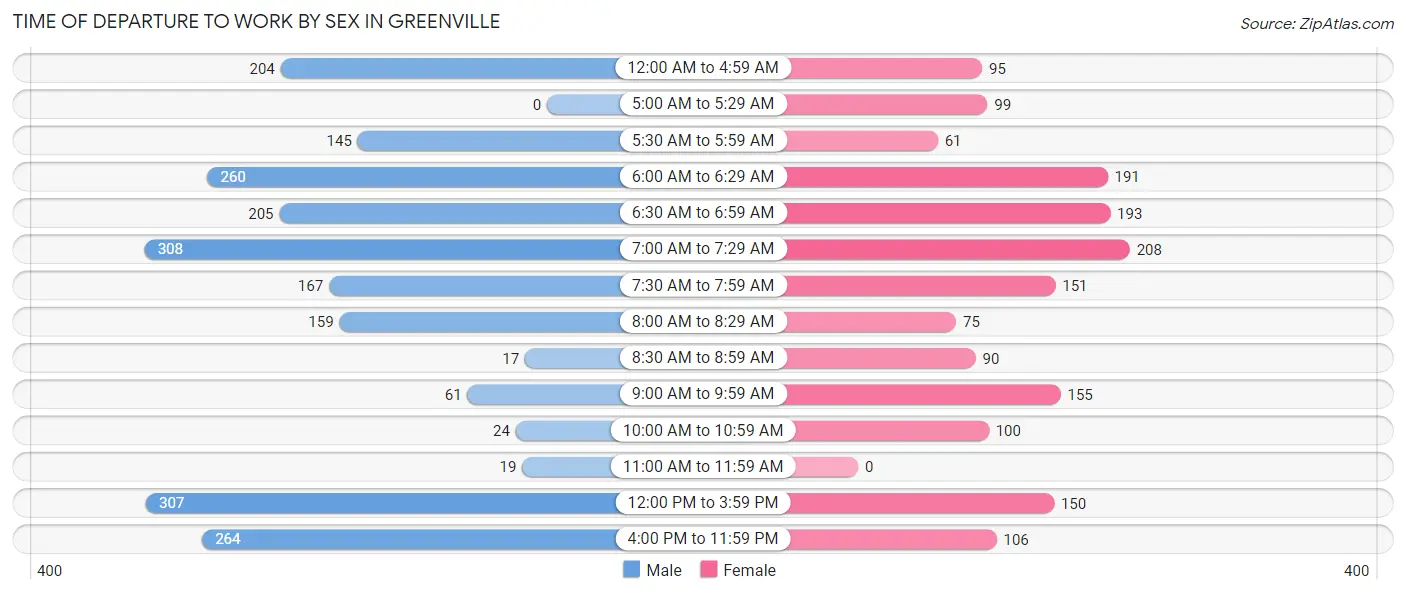
| Time of Departure | Male | Female |
| 12:00 AM to 4:59 AM | 204 (9.5%) | 95 (5.7%) |
| 5:00 AM to 5:29 AM | 0 (0.0%) | 99 (5.9%) |
| 5:30 AM to 5:59 AM | 145 (6.8%) | 61 (3.6%) |
| 6:00 AM to 6:29 AM | 260 (12.1%) | 191 (11.4%) |
| 6:30 AM to 6:59 AM | 205 (9.6%) | 193 (11.5%) |
| 7:00 AM to 7:29 AM | 308 (14.4%) | 208 (12.4%) |
| 7:30 AM to 7:59 AM | 167 (7.8%) | 151 (9.0%) |
| 8:00 AM to 8:29 AM | 159 (7.4%) | 75 (4.5%) |
| 8:30 AM to 8:59 AM | 17 (0.8%) | 90 (5.4%) |
| 9:00 AM to 9:59 AM | 61 (2.9%) | 155 (9.3%) |
| 10:00 AM to 10:59 AM | 24 (1.1%) | 100 (6.0%) |
| 11:00 AM to 11:59 AM | 19 (0.9%) | 0 (0.0%) |
| 12:00 PM to 3:59 PM | 307 (14.3%) | 150 (9.0%) |
| 4:00 PM to 11:59 PM | 264 (12.3%) | 106 (6.3%) |
| Total | 2,140 (100.0%) | 1,674 (100.0%) |
Housing Occupancy in Greenville
Occupancy by Ownership in Greenville
Of the total 3,593 dwellings in Greenville, owner-occupied units account for 2,221 (61.8%), while renter-occupied units make up 1,372 (38.2%).
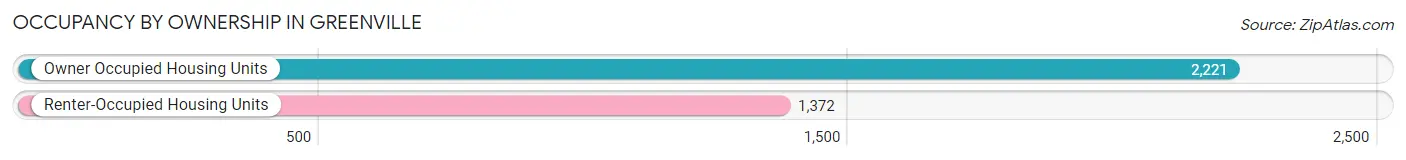
| Occupancy | # Housing Units | % Housing Units |
| Owner Occupied Housing Units | 2,221 | 61.8% |
| Renter-Occupied Housing Units | 1,372 | 38.2% |
| Total Occupied Housing Units | 3,593 | 100.0% |
Occupancy by Household Size in Greenville
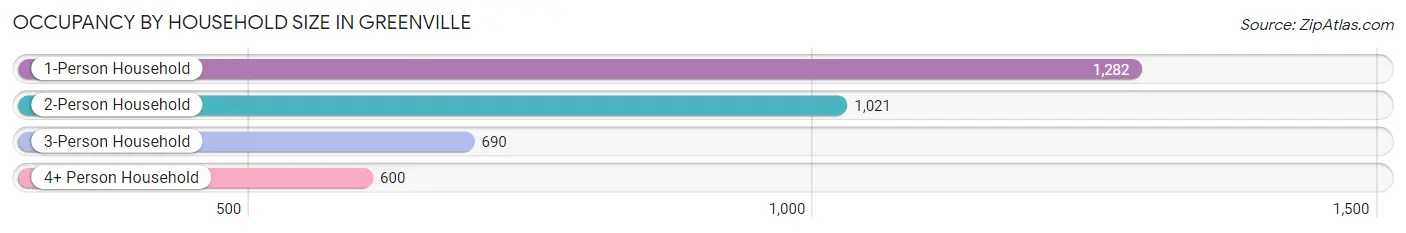
| Household Size | # Housing Units | % Housing Units |
| 1-Person Household | 1,282 | 35.7% |
| 2-Person Household | 1,021 | 28.4% |
| 3-Person Household | 690 | 19.2% |
| 4+ Person Household | 600 | 16.7% |
| Total Housing Units | 3,593 | 100.0% |
Occupancy by Ownership by Household Size in Greenville
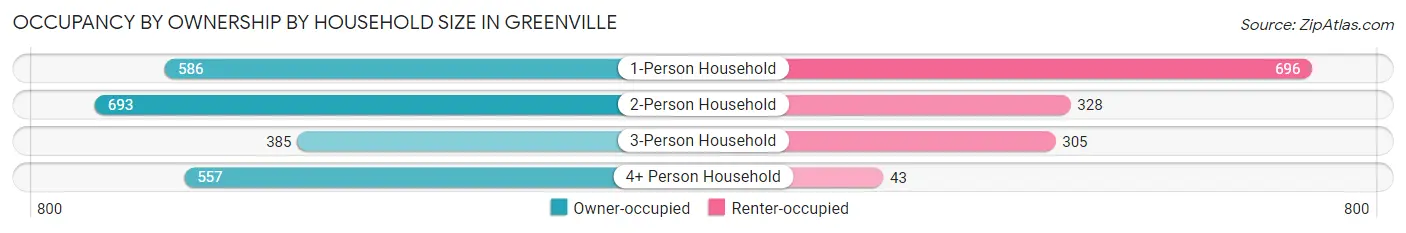
| Household Size | Owner-occupied | Renter-occupied |
| 1-Person Household | 586 (45.7%) | 696 (54.3%) |
| 2-Person Household | 693 (67.9%) | 328 (32.1%) |
| 3-Person Household | 385 (55.8%) | 305 (44.2%) |
| 4+ Person Household | 557 (92.8%) | 43 (7.2%) |
| Total Housing Units | 2,221 (61.8%) | 1,372 (38.2%) |
Occupancy by Educational Attainment in Greenville
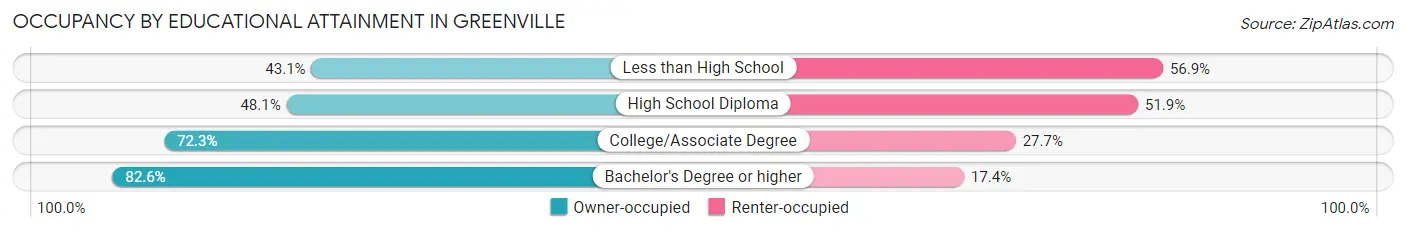
| Household Size | Owner-occupied | Renter-occupied |
| Less than High School | 198 (43.1%) | 261 (56.9%) |
| High School Diploma | 627 (48.1%) | 677 (51.9%) |
| College/Associate Degree | 813 (72.3%) | 311 (27.7%) |
| Bachelor's Degree or higher | 583 (82.6%) | 123 (17.4%) |
Occupancy by Age of Householder in Greenville
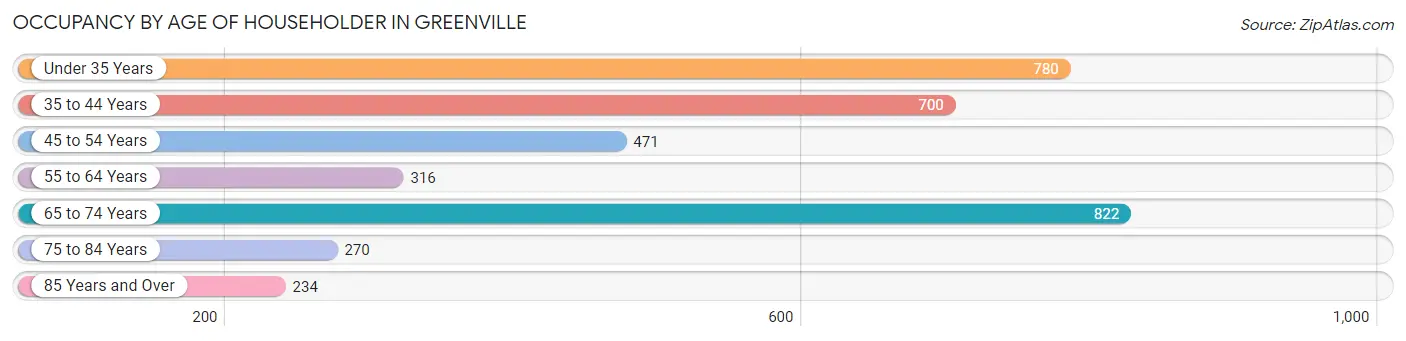
| Age Bracket | # Households | % Households |
| Under 35 Years | 780 | 21.7% |
| 35 to 44 Years | 700 | 19.5% |
| 45 to 54 Years | 471 | 13.1% |
| 55 to 64 Years | 316 | 8.8% |
| 65 to 74 Years | 822 | 22.9% |
| 75 to 84 Years | 270 | 7.5% |
| 85 Years and Over | 234 | 6.5% |
| Total | 3,593 | 100.0% |
Housing Finances in Greenville
Median Income by Occupancy in Greenville
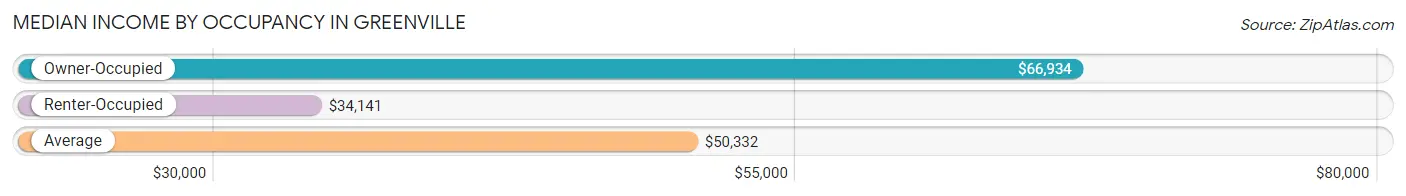
| Occupancy Type | # Households | Median Income |
| Owner-Occupied | 2,221 (61.8%) | $66,934 |
| Renter-Occupied | 1,372 (38.2%) | $34,141 |
| Average | 3,593 (100.0%) | $50,332 |
Occupancy by Householder Income Bracket in Greenville
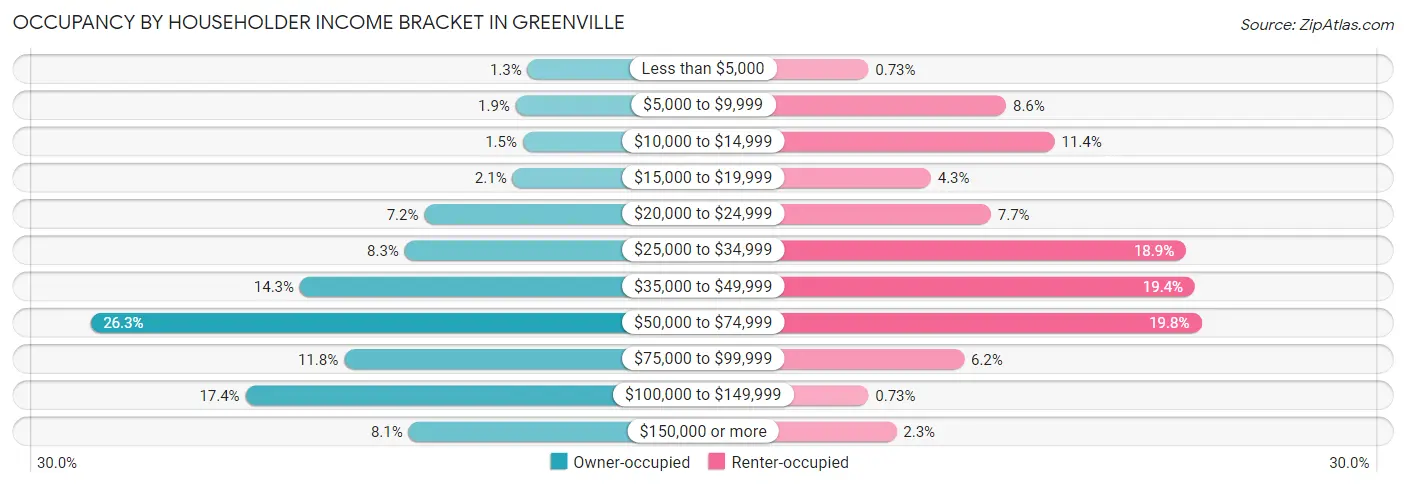
| Income Bracket | Owner-occupied | Renter-occupied |
| Less than $5,000 | 28 (1.3%) | 10 (0.7%) |
| $5,000 to $9,999 | 43 (1.9%) | 118 (8.6%) |
| $10,000 to $14,999 | 34 (1.5%) | 156 (11.4%) |
| $15,000 to $19,999 | 47 (2.1%) | 59 (4.3%) |
| $20,000 to $24,999 | 159 (7.2%) | 106 (7.7%) |
| $25,000 to $34,999 | 184 (8.3%) | 259 (18.9%) |
| $35,000 to $49,999 | 317 (14.3%) | 266 (19.4%) |
| $50,000 to $74,999 | 583 (26.3%) | 271 (19.8%) |
| $75,000 to $99,999 | 261 (11.7%) | 85 (6.2%) |
| $100,000 to $149,999 | 386 (17.4%) | 10 (0.7%) |
| $150,000 or more | 179 (8.1%) | 32 (2.3%) |
| Total | 2,221 (100.0%) | 1,372 (100.0%) |
Monthly Housing Cost Tiers in Greenville
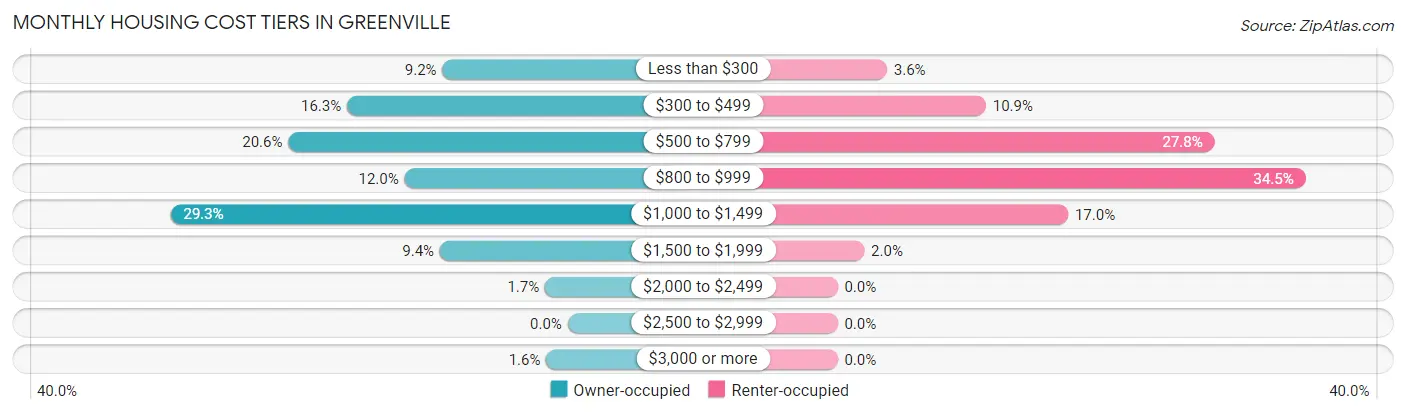
| Monthly Cost | Owner-occupied | Renter-occupied |
| Less than $300 | 205 (9.2%) | 50 (3.6%) |
| $300 to $499 | 361 (16.3%) | 150 (10.9%) |
| $500 to $799 | 457 (20.6%) | 381 (27.8%) |
| $800 to $999 | 267 (12.0%) | 473 (34.5%) |
| $1,000 to $1,499 | 650 (29.3%) | 233 (17.0%) |
| $1,500 to $1,999 | 209 (9.4%) | 27 (2.0%) |
| $2,000 to $2,499 | 37 (1.7%) | 0 (0.0%) |
| $2,500 to $2,999 | 0 (0.0%) | 0 (0.0%) |
| $3,000 or more | 35 (1.6%) | 0 (0.0%) |
| Total | 2,221 (100.0%) | 1,372 (100.0%) |
Physical Housing Characteristics in Greenville
Housing Structures in Greenville
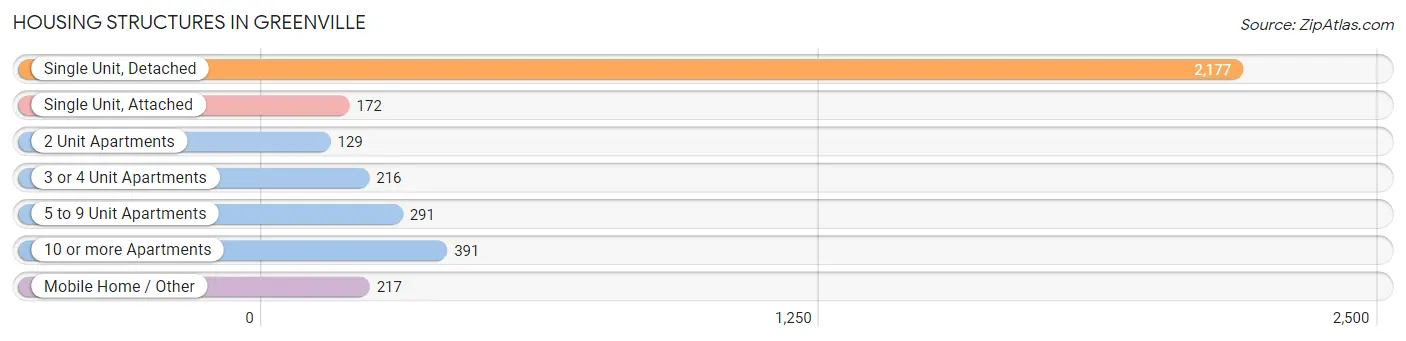
| Structure Type | # Housing Units | % Housing Units |
| Single Unit, Detached | 2,177 | 60.6% |
| Single Unit, Attached | 172 | 4.8% |
| 2 Unit Apartments | 129 | 3.6% |
| 3 or 4 Unit Apartments | 216 | 6.0% |
| 5 to 9 Unit Apartments | 291 | 8.1% |
| 10 or more Apartments | 391 | 10.9% |
| Mobile Home / Other | 217 | 6.0% |
| Total | 3,593 | 100.0% |
Housing Structures by Occupancy in Greenville
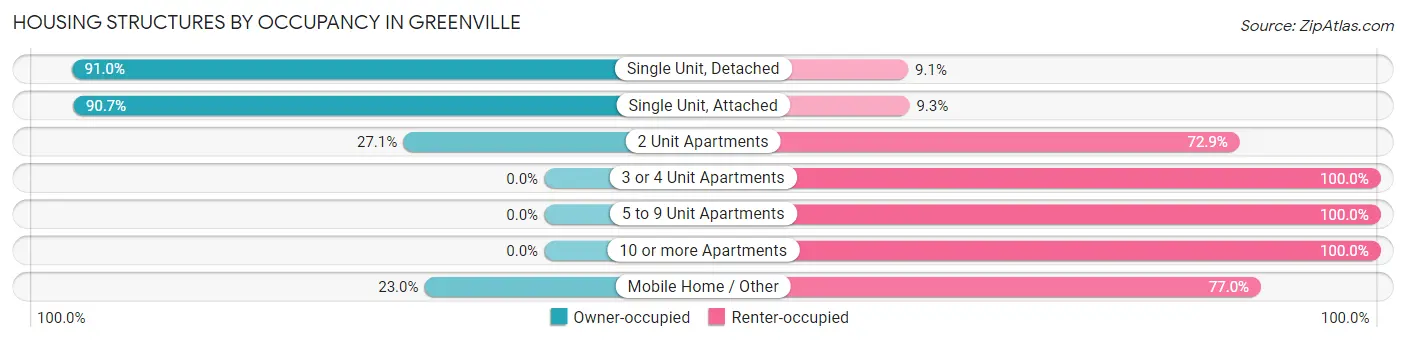
| Structure Type | Owner-occupied | Renter-occupied |
| Single Unit, Detached | 1,980 (90.9%) | 197 (9.0%) |
| Single Unit, Attached | 156 (90.7%) | 16 (9.3%) |
| 2 Unit Apartments | 35 (27.1%) | 94 (72.9%) |
| 3 or 4 Unit Apartments | 0 (0.0%) | 216 (100.0%) |
| 5 to 9 Unit Apartments | 0 (0.0%) | 291 (100.0%) |
| 10 or more Apartments | 0 (0.0%) | 391 (100.0%) |
| Mobile Home / Other | 50 (23.0%) | 167 (77.0%) |
| Total | 2,221 (61.8%) | 1,372 (38.2%) |
Housing Structures by Number of Rooms in Greenville
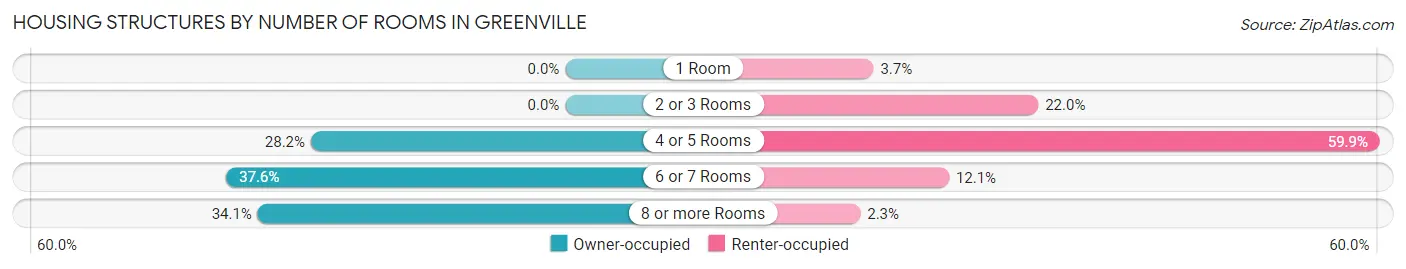
| Number of Rooms | Owner-occupied | Renter-occupied |
| 1 Room | 0 (0.0%) | 51 (3.7%) |
| 2 or 3 Rooms | 0 (0.0%) | 302 (22.0%) |
| 4 or 5 Rooms | 627 (28.2%) | 822 (59.9%) |
| 6 or 7 Rooms | 836 (37.6%) | 166 (12.1%) |
| 8 or more Rooms | 758 (34.1%) | 31 (2.3%) |
| Total | 2,221 (100.0%) | 1,372 (100.0%) |
Housing Structure by Heating Type in Greenville
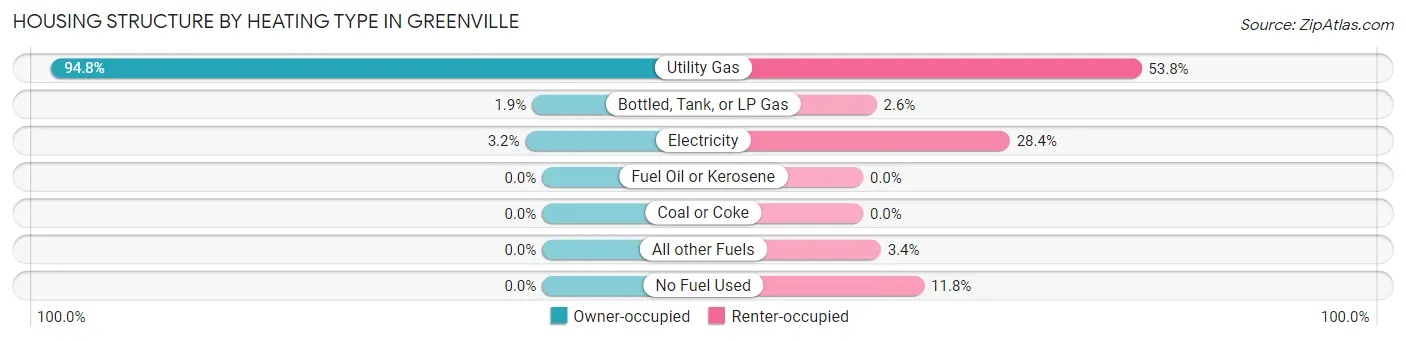
| Heating Type | Owner-occupied | Renter-occupied |
| Utility Gas | 2,106 (94.8%) | 738 (53.8%) |
| Bottled, Tank, or LP Gas | 43 (1.9%) | 36 (2.6%) |
| Electricity | 72 (3.2%) | 389 (28.3%) |
| Fuel Oil or Kerosene | 0 (0.0%) | 0 (0.0%) |
| Coal or Coke | 0 (0.0%) | 0 (0.0%) |
| All other Fuels | 0 (0.0%) | 47 (3.4%) |
| No Fuel Used | 0 (0.0%) | 162 (11.8%) |
| Total | 2,221 (100.0%) | 1,372 (100.0%) |
Household Vehicle Usage in Greenville
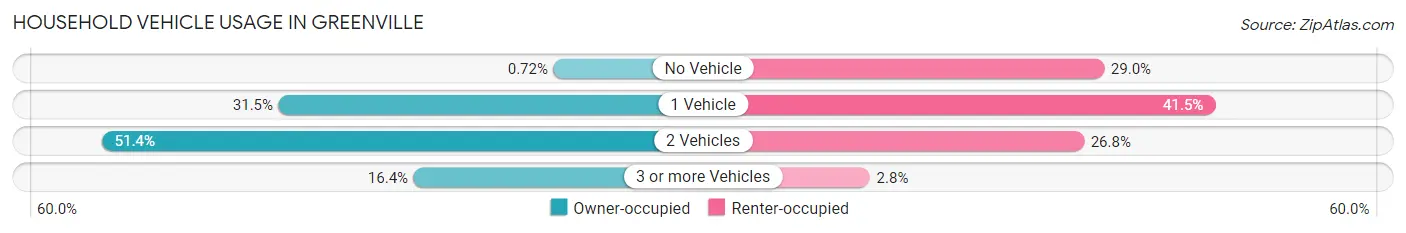
| Vehicles per Household | Owner-occupied | Renter-occupied |
| No Vehicle | 16 (0.7%) | 398 (29.0%) |
| 1 Vehicle | 700 (31.5%) | 569 (41.5%) |
| 2 Vehicles | 1,141 (51.4%) | 367 (26.8%) |
| 3 or more Vehicles | 364 (16.4%) | 38 (2.8%) |
| Total | 2,221 (100.0%) | 1,372 (100.0%) |
Real Estate & Mortgages in Greenville
Real Estate and Mortgage Overview in Greenville
| Characteristic | Without Mortgage | With Mortgage |
| Housing Units | 887 | 1,334 |
| Median Property Value | $129,500 | $152,400 |
| Median Household Income | $35,859 | $179 |
| Monthly Housing Costs | $422 | $35 |
| Real Estate Taxes | $1,965 | $66 |
Property Value by Mortgage Status in Greenville
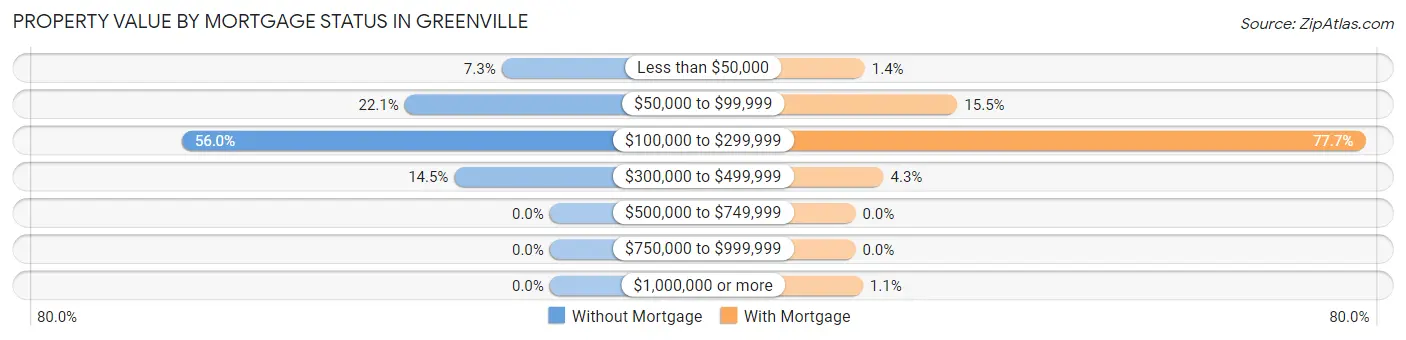
| Property Value | Without Mortgage | With Mortgage |
| Less than $50,000 | 65 (7.3%) | 19 (1.4%) |
| $50,000 to $99,999 | 196 (22.1%) | 207 (15.5%) |
| $100,000 to $299,999 | 497 (56.0%) | 1,036 (77.7%) |
| $300,000 to $499,999 | 129 (14.5%) | 57 (4.3%) |
| $500,000 to $749,999 | 0 (0.0%) | 0 (0.0%) |
| $750,000 to $999,999 | 0 (0.0%) | 0 (0.0%) |
| $1,000,000 or more | 0 (0.0%) | 15 (1.1%) |
| Total | 887 (100.0%) | 1,334 (100.0%) |
Household Income by Mortgage Status in Greenville
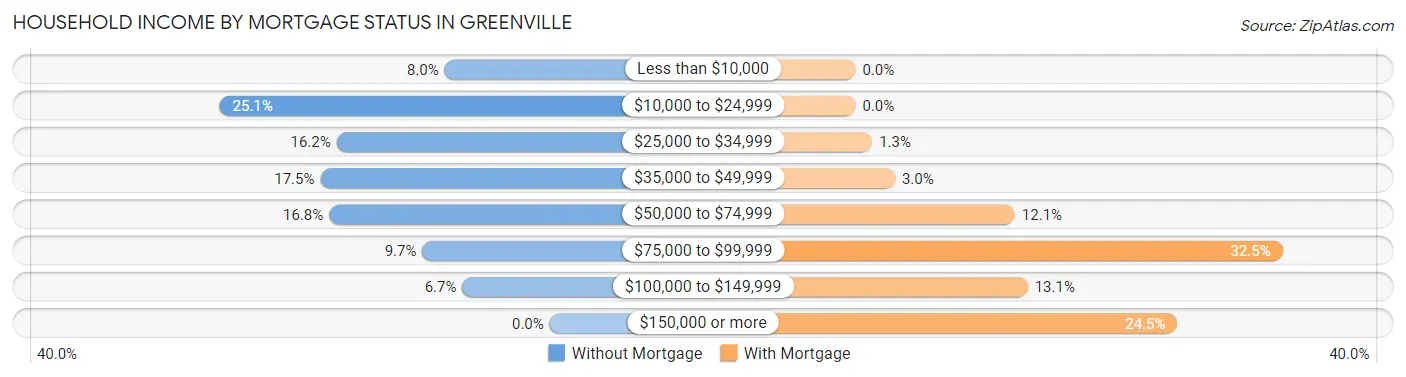
| Household Income | Without Mortgage | With Mortgage |
| Less than $10,000 | 71 (8.0%) | 0 (0.0%) |
| $10,000 to $24,999 | 223 (25.1%) | 0 (0.0%) |
| $25,000 to $34,999 | 144 (16.2%) | 17 (1.3%) |
| $35,000 to $49,999 | 155 (17.5%) | 40 (3.0%) |
| $50,000 to $74,999 | 149 (16.8%) | 162 (12.1%) |
| $75,000 to $99,999 | 86 (9.7%) | 434 (32.5%) |
| $100,000 to $149,999 | 59 (6.7%) | 175 (13.1%) |
| $150,000 or more | 0 (0.0%) | 327 (24.5%) |
| Total | 887 (100.0%) | 1,334 (100.0%) |
Property Value to Household Income Ratio in Greenville
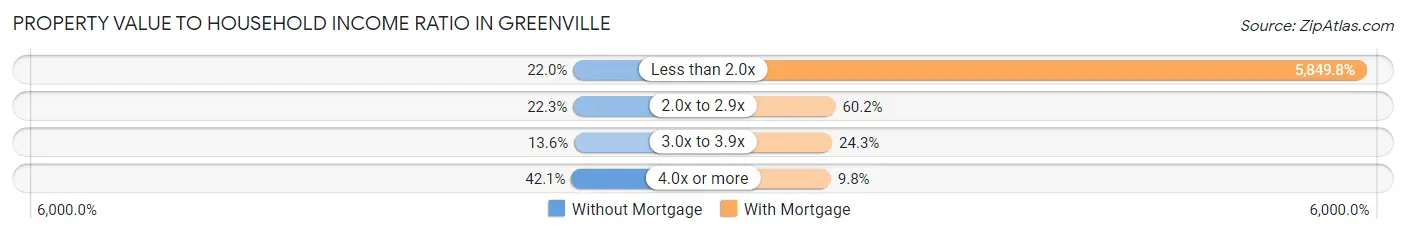
| Value-to-Income Ratio | Without Mortgage | With Mortgage |
| Less than 2.0x | 195 (22.0%) | 78,036 (5,849.8%) |
| 2.0x to 2.9x | 198 (22.3%) | 803 (60.2%) |
| 3.0x to 3.9x | 121 (13.6%) | 324 (24.3%) |
| 4.0x or more | 373 (42.0%) | 131 (9.8%) |
| Total | 887 (100.0%) | 1,334 (100.0%) |
Real Estate Taxes by Mortgage Status in Greenville
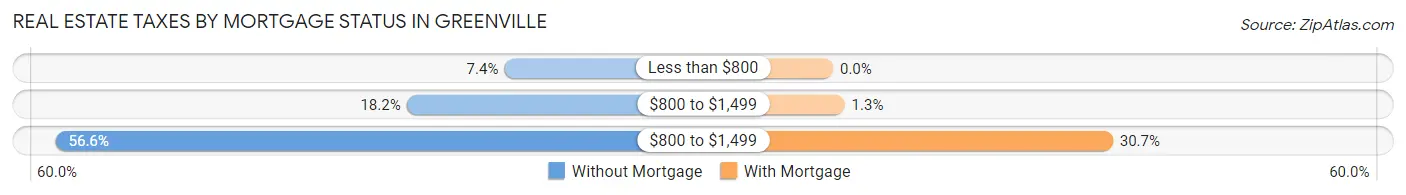
| Property Taxes | Without Mortgage | With Mortgage |
| Less than $800 | 66 (7.4%) | 0 (0.0%) |
| $800 to $1,499 | 161 (18.1%) | 17 (1.3%) |
| $800 to $1,499 | 502 (56.6%) | 409 (30.7%) |
| Total | 887 (100.0%) | 1,334 (100.0%) |
Health & Disability in Greenville
Health Insurance Coverage by Age in Greenville
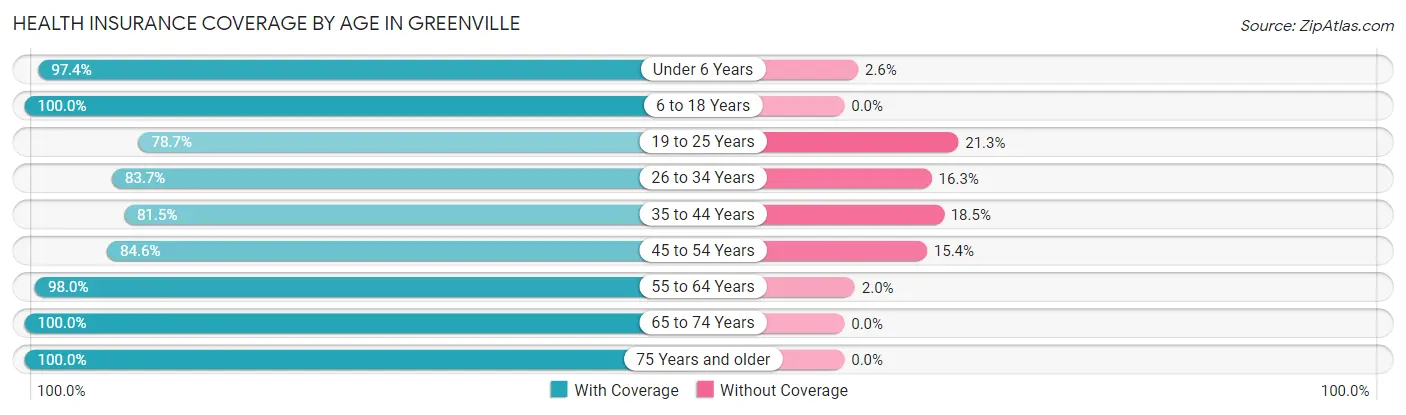
| Age Bracket | With Coverage | Without Coverage |
| Under 6 Years | 723 (97.4%) | 19 (2.6%) |
| 6 to 18 Years | 1,323 (100.0%) | 0 (0.0%) |
| 19 to 25 Years | 726 (78.7%) | 196 (21.3%) |
| 26 to 34 Years | 822 (83.7%) | 160 (16.3%) |
| 35 to 44 Years | 1,138 (81.5%) | 259 (18.5%) |
| 45 to 54 Years | 703 (84.6%) | 128 (15.4%) |
| 55 to 64 Years | 700 (98.0%) | 14 (2.0%) |
| 65 to 74 Years | 1,116 (100.0%) | 0 (0.0%) |
| 75 Years and older | 714 (100.0%) | 0 (0.0%) |
| Total | 7,965 (91.1%) | 776 (8.9%) |
Health Insurance Coverage by Citizenship Status in Greenville
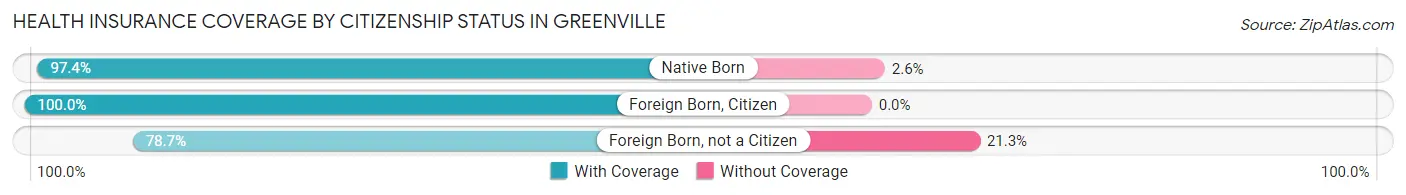
| Citizenship Status | With Coverage | Without Coverage |
| Native Born | 723 (97.4%) | 19 (2.6%) |
| Foreign Born, Citizen | 1,323 (100.0%) | 0 (0.0%) |
| Foreign Born, not a Citizen | 726 (78.7%) | 196 (21.3%) |
Health Insurance Coverage by Household Income in Greenville
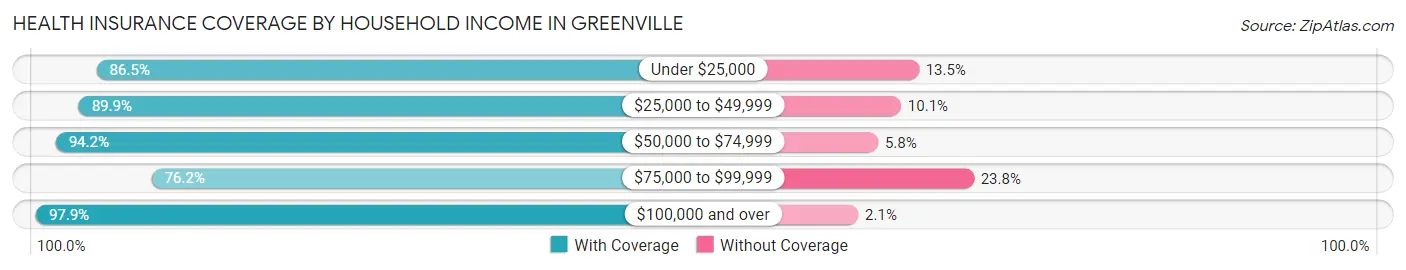
| Household Income | With Coverage | Without Coverage |
| Under $25,000 | 1,028 (86.5%) | 160 (13.5%) |
| $25,000 to $49,999 | 1,985 (89.9%) | 224 (10.1%) |
| $50,000 to $74,999 | 1,807 (94.2%) | 112 (5.8%) |
| $75,000 to $99,999 | 734 (76.2%) | 229 (23.8%) |
| $100,000 and over | 2,343 (97.9%) | 51 (2.1%) |
Public vs Private Health Insurance Coverage by Age in Greenville
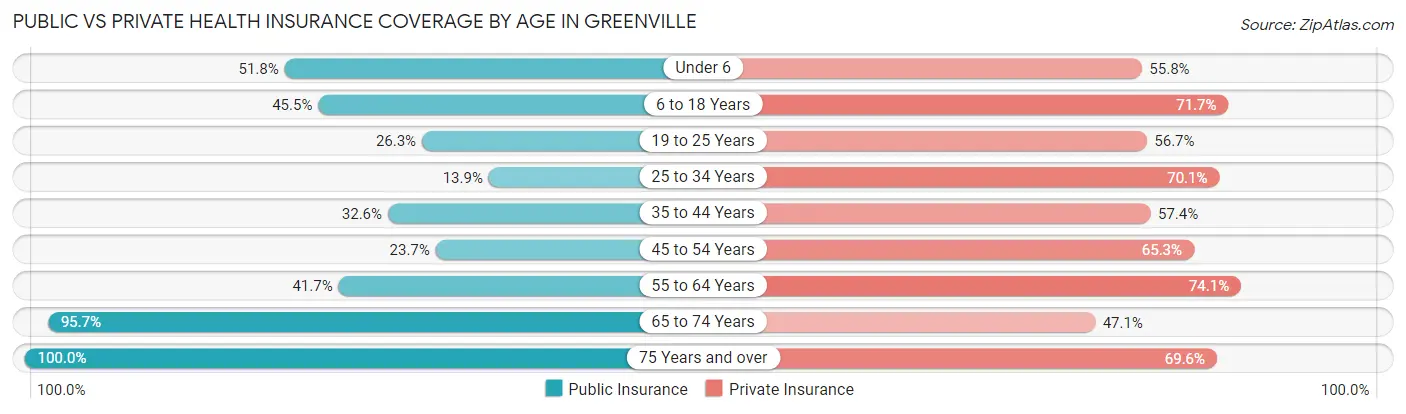
| Age Bracket | Public Insurance | Private Insurance |
| Under 6 | 384 (51.7%) | 414 (55.8%) |
| 6 to 18 Years | 602 (45.5%) | 949 (71.7%) |
| 19 to 25 Years | 242 (26.3%) | 523 (56.7%) |
| 25 to 34 Years | 136 (13.9%) | 688 (70.1%) |
| 35 to 44 Years | 455 (32.6%) | 802 (57.4%) |
| 45 to 54 Years | 197 (23.7%) | 543 (65.3%) |
| 55 to 64 Years | 298 (41.7%) | 529 (74.1%) |
| 65 to 74 Years | 1,068 (95.7%) | 526 (47.1%) |
| 75 Years and over | 714 (100.0%) | 497 (69.6%) |
| Total | 4,096 (46.9%) | 5,471 (62.6%) |
Disability Status by Sex by Age in Greenville
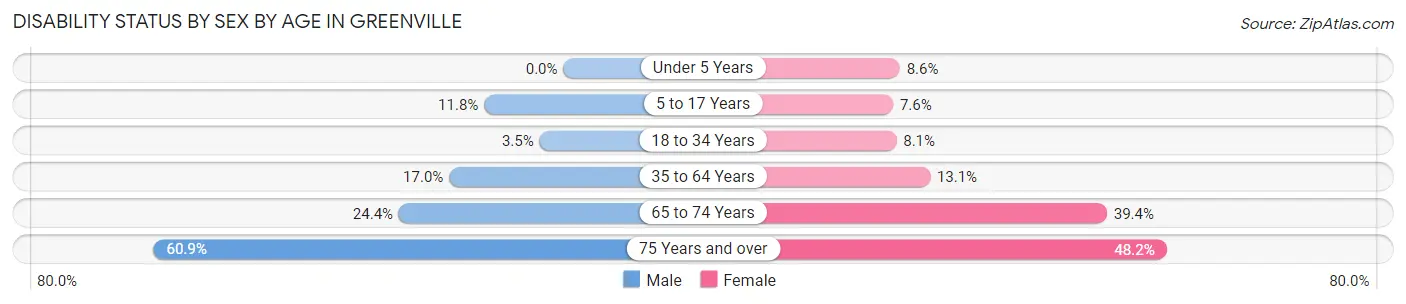
| Age Bracket | Male | Female |
| Under 5 Years | 0 (0.0%) | 40 (8.6%) |
| 5 to 17 Years | 66 (11.8%) | 61 (7.6%) |
| 18 to 34 Years | 35 (3.5%) | 76 (8.1%) |
| 35 to 64 Years | 245 (17.0%) | 196 (13.1%) |
| 65 to 74 Years | 159 (24.4%) | 183 (39.4%) |
| 75 Years and over | 129 (60.9%) | 242 (48.2%) |
Disability Class by Sex by Age in Greenville
Disability Class: Hearing Difficulty
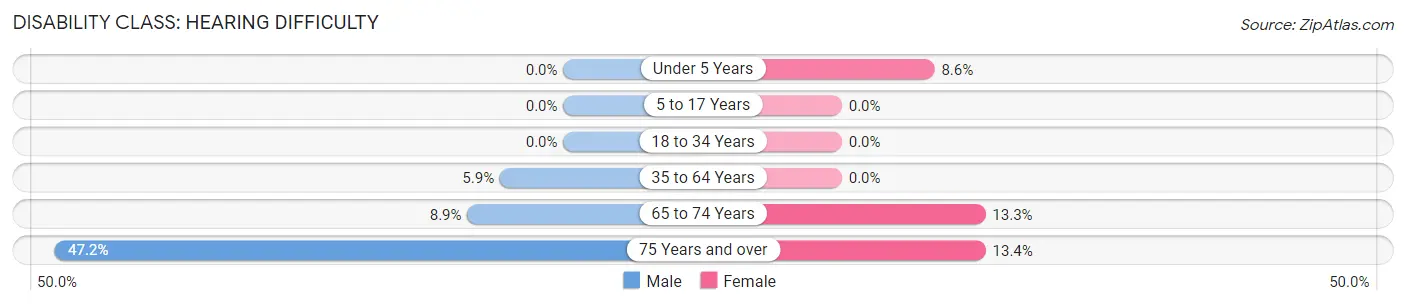
| Age Bracket | Male | Female |
| Under 5 Years | 0 (0.0%) | 40 (8.6%) |
| 5 to 17 Years | 0 (0.0%) | 0 (0.0%) |
| 18 to 34 Years | 0 (0.0%) | 0 (0.0%) |
| 35 to 64 Years | 85 (5.9%) | 0 (0.0%) |
| 65 to 74 Years | 58 (8.9%) | 62 (13.3%) |
| 75 Years and over | 100 (47.2%) | 67 (13.4%) |
Disability Class: Vision Difficulty
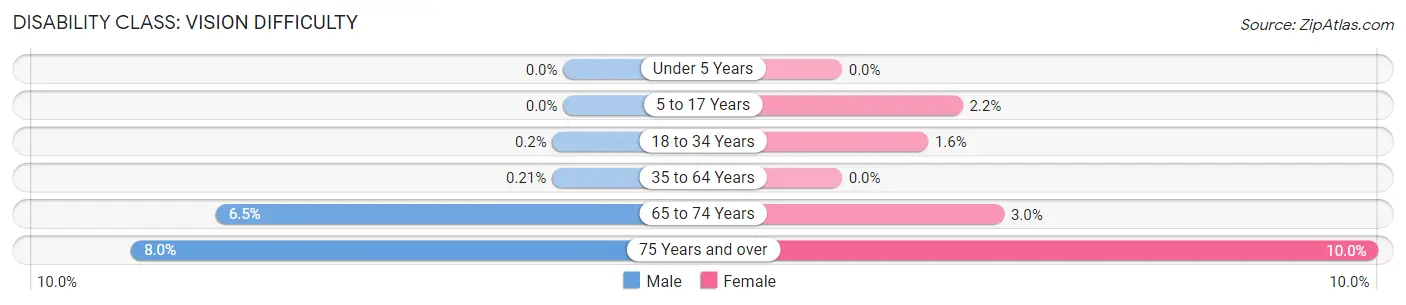
| Age Bracket | Male | Female |
| Under 5 Years | 0 (0.0%) | 0 (0.0%) |
| 5 to 17 Years | 0 (0.0%) | 18 (2.2%) |
| 18 to 34 Years | 2 (0.2%) | 15 (1.6%) |
| 35 to 64 Years | 3 (0.2%) | 0 (0.0%) |
| 65 to 74 Years | 42 (6.5%) | 14 (3.0%) |
| 75 Years and over | 17 (8.0%) | 50 (10.0%) |
Disability Class: Cognitive Difficulty
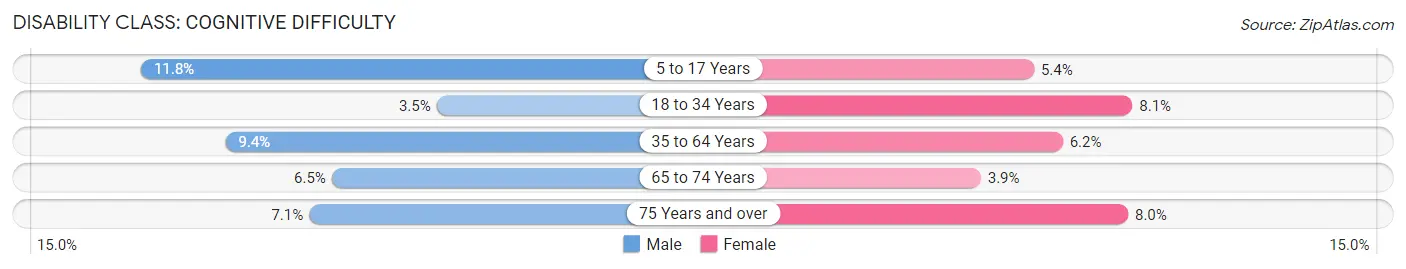
| Age Bracket | Male | Female |
| 5 to 17 Years | 66 (11.8%) | 43 (5.3%) |
| 18 to 34 Years | 35 (3.5%) | 76 (8.1%) |
| 35 to 64 Years | 136 (9.4%) | 92 (6.1%) |
| 65 to 74 Years | 42 (6.5%) | 18 (3.9%) |
| 75 Years and over | 15 (7.1%) | 40 (8.0%) |
Disability Class: Ambulatory Difficulty
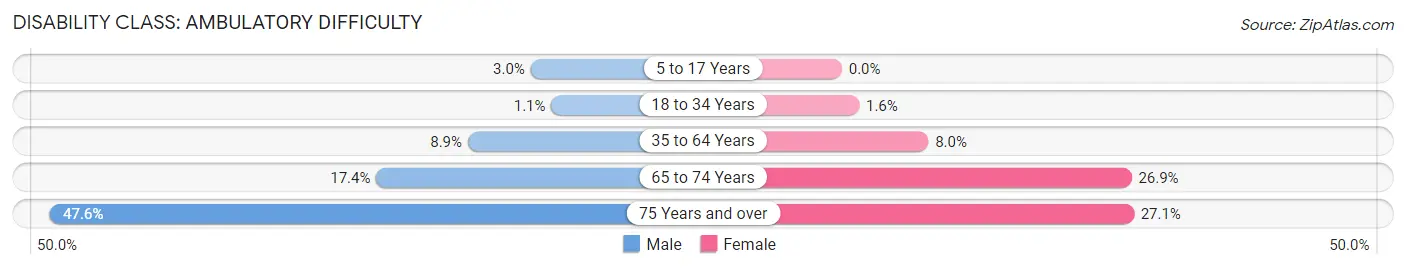
| Age Bracket | Male | Female |
| 5 to 17 Years | 17 (3.0%) | 0 (0.0%) |
| 18 to 34 Years | 11 (1.1%) | 15 (1.6%) |
| 35 to 64 Years | 128 (8.9%) | 120 (8.0%) |
| 65 to 74 Years | 113 (17.4%) | 125 (26.9%) |
| 75 Years and over | 101 (47.6%) | 136 (27.1%) |
Disability Class: Self-Care Difficulty
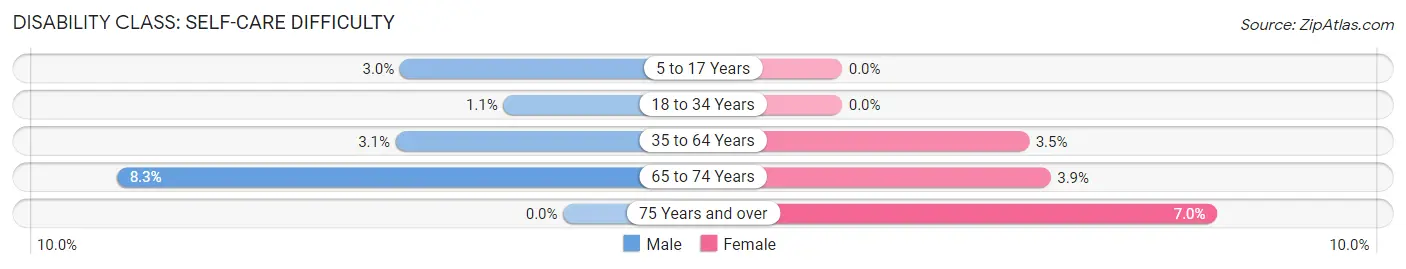
| Age Bracket | Male | Female |
| 5 to 17 Years | 17 (3.0%) | 0 (0.0%) |
| 18 to 34 Years | 11 (1.1%) | 0 (0.0%) |
| 35 to 64 Years | 45 (3.1%) | 52 (3.5%) |
| 65 to 74 Years | 54 (8.3%) | 18 (3.9%) |
| 75 Years and over | 0 (0.0%) | 35 (7.0%) |
Technology Access in Greenville
Computing Device Access in Greenville
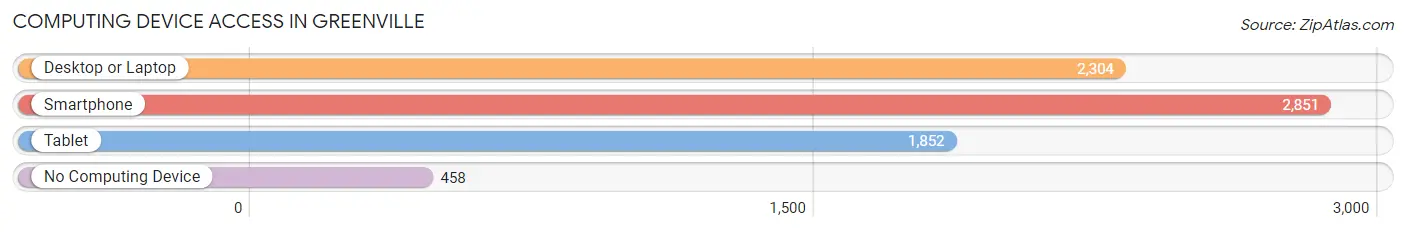
| Device Type | # Households | % Households |
| Desktop or Laptop | 2,304 | 64.1% |
| Smartphone | 2,851 | 79.3% |
| Tablet | 1,852 | 51.5% |
| No Computing Device | 458 | 12.8% |
| Total | 3,593 | 100.0% |
Internet Access in Greenville
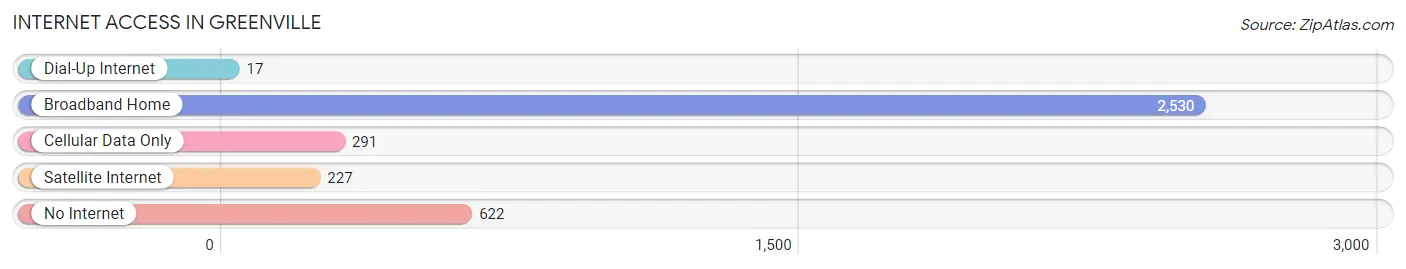
| Internet Type | # Households | % Households |
| Dial-Up Internet | 17 | 0.5% |
| Broadband Home | 2,530 | 70.4% |
| Cellular Data Only | 291 | 8.1% |
| Satellite Internet | 227 | 6.3% |
| No Internet | 622 | 17.3% |
| Total | 3,593 | 100.0% |
Greenville Summary
Geography
Greenville is a city located in Montcalm County, Michigan. It is situated in the central part of the state, approximately 40 miles northeast of Grand Rapids. The city is located on the Flat River, which is a tributary of the Grand River. The city is surrounded by a number of small towns and villages, including Belding, Gowen, Sidney, and Stanton. The city is located in a rural area, with a population of approximately 8,000 people.
The city of Greenville is located in a flat, low-lying area, with an elevation of approximately 890 feet above sea level. The city is located in a temperate climate, with average temperatures ranging from the mid-30s in the winter to the mid-70s in the summer. The city receives an average of 36 inches of precipitation per year, with most of it falling in the spring and summer months.
History
Greenville was first settled in 1836 by a group of settlers from New York. The city was named after the Greenville Treaty of 1795, which was signed between the United States and the Native American tribes of the area. The city was incorporated in 1867, and the first mayor was elected in 1868.
The city grew rapidly in the late 19th century, and by the early 20th century, it had become a major industrial center. The city was home to a number of factories, including a paper mill, a furniture factory, and a foundry. The city also had a number of other businesses, including a bank, a hotel, and a number of stores.
The city experienced a period of decline in the mid-20th century, as many of the factories closed and the population decreased. However, the city has experienced a resurgence in recent years, with a number of new businesses opening and the population increasing.
Economy
Greenville’s economy is largely based on manufacturing and agriculture. The city is home to a number of factories, including a paper mill, a furniture factory, and a foundry. The city also has a number of other businesses, including a bank, a hotel, and a number of stores.
The city is also home to a number of agricultural businesses, including a number of farms and a number of food processing plants. The city is also home to a number of retail businesses, including a number of restaurants, bars, and shops.
Demographics
As of the 2010 census, the population of Greenville was 8,082. The city has a population that is predominantly white, with approximately 87% of the population being white. The city also has a small Hispanic population, with approximately 5% of the population being Hispanic. The city also has a small African American population, with approximately 3% of the population being African American.
The median household income in Greenville is approximately $41,000, and the median home value is approximately $90,000. The city has a poverty rate of approximately 15%, which is slightly higher than the national average.
Conclusion
Greenville is a city located in Montcalm County, Michigan. It is situated in the central part of the state, approximately 40 miles northeast of Grand Rapids. The city is located on the Flat River, which is a tributary of the Grand River. The city is surrounded by a number of small towns and villages, including Belding, Gowen, Sidney, and Stanton. The city is located in a rural area, with a population of approximately 8,000 people.
Greenville’s economy is largely based on manufacturing and agriculture. The city is home to a number of factories, including a paper mill, a furniture factory, and a foundry. The city also has a number of other businesses, including a bank, a hotel, and a number of stores. The city is also home to a number of agricultural businesses, including a number of farms and a number of food processing plants. The city is also home to a number of retail businesses, including a number of restaurants, bars, and shops.
As of the 2010 census, the population of Greenville was 8,082. The city has a population that is predominantly white, with approximately 87% of the population being white. The city also has a small Hispanic population, with approximately 5% of the population being Hispanic. The city also has a small African American population, with approximately 3% of the population being African American. The median household income in Greenville is approximately $41,000, and the median home value is approximately $90,000. The city has a poverty rate of approximately 15%, which is slightly higher than the national average.
Common Questions
What is Per Capita Income in Greenville?
Per Capita income in Greenville is $26,688.
What is the Median Family Income in Greenville?
Median Family Income in Greenville is $60,859.
What is the Median Household income in Greenville?
Median Household Income in Greenville is $50,332.
What is Income or Wage Gap in Greenville?
Income or Wage Gap in Greenville is 31.0%.
Women in Greenville earn 69.0 cents for every dollar earned by a man.
What is Inequality or Gini Index in Greenville?
Inequality or Gini Index in Greenville is 0.39.
What is the Total Population of Greenville?
Total Population of Greenville is 8,866.
What is the Total Male Population of Greenville?
Total Male Population of Greenville is 4,127.
What is the Total Female Population of Greenville?
Total Female Population of Greenville is 4,739.
What is the Ratio of Males per 100 Females in Greenville?
There are 87.09 Males per 100 Females in Greenville.
What is the Ratio of Females per 100 Males in Greenville?
There are 114.83 Females per 100 Males in Greenville.
What is the Median Population Age in Greenville?
Median Population Age in Greenville is 37.3 Years.
What is the Average Family Size in Greenville
Average Family Size in Greenville is 3.1 People.
What is the Average Household Size in Greenville
Average Household Size in Greenville is 2.4 People.
How Large is the Labor Force in Greenville?
There are 4,174 People in the Labor Forcein in Greenville.
What is the Percentage of People in the Labor Force in Greenville?
59.4% of People are in the Labor Force in Greenville.
What is the Unemployment Rate in Greenville?
Unemployment Rate in Greenville is 5.8%.