Zip Codes with the Highest Percentage of Population Employed in Security & Protection in White Lake, MI
RELATED REPORTS & OPTIONS
Security & Protection
White Lake
Compare Zip Codes
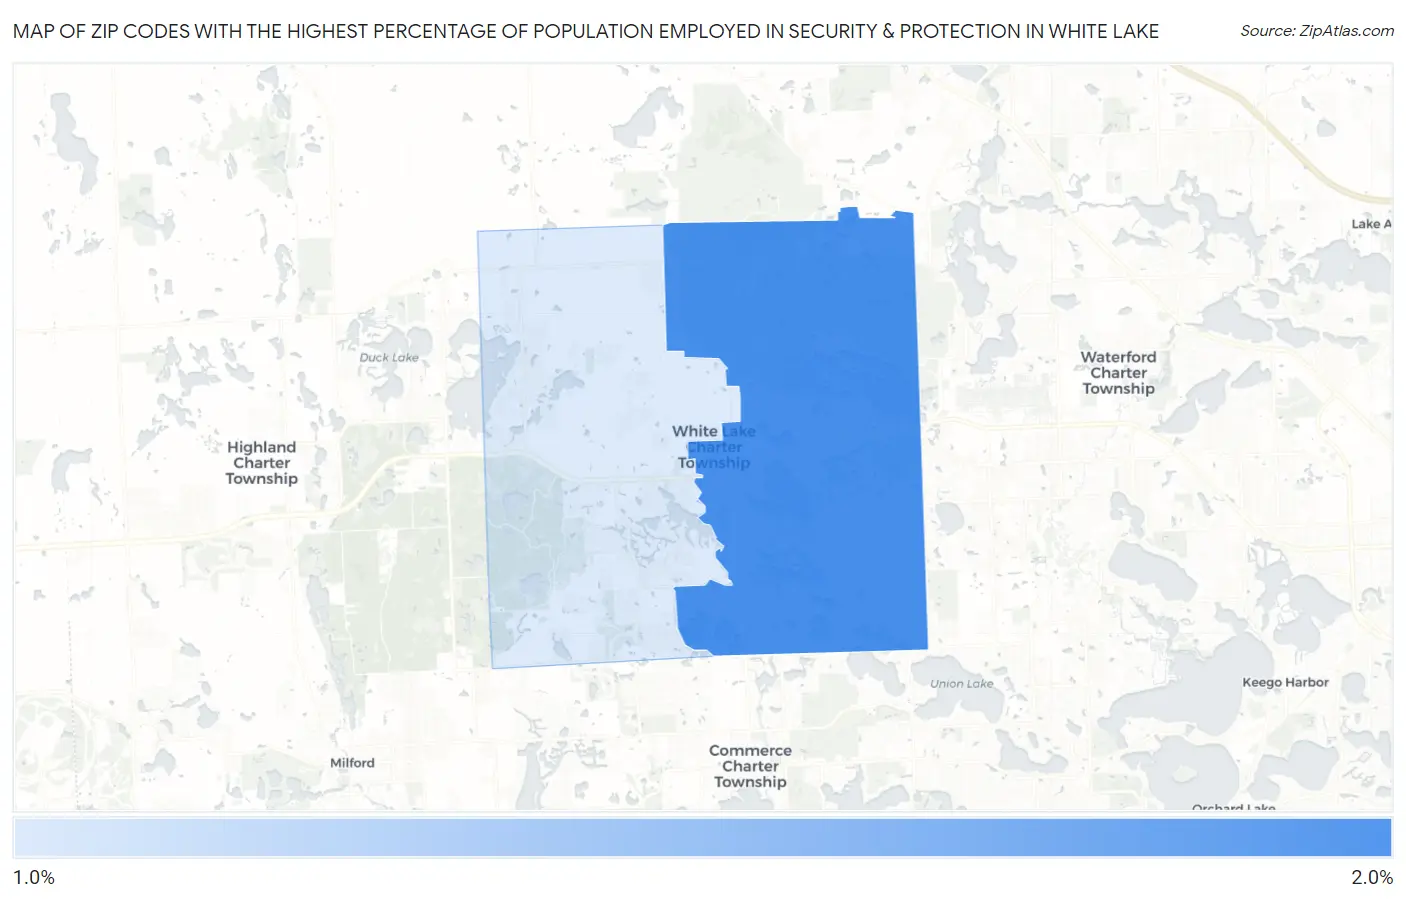
Map of Zip Codes with the Highest Percentage of Population Employed in Security & Protection in White Lake
1.1%
1.7%
Zip Codes with the Highest Percentage of Population Employed in Security & Protection in White Lake, MI
| Zip Code | % Employed | vs State | vs National | |
| 1. | 48386 | 1.7% | 1.6%(+0.104)#370 | 2.1%(-0.403)#14,347 |
| 2. | 48383 | 1.1% | 1.6%(-0.515)#573 | 2.1%(-1.02)#19,081 |
1
Common Questions
What are the Top Zip Codes with the Highest Percentage of Population Employed in Security & Protection in White Lake, MI?
Top Zip Codes with the Highest Percentage of Population Employed in Security & Protection in White Lake, MI are:
What zip code has the Highest Percentage of Population Employed in Security & Protection in White Lake, MI?
48386 has the Highest Percentage of Population Employed in Security & Protection in White Lake, MI with 1.7%.
What is the Percentage of Population Employed in Security & Protection in Michigan?
Percentage of Population Employed in Security & Protection in Michigan is 1.6%.
What is the Percentage of Population Employed in Security & Protection in the United States?
Percentage of Population Employed in Security & Protection in the United States is 2.1%.