Hardwood Acres, MI Map & Demographics
Hardwood Acres Map
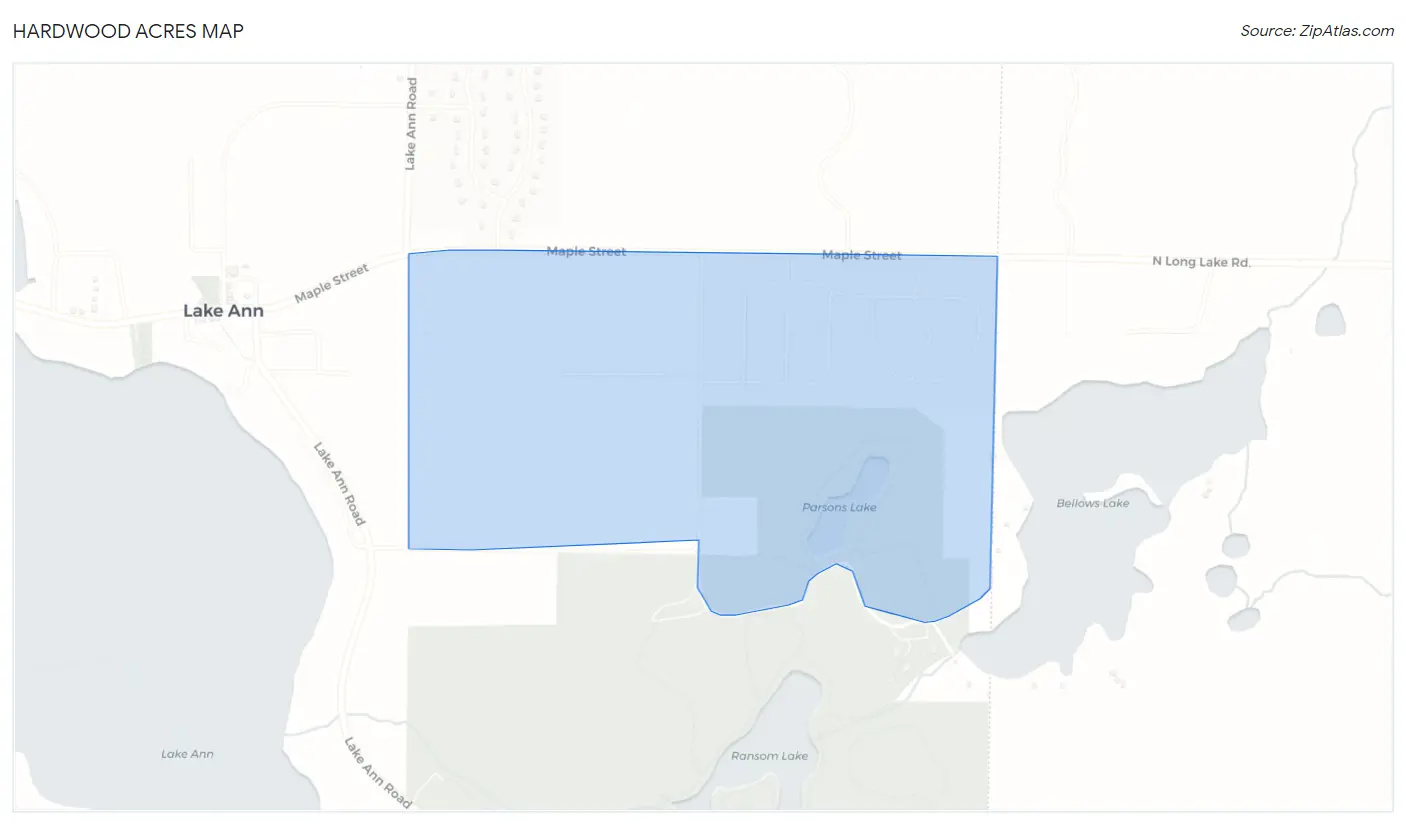
Hardwood Acres Overview
$35,337
PER CAPITA INCOME
$100,321
AVG FAMILY INCOME
$101,026
AVG HOUSEHOLD INCOME
17.1%
WAGE / INCOME GAP [ % ]
82.9¢/ $1
WAGE / INCOME GAP [ $ ]
0.22
INEQUALITY / GINI INDEX
561
TOTAL POPULATION
319
MALE POPULATION
242
FEMALE POPULATION
131.82
MALES / 100 FEMALES
75.86
FEMALES / 100 MALES
39.4
MEDIAN AGE
3.1
AVG FAMILY SIZE
3.0
AVG HOUSEHOLD SIZE
282
LABOR FORCE [ PEOPLE ]
63.2%
PERCENT IN LABOR FORCE
Income in Hardwood Acres
Income Overview in Hardwood Acres
Per Capita Income in Hardwood Acres is $35,337, while median incomes of families and households are $100,321 and $101,026 respectively.
| Characteristic | Number | Measure |
| Per Capita Income | 561 | $35,337 |
| Median Family Income | 164 | $100,321 |
| Mean Family Income | 164 | $107,423 |
| Median Household Income | 184 | $101,026 |
| Mean Household Income | 184 | $101,985 |
| Income Deficit | 164 | $0 |
| Wage / Income Gap (%) | 561 | 17.10% |
| Wage / Income Gap ($) | 561 | 82.90¢ per $1 |
| Gini / Inequality Index | 561 | 0.22 |
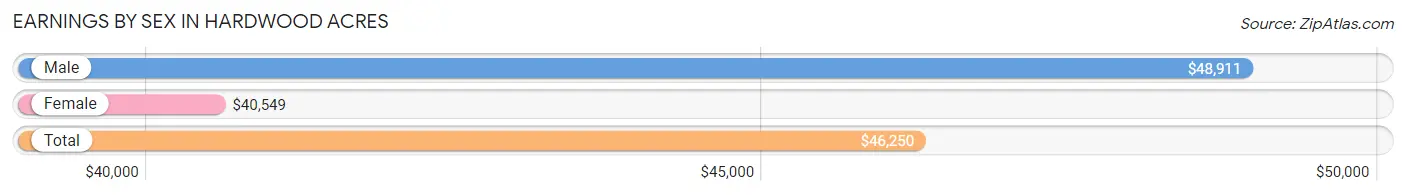
Earnings by Sex in Hardwood Acres
Average Earnings in Hardwood Acres are $46,250, $48,911 for men and $40,549 for women, a difference of 17.1%.
| Sex | Number | Average Earnings |
| Male | 171 (51.3%) | $48,911 |
| Female | 162 (48.6%) | $40,549 |
| Total | 333 (100.0%) | $46,250 |
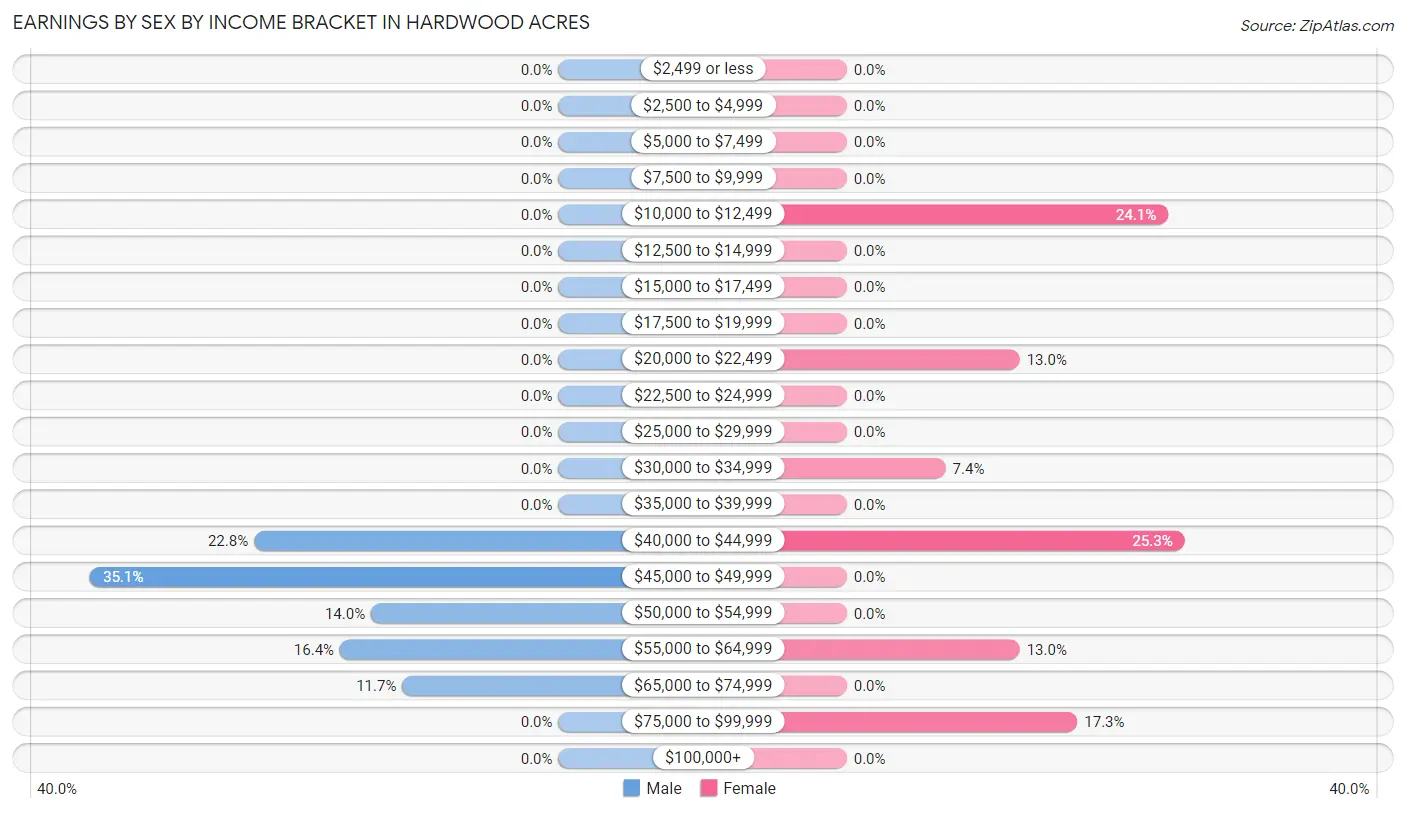
Earnings by Sex by Income Bracket in Hardwood Acres
The most common earnings brackets in Hardwood Acres are $45,000 to $49,999 for men (60 | 35.1%) and $40,000 to $44,999 for women (41 | 25.3%).
| Income | Male | Female |
| $2,499 or less | 0 (0.0%) | 0 (0.0%) |
| $2,500 to $4,999 | 0 (0.0%) | 0 (0.0%) |
| $5,000 to $7,499 | 0 (0.0%) | 0 (0.0%) |
| $7,500 to $9,999 | 0 (0.0%) | 0 (0.0%) |
| $10,000 to $12,499 | 0 (0.0%) | 39 (24.1%) |
| $12,500 to $14,999 | 0 (0.0%) | 0 (0.0%) |
| $15,000 to $17,499 | 0 (0.0%) | 0 (0.0%) |
| $17,500 to $19,999 | 0 (0.0%) | 0 (0.0%) |
| $20,000 to $22,499 | 0 (0.0%) | 21 (13.0%) |
| $22,500 to $24,999 | 0 (0.0%) | 0 (0.0%) |
| $25,000 to $29,999 | 0 (0.0%) | 0 (0.0%) |
| $30,000 to $34,999 | 0 (0.0%) | 12 (7.4%) |
| $35,000 to $39,999 | 0 (0.0%) | 0 (0.0%) |
| $40,000 to $44,999 | 39 (22.8%) | 41 (25.3%) |
| $45,000 to $49,999 | 60 (35.1%) | 0 (0.0%) |
| $50,000 to $54,999 | 24 (14.0%) | 0 (0.0%) |
| $55,000 to $64,999 | 28 (16.4%) | 21 (13.0%) |
| $65,000 to $74,999 | 20 (11.7%) | 0 (0.0%) |
| $75,000 to $99,999 | 0 (0.0%) | 28 (17.3%) |
| $100,000+ | 0 (0.0%) | 0 (0.0%) |
| Total | 171 (100.0%) | 162 (100.0%) |
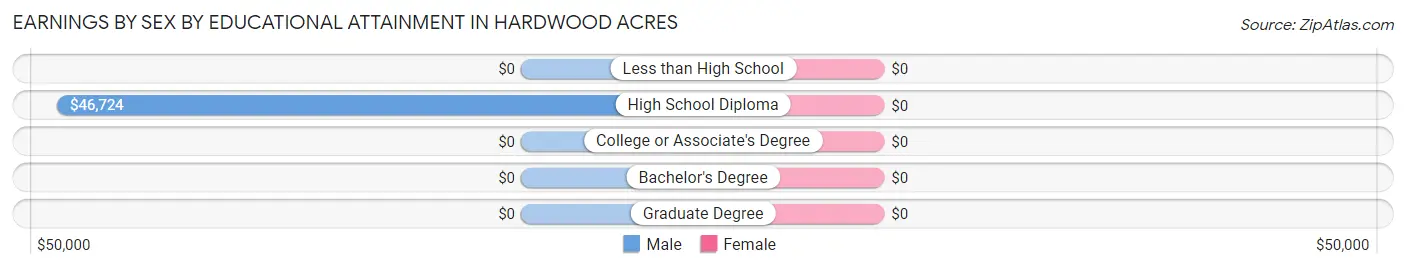
Earnings by Sex by Educational Attainment in Hardwood Acres
| Educational Attainment | Male Income | Female Income |
| Less than High School | - | - |
| High School Diploma | $46,724 | $0 |
| College or Associate's Degree | - | - |
| Bachelor's Degree | - | - |
| Graduate Degree | - | - |
| Total | $51,354 | $41,189 |
Family Income in Hardwood Acres
Family Income Brackets in Hardwood Acres
According to the Hardwood Acres family income data, there are 77 families falling into the $75,000 to $99,999 income range, which is the most common income bracket and makes up 46.9% of all families.
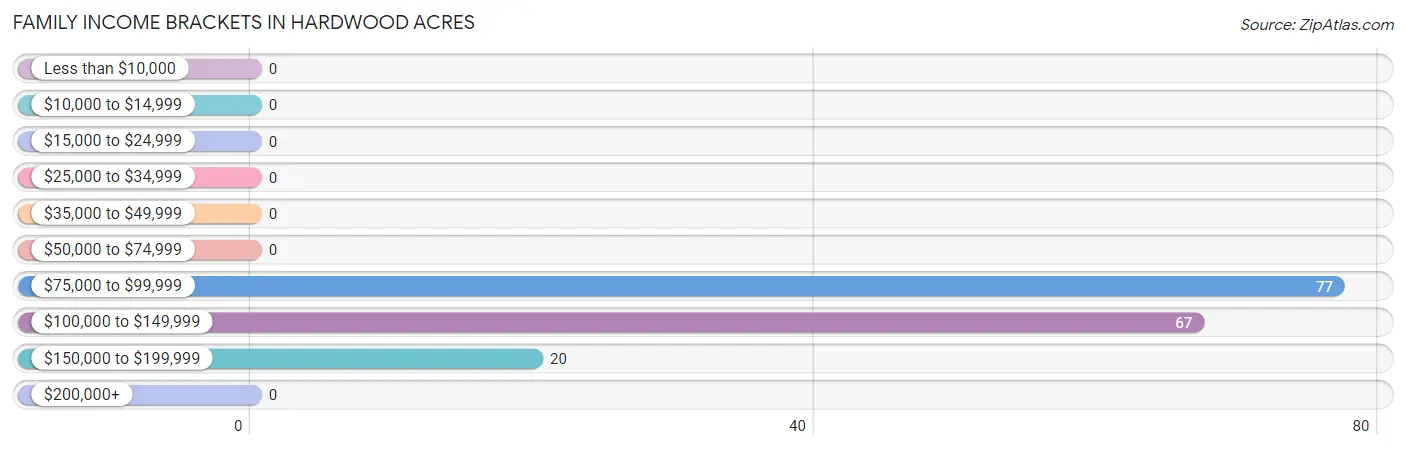
| Income Bracket | # Families | % Families |
| Less than $10,000 | 0 | 0.0% |
| $10,000 to $14,999 | 0 | 0.0% |
| $15,000 to $24,999 | 0 | 0.0% |
| $25,000 to $34,999 | 0 | 0.0% |
| $35,000 to $49,999 | 0 | 0.0% |
| $50,000 to $74,999 | 0 | 0.0% |
| $75,000 to $99,999 | 77 | 47.0% |
| $100,000 to $149,999 | 67 | 40.9% |
| $150,000 to $199,999 | 20 | 12.2% |
| $200,000+ | 0 | 0.0% |
Family Income by Famaliy Size in Hardwood Acres
3-person families (84 | 51.2%) account for the highest median family income in Hardwood Acres with $101,603 per family, while 3-person families (84 | 51.2%) have the highest median income of $33,868 per family member.
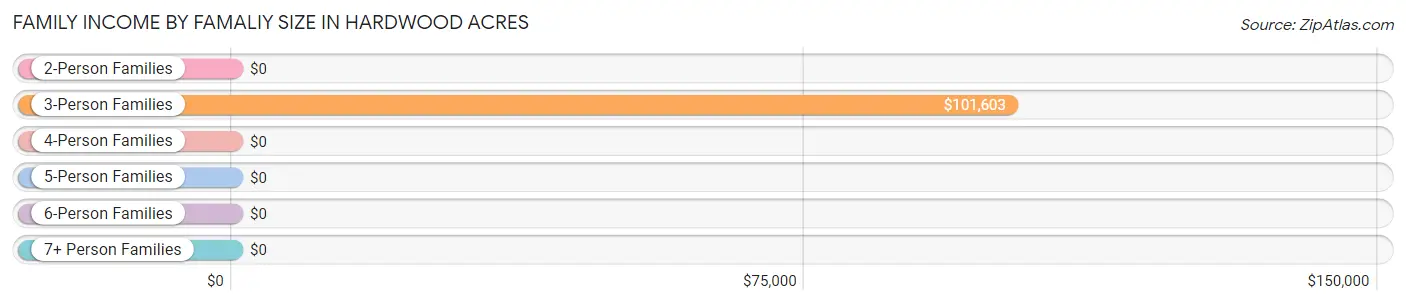
| Income Bracket | # Families | Median Income |
| 2-Person Families | 35 (21.3%) | $0 |
| 3-Person Families | 84 (51.2%) | $101,603 |
| 4-Person Families | 45 (27.4%) | $0 |
| 5-Person Families | 0 (0.0%) | $0 |
| 6-Person Families | 0 (0.0%) | $0 |
| 7+ Person Families | 0 (0.0%) | $0 |
| Total | 164 (100.0%) | $100,321 |
Family Income by Number of Earners in Hardwood Acres
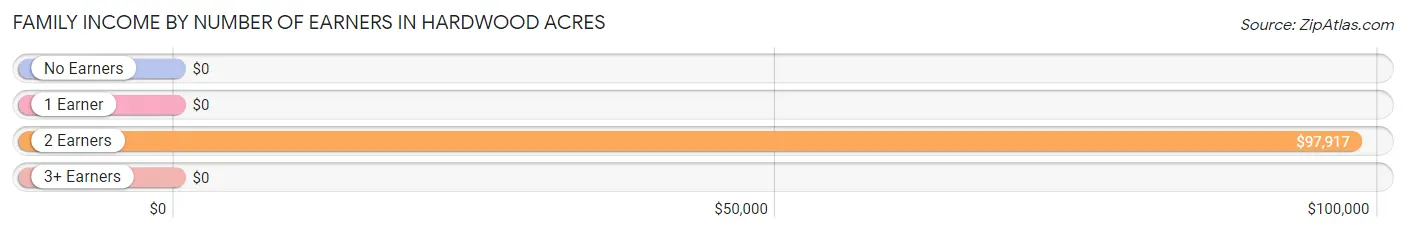
| Number of Earners | # Families | Median Income |
| No Earners | 0 (0.0%) | $0 |
| 1 Earner | 53 (32.3%) | $0 |
| 2 Earners | 91 (55.5%) | $97,917 |
| 3+ Earners | 20 (12.2%) | $0 |
| Total | 164 (100.0%) | $100,321 |
Household Income in Hardwood Acres
Household Income Brackets in Hardwood Acres
With 88 households falling in the category, the $100,000 to $149,999 income range is the most frequent in Hardwood Acres, accounting for 47.8% of all households.
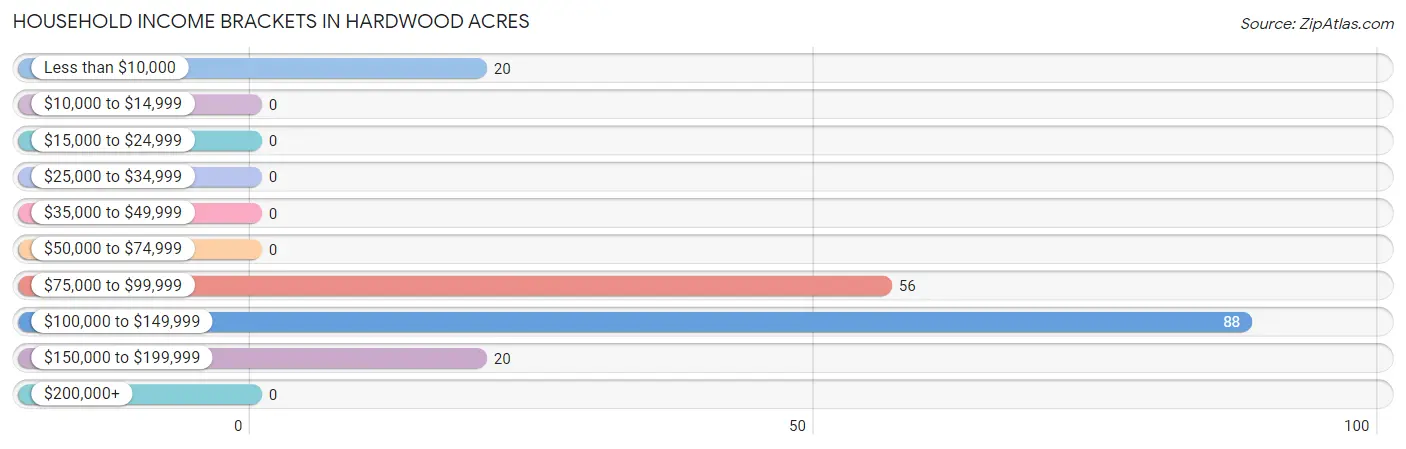
| Income Bracket | # Households | % Households |
| Less than $10,000 | 20 | 10.9% |
| $10,000 to $14,999 | 0 | 0.0% |
| $15,000 to $24,999 | 0 | 0.0% |
| $25,000 to $34,999 | 0 | 0.0% |
| $35,000 to $49,999 | 0 | 0.0% |
| $50,000 to $74,999 | 0 | 0.0% |
| $75,000 to $99,999 | 56 | 30.4% |
| $100,000 to $149,999 | 88 | 47.8% |
| $150,000 to $199,999 | 20 | 10.9% |
| $200,000+ | 0 | 0.0% |
Household Income by Householder Age in Hardwood Acres
The median household income in Hardwood Acres is $101,026, with the highest median household income of $94,744 found in the 45 to 64 years age bracket for the primary householder. A total of 104 households (56.5%) fall into this category.
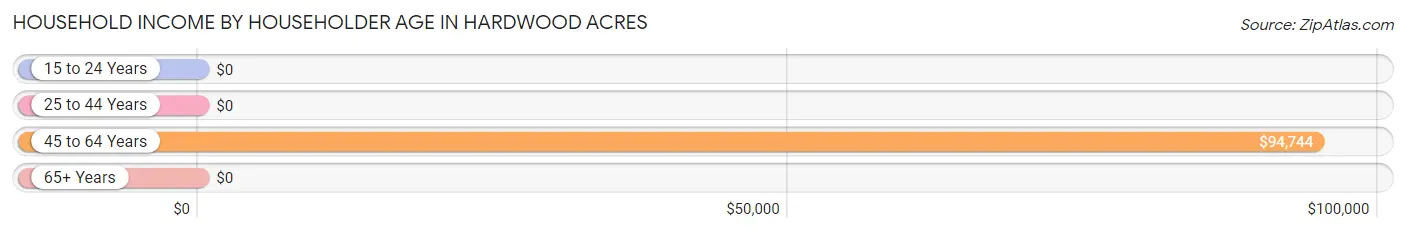
| Income Bracket | # Households | Median Income |
| 15 to 24 Years | 0 (0.0%) | $0 |
| 25 to 44 Years | 60 (32.6%) | $0 |
| 45 to 64 Years | 104 (56.5%) | $94,744 |
| 65+ Years | 20 (10.9%) | $0 |
| Total | 184 (100.0%) | $101,026 |
Poverty in Hardwood Acres
Income Below Poverty by Sex and Age in Hardwood Acres
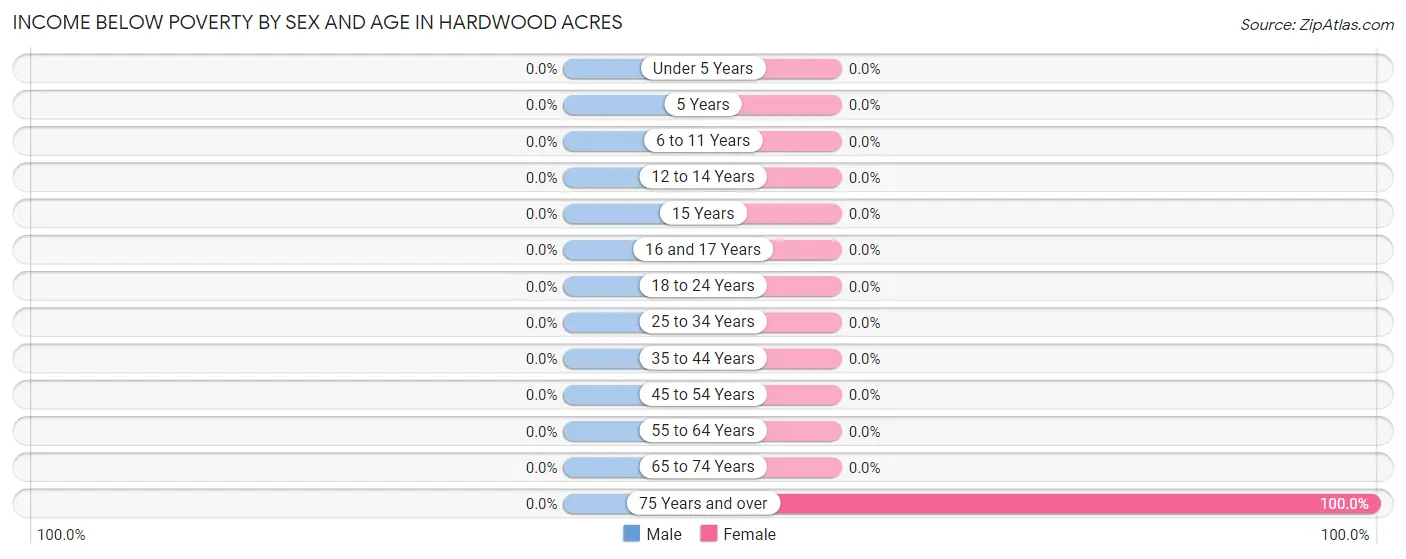
| Age Bracket | Male | Female |
| Under 5 Years | 0 (0.0%) | 0 (0.0%) |
| 5 Years | 0 (0.0%) | 0 (0.0%) |
| 6 to 11 Years | 0 (0.0%) | 0 (0.0%) |
| 12 to 14 Years | 0 (0.0%) | 0 (0.0%) |
| 15 Years | 0 (0.0%) | 0 (0.0%) |
| 16 and 17 Years | 0 (0.0%) | 0 (0.0%) |
| 18 to 24 Years | 0 (0.0%) | 0 (0.0%) |
| 25 to 34 Years | 0 (0.0%) | 0 (0.0%) |
| 35 to 44 Years | 0 (0.0%) | 0 (0.0%) |
| 45 to 54 Years | 0 (0.0%) | 0 (0.0%) |
| 55 to 64 Years | 0 (0.0%) | 0 (0.0%) |
| 65 to 74 Years | 0 (0.0%) | 0 (0.0%) |
| 75 Years and over | 0 (0.0%) | 20 (100.0%) |
| Total | 0 (0.0%) | 20 (8.3%) |
Income Above Poverty by Sex and Age in Hardwood Acres
According to the poverty statistics in Hardwood Acres, males aged 5 years and females aged 6 to 11 years are the age groups that are most secure financially, with 100.0% of males and 100.0% of females in these age groups living above the poverty line.
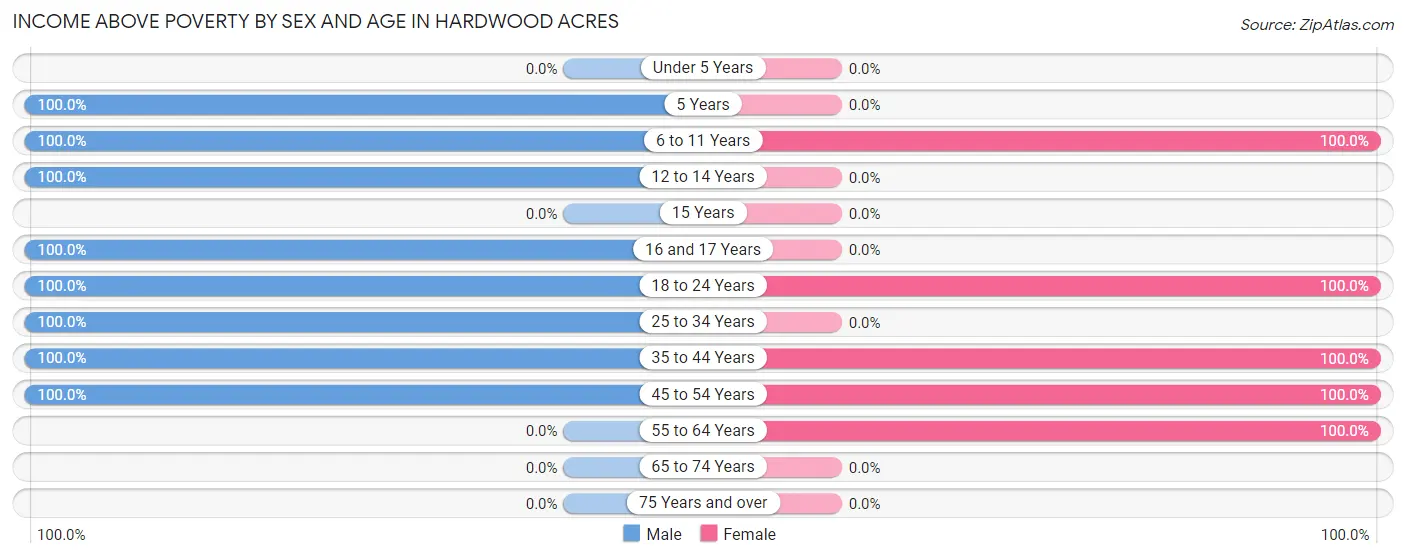
| Age Bracket | Male | Female |
| Under 5 Years | 0 (0.0%) | 0 (0.0%) |
| 5 Years | 23 (100.0%) | 0 (0.0%) |
| 6 to 11 Years | 23 (100.0%) | 41 (100.0%) |
| 12 to 14 Years | 28 (100.0%) | 0 (0.0%) |
| 15 Years | 0 (0.0%) | 0 (0.0%) |
| 16 and 17 Years | 26 (100.0%) | 0 (0.0%) |
| 18 to 24 Years | 53 (100.0%) | 21 (100.0%) |
| 25 to 34 Years | 28 (100.0%) | 0 (0.0%) |
| 35 to 44 Years | 63 (100.0%) | 60 (100.0%) |
| 45 to 54 Years | 75 (100.0%) | 88 (100.0%) |
| 55 to 64 Years | 0 (0.0%) | 12 (100.0%) |
| 65 to 74 Years | 0 (0.0%) | 0 (0.0%) |
| 75 Years and over | 0 (0.0%) | 0 (0.0%) |
| Total | 319 (100.0%) | 222 (91.7%) |
Income Below Poverty Among Married-Couple Families in Hardwood Acres
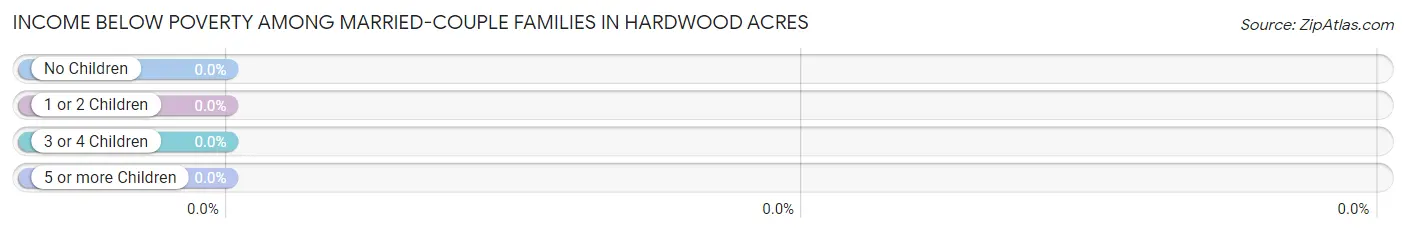
| Children | Above Poverty | Below Poverty |
| No Children | 34 (100.0%) | 0 (0.0%) |
| 1 or 2 Children | 81 (100.0%) | 0 (0.0%) |
| 3 or 4 Children | 0 (0.0%) | 0 (0.0%) |
| 5 or more Children | 0 (0.0%) | 0 (0.0%) |
| Total | 115 (100.0%) | 0 (0.0%) |
Income Below Poverty Among Single-Parent Households in Hardwood Acres
| Children | Single Father | Single Mother |
| No Children | 0 (0.0%) | 0 (0.0%) |
| 1 or 2 Children | 0 (0.0%) | 0 (0.0%) |
| 3 or 4 Children | 0 (0.0%) | 0 (0.0%) |
| 5 or more Children | 0 (0.0%) | 0 (0.0%) |
| Total | 0 (0.0%) | 0 (0.0%) |
Income Below Poverty Among Married-Couple vs Single-Parent Households in Hardwood Acres
| Children | Married-Couple Families | Single-Parent Households |
| No Children | 0 (0.0%) | 0 (0.0%) |
| 1 or 2 Children | 0 (0.0%) | 0 (0.0%) |
| 3 or 4 Children | 0 (0.0%) | 0 (0.0%) |
| 5 or more Children | 0 (0.0%) | 0 (0.0%) |
| Total | 0 (0.0%) | 0 (0.0%) |
Race in Hardwood Acres
The most populous races in Hardwood Acres are , and White / Caucasian (561 | 100.0%).
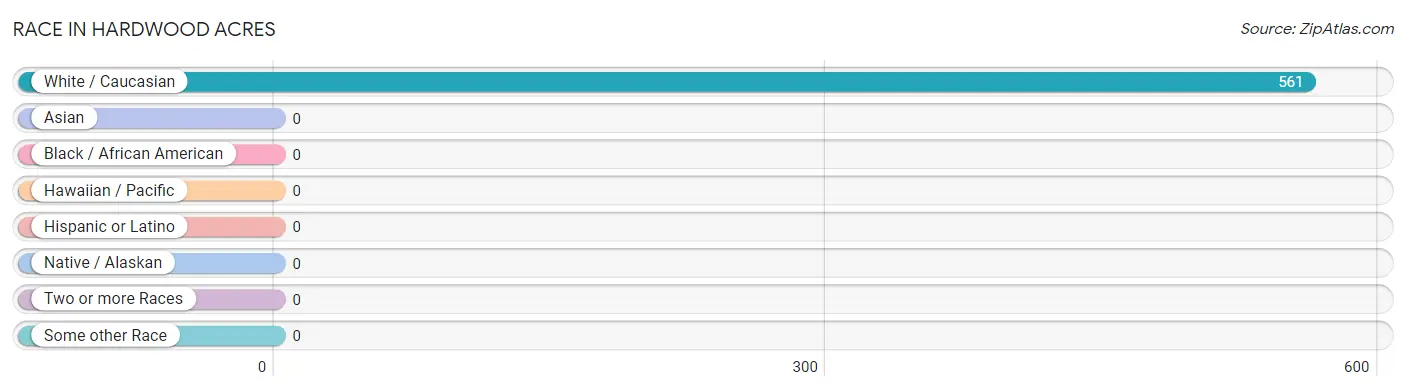
| Race | # Population | % Population |
| Asian | 0 | 0.0% |
| Black / African American | 0 | 0.0% |
| Hawaiian / Pacific | 0 | 0.0% |
| Hispanic or Latino | 0 | 0.0% |
| Native / Alaskan | 0 | 0.0% |
| White / Caucasian | 561 | 100.0% |
| Two or more Races | 0 | 0.0% |
| Some other Race | 0 | 0.0% |
| Total | 561 | 100.0% |
Ancestry in Hardwood Acres
The most populous ancestries reported in Hardwood Acres are English (120 | 21.4%), Polish (117 | 20.9%), Irish (81 | 14.4%), German (59 | 10.5%), and Portuguese (49 | 8.7%), together accounting for 75.9% of all Hardwood Acres residents.
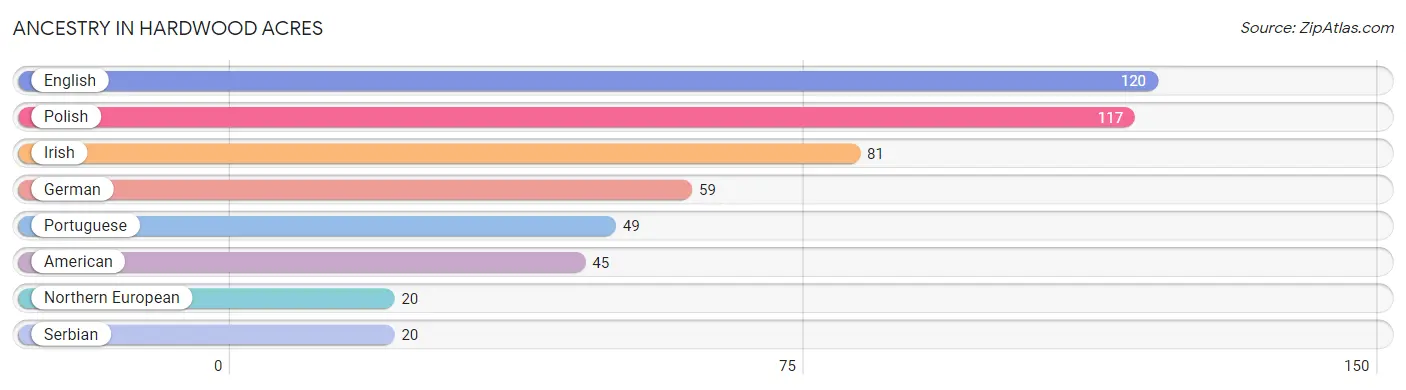
| Ancestry | # Population | % Population |
| American | 45 | 8.0% |
| English | 120 | 21.4% |
| German | 59 | 10.5% |
| Irish | 81 | 14.4% |
| Northern European | 20 | 3.6% |
| Polish | 117 | 20.9% |
| Portuguese | 49 | 8.7% |
| Serbian | 20 | 3.6% | View All 8 Rows |
Immigrants in Hardwood Acres

| Immigration Origin | # Population | % Population | View All 0 Rows |
Sex and Age in Hardwood Acres
Sex and Age in Hardwood Acres
The most populous age groups in Hardwood Acres are 40 to 44 Years (63 | 19.8%) for men and 50 to 54 Years (63 | 26.0%) for women.
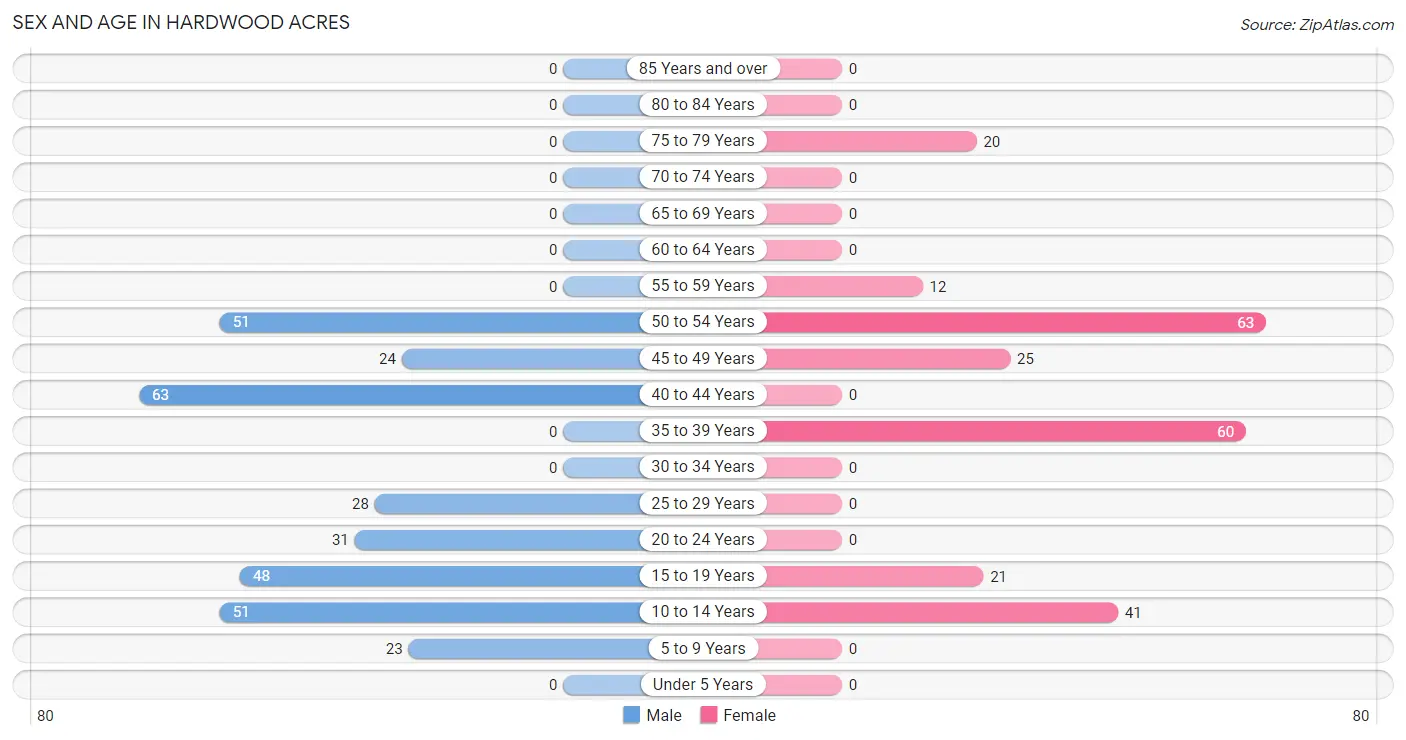
| Age Bracket | Male | Female |
| Under 5 Years | 0 (0.0%) | 0 (0.0%) |
| 5 to 9 Years | 23 (7.2%) | 0 (0.0%) |
| 10 to 14 Years | 51 (16.0%) | 41 (16.9%) |
| 15 to 19 Years | 48 (15.0%) | 21 (8.7%) |
| 20 to 24 Years | 31 (9.7%) | 0 (0.0%) |
| 25 to 29 Years | 28 (8.8%) | 0 (0.0%) |
| 30 to 34 Years | 0 (0.0%) | 0 (0.0%) |
| 35 to 39 Years | 0 (0.0%) | 60 (24.8%) |
| 40 to 44 Years | 63 (19.8%) | 0 (0.0%) |
| 45 to 49 Years | 24 (7.5%) | 25 (10.3%) |
| 50 to 54 Years | 51 (16.0%) | 63 (26.0%) |
| 55 to 59 Years | 0 (0.0%) | 12 (5.0%) |
| 60 to 64 Years | 0 (0.0%) | 0 (0.0%) |
| 65 to 69 Years | 0 (0.0%) | 0 (0.0%) |
| 70 to 74 Years | 0 (0.0%) | 0 (0.0%) |
| 75 to 79 Years | 0 (0.0%) | 20 (8.3%) |
| 80 to 84 Years | 0 (0.0%) | 0 (0.0%) |
| 85 Years and over | 0 (0.0%) | 0 (0.0%) |
| Total | 319 (100.0%) | 242 (100.0%) |
Families and Households in Hardwood Acres
Median Family Size in Hardwood Acres
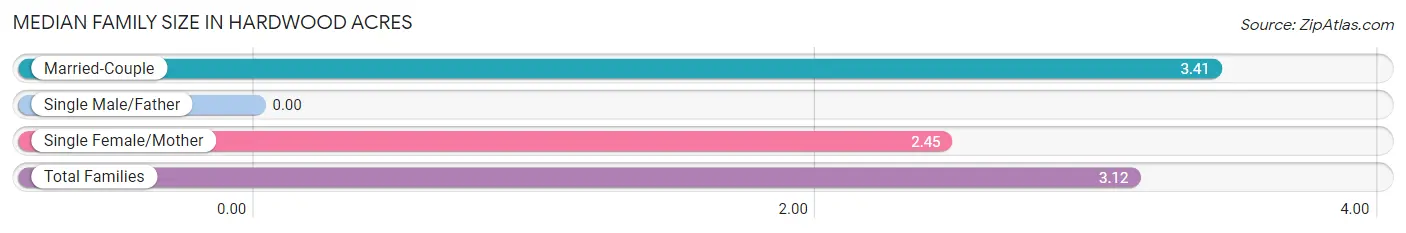
| Family Type | # Families | Family Size |
| Married-Couple | 115 (70.1%) | 3.41 |
| Single Male/Father | 0 (0.0%) | - |
| Single Female/Mother | 49 (29.9%) | 2.45 |
| Total Families | 164 (100.0%) | 3.12 |
Median Household Size in Hardwood Acres
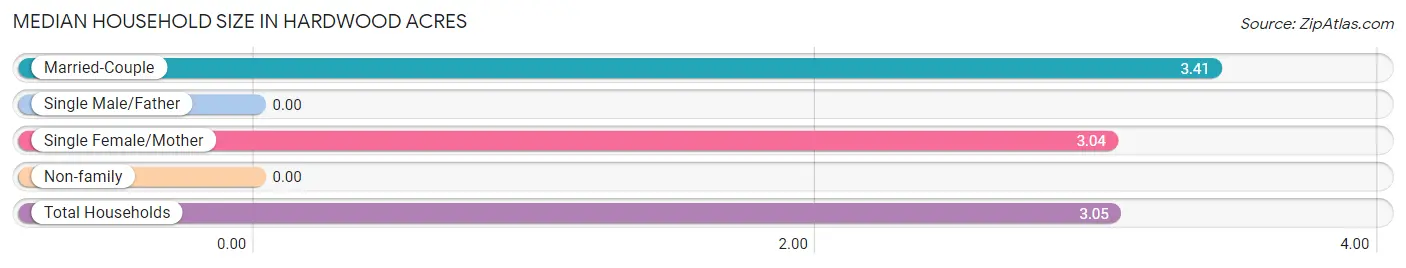
| Household Type | # Households | Household Size |
| Married-Couple | 115 (62.5%) | 3.41 |
| Single Male/Father | 0 (0.0%) | - |
| Single Female/Mother | 49 (26.6%) | 3.04 |
| Non-family | 20 (10.9%) | - |
| Total Households | 184 (100.0%) | 3.05 |
Household Size by Marriage Status in Hardwood Acres
Out of a total of 184 households in Hardwood Acres, 164 (89.1%) are family households, while 20 (10.9%) are nonfamily households. The most numerous type of family households are 3-person households, comprising 105, and the most common type of nonfamily households are 1-person households, comprising 20.
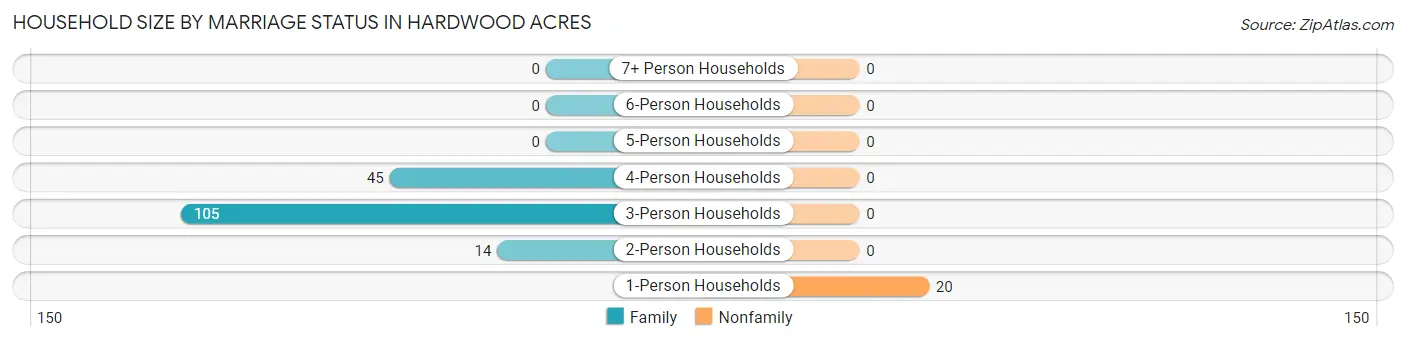
| Household Size | Family Households | Nonfamily Households |
| 1-Person Households | - | 20 (10.9%) |
| 2-Person Households | 14 (7.6%) | 0 (0.0%) |
| 3-Person Households | 105 (57.1%) | 0 (0.0%) |
| 4-Person Households | 45 (24.5%) | 0 (0.0%) |
| 5-Person Households | 0 (0.0%) | 0 (0.0%) |
| 6-Person Households | 0 (0.0%) | 0 (0.0%) |
| 7+ Person Households | 0 (0.0%) | 0 (0.0%) |
| Total | 164 (89.1%) | 20 (10.9%) |
Female Fertility in Hardwood Acres
Fertility by Age in Hardwood Acres
| Age Bracket | Women with Births | Births / 1,000 Women |
| 15 to 19 years | 0 (0.0%) | 0.0 |
| 20 to 34 years | 0 (0.0%) | 0.0 |
| 35 to 50 years | 0 (0.0%) | 0.0 |
| Total | 0 (0.0%) | 0.0 |
Fertility by Age by Marriage Status in Hardwood Acres
| Age Bracket | Married | Unmarried |
| 15 to 19 years | 0 (0.0%) | 0 (0.0%) |
| 20 to 34 years | 0 (0.0%) | 0 (0.0%) |
| 35 to 50 years | 0 (0.0%) | 0 (0.0%) |
| Total | 0 (0.0%) | 0 (0.0%) |
Fertility by Education in Hardwood Acres
| Educational Attainment | Women with Births | Births / 1,000 Women |
| Less than High School | 0 (0.0%) | 0.0 |
| High School Diploma | 0 (0.0%) | 0.0 |
| College or Associate's Degree | 0 (0.0%) | 0.0 |
| Bachelor's Degree | 0 (0.0%) | 0.0 |
| Graduate Degree | 0 (0.0%) | 0.0 |
| Total | 0 (0.0%) | 0.0 |
Fertility by Education by Marriage Status in Hardwood Acres
| Educational Attainment | Married | Unmarried |
| Less than High School | 0 (0.0%) | 0 (0.0%) |
| High School Diploma | 0 (0.0%) | 0 (0.0%) |
| College or Associate's Degree | 0 (0.0%) | 0 (0.0%) |
| Bachelor's Degree | 0 (0.0%) | 0 (0.0%) |
| Graduate Degree | 0 (0.0%) | 0 (0.0%) |
| Total | 0 (0.0%) | 0 (0.0%) |
Employment Characteristics in Hardwood Acres
Employment by Class of Employer in Hardwood Acres
Among the 282 employed individuals in Hardwood Acres, private company employees (108 | 38.3%), local government employees (77 | 27.3%), and not-for-profit organizations (64 | 22.7%) make up the most common classes of employment.
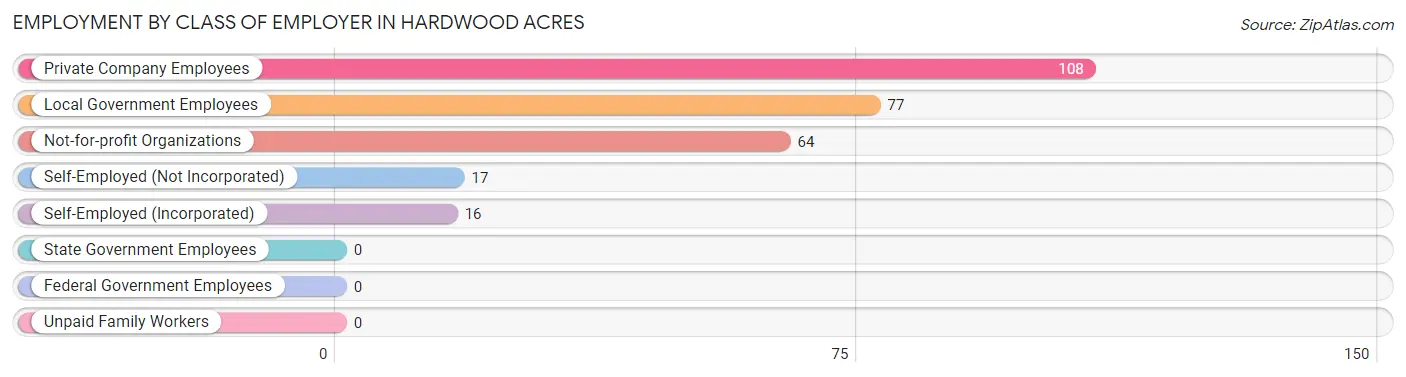
| Employer Class | # Employees | % Employees |
| Private Company Employees | 108 | 38.3% |
| Self-Employed (Incorporated) | 16 | 5.7% |
| Self-Employed (Not Incorporated) | 17 | 6.0% |
| Not-for-profit Organizations | 64 | 22.7% |
| Local Government Employees | 77 | 27.3% |
| State Government Employees | 0 | 0.0% |
| Federal Government Employees | 0 | 0.0% |
| Unpaid Family Workers | 0 | 0.0% |
| Total | 282 | 100.0% |
Employment Status by Age in Hardwood Acres
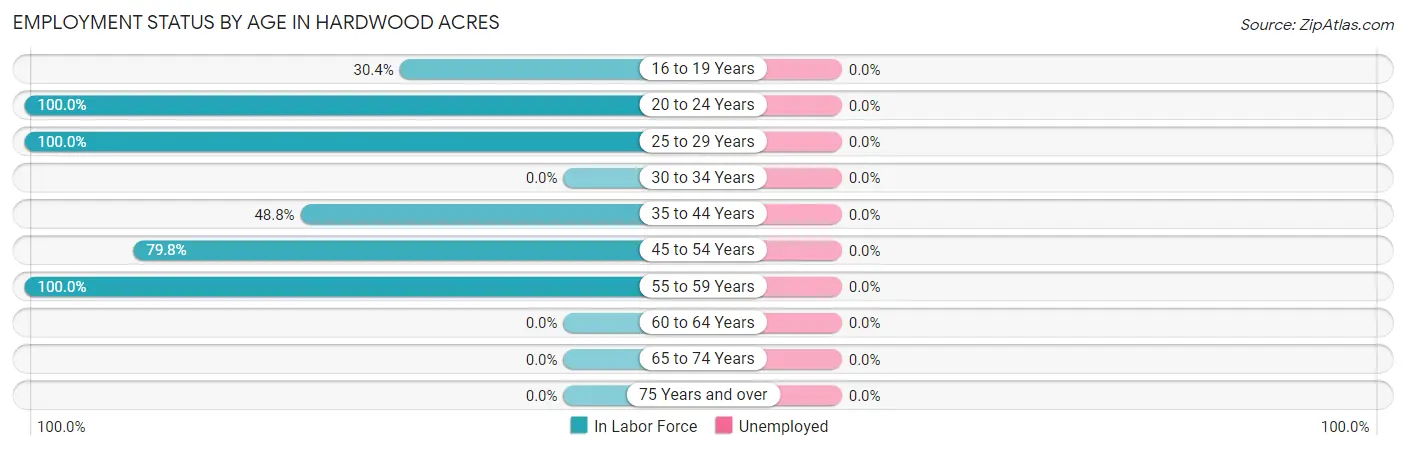
| Age Bracket | In Labor Force | Unemployed |
| 16 to 19 Years | 21 (30.4%) | 0 (0.0%) |
| 20 to 24 Years | 31 (100.0%) | 0 (0.0%) |
| 25 to 29 Years | 28 (100.0%) | 0 (0.0%) |
| 30 to 34 Years | 0 (0.0%) | 0 (0.0%) |
| 35 to 44 Years | 60 (48.8%) | 0 (0.0%) |
| 45 to 54 Years | 130 (79.8%) | 0 (0.0%) |
| 55 to 59 Years | 12 (100.0%) | 0 (0.0%) |
| 60 to 64 Years | 0 (0.0%) | 0 (0.0%) |
| 65 to 74 Years | 0 (0.0%) | 0 (0.0%) |
| 75 Years and over | 0 (0.0%) | 0 (0.0%) |
| Total | 282 (63.2%) | 0 (0.0%) |
Employment Status by Educational Attainment in Hardwood Acres
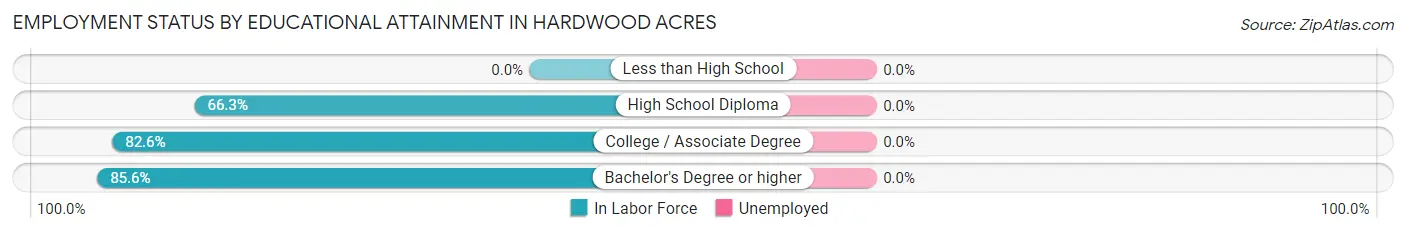
| Educational Attainment | In Labor Force | Unemployed |
| Less than High School | 0 (0.0%) | 0 (0.0%) |
| High School Diploma | 57 (66.3%) | 0 (0.0%) |
| College / Associate Degree | 90 (82.6%) | 0 (0.0%) |
| Bachelor's Degree or higher | 83 (85.6%) | 0 (0.0%) |
| Total | 230 (70.6%) | 0 (0.0%) |
Employment Occupations by Sex in Hardwood Acres
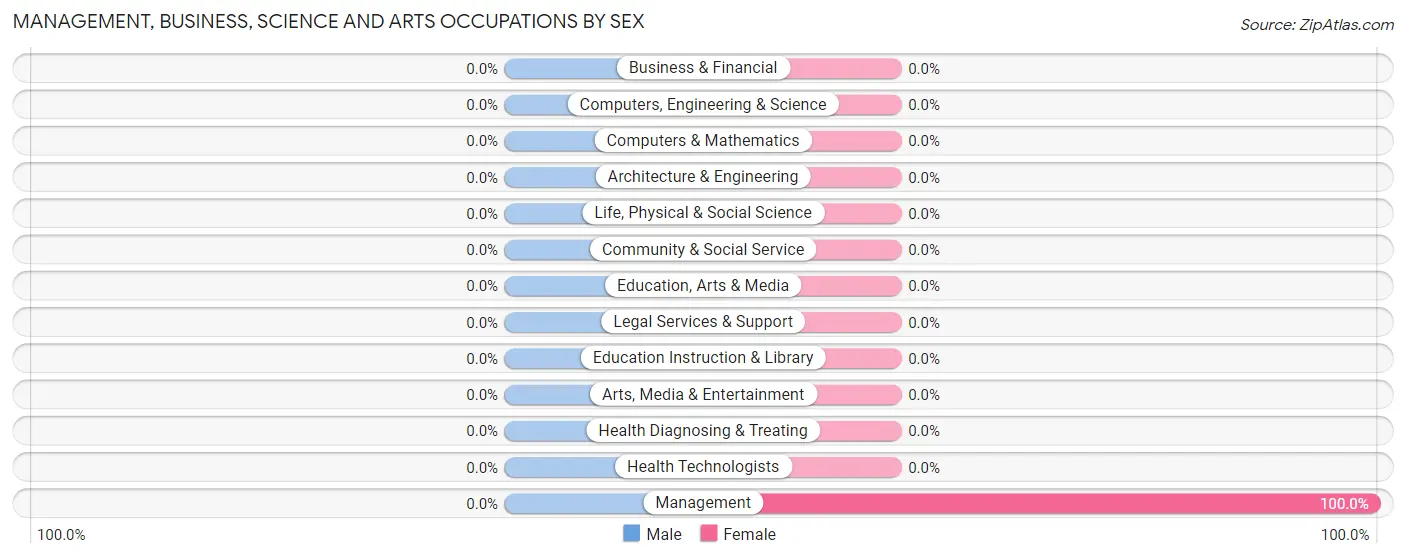
Management, Business, Science and Arts Occupations
The most common Management, Business, Science and Arts occupations in Hardwood Acres are , and Management (88 | 31.2%).
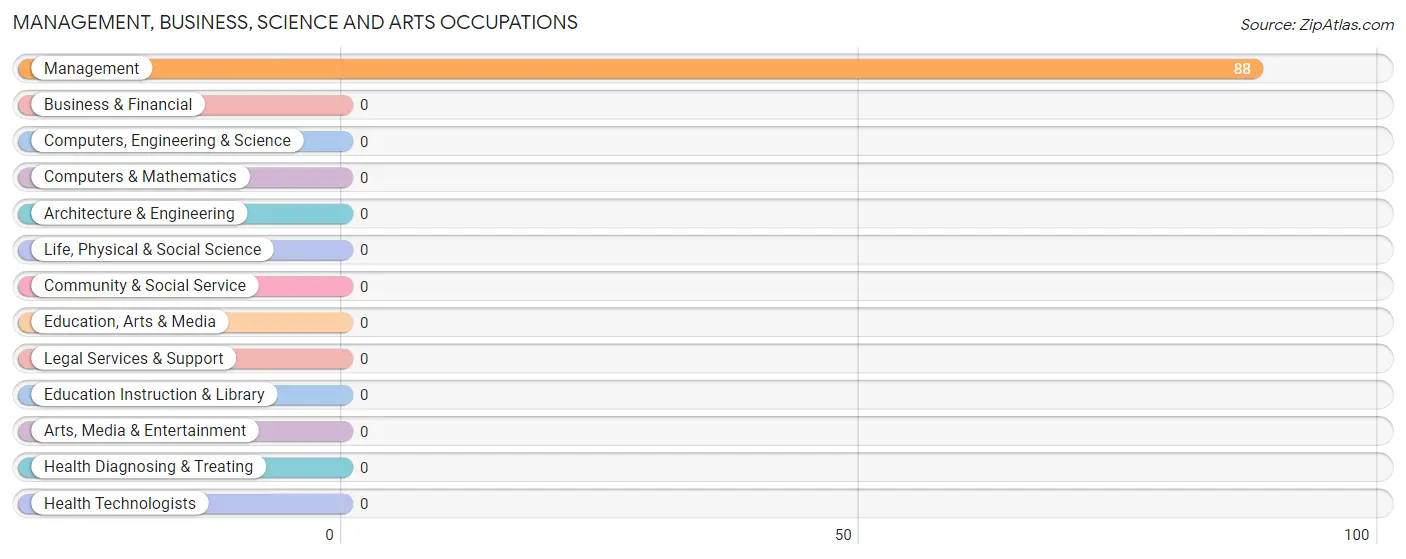
Management, Business, Science and Arts Occupations by Sex
| Occupation | Male | Female |
| Management | 0 (0.0%) | 88 (100.0%) |
| Business & Financial | 0 (0.0%) | 0 (0.0%) |
| Computers, Engineering & Science | 0 (0.0%) | 0 (0.0%) |
| Computers & Mathematics | 0 (0.0%) | 0 (0.0%) |
| Architecture & Engineering | 0 (0.0%) | 0 (0.0%) |
| Life, Physical & Social Science | 0 (0.0%) | 0 (0.0%) |
| Community & Social Service | 0 (0.0%) | 0 (0.0%) |
| Education, Arts & Media | 0 (0.0%) | 0 (0.0%) |
| Legal Services & Support | 0 (0.0%) | 0 (0.0%) |
| Education Instruction & Library | 0 (0.0%) | 0 (0.0%) |
| Arts, Media & Entertainment | 0 (0.0%) | 0 (0.0%) |
| Health Diagnosing & Treating | 0 (0.0%) | 0 (0.0%) |
| Health Technologists | 0 (0.0%) | 0 (0.0%) |
| Total (Category) | 0 (0.0%) | 88 (100.0%) |
| Total (Overall) | 120 (42.5%) | 162 (57.5%) |
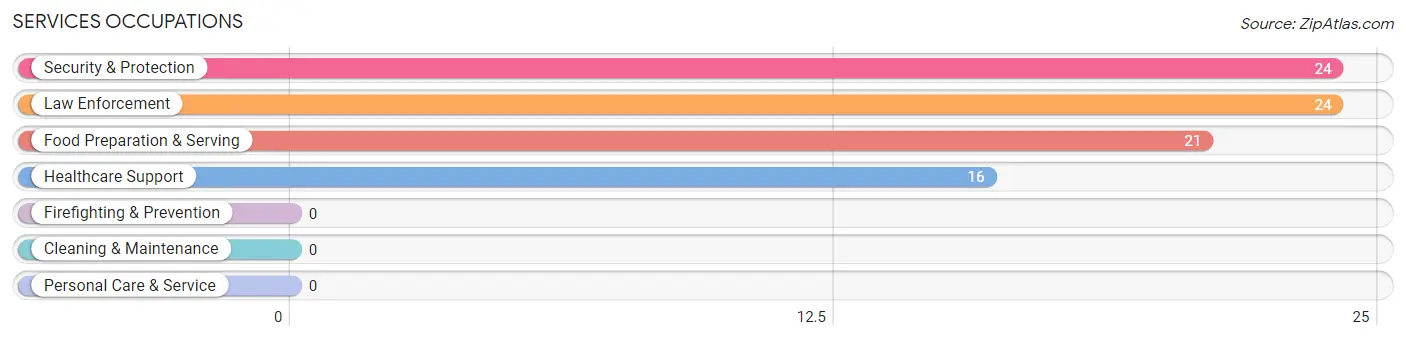
Services Occupations
The most common Services occupations in Hardwood Acres are Security & Protection (24 | 8.5%), Law Enforcement (24 | 8.5%), Food Preparation & Serving (21 | 7.4%), and Healthcare Support (16 | 5.7%).
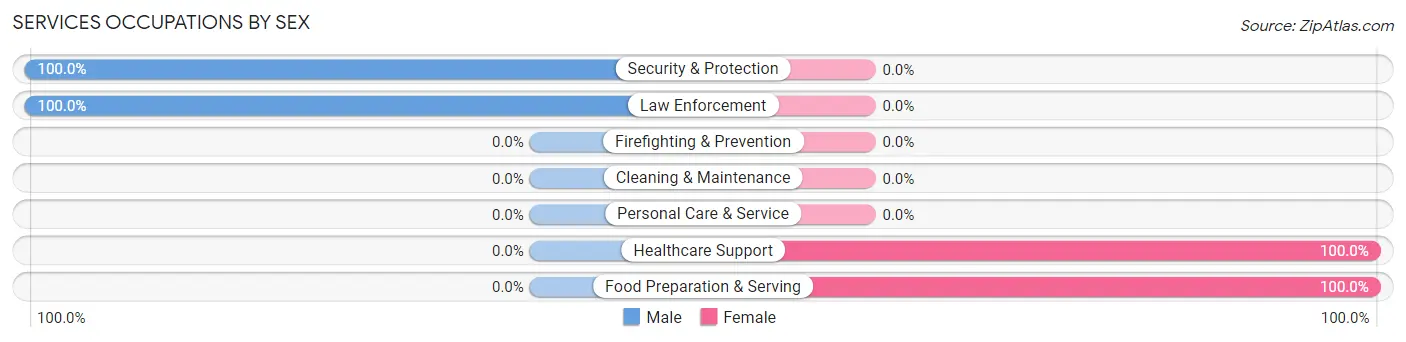
Services Occupations by Sex
Within the Services occupations in Hardwood Acres, the most male-oriented occupations are Security & Protection (100.0%), and Law Enforcement (100.0%), while the most female-oriented occupations are Healthcare Support (100.0%), and Food Preparation & Serving (100.0%).
| Occupation | Male | Female |
| Healthcare Support | 0 (0.0%) | 16 (100.0%) |
| Security & Protection | 24 (100.0%) | 0 (0.0%) |
| Firefighting & Prevention | 0 (0.0%) | 0 (0.0%) |
| Law Enforcement | 24 (100.0%) | 0 (0.0%) |
| Food Preparation & Serving | 0 (0.0%) | 21 (100.0%) |
| Cleaning & Maintenance | 0 (0.0%) | 0 (0.0%) |
| Personal Care & Service | 0 (0.0%) | 0 (0.0%) |
| Total (Category) | 24 (39.3%) | 37 (60.7%) |
| Total (Overall) | 120 (42.5%) | 162 (57.5%) |
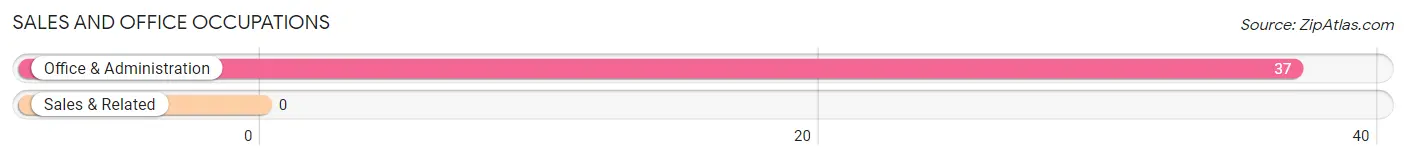
Sales and Office Occupations
The most common Sales and Office occupations in Hardwood Acres are , and Office & Administration (37 | 13.1%).
Sales and Office Occupations by Sex
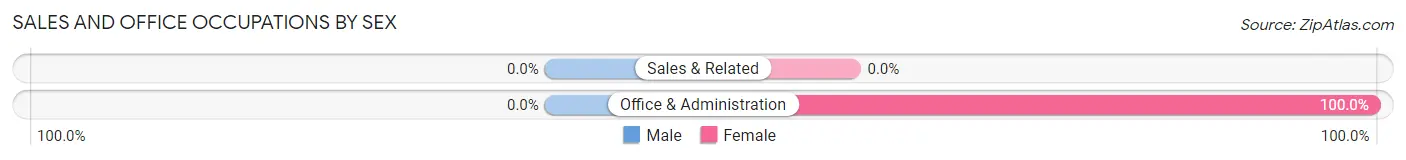
| Occupation | Male | Female |
| Sales & Related | 0 (0.0%) | 0 (0.0%) |
| Office & Administration | 0 (0.0%) | 37 (100.0%) |
| Total (Category) | 0 (0.0%) | 37 (100.0%) |
| Total (Overall) | 120 (42.5%) | 162 (57.5%) |
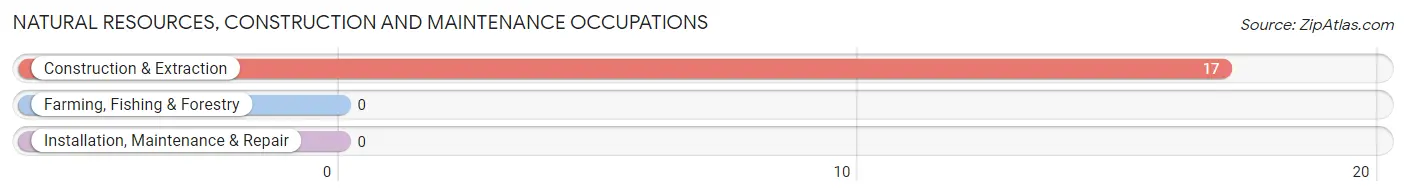
Natural Resources, Construction and Maintenance Occupations
The most common Natural Resources, Construction and Maintenance occupations in Hardwood Acres are , and Construction & Extraction (17 | 6.0%).
Natural Resources, Construction and Maintenance Occupations by Sex
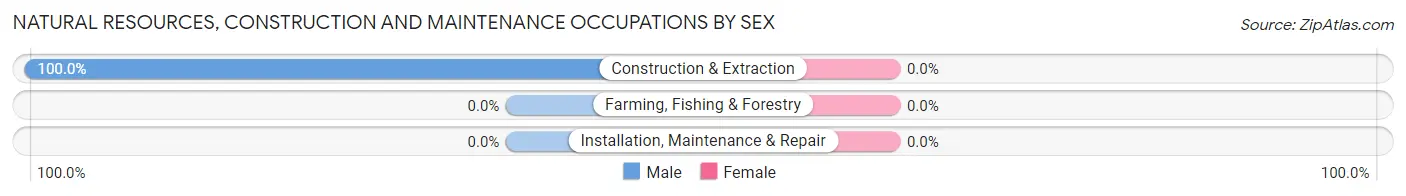
| Occupation | Male | Female |
| Farming, Fishing & Forestry | 0 (0.0%) | 0 (0.0%) |
| Construction & Extraction | 17 (100.0%) | 0 (0.0%) |
| Installation, Maintenance & Repair | 0 (0.0%) | 0 (0.0%) |
| Total (Category) | 17 (100.0%) | 0 (0.0%) |
| Total (Overall) | 120 (42.5%) | 162 (57.5%) |
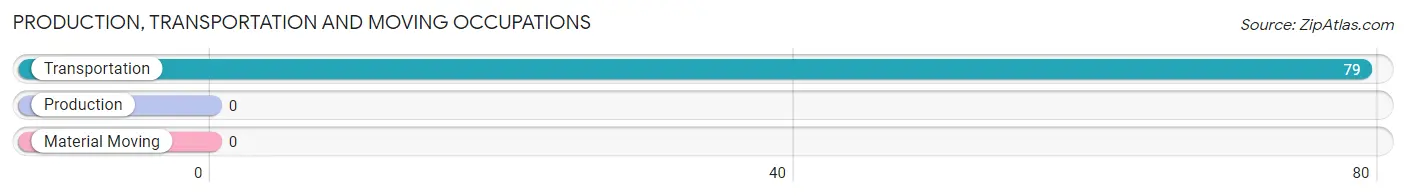
Production, Transportation and Moving Occupations
The most common Production, Transportation and Moving occupations in Hardwood Acres are , and Transportation (79 | 28.0%).
Production, Transportation and Moving Occupations by Sex
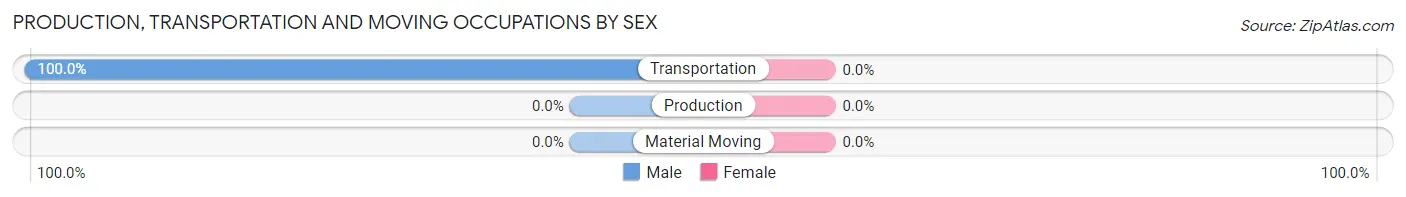
| Occupation | Male | Female |
| Production | 0 (0.0%) | 0 (0.0%) |
| Transportation | 79 (100.0%) | 0 (0.0%) |
| Material Moving | 0 (0.0%) | 0 (0.0%) |
| Total (Category) | 79 (100.0%) | 0 (0.0%) |
| Total (Overall) | 120 (42.5%) | 162 (57.5%) |
Employment Industries by Sex in Hardwood Acres
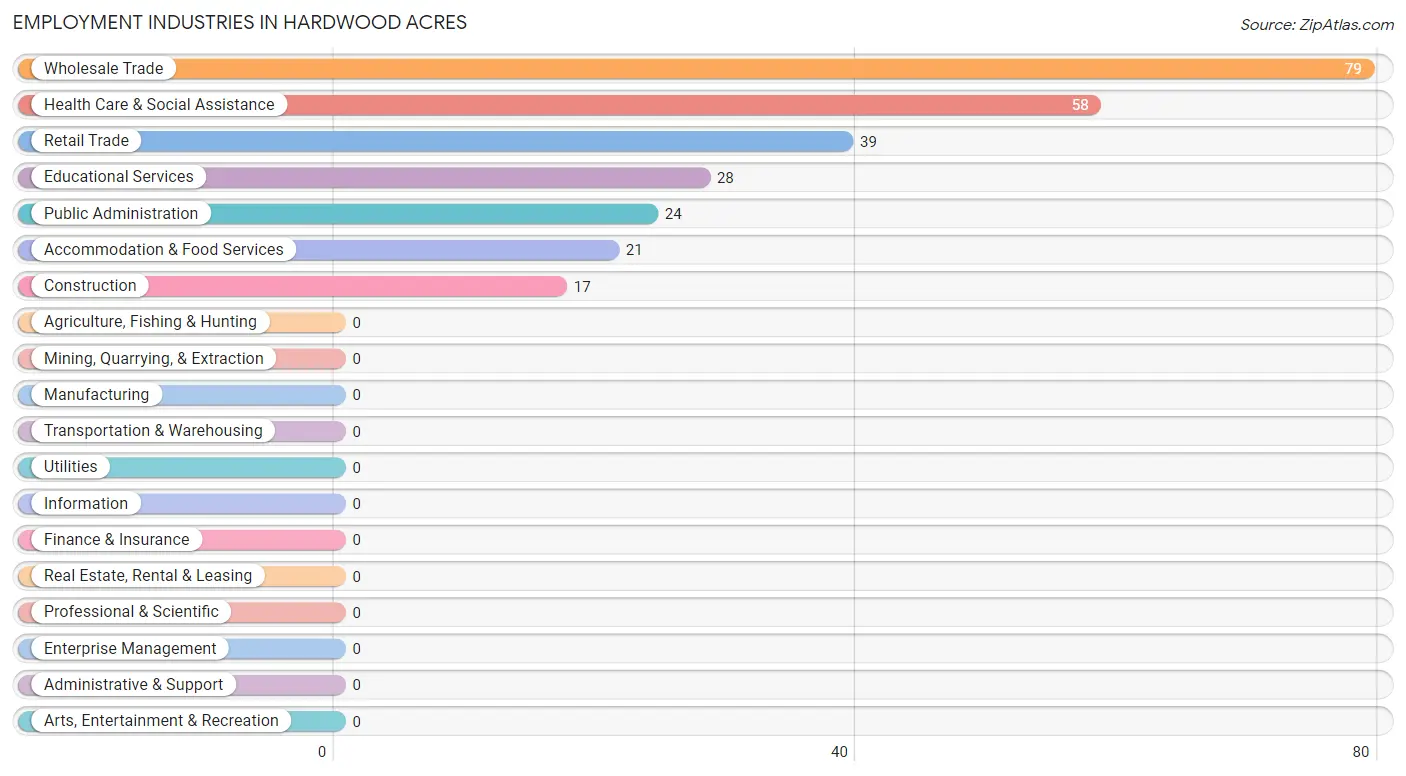
Employment Industries in Hardwood Acres
The major employment industries in Hardwood Acres include Wholesale Trade (79 | 28.0%), Health Care & Social Assistance (58 | 20.6%), Retail Trade (39 | 13.8%), Educational Services (28 | 9.9%), and Public Administration (24 | 8.5%).
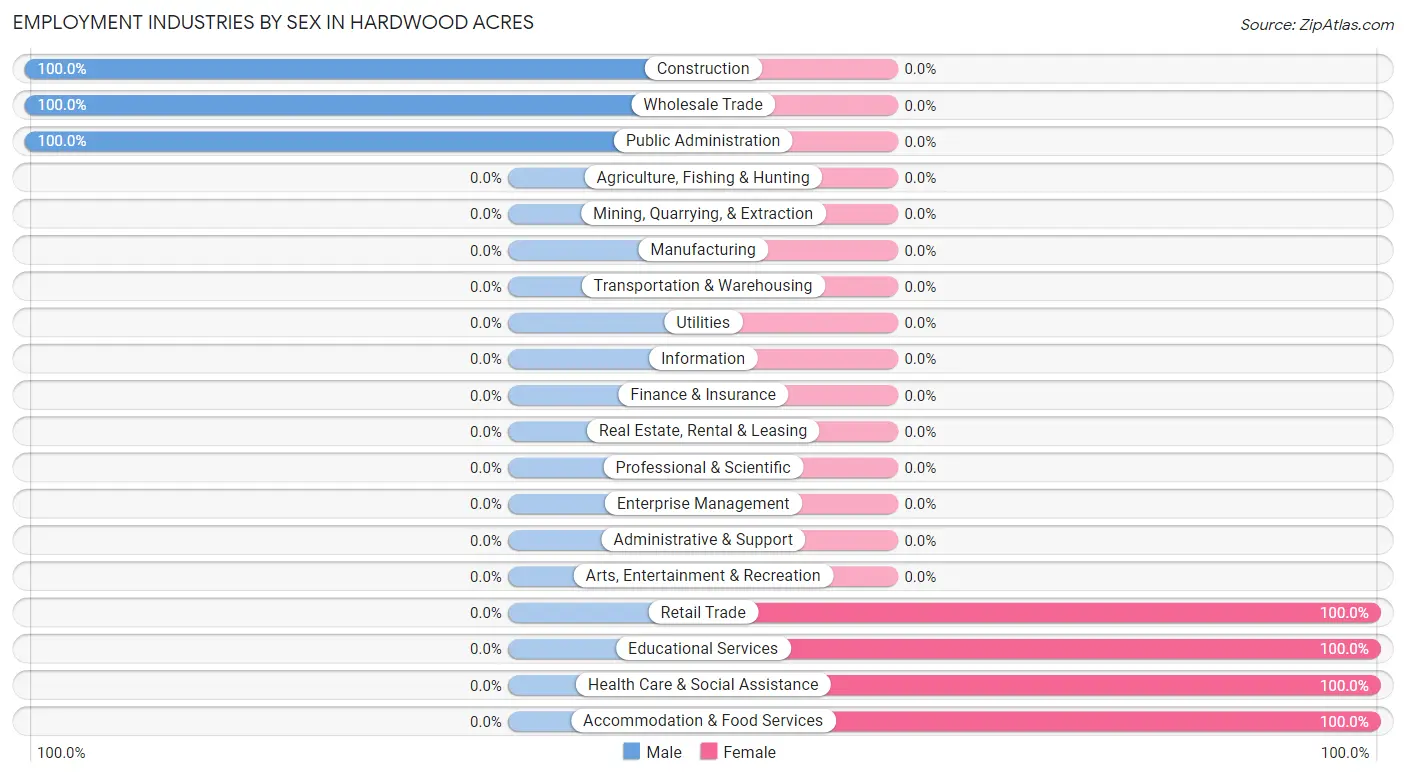
Employment Industries by Sex in Hardwood Acres
The Hardwood Acres industries that see more men than women are Construction (100.0%), Wholesale Trade (100.0%), and Public Administration (100.0%), whereas the industries that tend to have a higher number of women are Retail Trade (100.0%), Educational Services (100.0%), and Health Care & Social Assistance (100.0%).
| Industry | Male | Female |
| Agriculture, Fishing & Hunting | 0 (0.0%) | 0 (0.0%) |
| Mining, Quarrying, & Extraction | 0 (0.0%) | 0 (0.0%) |
| Construction | 17 (100.0%) | 0 (0.0%) |
| Manufacturing | 0 (0.0%) | 0 (0.0%) |
| Wholesale Trade | 79 (100.0%) | 0 (0.0%) |
| Retail Trade | 0 (0.0%) | 39 (100.0%) |
| Transportation & Warehousing | 0 (0.0%) | 0 (0.0%) |
| Utilities | 0 (0.0%) | 0 (0.0%) |
| Information | 0 (0.0%) | 0 (0.0%) |
| Finance & Insurance | 0 (0.0%) | 0 (0.0%) |
| Real Estate, Rental & Leasing | 0 (0.0%) | 0 (0.0%) |
| Professional & Scientific | 0 (0.0%) | 0 (0.0%) |
| Enterprise Management | 0 (0.0%) | 0 (0.0%) |
| Administrative & Support | 0 (0.0%) | 0 (0.0%) |
| Educational Services | 0 (0.0%) | 28 (100.0%) |
| Health Care & Social Assistance | 0 (0.0%) | 58 (100.0%) |
| Arts, Entertainment & Recreation | 0 (0.0%) | 0 (0.0%) |
| Accommodation & Food Services | 0 (0.0%) | 21 (100.0%) |
| Public Administration | 24 (100.0%) | 0 (0.0%) |
| Total | 120 (42.5%) | 162 (57.5%) |
Education in Hardwood Acres
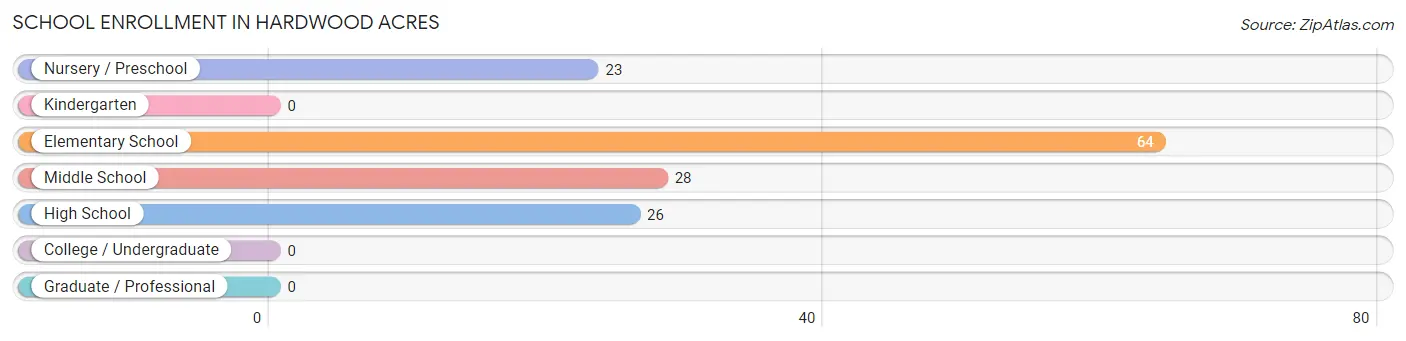
School Enrollment in Hardwood Acres
The most common levels of schooling among the 141 students in Hardwood Acres are elementary school (64 | 45.4%), middle school (28 | 19.9%), and high school (26 | 18.4%).
| School Level | # Students | % Students |
| Nursery / Preschool | 23 | 16.3% |
| Kindergarten | 0 | 0.0% |
| Elementary School | 64 | 45.4% |
| Middle School | 28 | 19.9% |
| High School | 26 | 18.4% |
| College / Undergraduate | 0 | 0.0% |
| Graduate / Professional | 0 | 0.0% |
| Total | 141 | 100.0% |
School Enrollment by Age by Funding Source in Hardwood Acres
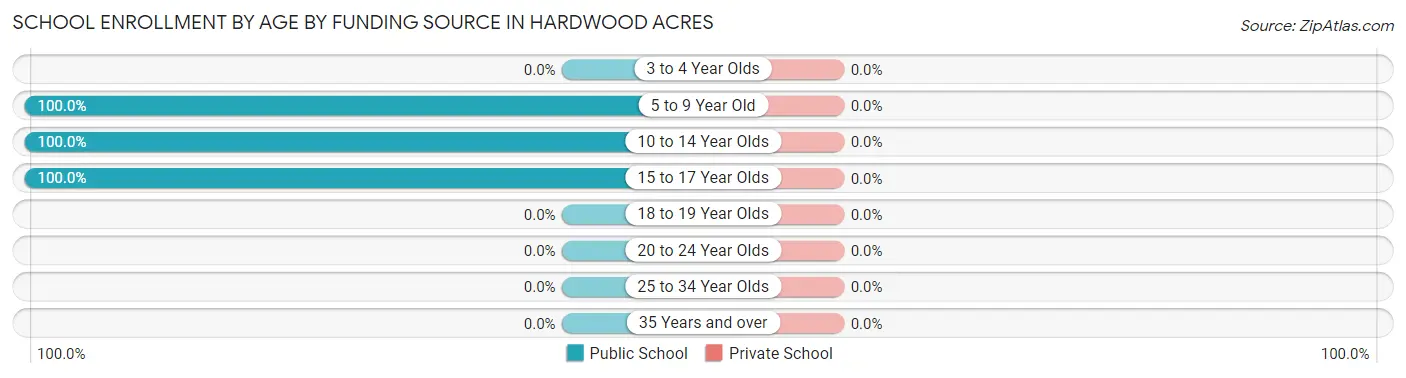
| Age Bracket | Public School | Private School |
| 3 to 4 Year Olds | 0 (0.0%) | 0 (0.0%) |
| 5 to 9 Year Old | 23 (100.0%) | 0 (0.0%) |
| 10 to 14 Year Olds | 92 (100.0%) | 0 (0.0%) |
| 15 to 17 Year Olds | 26 (100.0%) | 0 (0.0%) |
| 18 to 19 Year Olds | 0 (0.0%) | 0 (0.0%) |
| 20 to 24 Year Olds | 0 (0.0%) | 0 (0.0%) |
| 25 to 34 Year Olds | 0 (0.0%) | 0 (0.0%) |
| 35 Years and over | 0 (0.0%) | 0 (0.0%) |
| Total | 141 (100.0%) | 0 (0.0%) |
Educational Attainment by Field of Study in Hardwood Acres
Business (39 | 40.2%), education (28 | 28.9%), psychology (16 | 16.5%), and communications (14 | 14.4%) are the most common fields of study among 97 individuals in Hardwood Acres who have obtained a bachelor's degree or higher.
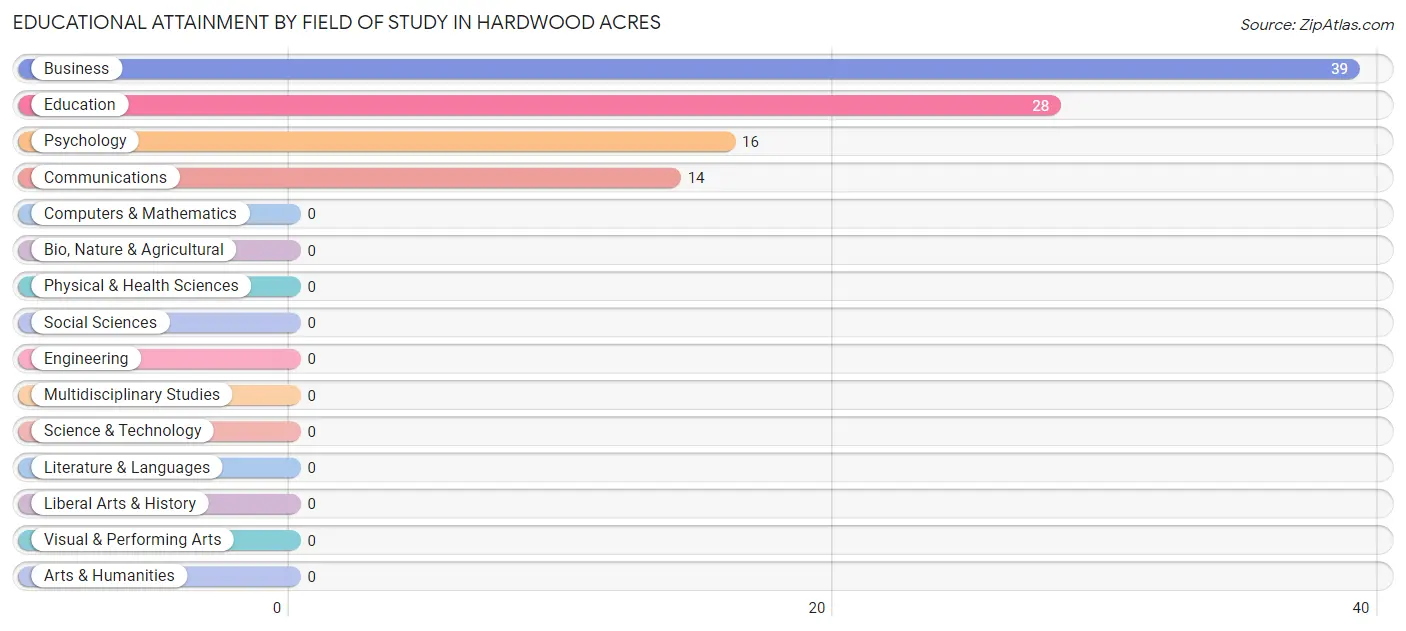
| Field of Study | # Graduates | % Graduates |
| Computers & Mathematics | 0 | 0.0% |
| Bio, Nature & Agricultural | 0 | 0.0% |
| Physical & Health Sciences | 0 | 0.0% |
| Psychology | 16 | 16.5% |
| Social Sciences | 0 | 0.0% |
| Engineering | 0 | 0.0% |
| Multidisciplinary Studies | 0 | 0.0% |
| Science & Technology | 0 | 0.0% |
| Business | 39 | 40.2% |
| Education | 28 | 28.9% |
| Literature & Languages | 0 | 0.0% |
| Liberal Arts & History | 0 | 0.0% |
| Visual & Performing Arts | 0 | 0.0% |
| Communications | 14 | 14.4% |
| Arts & Humanities | 0 | 0.0% |
| Total | 97 | 100.0% |
Transportation & Commute in Hardwood Acres
Vehicle Availability by Sex in Hardwood Acres
The most prevalent vehicle ownership categories in Hardwood Acres are males with 5 or more vehicles (79, accounting for 65.8%) and females with 5 or more vehicles (0, making up 48.8%).
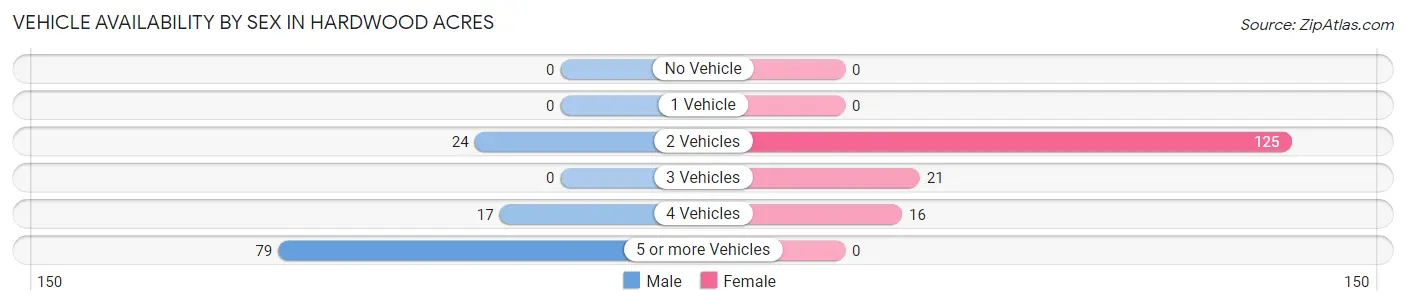
| Vehicles Available | Male | Female |
| No Vehicle | 0 (0.0%) | 0 (0.0%) |
| 1 Vehicle | 0 (0.0%) | 0 (0.0%) |
| 2 Vehicles | 24 (20.0%) | 125 (77.2%) |
| 3 Vehicles | 0 (0.0%) | 21 (13.0%) |
| 4 Vehicles | 17 (14.2%) | 16 (9.9%) |
| 5 or more Vehicles | 79 (65.8%) | 0 (0.0%) |
| Total | 120 (100.0%) | 162 (100.0%) |
Commute Time in Hardwood Acres
The most frequently occuring commute durations in Hardwood Acres are 20 to 24 minutes (168 commuters, 59.6%), 30 to 34 minutes (65 commuters, 23.1%), and 45 to 59 minutes (28 commuters, 9.9%).
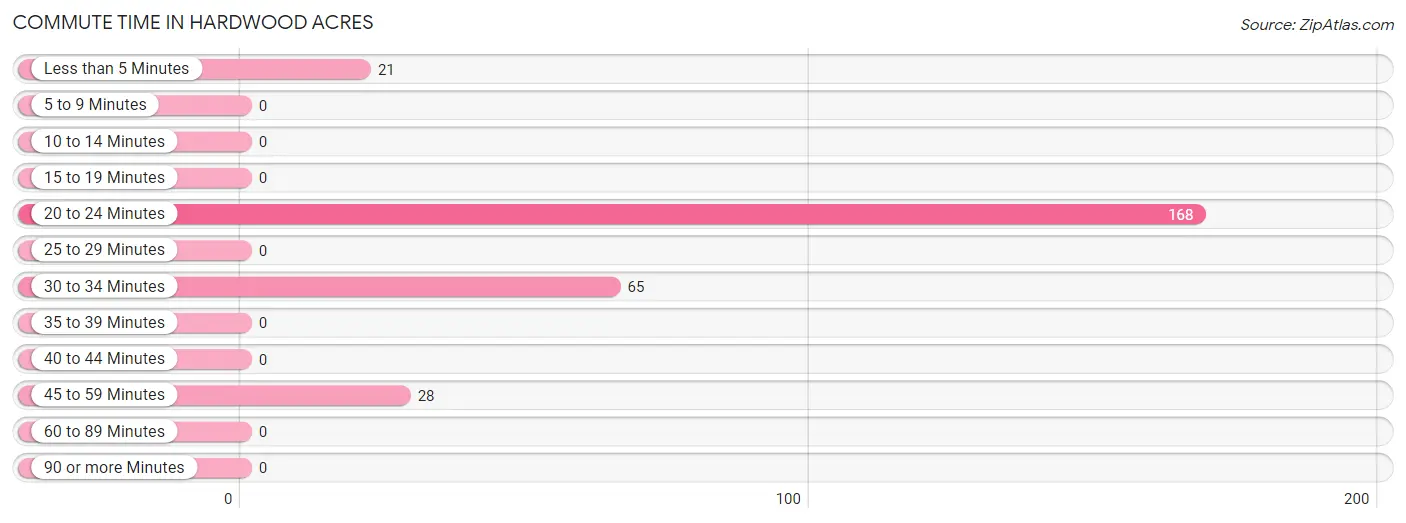
| Commute Time | # Commuters | % Commuters |
| Less than 5 Minutes | 21 | 7.4% |
| 5 to 9 Minutes | 0 | 0.0% |
| 10 to 14 Minutes | 0 | 0.0% |
| 15 to 19 Minutes | 0 | 0.0% |
| 20 to 24 Minutes | 168 | 59.6% |
| 25 to 29 Minutes | 0 | 0.0% |
| 30 to 34 Minutes | 65 | 23.1% |
| 35 to 39 Minutes | 0 | 0.0% |
| 40 to 44 Minutes | 0 | 0.0% |
| 45 to 59 Minutes | 28 | 9.9% |
| 60 to 89 Minutes | 0 | 0.0% |
| 90 or more Minutes | 0 | 0.0% |
Commute Time by Sex in Hardwood Acres
The most common commute times in Hardwood Acres are 20 to 24 minutes (83 commuters, 69.2%) for males and 20 to 24 minutes (85 commuters, 52.5%) for females.
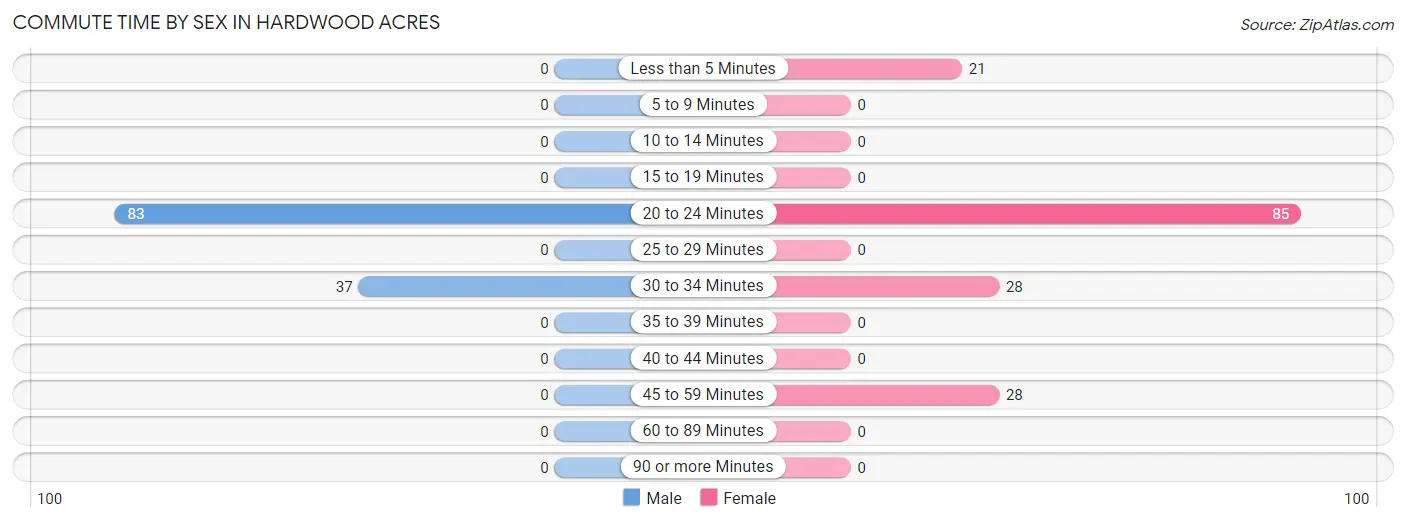
| Commute Time | Male | Female |
| Less than 5 Minutes | 0 (0.0%) | 21 (13.0%) |
| 5 to 9 Minutes | 0 (0.0%) | 0 (0.0%) |
| 10 to 14 Minutes | 0 (0.0%) | 0 (0.0%) |
| 15 to 19 Minutes | 0 (0.0%) | 0 (0.0%) |
| 20 to 24 Minutes | 83 (69.2%) | 85 (52.5%) |
| 25 to 29 Minutes | 0 (0.0%) | 0 (0.0%) |
| 30 to 34 Minutes | 37 (30.8%) | 28 (17.3%) |
| 35 to 39 Minutes | 0 (0.0%) | 0 (0.0%) |
| 40 to 44 Minutes | 0 (0.0%) | 0 (0.0%) |
| 45 to 59 Minutes | 0 (0.0%) | 28 (17.3%) |
| 60 to 89 Minutes | 0 (0.0%) | 0 (0.0%) |
| 90 or more Minutes | 0 (0.0%) | 0 (0.0%) |
Time of Departure to Work by Sex in Hardwood Acres
The most frequent times of departure to work in Hardwood Acres are 5:30 AM to 5:59 AM (31, 25.8%) for males and 6:30 AM to 6:59 AM (67, 41.4%) for females.
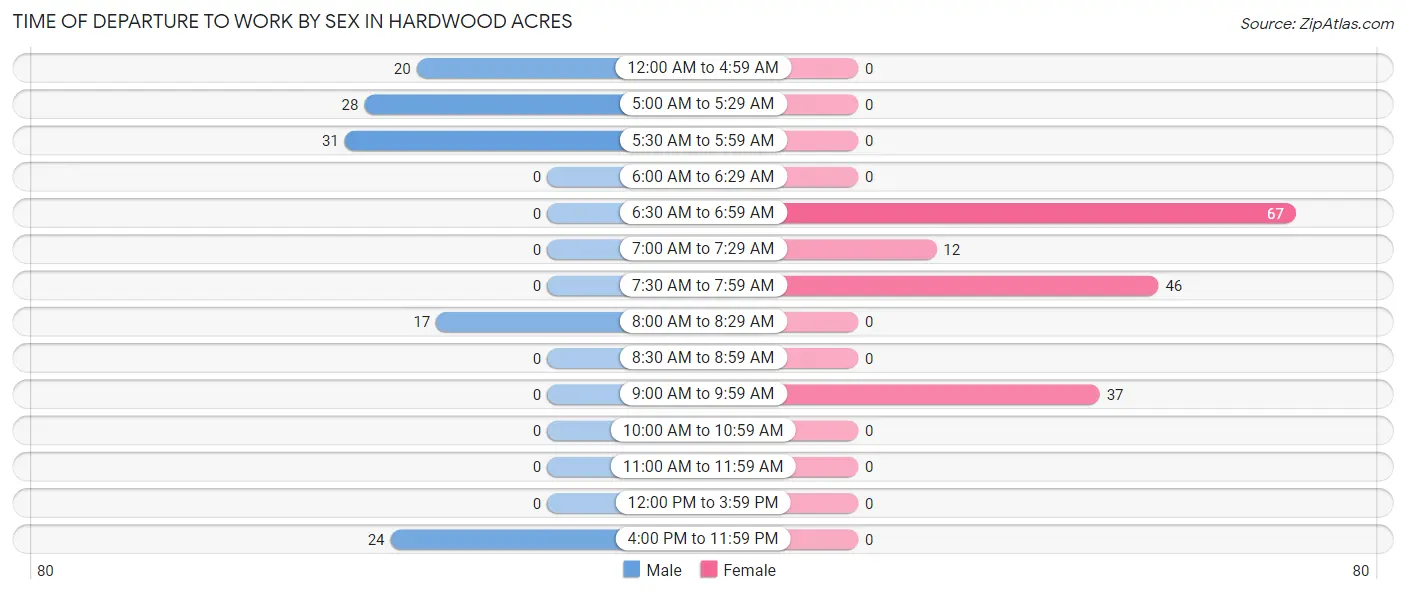
| Time of Departure | Male | Female |
| 12:00 AM to 4:59 AM | 20 (16.7%) | 0 (0.0%) |
| 5:00 AM to 5:29 AM | 28 (23.3%) | 0 (0.0%) |
| 5:30 AM to 5:59 AM | 31 (25.8%) | 0 (0.0%) |
| 6:00 AM to 6:29 AM | 0 (0.0%) | 0 (0.0%) |
| 6:30 AM to 6:59 AM | 0 (0.0%) | 67 (41.4%) |
| 7:00 AM to 7:29 AM | 0 (0.0%) | 12 (7.4%) |
| 7:30 AM to 7:59 AM | 0 (0.0%) | 46 (28.4%) |
| 8:00 AM to 8:29 AM | 17 (14.2%) | 0 (0.0%) |
| 8:30 AM to 8:59 AM | 0 (0.0%) | 0 (0.0%) |
| 9:00 AM to 9:59 AM | 0 (0.0%) | 37 (22.8%) |
| 10:00 AM to 10:59 AM | 0 (0.0%) | 0 (0.0%) |
| 11:00 AM to 11:59 AM | 0 (0.0%) | 0 (0.0%) |
| 12:00 PM to 3:59 PM | 0 (0.0%) | 0 (0.0%) |
| 4:00 PM to 11:59 PM | 24 (20.0%) | 0 (0.0%) |
| Total | 120 (100.0%) | 162 (100.0%) |
Housing Occupancy in Hardwood Acres
Occupancy by Ownership in Hardwood Acres
Of the total 184 dwellings in Hardwood Acres, owner-occupied units account for 145 (78.8%), while renter-occupied units make up 39 (21.2%).
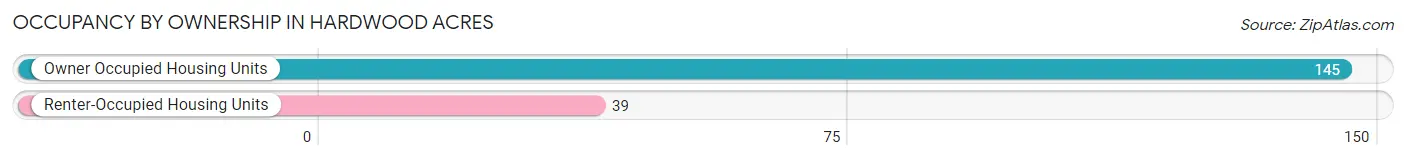
| Occupancy | # Housing Units | % Housing Units |
| Owner Occupied Housing Units | 145 | 78.8% |
| Renter-Occupied Housing Units | 39 | 21.2% |
| Total Occupied Housing Units | 184 | 100.0% |
Occupancy by Household Size in Hardwood Acres
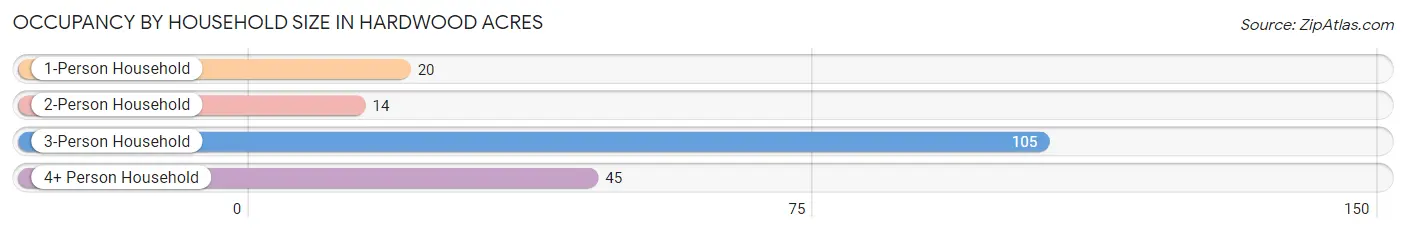
| Household Size | # Housing Units | % Housing Units |
| 1-Person Household | 20 | 10.9% |
| 2-Person Household | 14 | 7.6% |
| 3-Person Household | 105 | 57.1% |
| 4+ Person Household | 45 | 24.5% |
| Total Housing Units | 184 | 100.0% |
Occupancy by Ownership by Household Size in Hardwood Acres
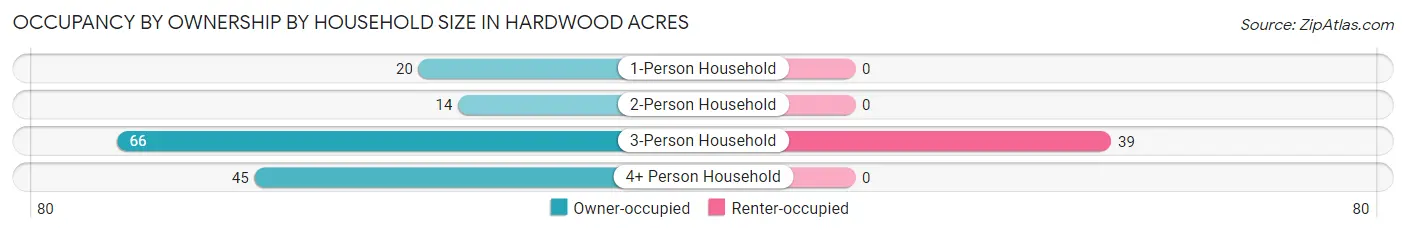
| Household Size | Owner-occupied | Renter-occupied |
| 1-Person Household | 20 (100.0%) | 0 (0.0%) |
| 2-Person Household | 14 (100.0%) | 0 (0.0%) |
| 3-Person Household | 66 (62.9%) | 39 (37.1%) |
| 4+ Person Household | 45 (100.0%) | 0 (0.0%) |
| Total Housing Units | 145 (78.8%) | 39 (21.2%) |
Occupancy by Educational Attainment in Hardwood Acres
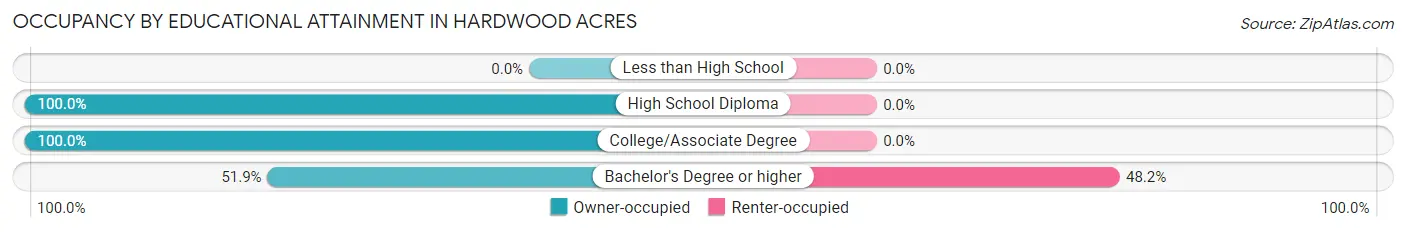
| Household Size | Owner-occupied | Renter-occupied |
| Less than High School | 0 (0.0%) | 0 (0.0%) |
| High School Diploma | 17 (100.0%) | 0 (0.0%) |
| College/Associate Degree | 86 (100.0%) | 0 (0.0%) |
| Bachelor's Degree or higher | 42 (51.8%) | 39 (48.1%) |
Occupancy by Age of Householder in Hardwood Acres
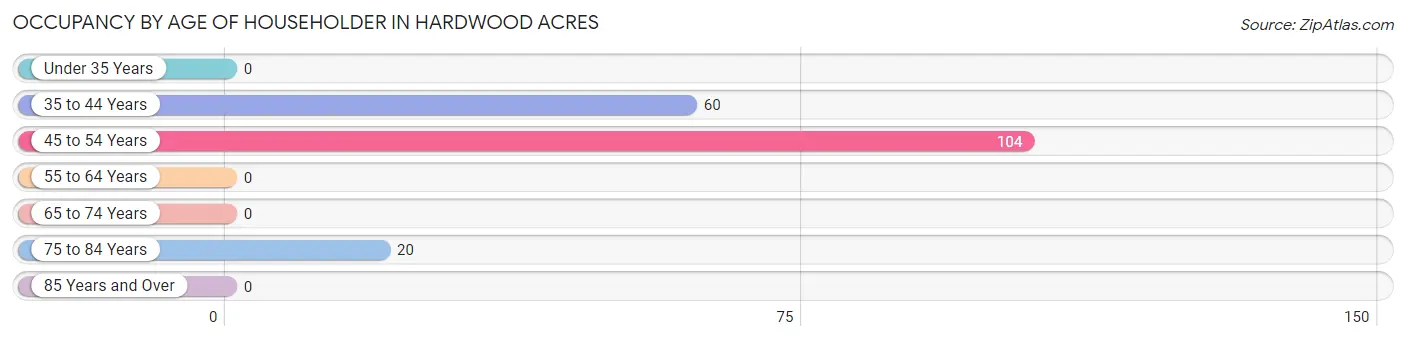
| Age Bracket | # Households | % Households |
| Under 35 Years | 0 | 0.0% |
| 35 to 44 Years | 60 | 32.6% |
| 45 to 54 Years | 104 | 56.5% |
| 55 to 64 Years | 0 | 0.0% |
| 65 to 74 Years | 0 | 0.0% |
| 75 to 84 Years | 20 | 10.9% |
| 85 Years and Over | 0 | 0.0% |
| Total | 184 | 100.0% |
Housing Finances in Hardwood Acres
Median Income by Occupancy in Hardwood Acres
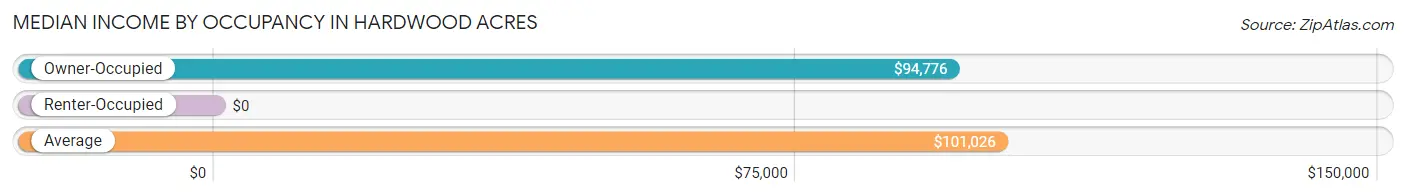
| Occupancy Type | # Households | Median Income |
| Owner-Occupied | 145 (78.8%) | $94,776 |
| Renter-Occupied | 39 (21.2%) | $0 |
| Average | 184 (100.0%) | $101,026 |
Occupancy by Householder Income Bracket in Hardwood Acres
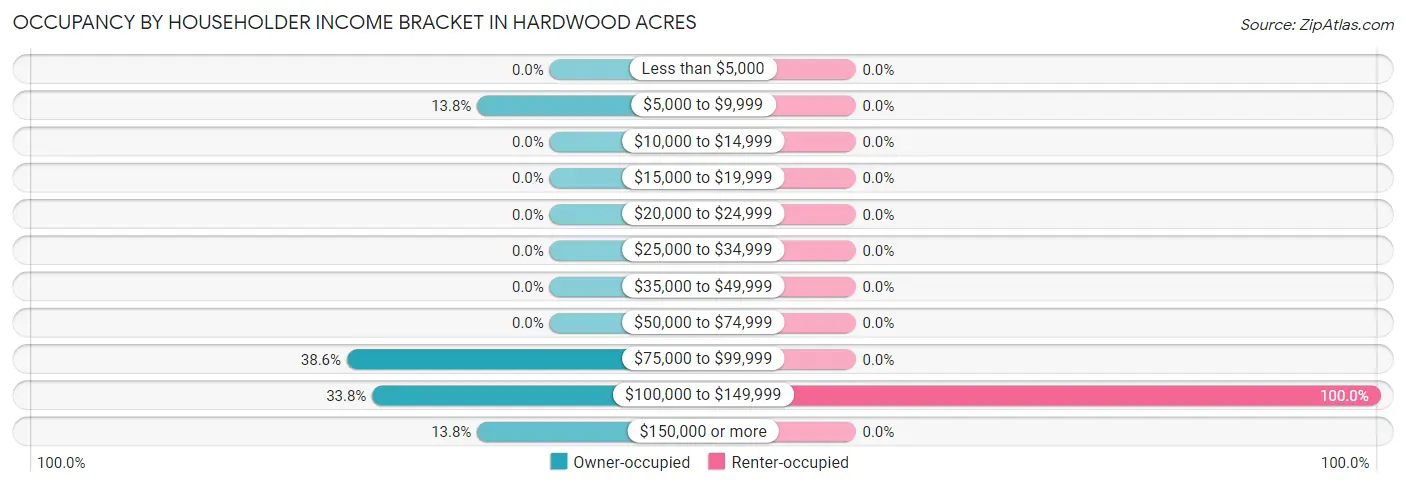
| Income Bracket | Owner-occupied | Renter-occupied |
| Less than $5,000 | 0 (0.0%) | 0 (0.0%) |
| $5,000 to $9,999 | 20 (13.8%) | 0 (0.0%) |
| $10,000 to $14,999 | 0 (0.0%) | 0 (0.0%) |
| $15,000 to $19,999 | 0 (0.0%) | 0 (0.0%) |
| $20,000 to $24,999 | 0 (0.0%) | 0 (0.0%) |
| $25,000 to $34,999 | 0 (0.0%) | 0 (0.0%) |
| $35,000 to $49,999 | 0 (0.0%) | 0 (0.0%) |
| $50,000 to $74,999 | 0 (0.0%) | 0 (0.0%) |
| $75,000 to $99,999 | 56 (38.6%) | 0 (0.0%) |
| $100,000 to $149,999 | 49 (33.8%) | 39 (100.0%) |
| $150,000 or more | 20 (13.8%) | 0 (0.0%) |
| Total | 145 (100.0%) | 39 (100.0%) |
Monthly Housing Cost Tiers in Hardwood Acres
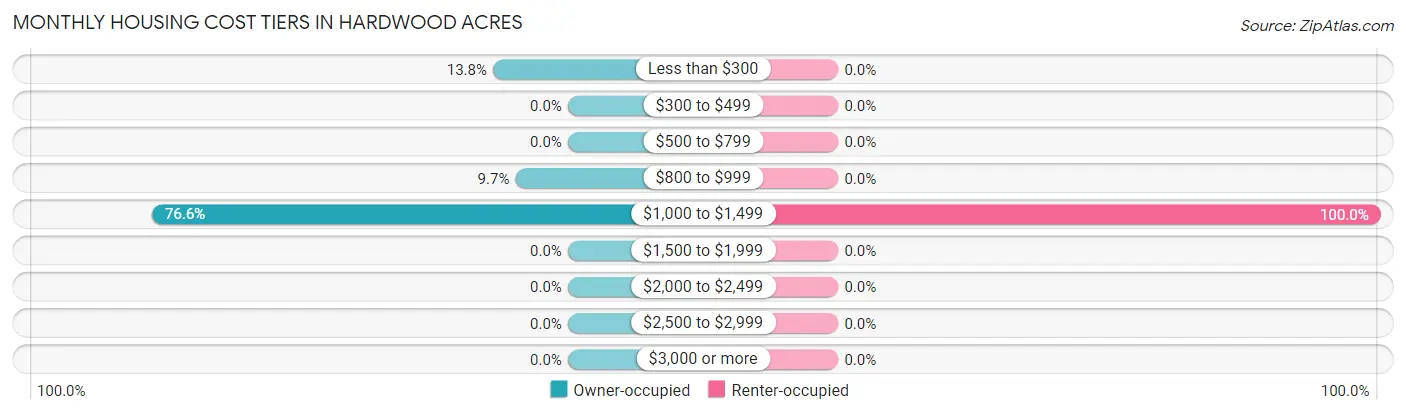
| Monthly Cost | Owner-occupied | Renter-occupied |
| Less than $300 | 20 (13.8%) | 0 (0.0%) |
| $300 to $499 | 0 (0.0%) | 0 (0.0%) |
| $500 to $799 | 0 (0.0%) | 0 (0.0%) |
| $800 to $999 | 14 (9.7%) | 0 (0.0%) |
| $1,000 to $1,499 | 111 (76.5%) | 39 (100.0%) |
| $1,500 to $1,999 | 0 (0.0%) | 0 (0.0%) |
| $2,000 to $2,499 | 0 (0.0%) | 0 (0.0%) |
| $2,500 to $2,999 | 0 (0.0%) | 0 (0.0%) |
| $3,000 or more | 0 (0.0%) | 0 (0.0%) |
| Total | 145 (100.0%) | 39 (100.0%) |
Physical Housing Characteristics in Hardwood Acres
Housing Structures in Hardwood Acres
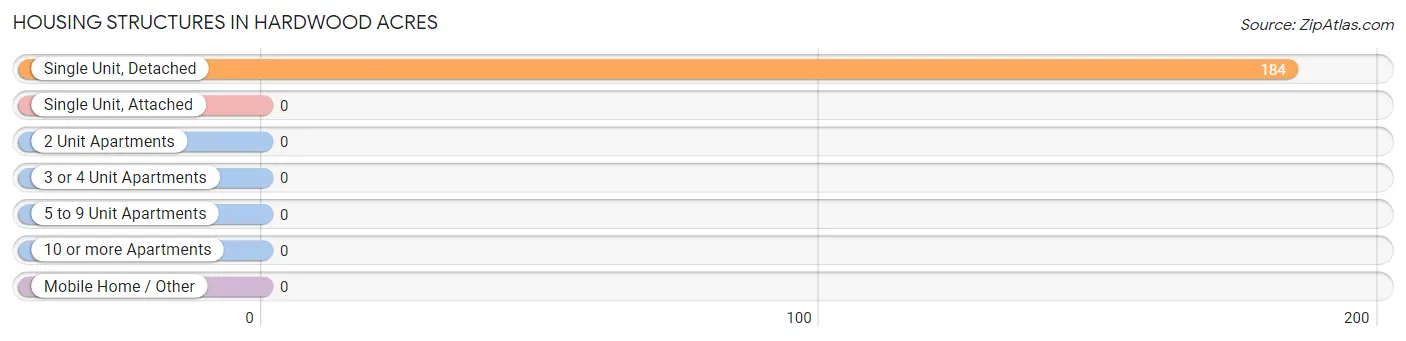
| Structure Type | # Housing Units | % Housing Units |
| Single Unit, Detached | 184 | 100.0% |
| Single Unit, Attached | 0 | 0.0% |
| 2 Unit Apartments | 0 | 0.0% |
| 3 or 4 Unit Apartments | 0 | 0.0% |
| 5 to 9 Unit Apartments | 0 | 0.0% |
| 10 or more Apartments | 0 | 0.0% |
| Mobile Home / Other | 0 | 0.0% |
| Total | 184 | 100.0% |
Housing Structures by Occupancy in Hardwood Acres
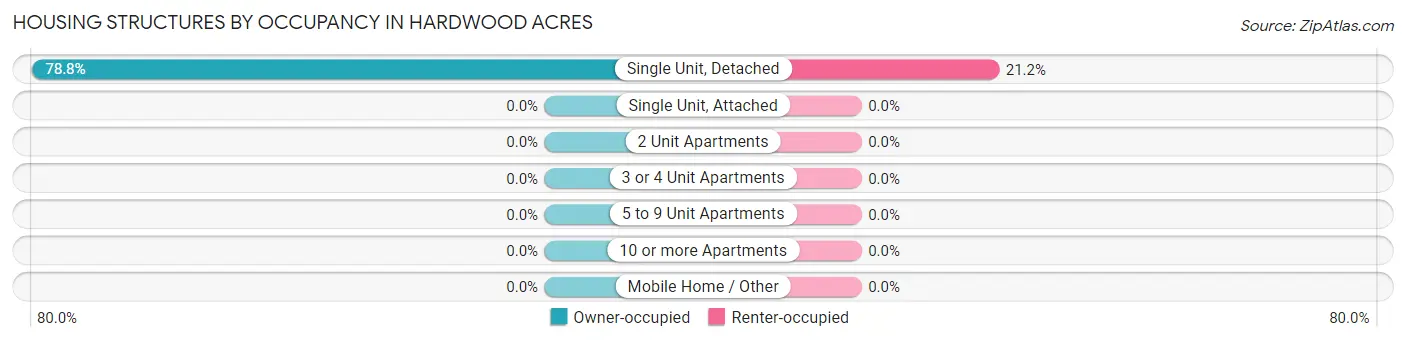
| Structure Type | Owner-occupied | Renter-occupied |
| Single Unit, Detached | 145 (78.8%) | 39 (21.2%) |
| Single Unit, Attached | 0 (0.0%) | 0 (0.0%) |
| 2 Unit Apartments | 0 (0.0%) | 0 (0.0%) |
| 3 or 4 Unit Apartments | 0 (0.0%) | 0 (0.0%) |
| 5 to 9 Unit Apartments | 0 (0.0%) | 0 (0.0%) |
| 10 or more Apartments | 0 (0.0%) | 0 (0.0%) |
| Mobile Home / Other | 0 (0.0%) | 0 (0.0%) |
| Total | 145 (78.8%) | 39 (21.2%) |
Housing Structures by Number of Rooms in Hardwood Acres
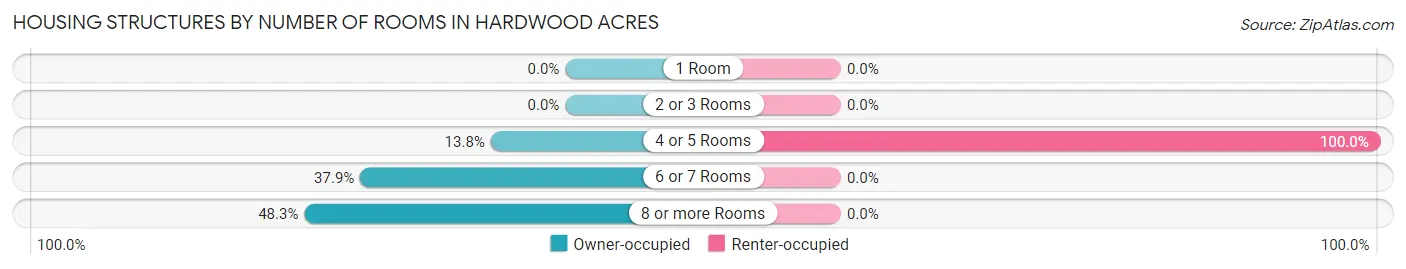
| Number of Rooms | Owner-occupied | Renter-occupied |
| 1 Room | 0 (0.0%) | 0 (0.0%) |
| 2 or 3 Rooms | 0 (0.0%) | 0 (0.0%) |
| 4 or 5 Rooms | 20 (13.8%) | 39 (100.0%) |
| 6 or 7 Rooms | 55 (37.9%) | 0 (0.0%) |
| 8 or more Rooms | 70 (48.3%) | 0 (0.0%) |
| Total | 145 (100.0%) | 39 (100.0%) |
Housing Structure by Heating Type in Hardwood Acres
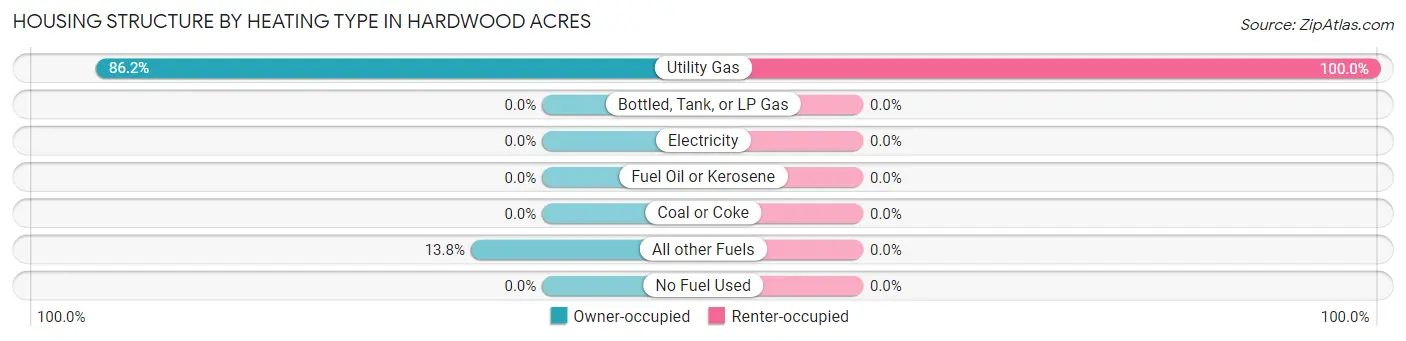
| Heating Type | Owner-occupied | Renter-occupied |
| Utility Gas | 125 (86.2%) | 39 (100.0%) |
| Bottled, Tank, or LP Gas | 0 (0.0%) | 0 (0.0%) |
| Electricity | 0 (0.0%) | 0 (0.0%) |
| Fuel Oil or Kerosene | 0 (0.0%) | 0 (0.0%) |
| Coal or Coke | 0 (0.0%) | 0 (0.0%) |
| All other Fuels | 20 (13.8%) | 0 (0.0%) |
| No Fuel Used | 0 (0.0%) | 0 (0.0%) |
| Total | 145 (100.0%) | 39 (100.0%) |
Household Vehicle Usage in Hardwood Acres
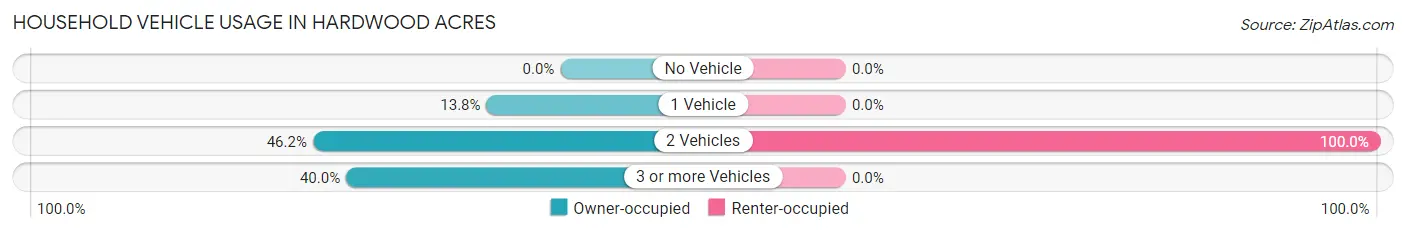
| Vehicles per Household | Owner-occupied | Renter-occupied |
| No Vehicle | 0 (0.0%) | 0 (0.0%) |
| 1 Vehicle | 20 (13.8%) | 0 (0.0%) |
| 2 Vehicles | 67 (46.2%) | 39 (100.0%) |
| 3 or more Vehicles | 58 (40.0%) | 0 (0.0%) |
| Total | 145 (100.0%) | 39 (100.0%) |
Real Estate & Mortgages in Hardwood Acres
Real Estate and Mortgage Overview in Hardwood Acres
| Characteristic | Without Mortgage | With Mortgage |
| Housing Units | 20 | 125 |
| Median Property Value | - | - |
| Median Household Income | - | - |
| Monthly Housing Costs | - | - |
| Real Estate Taxes | - | - |
Property Value by Mortgage Status in Hardwood Acres
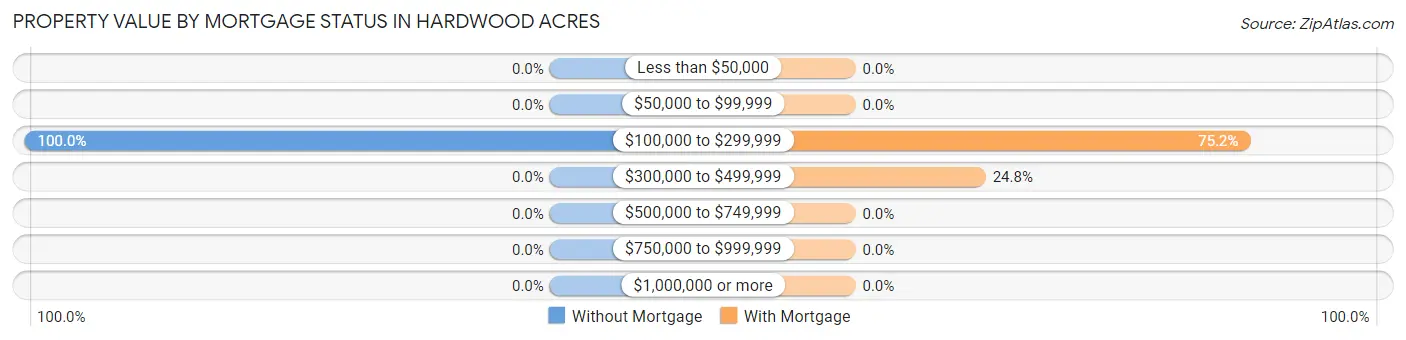
| Property Value | Without Mortgage | With Mortgage |
| Less than $50,000 | 0 (0.0%) | 0 (0.0%) |
| $50,000 to $99,999 | 0 (0.0%) | 0 (0.0%) |
| $100,000 to $299,999 | 20 (100.0%) | 94 (75.2%) |
| $300,000 to $499,999 | 0 (0.0%) | 31 (24.8%) |
| $500,000 to $749,999 | 0 (0.0%) | 0 (0.0%) |
| $750,000 to $999,999 | 0 (0.0%) | 0 (0.0%) |
| $1,000,000 or more | 0 (0.0%) | 0 (0.0%) |
| Total | 20 (100.0%) | 125 (100.0%) |
Household Income by Mortgage Status in Hardwood Acres
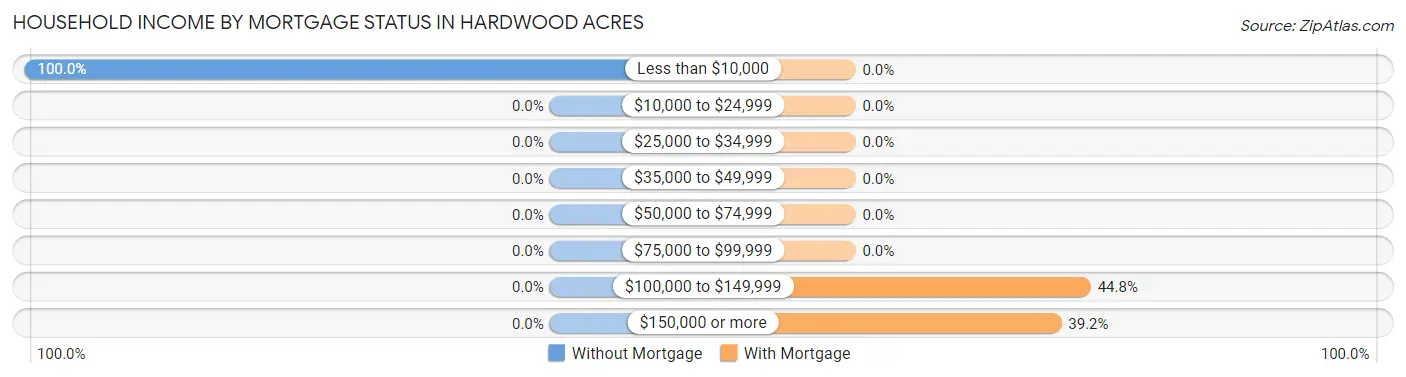
| Household Income | Without Mortgage | With Mortgage |
| Less than $10,000 | 20 (100.0%) | 0 (0.0%) |
| $10,000 to $24,999 | 0 (0.0%) | 0 (0.0%) |
| $25,000 to $34,999 | 0 (0.0%) | 0 (0.0%) |
| $35,000 to $49,999 | 0 (0.0%) | 0 (0.0%) |
| $50,000 to $74,999 | 0 (0.0%) | 0 (0.0%) |
| $75,000 to $99,999 | 0 (0.0%) | 0 (0.0%) |
| $100,000 to $149,999 | 0 (0.0%) | 56 (44.8%) |
| $150,000 or more | 0 (0.0%) | 49 (39.2%) |
| Total | 20 (100.0%) | 125 (100.0%) |
Property Value to Household Income Ratio in Hardwood Acres
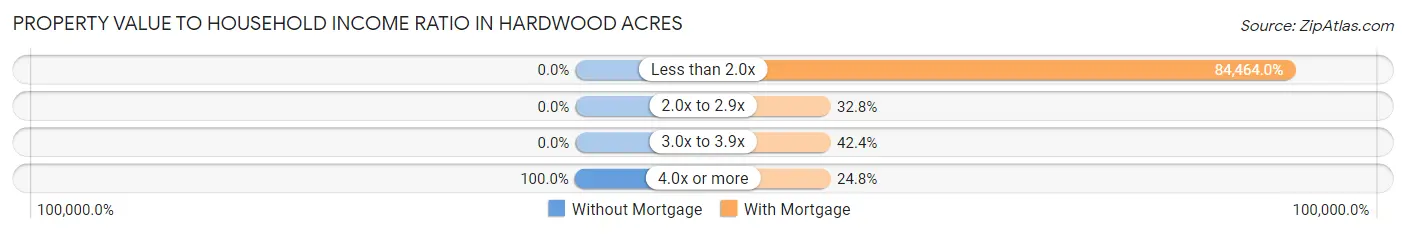
| Value-to-Income Ratio | Without Mortgage | With Mortgage |
| Less than 2.0x | 0 (0.0%) | 105,580 (84,464.0%) |
| 2.0x to 2.9x | 0 (0.0%) | 41 (32.8%) |
| 3.0x to 3.9x | 0 (0.0%) | 53 (42.4%) |
| 4.0x or more | 20 (100.0%) | 31 (24.8%) |
| Total | 20 (100.0%) | 125 (100.0%) |
Real Estate Taxes by Mortgage Status in Hardwood Acres
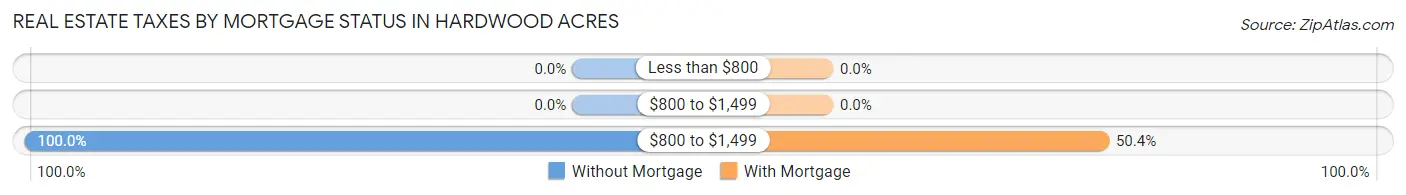
| Property Taxes | Without Mortgage | With Mortgage |
| Less than $800 | 0 (0.0%) | 0 (0.0%) |
| $800 to $1,499 | 0 (0.0%) | 0 (0.0%) |
| $800 to $1,499 | 20 (100.0%) | 63 (50.4%) |
| Total | 20 (100.0%) | 125 (100.0%) |
Health & Disability in Hardwood Acres
Health Insurance Coverage by Age in Hardwood Acres
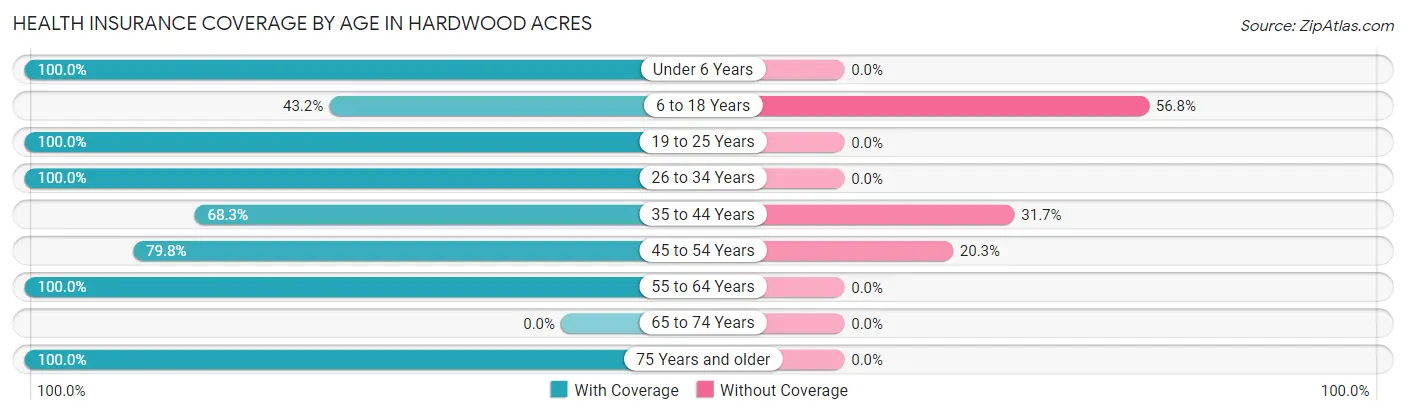
| Age Bracket | With Coverage | Without Coverage |
| Under 6 Years | 23 (100.0%) | 0 (0.0%) |
| 6 to 18 Years | 51 (43.2%) | 67 (56.8%) |
| 19 to 25 Years | 74 (100.0%) | 0 (0.0%) |
| 26 to 34 Years | 28 (100.0%) | 0 (0.0%) |
| 35 to 44 Years | 84 (68.3%) | 39 (31.7%) |
| 45 to 54 Years | 130 (79.7%) | 33 (20.3%) |
| 55 to 64 Years | 12 (100.0%) | 0 (0.0%) |
| 65 to 74 Years | 0 (0.0%) | 0 (0.0%) |
| 75 Years and older | 20 (100.0%) | 0 (0.0%) |
| Total | 422 (75.2%) | 139 (24.8%) |
Health Insurance Coverage by Citizenship Status in Hardwood Acres
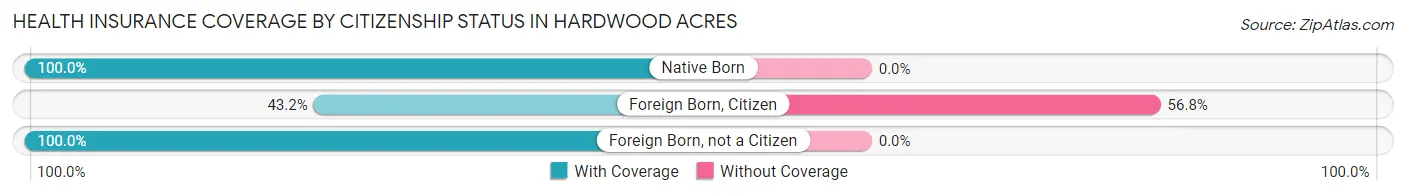
| Citizenship Status | With Coverage | Without Coverage |
| Native Born | 23 (100.0%) | 0 (0.0%) |
| Foreign Born, Citizen | 51 (43.2%) | 67 (56.8%) |
| Foreign Born, not a Citizen | 74 (100.0%) | 0 (0.0%) |
Health Insurance Coverage by Household Income in Hardwood Acres
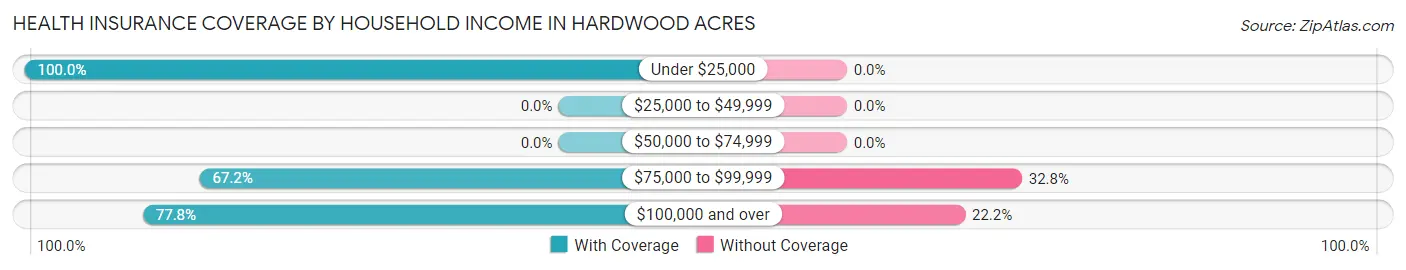
| Household Income | With Coverage | Without Coverage |
| Under $25,000 | 20 (100.0%) | 0 (0.0%) |
| $25,000 to $49,999 | 0 (0.0%) | 0 (0.0%) |
| $50,000 to $74,999 | 0 (0.0%) | 0 (0.0%) |
| $75,000 to $99,999 | 121 (67.2%) | 59 (32.8%) |
| $100,000 and over | 281 (77.8%) | 80 (22.2%) |
Public vs Private Health Insurance Coverage by Age in Hardwood Acres
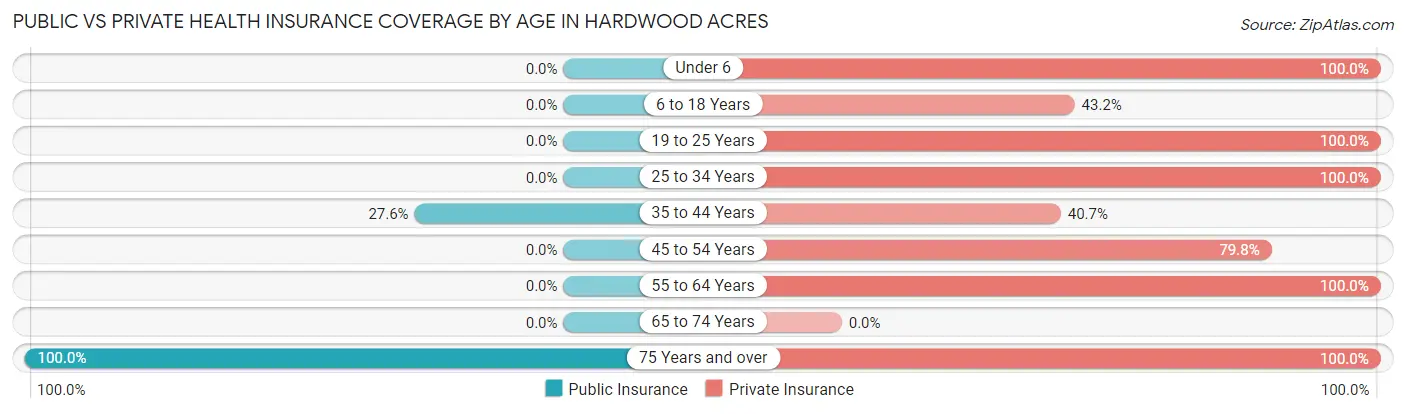
| Age Bracket | Public Insurance | Private Insurance |
| Under 6 | 0 (0.0%) | 23 (100.0%) |
| 6 to 18 Years | 0 (0.0%) | 51 (43.2%) |
| 19 to 25 Years | 0 (0.0%) | 74 (100.0%) |
| 25 to 34 Years | 0 (0.0%) | 28 (100.0%) |
| 35 to 44 Years | 34 (27.6%) | 50 (40.6%) |
| 45 to 54 Years | 0 (0.0%) | 130 (79.7%) |
| 55 to 64 Years | 0 (0.0%) | 12 (100.0%) |
| 65 to 74 Years | 0 (0.0%) | 0 (0.0%) |
| 75 Years and over | 20 (100.0%) | 20 (100.0%) |
| Total | 54 (9.6%) | 388 (69.2%) |
Disability Status by Sex by Age in Hardwood Acres
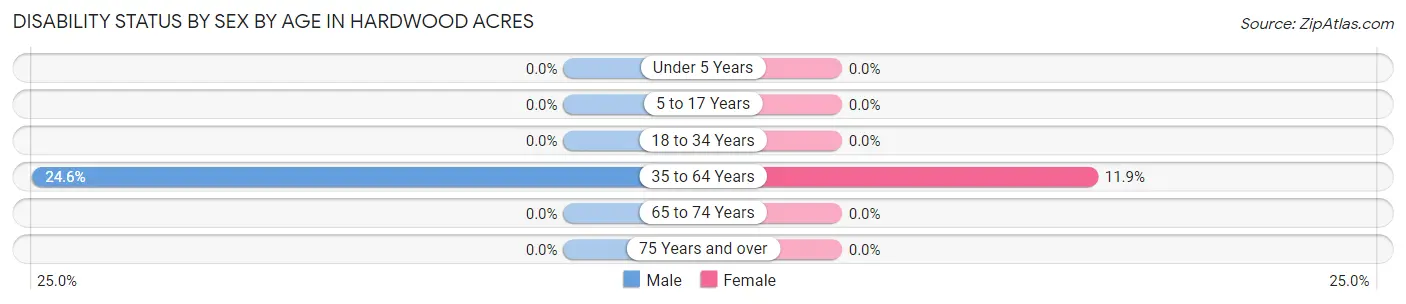
| Age Bracket | Male | Female |
| Under 5 Years | 0 (0.0%) | 0 (0.0%) |
| 5 to 17 Years | 0 (0.0%) | 0 (0.0%) |
| 18 to 34 Years | 0 (0.0%) | 0 (0.0%) |
| 35 to 64 Years | 34 (24.6%) | 19 (11.9%) |
| 65 to 74 Years | 0 (0.0%) | 0 (0.0%) |
| 75 Years and over | 0 (0.0%) | 0 (0.0%) |
Disability Class by Sex by Age in Hardwood Acres
Disability Class: Hearing Difficulty
| Age Bracket | Male | Female |
| Under 5 Years | 0 (0.0%) | 0 (0.0%) |
| 5 to 17 Years | 0 (0.0%) | 0 (0.0%) |
| 18 to 34 Years | 0 (0.0%) | 0 (0.0%) |
| 35 to 64 Years | 0 (0.0%) | 0 (0.0%) |
| 65 to 74 Years | 0 (0.0%) | 0 (0.0%) |
| 75 Years and over | 0 (0.0%) | 0 (0.0%) |
Disability Class: Vision Difficulty
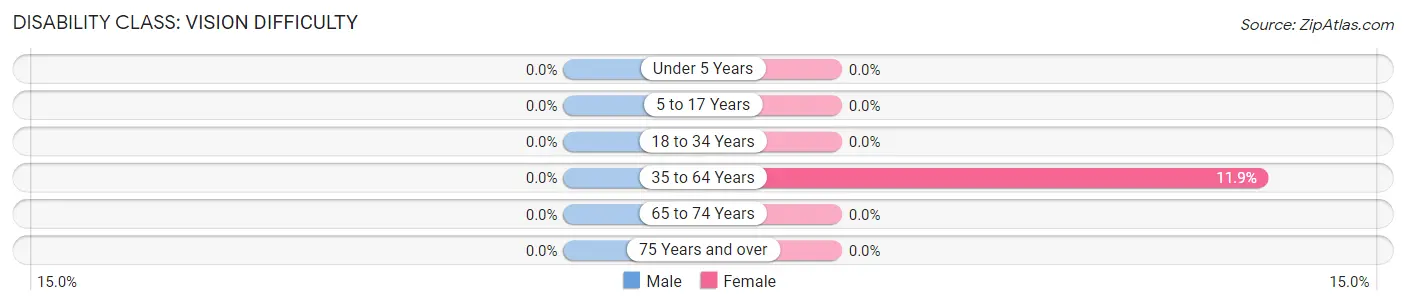
| Age Bracket | Male | Female |
| Under 5 Years | 0 (0.0%) | 0 (0.0%) |
| 5 to 17 Years | 0 (0.0%) | 0 (0.0%) |
| 18 to 34 Years | 0 (0.0%) | 0 (0.0%) |
| 35 to 64 Years | 0 (0.0%) | 19 (11.9%) |
| 65 to 74 Years | 0 (0.0%) | 0 (0.0%) |
| 75 Years and over | 0 (0.0%) | 0 (0.0%) |
Disability Class: Cognitive Difficulty
| Age Bracket | Male | Female |
| 5 to 17 Years | 0 (0.0%) | 0 (0.0%) |
| 18 to 34 Years | 0 (0.0%) | 0 (0.0%) |
| 35 to 64 Years | 0 (0.0%) | 0 (0.0%) |
| 65 to 74 Years | 0 (0.0%) | 0 (0.0%) |
| 75 Years and over | 0 (0.0%) | 0 (0.0%) |
Disability Class: Ambulatory Difficulty
| Age Bracket | Male | Female |
| 5 to 17 Years | 0 (0.0%) | 0 (0.0%) |
| 18 to 34 Years | 0 (0.0%) | 0 (0.0%) |
| 35 to 64 Years | 0 (0.0%) | 0 (0.0%) |
| 65 to 74 Years | 0 (0.0%) | 0 (0.0%) |
| 75 Years and over | 0 (0.0%) | 0 (0.0%) |
Disability Class: Self-Care Difficulty

| Age Bracket | Male | Female |
| 5 to 17 Years | 0 (0.0%) | 0 (0.0%) |
| 18 to 34 Years | 0 (0.0%) | 0 (0.0%) |
| 35 to 64 Years | 0 (0.0%) | 0 (0.0%) |
| 65 to 74 Years | 0 (0.0%) | 0 (0.0%) |
| 75 Years and over | 0 (0.0%) | 0 (0.0%) |
Technology Access in Hardwood Acres
Computing Device Access in Hardwood Acres
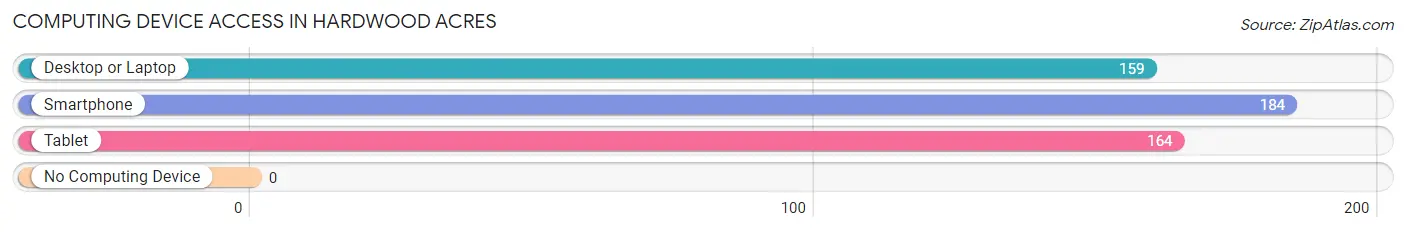
| Device Type | # Households | % Households |
| Desktop or Laptop | 159 | 86.4% |
| Smartphone | 184 | 100.0% |
| Tablet | 164 | 89.1% |
| No Computing Device | 0 | 0.0% |
| Total | 184 | 100.0% |
Internet Access in Hardwood Acres
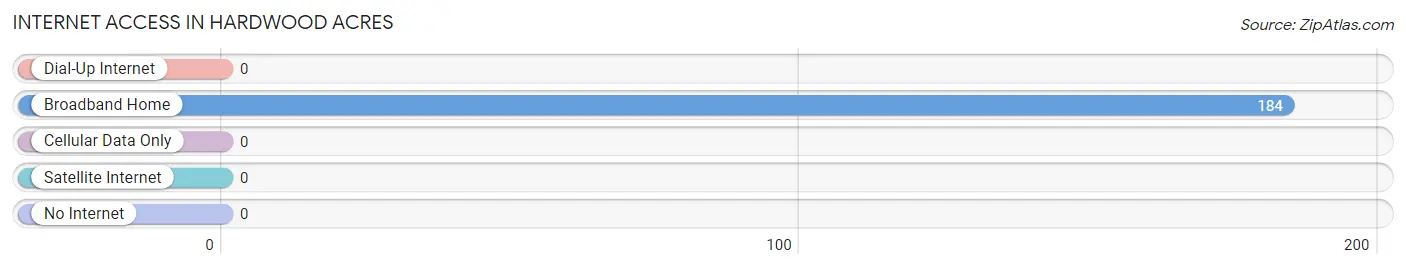
| Internet Type | # Households | % Households |
| Dial-Up Internet | 0 | 0.0% |
| Broadband Home | 184 | 100.0% |
| Cellular Data Only | 0 | 0.0% |
| Satellite Internet | 0 | 0.0% |
| No Internet | 0 | 0.0% |
| Total | 184 | 100.0% |
Hardwood Acres Summary
Wood Acres, Michigan is a small unincorporated community located in the northern part of the state, in the county of Grand Traverse. It is situated on the shores of Lake Michigan, and is surrounded by the towns of Traverse City, Acme, and Williamsburg. The population of Wood Acres was estimated to be around 1,000 people in 2000.
History
Wood Acres was first settled in the late 1800s by a group of lumberjacks who were looking for a place to call home. The area was heavily forested and the lumberjacks were able to make a living by cutting down the trees and selling the lumber. The lumber industry was the main source of income for the area until the early 1900s when the lumber industry began to decline.
In the early 1900s, the area began to transition from a lumber-based economy to a tourism-based economy. The area was known for its beautiful scenery and was a popular destination for vacationers. The area also became known for its fishing and hunting opportunities.
Geography
Wood Acres is located in the northern part of Michigan, in the county of Grand Traverse. It is situated on the shores of Lake Michigan, and is surrounded by the towns of Traverse City, Acme, and Williamsburg. The area is mostly flat, with some rolling hills and valleys. The area is heavily forested, with a mix of deciduous and coniferous trees.
Economy
The economy of Wood Acres is largely based on tourism. The area is known for its beautiful scenery and is a popular destination for vacationers. The area also has a thriving fishing and hunting industry. There are also several small businesses in the area, including restaurants, shops, and lodging.
Demographics
The population of Wood Acres was estimated to be around 1,000 people in 2000. The majority of the population is white, with a small percentage of African Americans and Native Americans. The median household income is around $50,000, and the median age is around 40 years old. The area is mostly rural, with a few small towns and villages.
Common Questions
What is Per Capita Income in Hardwood Acres?
Per Capita income in Hardwood Acres is $35,337.
What is the Median Family Income in Hardwood Acres?
Median Family Income in Hardwood Acres is $100,321.
What is the Median Household income in Hardwood Acres?
Median Household Income in Hardwood Acres is $101,026.
What is Income or Wage Gap in Hardwood Acres?
Income or Wage Gap in Hardwood Acres is 17.1%.
Women in Hardwood Acres earn 82.9 cents for every dollar earned by a man.
What is Inequality or Gini Index in Hardwood Acres?
Inequality or Gini Index in Hardwood Acres is 0.22.
What is the Total Population of Hardwood Acres?
Total Population of Hardwood Acres is 561.
What is the Total Male Population of Hardwood Acres?
Total Male Population of Hardwood Acres is 319.
What is the Total Female Population of Hardwood Acres?
Total Female Population of Hardwood Acres is 242.
What is the Ratio of Males per 100 Females in Hardwood Acres?
There are 131.82 Males per 100 Females in Hardwood Acres.
What is the Ratio of Females per 100 Males in Hardwood Acres?
There are 75.86 Females per 100 Males in Hardwood Acres.
What is the Median Population Age in Hardwood Acres?
Median Population Age in Hardwood Acres is 39.4 Years.
What is the Average Family Size in Hardwood Acres
Average Family Size in Hardwood Acres is 3.1 People.
What is the Average Household Size in Hardwood Acres
Average Household Size in Hardwood Acres is 3.0 People.
How Large is the Labor Force in Hardwood Acres?
There are 282 People in the Labor Forcein in Hardwood Acres.
What is the Percentage of People in the Labor Force in Hardwood Acres?
63.2% of People are in the Labor Force in Hardwood Acres.