Canada Creek Ranch, MI Map & Demographics
Canada Creek Ranch Map
Canada Creek Ranch Overview
$38,010
PER CAPITA INCOME
$72,176
AVG FAMILY INCOME
$71,204
AVG HOUSEHOLD INCOME
0.34
INEQUALITY / GINI INDEX
314
TOTAL POPULATION
158
MALE POPULATION
156
FEMALE POPULATION
101.28
MALES / 100 FEMALES
98.73
FEMALES / 100 MALES
68.9
MEDIAN AGE
2.2
AVG FAMILY SIZE
1.9
AVG HOUSEHOLD SIZE
87
LABOR FORCE [ PEOPLE ]
28.1%
PERCENT IN LABOR FORCE
5.7%
UNEMPLOYMENT RATE
Income in Canada Creek Ranch
Income Overview in Canada Creek Ranch
Per Capita Income in Canada Creek Ranch is $38,010, while median incomes of families and households are $72,176 and $71,204 respectively.
| Characteristic | Number | Measure |
| Per Capita Income | 314 | $38,010 |
| Median Family Income | 123 | $72,176 |
| Mean Family Income | 123 | $84,761 |
| Median Household Income | 166 | $71,204 |
| Mean Household Income | 166 | $72,882 |
| Income Deficit | 123 | $0 |
| Wage / Income Gap (%) | 314 | 0.00% |
| Wage / Income Gap ($) | 314 | 100.00¢ per $1 |
| Gini / Inequality Index | 314 | 0.34 |
Earnings by Sex in Canada Creek Ranch
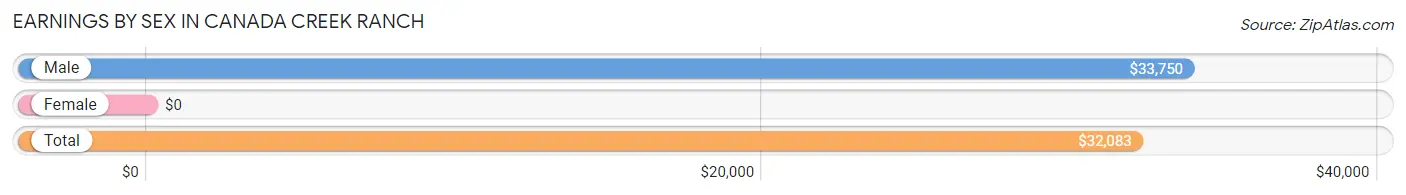
| Sex | Number | Average Earnings |
| Male | 53 (55.2%) | $33,750 |
| Female | 43 (44.8%) | $0 |
| Total | 96 (100.0%) | $32,083 |
Earnings by Sex by Income Bracket in Canada Creek Ranch
The most common earnings brackets in Canada Creek Ranch are $75,000 to $99,999 for men (14 | 26.4%) and $75,000 to $99,999 for women (13 | 30.2%).
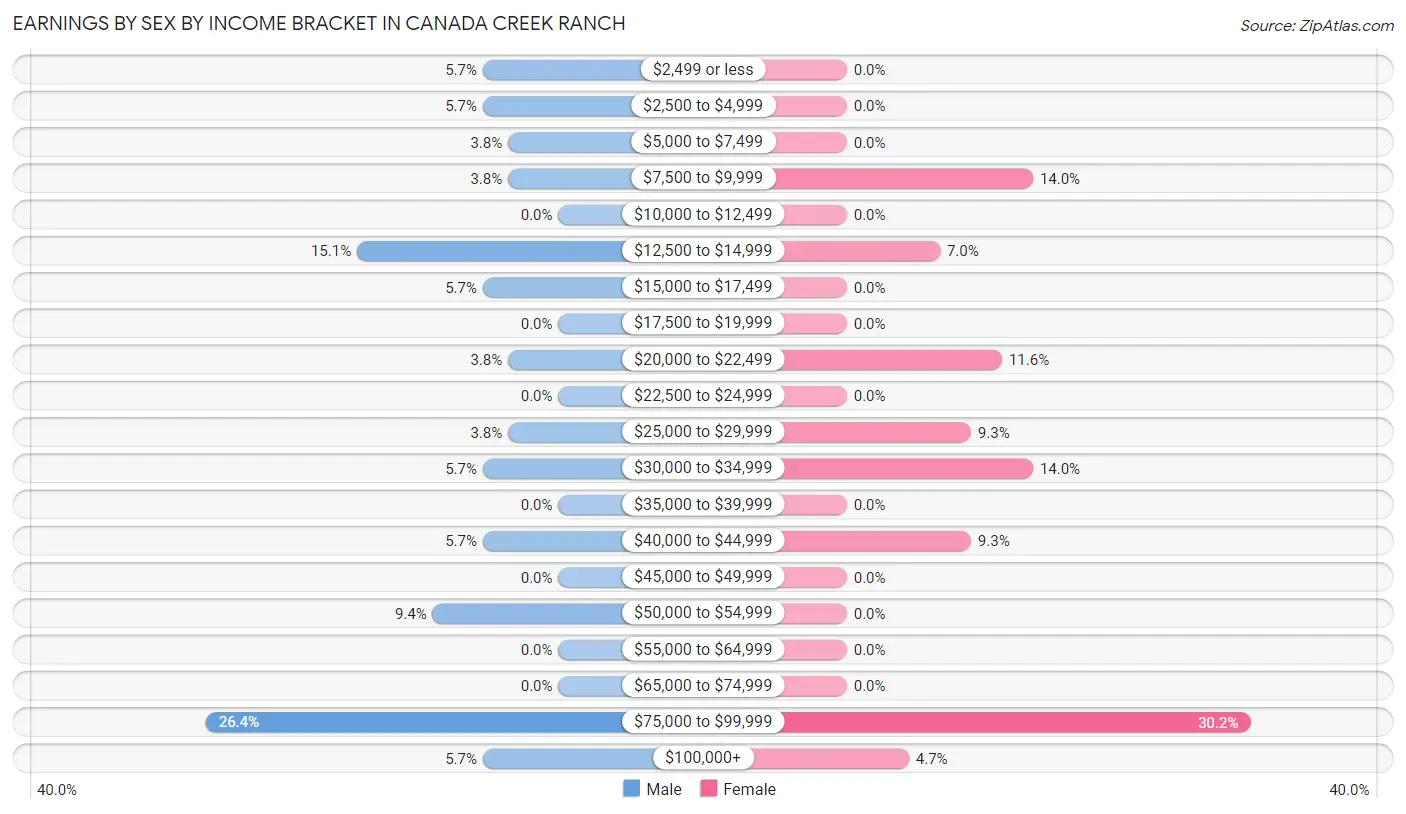
| Income | Male | Female |
| $2,499 or less | 3 (5.7%) | 0 (0.0%) |
| $2,500 to $4,999 | 3 (5.7%) | 0 (0.0%) |
| $5,000 to $7,499 | 2 (3.8%) | 0 (0.0%) |
| $7,500 to $9,999 | 2 (3.8%) | 6 (14.0%) |
| $10,000 to $12,499 | 0 (0.0%) | 0 (0.0%) |
| $12,500 to $14,999 | 8 (15.1%) | 3 (7.0%) |
| $15,000 to $17,499 | 3 (5.7%) | 0 (0.0%) |
| $17,500 to $19,999 | 0 (0.0%) | 0 (0.0%) |
| $20,000 to $22,499 | 2 (3.8%) | 5 (11.6%) |
| $22,500 to $24,999 | 0 (0.0%) | 0 (0.0%) |
| $25,000 to $29,999 | 2 (3.8%) | 4 (9.3%) |
| $30,000 to $34,999 | 3 (5.7%) | 6 (14.0%) |
| $35,000 to $39,999 | 0 (0.0%) | 0 (0.0%) |
| $40,000 to $44,999 | 3 (5.7%) | 4 (9.3%) |
| $45,000 to $49,999 | 0 (0.0%) | 0 (0.0%) |
| $50,000 to $54,999 | 5 (9.4%) | 0 (0.0%) |
| $55,000 to $64,999 | 0 (0.0%) | 0 (0.0%) |
| $65,000 to $74,999 | 0 (0.0%) | 0 (0.0%) |
| $75,000 to $99,999 | 14 (26.4%) | 13 (30.2%) |
| $100,000+ | 3 (5.7%) | 2 (4.6%) |
| Total | 53 (100.0%) | 43 (100.0%) |
Earnings by Sex by Educational Attainment in Canada Creek Ranch
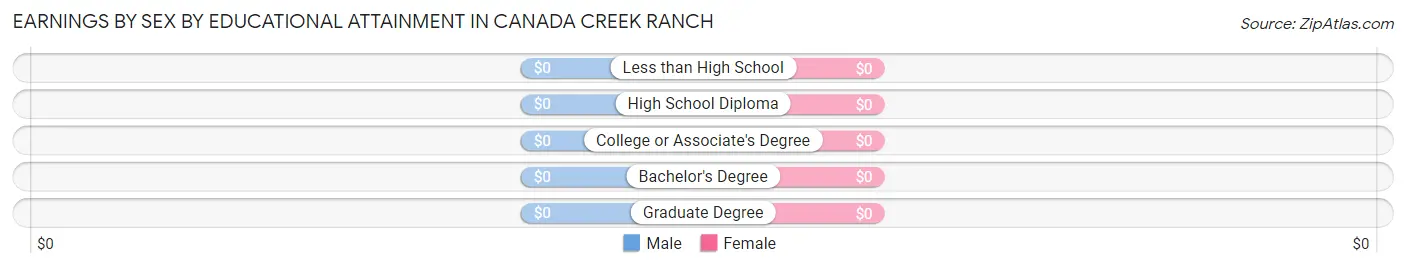
| Educational Attainment | Male Income | Female Income |
| Less than High School | - | - |
| High School Diploma | - | - |
| College or Associate's Degree | - | - |
| Bachelor's Degree | - | - |
| Graduate Degree | - | - |
| Total | $33,750 | $0 |
Family Income in Canada Creek Ranch
Family Income Brackets in Canada Creek Ranch
According to the Canada Creek Ranch family income data, there are 56 families falling into the $50,000 to $74,999 income range, which is the most common income bracket and makes up 45.5% of all families.
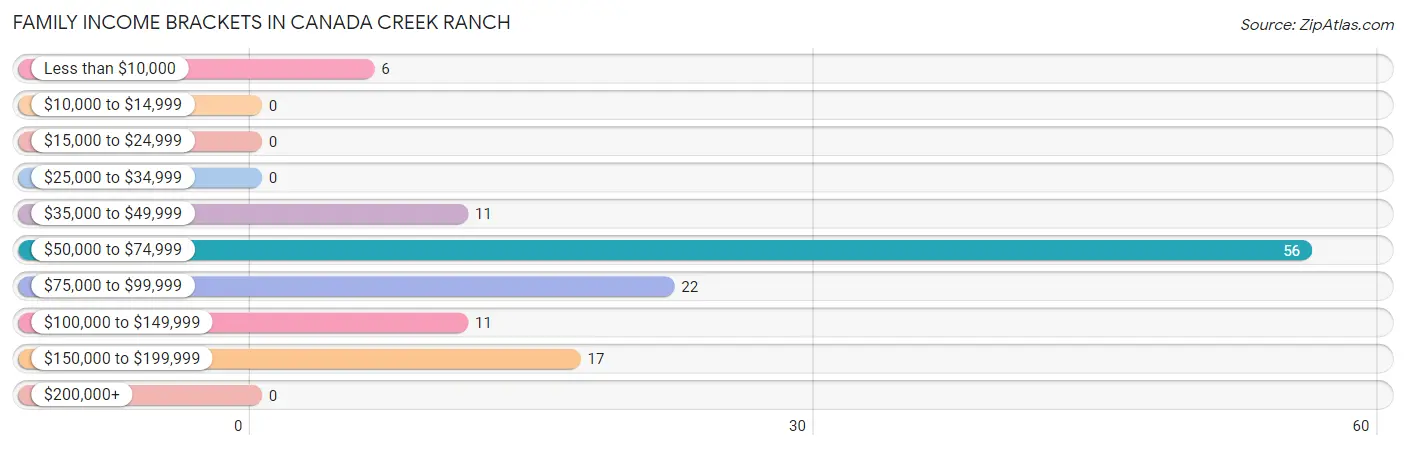
| Income Bracket | # Families | % Families |
| Less than $10,000 | 6 | 4.9% |
| $10,000 to $14,999 | 0 | 0.0% |
| $15,000 to $24,999 | 0 | 0.0% |
| $25,000 to $34,999 | 0 | 0.0% |
| $35,000 to $49,999 | 11 | 8.9% |
| $50,000 to $74,999 | 56 | 45.5% |
| $75,000 to $99,999 | 22 | 17.9% |
| $100,000 to $149,999 | 11 | 8.9% |
| $150,000 to $199,999 | 17 | 13.8% |
| $200,000+ | 0 | 0.0% |
Family Income by Famaliy Size in Canada Creek Ranch
3-person families (12 | 9.8%) account for the highest median family income in Canada Creek Ranch with $81,875 per family, while 2-person families (105 | 85.4%) have the highest median income of $35,810 per family member.
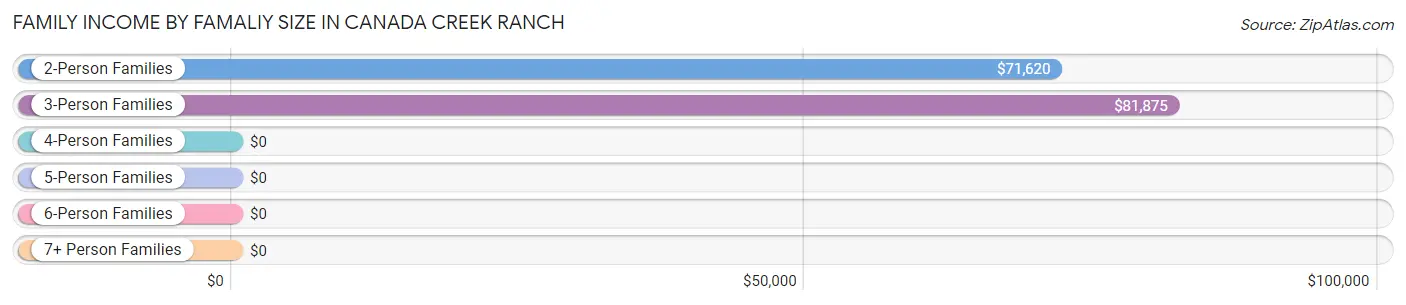
| Income Bracket | # Families | Median Income |
| 2-Person Families | 105 (85.4%) | $71,620 |
| 3-Person Families | 12 (9.8%) | $81,875 |
| 4-Person Families | 0 (0.0%) | $0 |
| 5-Person Families | 6 (4.9%) | $0 |
| 6-Person Families | 0 (0.0%) | $0 |
| 7+ Person Families | 0 (0.0%) | $0 |
| Total | 123 (100.0%) | $72,176 |
Family Income by Number of Earners in Canada Creek Ranch
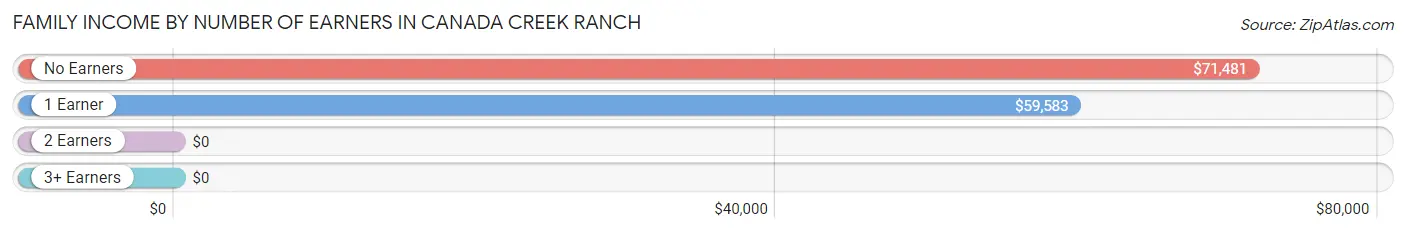
| Number of Earners | # Families | Median Income |
| No Earners | 70 (56.9%) | $71,481 |
| 1 Earner | 19 (15.4%) | $59,583 |
| 2 Earners | 30 (24.4%) | $0 |
| 3+ Earners | 4 (3.3%) | $0 |
| Total | 123 (100.0%) | $72,176 |
Household Income in Canada Creek Ranch
Household Income Brackets in Canada Creek Ranch
With 57 households falling in the category, the $50,000 to $74,999 income range is the most frequent in Canada Creek Ranch, accounting for 34.3% of all households.
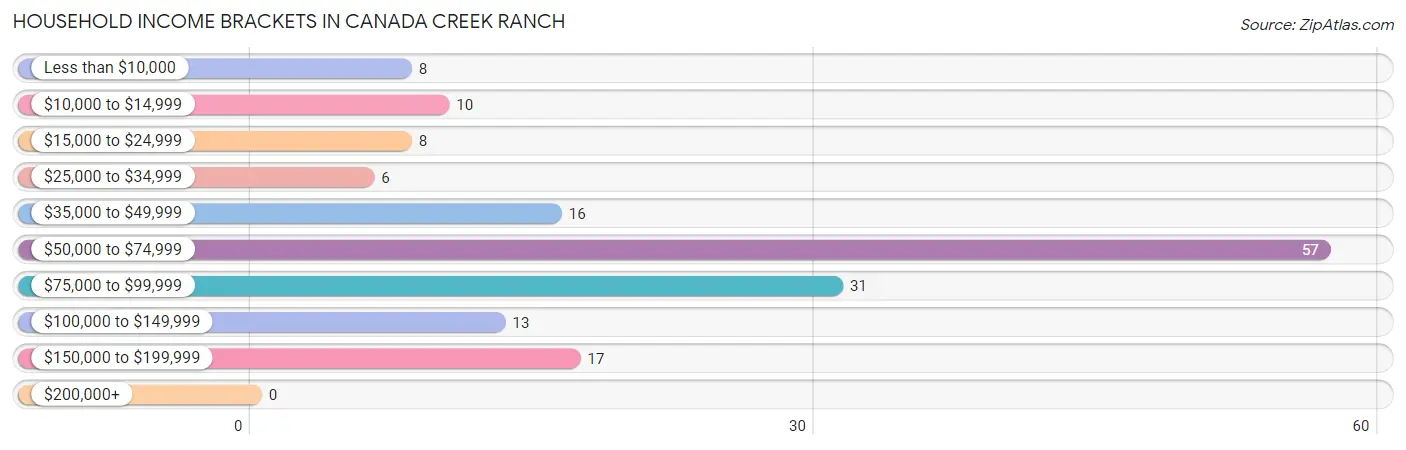
| Income Bracket | # Households | % Households |
| Less than $10,000 | 8 | 4.8% |
| $10,000 to $14,999 | 10 | 6.0% |
| $15,000 to $24,999 | 8 | 4.8% |
| $25,000 to $34,999 | 6 | 3.6% |
| $35,000 to $49,999 | 16 | 9.6% |
| $50,000 to $74,999 | 57 | 34.3% |
| $75,000 to $99,999 | 31 | 18.7% |
| $100,000 to $149,999 | 13 | 7.8% |
| $150,000 to $199,999 | 17 | 10.2% |
| $200,000+ | 0 | 0.0% |
Household Income by Householder Age in Canada Creek Ranch
The median household income in Canada Creek Ranch is $71,204, with the highest median household income of $70,509 found in the 65+ years age bracket for the primary householder. A total of 123 households (74.1%) fall into this category.
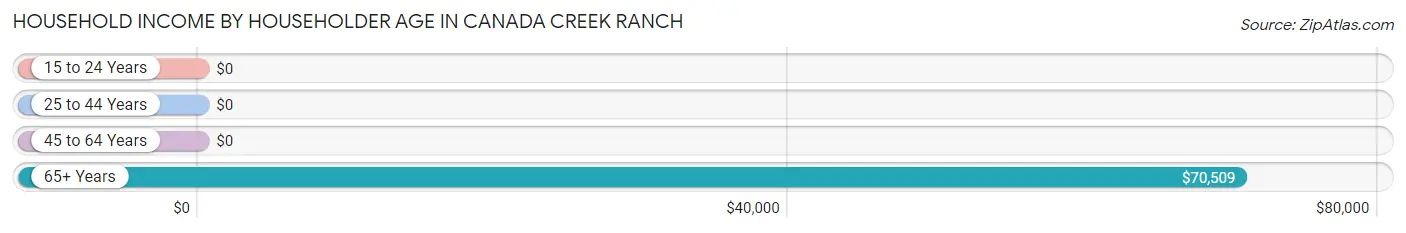
| Income Bracket | # Households | Median Income |
| 15 to 24 Years | 0 (0.0%) | $0 |
| 25 to 44 Years | 9 (5.4%) | $0 |
| 45 to 64 Years | 34 (20.5%) | $0 |
| 65+ Years | 123 (74.1%) | $70,509 |
| Total | 166 (100.0%) | $71,204 |
Poverty in Canada Creek Ranch
Income Below Poverty by Sex and Age in Canada Creek Ranch
With 3.8% poverty level for males and 6.4% for females among the residents of Canada Creek Ranch, 75 year old and over males and 75 year old and over females are the most vulnerable to poverty, with 6 males (10.9%) and 10 females (21.3%) in their respective age groups living below the poverty level.
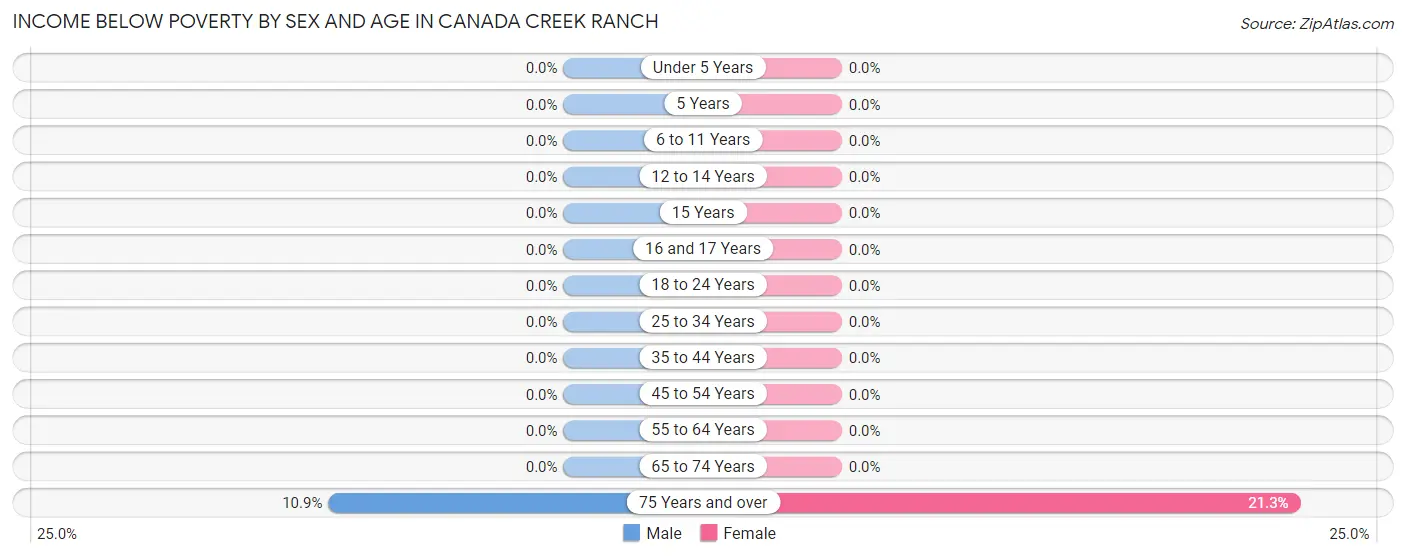
| Age Bracket | Male | Female |
| Under 5 Years | 0 (0.0%) | 0 (0.0%) |
| 5 Years | 0 (0.0%) | 0 (0.0%) |
| 6 to 11 Years | 0 (0.0%) | 0 (0.0%) |
| 12 to 14 Years | 0 (0.0%) | 0 (0.0%) |
| 15 Years | 0 (0.0%) | 0 (0.0%) |
| 16 and 17 Years | 0 (0.0%) | 0 (0.0%) |
| 18 to 24 Years | 0 (0.0%) | 0 (0.0%) |
| 25 to 34 Years | 0 (0.0%) | 0 (0.0%) |
| 35 to 44 Years | 0 (0.0%) | 0 (0.0%) |
| 45 to 54 Years | 0 (0.0%) | 0 (0.0%) |
| 55 to 64 Years | 0 (0.0%) | 0 (0.0%) |
| 65 to 74 Years | 0 (0.0%) | 0 (0.0%) |
| 75 Years and over | 6 (10.9%) | 10 (21.3%) |
| Total | 6 (3.8%) | 10 (6.4%) |
Income Above Poverty by Sex and Age in Canada Creek Ranch
According to the poverty statistics in Canada Creek Ranch, males aged 16 and 17 years and females aged 6 to 11 years are the age groups that are most secure financially, with 100.0% of males and 100.0% of females in these age groups living above the poverty line.
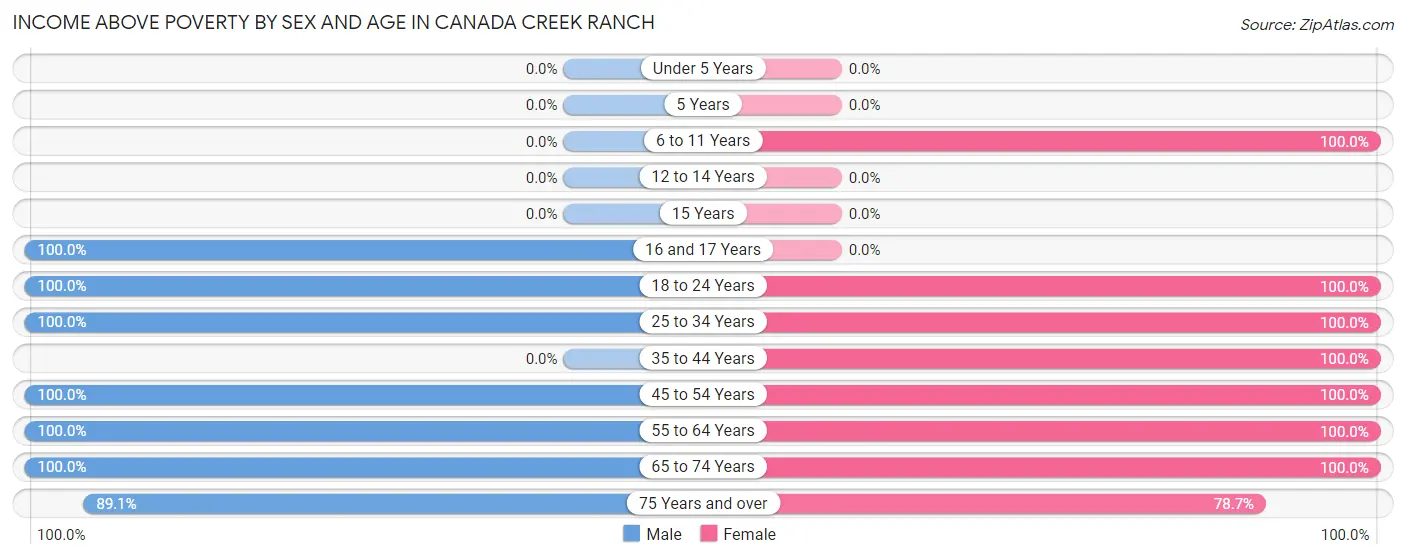
| Age Bracket | Male | Female |
| Under 5 Years | 0 (0.0%) | 0 (0.0%) |
| 5 Years | 0 (0.0%) | 0 (0.0%) |
| 6 to 11 Years | 0 (0.0%) | 4 (100.0%) |
| 12 to 14 Years | 0 (0.0%) | 0 (0.0%) |
| 15 Years | 0 (0.0%) | 0 (0.0%) |
| 16 and 17 Years | 8 (100.0%) | 0 (0.0%) |
| 18 to 24 Years | 6 (100.0%) | 3 (100.0%) |
| 25 to 34 Years | 9 (100.0%) | 2 (100.0%) |
| 35 to 44 Years | 0 (0.0%) | 8 (100.0%) |
| 45 to 54 Years | 3 (100.0%) | 17 (100.0%) |
| 55 to 64 Years | 32 (100.0%) | 21 (100.0%) |
| 65 to 74 Years | 45 (100.0%) | 54 (100.0%) |
| 75 Years and over | 49 (89.1%) | 37 (78.7%) |
| Total | 152 (96.2%) | 146 (93.6%) |
Income Below Poverty Among Married-Couple Families in Canada Creek Ranch
The poverty statistics for married-couple families in Canada Creek Ranch show that 5.2% or 6 of the total 115 families live below the poverty line. Families with no children have the highest poverty rate of 5.5%, comprising of 6 families. On the other hand, families with 1 or 2 children have the lowest poverty rate of 0.0%, which includes 0 families.
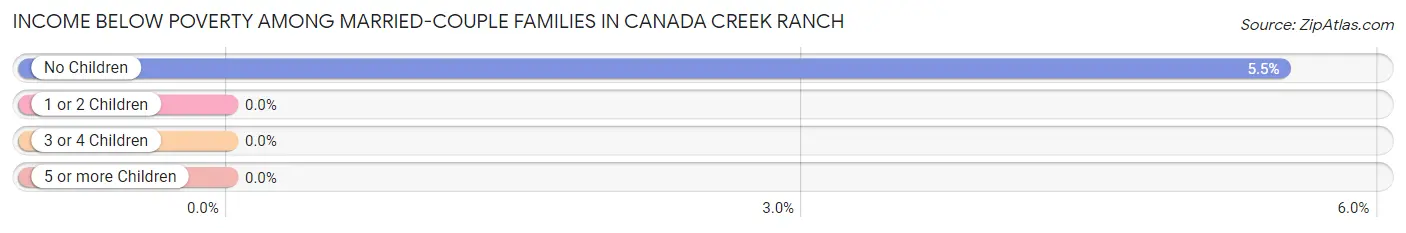
| Children | Above Poverty | Below Poverty |
| No Children | 103 (94.5%) | 6 (5.5%) |
| 1 or 2 Children | 6 (100.0%) | 0 (0.0%) |
| 3 or 4 Children | 0 (0.0%) | 0 (0.0%) |
| 5 or more Children | 0 (0.0%) | 0 (0.0%) |
| Total | 109 (94.8%) | 6 (5.2%) |
Income Below Poverty Among Single-Parent Households in Canada Creek Ranch
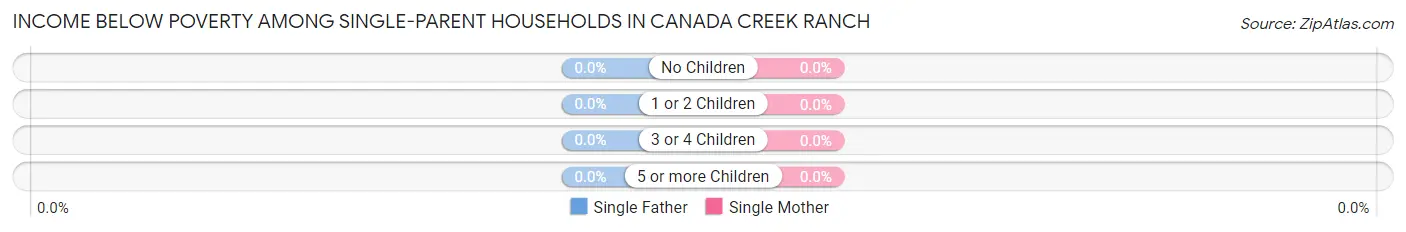
| Children | Single Father | Single Mother |
| No Children | 0 (0.0%) | 0 (0.0%) |
| 1 or 2 Children | 0 (0.0%) | 0 (0.0%) |
| 3 or 4 Children | 0 (0.0%) | 0 (0.0%) |
| 5 or more Children | 0 (0.0%) | 0 (0.0%) |
| Total | 0 (0.0%) | 0 (0.0%) |
Income Below Poverty Among Married-Couple vs Single-Parent Households in Canada Creek Ranch
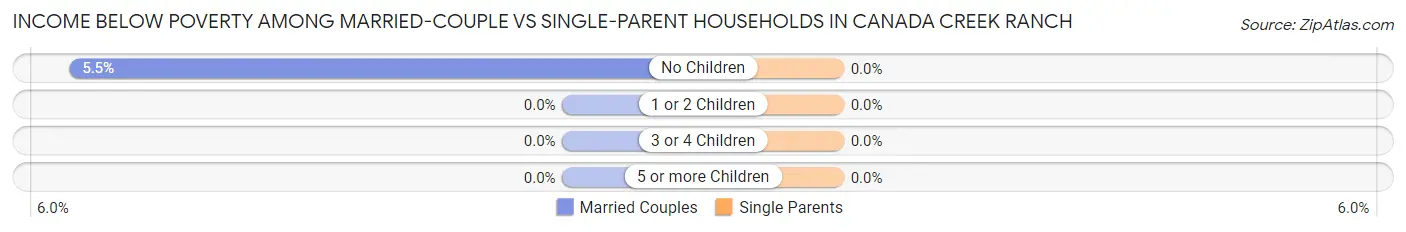
| Children | Married-Couple Families | Single-Parent Households |
| No Children | 6 (5.5%) | 0 (0.0%) |
| 1 or 2 Children | 0 (0.0%) | 0 (0.0%) |
| 3 or 4 Children | 0 (0.0%) | 0 (0.0%) |
| 5 or more Children | 0 (0.0%) | 0 (0.0%) |
| Total | 6 (5.2%) | 0 (0.0%) |
Race in Canada Creek Ranch
The most populous races in Canada Creek Ranch are White / Caucasian (306 | 97.5%), Two or more Races (8 | 2.5%), and Hispanic or Latino (4 | 1.3%).
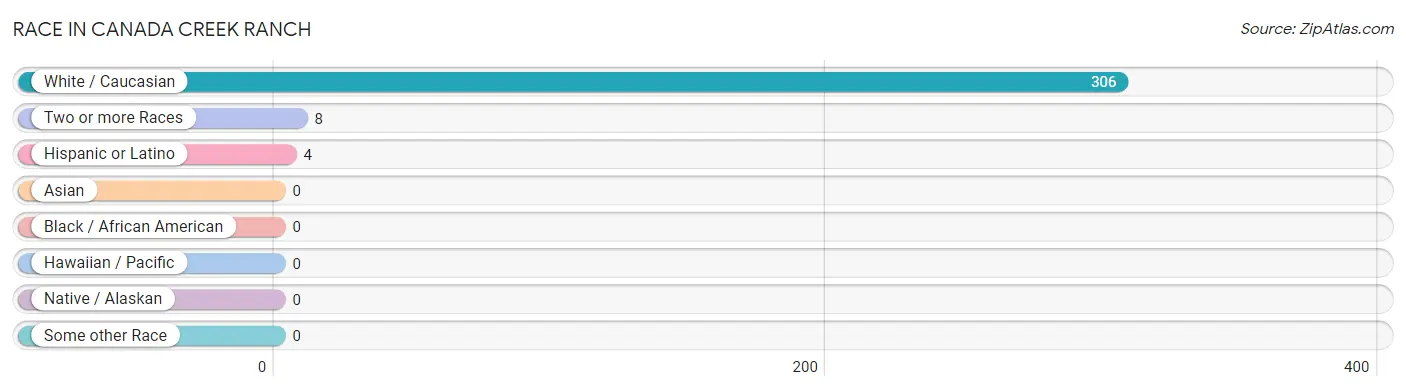
| Race | # Population | % Population |
| Asian | 0 | 0.0% |
| Black / African American | 0 | 0.0% |
| Hawaiian / Pacific | 0 | 0.0% |
| Hispanic or Latino | 4 | 1.3% |
| Native / Alaskan | 0 | 0.0% |
| White / Caucasian | 306 | 97.5% |
| Two or more Races | 8 | 2.5% |
| Some other Race | 0 | 0.0% |
| Total | 314 | 100.0% |
Ancestry in Canada Creek Ranch
The most populous ancestries reported in Canada Creek Ranch are English (147 | 46.8%), German (101 | 32.2%), Irish (63 | 20.1%), Polish (30 | 9.6%), and Scottish (18 | 5.7%), together accounting for 114.3% of all Canada Creek Ranch residents.
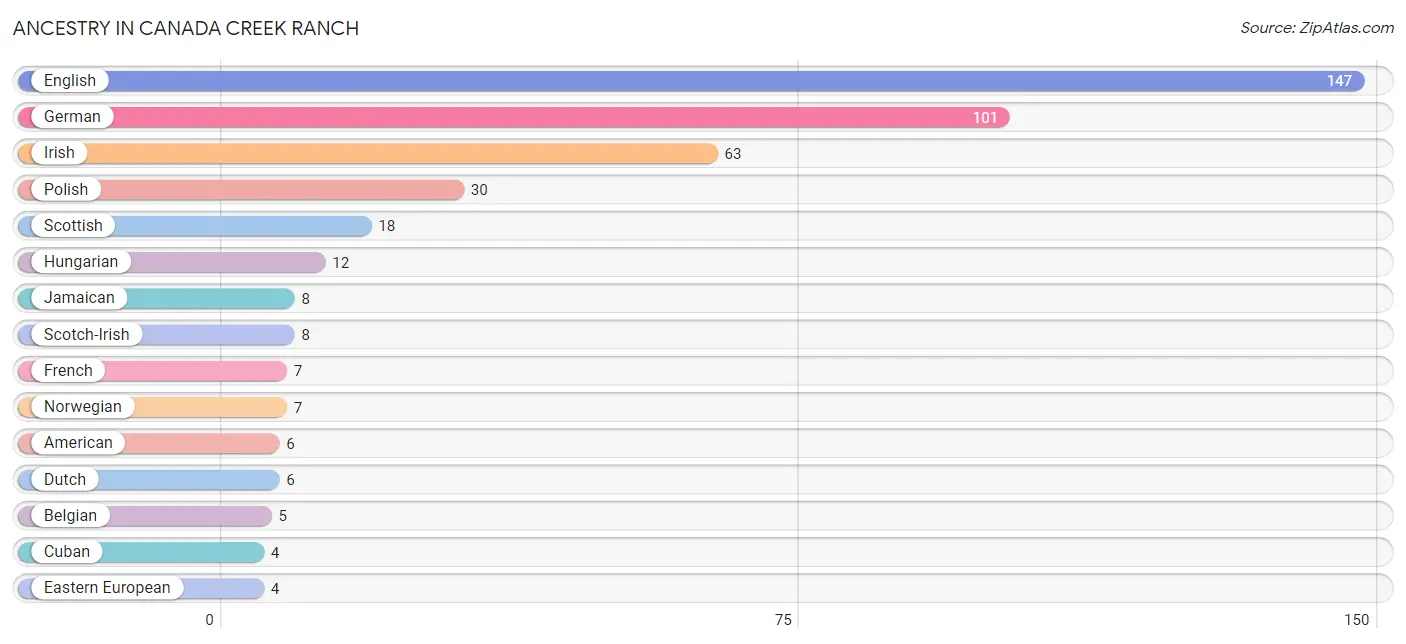
| Ancestry | # Population | % Population |
| American | 6 | 1.9% |
| Austrian | 3 | 1.0% |
| Belgian | 5 | 1.6% |
| Cuban | 4 | 1.3% |
| Dutch | 6 | 1.9% |
| Eastern European | 4 | 1.3% |
| English | 147 | 46.8% |
| Finnish | 3 | 1.0% |
| French | 7 | 2.2% |
| French Canadian | 3 | 1.0% |
| German | 101 | 32.2% |
| Hungarian | 12 | 3.8% |
| Iranian | 3 | 1.0% |
| Irish | 63 | 20.1% |
| Italian | 3 | 1.0% |
| Jamaican | 8 | 2.5% |
| Lithuanian | 3 | 1.0% |
| Norwegian | 7 | 2.2% |
| Polish | 30 | 9.6% |
| Russian | 3 | 1.0% |
| Scotch-Irish | 8 | 2.5% |
| Scottish | 18 | 5.7% |
| Slovene | 4 | 1.3% |
| Ukrainian | 2 | 0.6% |
| Welsh | 3 | 1.0% | View All 25 Rows |
Immigrants in Canada Creek Ranch
The most numerous immigrant groups reported in Canada Creek Ranch came from Asia (3 | 1.0%), Iran (3 | 1.0%), and South Central Asia (3 | 1.0%), together accounting for 2.9% of all Canada Creek Ranch residents.
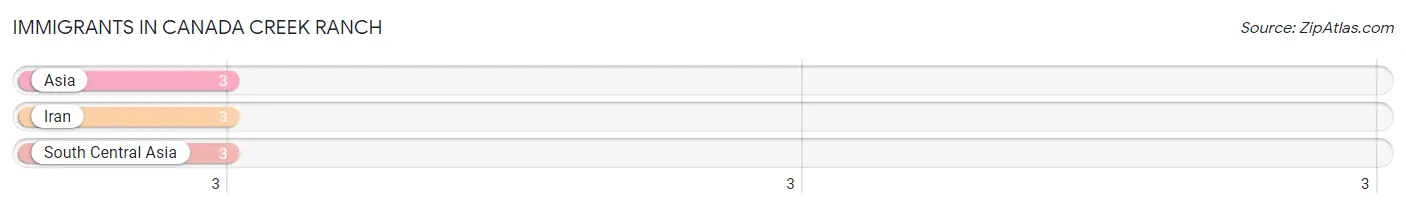
| Immigration Origin | # Population | % Population |
| Asia | 3 | 1.0% |
| Iran | 3 | 1.0% |
| South Central Asia | 3 | 1.0% | View All 3 Rows |
Sex and Age in Canada Creek Ranch
Sex and Age in Canada Creek Ranch
The most populous age groups in Canada Creek Ranch are 65 to 69 Years (34 | 21.5%) for men and 80 to 84 Years (33 | 21.1%) for women.
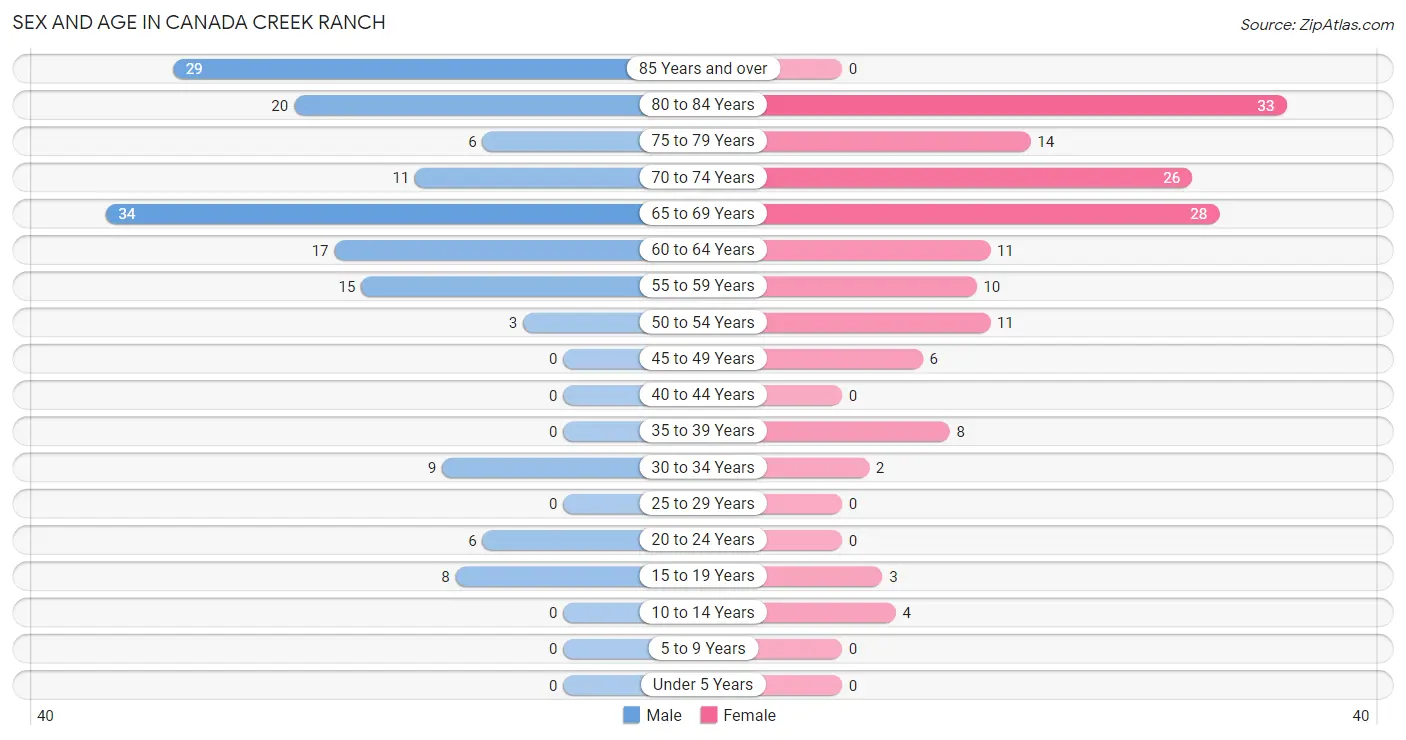
| Age Bracket | Male | Female |
| Under 5 Years | 0 (0.0%) | 0 (0.0%) |
| 5 to 9 Years | 0 (0.0%) | 0 (0.0%) |
| 10 to 14 Years | 0 (0.0%) | 4 (2.6%) |
| 15 to 19 Years | 8 (5.1%) | 3 (1.9%) |
| 20 to 24 Years | 6 (3.8%) | 0 (0.0%) |
| 25 to 29 Years | 0 (0.0%) | 0 (0.0%) |
| 30 to 34 Years | 9 (5.7%) | 2 (1.3%) |
| 35 to 39 Years | 0 (0.0%) | 8 (5.1%) |
| 40 to 44 Years | 0 (0.0%) | 0 (0.0%) |
| 45 to 49 Years | 0 (0.0%) | 6 (3.8%) |
| 50 to 54 Years | 3 (1.9%) | 11 (7.0%) |
| 55 to 59 Years | 15 (9.5%) | 10 (6.4%) |
| 60 to 64 Years | 17 (10.8%) | 11 (7.0%) |
| 65 to 69 Years | 34 (21.5%) | 28 (17.9%) |
| 70 to 74 Years | 11 (7.0%) | 26 (16.7%) |
| 75 to 79 Years | 6 (3.8%) | 14 (9.0%) |
| 80 to 84 Years | 20 (12.7%) | 33 (21.1%) |
| 85 Years and over | 29 (18.3%) | 0 (0.0%) |
| Total | 158 (100.0%) | 156 (100.0%) |
Families and Households in Canada Creek Ranch
Median Family Size in Canada Creek Ranch
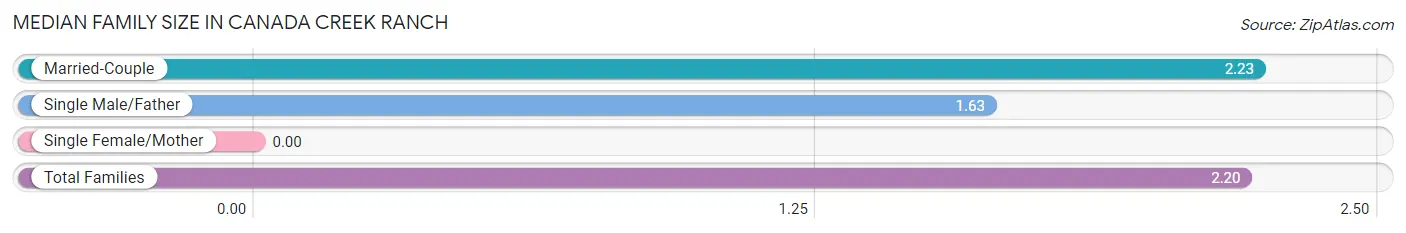
| Family Type | # Families | Family Size |
| Married-Couple | 115 (93.5%) | 2.23 |
| Single Male/Father | 8 (6.5%) | 1.63 |
| Single Female/Mother | 0 (0.0%) | - |
| Total Families | 123 (100.0%) | 2.20 |
Median Household Size in Canada Creek Ranch
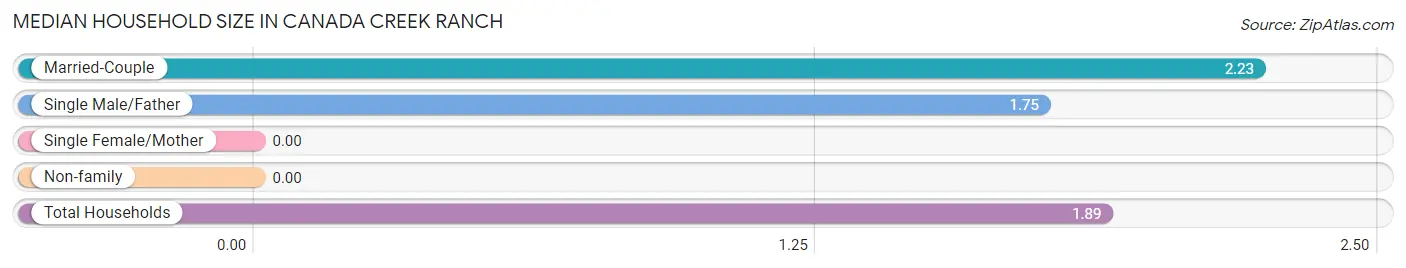
| Household Type | # Households | Household Size |
| Married-Couple | 115 (69.3%) | 2.23 |
| Single Male/Father | 8 (4.8%) | 1.75 |
| Single Female/Mother | 0 (0.0%) | - |
| Non-family | 43 (25.9%) | - |
| Total Households | 166 (100.0%) | 1.89 |
Household Size by Marriage Status in Canada Creek Ranch
Out of a total of 166 households in Canada Creek Ranch, 123 (74.1%) are family households, while 43 (25.9%) are nonfamily households. The most numerous type of family households are 2-person households, comprising 102, and the most common type of nonfamily households are 1-person households, comprising 43.
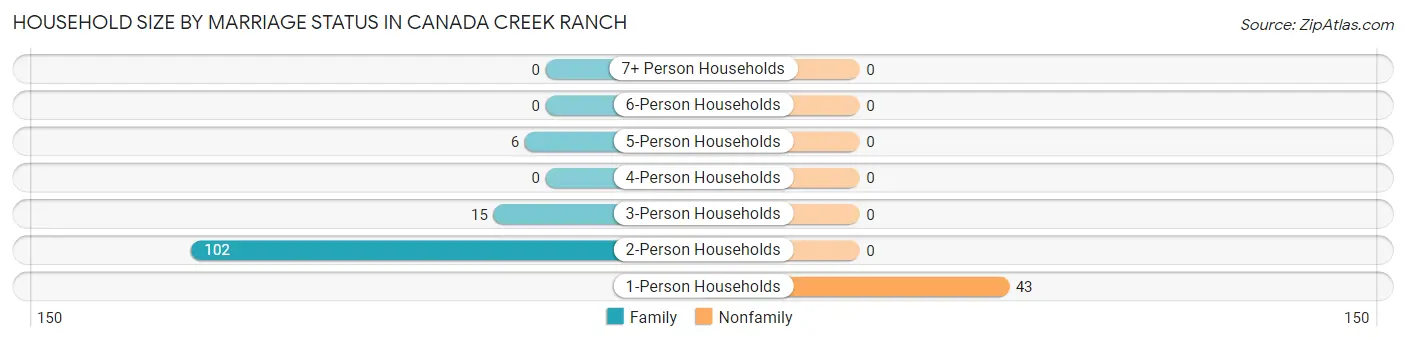
| Household Size | Family Households | Nonfamily Households |
| 1-Person Households | - | 43 (25.9%) |
| 2-Person Households | 102 (61.5%) | 0 (0.0%) |
| 3-Person Households | 15 (9.0%) | 0 (0.0%) |
| 4-Person Households | 0 (0.0%) | 0 (0.0%) |
| 5-Person Households | 6 (3.6%) | 0 (0.0%) |
| 6-Person Households | 0 (0.0%) | 0 (0.0%) |
| 7+ Person Households | 0 (0.0%) | 0 (0.0%) |
| Total | 123 (74.1%) | 43 (25.9%) |
Female Fertility in Canada Creek Ranch
Fertility by Age in Canada Creek Ranch
| Age Bracket | Women with Births | Births / 1,000 Women |
| 15 to 19 years | 0 (0.0%) | 0.0 |
| 20 to 34 years | 0 (0.0%) | 0.0 |
| 35 to 50 years | 0 (0.0%) | 0.0 |
| Total | 0 (0.0%) | 0.0 |
Fertility by Age by Marriage Status in Canada Creek Ranch
| Age Bracket | Married | Unmarried |
| 15 to 19 years | 0 (0.0%) | 0 (0.0%) |
| 20 to 34 years | 0 (0.0%) | 0 (0.0%) |
| 35 to 50 years | 0 (0.0%) | 0 (0.0%) |
| Total | 0 (0.0%) | 0 (0.0%) |
Fertility by Education in Canada Creek Ranch
| Educational Attainment | Women with Births | Births / 1,000 Women |
| Less than High School | 0 (0.0%) | 0.0 |
| High School Diploma | 0 (0.0%) | 0.0 |
| College or Associate's Degree | 0 (0.0%) | 0.0 |
| Bachelor's Degree | 0 (0.0%) | 0.0 |
| Graduate Degree | 0 (0.0%) | 0.0 |
| Total | 0 (0.0%) | 0.0 |
Fertility by Education by Marriage Status in Canada Creek Ranch
| Educational Attainment | Married | Unmarried |
| Less than High School | 0 (0.0%) | 0 (0.0%) |
| High School Diploma | 0 (0.0%) | 0 (0.0%) |
| College or Associate's Degree | 0 (0.0%) | 0 (0.0%) |
| Bachelor's Degree | 0 (0.0%) | 0 (0.0%) |
| Graduate Degree | 0 (0.0%) | 0 (0.0%) |
| Total | 0 (0.0%) | 0 (0.0%) |
Employment Characteristics in Canada Creek Ranch
Employment by Class of Employer in Canada Creek Ranch
Among the 82 employed individuals in Canada Creek Ranch, private company employees (45 | 54.9%), self-employed (not incorporated) (15 | 18.3%), and not-for-profit organizations (11 | 13.4%) make up the most common classes of employment.
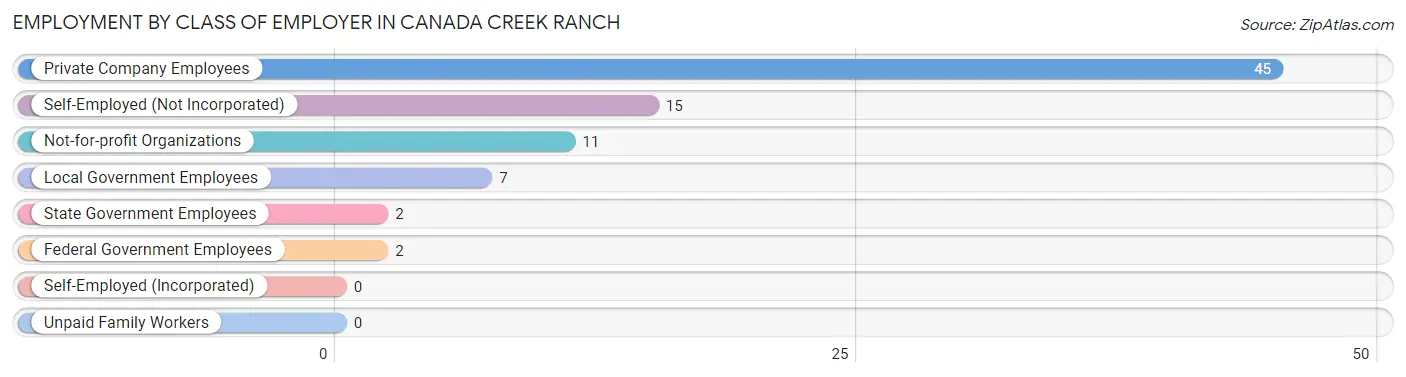
| Employer Class | # Employees | % Employees |
| Private Company Employees | 45 | 54.9% |
| Self-Employed (Incorporated) | 0 | 0.0% |
| Self-Employed (Not Incorporated) | 15 | 18.3% |
| Not-for-profit Organizations | 11 | 13.4% |
| Local Government Employees | 7 | 8.5% |
| State Government Employees | 2 | 2.4% |
| Federal Government Employees | 2 | 2.4% |
| Unpaid Family Workers | 0 | 0.0% |
| Total | 82 | 100.0% |
Employment Status by Age in Canada Creek Ranch
According to the labor force statistics for Canada Creek Ranch, out of the total population over 16 years of age (310), 28.1% or 87 individuals are in the labor force, with 5.7% or 5 of them unemployed. The age group with the highest labor force participation rate is 30 to 34 years, with 100.0% or 11 individuals in the labor force. Within the labor force, the 55 to 59 years age range has the highest percentage of unemployed individuals, with 18.8% or 3 of them being unemployed.
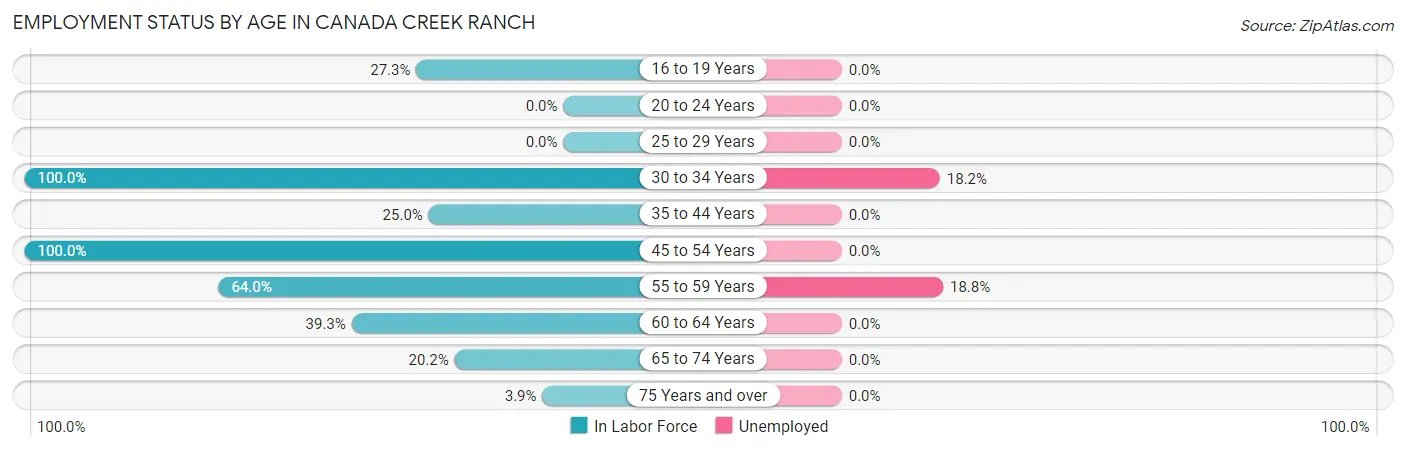
| Age Bracket | In Labor Force | Unemployed |
| 16 to 19 Years | 3 (27.3%) | 0 (0.0%) |
| 20 to 24 Years | 0 (0.0%) | 0 (0.0%) |
| 25 to 29 Years | 0 (0.0%) | 0 (0.0%) |
| 30 to 34 Years | 11 (100.0%) | 2 (18.2%) |
| 35 to 44 Years | 2 (25.0%) | 0 (0.0%) |
| 45 to 54 Years | 20 (100.0%) | 0 (0.0%) |
| 55 to 59 Years | 16 (64.0%) | 3 (18.8%) |
| 60 to 64 Years | 11 (39.3%) | 0 (0.0%) |
| 65 to 74 Years | 20 (20.2%) | 0 (0.0%) |
| 75 Years and over | 4 (3.9%) | 0 (0.0%) |
| Total | 87 (28.1%) | 5 (5.7%) |
Employment Status by Educational Attainment in Canada Creek Ranch
According to labor force statistics for Canada Creek Ranch, 65.2% of individuals (60) out of the total population between 25 and 64 years of age (92) are in the labor force, with 8.3% or 5 of them being unemployed. The group with the highest labor force participation rate are those with the educational attainment of college / associate degree, with 84.3% or 43 individuals in the labor force. Within the labor force, individuals with bachelor's degree or higher education have the highest percentage of unemployment, with 30.0% or 3 of them being unemployed.
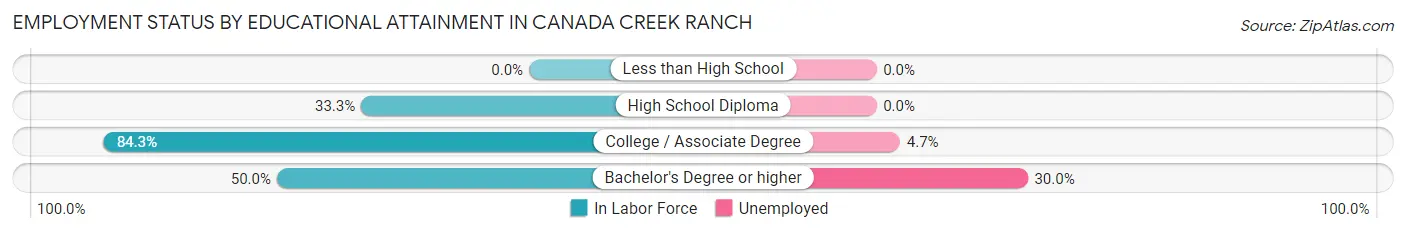
| Educational Attainment | In Labor Force | Unemployed |
| Less than High School | 0 (0.0%) | 0 (0.0%) |
| High School Diploma | 7 (33.3%) | 0 (0.0%) |
| College / Associate Degree | 43 (84.3%) | 2 (4.7%) |
| Bachelor's Degree or higher | 10 (50.0%) | 6 (30.0%) |
| Total | 60 (65.2%) | 8 (8.3%) |
Employment Occupations by Sex in Canada Creek Ranch
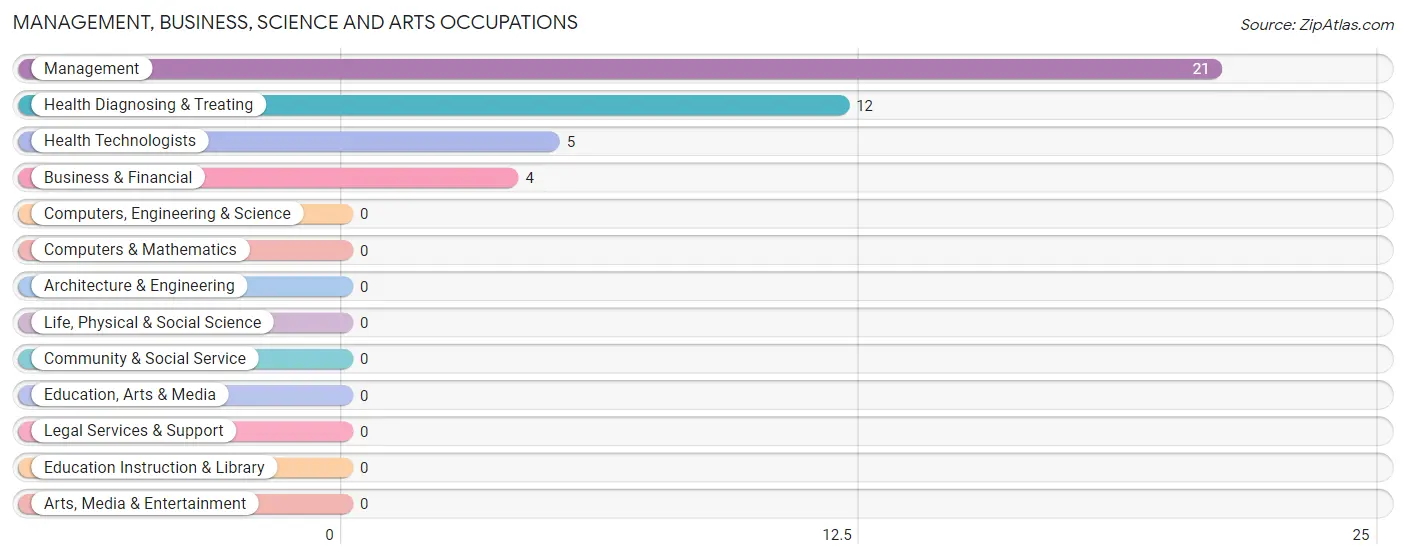
Management, Business, Science and Arts Occupations
The most common Management, Business, Science and Arts occupations in Canada Creek Ranch are Management (21 | 25.6%), Health Diagnosing & Treating (12 | 14.6%), Health Technologists (5 | 6.1%), and Business & Financial (4 | 4.9%).
Management, Business, Science and Arts Occupations by Sex
Within the Management, Business, Science and Arts occupations in Canada Creek Ranch, the most male-oriented occupations are Management (71.4%), Health Diagnosing & Treating (66.7%), and Health Technologists (40.0%), while the most female-oriented occupations are Business & Financial (100.0%), Health Technologists (60.0%), and Health Diagnosing & Treating (33.3%).
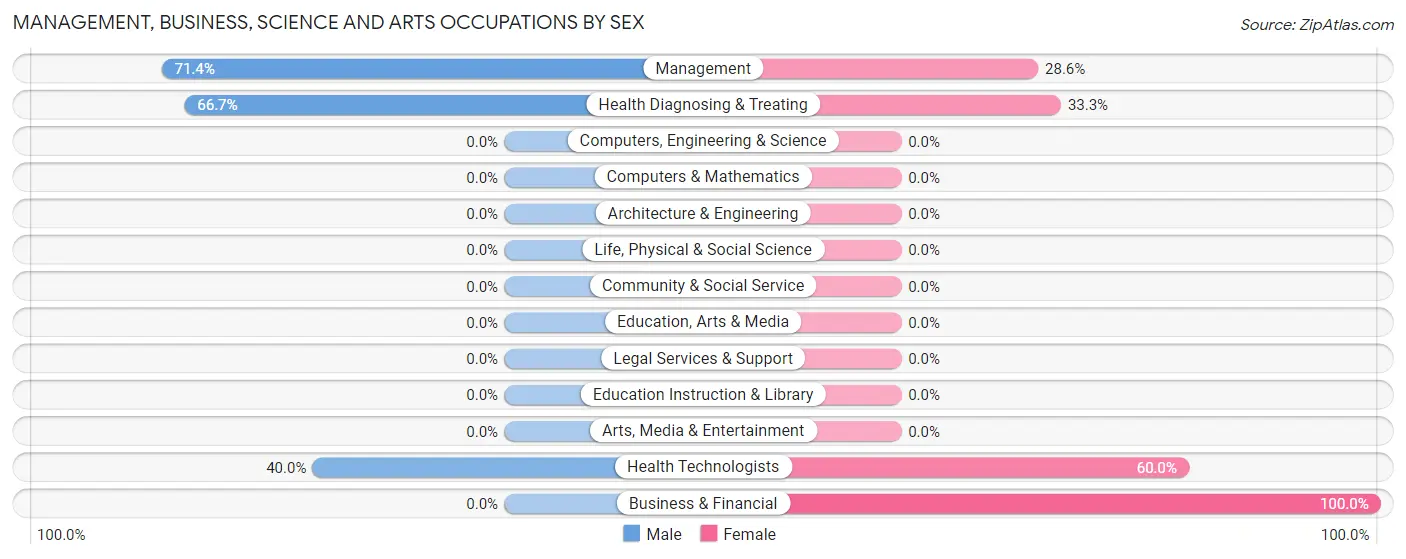
| Occupation | Male | Female |
| Management | 15 (71.4%) | 6 (28.6%) |
| Business & Financial | 0 (0.0%) | 4 (100.0%) |
| Computers, Engineering & Science | 0 (0.0%) | 0 (0.0%) |
| Computers & Mathematics | 0 (0.0%) | 0 (0.0%) |
| Architecture & Engineering | 0 (0.0%) | 0 (0.0%) |
| Life, Physical & Social Science | 0 (0.0%) | 0 (0.0%) |
| Community & Social Service | 0 (0.0%) | 0 (0.0%) |
| Education, Arts & Media | 0 (0.0%) | 0 (0.0%) |
| Legal Services & Support | 0 (0.0%) | 0 (0.0%) |
| Education Instruction & Library | 0 (0.0%) | 0 (0.0%) |
| Arts, Media & Entertainment | 0 (0.0%) | 0 (0.0%) |
| Health Diagnosing & Treating | 8 (66.7%) | 4 (33.3%) |
| Health Technologists | 2 (40.0%) | 3 (60.0%) |
| Total (Category) | 23 (62.2%) | 14 (37.8%) |
| Total (Overall) | 44 (53.7%) | 38 (46.3%) |
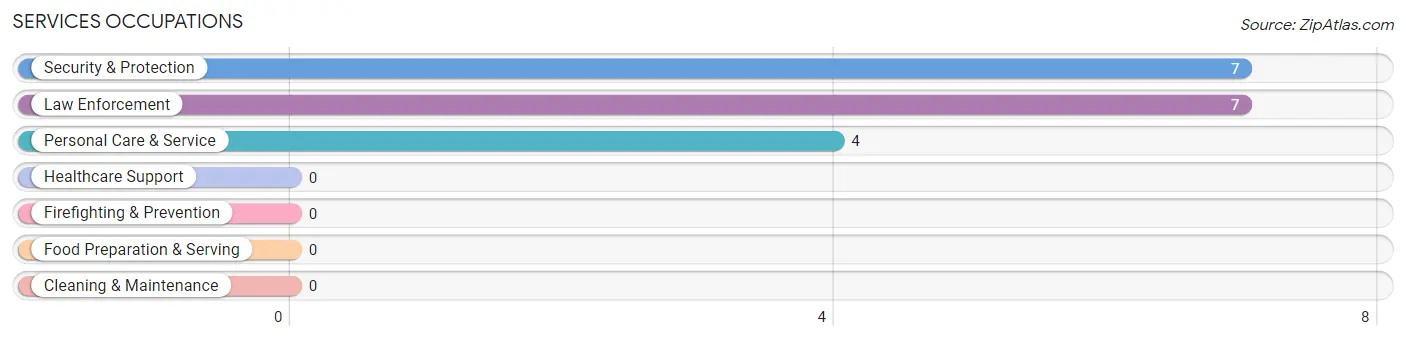
Services Occupations
The most common Services occupations in Canada Creek Ranch are Security & Protection (7 | 8.5%), Law Enforcement (7 | 8.5%), and Personal Care & Service (4 | 4.9%).
Services Occupations by Sex
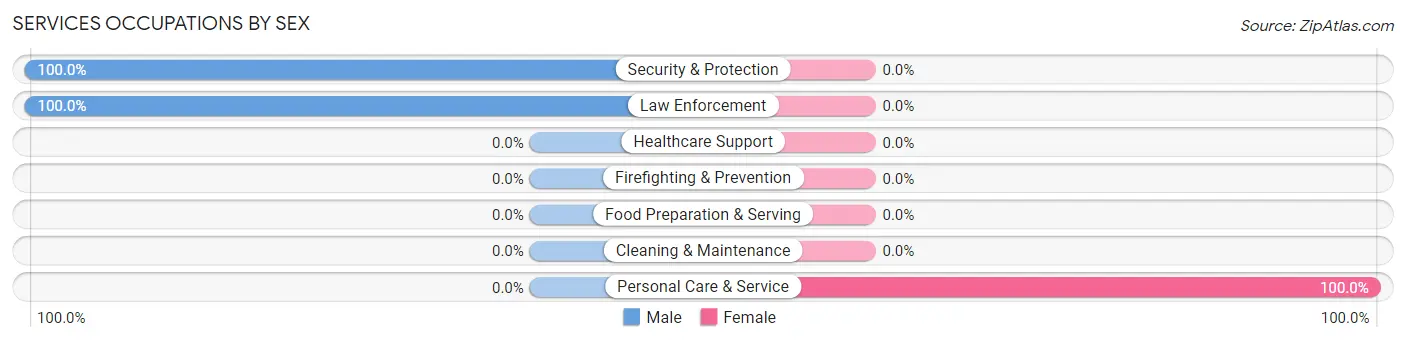
| Occupation | Male | Female |
| Healthcare Support | 0 (0.0%) | 0 (0.0%) |
| Security & Protection | 7 (100.0%) | 0 (0.0%) |
| Firefighting & Prevention | 0 (0.0%) | 0 (0.0%) |
| Law Enforcement | 7 (100.0%) | 0 (0.0%) |
| Food Preparation & Serving | 0 (0.0%) | 0 (0.0%) |
| Cleaning & Maintenance | 0 (0.0%) | 0 (0.0%) |
| Personal Care & Service | 0 (0.0%) | 4 (100.0%) |
| Total (Category) | 7 (63.6%) | 4 (36.4%) |
| Total (Overall) | 44 (53.7%) | 38 (46.3%) |
Sales and Office Occupations
The most common Sales and Office occupations in Canada Creek Ranch are Sales & Related (6 | 7.3%), and Office & Administration (3 | 3.7%).

Sales and Office Occupations by Sex

| Occupation | Male | Female |
| Sales & Related | 3 (50.0%) | 3 (50.0%) |
| Office & Administration | 0 (0.0%) | 3 (100.0%) |
| Total (Category) | 3 (33.3%) | 6 (66.7%) |
| Total (Overall) | 44 (53.7%) | 38 (46.3%) |
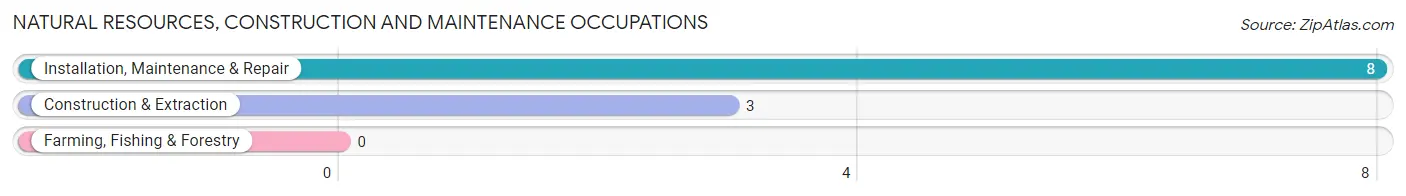
Natural Resources, Construction and Maintenance Occupations
The most common Natural Resources, Construction and Maintenance occupations in Canada Creek Ranch are Installation, Maintenance & Repair (8 | 9.8%), and Construction & Extraction (3 | 3.7%).
Natural Resources, Construction and Maintenance Occupations by Sex
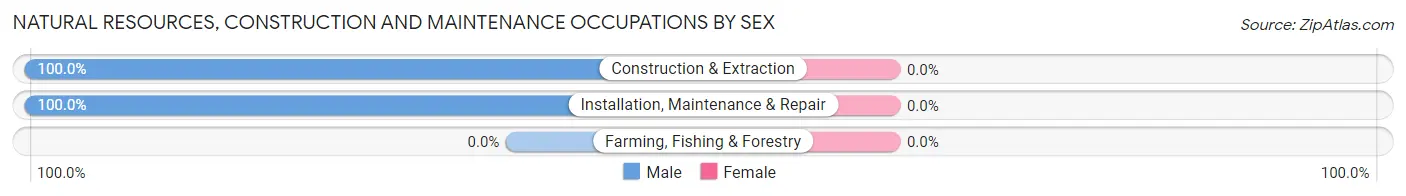
| Occupation | Male | Female |
| Farming, Fishing & Forestry | 0 (0.0%) | 0 (0.0%) |
| Construction & Extraction | 3 (100.0%) | 0 (0.0%) |
| Installation, Maintenance & Repair | 8 (100.0%) | 0 (0.0%) |
| Total (Category) | 11 (100.0%) | 0 (0.0%) |
| Total (Overall) | 44 (53.7%) | 38 (46.3%) |
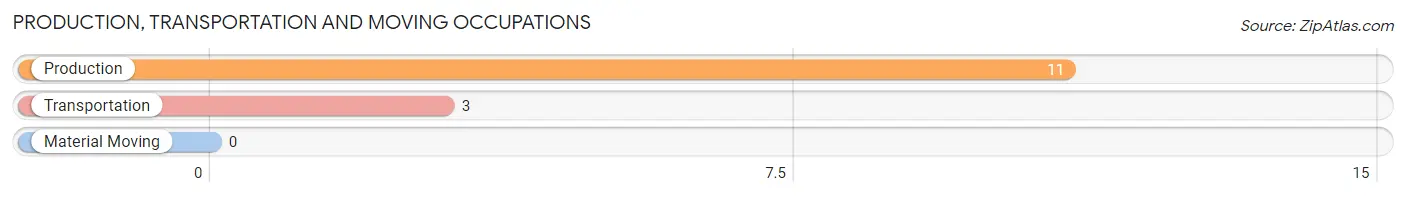
Production, Transportation and Moving Occupations
The most common Production, Transportation and Moving occupations in Canada Creek Ranch are Production (11 | 13.4%), and Transportation (3 | 3.7%).
Production, Transportation and Moving Occupations by Sex
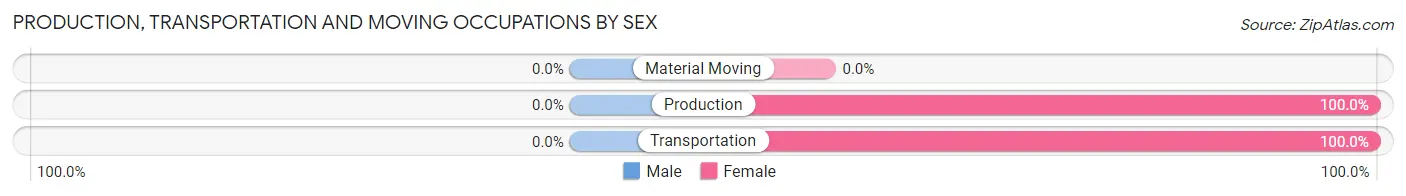
| Occupation | Male | Female |
| Production | 0 (0.0%) | 11 (100.0%) |
| Transportation | 0 (0.0%) | 3 (100.0%) |
| Material Moving | 0 (0.0%) | 0 (0.0%) |
| Total (Category) | 0 (0.0%) | 14 (100.0%) |
| Total (Overall) | 44 (53.7%) | 38 (46.3%) |
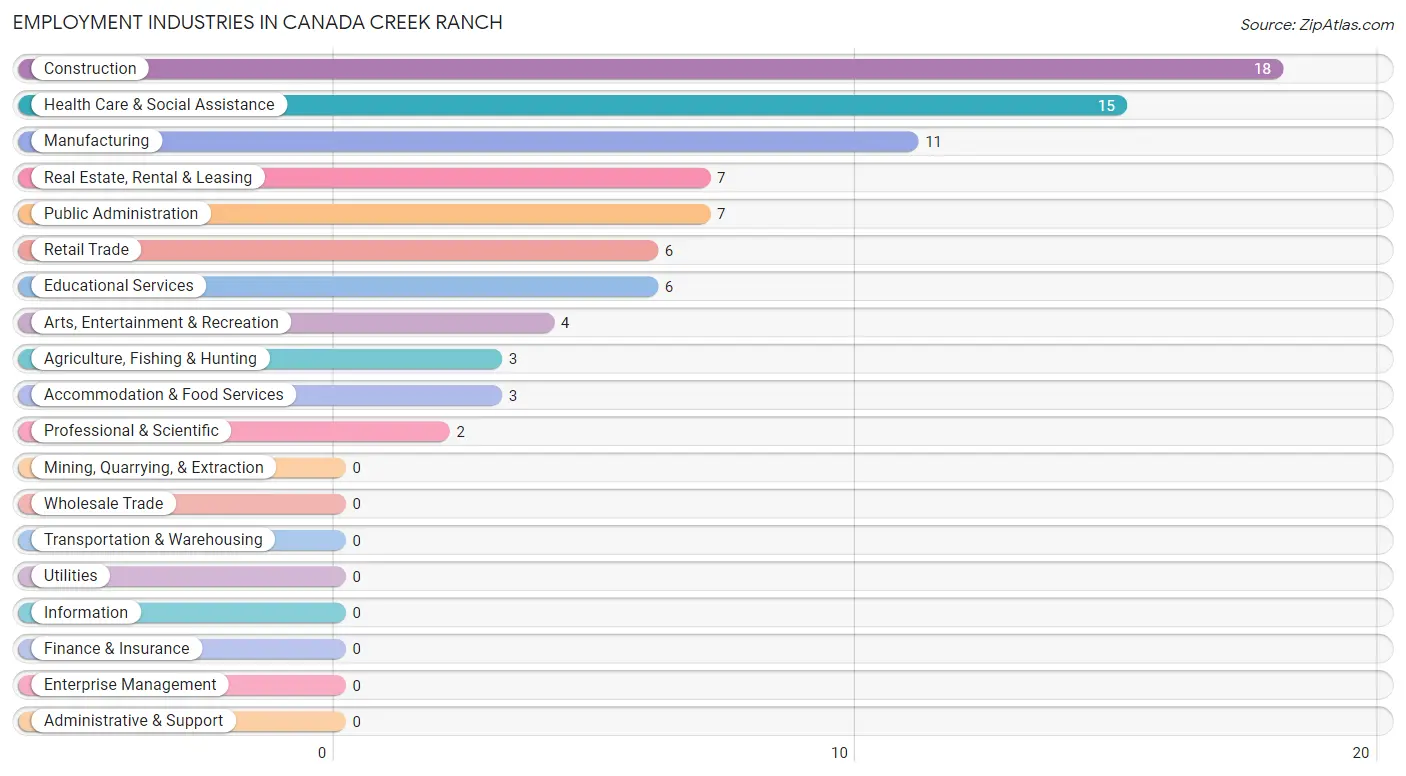
Employment Industries by Sex in Canada Creek Ranch
Employment Industries in Canada Creek Ranch
The major employment industries in Canada Creek Ranch include Construction (18 | 22.0%), Health Care & Social Assistance (15 | 18.3%), Manufacturing (11 | 13.4%), Real Estate, Rental & Leasing (7 | 8.5%), and Public Administration (7 | 8.5%).
Employment Industries by Sex in Canada Creek Ranch
The Canada Creek Ranch industries that see more men than women are Agriculture, Fishing & Hunting (100.0%), Construction (100.0%), and Real Estate, Rental & Leasing (100.0%), whereas the industries that tend to have a higher number of women are Manufacturing (100.0%), Retail Trade (100.0%), and Professional & Scientific (100.0%).
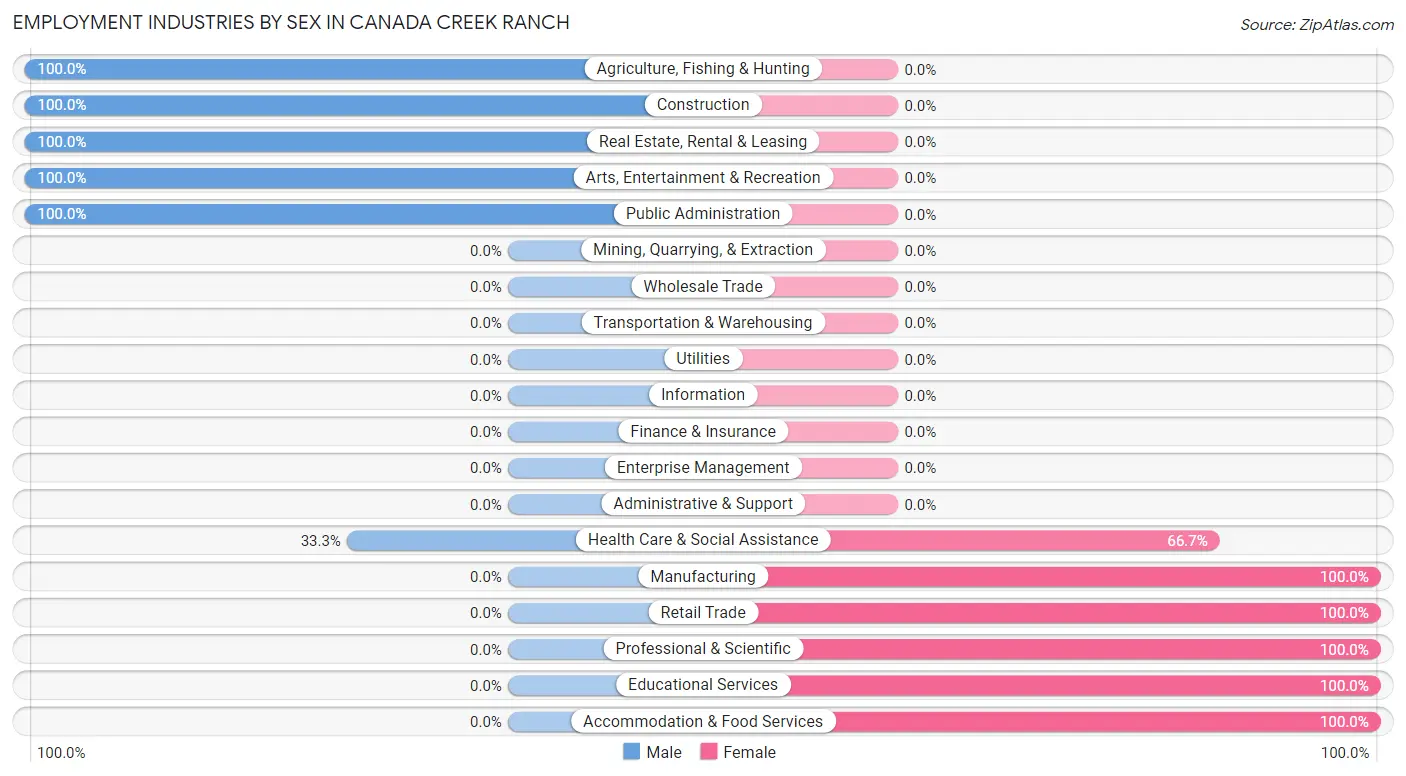
| Industry | Male | Female |
| Agriculture, Fishing & Hunting | 3 (100.0%) | 0 (0.0%) |
| Mining, Quarrying, & Extraction | 0 (0.0%) | 0 (0.0%) |
| Construction | 18 (100.0%) | 0 (0.0%) |
| Manufacturing | 0 (0.0%) | 11 (100.0%) |
| Wholesale Trade | 0 (0.0%) | 0 (0.0%) |
| Retail Trade | 0 (0.0%) | 6 (100.0%) |
| Transportation & Warehousing | 0 (0.0%) | 0 (0.0%) |
| Utilities | 0 (0.0%) | 0 (0.0%) |
| Information | 0 (0.0%) | 0 (0.0%) |
| Finance & Insurance | 0 (0.0%) | 0 (0.0%) |
| Real Estate, Rental & Leasing | 7 (100.0%) | 0 (0.0%) |
| Professional & Scientific | 0 (0.0%) | 2 (100.0%) |
| Enterprise Management | 0 (0.0%) | 0 (0.0%) |
| Administrative & Support | 0 (0.0%) | 0 (0.0%) |
| Educational Services | 0 (0.0%) | 6 (100.0%) |
| Health Care & Social Assistance | 5 (33.3%) | 10 (66.7%) |
| Arts, Entertainment & Recreation | 4 (100.0%) | 0 (0.0%) |
| Accommodation & Food Services | 0 (0.0%) | 3 (100.0%) |
| Public Administration | 7 (100.0%) | 0 (0.0%) |
| Total | 44 (53.7%) | 38 (46.3%) |
Education in Canada Creek Ranch
School Enrollment in Canada Creek Ranch
The most common levels of schooling among the 12 students in Canada Creek Ranch are high school (8 | 66.7%), and middle school (4 | 33.3%).
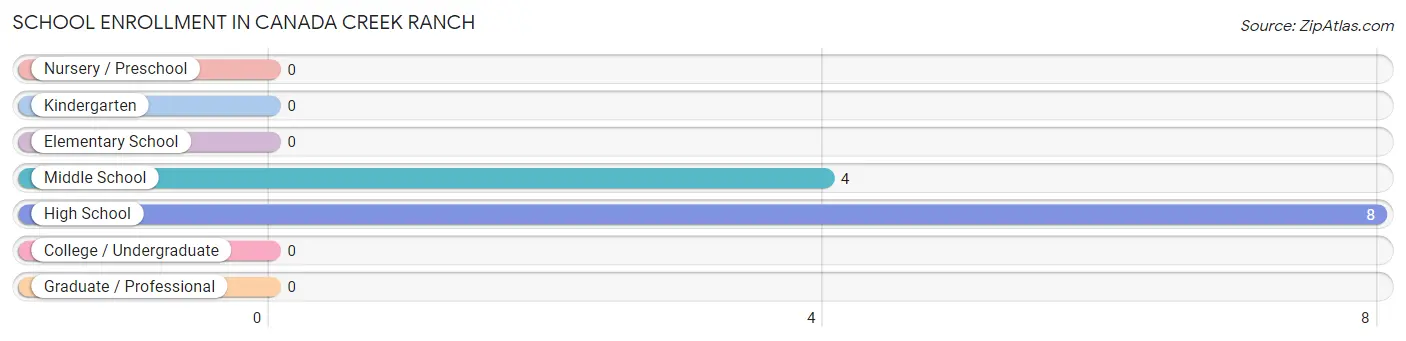
| School Level | # Students | % Students |
| Nursery / Preschool | 0 | 0.0% |
| Kindergarten | 0 | 0.0% |
| Elementary School | 0 | 0.0% |
| Middle School | 4 | 33.3% |
| High School | 8 | 66.7% |
| College / Undergraduate | 0 | 0.0% |
| Graduate / Professional | 0 | 0.0% |
| Total | 12 | 100.0% |
School Enrollment by Age by Funding Source in Canada Creek Ranch
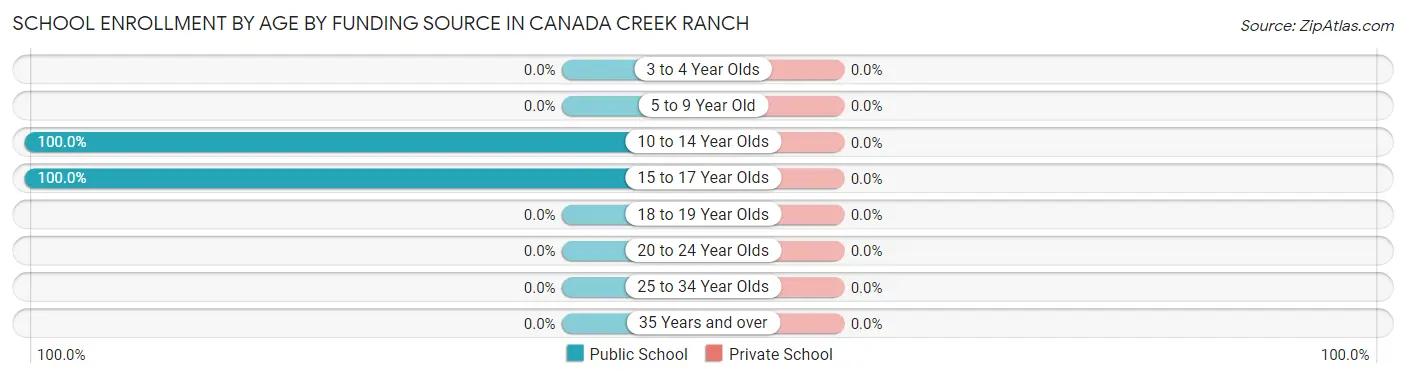
| Age Bracket | Public School | Private School |
| 3 to 4 Year Olds | 0 (0.0%) | 0 (0.0%) |
| 5 to 9 Year Old | 0 (0.0%) | 0 (0.0%) |
| 10 to 14 Year Olds | 4 (100.0%) | 0 (0.0%) |
| 15 to 17 Year Olds | 8 (100.0%) | 0 (0.0%) |
| 18 to 19 Year Olds | 0 (0.0%) | 0 (0.0%) |
| 20 to 24 Year Olds | 0 (0.0%) | 0 (0.0%) |
| 25 to 34 Year Olds | 0 (0.0%) | 0 (0.0%) |
| 35 Years and over | 0 (0.0%) | 0 (0.0%) |
| Total | 12 (100.0%) | 0 (0.0%) |
Educational Attainment by Field of Study in Canada Creek Ranch
Bio, nature & agricultural (16 | 19.1%), science & technology (15 | 17.9%), education (14 | 16.7%), business (12 | 14.3%), and engineering (11 | 13.1%) are the most common fields of study among 84 individuals in Canada Creek Ranch who have obtained a bachelor's degree or higher.
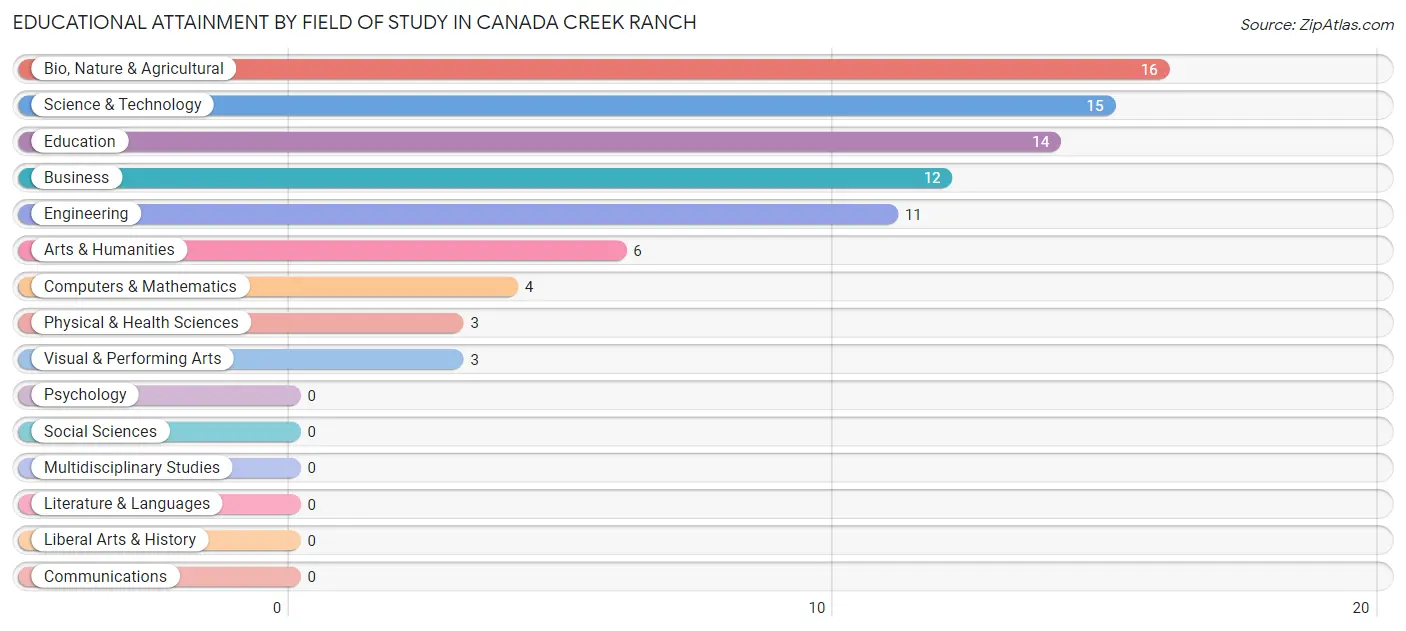
| Field of Study | # Graduates | % Graduates |
| Computers & Mathematics | 4 | 4.8% |
| Bio, Nature & Agricultural | 16 | 19.1% |
| Physical & Health Sciences | 3 | 3.6% |
| Psychology | 0 | 0.0% |
| Social Sciences | 0 | 0.0% |
| Engineering | 11 | 13.1% |
| Multidisciplinary Studies | 0 | 0.0% |
| Science & Technology | 15 | 17.9% |
| Business | 12 | 14.3% |
| Education | 14 | 16.7% |
| Literature & Languages | 0 | 0.0% |
| Liberal Arts & History | 0 | 0.0% |
| Visual & Performing Arts | 3 | 3.6% |
| Communications | 0 | 0.0% |
| Arts & Humanities | 6 | 7.1% |
| Total | 84 | 100.0% |
Transportation & Commute in Canada Creek Ranch
Vehicle Availability by Sex in Canada Creek Ranch
The most prevalent vehicle ownership categories in Canada Creek Ranch are males with 3 vehicles (26, accounting for 59.1%) and females with 3 vehicles (19, making up 68.4%).
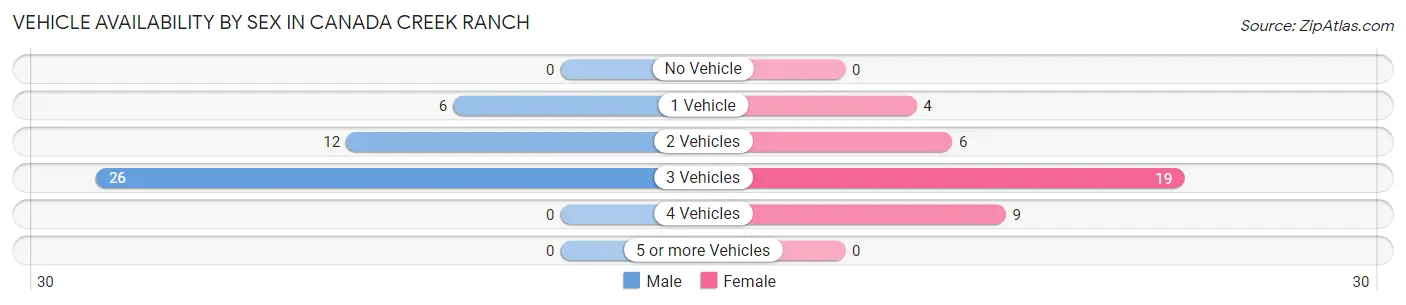
| Vehicles Available | Male | Female |
| No Vehicle | 0 (0.0%) | 0 (0.0%) |
| 1 Vehicle | 6 (13.6%) | 4 (10.5%) |
| 2 Vehicles | 12 (27.3%) | 6 (15.8%) |
| 3 Vehicles | 26 (59.1%) | 19 (50.0%) |
| 4 Vehicles | 0 (0.0%) | 9 (23.7%) |
| 5 or more Vehicles | 0 (0.0%) | 0 (0.0%) |
| Total | 44 (100.0%) | 38 (100.0%) |
Commute Time in Canada Creek Ranch
The most frequently occuring commute durations in Canada Creek Ranch are 15 to 19 minutes (19 commuters, 25.7%), 30 to 34 minutes (17 commuters, 23.0%), and 45 to 59 minutes (12 commuters, 16.2%).
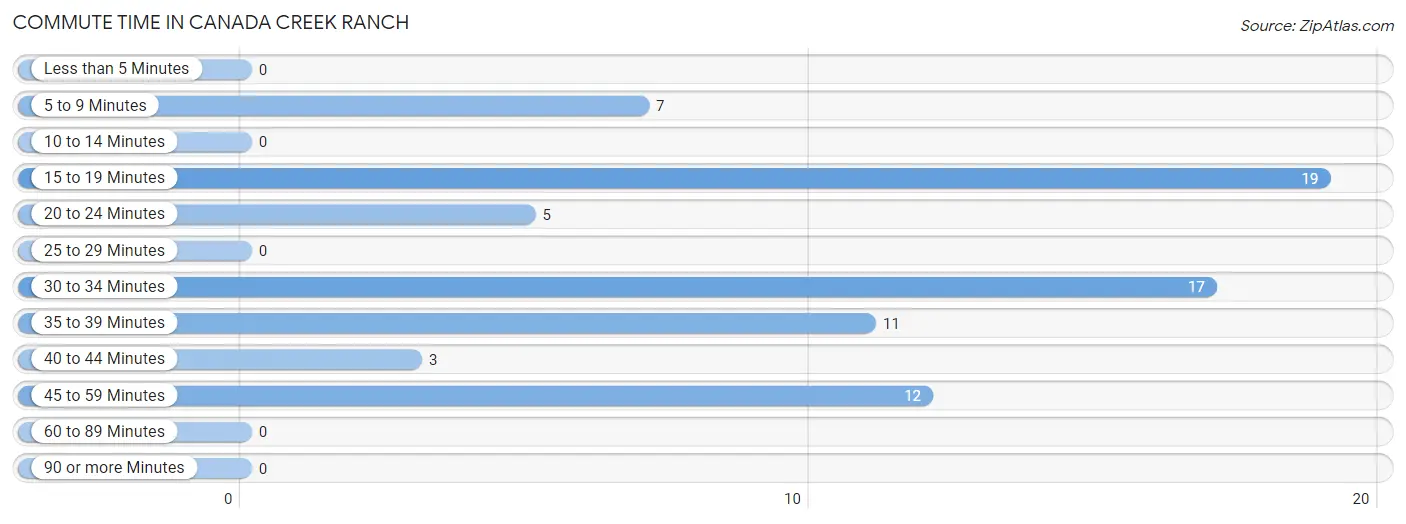
| Commute Time | # Commuters | % Commuters |
| Less than 5 Minutes | 0 | 0.0% |
| 5 to 9 Minutes | 7 | 9.5% |
| 10 to 14 Minutes | 0 | 0.0% |
| 15 to 19 Minutes | 19 | 25.7% |
| 20 to 24 Minutes | 5 | 6.8% |
| 25 to 29 Minutes | 0 | 0.0% |
| 30 to 34 Minutes | 17 | 23.0% |
| 35 to 39 Minutes | 11 | 14.9% |
| 40 to 44 Minutes | 3 | 4.1% |
| 45 to 59 Minutes | 12 | 16.2% |
| 60 to 89 Minutes | 0 | 0.0% |
| 90 or more Minutes | 0 | 0.0% |
Commute Time by Sex in Canada Creek Ranch
The most common commute times in Canada Creek Ranch are 15 to 19 minutes (13 commuters, 29.5%) for males and 35 to 39 minutes (11 commuters, 36.7%) for females.
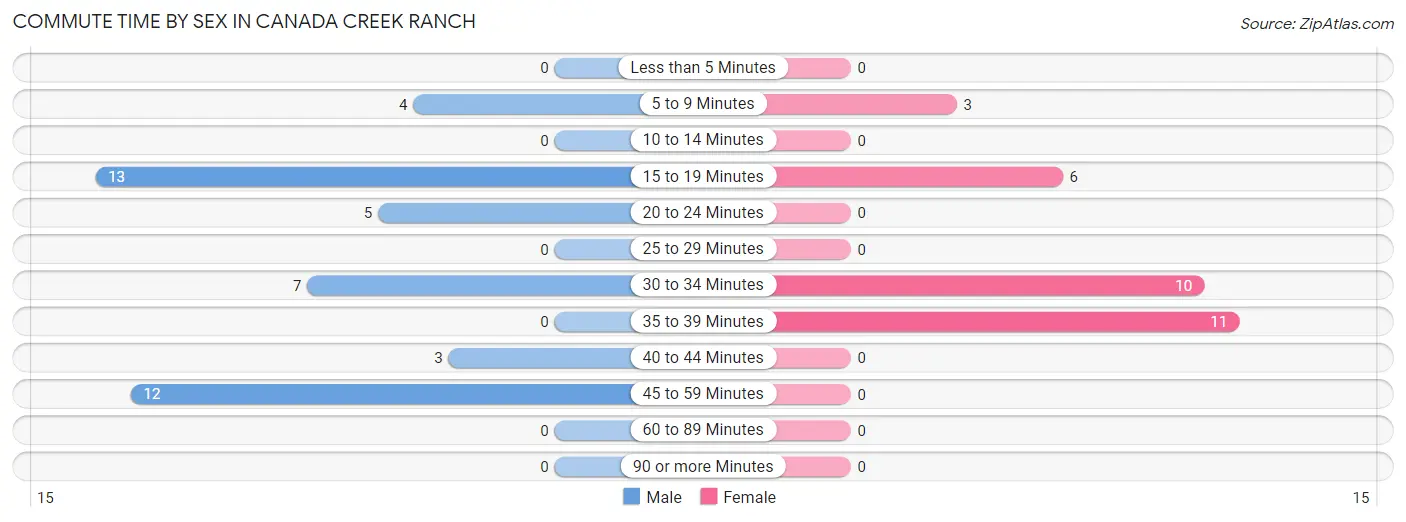
| Commute Time | Male | Female |
| Less than 5 Minutes | 0 (0.0%) | 0 (0.0%) |
| 5 to 9 Minutes | 4 (9.1%) | 3 (10.0%) |
| 10 to 14 Minutes | 0 (0.0%) | 0 (0.0%) |
| 15 to 19 Minutes | 13 (29.5%) | 6 (20.0%) |
| 20 to 24 Minutes | 5 (11.4%) | 0 (0.0%) |
| 25 to 29 Minutes | 0 (0.0%) | 0 (0.0%) |
| 30 to 34 Minutes | 7 (15.9%) | 10 (33.3%) |
| 35 to 39 Minutes | 0 (0.0%) | 11 (36.7%) |
| 40 to 44 Minutes | 3 (6.8%) | 0 (0.0%) |
| 45 to 59 Minutes | 12 (27.3%) | 0 (0.0%) |
| 60 to 89 Minutes | 0 (0.0%) | 0 (0.0%) |
| 90 or more Minutes | 0 (0.0%) | 0 (0.0%) |
Time of Departure to Work by Sex in Canada Creek Ranch
The most frequent times of departure to work in Canada Creek Ranch are 7:30 AM to 7:59 AM (20, 45.5%) for males and 5:00 AM to 5:29 AM (11, 36.7%) for females.
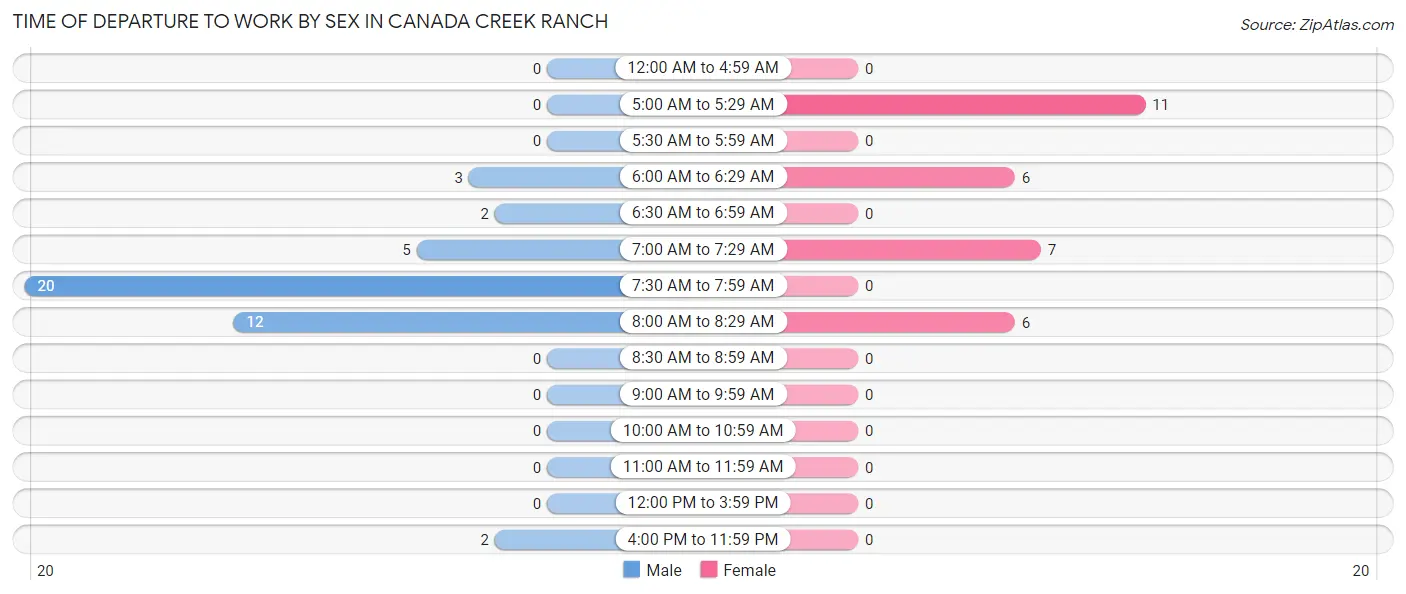
| Time of Departure | Male | Female |
| 12:00 AM to 4:59 AM | 0 (0.0%) | 0 (0.0%) |
| 5:00 AM to 5:29 AM | 0 (0.0%) | 11 (36.7%) |
| 5:30 AM to 5:59 AM | 0 (0.0%) | 0 (0.0%) |
| 6:00 AM to 6:29 AM | 3 (6.8%) | 6 (20.0%) |
| 6:30 AM to 6:59 AM | 2 (4.5%) | 0 (0.0%) |
| 7:00 AM to 7:29 AM | 5 (11.4%) | 7 (23.3%) |
| 7:30 AM to 7:59 AM | 20 (45.5%) | 0 (0.0%) |
| 8:00 AM to 8:29 AM | 12 (27.3%) | 6 (20.0%) |
| 8:30 AM to 8:59 AM | 0 (0.0%) | 0 (0.0%) |
| 9:00 AM to 9:59 AM | 0 (0.0%) | 0 (0.0%) |
| 10:00 AM to 10:59 AM | 0 (0.0%) | 0 (0.0%) |
| 11:00 AM to 11:59 AM | 0 (0.0%) | 0 (0.0%) |
| 12:00 PM to 3:59 PM | 0 (0.0%) | 0 (0.0%) |
| 4:00 PM to 11:59 PM | 2 (4.5%) | 0 (0.0%) |
| Total | 44 (100.0%) | 30 (100.0%) |
Housing Occupancy in Canada Creek Ranch
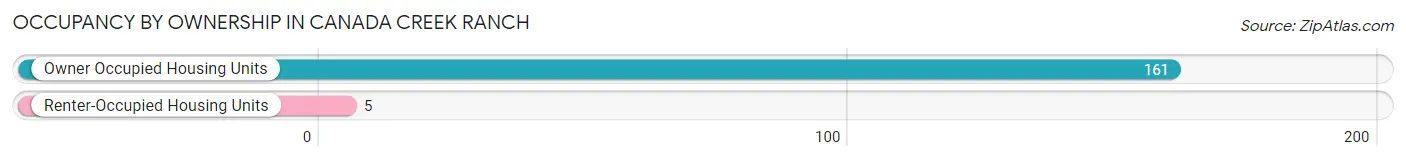
Occupancy by Ownership in Canada Creek Ranch
Of the total 166 dwellings in Canada Creek Ranch, owner-occupied units account for 161 (97.0%), while renter-occupied units make up 5 (3.0%).
| Occupancy | # Housing Units | % Housing Units |
| Owner Occupied Housing Units | 161 | 97.0% |
| Renter-Occupied Housing Units | 5 | 3.0% |
| Total Occupied Housing Units | 166 | 100.0% |
Occupancy by Household Size in Canada Creek Ranch
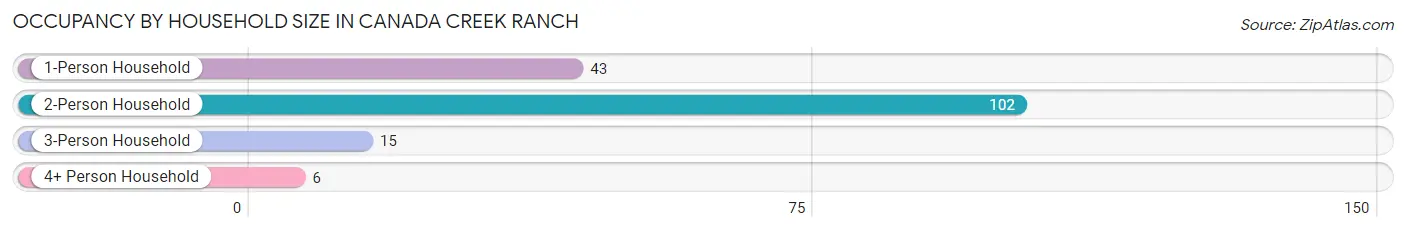
| Household Size | # Housing Units | % Housing Units |
| 1-Person Household | 43 | 25.9% |
| 2-Person Household | 102 | 61.5% |
| 3-Person Household | 15 | 9.0% |
| 4+ Person Household | 6 | 3.6% |
| Total Housing Units | 166 | 100.0% |
Occupancy by Ownership by Household Size in Canada Creek Ranch
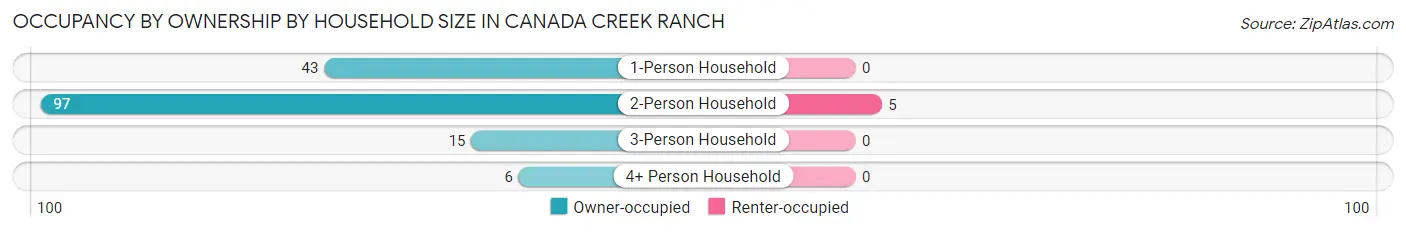
| Household Size | Owner-occupied | Renter-occupied |
| 1-Person Household | 43 (100.0%) | 0 (0.0%) |
| 2-Person Household | 97 (95.1%) | 5 (4.9%) |
| 3-Person Household | 15 (100.0%) | 0 (0.0%) |
| 4+ Person Household | 6 (100.0%) | 0 (0.0%) |
| Total Housing Units | 161 (97.0%) | 5 (3.0%) |
Occupancy by Educational Attainment in Canada Creek Ranch
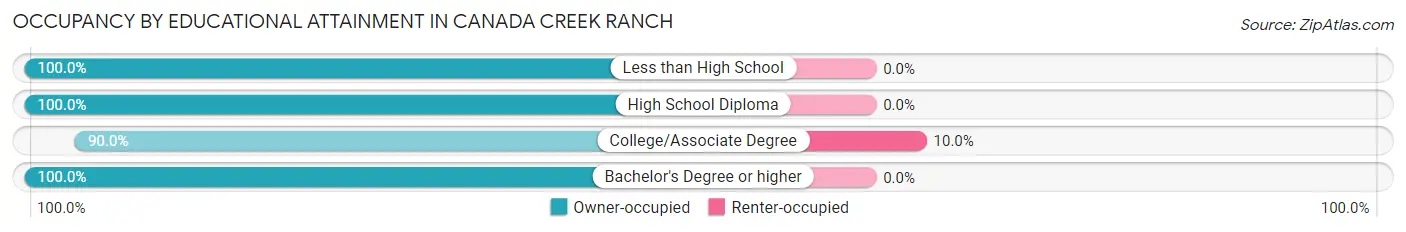
| Household Size | Owner-occupied | Renter-occupied |
| Less than High School | 6 (100.0%) | 0 (0.0%) |
| High School Diploma | 50 (100.0%) | 0 (0.0%) |
| College/Associate Degree | 45 (90.0%) | 5 (10.0%) |
| Bachelor's Degree or higher | 60 (100.0%) | 0 (0.0%) |
Occupancy by Age of Householder in Canada Creek Ranch
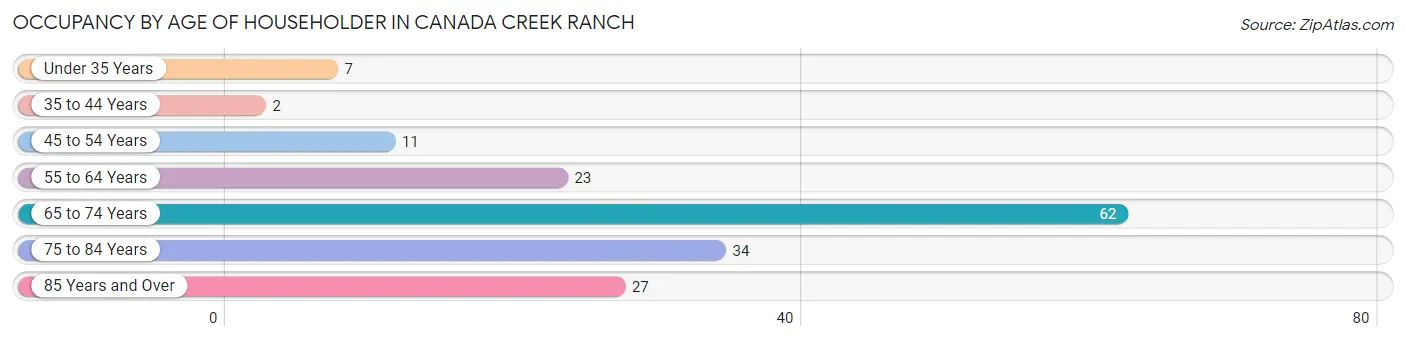
| Age Bracket | # Households | % Households |
| Under 35 Years | 7 | 4.2% |
| 35 to 44 Years | 2 | 1.2% |
| 45 to 54 Years | 11 | 6.6% |
| 55 to 64 Years | 23 | 13.9% |
| 65 to 74 Years | 62 | 37.3% |
| 75 to 84 Years | 34 | 20.5% |
| 85 Years and Over | 27 | 16.3% |
| Total | 166 | 100.0% |
Housing Finances in Canada Creek Ranch
Median Income by Occupancy in Canada Creek Ranch
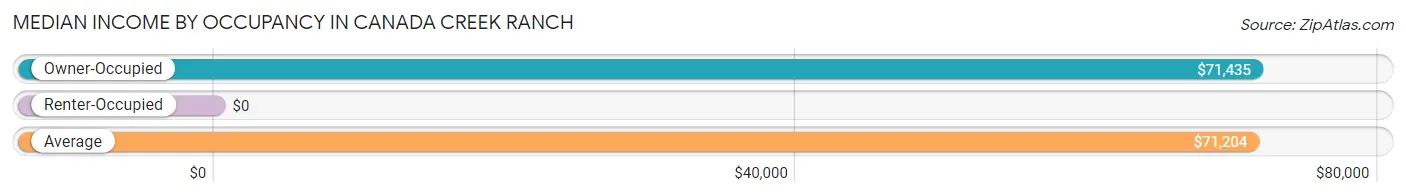
| Occupancy Type | # Households | Median Income |
| Owner-Occupied | 161 (97.0%) | $71,435 |
| Renter-Occupied | 5 (3.0%) | $0 |
| Average | 166 (100.0%) | $71,204 |
Occupancy by Householder Income Bracket in Canada Creek Ranch
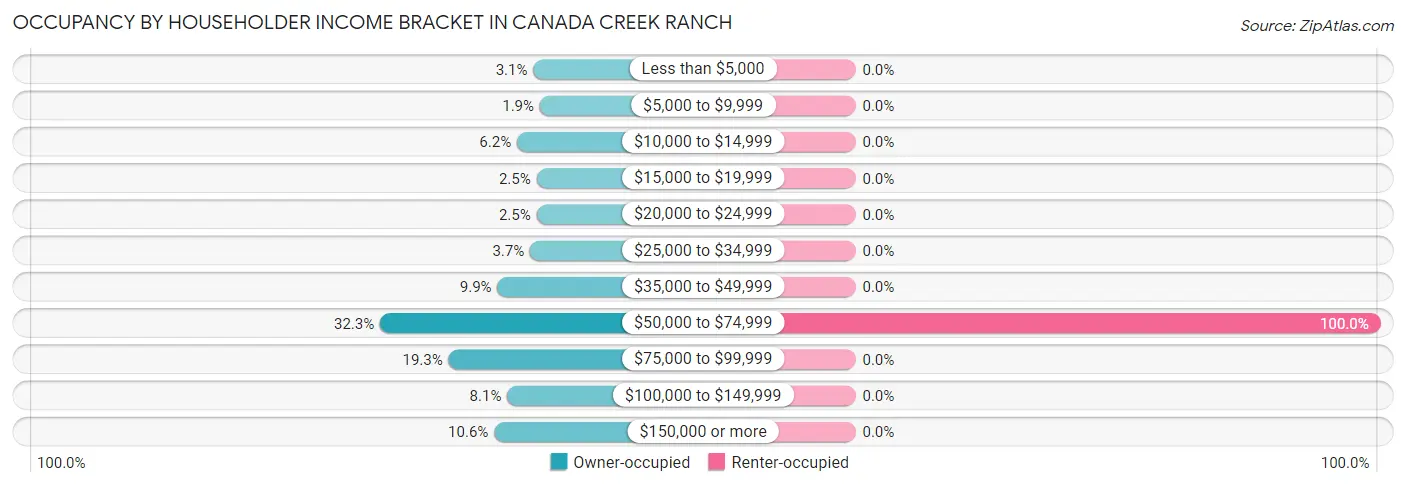
| Income Bracket | Owner-occupied | Renter-occupied |
| Less than $5,000 | 5 (3.1%) | 0 (0.0%) |
| $5,000 to $9,999 | 3 (1.9%) | 0 (0.0%) |
| $10,000 to $14,999 | 10 (6.2%) | 0 (0.0%) |
| $15,000 to $19,999 | 4 (2.5%) | 0 (0.0%) |
| $20,000 to $24,999 | 4 (2.5%) | 0 (0.0%) |
| $25,000 to $34,999 | 6 (3.7%) | 0 (0.0%) |
| $35,000 to $49,999 | 16 (9.9%) | 0 (0.0%) |
| $50,000 to $74,999 | 52 (32.3%) | 5 (100.0%) |
| $75,000 to $99,999 | 31 (19.3%) | 0 (0.0%) |
| $100,000 to $149,999 | 13 (8.1%) | 0 (0.0%) |
| $150,000 or more | 17 (10.6%) | 0 (0.0%) |
| Total | 161 (100.0%) | 5 (100.0%) |
Monthly Housing Cost Tiers in Canada Creek Ranch
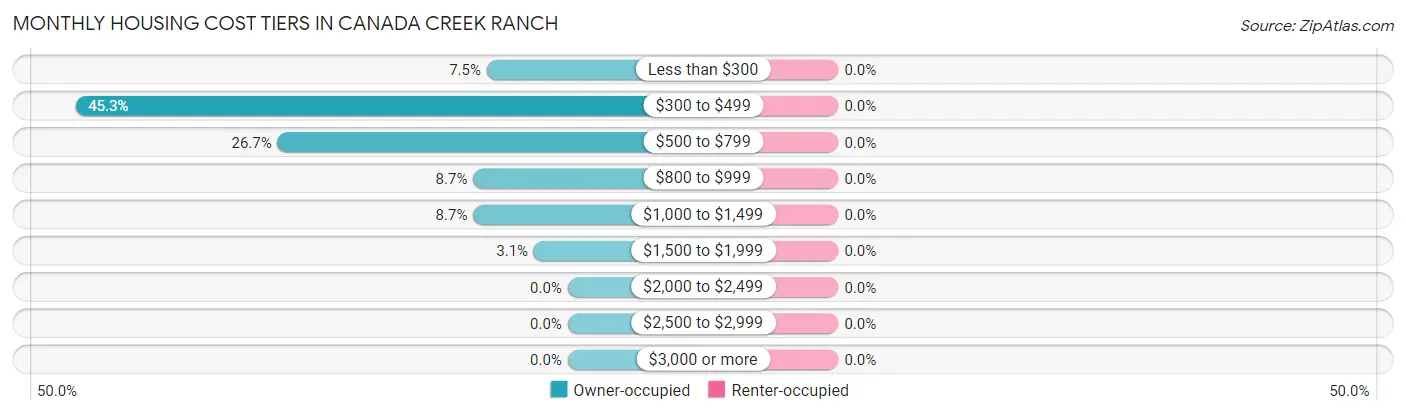
| Monthly Cost | Owner-occupied | Renter-occupied |
| Less than $300 | 12 (7.4%) | 0 (0.0%) |
| $300 to $499 | 73 (45.3%) | 0 (0.0%) |
| $500 to $799 | 43 (26.7%) | 0 (0.0%) |
| $800 to $999 | 14 (8.7%) | 0 (0.0%) |
| $1,000 to $1,499 | 14 (8.7%) | 0 (0.0%) |
| $1,500 to $1,999 | 5 (3.1%) | 0 (0.0%) |
| $2,000 to $2,499 | 0 (0.0%) | 0 (0.0%) |
| $2,500 to $2,999 | 0 (0.0%) | 0 (0.0%) |
| $3,000 or more | 0 (0.0%) | 0 (0.0%) |
| Total | 161 (100.0%) | 5 (100.0%) |
Physical Housing Characteristics in Canada Creek Ranch
Housing Structures in Canada Creek Ranch
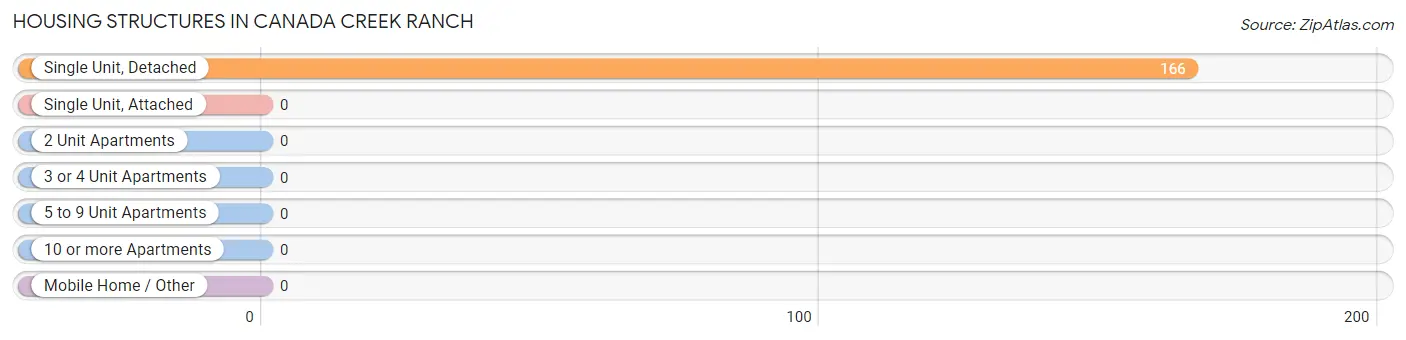
| Structure Type | # Housing Units | % Housing Units |
| Single Unit, Detached | 166 | 100.0% |
| Single Unit, Attached | 0 | 0.0% |
| 2 Unit Apartments | 0 | 0.0% |
| 3 or 4 Unit Apartments | 0 | 0.0% |
| 5 to 9 Unit Apartments | 0 | 0.0% |
| 10 or more Apartments | 0 | 0.0% |
| Mobile Home / Other | 0 | 0.0% |
| Total | 166 | 100.0% |
Housing Structures by Occupancy in Canada Creek Ranch
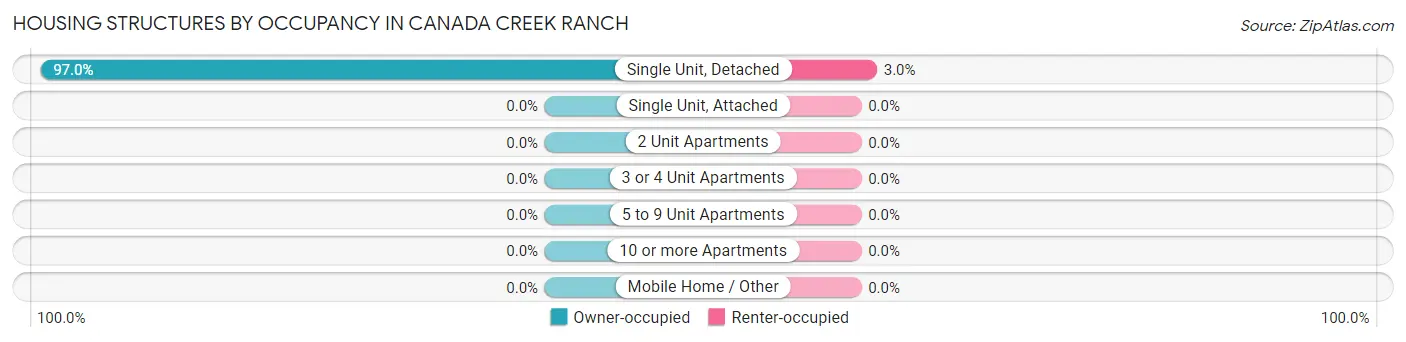
| Structure Type | Owner-occupied | Renter-occupied |
| Single Unit, Detached | 161 (97.0%) | 5 (3.0%) |
| Single Unit, Attached | 0 (0.0%) | 0 (0.0%) |
| 2 Unit Apartments | 0 (0.0%) | 0 (0.0%) |
| 3 or 4 Unit Apartments | 0 (0.0%) | 0 (0.0%) |
| 5 to 9 Unit Apartments | 0 (0.0%) | 0 (0.0%) |
| 10 or more Apartments | 0 (0.0%) | 0 (0.0%) |
| Mobile Home / Other | 0 (0.0%) | 0 (0.0%) |
| Total | 161 (97.0%) | 5 (3.0%) |
Housing Structures by Number of Rooms in Canada Creek Ranch
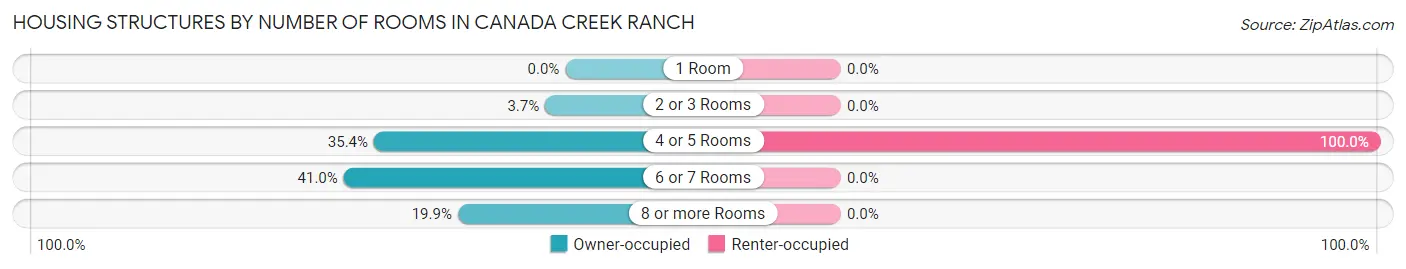
| Number of Rooms | Owner-occupied | Renter-occupied |
| 1 Room | 0 (0.0%) | 0 (0.0%) |
| 2 or 3 Rooms | 6 (3.7%) | 0 (0.0%) |
| 4 or 5 Rooms | 57 (35.4%) | 5 (100.0%) |
| 6 or 7 Rooms | 66 (41.0%) | 0 (0.0%) |
| 8 or more Rooms | 32 (19.9%) | 0 (0.0%) |
| Total | 161 (100.0%) | 5 (100.0%) |
Housing Structure by Heating Type in Canada Creek Ranch
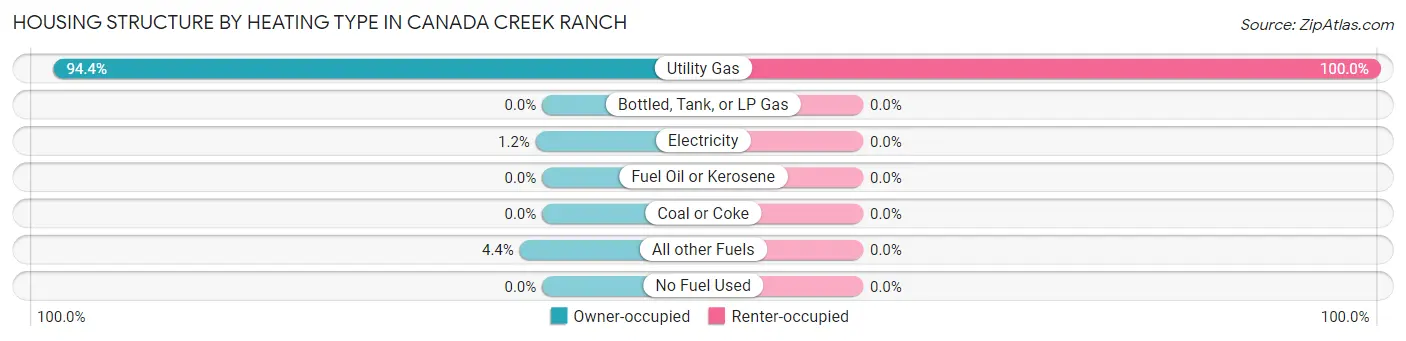
| Heating Type | Owner-occupied | Renter-occupied |
| Utility Gas | 152 (94.4%) | 5 (100.0%) |
| Bottled, Tank, or LP Gas | 0 (0.0%) | 0 (0.0%) |
| Electricity | 2 (1.2%) | 0 (0.0%) |
| Fuel Oil or Kerosene | 0 (0.0%) | 0 (0.0%) |
| Coal or Coke | 0 (0.0%) | 0 (0.0%) |
| All other Fuels | 7 (4.3%) | 0 (0.0%) |
| No Fuel Used | 0 (0.0%) | 0 (0.0%) |
| Total | 161 (100.0%) | 5 (100.0%) |
Household Vehicle Usage in Canada Creek Ranch
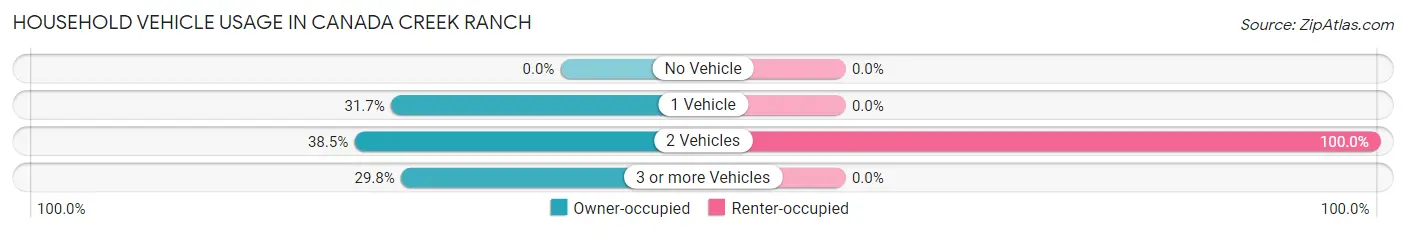
| Vehicles per Household | Owner-occupied | Renter-occupied |
| No Vehicle | 0 (0.0%) | 0 (0.0%) |
| 1 Vehicle | 51 (31.7%) | 0 (0.0%) |
| 2 Vehicles | 62 (38.5%) | 5 (100.0%) |
| 3 or more Vehicles | 48 (29.8%) | 0 (0.0%) |
| Total | 161 (100.0%) | 5 (100.0%) |
Real Estate & Mortgages in Canada Creek Ranch
Real Estate and Mortgage Overview in Canada Creek Ranch
| Characteristic | Without Mortgage | With Mortgage |
| Housing Units | 108 | 53 |
| Median Property Value | $168,800 | $142,000 |
| Median Household Income | $64,583 | $13 |
| Monthly Housing Costs | $384 | $0 |
| Real Estate Taxes | $1,591 | $3 |
Property Value by Mortgage Status in Canada Creek Ranch
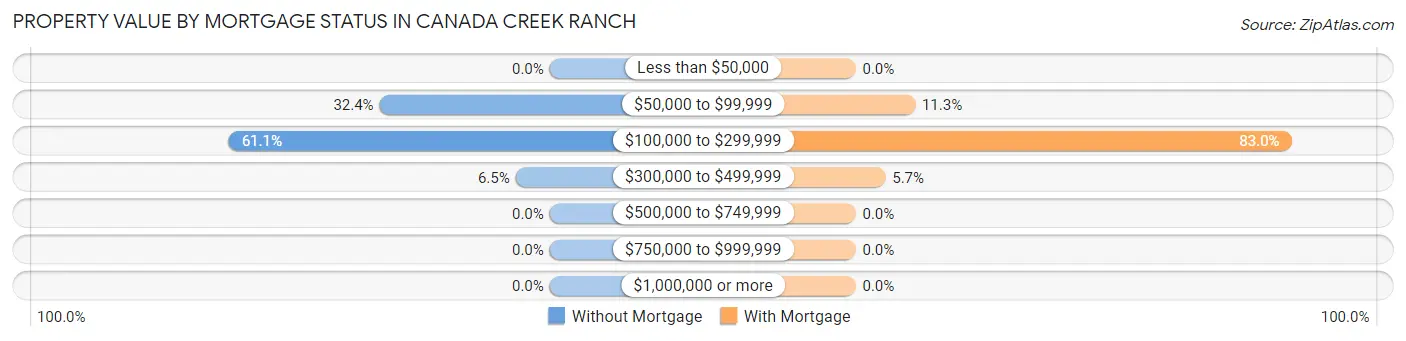
| Property Value | Without Mortgage | With Mortgage |
| Less than $50,000 | 0 (0.0%) | 0 (0.0%) |
| $50,000 to $99,999 | 35 (32.4%) | 6 (11.3%) |
| $100,000 to $299,999 | 66 (61.1%) | 44 (83.0%) |
| $300,000 to $499,999 | 7 (6.5%) | 3 (5.7%) |
| $500,000 to $749,999 | 0 (0.0%) | 0 (0.0%) |
| $750,000 to $999,999 | 0 (0.0%) | 0 (0.0%) |
| $1,000,000 or more | 0 (0.0%) | 0 (0.0%) |
| Total | 108 (100.0%) | 53 (100.0%) |
Household Income by Mortgage Status in Canada Creek Ranch
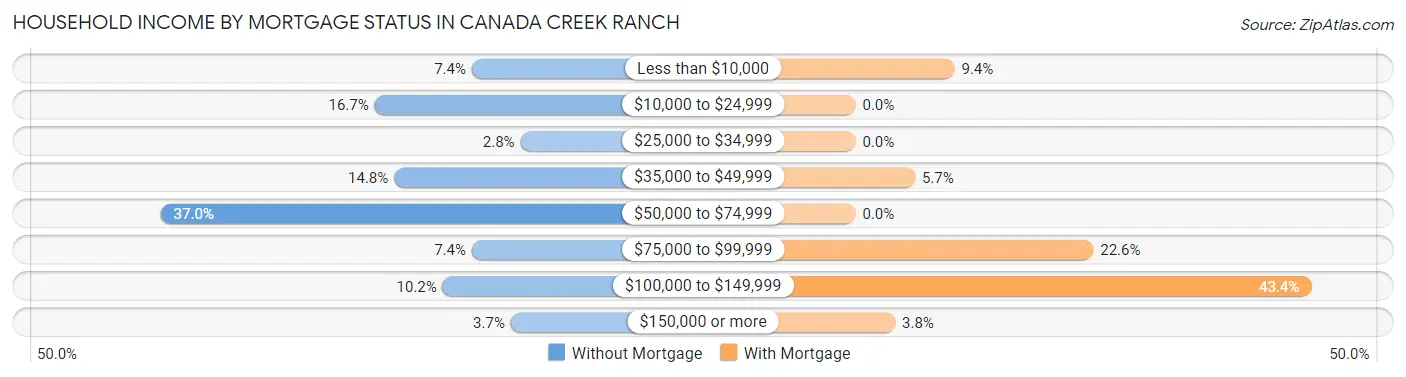
| Household Income | Without Mortgage | With Mortgage |
| Less than $10,000 | 8 (7.4%) | 5 (9.4%) |
| $10,000 to $24,999 | 18 (16.7%) | 0 (0.0%) |
| $25,000 to $34,999 | 3 (2.8%) | 0 (0.0%) |
| $35,000 to $49,999 | 16 (14.8%) | 3 (5.7%) |
| $50,000 to $74,999 | 40 (37.0%) | 0 (0.0%) |
| $75,000 to $99,999 | 8 (7.4%) | 12 (22.6%) |
| $100,000 to $149,999 | 11 (10.2%) | 23 (43.4%) |
| $150,000 or more | 4 (3.7%) | 2 (3.8%) |
| Total | 108 (100.0%) | 53 (100.0%) |
Property Value to Household Income Ratio in Canada Creek Ranch
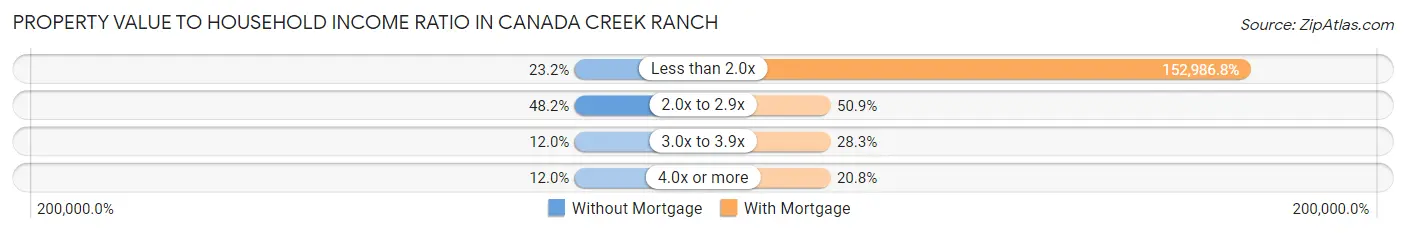
| Value-to-Income Ratio | Without Mortgage | With Mortgage |
| Less than 2.0x | 25 (23.2%) | 81,083 (152,986.8%) |
| 2.0x to 2.9x | 52 (48.1%) | 27 (50.9%) |
| 3.0x to 3.9x | 13 (12.0%) | 15 (28.3%) |
| 4.0x or more | 13 (12.0%) | 11 (20.7%) |
| Total | 108 (100.0%) | 53 (100.0%) |
Real Estate Taxes by Mortgage Status in Canada Creek Ranch
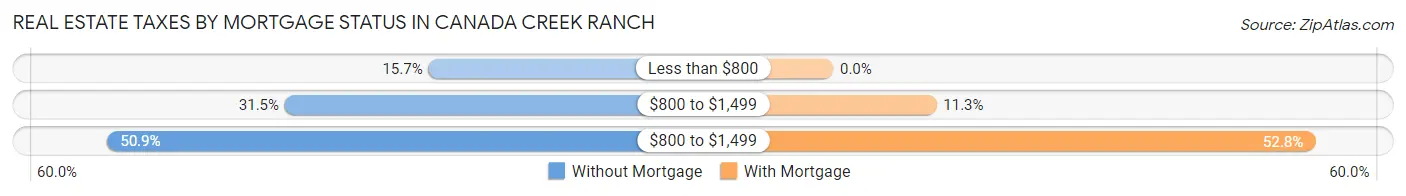
| Property Taxes | Without Mortgage | With Mortgage |
| Less than $800 | 17 (15.7%) | 0 (0.0%) |
| $800 to $1,499 | 34 (31.5%) | 6 (11.3%) |
| $800 to $1,499 | 55 (50.9%) | 28 (52.8%) |
| Total | 108 (100.0%) | 53 (100.0%) |
Health & Disability in Canada Creek Ranch
Health Insurance Coverage by Age in Canada Creek Ranch
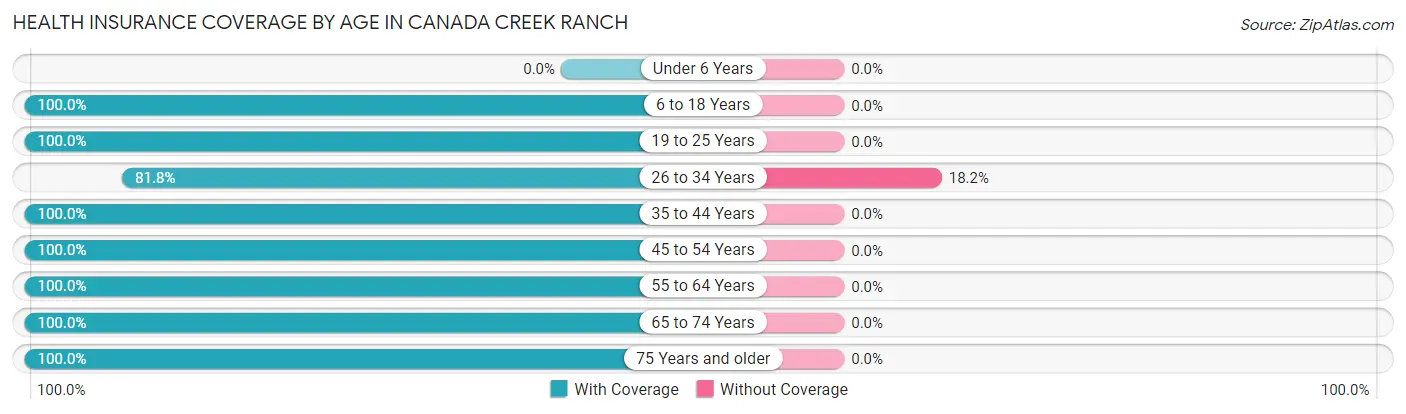
| Age Bracket | With Coverage | Without Coverage |
| Under 6 Years | 0 (0.0%) | 0 (0.0%) |
| 6 to 18 Years | 15 (100.0%) | 0 (0.0%) |
| 19 to 25 Years | 6 (100.0%) | 0 (0.0%) |
| 26 to 34 Years | 9 (81.8%) | 2 (18.2%) |
| 35 to 44 Years | 8 (100.0%) | 0 (0.0%) |
| 45 to 54 Years | 20 (100.0%) | 0 (0.0%) |
| 55 to 64 Years | 53 (100.0%) | 0 (0.0%) |
| 65 to 74 Years | 99 (100.0%) | 0 (0.0%) |
| 75 Years and older | 102 (100.0%) | 0 (0.0%) |
| Total | 312 (99.4%) | 2 (0.6%) |
Health Insurance Coverage by Citizenship Status in Canada Creek Ranch

| Citizenship Status | With Coverage | Without Coverage |
| Native Born | 0 (0.0%) | 0 (0.0%) |
| Foreign Born, Citizen | 15 (100.0%) | 0 (0.0%) |
| Foreign Born, not a Citizen | 6 (100.0%) | 0 (0.0%) |
Health Insurance Coverage by Household Income in Canada Creek Ranch
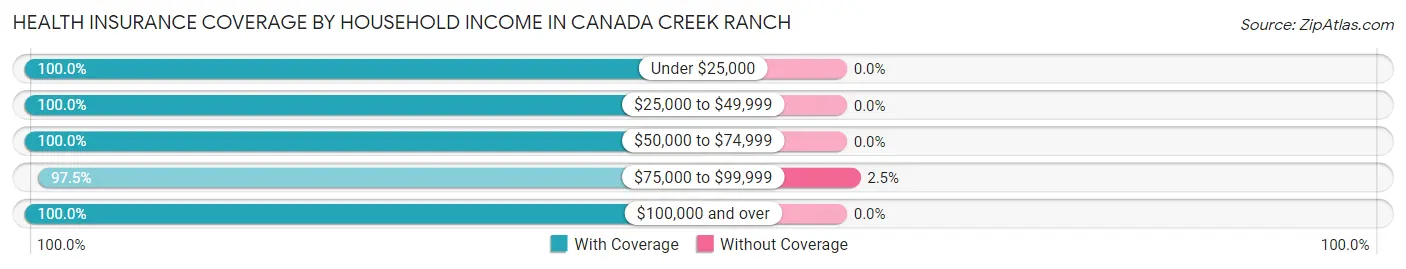
| Household Income | With Coverage | Without Coverage |
| Under $25,000 | 31 (100.0%) | 0 (0.0%) |
| $25,000 to $49,999 | 35 (100.0%) | 0 (0.0%) |
| $50,000 to $74,999 | 104 (100.0%) | 0 (0.0%) |
| $75,000 to $99,999 | 77 (97.5%) | 2 (2.5%) |
| $100,000 and over | 65 (100.0%) | 0 (0.0%) |
Public vs Private Health Insurance Coverage by Age in Canada Creek Ranch
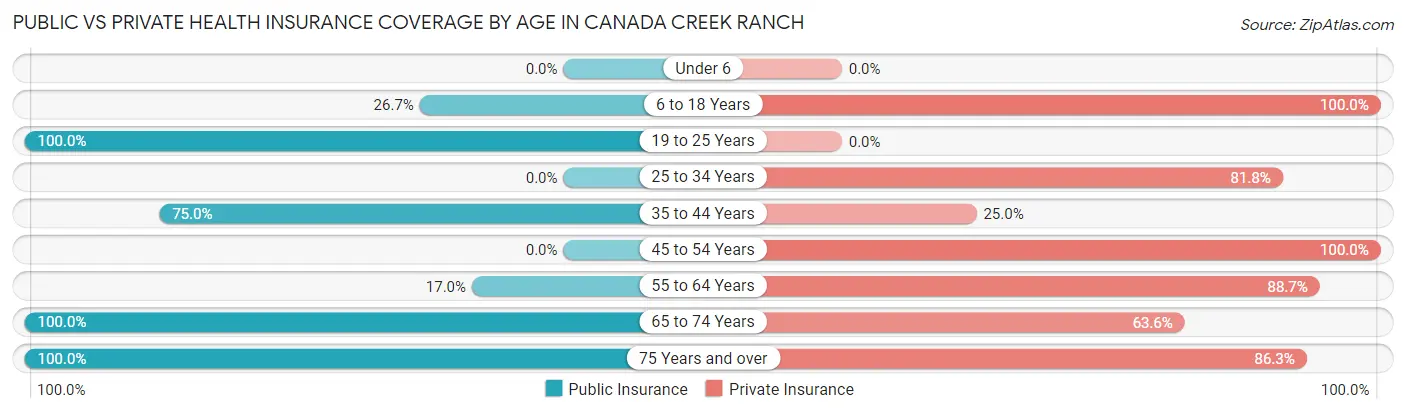
| Age Bracket | Public Insurance | Private Insurance |
| Under 6 | 0 (0.0%) | 0 (0.0%) |
| 6 to 18 Years | 4 (26.7%) | 15 (100.0%) |
| 19 to 25 Years | 6 (100.0%) | 0 (0.0%) |
| 25 to 34 Years | 0 (0.0%) | 9 (81.8%) |
| 35 to 44 Years | 6 (75.0%) | 2 (25.0%) |
| 45 to 54 Years | 0 (0.0%) | 20 (100.0%) |
| 55 to 64 Years | 9 (17.0%) | 47 (88.7%) |
| 65 to 74 Years | 99 (100.0%) | 63 (63.6%) |
| 75 Years and over | 102 (100.0%) | 88 (86.3%) |
| Total | 226 (72.0%) | 244 (77.7%) |
Disability Status by Sex by Age in Canada Creek Ranch
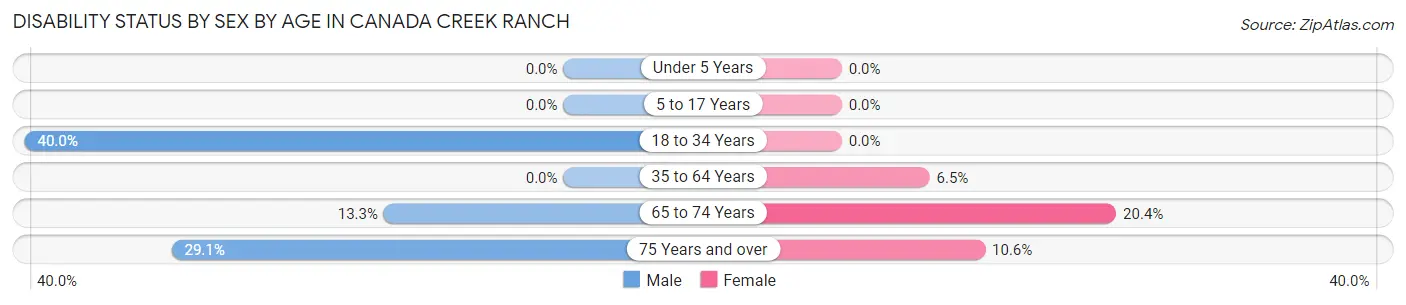
| Age Bracket | Male | Female |
| Under 5 Years | 0 (0.0%) | 0 (0.0%) |
| 5 to 17 Years | 0 (0.0%) | 0 (0.0%) |
| 18 to 34 Years | 6 (40.0%) | 0 (0.0%) |
| 35 to 64 Years | 0 (0.0%) | 3 (6.5%) |
| 65 to 74 Years | 6 (13.3%) | 11 (20.4%) |
| 75 Years and over | 16 (29.1%) | 5 (10.6%) |
Disability Class by Sex by Age in Canada Creek Ranch
Disability Class: Hearing Difficulty
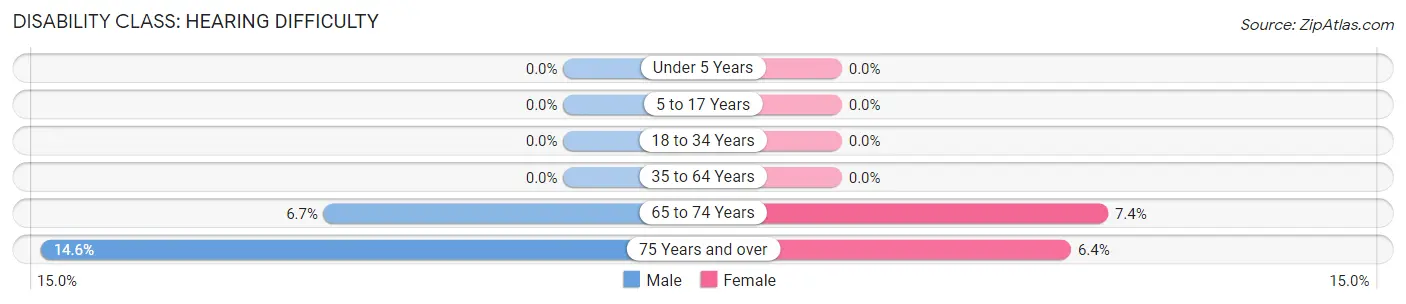
| Age Bracket | Male | Female |
| Under 5 Years | 0 (0.0%) | 0 (0.0%) |
| 5 to 17 Years | 0 (0.0%) | 0 (0.0%) |
| 18 to 34 Years | 0 (0.0%) | 0 (0.0%) |
| 35 to 64 Years | 0 (0.0%) | 0 (0.0%) |
| 65 to 74 Years | 3 (6.7%) | 4 (7.4%) |
| 75 Years and over | 8 (14.5%) | 3 (6.4%) |
Disability Class: Vision Difficulty
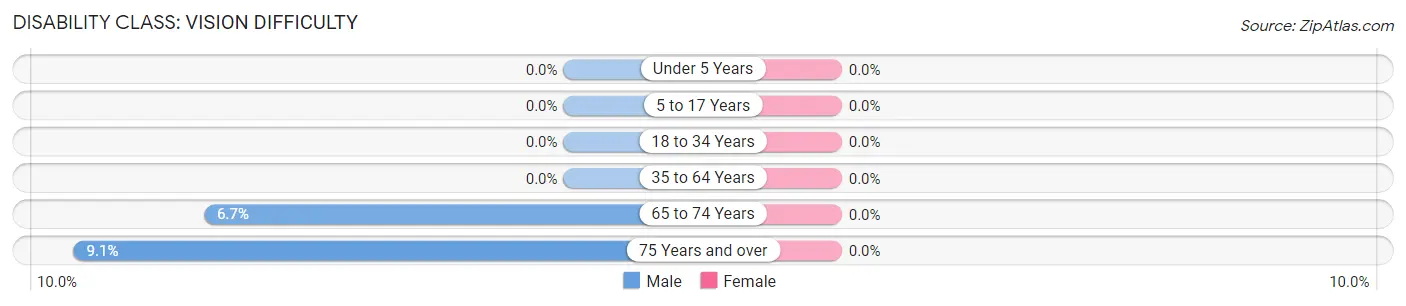
| Age Bracket | Male | Female |
| Under 5 Years | 0 (0.0%) | 0 (0.0%) |
| 5 to 17 Years | 0 (0.0%) | 0 (0.0%) |
| 18 to 34 Years | 0 (0.0%) | 0 (0.0%) |
| 35 to 64 Years | 0 (0.0%) | 0 (0.0%) |
| 65 to 74 Years | 3 (6.7%) | 0 (0.0%) |
| 75 Years and over | 5 (9.1%) | 0 (0.0%) |
Disability Class: Cognitive Difficulty
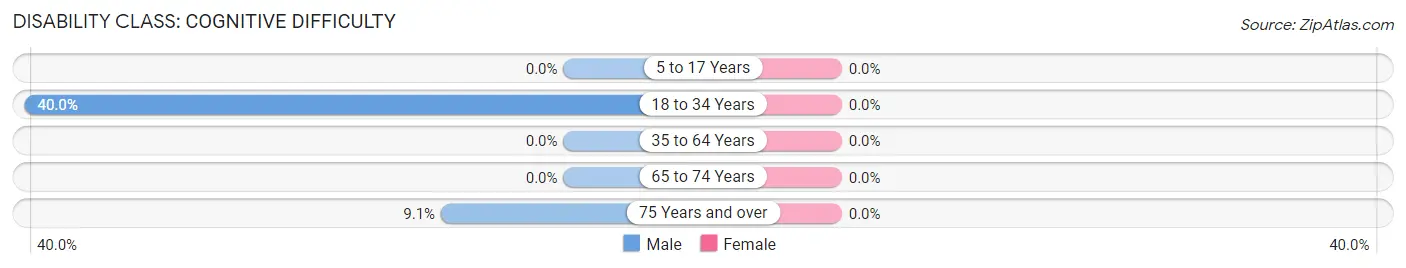
| Age Bracket | Male | Female |
| 5 to 17 Years | 0 (0.0%) | 0 (0.0%) |
| 18 to 34 Years | 6 (40.0%) | 0 (0.0%) |
| 35 to 64 Years | 0 (0.0%) | 0 (0.0%) |
| 65 to 74 Years | 0 (0.0%) | 0 (0.0%) |
| 75 Years and over | 5 (9.1%) | 0 (0.0%) |
Disability Class: Ambulatory Difficulty
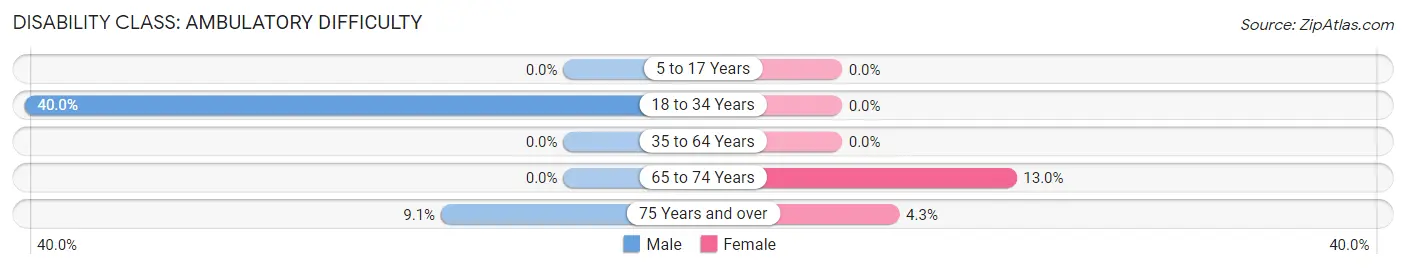
| Age Bracket | Male | Female |
| 5 to 17 Years | 0 (0.0%) | 0 (0.0%) |
| 18 to 34 Years | 6 (40.0%) | 0 (0.0%) |
| 35 to 64 Years | 0 (0.0%) | 0 (0.0%) |
| 65 to 74 Years | 0 (0.0%) | 7 (13.0%) |
| 75 Years and over | 5 (9.1%) | 2 (4.3%) |
Disability Class: Self-Care Difficulty
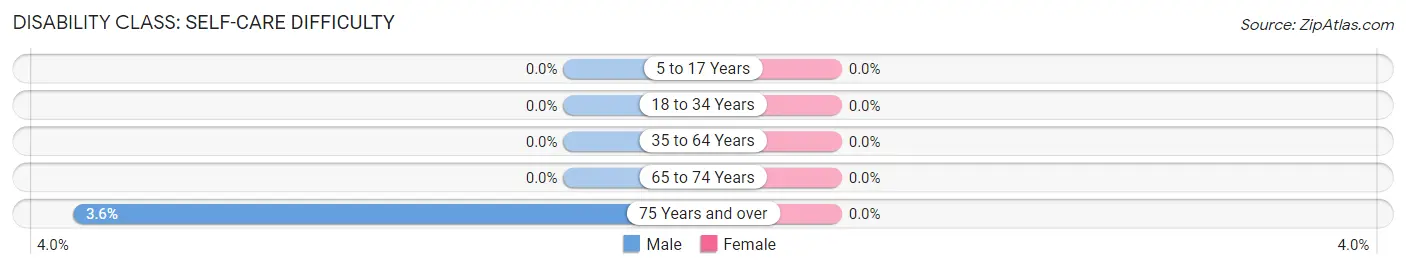
| Age Bracket | Male | Female |
| 5 to 17 Years | 0 (0.0%) | 0 (0.0%) |
| 18 to 34 Years | 0 (0.0%) | 0 (0.0%) |
| 35 to 64 Years | 0 (0.0%) | 0 (0.0%) |
| 65 to 74 Years | 0 (0.0%) | 0 (0.0%) |
| 75 Years and over | 2 (3.6%) | 0 (0.0%) |
Technology Access in Canada Creek Ranch
Computing Device Access in Canada Creek Ranch
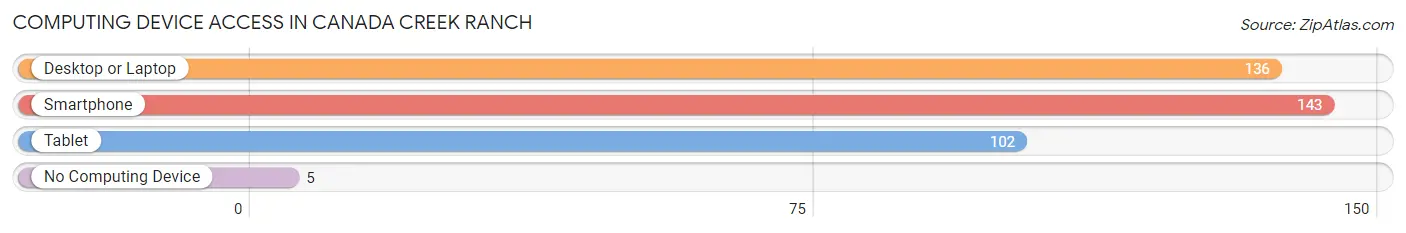
| Device Type | # Households | % Households |
| Desktop or Laptop | 136 | 81.9% |
| Smartphone | 143 | 86.1% |
| Tablet | 102 | 61.5% |
| No Computing Device | 5 | 3.0% |
| Total | 166 | 100.0% |
Internet Access in Canada Creek Ranch
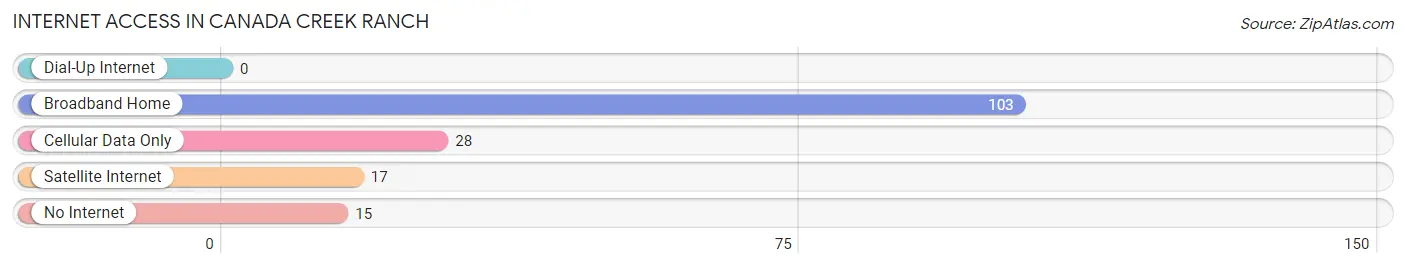
| Internet Type | # Households | % Households |
| Dial-Up Internet | 0 | 0.0% |
| Broadband Home | 103 | 62.1% |
| Cellular Data Only | 28 | 16.9% |
| Satellite Internet | 17 | 10.2% |
| No Internet | 15 | 9.0% |
| Total | 166 | 100.0% |
Canada Creek Ranch Summary
History
Canada Creek Ranch is a small unincorporated community located in Montmorency County, Michigan. It is situated in the northeast corner of the state, near the border of Michigan and Ontario, Canada. The community was first settled in the late 1800s by a group of French-Canadian immigrants who were looking for a place to call home. The area was originally known as “Canada Creek” due to its proximity to the Canadian border.
The first settlers of Canada Creek Ranch were mostly farmers and loggers. They cleared the land and built small cabins and barns. The area was also home to a few small businesses, such as a general store and a blacksmith shop. As the population grew, more businesses opened up, including a post office, a school, and a church.
In the early 1900s, the area began to attract more people, including hunters and fishermen. The area was known for its abundance of wildlife, including deer, bear, and other game. The area also had a thriving logging industry, which provided jobs for many of the residents.
In the 1950s, the area began to change as more people moved in and the logging industry began to decline. The area was no longer as attractive to hunters and fishermen, and the population began to decline. In the 1970s, the area was re-discovered by a group of entrepreneurs who saw the potential of the area and began to develop it into a recreational area.
Today, Canada Creek Ranch is a popular destination for outdoor enthusiasts. The area is home to a variety of activities, including camping, fishing, hunting, and hiking. The area is also home to a variety of wildlife, including deer, bear, and other game.
Geography
Canada Creek Ranch is located in the northeast corner of Michigan, near the border of Michigan and Ontario, Canada. The area is situated in the northern part of Montmorency County, and is bordered by the towns of Hillman, Atlanta, and Lewiston. The area is mostly rural, with a few small towns and villages scattered throughout.
The area is mostly flat, with rolling hills and valleys. The terrain is mostly forested, with a few open fields and meadows. The area is home to a variety of wildlife, including deer, bear, and other game.
Economy
The economy of Canada Creek Ranch is largely based on tourism and recreation. The area is home to a variety of outdoor activities, including camping, fishing, hunting, and hiking. The area is also home to a variety of wildlife, including deer, bear, and other game.
The area is also home to a few small businesses, such as a general store and a blacksmith shop. The area is also home to a few small farms, which produce a variety of crops, such as corn, soybeans, and hay.
Demographics
As of the 2010 census, the population of Canada Creek Ranch was 1,072. The population is mostly white (97.2%), with a small percentage of African Americans (1.2%) and Native Americans (0.6%). The median age of the population is 44.7 years, and the median household income is $41,944. The area is mostly rural, with a few small towns and villages scattered throughout.
Common Questions
What is Per Capita Income in Canada Creek Ranch?
Per Capita income in Canada Creek Ranch is $38,010.
What is the Median Family Income in Canada Creek Ranch?
Median Family Income in Canada Creek Ranch is $72,176.
What is the Median Household income in Canada Creek Ranch?
Median Household Income in Canada Creek Ranch is $71,204.
What is Inequality or Gini Index in Canada Creek Ranch?
Inequality or Gini Index in Canada Creek Ranch is 0.34.
What is the Total Population of Canada Creek Ranch?
Total Population of Canada Creek Ranch is 314.
What is the Total Male Population of Canada Creek Ranch?
Total Male Population of Canada Creek Ranch is 158.
What is the Total Female Population of Canada Creek Ranch?
Total Female Population of Canada Creek Ranch is 156.
What is the Ratio of Males per 100 Females in Canada Creek Ranch?
There are 101.28 Males per 100 Females in Canada Creek Ranch.
What is the Ratio of Females per 100 Males in Canada Creek Ranch?
There are 98.73 Females per 100 Males in Canada Creek Ranch.
What is the Median Population Age in Canada Creek Ranch?
Median Population Age in Canada Creek Ranch is 68.9 Years.
What is the Average Family Size in Canada Creek Ranch
Average Family Size in Canada Creek Ranch is 2.2 People.
What is the Average Household Size in Canada Creek Ranch
Average Household Size in Canada Creek Ranch is 1.9 People.
How Large is the Labor Force in Canada Creek Ranch?
There are 87 People in the Labor Forcein in Canada Creek Ranch.
What is the Percentage of People in the Labor Force in Canada Creek Ranch?
28.1% of People are in the Labor Force in Canada Creek Ranch.
What is the Unemployment Rate in Canada Creek Ranch?
Unemployment Rate in Canada Creek Ranch is 5.7%.