Big Rapids, MI Map & Demographics
Big Rapids Map
Big Rapids Overview
$19,854
PER CAPITA INCOME
$56,827
AVG FAMILY INCOME
$36,058
AVG HOUSEHOLD INCOME
7.3%
WAGE / INCOME GAP [ % ]
92.7¢/ $1
WAGE / INCOME GAP [ $ ]
0.47
INEQUALITY / GINI INDEX
7,915
TOTAL POPULATION
4,166
MALE POPULATION
3,749
FEMALE POPULATION
111.12
MALES / 100 FEMALES
89.99
FEMALES / 100 MALES
22.8
MEDIAN AGE
2.9
AVG FAMILY SIZE
2.2
AVG HOUSEHOLD SIZE
4,341
LABOR FORCE [ PEOPLE ]
62.2%
PERCENT IN LABOR FORCE
7.2%
UNEMPLOYMENT RATE
Big Rapids Zip Codes
Big Rapids Area Codes
Income in Big Rapids
Income Overview in Big Rapids
Per Capita Income in Big Rapids is $19,854, while median incomes of families and households are $56,827 and $36,058 respectively.
| Characteristic | Number | Measure |
| Per Capita Income | 7,915 | $19,854 |
| Median Family Income | 945 | $56,827 |
| Mean Family Income | 945 | $77,896 |
| Median Household Income | 2,628 | $36,058 |
| Mean Household Income | 2,628 | $54,086 |
| Income Deficit | 945 | $0 |
| Wage / Income Gap (%) | 7,915 | 7.26% |
| Wage / Income Gap ($) | 7,915 | 92.74¢ per $1 |
| Gini / Inequality Index | 7,915 | 0.47 |
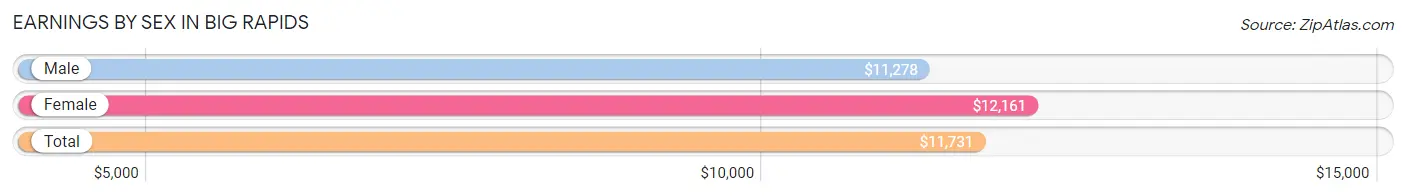
Earnings by Sex in Big Rapids
Average Earnings in Big Rapids are $11,731, $11,278 for men and $12,161 for women, a difference of 7.3%.
| Sex | Number | Average Earnings |
| Male | 3,104 (57.0%) | $11,278 |
| Female | 2,339 (43.0%) | $12,161 |
| Total | 5,443 (100.0%) | $11,731 |
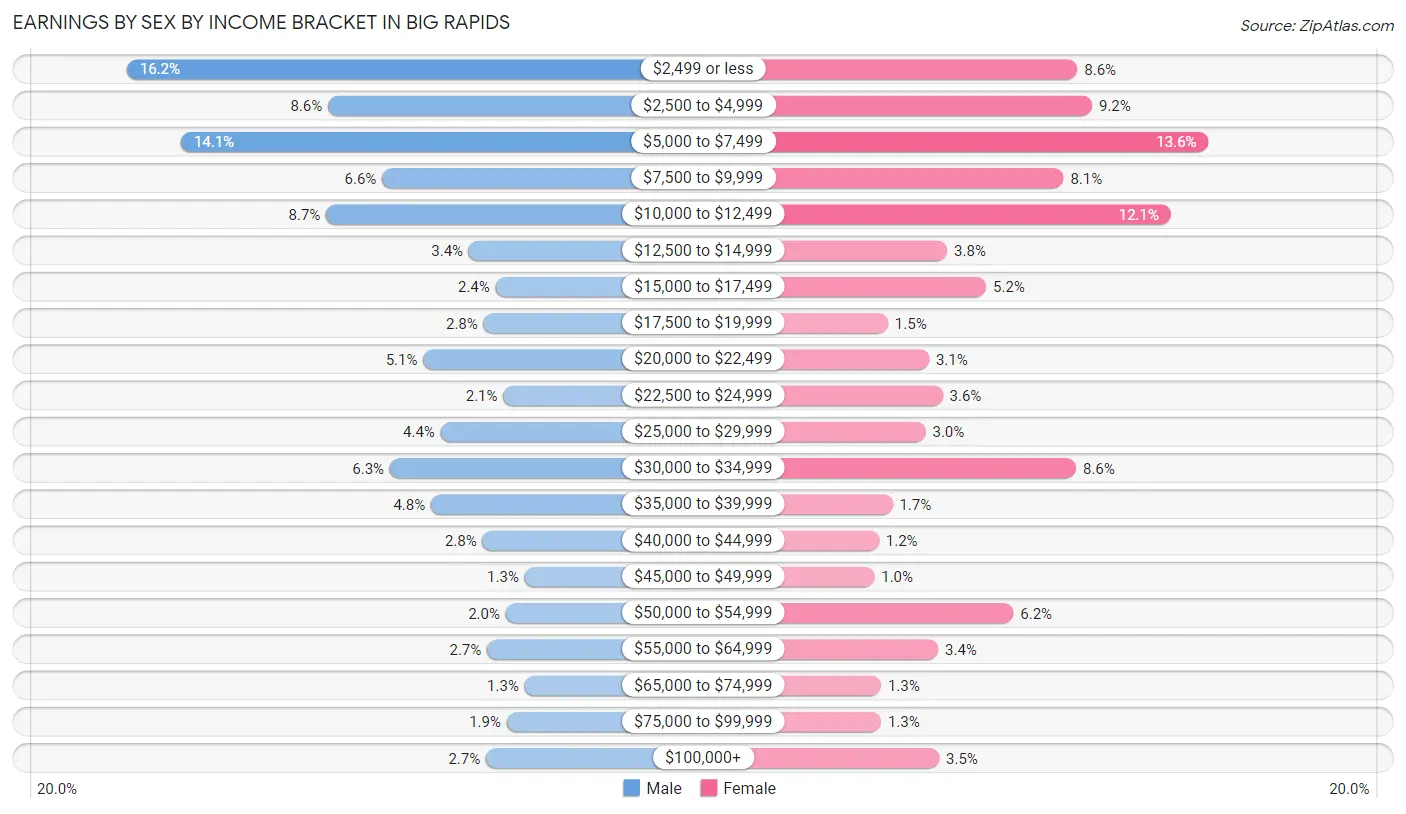
Earnings by Sex by Income Bracket in Big Rapids
The most common earnings brackets in Big Rapids are $2,499 or less for men (502 | 16.2%) and $5,000 to $7,499 for women (317 | 13.6%).
| Income | Male | Female |
| $2,499 or less | 502 (16.2%) | 202 (8.6%) |
| $2,500 to $4,999 | 268 (8.6%) | 215 (9.2%) |
| $5,000 to $7,499 | 439 (14.1%) | 317 (13.6%) |
| $7,500 to $9,999 | 205 (6.6%) | 190 (8.1%) |
| $10,000 to $12,499 | 270 (8.7%) | 284 (12.1%) |
| $12,500 to $14,999 | 104 (3.4%) | 88 (3.8%) |
| $15,000 to $17,499 | 73 (2.4%) | 122 (5.2%) |
| $17,500 to $19,999 | 87 (2.8%) | 36 (1.5%) |
| $20,000 to $22,499 | 157 (5.1%) | 72 (3.1%) |
| $22,500 to $24,999 | 64 (2.1%) | 84 (3.6%) |
| $25,000 to $29,999 | 137 (4.4%) | 69 (2.9%) |
| $30,000 to $34,999 | 196 (6.3%) | 201 (8.6%) |
| $35,000 to $39,999 | 148 (4.8%) | 40 (1.7%) |
| $40,000 to $44,999 | 88 (2.8%) | 28 (1.2%) |
| $45,000 to $49,999 | 39 (1.3%) | 24 (1.0%) |
| $50,000 to $54,999 | 61 (2.0%) | 146 (6.2%) |
| $55,000 to $64,999 | 83 (2.7%) | 80 (3.4%) |
| $65,000 to $74,999 | 39 (1.3%) | 30 (1.3%) |
| $75,000 to $99,999 | 60 (1.9%) | 30 (1.3%) |
| $100,000+ | 84 (2.7%) | 81 (3.5%) |
| Total | 3,104 (100.0%) | 2,339 (100.0%) |
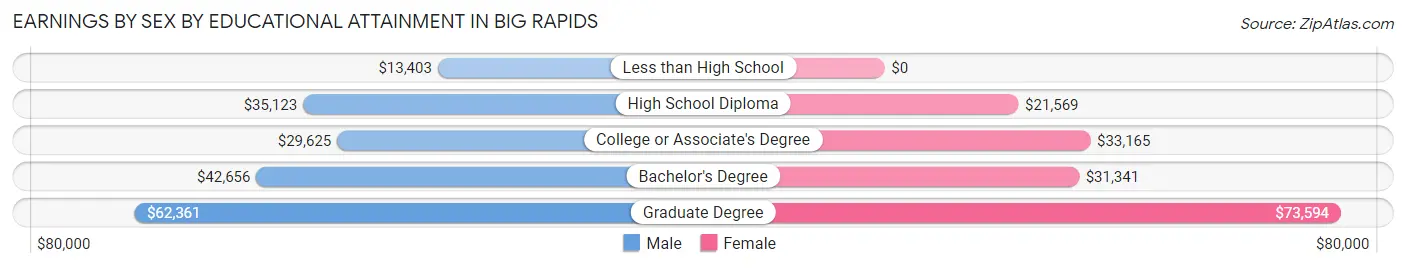
Earnings by Sex by Educational Attainment in Big Rapids
Average earnings in Big Rapids are $33,967 for men and $30,616 for women, a difference of 9.9%. Men with an educational attainment of graduate degree enjoy the highest average annual earnings of $62,361, while those with less than high school education earn the least with $13,403. Women with an educational attainment of graduate degree earn the most with the average annual earnings of $73,594, while those with high school diploma education have the smallest earnings of $21,569.
| Educational Attainment | Male Income | Female Income |
| Less than High School | $13,403 | $0 |
| High School Diploma | $35,123 | $21,569 |
| College or Associate's Degree | $29,625 | $33,165 |
| Bachelor's Degree | $42,656 | $31,341 |
| Graduate Degree | $62,361 | $73,594 |
| Total | $33,967 | $30,616 |
Family Income in Big Rapids
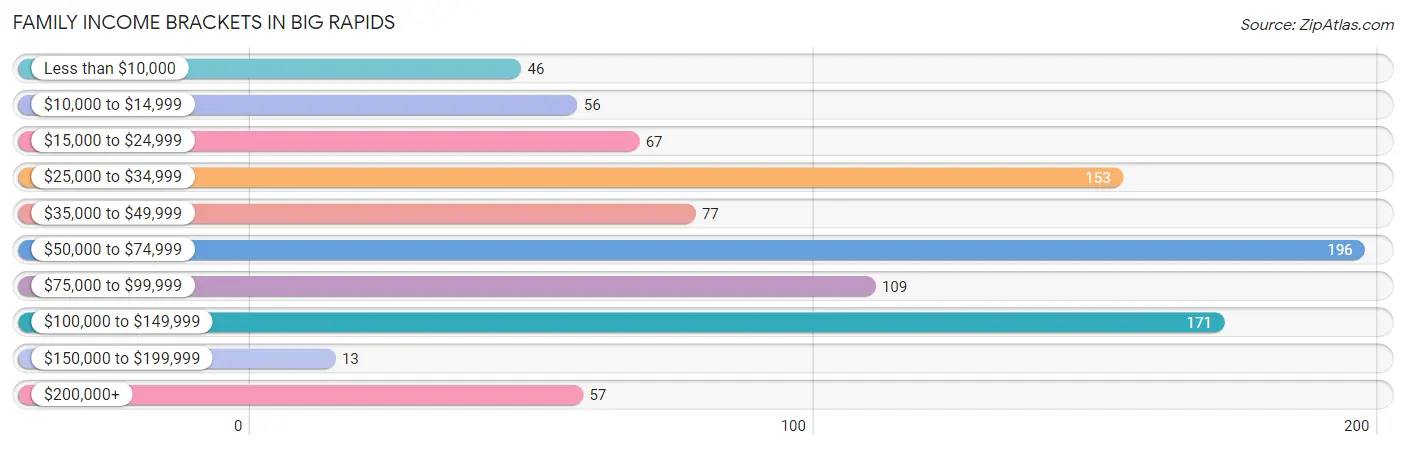
Family Income Brackets in Big Rapids
According to the Big Rapids family income data, there are 196 families falling into the $50,000 to $74,999 income range, which is the most common income bracket and makes up 20.7% of all families. Conversely, the $150,000 to $199,999 income bracket is the least frequent group with only 13 families (1.4%) belonging to this category.
| Income Bracket | # Families | % Families |
| Less than $10,000 | 46 | 4.9% |
| $10,000 to $14,999 | 56 | 5.9% |
| $15,000 to $24,999 | 67 | 7.1% |
| $25,000 to $34,999 | 153 | 16.2% |
| $35,000 to $49,999 | 77 | 8.1% |
| $50,000 to $74,999 | 196 | 20.7% |
| $75,000 to $99,999 | 109 | 11.5% |
| $100,000 to $149,999 | 171 | 18.1% |
| $150,000 to $199,999 | 13 | 1.4% |
| $200,000+ | 57 | 6.0% |
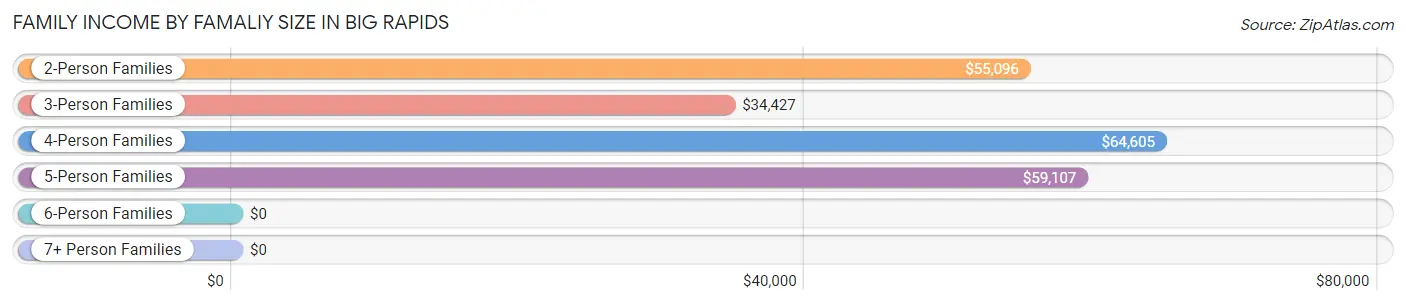
Family Income by Famaliy Size in Big Rapids
4-person families (158 | 16.7%) account for the highest median family income in Big Rapids with $64,605 per family, while 2-person families (415 | 43.9%) have the highest median income of $27,548 per family member.
| Income Bracket | # Families | Median Income |
| 2-Person Families | 415 (43.9%) | $55,096 |
| 3-Person Families | 266 (28.1%) | $34,427 |
| 4-Person Families | 158 (16.7%) | $64,605 |
| 5-Person Families | 86 (9.1%) | $59,107 |
| 6-Person Families | 20 (2.1%) | $0 |
| 7+ Person Families | 0 (0.0%) | $0 |
| Total | 945 (100.0%) | $56,827 |
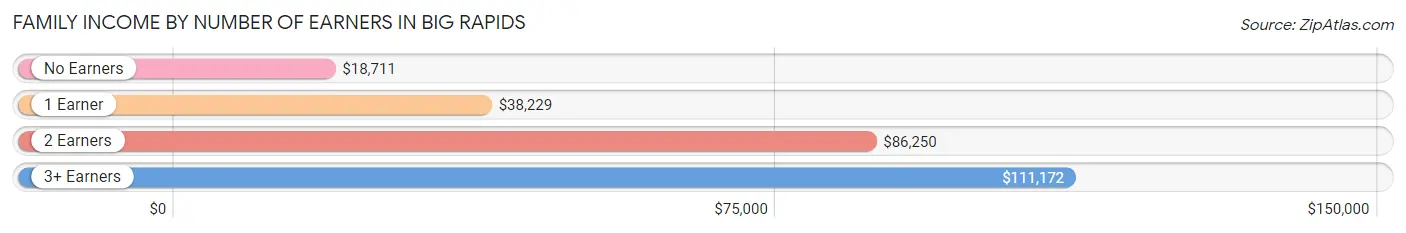
Family Income by Number of Earners in Big Rapids
The median family income in Big Rapids is $56,827, with families comprising 3+ earners (87) having the highest median family income of $111,172, while families with no earners (89) have the lowest median family income of $18,711, accounting for 9.2% and 9.4% of families, respectively.
| Number of Earners | # Families | Median Income |
| No Earners | 89 (9.4%) | $18,711 |
| 1 Earner | 463 (49.0%) | $38,229 |
| 2 Earners | 306 (32.4%) | $86,250 |
| 3+ Earners | 87 (9.2%) | $111,172 |
| Total | 945 (100.0%) | $56,827 |
Household Income in Big Rapids
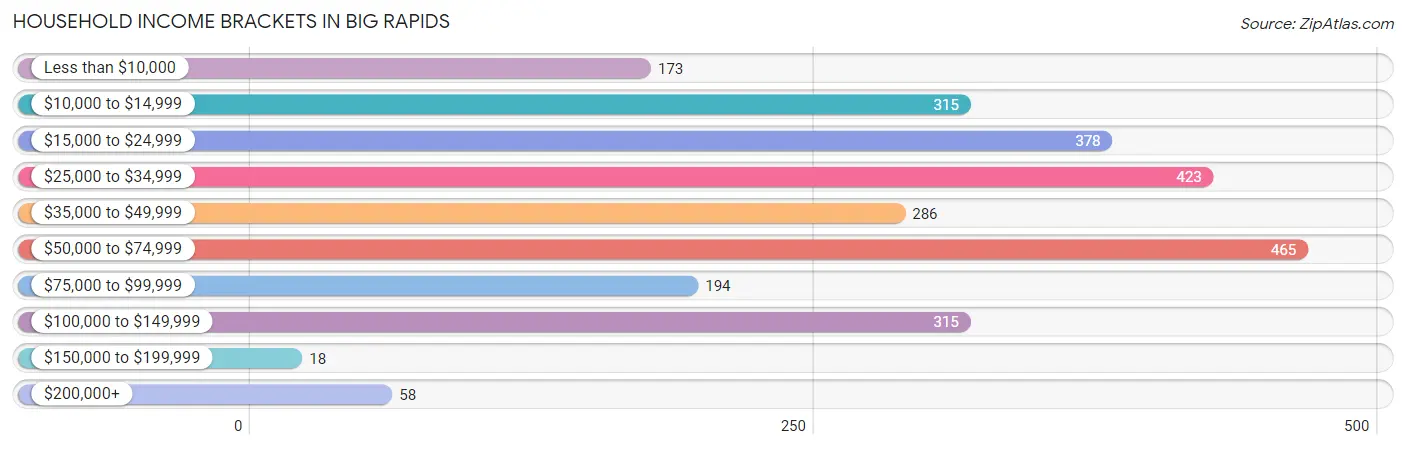
Household Income Brackets in Big Rapids
With 465 households falling in the category, the $50,000 to $74,999 income range is the most frequent in Big Rapids, accounting for 17.7% of all households. In contrast, only 18 households (0.7%) fall into the $150,000 to $199,999 income bracket, making it the least populous group.
| Income Bracket | # Households | % Households |
| Less than $10,000 | 173 | 6.6% |
| $10,000 to $14,999 | 315 | 12.0% |
| $15,000 to $24,999 | 378 | 14.4% |
| $25,000 to $34,999 | 423 | 16.1% |
| $35,000 to $49,999 | 286 | 10.9% |
| $50,000 to $74,999 | 465 | 17.7% |
| $75,000 to $99,999 | 194 | 7.4% |
| $100,000 to $149,999 | 315 | 12.0% |
| $150,000 to $199,999 | 18 | 0.7% |
| $200,000+ | 58 | 2.2% |
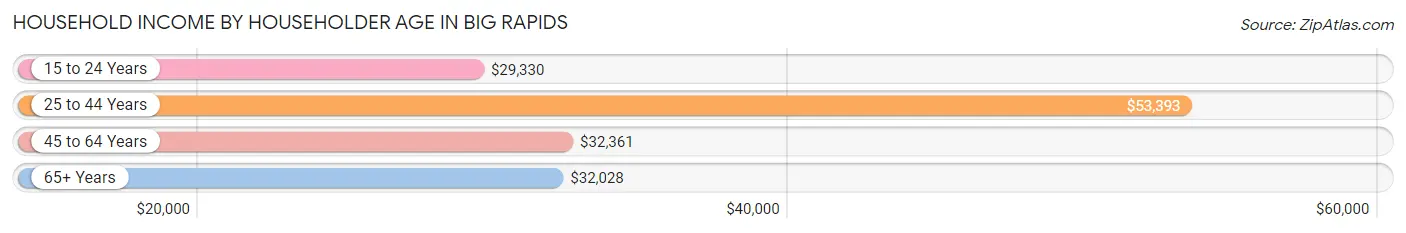
Household Income by Householder Age in Big Rapids
The median household income in Big Rapids is $36,058, with the highest median household income of $53,393 found in the 25 to 44 years age bracket for the primary householder. A total of 806 households (30.7%) fall into this category. Meanwhile, the 15 to 24 years age bracket for the primary householder has the lowest median household income of $29,330, with 651 households (24.8%) in this group.
| Income Bracket | # Households | Median Income |
| 15 to 24 Years | 651 (24.8%) | $29,330 |
| 25 to 44 Years | 806 (30.7%) | $53,393 |
| 45 to 64 Years | 669 (25.5%) | $32,361 |
| 65+ Years | 502 (19.1%) | $32,028 |
| Total | 2,628 (100.0%) | $36,058 |
Poverty in Big Rapids
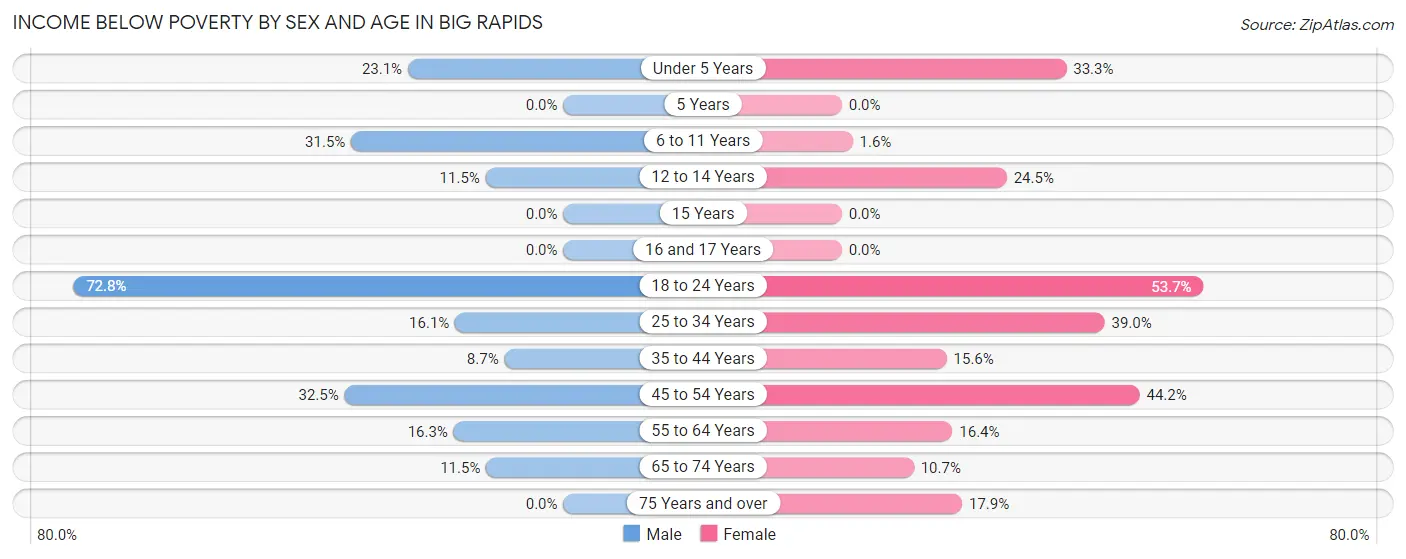
Income Below Poverty by Sex and Age in Big Rapids
With 37.4% poverty level for males and 29.7% for females among the residents of Big Rapids, 18 to 24 year old males and 18 to 24 year old females are the most vulnerable to poverty, with 778 males (72.8%) and 364 females (53.7%) in their respective age groups living below the poverty level.
| Age Bracket | Male | Female |
| Under 5 Years | 21 (23.1%) | 51 (33.3%) |
| 5 Years | 0 (0.0%) | 0 (0.0%) |
| 6 to 11 Years | 46 (31.5%) | 3 (1.6%) |
| 12 to 14 Years | 9 (11.5%) | 36 (24.5%) |
| 15 Years | 0 (0.0%) | 0 (0.0%) |
| 16 and 17 Years | 0 (0.0%) | 0 (0.0%) |
| 18 to 24 Years | 778 (72.8%) | 364 (53.7%) |
| 25 to 34 Years | 54 (16.1%) | 135 (39.0%) |
| 35 to 44 Years | 36 (8.7%) | 47 (15.6%) |
| 45 to 54 Years | 64 (32.5%) | 107 (44.2%) |
| 55 to 64 Years | 42 (16.3%) | 45 (16.4%) |
| 65 to 74 Years | 19 (11.5%) | 25 (10.7%) |
| 75 Years and over | 0 (0.0%) | 30 (17.9%) |
| Total | 1,069 (37.4%) | 843 (29.7%) |
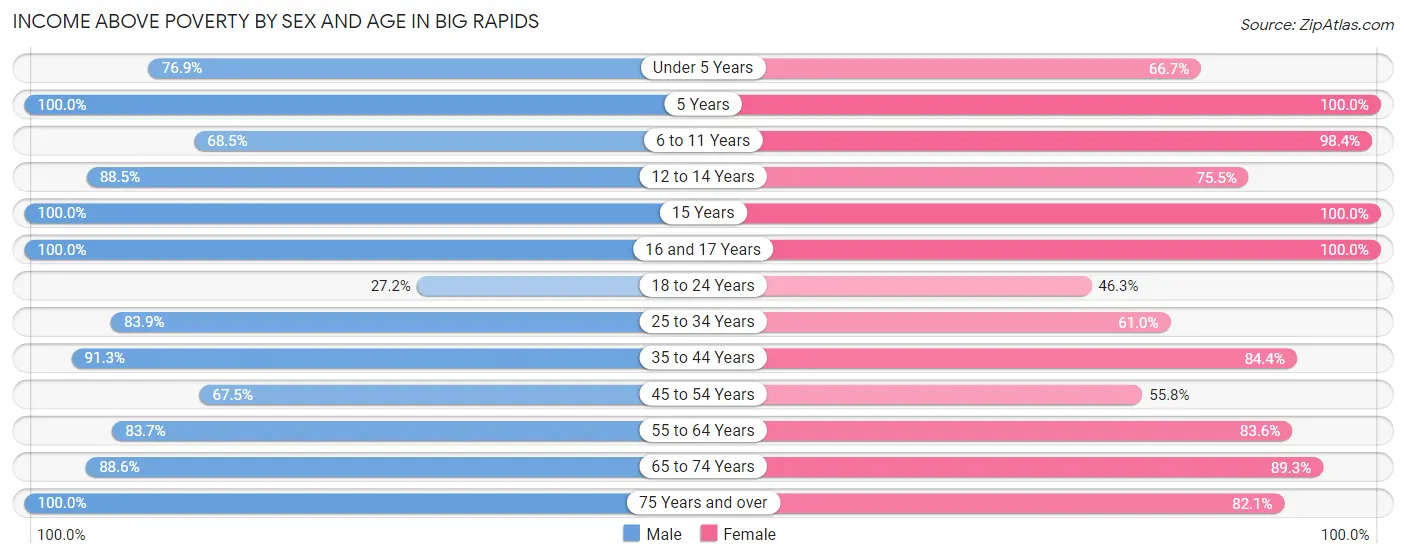
Income Above Poverty by Sex and Age in Big Rapids
According to the poverty statistics in Big Rapids, males aged 5 years and females aged 5 years are the age groups that are most secure financially, with 100.0% of males and 100.0% of females in these age groups living above the poverty line.
| Age Bracket | Male | Female |
| Under 5 Years | 70 (76.9%) | 102 (66.7%) |
| 5 Years | 23 (100.0%) | 53 (100.0%) |
| 6 to 11 Years | 100 (68.5%) | 184 (98.4%) |
| 12 to 14 Years | 69 (88.5%) | 111 (75.5%) |
| 15 Years | 25 (100.0%) | 30 (100.0%) |
| 16 and 17 Years | 14 (100.0%) | 23 (100.0%) |
| 18 to 24 Years | 291 (27.2%) | 314 (46.3%) |
| 25 to 34 Years | 282 (83.9%) | 211 (61.0%) |
| 35 to 44 Years | 376 (91.3%) | 255 (84.4%) |
| 45 to 54 Years | 133 (67.5%) | 135 (55.8%) |
| 55 to 64 Years | 216 (83.7%) | 229 (83.6%) |
| 65 to 74 Years | 147 (88.5%) | 209 (89.3%) |
| 75 Years and over | 46 (100.0%) | 138 (82.1%) |
| Total | 1,792 (62.6%) | 1,994 (70.3%) |
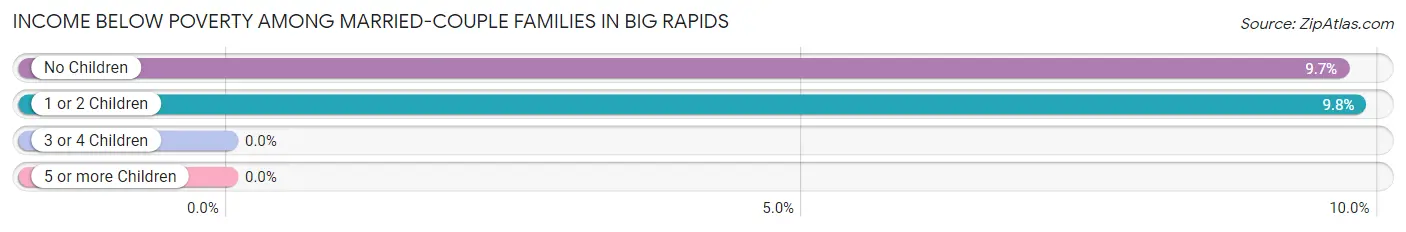
Income Below Poverty Among Married-Couple Families in Big Rapids
The poverty statistics for married-couple families in Big Rapids show that 8.4% or 54 of the total 642 families live below the poverty line. Families with 1 or 2 children have the highest poverty rate of 9.8%, comprising of 22 families. On the other hand, families with 3 or 4 children have the lowest poverty rate of 0.0%, which includes 0 families.
| Children | Above Poverty | Below Poverty |
| No Children | 299 (90.3%) | 32 (9.7%) |
| 1 or 2 Children | 202 (90.2%) | 22 (9.8%) |
| 3 or 4 Children | 87 (100.0%) | 0 (0.0%) |
| 5 or more Children | 0 (0.0%) | 0 (0.0%) |
| Total | 588 (91.6%) | 54 (8.4%) |
Income Below Poverty Among Single-Parent Households in Big Rapids
According to the poverty data in Big Rapids, 18.6% or 13 single-father households and 43.8% or 102 single-mother households are living below the poverty line. Among single-father households, those with 1 or 2 children have the highest poverty rate, with 13 households (18.8%) experiencing poverty. Likewise, among single-mother households, those with no children have the highest poverty rate, with 18 households (46.2%) falling below the poverty line.
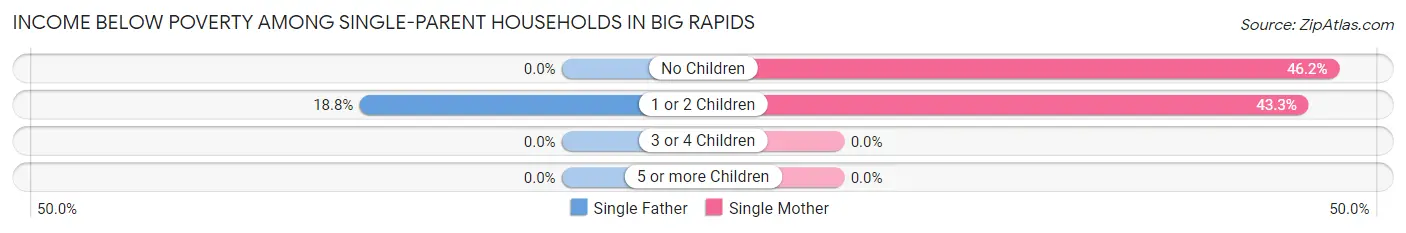
| Children | Single Father | Single Mother |
| No Children | 0 (0.0%) | 18 (46.2%) |
| 1 or 2 Children | 13 (18.8%) | 84 (43.3%) |
| 3 or 4 Children | 0 (0.0%) | 0 (0.0%) |
| 5 or more Children | 0 (0.0%) | 0 (0.0%) |
| Total | 13 (18.6%) | 102 (43.8%) |
Income Below Poverty Among Married-Couple vs Single-Parent Households in Big Rapids
The poverty data for Big Rapids shows that 54 of the married-couple family households (8.4%) and 115 of the single-parent households (38.0%) are living below the poverty level. Within the married-couple family households, those with 1 or 2 children have the highest poverty rate, with 22 households (9.8%) falling below the poverty line. Among the single-parent households, those with no children have the highest poverty rate, with 18 household (45.0%) living below poverty.
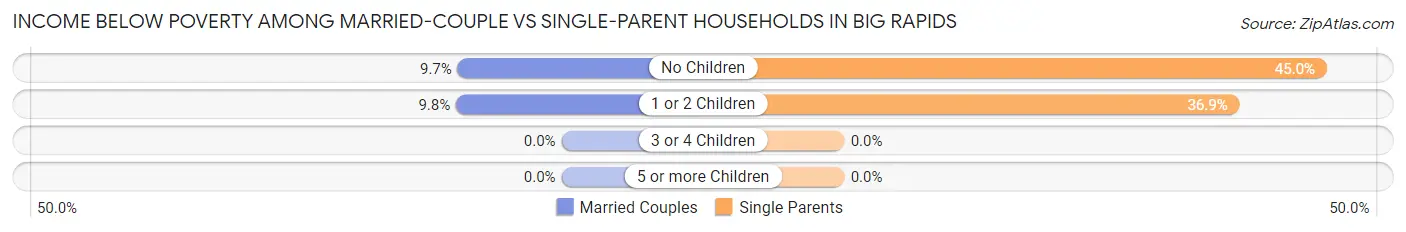
| Children | Married-Couple Families | Single-Parent Households |
| No Children | 32 (9.7%) | 18 (45.0%) |
| 1 or 2 Children | 22 (9.8%) | 97 (36.9%) |
| 3 or 4 Children | 0 (0.0%) | 0 (0.0%) |
| 5 or more Children | 0 (0.0%) | 0 (0.0%) |
| Total | 54 (8.4%) | 115 (38.0%) |
Race in Big Rapids
The most populous races in Big Rapids are White / Caucasian (6,666 | 84.2%), Black / African American (656 | 8.3%), and Hispanic or Latino (348 | 4.4%).
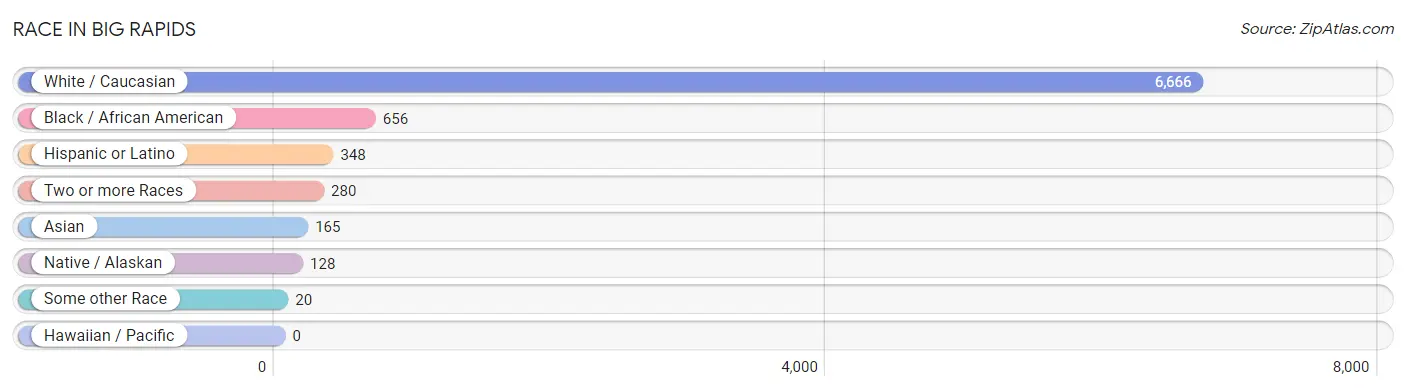
| Race | # Population | % Population |
| Asian | 165 | 2.1% |
| Black / African American | 656 | 8.3% |
| Hawaiian / Pacific | 0 | 0.0% |
| Hispanic or Latino | 348 | 4.4% |
| Native / Alaskan | 128 | 1.6% |
| White / Caucasian | 6,666 | 84.2% |
| Two or more Races | 280 | 3.5% |
| Some other Race | 20 | 0.3% |
| Total | 7,915 | 100.0% |
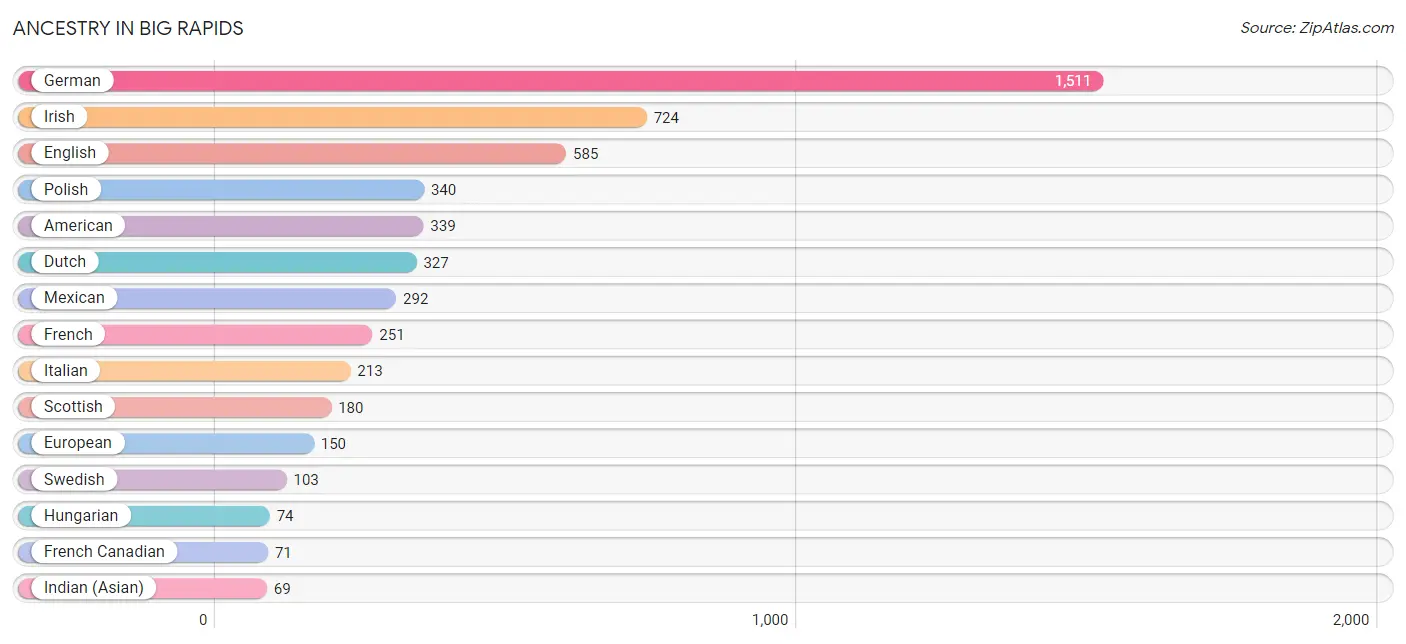
Ancestry in Big Rapids
The most populous ancestries reported in Big Rapids are German (1,511 | 19.1%), Irish (724 | 9.1%), English (585 | 7.4%), Polish (340 | 4.3%), and American (339 | 4.3%), together accounting for 44.2% of all Big Rapids residents.
| Ancestry | # Population | % Population |
| African | 19 | 0.2% |
| American | 339 | 4.3% |
| Arab | 35 | 0.4% |
| Belgian | 3 | 0.0% |
| Bhutanese | 4 | 0.1% |
| British | 39 | 0.5% |
| Burmese | 54 | 0.7% |
| Canadian | 18 | 0.2% |
| Cherokee | 7 | 0.1% |
| Chickasaw | 7 | 0.1% |
| Chippewa | 30 | 0.4% |
| Creek | 27 | 0.3% |
| Croatian | 2 | 0.0% |
| Czech | 16 | 0.2% |
| Danish | 7 | 0.1% |
| Dutch | 327 | 4.1% |
| Eastern European | 18 | 0.2% |
| English | 585 | 7.4% |
| European | 150 | 1.9% |
| Finnish | 55 | 0.7% |
| French | 251 | 3.2% |
| French Canadian | 71 | 0.9% |
| German | 1,511 | 19.1% |
| Greek | 4 | 0.1% |
| Hungarian | 74 | 0.9% |
| Indian (Asian) | 69 | 0.9% |
| Indonesian | 22 | 0.3% |
| Iraqi | 3 | 0.0% |
| Irish | 724 | 9.1% |
| Italian | 213 | 2.7% |
| Korean | 38 | 0.5% |
| Lebanese | 32 | 0.4% |
| Malaysian | 36 | 0.4% |
| Mexican | 292 | 3.7% |
| Navajo | 36 | 0.4% |
| Northern European | 7 | 0.1% |
| Norwegian | 57 | 0.7% |
| Pennsylvania German | 1 | 0.0% |
| Polish | 340 | 4.3% |
| Portuguese | 6 | 0.1% |
| Puerto Rican | 28 | 0.4% |
| Russian | 45 | 0.6% |
| Scandinavian | 31 | 0.4% |
| Scotch-Irish | 61 | 0.8% |
| Scottish | 180 | 2.3% |
| South American | 24 | 0.3% |
| Spanish | 4 | 0.1% |
| Sri Lankan | 8 | 0.1% |
| Subsaharan African | 19 | 0.2% |
| Swedish | 103 | 1.3% |
| Swiss | 15 | 0.2% |
| Thai | 14 | 0.2% |
| Ukrainian | 11 | 0.1% |
| Venezuelan | 24 | 0.3% |
| Welsh | 9 | 0.1% | View All 55 Rows |
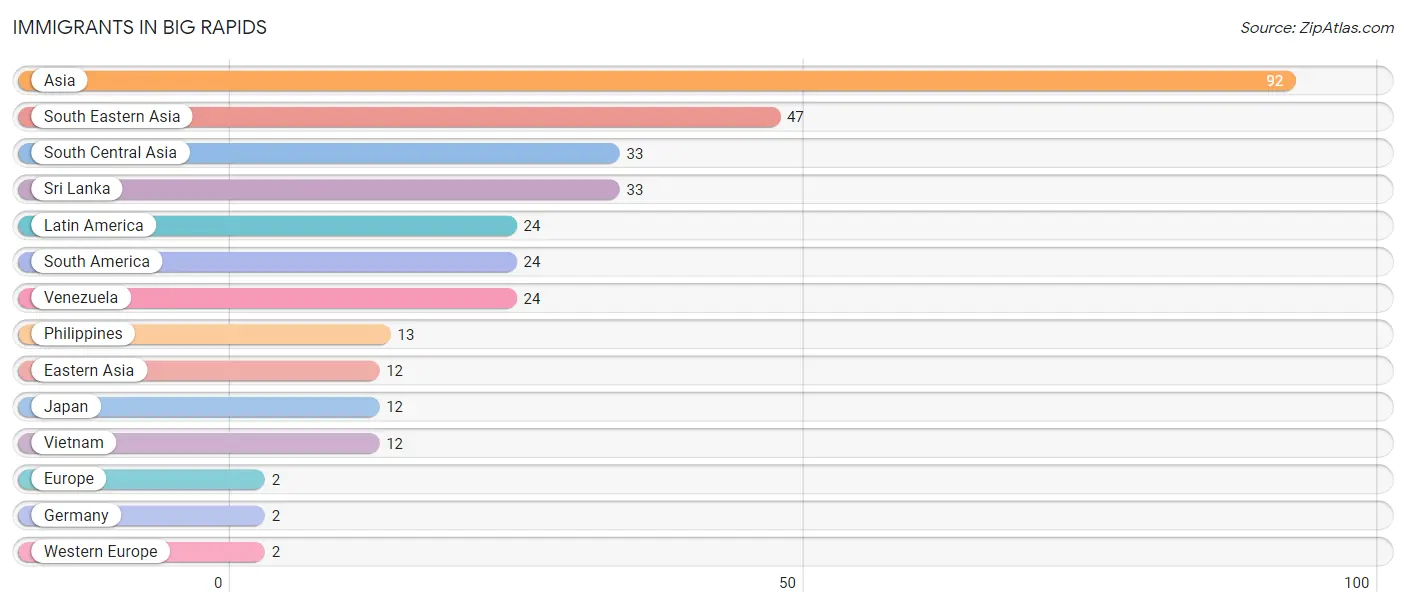
Immigrants in Big Rapids
The most numerous immigrant groups reported in Big Rapids came from Asia (92 | 1.2%), South Eastern Asia (47 | 0.6%), South Central Asia (33 | 0.4%), Sri Lanka (33 | 0.4%), and Latin America (24 | 0.3%), together accounting for 2.9% of all Big Rapids residents.
| Immigration Origin | # Population | % Population |
| Asia | 92 | 1.2% |
| Eastern Asia | 12 | 0.2% |
| Europe | 2 | 0.0% |
| Germany | 2 | 0.0% |
| Japan | 12 | 0.2% |
| Latin America | 24 | 0.3% |
| Philippines | 13 | 0.2% |
| South America | 24 | 0.3% |
| South Central Asia | 33 | 0.4% |
| South Eastern Asia | 47 | 0.6% |
| Sri Lanka | 33 | 0.4% |
| Venezuela | 24 | 0.3% |
| Vietnam | 12 | 0.2% |
| Western Europe | 2 | 0.0% | View All 14 Rows |
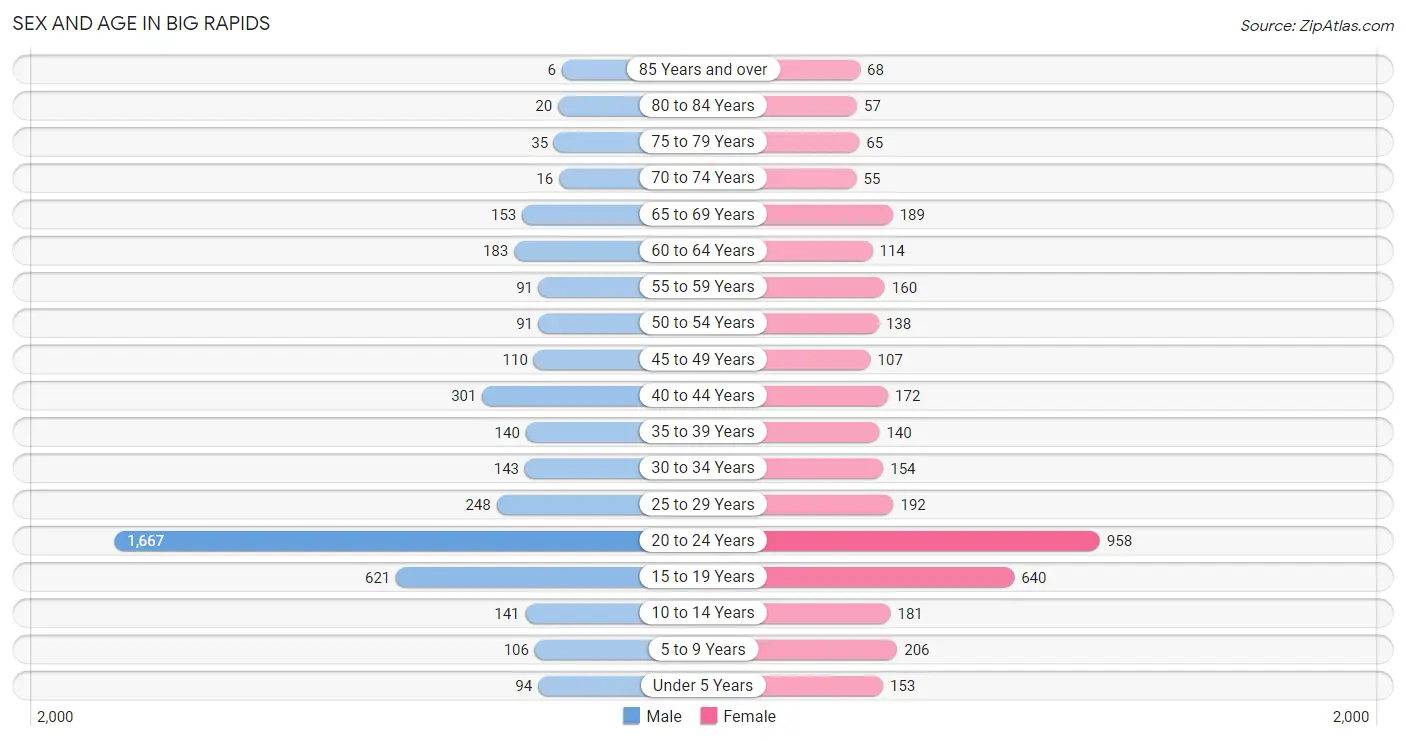
Sex and Age in Big Rapids
Sex and Age in Big Rapids
The most populous age groups in Big Rapids are 20 to 24 Years (1,667 | 40.0%) for men and 20 to 24 Years (958 | 25.6%) for women.
| Age Bracket | Male | Female |
| Under 5 Years | 94 (2.3%) | 153 (4.1%) |
| 5 to 9 Years | 106 (2.5%) | 206 (5.5%) |
| 10 to 14 Years | 141 (3.4%) | 181 (4.8%) |
| 15 to 19 Years | 621 (14.9%) | 640 (17.1%) |
| 20 to 24 Years | 1,667 (40.0%) | 958 (25.6%) |
| 25 to 29 Years | 248 (5.9%) | 192 (5.1%) |
| 30 to 34 Years | 143 (3.4%) | 154 (4.1%) |
| 35 to 39 Years | 140 (3.4%) | 140 (3.7%) |
| 40 to 44 Years | 301 (7.2%) | 172 (4.6%) |
| 45 to 49 Years | 110 (2.6%) | 107 (2.9%) |
| 50 to 54 Years | 91 (2.2%) | 138 (3.7%) |
| 55 to 59 Years | 91 (2.2%) | 160 (4.3%) |
| 60 to 64 Years | 183 (4.4%) | 114 (3.0%) |
| 65 to 69 Years | 153 (3.7%) | 189 (5.0%) |
| 70 to 74 Years | 16 (0.4%) | 55 (1.5%) |
| 75 to 79 Years | 35 (0.8%) | 65 (1.7%) |
| 80 to 84 Years | 20 (0.5%) | 57 (1.5%) |
| 85 Years and over | 6 (0.1%) | 68 (1.8%) |
| Total | 4,166 (100.0%) | 3,749 (100.0%) |
Families and Households in Big Rapids
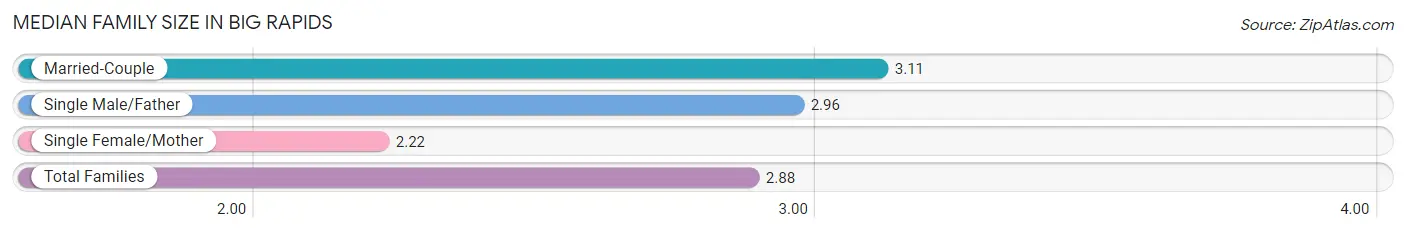
Median Family Size in Big Rapids
The median family size in Big Rapids is 2.88 persons per family, with married-couple families (642 | 67.9%) accounting for the largest median family size of 3.11 persons per family. On the other hand, single female/mother families (233 | 24.7%) represent the smallest median family size with 2.22 persons per family.
| Family Type | # Families | Family Size |
| Married-Couple | 642 (67.9%) | 3.11 |
| Single Male/Father | 70 (7.4%) | 2.96 |
| Single Female/Mother | 233 (24.7%) | 2.22 |
| Total Families | 945 (100.0%) | 2.88 |
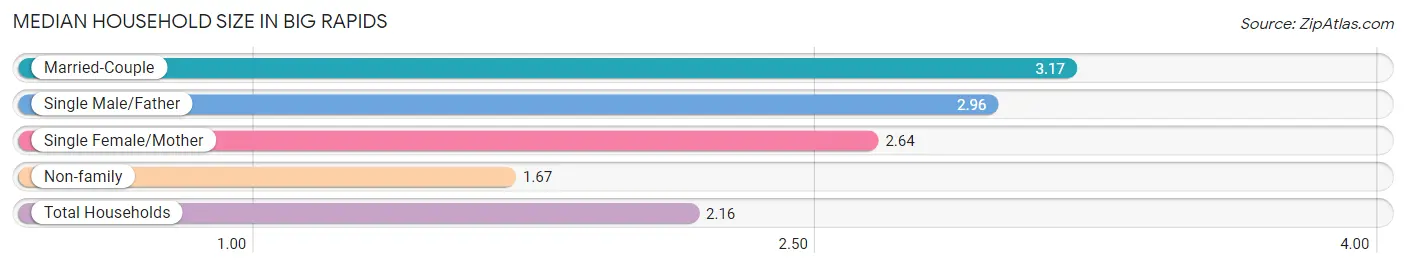
Median Household Size in Big Rapids
The median household size in Big Rapids is 2.16 persons per household, with married-couple households (642 | 24.4%) accounting for the largest median household size of 3.17 persons per household. non-family households (1,683 | 64.0%) represent the smallest median household size with 1.67 persons per household.
| Household Type | # Households | Household Size |
| Married-Couple | 642 (24.4%) | 3.17 |
| Single Male/Father | 70 (2.7%) | 2.96 |
| Single Female/Mother | 233 (8.9%) | 2.64 |
| Non-family | 1,683 (64.0%) | 1.67 |
| Total Households | 2,628 (100.0%) | 2.16 |
Household Size by Marriage Status in Big Rapids
Out of a total of 2,628 households in Big Rapids, 945 (36.0%) are family households, while 1,683 (64.0%) are nonfamily households. The most numerous type of family households are 2-person households, comprising 349, and the most common type of nonfamily households are 1-person households, comprising 1,048.
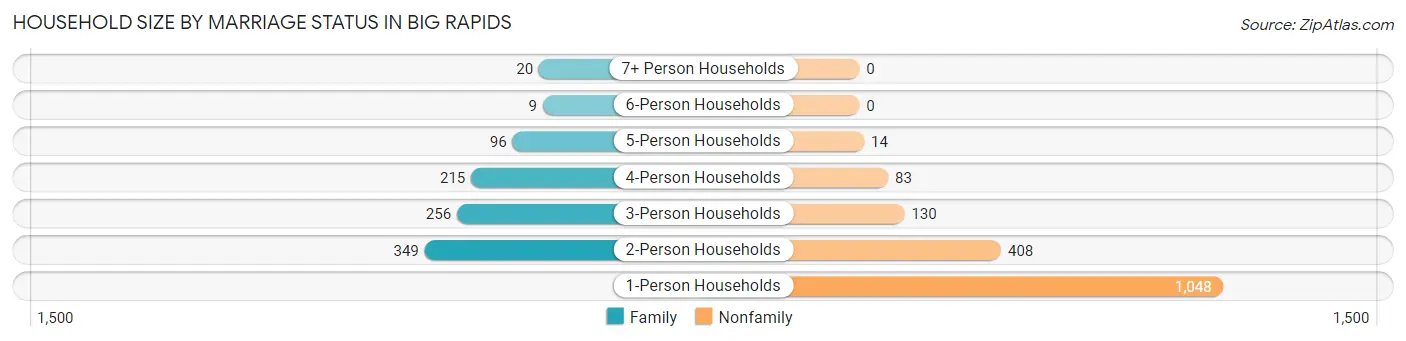
| Household Size | Family Households | Nonfamily Households |
| 1-Person Households | - | 1,048 (39.9%) |
| 2-Person Households | 349 (13.3%) | 408 (15.5%) |
| 3-Person Households | 256 (9.7%) | 130 (5.0%) |
| 4-Person Households | 215 (8.2%) | 83 (3.2%) |
| 5-Person Households | 96 (3.6%) | 14 (0.5%) |
| 6-Person Households | 9 (0.3%) | 0 (0.0%) |
| 7+ Person Households | 20 (0.8%) | 0 (0.0%) |
| Total | 945 (36.0%) | 1,683 (64.0%) |
Female Fertility in Big Rapids
Fertility by Age in Big Rapids
Average fertility rate in Big Rapids is 12.0 births per 1,000 women. Women in the age bracket of 20 to 34 years have the highest fertility rate with 17.0 births per 1,000 women. Women in the age bracket of 20 to 34 years acount for 73.3% of all women with births.
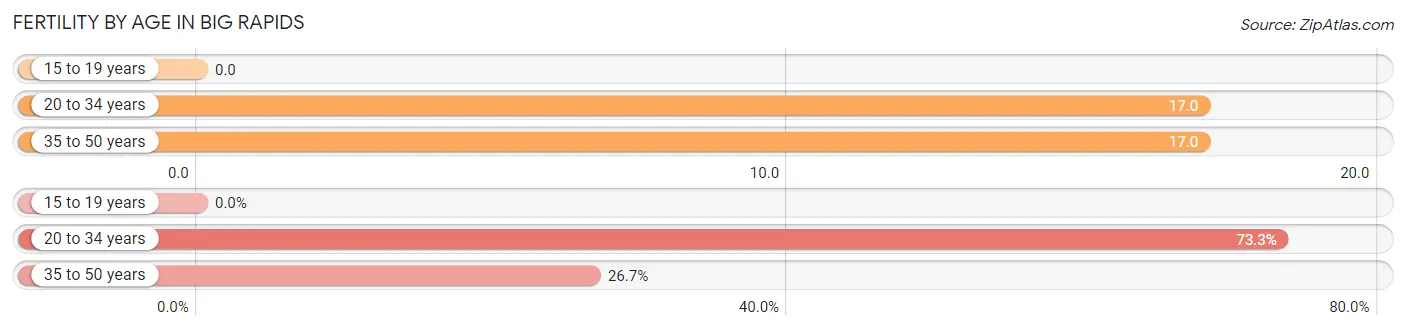
| Age Bracket | Women with Births | Births / 1,000 Women |
| 15 to 19 years | 0 (0.0%) | 0.0 |
| 20 to 34 years | 22 (73.3%) | 17.0 |
| 35 to 50 years | 8 (26.7%) | 17.0 |
| Total | 30 (100.0%) | 12.0 |
Fertility by Age by Marriage Status in Big Rapids
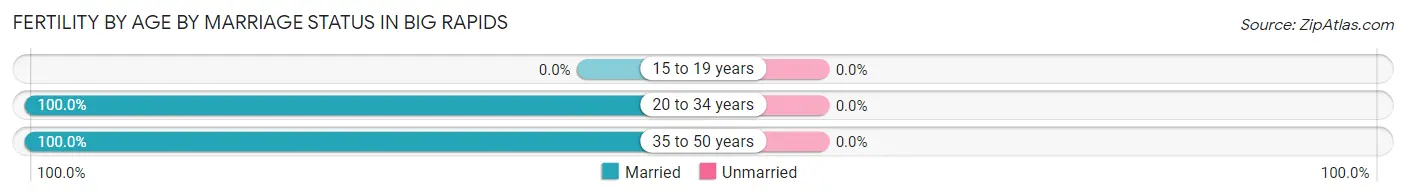
| Age Bracket | Married | Unmarried |
| 15 to 19 years | 0 (0.0%) | 0 (0.0%) |
| 20 to 34 years | 22 (100.0%) | 0 (0.0%) |
| 35 to 50 years | 8 (100.0%) | 0 (0.0%) |
| Total | 30 (100.0%) | 0 (0.0%) |
Fertility by Education in Big Rapids
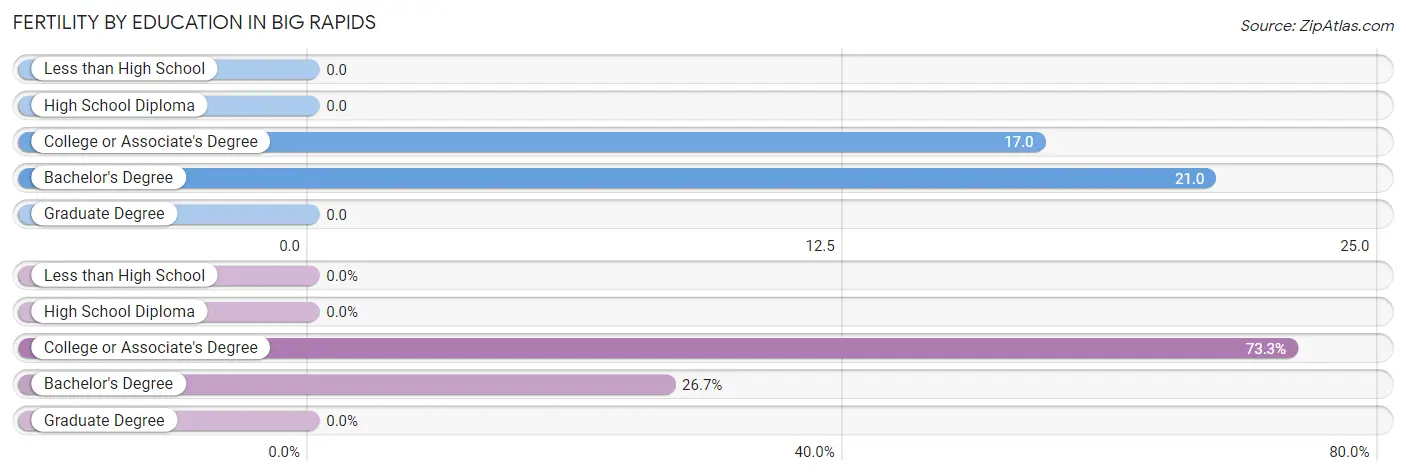
| Educational Attainment | Women with Births | Births / 1,000 Women |
| Less than High School | 0 (0.0%) | 0.0 |
| High School Diploma | 0 (0.0%) | 0.0 |
| College or Associate's Degree | 22 (73.3%) | 17.0 |
| Bachelor's Degree | 8 (26.7%) | 21.0 |
| Graduate Degree | 0 (0.0%) | 0.0 |
| Total | 30 (100.0%) | 12.0 |
Fertility by Education by Marriage Status in Big Rapids
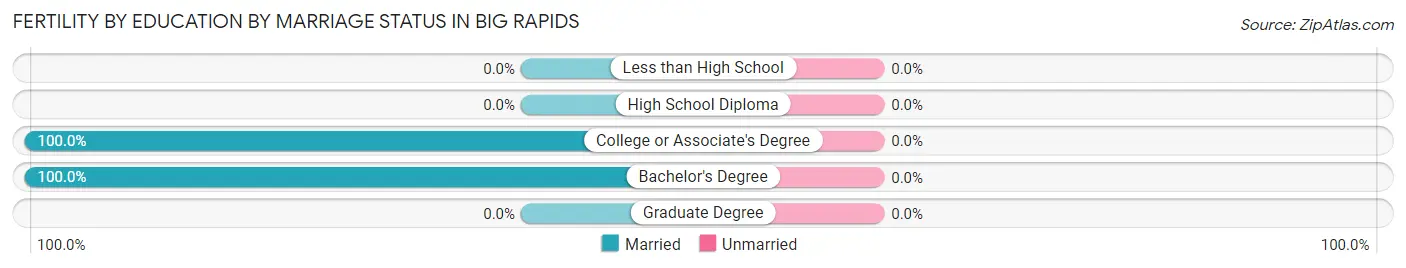
| Educational Attainment | Married | Unmarried |
| Less than High School | 0 (0.0%) | 0 (0.0%) |
| High School Diploma | 0 (0.0%) | 0 (0.0%) |
| College or Associate's Degree | 22 (100.0%) | 0 (0.0%) |
| Bachelor's Degree | 8 (100.0%) | 0 (0.0%) |
| Graduate Degree | 0 (0.0%) | 0 (0.0%) |
| Total | 30 (100.0%) | 0 (0.0%) |
Employment Characteristics in Big Rapids
Employment by Class of Employer in Big Rapids
Among the 3,834 employed individuals in Big Rapids, private company employees (2,662 | 69.4%), not-for-profit organizations (463 | 12.1%), and state government employees (377 | 9.8%) make up the most common classes of employment.
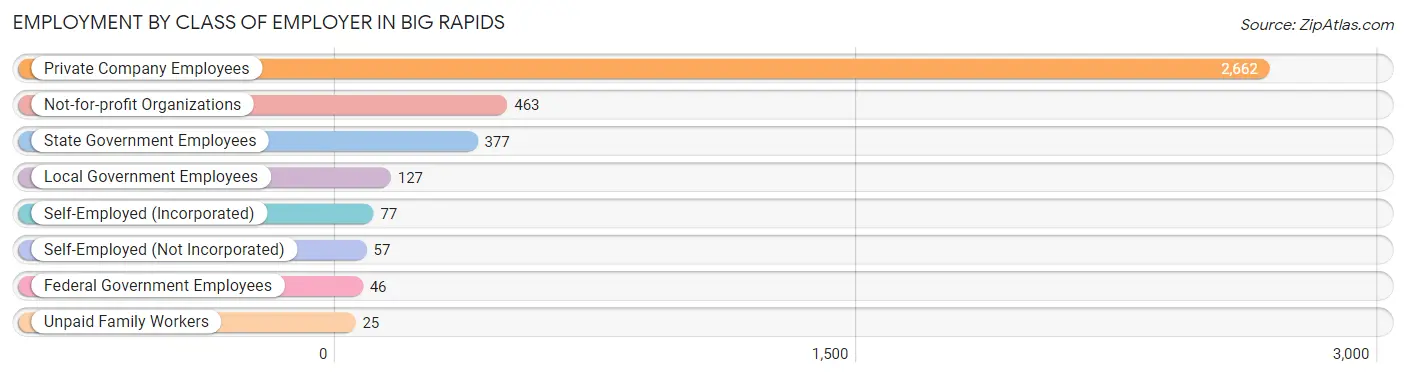
| Employer Class | # Employees | % Employees |
| Private Company Employees | 2,662 | 69.4% |
| Self-Employed (Incorporated) | 77 | 2.0% |
| Self-Employed (Not Incorporated) | 57 | 1.5% |
| Not-for-profit Organizations | 463 | 12.1% |
| Local Government Employees | 127 | 3.3% |
| State Government Employees | 377 | 9.8% |
| Federal Government Employees | 46 | 1.2% |
| Unpaid Family Workers | 25 | 0.6% |
| Total | 3,834 | 100.0% |
Employment Status by Age in Big Rapids
According to the labor force statistics for Big Rapids, out of the total population over 16 years of age (6,979), 62.2% or 4,341 individuals are in the labor force, with 7.2% or 313 of them unemployed. The age group with the highest labor force participation rate is 25 to 29 years, with 94.3% or 415 individuals in the labor force. Within the labor force, the 16 to 19 years age range has the highest percentage of unemployed individuals, with 19.3% or 130 of them being unemployed.
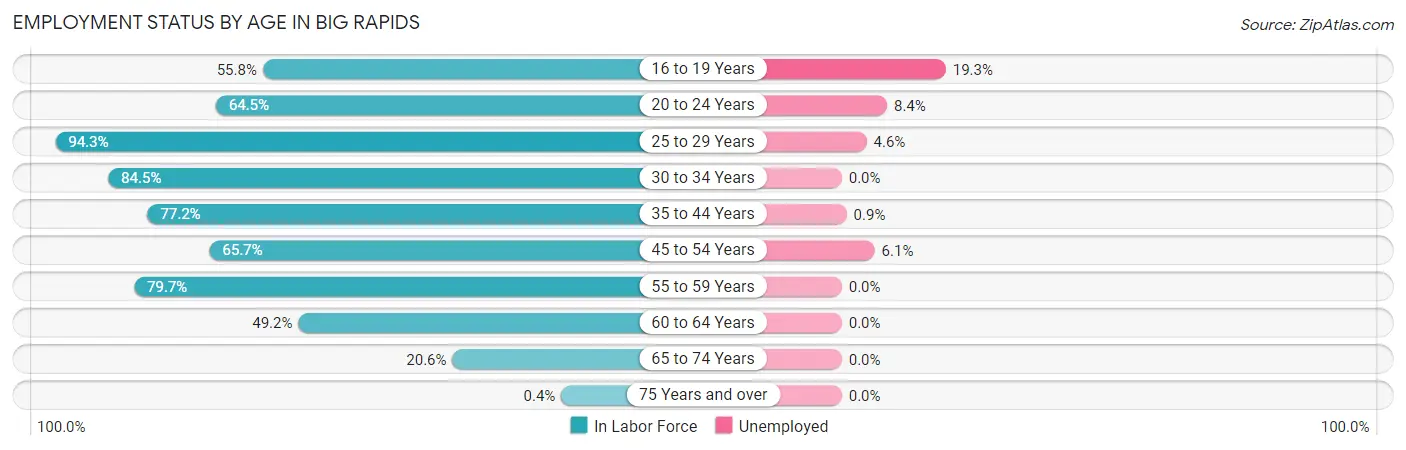
| Age Bracket | In Labor Force | Unemployed |
| 16 to 19 Years | 673 (55.8%) | 130 (19.3%) |
| 20 to 24 Years | 1,693 (64.5%) | 142 (8.4%) |
| 25 to 29 Years | 415 (94.3%) | 19 (4.6%) |
| 30 to 34 Years | 251 (84.5%) | 0 (0.0%) |
| 35 to 44 Years | 581 (77.2%) | 5 (0.9%) |
| 45 to 54 Years | 293 (65.7%) | 18 (6.1%) |
| 55 to 59 Years | 200 (79.7%) | 0 (0.0%) |
| 60 to 64 Years | 146 (49.2%) | 0 (0.0%) |
| 65 to 74 Years | 85 (20.6%) | 0 (0.0%) |
| 75 Years and over | 1 (0.4%) | 0 (0.0%) |
| Total | 4,341 (62.2%) | 313 (7.2%) |
Employment Status by Educational Attainment in Big Rapids
According to labor force statistics for Big Rapids, 75.9% of individuals (1,885) out of the total population between 25 and 64 years of age (2,484) are in the labor force, with 2.2% or 41 of them being unemployed. The group with the highest labor force participation rate are those with the educational attainment of bachelor's degree or higher, with 87.2% or 595 individuals in the labor force. Within the labor force, individuals with less than high school education have the highest percentage of unemployment, with 12.8% or 5 of them being unemployed.
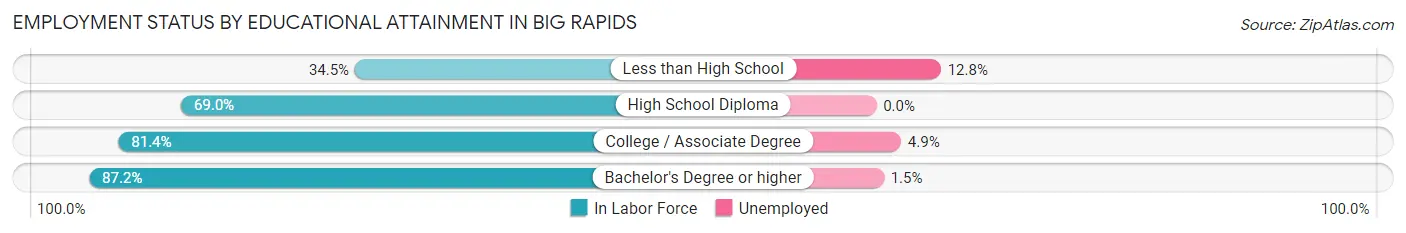
| Educational Attainment | In Labor Force | Unemployed |
| Less than High School | 39 (34.5%) | 14 (12.8%) |
| High School Diploma | 684 (69.0%) | 0 (0.0%) |
| College / Associate Degree | 568 (81.4%) | 34 (4.9%) |
| Bachelor's Degree or higher | 595 (87.2%) | 10 (1.5%) |
| Total | 1,885 (75.9%) | 55 (2.2%) |
Employment Occupations by Sex in Big Rapids
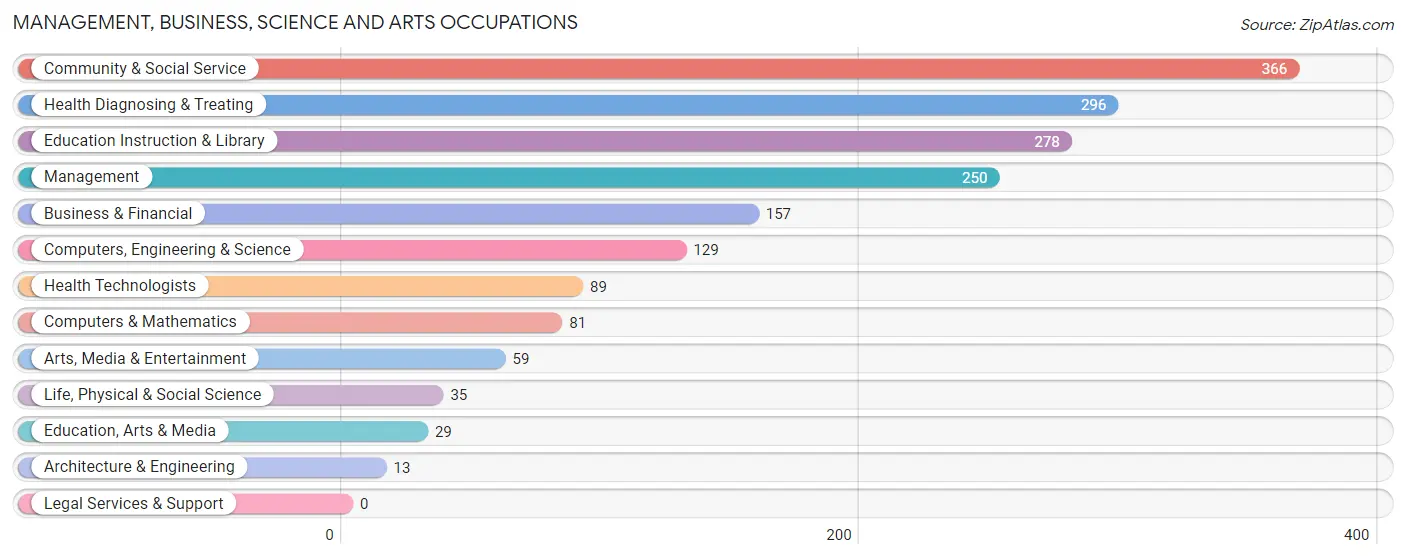
Management, Business, Science and Arts Occupations
The most common Management, Business, Science and Arts occupations in Big Rapids are Community & Social Service (366 | 9.1%), Health Diagnosing & Treating (296 | 7.4%), Education Instruction & Library (278 | 6.9%), Management (250 | 6.2%), and Business & Financial (157 | 3.9%).
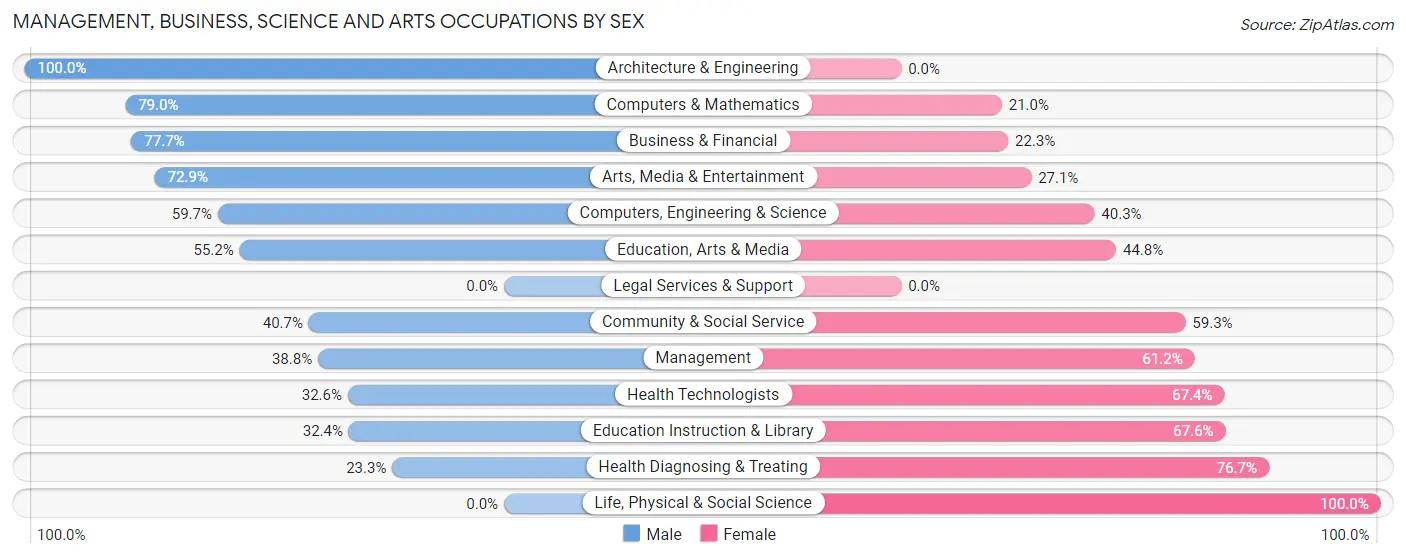
Management, Business, Science and Arts Occupations by Sex
Within the Management, Business, Science and Arts occupations in Big Rapids, the most male-oriented occupations are Architecture & Engineering (100.0%), Computers & Mathematics (79.0%), and Business & Financial (77.7%), while the most female-oriented occupations are Life, Physical & Social Science (100.0%), Health Diagnosing & Treating (76.7%), and Education Instruction & Library (67.6%).
| Occupation | Male | Female |
| Management | 97 (38.8%) | 153 (61.2%) |
| Business & Financial | 122 (77.7%) | 35 (22.3%) |
| Computers, Engineering & Science | 77 (59.7%) | 52 (40.3%) |
| Computers & Mathematics | 64 (79.0%) | 17 (21.0%) |
| Architecture & Engineering | 13 (100.0%) | 0 (0.0%) |
| Life, Physical & Social Science | 0 (0.0%) | 35 (100.0%) |
| Community & Social Service | 149 (40.7%) | 217 (59.3%) |
| Education, Arts & Media | 16 (55.2%) | 13 (44.8%) |
| Legal Services & Support | 0 (0.0%) | 0 (0.0%) |
| Education Instruction & Library | 90 (32.4%) | 188 (67.6%) |
| Arts, Media & Entertainment | 43 (72.9%) | 16 (27.1%) |
| Health Diagnosing & Treating | 69 (23.3%) | 227 (76.7%) |
| Health Technologists | 29 (32.6%) | 60 (67.4%) |
| Total (Category) | 514 (42.9%) | 684 (57.1%) |
| Total (Overall) | 2,017 (50.2%) | 2,003 (49.8%) |
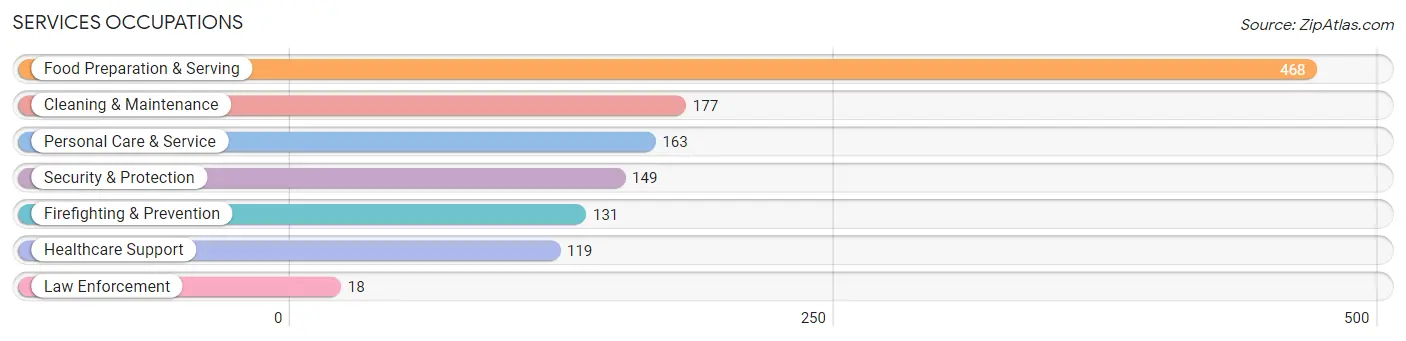
Services Occupations
The most common Services occupations in Big Rapids are Food Preparation & Serving (468 | 11.6%), Cleaning & Maintenance (177 | 4.4%), Personal Care & Service (163 | 4.1%), Security & Protection (149 | 3.7%), and Firefighting & Prevention (131 | 3.3%).
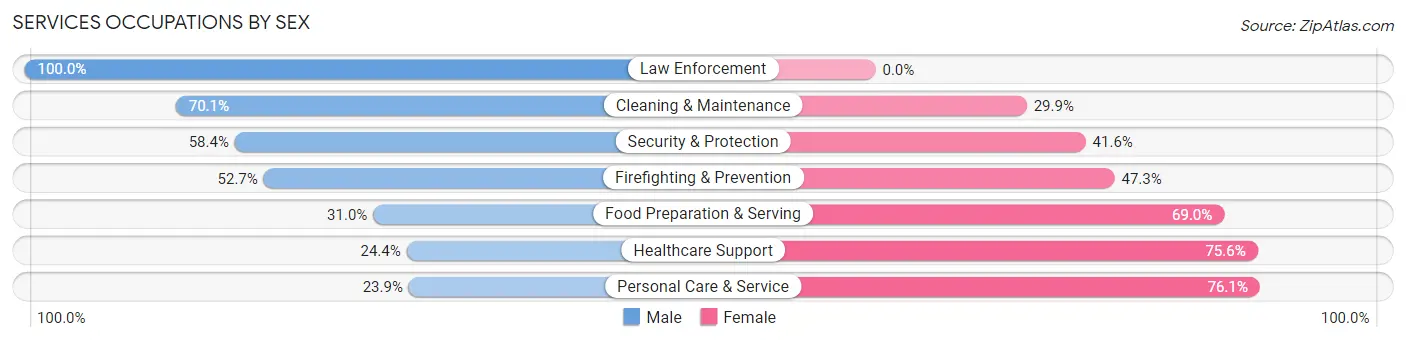
Services Occupations by Sex
Within the Services occupations in Big Rapids, the most male-oriented occupations are Law Enforcement (100.0%), Cleaning & Maintenance (70.1%), and Security & Protection (58.4%), while the most female-oriented occupations are Personal Care & Service (76.1%), Healthcare Support (75.6%), and Food Preparation & Serving (69.0%).
| Occupation | Male | Female |
| Healthcare Support | 29 (24.4%) | 90 (75.6%) |
| Security & Protection | 87 (58.4%) | 62 (41.6%) |
| Firefighting & Prevention | 69 (52.7%) | 62 (47.3%) |
| Law Enforcement | 18 (100.0%) | 0 (0.0%) |
| Food Preparation & Serving | 145 (31.0%) | 323 (69.0%) |
| Cleaning & Maintenance | 124 (70.1%) | 53 (29.9%) |
| Personal Care & Service | 39 (23.9%) | 124 (76.1%) |
| Total (Category) | 424 (39.4%) | 652 (60.6%) |
| Total (Overall) | 2,017 (50.2%) | 2,003 (49.8%) |
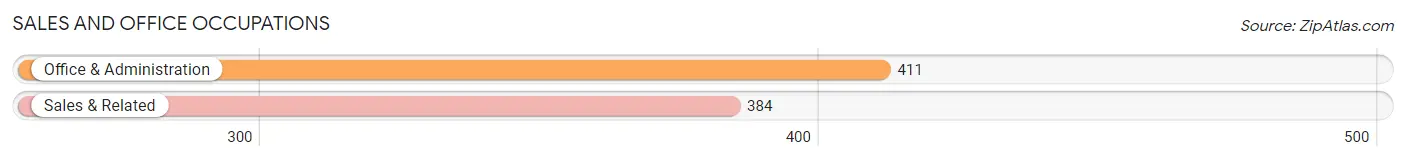
Sales and Office Occupations
The most common Sales and Office occupations in Big Rapids are Office & Administration (411 | 10.2%), and Sales & Related (384 | 9.6%).
Sales and Office Occupations by Sex
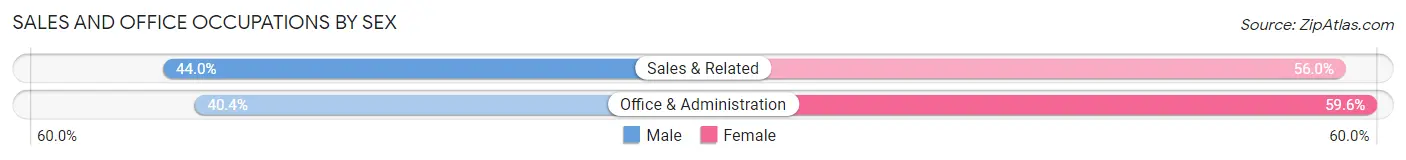
| Occupation | Male | Female |
| Sales & Related | 169 (44.0%) | 215 (56.0%) |
| Office & Administration | 166 (40.4%) | 245 (59.6%) |
| Total (Category) | 335 (42.1%) | 460 (57.9%) |
| Total (Overall) | 2,017 (50.2%) | 2,003 (49.8%) |
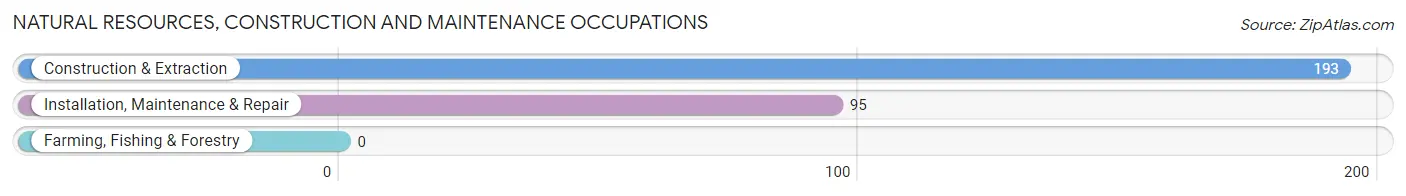
Natural Resources, Construction and Maintenance Occupations
The most common Natural Resources, Construction and Maintenance occupations in Big Rapids are Construction & Extraction (193 | 4.8%), and Installation, Maintenance & Repair (95 | 2.4%).
Natural Resources, Construction and Maintenance Occupations by Sex
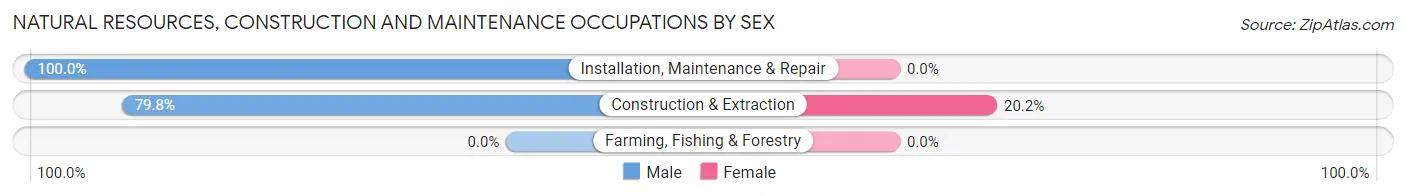
| Occupation | Male | Female |
| Farming, Fishing & Forestry | 0 (0.0%) | 0 (0.0%) |
| Construction & Extraction | 154 (79.8%) | 39 (20.2%) |
| Installation, Maintenance & Repair | 95 (100.0%) | 0 (0.0%) |
| Total (Category) | 249 (86.5%) | 39 (13.5%) |
| Total (Overall) | 2,017 (50.2%) | 2,003 (49.8%) |
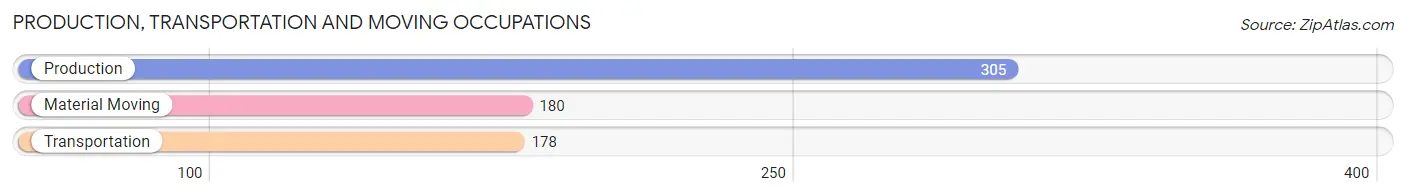
Production, Transportation and Moving Occupations
The most common Production, Transportation and Moving occupations in Big Rapids are Production (305 | 7.6%), Material Moving (180 | 4.5%), and Transportation (178 | 4.4%).
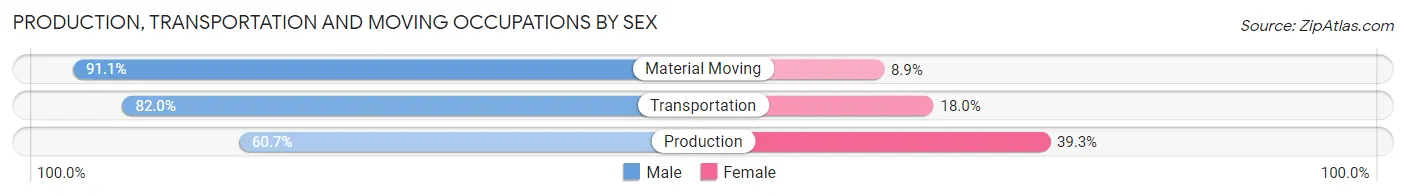
Production, Transportation and Moving Occupations by Sex
| Occupation | Male | Female |
| Production | 185 (60.7%) | 120 (39.3%) |
| Transportation | 146 (82.0%) | 32 (18.0%) |
| Material Moving | 164 (91.1%) | 16 (8.9%) |
| Total (Category) | 495 (74.7%) | 168 (25.3%) |
| Total (Overall) | 2,017 (50.2%) | 2,003 (49.8%) |
Employment Industries by Sex in Big Rapids
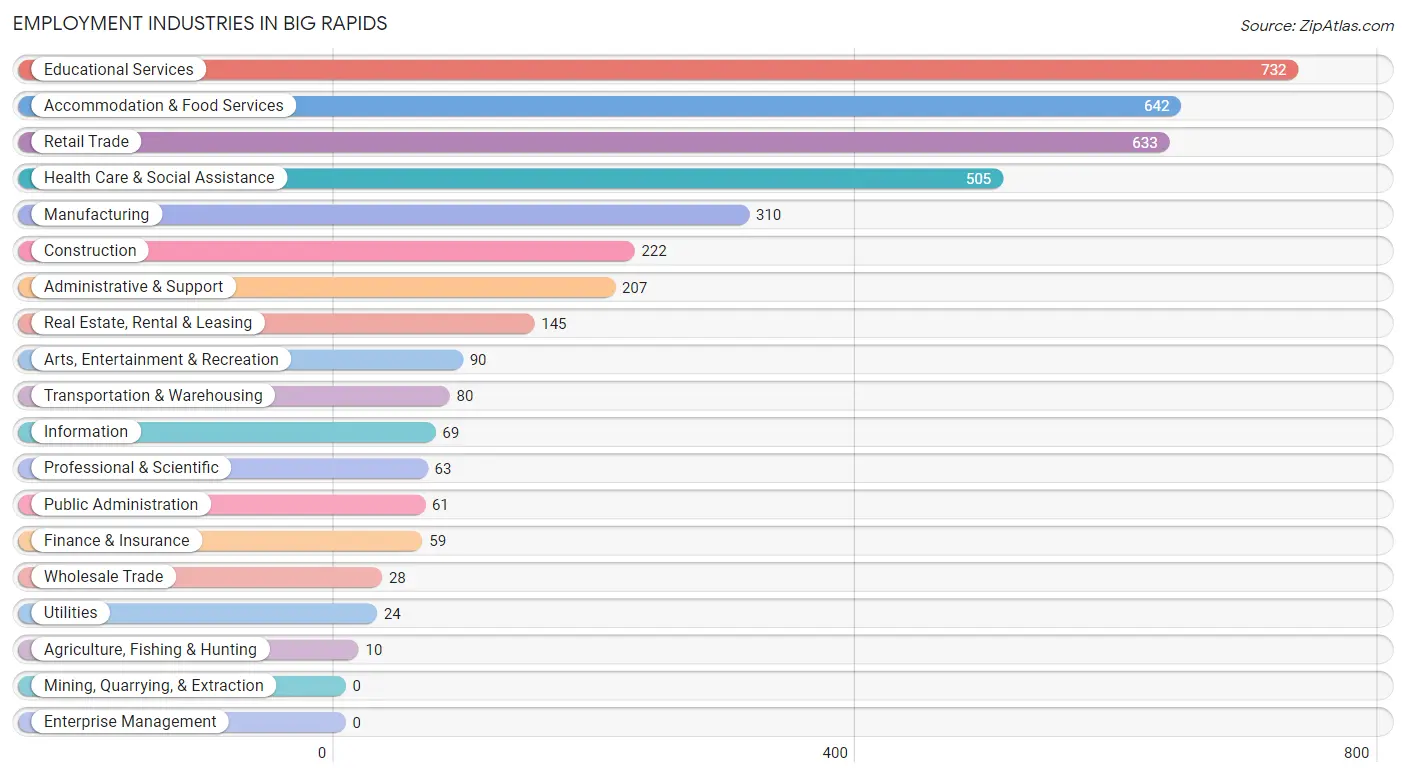
Employment Industries in Big Rapids
The major employment industries in Big Rapids include Educational Services (732 | 18.2%), Accommodation & Food Services (642 | 16.0%), Retail Trade (633 | 15.8%), Health Care & Social Assistance (505 | 12.6%), and Manufacturing (310 | 7.7%).
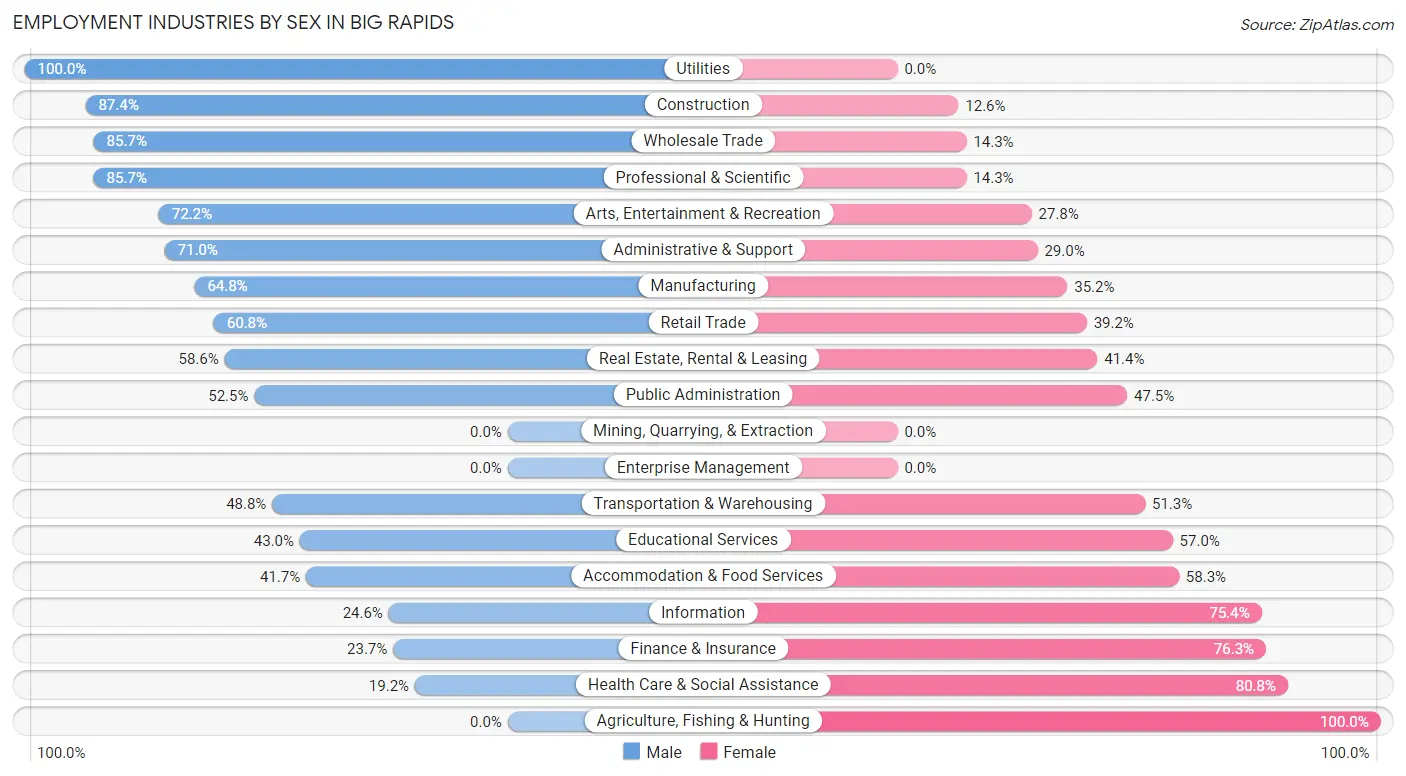
Employment Industries by Sex in Big Rapids
The Big Rapids industries that see more men than women are Utilities (100.0%), Construction (87.4%), and Wholesale Trade (85.7%), whereas the industries that tend to have a higher number of women are Agriculture, Fishing & Hunting (100.0%), Health Care & Social Assistance (80.8%), and Finance & Insurance (76.3%).
| Industry | Male | Female |
| Agriculture, Fishing & Hunting | 0 (0.0%) | 10 (100.0%) |
| Mining, Quarrying, & Extraction | 0 (0.0%) | 0 (0.0%) |
| Construction | 194 (87.4%) | 28 (12.6%) |
| Manufacturing | 201 (64.8%) | 109 (35.2%) |
| Wholesale Trade | 24 (85.7%) | 4 (14.3%) |
| Retail Trade | 385 (60.8%) | 248 (39.2%) |
| Transportation & Warehousing | 39 (48.7%) | 41 (51.2%) |
| Utilities | 24 (100.0%) | 0 (0.0%) |
| Information | 17 (24.6%) | 52 (75.4%) |
| Finance & Insurance | 14 (23.7%) | 45 (76.3%) |
| Real Estate, Rental & Leasing | 85 (58.6%) | 60 (41.4%) |
| Professional & Scientific | 54 (85.7%) | 9 (14.3%) |
| Enterprise Management | 0 (0.0%) | 0 (0.0%) |
| Administrative & Support | 147 (71.0%) | 60 (29.0%) |
| Educational Services | 315 (43.0%) | 417 (57.0%) |
| Health Care & Social Assistance | 97 (19.2%) | 408 (80.8%) |
| Arts, Entertainment & Recreation | 65 (72.2%) | 25 (27.8%) |
| Accommodation & Food Services | 268 (41.7%) | 374 (58.3%) |
| Public Administration | 32 (52.5%) | 29 (47.5%) |
| Total | 2,017 (50.2%) | 2,003 (49.8%) |
Education in Big Rapids
School Enrollment in Big Rapids
The most common levels of schooling among the 4,265 students in Big Rapids are college / undergraduate (3,182 | 74.6%), graduate / professional (334 | 7.8%), and middle school (257 | 6.0%).
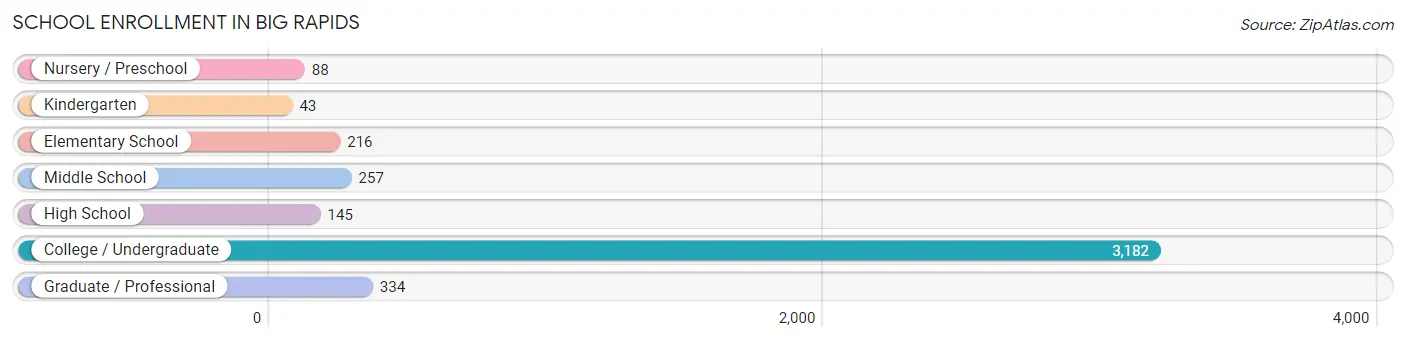
| School Level | # Students | % Students |
| Nursery / Preschool | 88 | 2.1% |
| Kindergarten | 43 | 1.0% |
| Elementary School | 216 | 5.1% |
| Middle School | 257 | 6.0% |
| High School | 145 | 3.4% |
| College / Undergraduate | 3,182 | 74.6% |
| Graduate / Professional | 334 | 7.8% |
| Total | 4,265 | 100.0% |
School Enrollment by Age by Funding Source in Big Rapids
Out of a total of 4,265 students who are enrolled in schools in Big Rapids, 337 (7.9%) attend a private institution, while the remaining 3,928 (92.1%) are enrolled in public schools. The age group of 5 to 9 year old has the highest likelihood of being enrolled in private schools, with 36 (13.6% in the age bracket) enrolled. Conversely, the age group of 3 to 4 year olds has the lowest likelihood of being enrolled in a private school, with 65 (100.0% in the age bracket) attending a public institution.
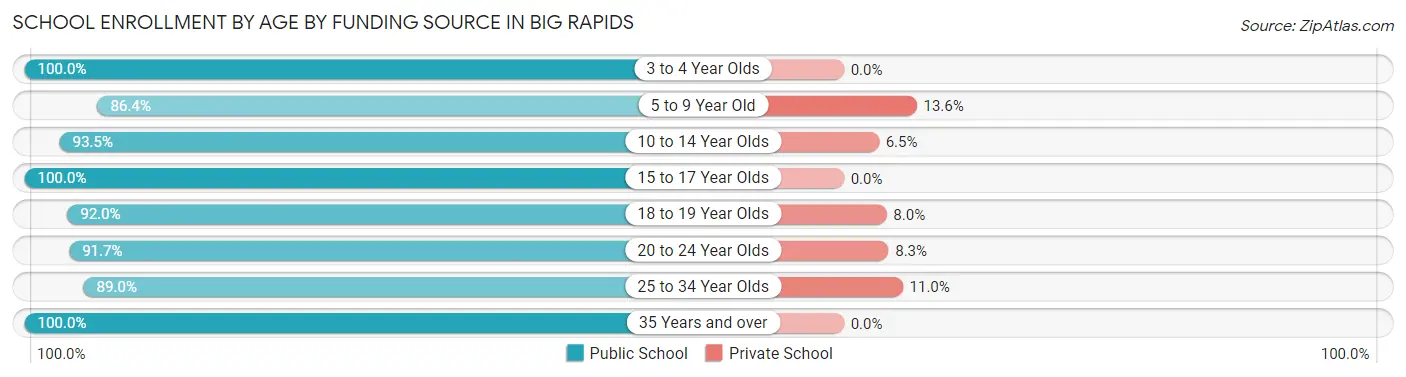
| Age Bracket | Public School | Private School |
| 3 to 4 Year Olds | 65 (100.0%) | 0 (0.0%) |
| 5 to 9 Year Old | 229 (86.4%) | 36 (13.6%) |
| 10 to 14 Year Olds | 301 (93.5%) | 21 (6.5%) |
| 15 to 17 Year Olds | 136 (100.0%) | 0 (0.0%) |
| 18 to 19 Year Olds | 995 (92.0%) | 86 (8.0%) |
| 20 to 24 Year Olds | 1,963 (91.7%) | 178 (8.3%) |
| 25 to 34 Year Olds | 146 (89.0%) | 18 (11.0%) |
| 35 Years and over | 91 (100.0%) | 0 (0.0%) |
| Total | 3,928 (92.1%) | 337 (7.9%) |
Educational Attainment by Field of Study in Big Rapids
Business (213 | 20.8%), education (128 | 12.5%), arts & humanities (117 | 11.5%), bio, nature & agricultural (101 | 9.9%), and communications (73 | 7.1%) are the most common fields of study among 1,022 individuals in Big Rapids who have obtained a bachelor's degree or higher.
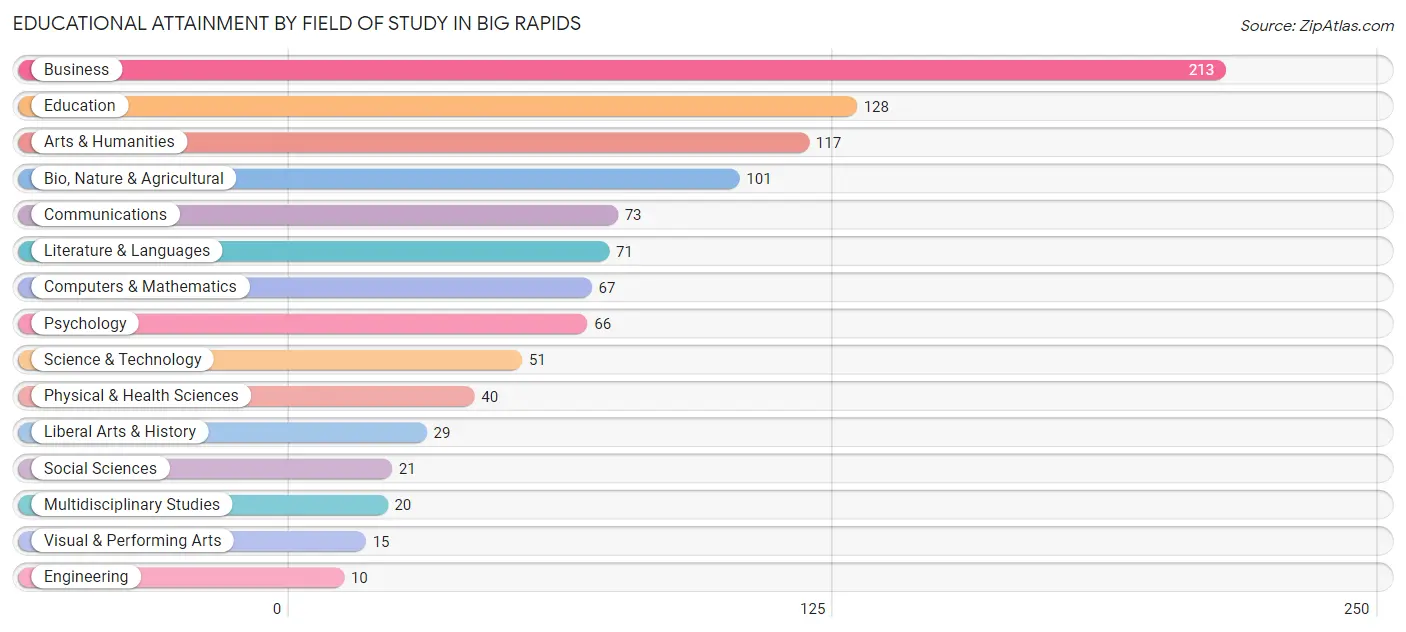
| Field of Study | # Graduates | % Graduates |
| Computers & Mathematics | 67 | 6.6% |
| Bio, Nature & Agricultural | 101 | 9.9% |
| Physical & Health Sciences | 40 | 3.9% |
| Psychology | 66 | 6.5% |
| Social Sciences | 21 | 2.1% |
| Engineering | 10 | 1.0% |
| Multidisciplinary Studies | 20 | 2.0% |
| Science & Technology | 51 | 5.0% |
| Business | 213 | 20.8% |
| Education | 128 | 12.5% |
| Literature & Languages | 71 | 7.0% |
| Liberal Arts & History | 29 | 2.8% |
| Visual & Performing Arts | 15 | 1.5% |
| Communications | 73 | 7.1% |
| Arts & Humanities | 117 | 11.5% |
| Total | 1,022 | 100.0% |
Transportation & Commute in Big Rapids
Vehicle Availability by Sex in Big Rapids
The most prevalent vehicle ownership categories in Big Rapids are males with 2 vehicles (796, accounting for 51.0%) and females with 2 vehicles (645, making up 54.8%).
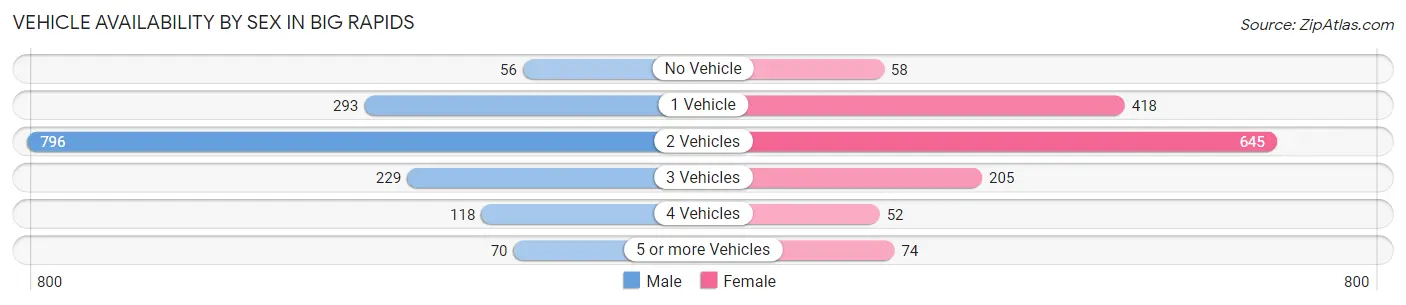
| Vehicles Available | Male | Female |
| No Vehicle | 56 (3.6%) | 58 (4.0%) |
| 1 Vehicle | 293 (18.8%) | 418 (28.8%) |
| 2 Vehicles | 796 (51.0%) | 645 (44.4%) |
| 3 Vehicles | 229 (14.7%) | 205 (14.1%) |
| 4 Vehicles | 118 (7.5%) | 52 (3.6%) |
| 5 or more Vehicles | 70 (4.5%) | 74 (5.1%) |
| Total | 1,562 (100.0%) | 1,452 (100.0%) |
Commute Time in Big Rapids
The most frequently occuring commute durations in Big Rapids are 5 to 9 minutes (1,110 commuters, 30.6%), 10 to 14 minutes (616 commuters, 17.0%), and less than 5 minutes (527 commuters, 14.5%).
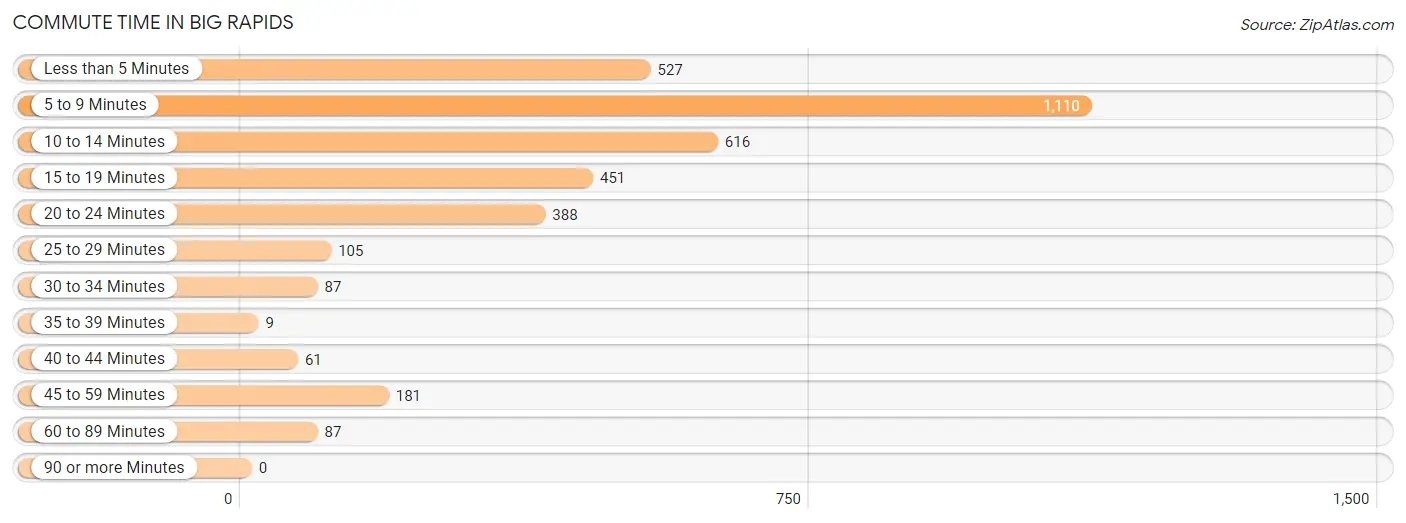
| Commute Time | # Commuters | % Commuters |
| Less than 5 Minutes | 527 | 14.5% |
| 5 to 9 Minutes | 1,110 | 30.6% |
| 10 to 14 Minutes | 616 | 17.0% |
| 15 to 19 Minutes | 451 | 12.4% |
| 20 to 24 Minutes | 388 | 10.7% |
| 25 to 29 Minutes | 105 | 2.9% |
| 30 to 34 Minutes | 87 | 2.4% |
| 35 to 39 Minutes | 9 | 0.3% |
| 40 to 44 Minutes | 61 | 1.7% |
| 45 to 59 Minutes | 181 | 5.0% |
| 60 to 89 Minutes | 87 | 2.4% |
| 90 or more Minutes | 0 | 0.0% |
Commute Time by Sex in Big Rapids
The most common commute times in Big Rapids are 5 to 9 minutes (641 commuters, 34.9%) for males and 5 to 9 minutes (469 commuters, 26.3%) for females.
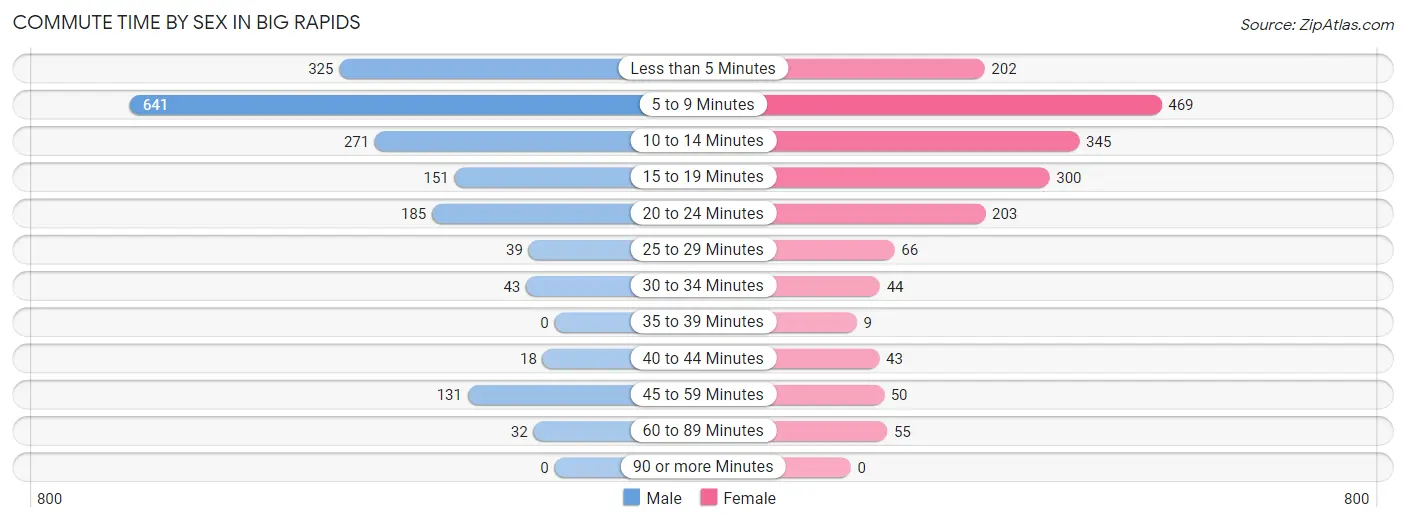
| Commute Time | Male | Female |
| Less than 5 Minutes | 325 (17.7%) | 202 (11.3%) |
| 5 to 9 Minutes | 641 (34.9%) | 469 (26.3%) |
| 10 to 14 Minutes | 271 (14.8%) | 345 (19.3%) |
| 15 to 19 Minutes | 151 (8.2%) | 300 (16.8%) |
| 20 to 24 Minutes | 185 (10.1%) | 203 (11.4%) |
| 25 to 29 Minutes | 39 (2.1%) | 66 (3.7%) |
| 30 to 34 Minutes | 43 (2.3%) | 44 (2.5%) |
| 35 to 39 Minutes | 0 (0.0%) | 9 (0.5%) |
| 40 to 44 Minutes | 18 (1.0%) | 43 (2.4%) |
| 45 to 59 Minutes | 131 (7.1%) | 50 (2.8%) |
| 60 to 89 Minutes | 32 (1.7%) | 55 (3.1%) |
| 90 or more Minutes | 0 (0.0%) | 0 (0.0%) |
Time of Departure to Work by Sex in Big Rapids
The most frequent times of departure to work in Big Rapids are 12:00 PM to 3:59 PM (345, 18.8%) for males and 12:00 PM to 3:59 PM (426, 23.8%) for females.
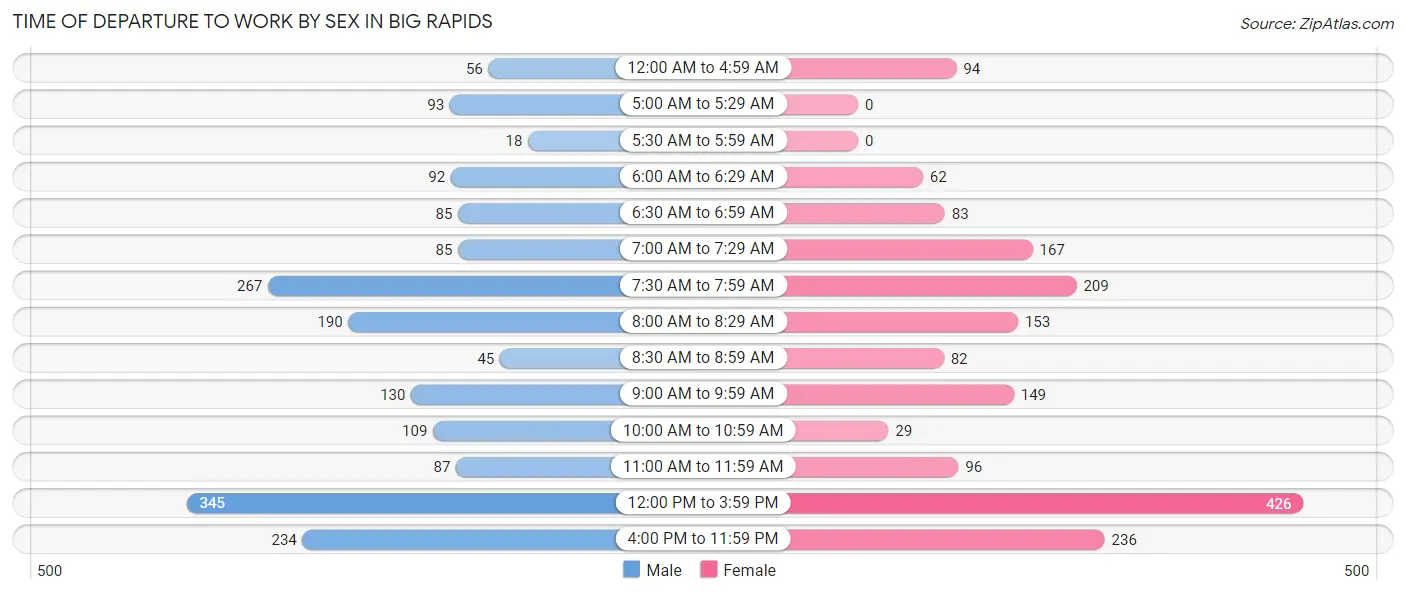
| Time of Departure | Male | Female |
| 12:00 AM to 4:59 AM | 56 (3.0%) | 94 (5.3%) |
| 5:00 AM to 5:29 AM | 93 (5.1%) | 0 (0.0%) |
| 5:30 AM to 5:59 AM | 18 (1.0%) | 0 (0.0%) |
| 6:00 AM to 6:29 AM | 92 (5.0%) | 62 (3.5%) |
| 6:30 AM to 6:59 AM | 85 (4.6%) | 83 (4.6%) |
| 7:00 AM to 7:29 AM | 85 (4.6%) | 167 (9.3%) |
| 7:30 AM to 7:59 AM | 267 (14.5%) | 209 (11.7%) |
| 8:00 AM to 8:29 AM | 190 (10.3%) | 153 (8.6%) |
| 8:30 AM to 8:59 AM | 45 (2.5%) | 82 (4.6%) |
| 9:00 AM to 9:59 AM | 130 (7.1%) | 149 (8.3%) |
| 10:00 AM to 10:59 AM | 109 (5.9%) | 29 (1.6%) |
| 11:00 AM to 11:59 AM | 87 (4.7%) | 96 (5.4%) |
| 12:00 PM to 3:59 PM | 345 (18.8%) | 426 (23.8%) |
| 4:00 PM to 11:59 PM | 234 (12.8%) | 236 (13.2%) |
| Total | 1,836 (100.0%) | 1,786 (100.0%) |
Housing Occupancy in Big Rapids
Occupancy by Ownership in Big Rapids
Of the total 2,628 dwellings in Big Rapids, owner-occupied units account for 1,069 (40.7%), while renter-occupied units make up 1,559 (59.3%).
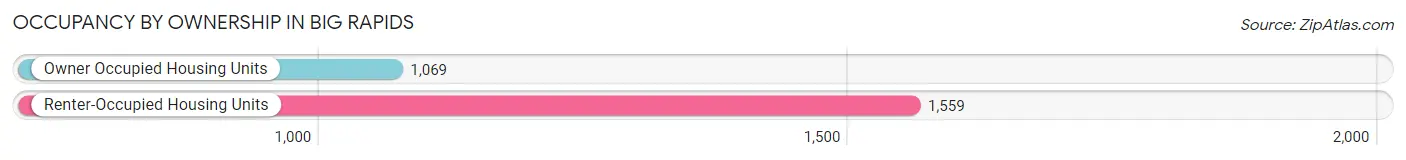
| Occupancy | # Housing Units | % Housing Units |
| Owner Occupied Housing Units | 1,069 | 40.7% |
| Renter-Occupied Housing Units | 1,559 | 59.3% |
| Total Occupied Housing Units | 2,628 | 100.0% |
Occupancy by Household Size in Big Rapids
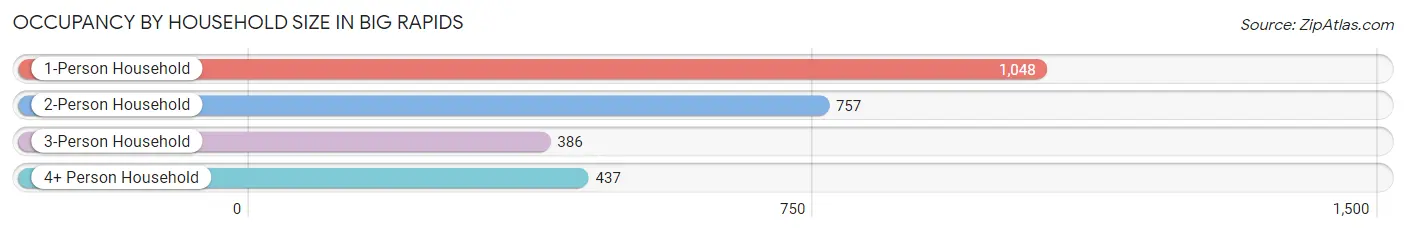
| Household Size | # Housing Units | % Housing Units |
| 1-Person Household | 1,048 | 39.9% |
| 2-Person Household | 757 | 28.8% |
| 3-Person Household | 386 | 14.7% |
| 4+ Person Household | 437 | 16.6% |
| Total Housing Units | 2,628 | 100.0% |
Occupancy by Ownership by Household Size in Big Rapids
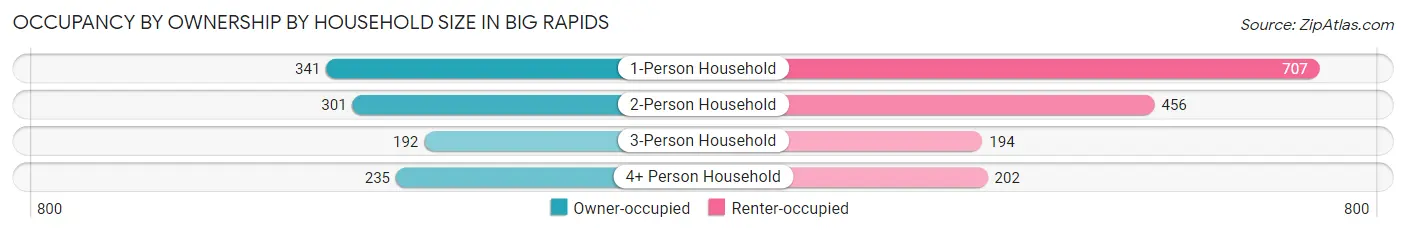
| Household Size | Owner-occupied | Renter-occupied |
| 1-Person Household | 341 (32.5%) | 707 (67.5%) |
| 2-Person Household | 301 (39.8%) | 456 (60.2%) |
| 3-Person Household | 192 (49.7%) | 194 (50.3%) |
| 4+ Person Household | 235 (53.8%) | 202 (46.2%) |
| Total Housing Units | 1,069 (40.7%) | 1,559 (59.3%) |
Occupancy by Educational Attainment in Big Rapids
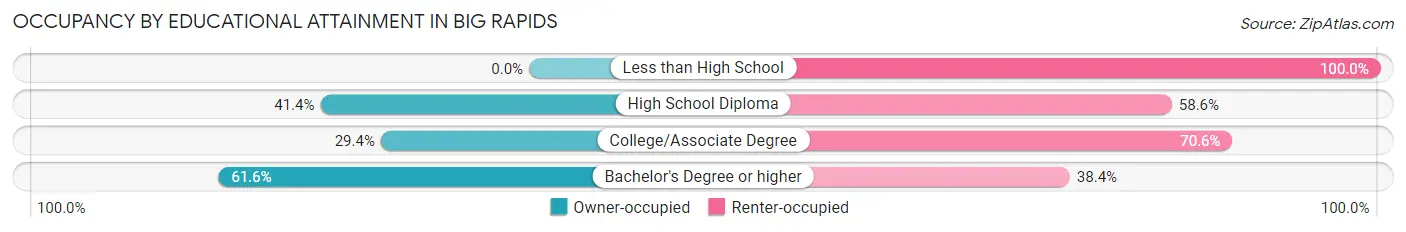
| Household Size | Owner-occupied | Renter-occupied |
| Less than High School | 0 (0.0%) | 76 (100.0%) |
| High School Diploma | 305 (41.4%) | 432 (58.6%) |
| College/Associate Degree | 323 (29.4%) | 776 (70.6%) |
| Bachelor's Degree or higher | 441 (61.6%) | 275 (38.4%) |
Occupancy by Age of Householder in Big Rapids
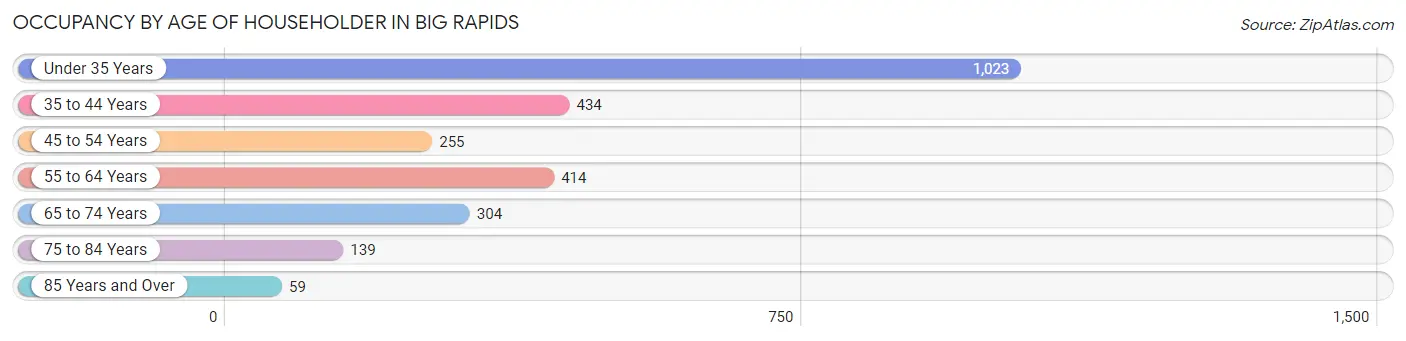
| Age Bracket | # Households | % Households |
| Under 35 Years | 1,023 | 38.9% |
| 35 to 44 Years | 434 | 16.5% |
| 45 to 54 Years | 255 | 9.7% |
| 55 to 64 Years | 414 | 15.8% |
| 65 to 74 Years | 304 | 11.6% |
| 75 to 84 Years | 139 | 5.3% |
| 85 Years and Over | 59 | 2.2% |
| Total | 2,628 | 100.0% |
Housing Finances in Big Rapids
Median Income by Occupancy in Big Rapids
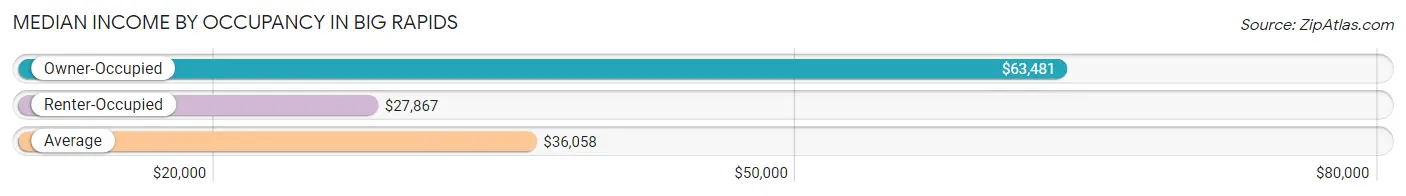
| Occupancy Type | # Households | Median Income |
| Owner-Occupied | 1,069 (40.7%) | $63,481 |
| Renter-Occupied | 1,559 (59.3%) | $27,867 |
| Average | 2,628 (100.0%) | $36,058 |
Occupancy by Householder Income Bracket in Big Rapids
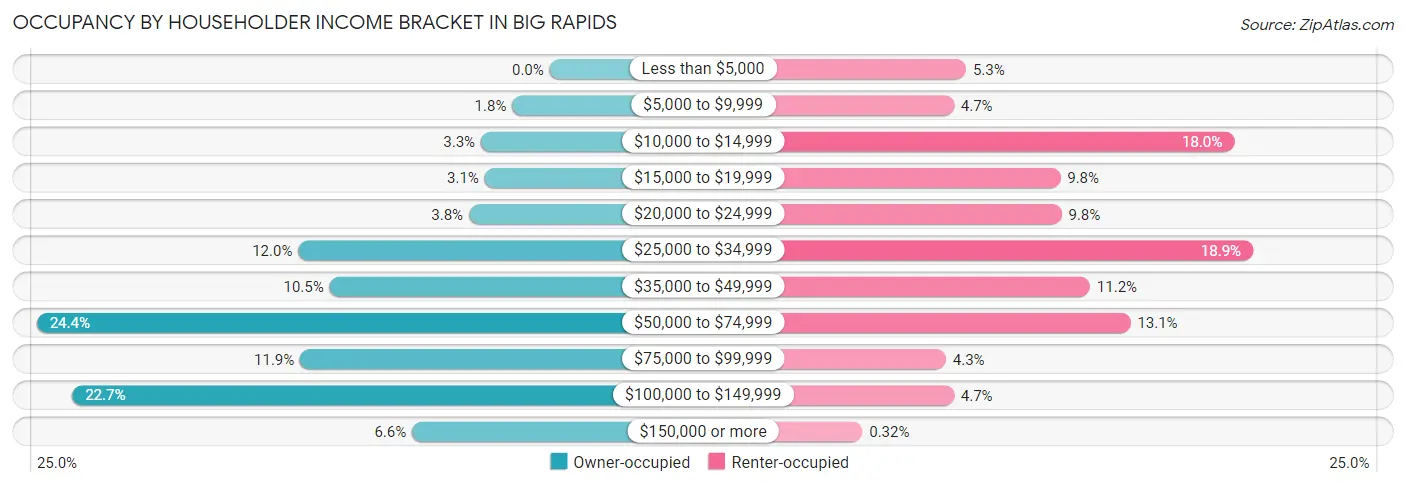
| Income Bracket | Owner-occupied | Renter-occupied |
| Less than $5,000 | 0 (0.0%) | 82 (5.3%) |
| $5,000 to $9,999 | 19 (1.8%) | 73 (4.7%) |
| $10,000 to $14,999 | 35 (3.3%) | 281 (18.0%) |
| $15,000 to $19,999 | 33 (3.1%) | 152 (9.8%) |
| $20,000 to $24,999 | 41 (3.8%) | 153 (9.8%) |
| $25,000 to $34,999 | 128 (12.0%) | 295 (18.9%) |
| $35,000 to $49,999 | 112 (10.5%) | 174 (11.2%) |
| $50,000 to $74,999 | 261 (24.4%) | 204 (13.1%) |
| $75,000 to $99,999 | 127 (11.9%) | 67 (4.3%) |
| $100,000 to $149,999 | 243 (22.7%) | 73 (4.7%) |
| $150,000 or more | 70 (6.6%) | 5 (0.3%) |
| Total | 1,069 (100.0%) | 1,559 (100.0%) |
Monthly Housing Cost Tiers in Big Rapids
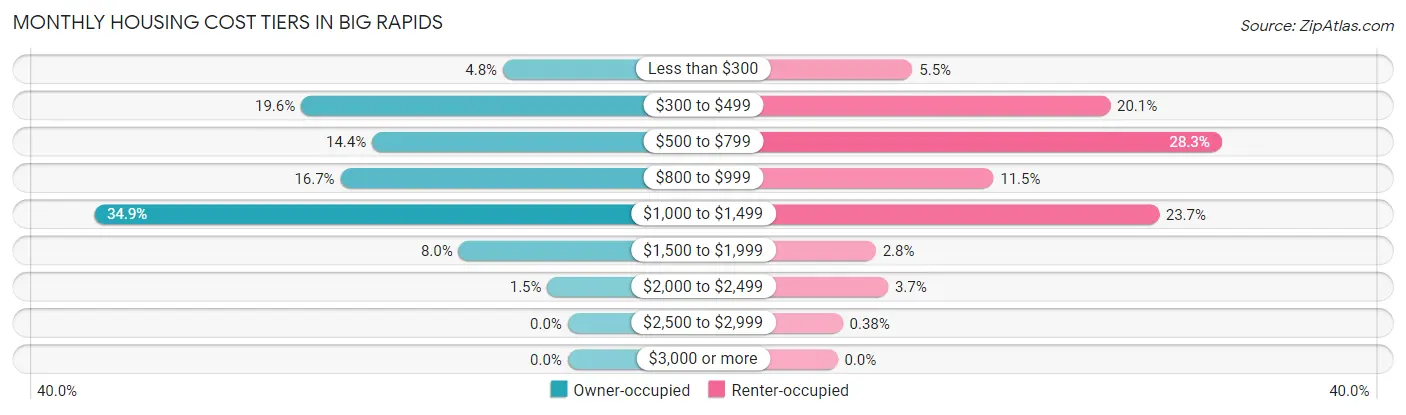
| Monthly Cost | Owner-occupied | Renter-occupied |
| Less than $300 | 51 (4.8%) | 86 (5.5%) |
| $300 to $499 | 210 (19.6%) | 313 (20.1%) |
| $500 to $799 | 154 (14.4%) | 441 (28.3%) |
| $800 to $999 | 179 (16.7%) | 179 (11.5%) |
| $1,000 to $1,499 | 373 (34.9%) | 369 (23.7%) |
| $1,500 to $1,999 | 86 (8.0%) | 44 (2.8%) |
| $2,000 to $2,499 | 16 (1.5%) | 58 (3.7%) |
| $2,500 to $2,999 | 0 (0.0%) | 6 (0.4%) |
| $3,000 or more | 0 (0.0%) | 0 (0.0%) |
| Total | 1,069 (100.0%) | 1,559 (100.0%) |
Physical Housing Characteristics in Big Rapids
Housing Structures in Big Rapids
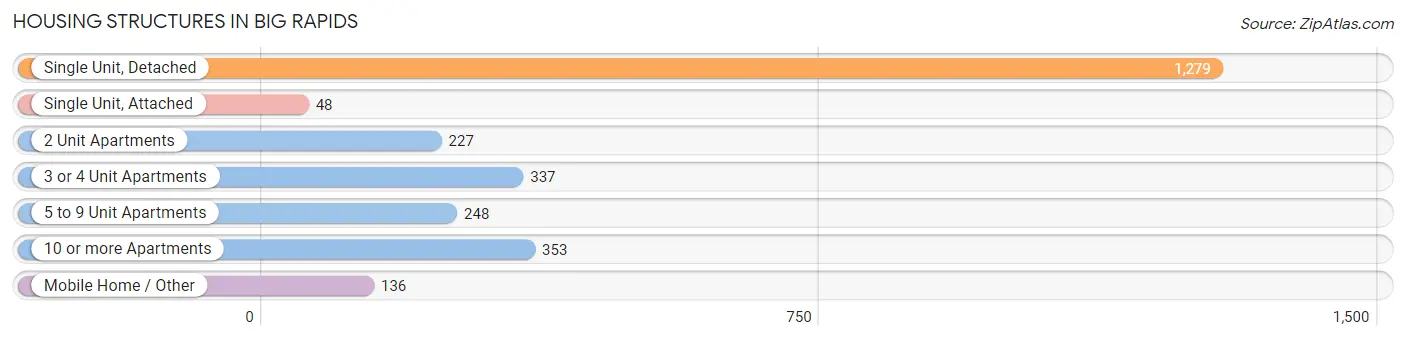
| Structure Type | # Housing Units | % Housing Units |
| Single Unit, Detached | 1,279 | 48.7% |
| Single Unit, Attached | 48 | 1.8% |
| 2 Unit Apartments | 227 | 8.6% |
| 3 or 4 Unit Apartments | 337 | 12.8% |
| 5 to 9 Unit Apartments | 248 | 9.4% |
| 10 or more Apartments | 353 | 13.4% |
| Mobile Home / Other | 136 | 5.2% |
| Total | 2,628 | 100.0% |
Housing Structures by Occupancy in Big Rapids
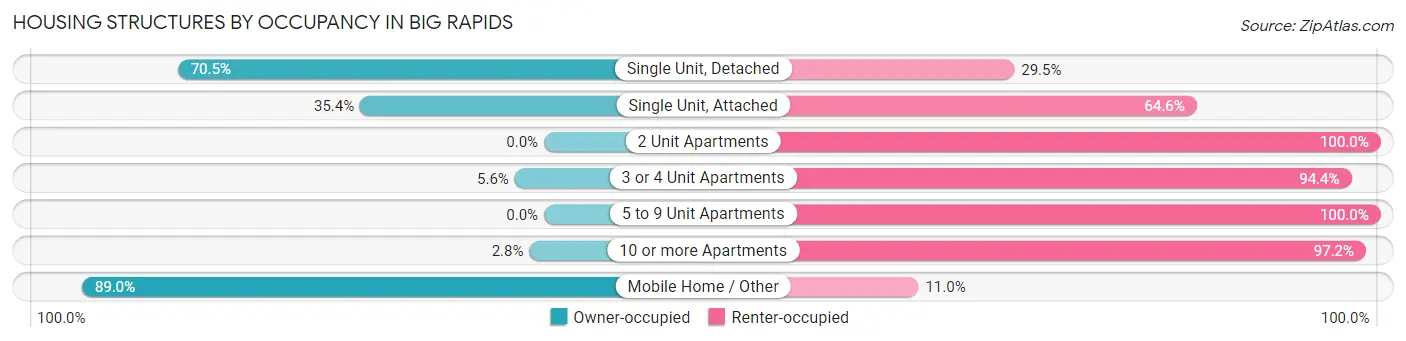
| Structure Type | Owner-occupied | Renter-occupied |
| Single Unit, Detached | 902 (70.5%) | 377 (29.5%) |
| Single Unit, Attached | 17 (35.4%) | 31 (64.6%) |
| 2 Unit Apartments | 0 (0.0%) | 227 (100.0%) |
| 3 or 4 Unit Apartments | 19 (5.6%) | 318 (94.4%) |
| 5 to 9 Unit Apartments | 0 (0.0%) | 248 (100.0%) |
| 10 or more Apartments | 10 (2.8%) | 343 (97.2%) |
| Mobile Home / Other | 121 (89.0%) | 15 (11.0%) |
| Total | 1,069 (40.7%) | 1,559 (59.3%) |
Housing Structures by Number of Rooms in Big Rapids
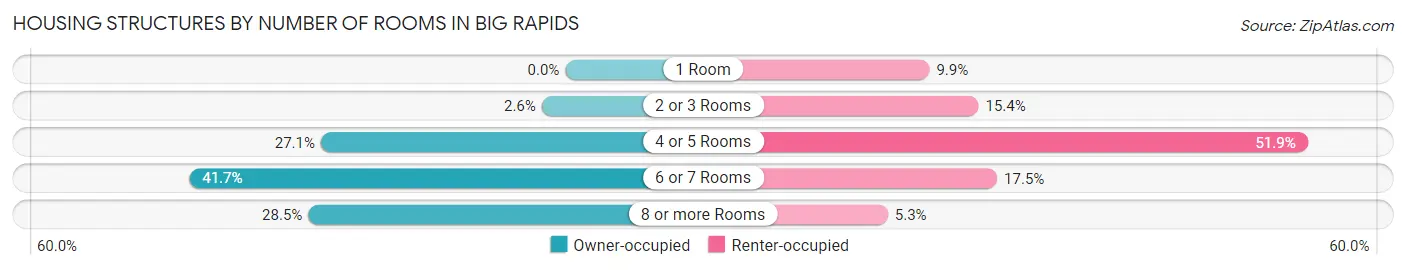
| Number of Rooms | Owner-occupied | Renter-occupied |
| 1 Room | 0 (0.0%) | 155 (9.9%) |
| 2 or 3 Rooms | 28 (2.6%) | 240 (15.4%) |
| 4 or 5 Rooms | 290 (27.1%) | 809 (51.9%) |
| 6 or 7 Rooms | 446 (41.7%) | 272 (17.4%) |
| 8 or more Rooms | 305 (28.5%) | 83 (5.3%) |
| Total | 1,069 (100.0%) | 1,559 (100.0%) |
Housing Structure by Heating Type in Big Rapids
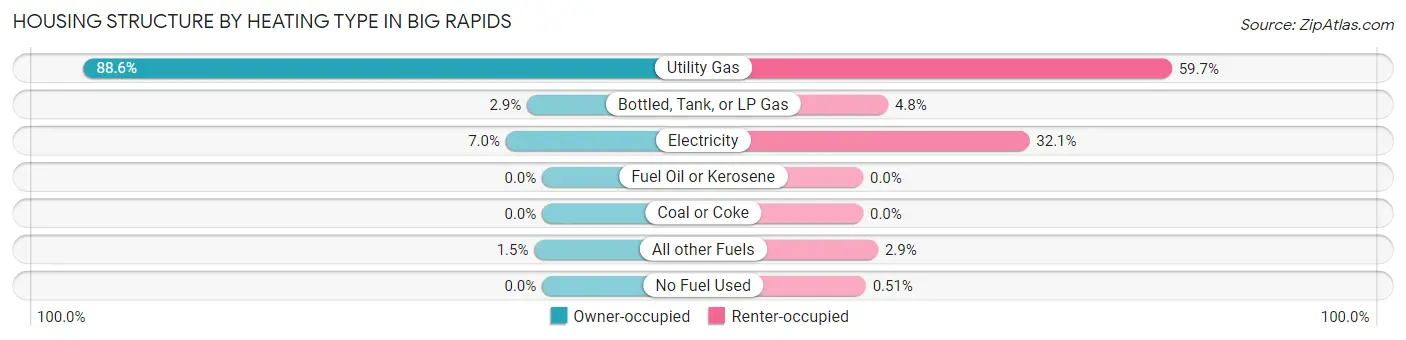
| Heating Type | Owner-occupied | Renter-occupied |
| Utility Gas | 947 (88.6%) | 930 (59.7%) |
| Bottled, Tank, or LP Gas | 31 (2.9%) | 75 (4.8%) |
| Electricity | 75 (7.0%) | 501 (32.1%) |
| Fuel Oil or Kerosene | 0 (0.0%) | 0 (0.0%) |
| Coal or Coke | 0 (0.0%) | 0 (0.0%) |
| All other Fuels | 16 (1.5%) | 45 (2.9%) |
| No Fuel Used | 0 (0.0%) | 8 (0.5%) |
| Total | 1,069 (100.0%) | 1,559 (100.0%) |
Household Vehicle Usage in Big Rapids
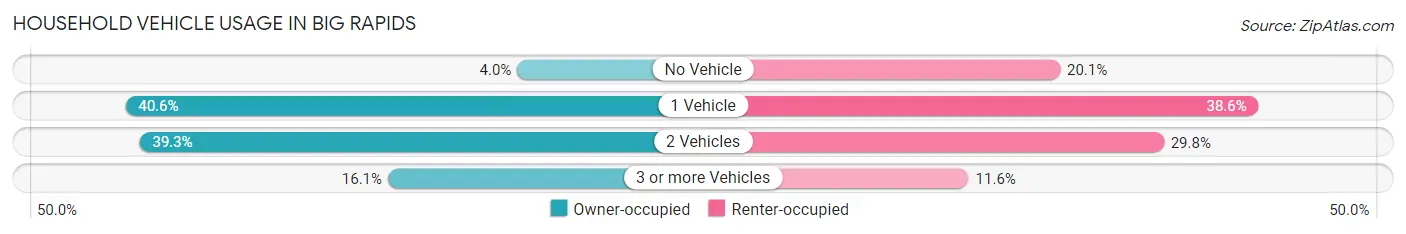
| Vehicles per Household | Owner-occupied | Renter-occupied |
| No Vehicle | 43 (4.0%) | 313 (20.1%) |
| 1 Vehicle | 434 (40.6%) | 602 (38.6%) |
| 2 Vehicles | 420 (39.3%) | 464 (29.8%) |
| 3 or more Vehicles | 172 (16.1%) | 180 (11.6%) |
| Total | 1,069 (100.0%) | 1,559 (100.0%) |
Real Estate & Mortgages in Big Rapids
Real Estate and Mortgage Overview in Big Rapids
| Characteristic | Without Mortgage | With Mortgage |
| Housing Units | 337 | 732 |
| Median Property Value | $78,900 | $139,900 |
| Median Household Income | $40,250 | $53 |
| Monthly Housing Costs | $420 | $0 |
| Real Estate Taxes | $1,933 | $17 |
Property Value by Mortgage Status in Big Rapids
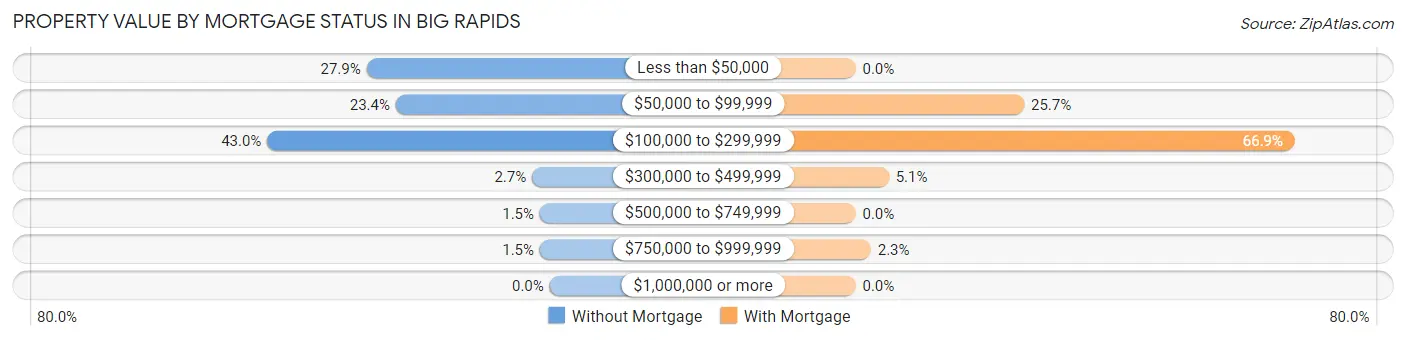
| Property Value | Without Mortgage | With Mortgage |
| Less than $50,000 | 94 (27.9%) | 0 (0.0%) |
| $50,000 to $99,999 | 79 (23.4%) | 188 (25.7%) |
| $100,000 to $299,999 | 145 (43.0%) | 490 (66.9%) |
| $300,000 to $499,999 | 9 (2.7%) | 37 (5.1%) |
| $500,000 to $749,999 | 5 (1.5%) | 0 (0.0%) |
| $750,000 to $999,999 | 5 (1.5%) | 17 (2.3%) |
| $1,000,000 or more | 0 (0.0%) | 0 (0.0%) |
| Total | 337 (100.0%) | 732 (100.0%) |
Household Income by Mortgage Status in Big Rapids
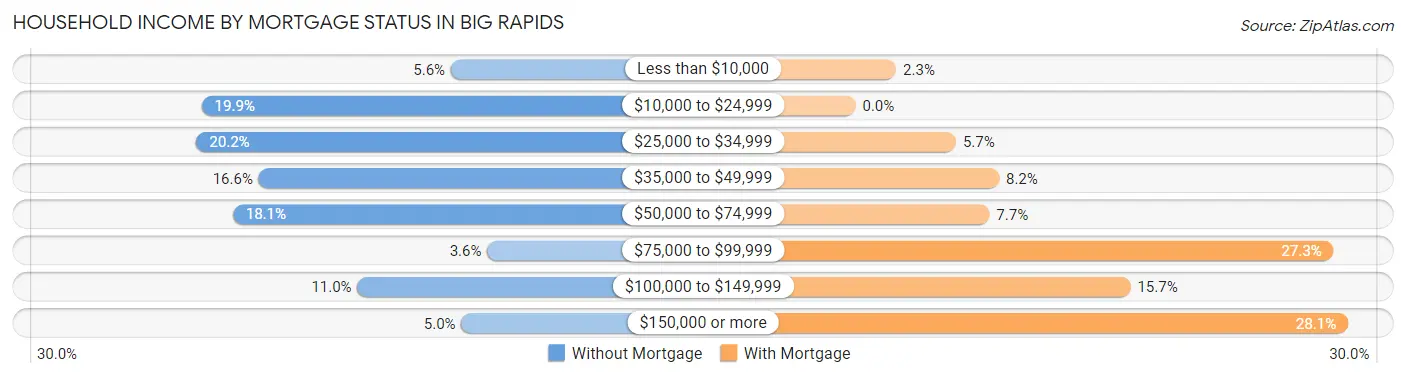
| Household Income | Without Mortgage | With Mortgage |
| Less than $10,000 | 19 (5.6%) | 17 (2.3%) |
| $10,000 to $24,999 | 67 (19.9%) | 0 (0.0%) |
| $25,000 to $34,999 | 68 (20.2%) | 42 (5.7%) |
| $35,000 to $49,999 | 56 (16.6%) | 60 (8.2%) |
| $50,000 to $74,999 | 61 (18.1%) | 56 (7.6%) |
| $75,000 to $99,999 | 12 (3.6%) | 200 (27.3%) |
| $100,000 to $149,999 | 37 (11.0%) | 115 (15.7%) |
| $150,000 or more | 17 (5.0%) | 206 (28.1%) |
| Total | 337 (100.0%) | 732 (100.0%) |
Property Value to Household Income Ratio in Big Rapids
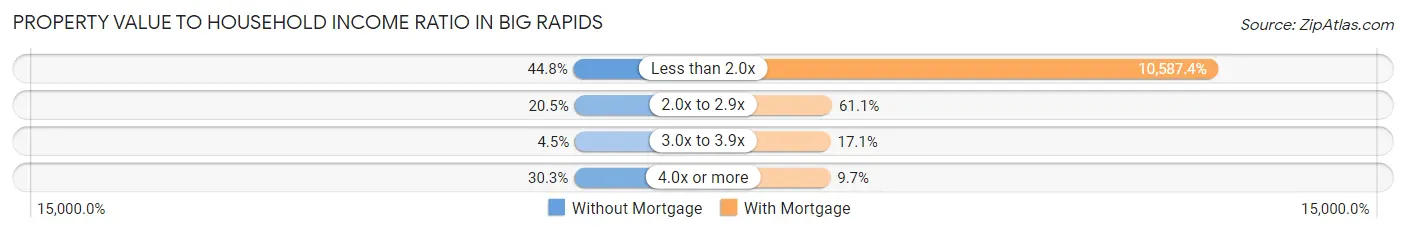
| Value-to-Income Ratio | Without Mortgage | With Mortgage |
| Less than 2.0x | 151 (44.8%) | 77,500 (10,587.4%) |
| 2.0x to 2.9x | 69 (20.5%) | 447 (61.1%) |
| 3.0x to 3.9x | 15 (4.4%) | 125 (17.1%) |
| 4.0x or more | 102 (30.3%) | 71 (9.7%) |
| Total | 337 (100.0%) | 732 (100.0%) |
Real Estate Taxes by Mortgage Status in Big Rapids
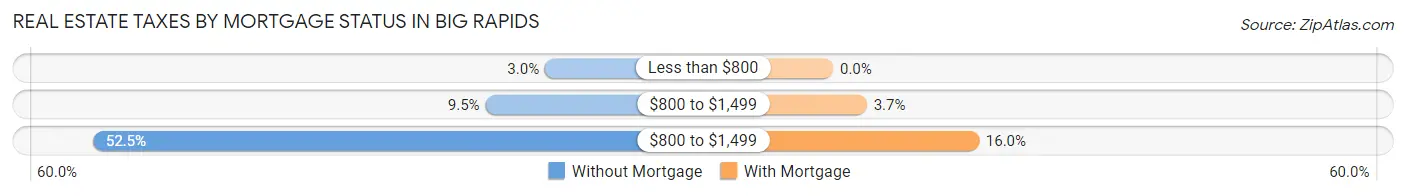
| Property Taxes | Without Mortgage | With Mortgage |
| Less than $800 | 10 (3.0%) | 0 (0.0%) |
| $800 to $1,499 | 32 (9.5%) | 27 (3.7%) |
| $800 to $1,499 | 177 (52.5%) | 117 (16.0%) |
| Total | 337 (100.0%) | 732 (100.0%) |
Health & Disability in Big Rapids
Health Insurance Coverage by Age in Big Rapids
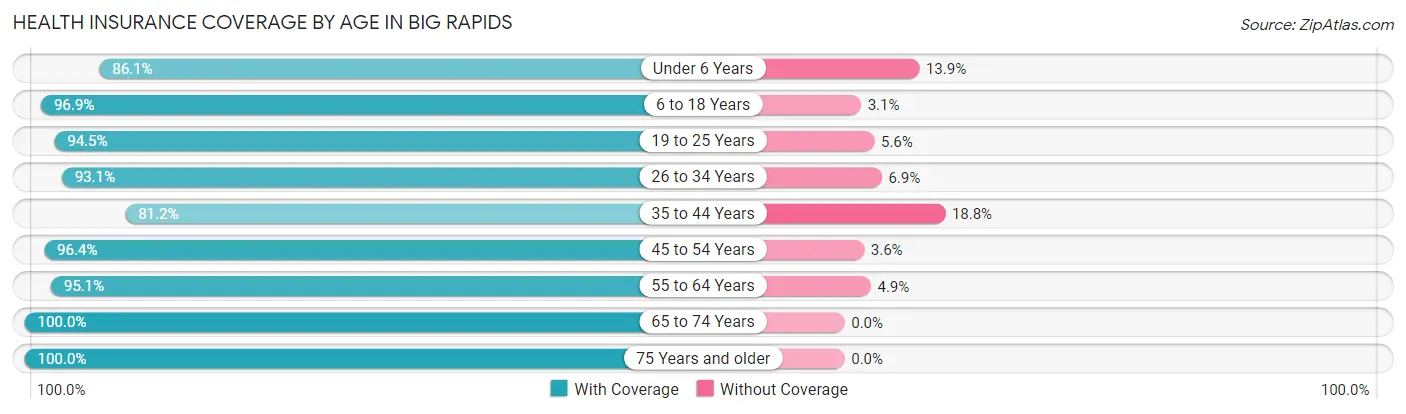
| Age Bracket | With Coverage | Without Coverage |
| Under 6 Years | 278 (86.1%) | 45 (13.9%) |
| 6 to 18 Years | 1,171 (96.9%) | 37 (3.1%) |
| 19 to 25 Years | 3,150 (94.5%) | 185 (5.6%) |
| 26 to 34 Years | 551 (93.1%) | 41 (6.9%) |
| 35 to 44 Years | 580 (81.2%) | 134 (18.8%) |
| 45 to 54 Years | 423 (96.4%) | 16 (3.6%) |
| 55 to 64 Years | 506 (95.1%) | 26 (4.9%) |
| 65 to 74 Years | 400 (100.0%) | 0 (0.0%) |
| 75 Years and older | 214 (100.0%) | 0 (0.0%) |
| Total | 7,273 (93.8%) | 484 (6.2%) |
Health Insurance Coverage by Citizenship Status in Big Rapids
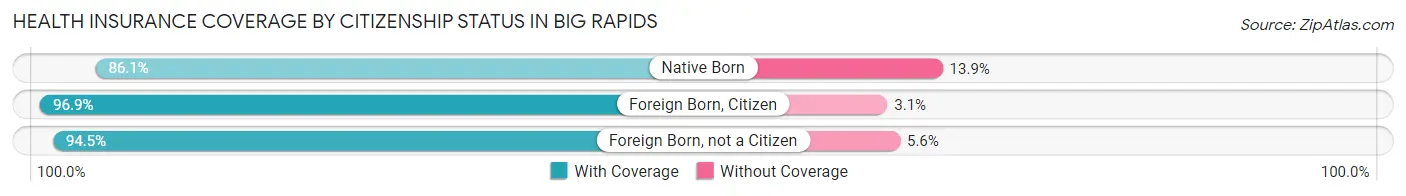
| Citizenship Status | With Coverage | Without Coverage |
| Native Born | 278 (86.1%) | 45 (13.9%) |
| Foreign Born, Citizen | 1,171 (96.9%) | 37 (3.1%) |
| Foreign Born, not a Citizen | 3,150 (94.5%) | 185 (5.6%) |
Health Insurance Coverage by Household Income in Big Rapids
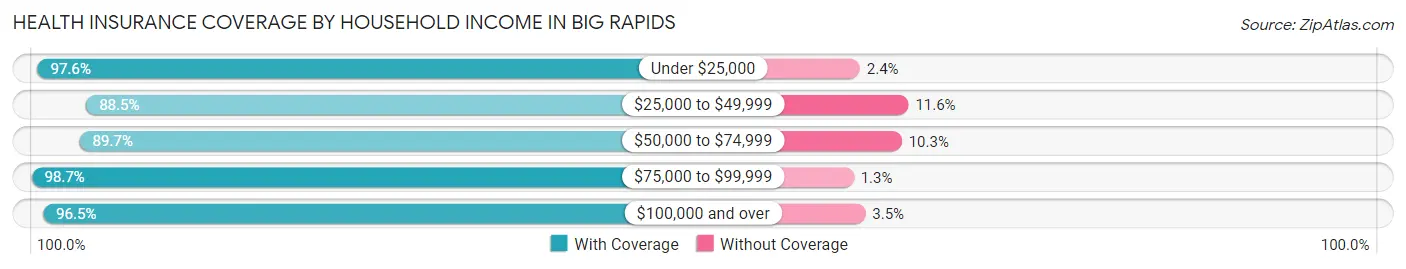
| Household Income | With Coverage | Without Coverage |
| Under $25,000 | 1,401 (97.6%) | 35 (2.4%) |
| $25,000 to $49,999 | 1,240 (88.4%) | 162 (11.6%) |
| $50,000 to $74,999 | 1,133 (89.7%) | 130 (10.3%) |
| $75,000 to $99,999 | 610 (98.7%) | 8 (1.3%) |
| $100,000 and over | 915 (96.5%) | 33 (3.5%) |
Public vs Private Health Insurance Coverage by Age in Big Rapids
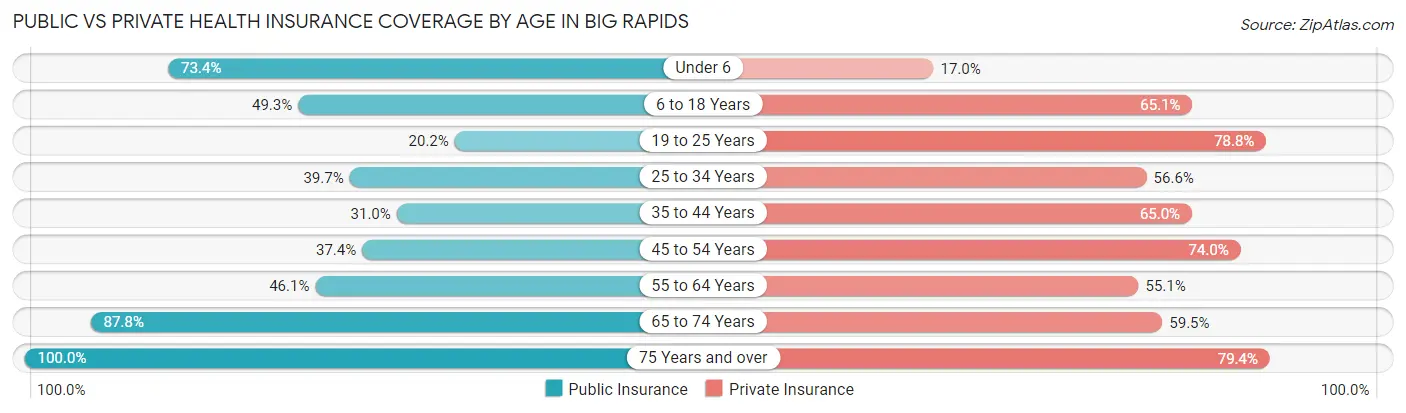
| Age Bracket | Public Insurance | Private Insurance |
| Under 6 | 237 (73.4%) | 55 (17.0%) |
| 6 to 18 Years | 595 (49.2%) | 786 (65.1%) |
| 19 to 25 Years | 673 (20.2%) | 2,627 (78.8%) |
| 25 to 34 Years | 235 (39.7%) | 335 (56.6%) |
| 35 to 44 Years | 221 (30.9%) | 464 (65.0%) |
| 45 to 54 Years | 164 (37.4%) | 325 (74.0%) |
| 55 to 64 Years | 245 (46.1%) | 293 (55.1%) |
| 65 to 74 Years | 351 (87.7%) | 238 (59.5%) |
| 75 Years and over | 214 (100.0%) | 170 (79.4%) |
| Total | 2,935 (37.8%) | 5,293 (68.2%) |
Disability Status by Sex by Age in Big Rapids
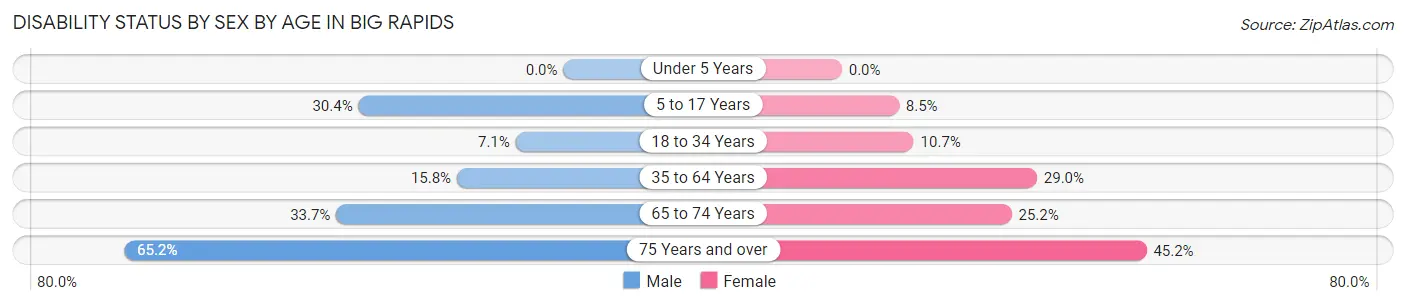
| Age Bracket | Male | Female |
| Under 5 Years | 0 (0.0%) | 0 (0.0%) |
| 5 to 17 Years | 87 (30.4%) | 41 (8.5%) |
| 18 to 34 Years | 184 (7.1%) | 197 (10.7%) |
| 35 to 64 Years | 137 (15.8%) | 237 (29.0%) |
| 65 to 74 Years | 56 (33.7%) | 59 (25.2%) |
| 75 Years and over | 30 (65.2%) | 76 (45.2%) |
Disability Class by Sex by Age in Big Rapids
Disability Class: Hearing Difficulty
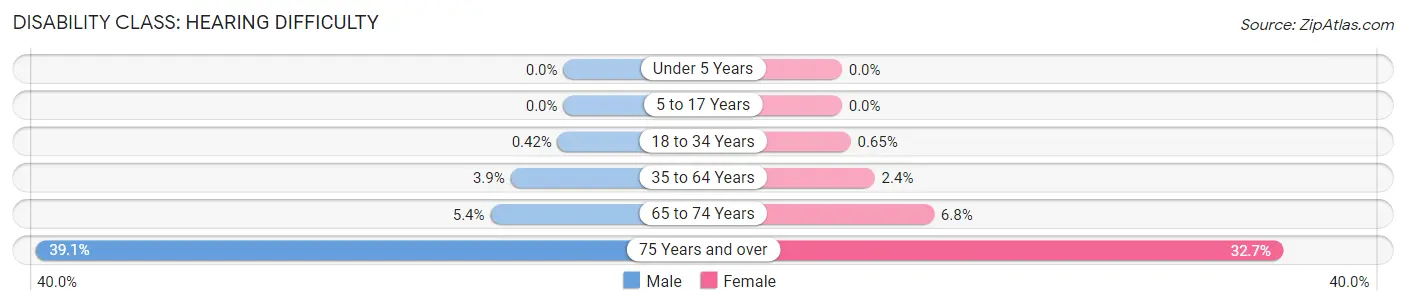
| Age Bracket | Male | Female |
| Under 5 Years | 0 (0.0%) | 0 (0.0%) |
| 5 to 17 Years | 0 (0.0%) | 0 (0.0%) |
| 18 to 34 Years | 11 (0.4%) | 12 (0.6%) |
| 35 to 64 Years | 34 (3.9%) | 20 (2.4%) |
| 65 to 74 Years | 9 (5.4%) | 16 (6.8%) |
| 75 Years and over | 18 (39.1%) | 55 (32.7%) |
Disability Class: Vision Difficulty
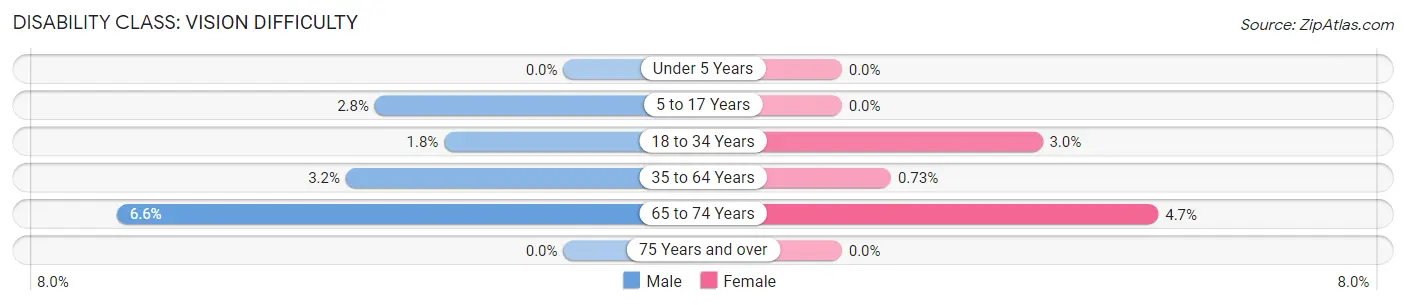
| Age Bracket | Male | Female |
| Under 5 Years | 0 (0.0%) | 0 (0.0%) |
| 5 to 17 Years | 8 (2.8%) | 0 (0.0%) |
| 18 to 34 Years | 46 (1.8%) | 55 (3.0%) |
| 35 to 64 Years | 28 (3.2%) | 6 (0.7%) |
| 65 to 74 Years | 11 (6.6%) | 11 (4.7%) |
| 75 Years and over | 0 (0.0%) | 0 (0.0%) |
Disability Class: Cognitive Difficulty
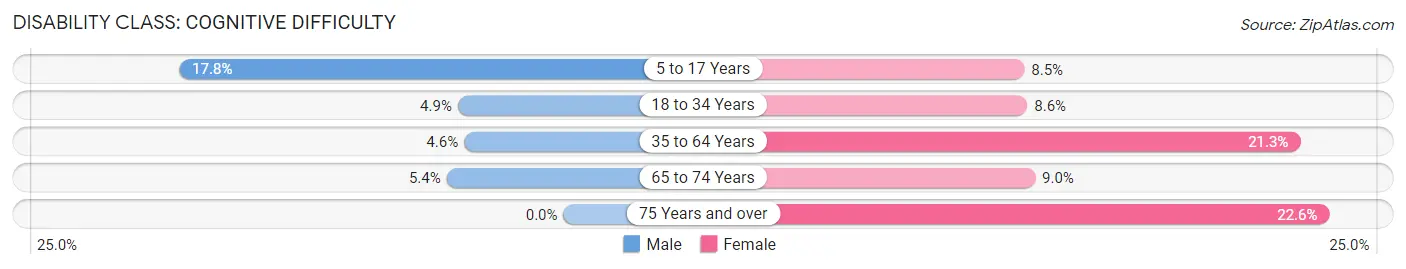
| Age Bracket | Male | Female |
| 5 to 17 Years | 51 (17.8%) | 41 (8.5%) |
| 18 to 34 Years | 127 (4.9%) | 159 (8.6%) |
| 35 to 64 Years | 40 (4.6%) | 174 (21.3%) |
| 65 to 74 Years | 9 (5.4%) | 21 (9.0%) |
| 75 Years and over | 0 (0.0%) | 38 (22.6%) |
Disability Class: Ambulatory Difficulty
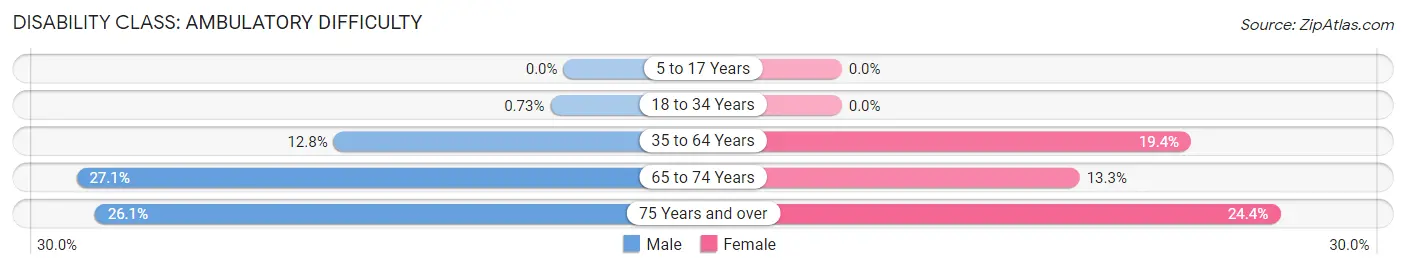
| Age Bracket | Male | Female |
| 5 to 17 Years | 0 (0.0%) | 0 (0.0%) |
| 18 to 34 Years | 19 (0.7%) | 0 (0.0%) |
| 35 to 64 Years | 111 (12.8%) | 159 (19.4%) |
| 65 to 74 Years | 45 (27.1%) | 31 (13.3%) |
| 75 Years and over | 12 (26.1%) | 41 (24.4%) |
Disability Class: Self-Care Difficulty
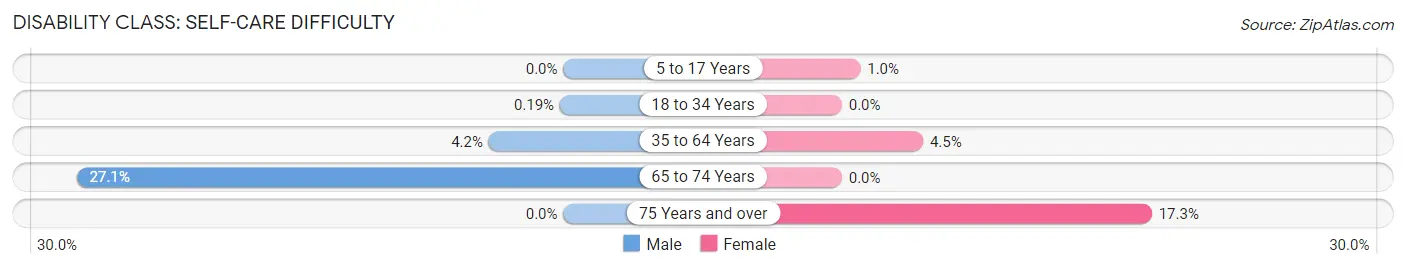
| Age Bracket | Male | Female |
| 5 to 17 Years | 0 (0.0%) | 5 (1.0%) |
| 18 to 34 Years | 5 (0.2%) | 0 (0.0%) |
| 35 to 64 Years | 36 (4.2%) | 37 (4.5%) |
| 65 to 74 Years | 45 (27.1%) | 0 (0.0%) |
| 75 Years and over | 0 (0.0%) | 29 (17.3%) |
Technology Access in Big Rapids
Computing Device Access in Big Rapids
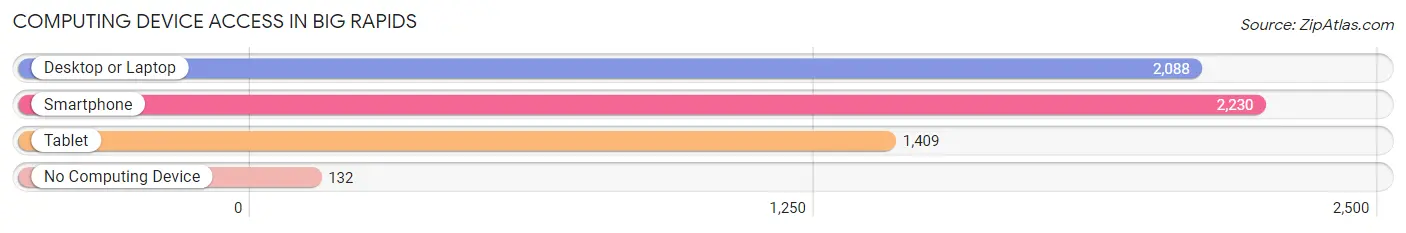
| Device Type | # Households | % Households |
| Desktop or Laptop | 2,088 | 79.4% |
| Smartphone | 2,230 | 84.9% |
| Tablet | 1,409 | 53.6% |
| No Computing Device | 132 | 5.0% |
| Total | 2,628 | 100.0% |
Internet Access in Big Rapids
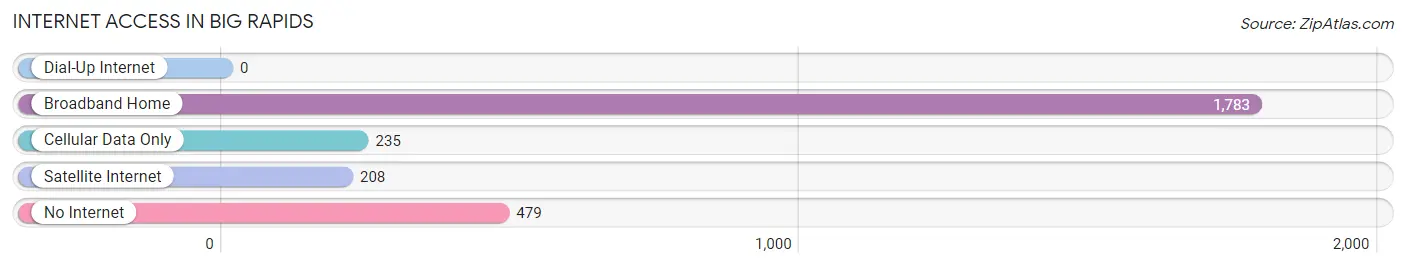
| Internet Type | # Households | % Households |
| Dial-Up Internet | 0 | 0.0% |
| Broadband Home | 1,783 | 67.8% |
| Cellular Data Only | 235 | 8.9% |
| Satellite Internet | 208 | 7.9% |
| No Internet | 479 | 18.2% |
| Total | 2,628 | 100.0% |
Big Rapids Summary
History
Big Rapids, Michigan is a city located in Mecosta County, Michigan. It is the county seat of Mecosta County and is located on the Muskegon River. The city was founded in 1855 by George French and was originally named Leonard. The city was renamed Big Rapids in 1859 due to its location at the rapids of the Muskegon River.
Big Rapids was an important stop on the Grand Rapids and Indiana Railroad, which was built in 1867. The railroad connected Big Rapids to Grand Rapids and other cities in Michigan. The railroad was an important factor in the growth of the city, as it allowed for the transportation of goods and people.
The city was also an important stop on the Pere Marquette Railroad, which was built in 1871. This railroad connected Big Rapids to other cities in Michigan, as well as Chicago and other cities in the Midwest.
The city was also an important stop on the Michigan Central Railroad, which was built in 1881. This railroad connected Big Rapids to other cities in Michigan, as well as Detroit and other cities in the Midwest.
The city was also an important stop on the Detroit, Grand Haven and Milwaukee Railroad, which was built in 1883. This railroad connected Big Rapids to other cities in Michigan, as well as Milwaukee and other cities in the Midwest.
The city was also an important stop on the Chicago and West Michigan Railway, which was built in 1887. This railroad connected Big Rapids to other cities in Michigan, as well as Chicago and other cities in the Midwest.
The city was also an important stop on the Detroit, Lansing and Northern Railroad, which was built in 1891. This railroad connected Big Rapids to other cities in Michigan, as well as Detroit and other cities in the Midwest.
The city was also an important stop on the Grand Rapids and Indiana Railroad, which was built in 1895. This railroad connected Big Rapids to other cities in Michigan, as well as Grand Rapids and other cities in the Midwest.
The city was also an important stop on the Michigan Air Line Railroad, which was built in 1901. This railroad connected Big Rapids to other cities in Michigan, as well as Detroit and other cities in the Midwest.
The city was also an important stop on the Grand Trunk Western Railroad, which was built in 1903. This railroad connected Big Rapids to other cities in Michigan, as well as Chicago and other cities in the Midwest.
Geography
Big Rapids is located in the central part of Michigan, in Mecosta County. The city is situated on the Muskegon River, which is a tributary of the Grand River. The city is located approximately 40 miles north of Grand Rapids and approximately 80 miles east of Lansing.
The city has a total area of 5.3 square miles, of which 5.2 square miles is land and 0.1 square miles is water. The city is located at an elevation of 845 feet above sea level.
The climate in Big Rapids is classified as humid continental, with warm summers and cold winters. The average temperature in the summer is around 75 degrees Fahrenheit, and the average temperature in the winter is around 25 degrees Fahrenheit.
Economy
The economy of Big Rapids is largely based on manufacturing, healthcare, education, and tourism. The city is home to Ferris State University, which is a major employer in the city. The university also attracts many students and visitors to the city, which helps to boost the local economy.
The city is also home to several manufacturing companies, including Big Rapids Manufacturing, which produces automotive parts, and Big Rapids Plastics, which produces plastic products.
The city is also home to several healthcare facilities, including Spectrum Health Big Rapids Hospital, which is a major employer in the city.
The city is also home to several tourist attractions, including the Mecosta County Historical Museum, the Big Rapids Riverwalk, and the Big Rapids Farmers Market.
Demographics
As of the 2010 census, the population of Big Rapids was 10,601. The population density was 2,000 people per square mile. The racial makeup of the city was 90.2% White, 4.2% African American, 0.7% Native American, 1.7% Asian, 0.1% Pacific Islander, 1.2% from other races, and 1.9% from two or more races. Hispanic or Latino of any race were 4.2% of the population.
The median income for a household in the city was $31,945, and the median income for a family was $41,945. The per capita income for the city was $17,845. About 16.2% of the population was below the poverty line.
Common Questions
What is Per Capita Income in Big Rapids?
Per Capita income in Big Rapids is $19,854.
What is the Median Family Income in Big Rapids?
Median Family Income in Big Rapids is $56,827.
What is the Median Household income in Big Rapids?
Median Household Income in Big Rapids is $36,058.
What is Income or Wage Gap in Big Rapids?
Income or Wage Gap in Big Rapids is 7.3%.
Women in Big Rapids earn 92.7 cents for every dollar earned by a man.
What is Inequality or Gini Index in Big Rapids?
Inequality or Gini Index in Big Rapids is 0.47.
What is the Total Population of Big Rapids?
Total Population of Big Rapids is 7,915.
What is the Total Male Population of Big Rapids?
Total Male Population of Big Rapids is 4,166.
What is the Total Female Population of Big Rapids?
Total Female Population of Big Rapids is 3,749.
What is the Ratio of Males per 100 Females in Big Rapids?
There are 111.12 Males per 100 Females in Big Rapids.
What is the Ratio of Females per 100 Males in Big Rapids?
There are 89.99 Females per 100 Males in Big Rapids.
What is the Median Population Age in Big Rapids?
Median Population Age in Big Rapids is 22.8 Years.
What is the Average Family Size in Big Rapids
Average Family Size in Big Rapids is 2.9 People.
What is the Average Household Size in Big Rapids
Average Household Size in Big Rapids is 2.2 People.
How Large is the Labor Force in Big Rapids?
There are 4,341 People in the Labor Forcein in Big Rapids.
What is the Percentage of People in the Labor Force in Big Rapids?
62.2% of People are in the Labor Force in Big Rapids.
What is the Unemployment Rate in Big Rapids?
Unemployment Rate in Big Rapids is 7.2%.