Marenisco, MI Map & Demographics
Marenisco Map
Marenisco Overview
$25,927
PER CAPITA INCOME
$47,083
AVG FAMILY INCOME
$39,306
AVG HOUSEHOLD INCOME
0.36
INEQUALITY / GINI INDEX
249
TOTAL POPULATION
142
MALE POPULATION
107
FEMALE POPULATION
132.71
MALES / 100 FEMALES
75.35
FEMALES / 100 MALES
58.1
MEDIAN AGE
2.9
AVG FAMILY SIZE
2.1
AVG HOUSEHOLD SIZE
77
LABOR FORCE [ PEOPLE ]
39.9%
PERCENT IN LABOR FORCE
Marenisco Zip Codes
Marenisco Area Codes
Income in Marenisco
Income Overview in Marenisco
Per Capita Income in Marenisco is $25,927, while median incomes of families and households are $47,083 and $39,306 respectively.
| Characteristic | Number | Measure |
| Per Capita Income | 249 | $25,927 |
| Median Family Income | 61 | $47,083 |
| Mean Family Income | 61 | $57,538 |
| Median Household Income | 121 | $39,306 |
| Mean Household Income | 121 | $50,302 |
| Income Deficit | 61 | $0 |
| Wage / Income Gap (%) | 249 | 0.00% |
| Wage / Income Gap ($) | 249 | 100.00¢ per $1 |
| Gini / Inequality Index | 249 | 0.36 |
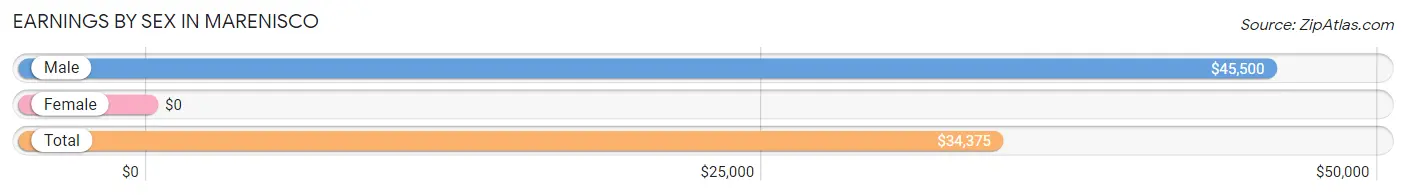
Earnings by Sex in Marenisco
| Sex | Number | Average Earnings |
| Male | 50 (52.1%) | $45,500 |
| Female | 46 (47.9%) | $0 |
| Total | 96 (100.0%) | $34,375 |
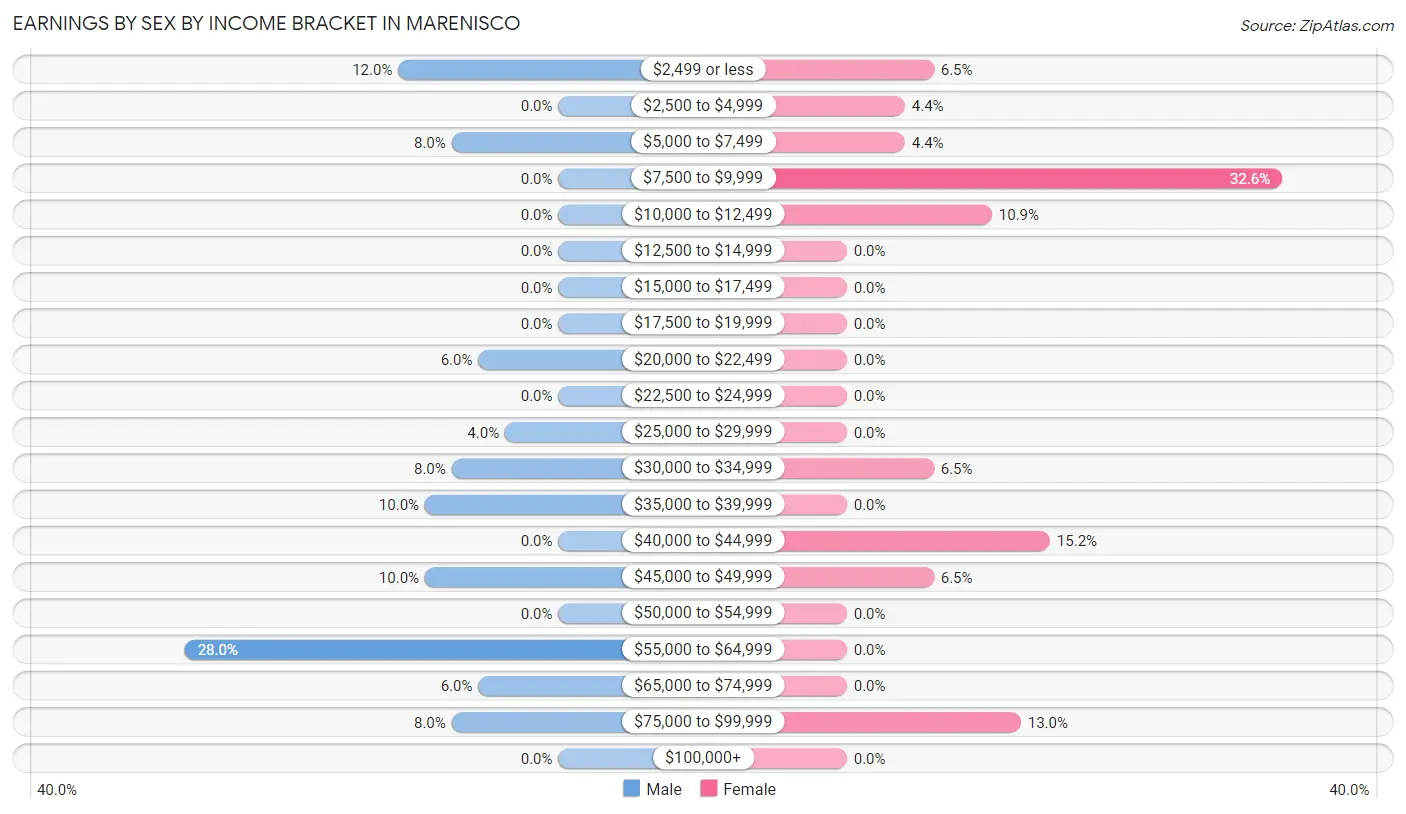
Earnings by Sex by Income Bracket in Marenisco
The most common earnings brackets in Marenisco are $55,000 to $64,999 for men (14 | 28.0%) and $7,500 to $9,999 for women (15 | 32.6%).
| Income | Male | Female |
| $2,499 or less | 6 (12.0%) | 3 (6.5%) |
| $2,500 to $4,999 | 0 (0.0%) | 2 (4.3%) |
| $5,000 to $7,499 | 4 (8.0%) | 2 (4.3%) |
| $7,500 to $9,999 | 0 (0.0%) | 15 (32.6%) |
| $10,000 to $12,499 | 0 (0.0%) | 5 (10.9%) |
| $12,500 to $14,999 | 0 (0.0%) | 0 (0.0%) |
| $15,000 to $17,499 | 0 (0.0%) | 0 (0.0%) |
| $17,500 to $19,999 | 0 (0.0%) | 0 (0.0%) |
| $20,000 to $22,499 | 3 (6.0%) | 0 (0.0%) |
| $22,500 to $24,999 | 0 (0.0%) | 0 (0.0%) |
| $25,000 to $29,999 | 2 (4.0%) | 0 (0.0%) |
| $30,000 to $34,999 | 4 (8.0%) | 3 (6.5%) |
| $35,000 to $39,999 | 5 (10.0%) | 0 (0.0%) |
| $40,000 to $44,999 | 0 (0.0%) | 7 (15.2%) |
| $45,000 to $49,999 | 5 (10.0%) | 3 (6.5%) |
| $50,000 to $54,999 | 0 (0.0%) | 0 (0.0%) |
| $55,000 to $64,999 | 14 (28.0%) | 0 (0.0%) |
| $65,000 to $74,999 | 3 (6.0%) | 0 (0.0%) |
| $75,000 to $99,999 | 4 (8.0%) | 6 (13.0%) |
| $100,000+ | 0 (0.0%) | 0 (0.0%) |
| Total | 50 (100.0%) | 46 (100.0%) |
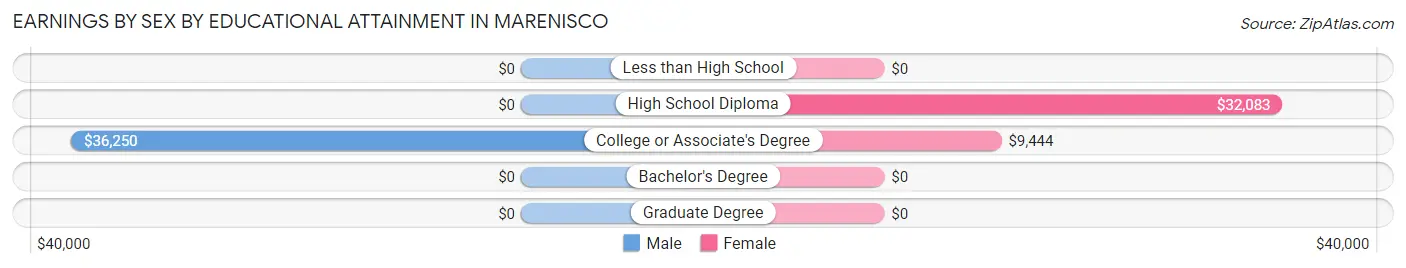
Earnings by Sex by Educational Attainment in Marenisco
| Educational Attainment | Male Income | Female Income |
| Less than High School | - | - |
| High School Diploma | - | - |
| College or Associate's Degree | $36,250 | $9,444 |
| Bachelor's Degree | - | - |
| Graduate Degree | - | - |
| Total | $46,500 | $0 |
Family Income in Marenisco
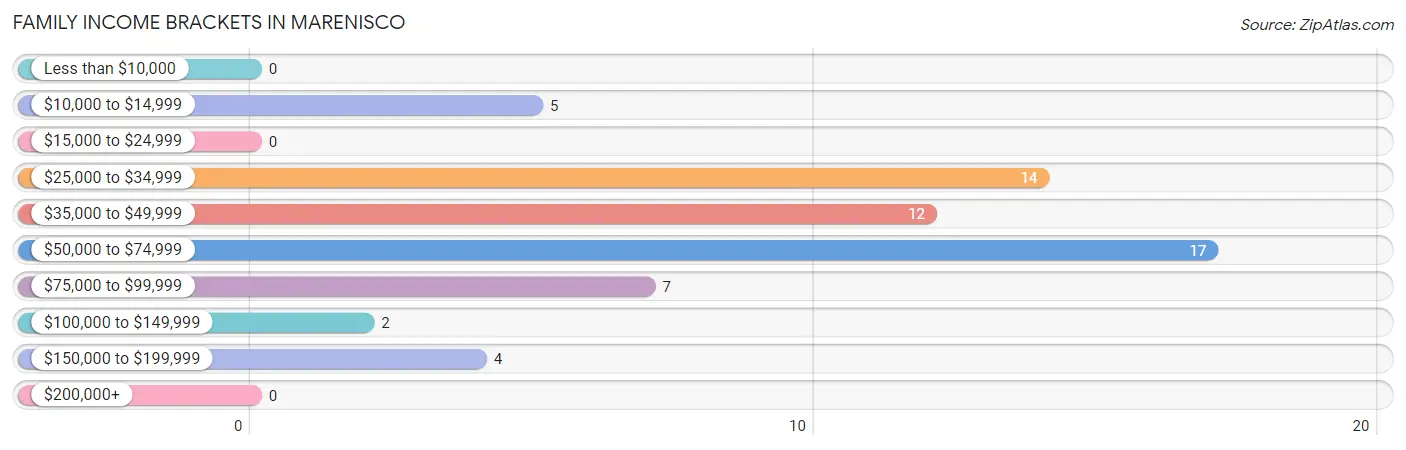
Family Income Brackets in Marenisco
According to the Marenisco family income data, there are 17 families falling into the $50,000 to $74,999 income range, which is the most common income bracket and makes up 27.9% of all families.
| Income Bracket | # Families | % Families |
| Less than $10,000 | 0 | 0.0% |
| $10,000 to $14,999 | 5 | 8.2% |
| $15,000 to $24,999 | 0 | 0.0% |
| $25,000 to $34,999 | 14 | 23.0% |
| $35,000 to $49,999 | 12 | 19.7% |
| $50,000 to $74,999 | 17 | 27.9% |
| $75,000 to $99,999 | 7 | 11.5% |
| $100,000 to $149,999 | 2 | 3.3% |
| $150,000 to $199,999 | 4 | 6.6% |
| $200,000+ | 0 | 0.0% |
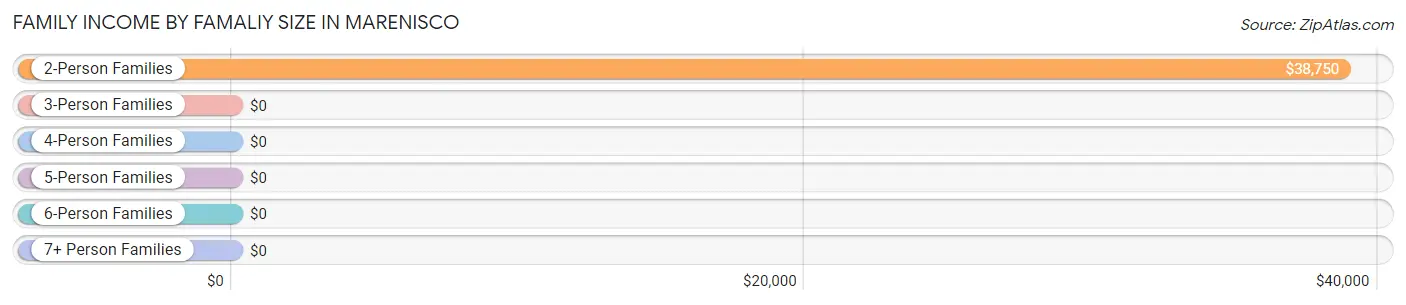
Family Income by Famaliy Size in Marenisco
2-person families (47 | 77.0%) account for the highest median family income in Marenisco with $38,750 per family, while 2-person families (47 | 77.0%) have the highest median income of $19,375 per family member.
| Income Bracket | # Families | Median Income |
| 2-Person Families | 47 (77.0%) | $38,750 |
| 3-Person Families | 3 (4.9%) | $0 |
| 4-Person Families | 4 (6.6%) | $0 |
| 5-Person Families | 0 (0.0%) | $0 |
| 6-Person Families | 7 (11.5%) | $0 |
| 7+ Person Families | 0 (0.0%) | $0 |
| Total | 61 (100.0%) | $47,083 |
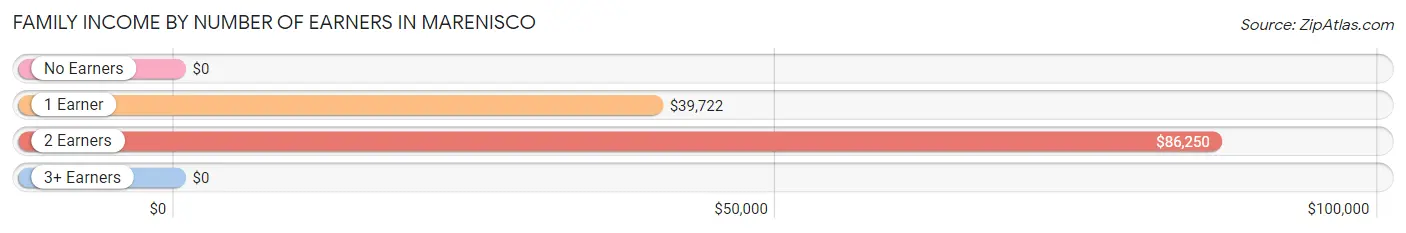
Family Income by Number of Earners in Marenisco
| Number of Earners | # Families | Median Income |
| No Earners | 8 (13.1%) | $0 |
| 1 Earner | 38 (62.3%) | $39,722 |
| 2 Earners | 11 (18.0%) | $86,250 |
| 3+ Earners | 4 (6.6%) | $0 |
| Total | 61 (100.0%) | $47,083 |
Household Income in Marenisco
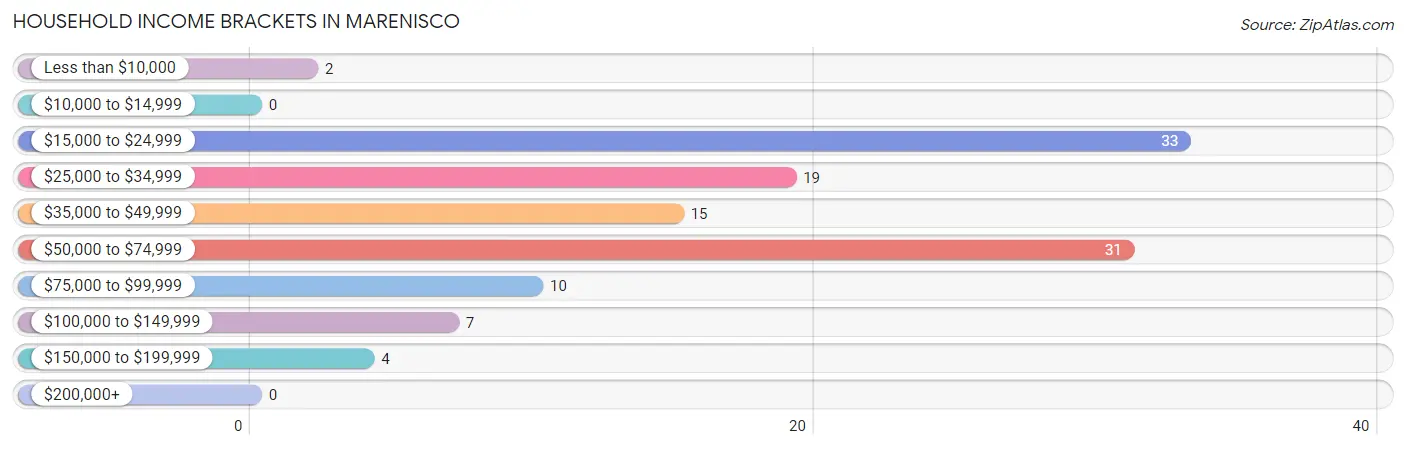
Household Income Brackets in Marenisco
With 33 households falling in the category, the $15,000 to $24,999 income range is the most frequent in Marenisco, accounting for 27.3% of all households.
| Income Bracket | # Households | % Households |
| Less than $10,000 | 2 | 1.7% |
| $10,000 to $14,999 | 0 | 0.0% |
| $15,000 to $24,999 | 33 | 27.3% |
| $25,000 to $34,999 | 19 | 15.7% |
| $35,000 to $49,999 | 15 | 12.4% |
| $50,000 to $74,999 | 31 | 25.6% |
| $75,000 to $99,999 | 10 | 8.3% |
| $100,000 to $149,999 | 7 | 5.8% |
| $150,000 to $199,999 | 4 | 3.3% |
| $200,000+ | 0 | 0.0% |
Household Income by Householder Age in Marenisco
The median household income in Marenisco is $39,306, with the highest median household income of $67,321 found in the 45 to 64 years age bracket for the primary householder. A total of 25 households (20.7%) fall into this category.
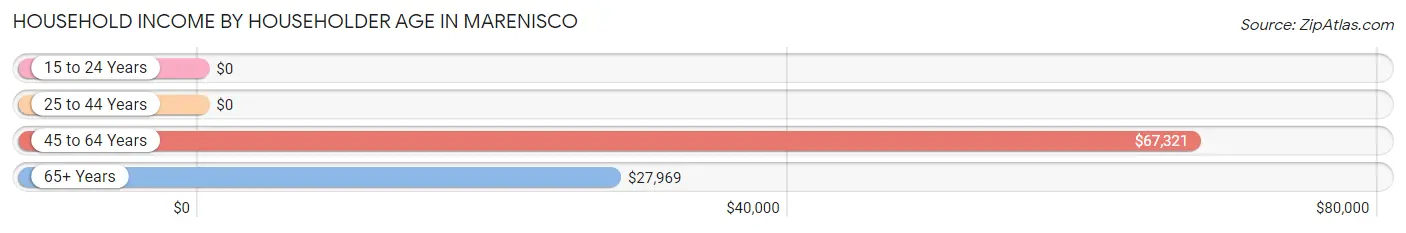
| Income Bracket | # Households | Median Income |
| 15 to 24 Years | 0 (0.0%) | $0 |
| 25 to 44 Years | 15 (12.4%) | $0 |
| 45 to 64 Years | 25 (20.7%) | $67,321 |
| 65+ Years | 81 (66.9%) | $27,969 |
| Total | 121 (100.0%) | $39,306 |
Poverty in Marenisco
Income Below Poverty by Sex and Age in Marenisco
With 4.2% poverty level for males and 6.5% for females among the residents of Marenisco, under 5 year old males and 25 to 34 year old females are the most vulnerable to poverty, with 6 males (100.0%) and 5 females (41.7%) in their respective age groups living below the poverty level.
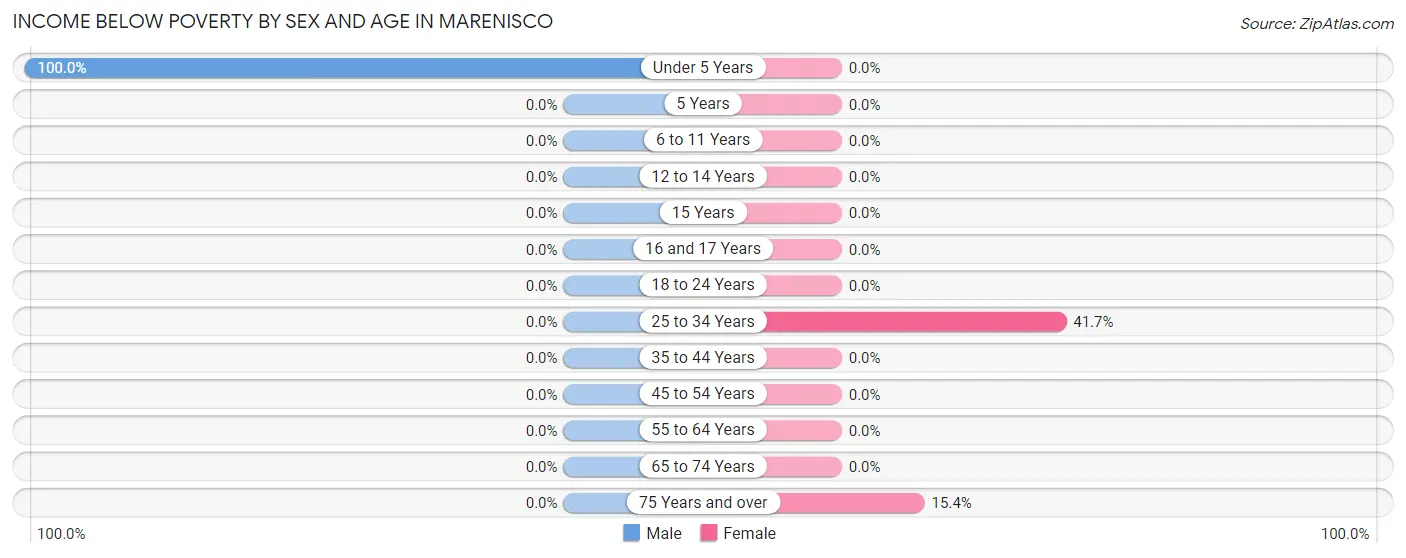
| Age Bracket | Male | Female |
| Under 5 Years | 6 (100.0%) | 0 (0.0%) |
| 5 Years | 0 (0.0%) | 0 (0.0%) |
| 6 to 11 Years | 0 (0.0%) | 0 (0.0%) |
| 12 to 14 Years | 0 (0.0%) | 0 (0.0%) |
| 15 Years | 0 (0.0%) | 0 (0.0%) |
| 16 and 17 Years | 0 (0.0%) | 0 (0.0%) |
| 18 to 24 Years | 0 (0.0%) | 0 (0.0%) |
| 25 to 34 Years | 0 (0.0%) | 5 (41.7%) |
| 35 to 44 Years | 0 (0.0%) | 0 (0.0%) |
| 45 to 54 Years | 0 (0.0%) | 0 (0.0%) |
| 55 to 64 Years | 0 (0.0%) | 0 (0.0%) |
| 65 to 74 Years | 0 (0.0%) | 0 (0.0%) |
| 75 Years and over | 0 (0.0%) | 2 (15.4%) |
| Total | 6 (4.2%) | 7 (6.5%) |
Income Above Poverty by Sex and Age in Marenisco
According to the poverty statistics in Marenisco, males aged 12 to 14 years and females aged 6 to 11 years are the age groups that are most secure financially, with 100.0% of males and 100.0% of females in these age groups living above the poverty line.
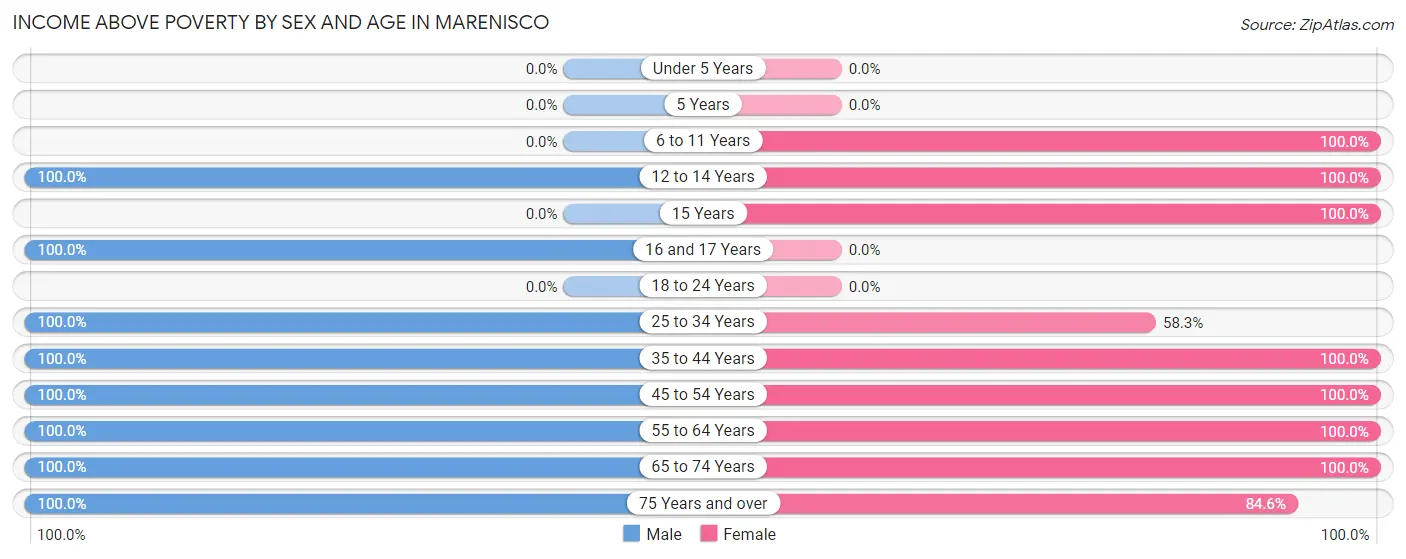
| Age Bracket | Male | Female |
| Under 5 Years | 0 (0.0%) | 0 (0.0%) |
| 5 Years | 0 (0.0%) | 0 (0.0%) |
| 6 to 11 Years | 0 (0.0%) | 20 (100.0%) |
| 12 to 14 Years | 15 (100.0%) | 11 (100.0%) |
| 15 Years | 0 (0.0%) | 4 (100.0%) |
| 16 and 17 Years | 4 (100.0%) | 0 (0.0%) |
| 18 to 24 Years | 0 (0.0%) | 0 (0.0%) |
| 25 to 34 Years | 4 (100.0%) | 7 (58.3%) |
| 35 to 44 Years | 8 (100.0%) | 3 (100.0%) |
| 45 to 54 Years | 21 (100.0%) | 7 (100.0%) |
| 55 to 64 Years | 10 (100.0%) | 13 (100.0%) |
| 65 to 74 Years | 60 (100.0%) | 24 (100.0%) |
| 75 Years and over | 14 (100.0%) | 11 (84.6%) |
| Total | 136 (95.8%) | 100 (93.5%) |
Income Below Poverty Among Married-Couple Families in Marenisco
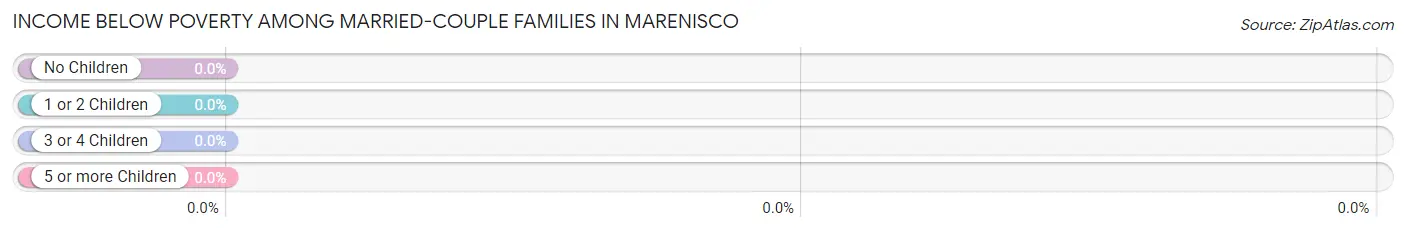
| Children | Above Poverty | Below Poverty |
| No Children | 36 (100.0%) | 0 (0.0%) |
| 1 or 2 Children | 4 (100.0%) | 0 (0.0%) |
| 3 or 4 Children | 7 (100.0%) | 0 (0.0%) |
| 5 or more Children | 0 (0.0%) | 0 (0.0%) |
| Total | 47 (100.0%) | 0 (0.0%) |
Income Below Poverty Among Single-Parent Households in Marenisco
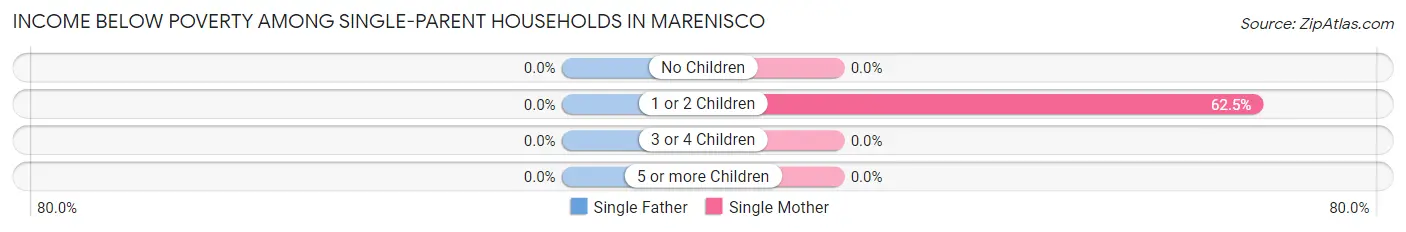
| Children | Single Father | Single Mother |
| No Children | 0 (0.0%) | 0 (0.0%) |
| 1 or 2 Children | 0 (0.0%) | 5 (62.5%) |
| 3 or 4 Children | 0 (0.0%) | 0 (0.0%) |
| 5 or more Children | 0 (0.0%) | 0 (0.0%) |
| Total | 0 (0.0%) | 5 (62.5%) |
Income Below Poverty Among Married-Couple vs Single-Parent Households in Marenisco
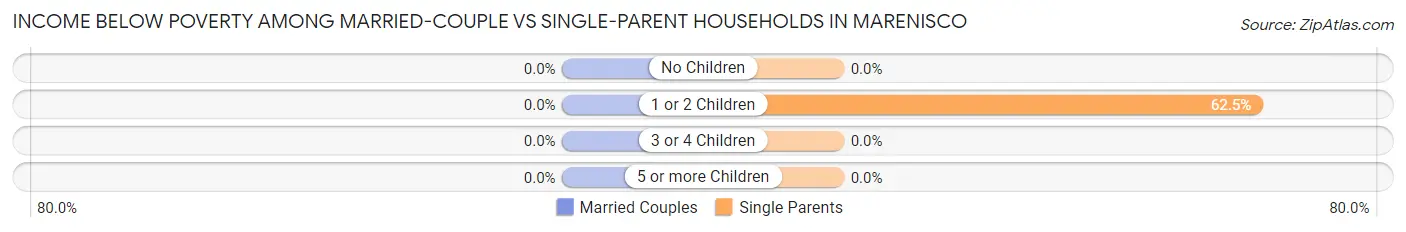
| Children | Married-Couple Families | Single-Parent Households |
| No Children | 0 (0.0%) | 0 (0.0%) |
| 1 or 2 Children | 0 (0.0%) | 5 (62.5%) |
| 3 or 4 Children | 0 (0.0%) | 0 (0.0%) |
| 5 or more Children | 0 (0.0%) | 0 (0.0%) |
| Total | 0 (0.0%) | 5 (35.7%) |
Race in Marenisco
The most populous races in Marenisco are White / Caucasian (184 | 73.9%), Native / Alaskan (62 | 24.9%), and Asian (3 | 1.2%).
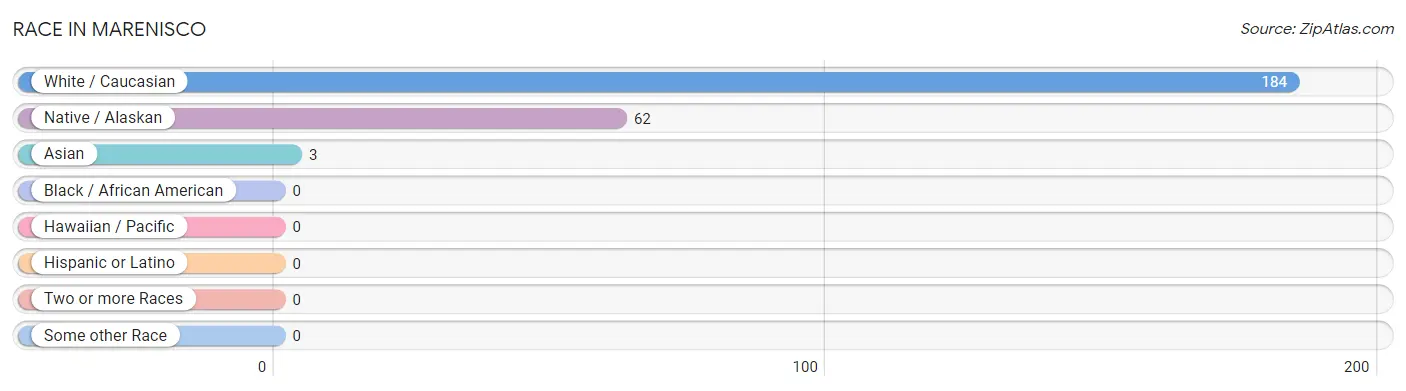
| Race | # Population | % Population |
| Asian | 3 | 1.2% |
| Black / African American | 0 | 0.0% |
| Hawaiian / Pacific | 0 | 0.0% |
| Hispanic or Latino | 0 | 0.0% |
| Native / Alaskan | 62 | 24.9% |
| White / Caucasian | 184 | 73.9% |
| Two or more Races | 0 | 0.0% |
| Some other Race | 0 | 0.0% |
| Total | 249 | 100.0% |
Ancestry in Marenisco
The most populous ancestries reported in Marenisco are Dutch (42 | 16.9%), German (38 | 15.3%), English (23 | 9.2%), Polish (18 | 7.2%), and American (15 | 6.0%), together accounting for 54.6% of all Marenisco residents.
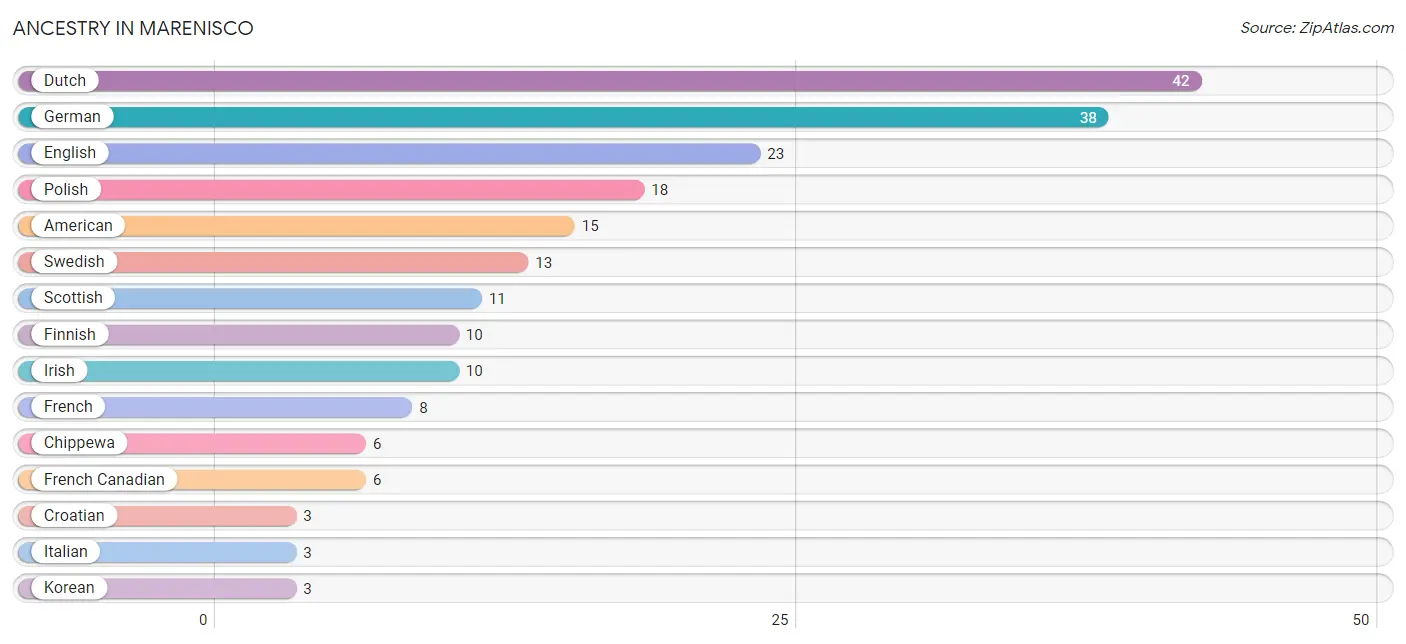
| Ancestry | # Population | % Population |
| American | 15 | 6.0% |
| Chippewa | 6 | 2.4% |
| Croatian | 3 | 1.2% |
| Dutch | 42 | 16.9% |
| English | 23 | 9.2% |
| Finnish | 10 | 4.0% |
| French | 8 | 3.2% |
| French Canadian | 6 | 2.4% |
| German | 38 | 15.3% |
| Irish | 10 | 4.0% |
| Italian | 3 | 1.2% |
| Korean | 3 | 1.2% |
| Norwegian | 2 | 0.8% |
| Ottawa | 3 | 1.2% |
| Polish | 18 | 7.2% |
| Scotch-Irish | 1 | 0.4% |
| Scottish | 11 | 4.4% |
| Swedish | 13 | 5.2% |
| Swiss | 3 | 1.2% | View All 19 Rows |
Immigrants in Marenisco
The most numerous immigrant groups reported in Marenisco came from Asia (3 | 1.2%), Philippines (3 | 1.2%), and South Eastern Asia (3 | 1.2%), together accounting for 3.6% of all Marenisco residents.
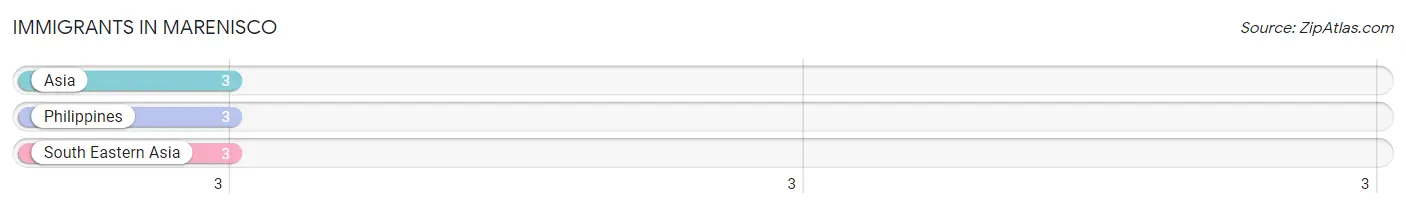
| Immigration Origin | # Population | % Population |
| Asia | 3 | 1.2% |
| Philippines | 3 | 1.2% |
| South Eastern Asia | 3 | 1.2% | View All 3 Rows |
Sex and Age in Marenisco
Sex and Age in Marenisco
The most populous age groups in Marenisco are 70 to 74 Years (51 | 35.9%) for men and 5 to 9 Years (20 | 18.7%) for women.
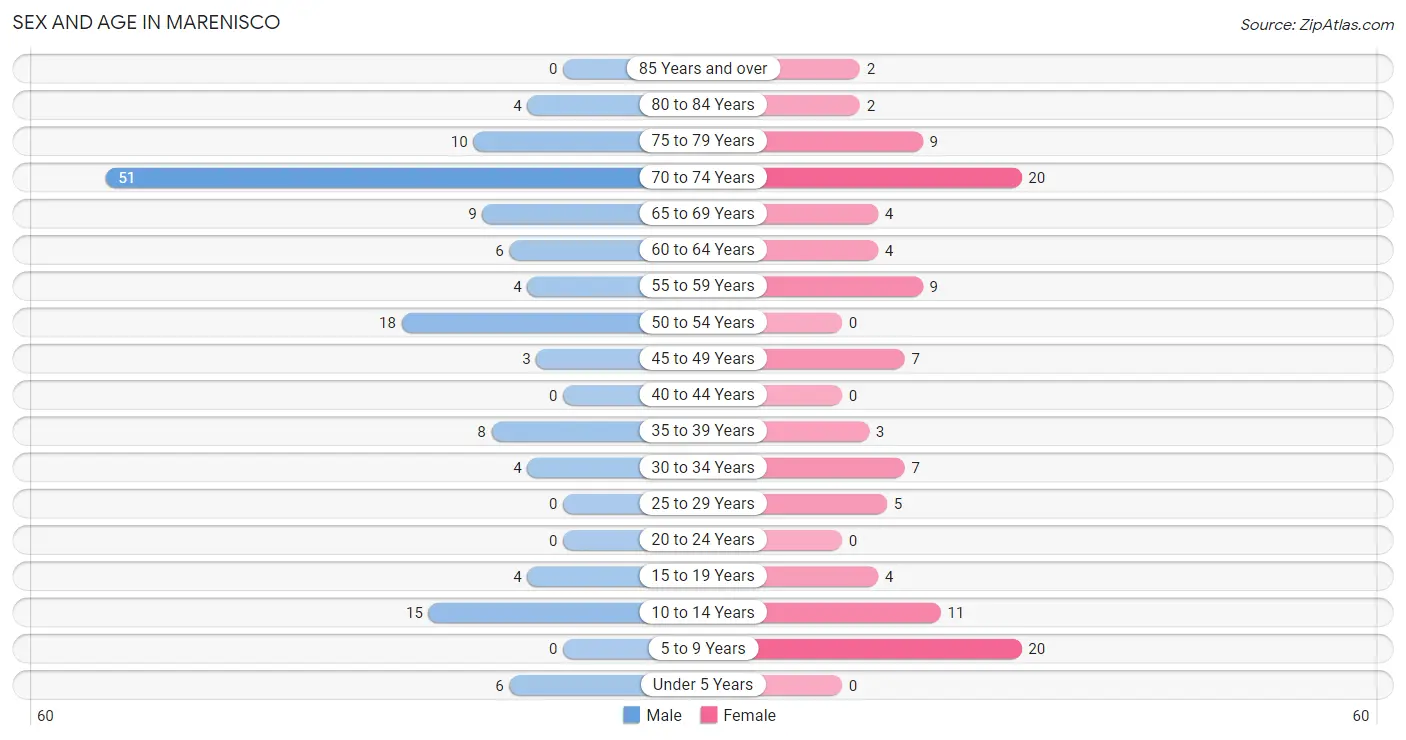
| Age Bracket | Male | Female |
| Under 5 Years | 6 (4.2%) | 0 (0.0%) |
| 5 to 9 Years | 0 (0.0%) | 20 (18.7%) |
| 10 to 14 Years | 15 (10.6%) | 11 (10.3%) |
| 15 to 19 Years | 4 (2.8%) | 4 (3.7%) |
| 20 to 24 Years | 0 (0.0%) | 0 (0.0%) |
| 25 to 29 Years | 0 (0.0%) | 5 (4.7%) |
| 30 to 34 Years | 4 (2.8%) | 7 (6.5%) |
| 35 to 39 Years | 8 (5.6%) | 3 (2.8%) |
| 40 to 44 Years | 0 (0.0%) | 0 (0.0%) |
| 45 to 49 Years | 3 (2.1%) | 7 (6.5%) |
| 50 to 54 Years | 18 (12.7%) | 0 (0.0%) |
| 55 to 59 Years | 4 (2.8%) | 9 (8.4%) |
| 60 to 64 Years | 6 (4.2%) | 4 (3.7%) |
| 65 to 69 Years | 9 (6.3%) | 4 (3.7%) |
| 70 to 74 Years | 51 (35.9%) | 20 (18.7%) |
| 75 to 79 Years | 10 (7.0%) | 9 (8.4%) |
| 80 to 84 Years | 4 (2.8%) | 2 (1.9%) |
| 85 Years and over | 0 (0.0%) | 2 (1.9%) |
| Total | 142 (100.0%) | 107 (100.0%) |
Families and Households in Marenisco
Median Family Size in Marenisco
The median family size in Marenisco is 2.90 persons per family, with married-couple families (47 | 77.0%) accounting for the largest median family size of 3.06 persons per family. On the other hand, single male/father families (6 | 9.8%) represent the smallest median family size with 2.00 persons per family.
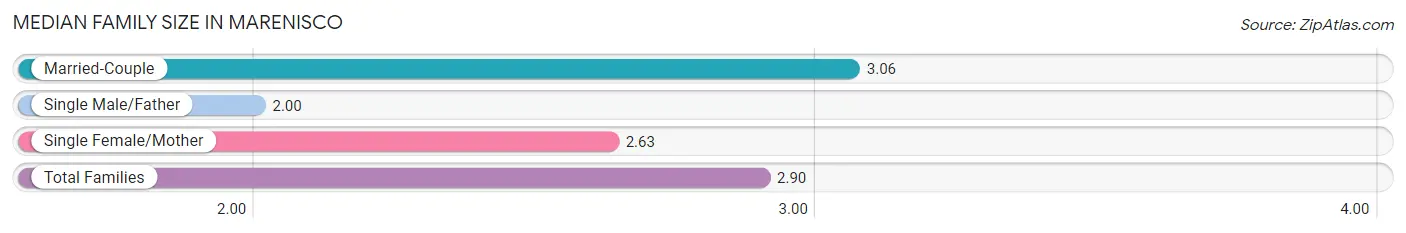
| Family Type | # Families | Family Size |
| Married-Couple | 47 (77.0%) | 3.06 |
| Single Male/Father | 6 (9.8%) | 2.00 |
| Single Female/Mother | 8 (13.1%) | 2.63 |
| Total Families | 61 (100.0%) | 2.90 |
Median Household Size in Marenisco
The median household size in Marenisco is 2.06 persons per household, with single female/mother households (8 | 6.6%) accounting for the largest median household size of 3.25 persons per household. non-family households (60 | 49.6%) represent the smallest median household size with 1.12 persons per household.
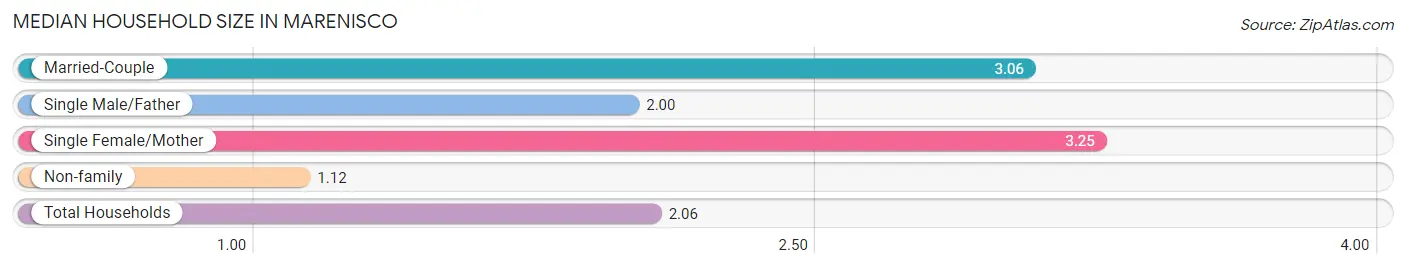
| Household Type | # Households | Household Size |
| Married-Couple | 47 (38.8%) | 3.06 |
| Single Male/Father | 6 (5.0%) | 2.00 |
| Single Female/Mother | 8 (6.6%) | 3.25 |
| Non-family | 60 (49.6%) | 1.12 |
| Total Households | 121 (100.0%) | 2.06 |
Household Size by Marriage Status in Marenisco
Out of a total of 121 households in Marenisco, 61 (50.4%) are family households, while 60 (49.6%) are nonfamily households. The most numerous type of family households are 2-person households, comprising 42, and the most common type of nonfamily households are 1-person households, comprising 54.
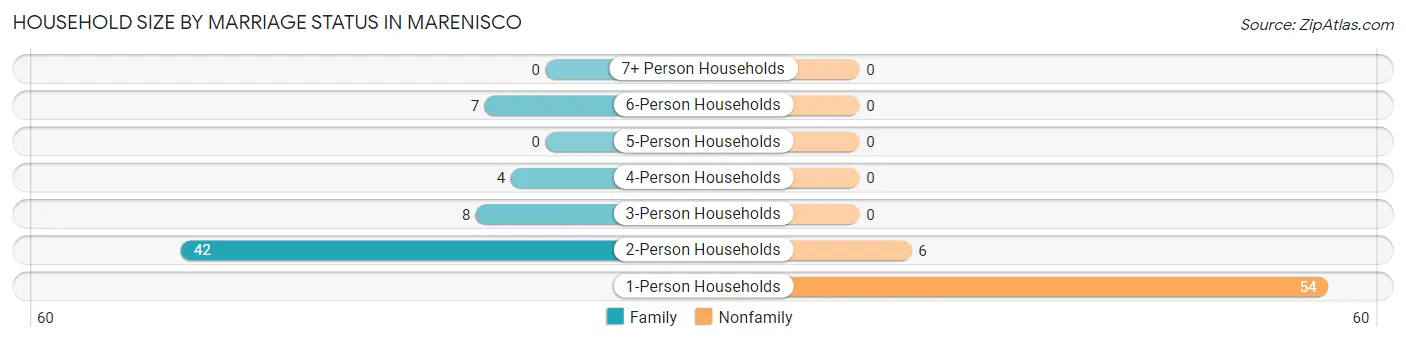
| Household Size | Family Households | Nonfamily Households |
| 1-Person Households | - | 54 (44.6%) |
| 2-Person Households | 42 (34.7%) | 6 (5.0%) |
| 3-Person Households | 8 (6.6%) | 0 (0.0%) |
| 4-Person Households | 4 (3.3%) | 0 (0.0%) |
| 5-Person Households | 0 (0.0%) | 0 (0.0%) |
| 6-Person Households | 7 (5.8%) | 0 (0.0%) |
| 7+ Person Households | 0 (0.0%) | 0 (0.0%) |
| Total | 61 (50.4%) | 60 (49.6%) |
Female Fertility in Marenisco
Fertility by Age in Marenisco
Average fertility rate in Marenisco is 192.0 births per 1,000 women. Women in the age bracket of 20 to 34 years have the highest fertility rate with 417.0 births per 1,000 women. Women in the age bracket of 20 to 34 years acount for 100.0% of all women with births.
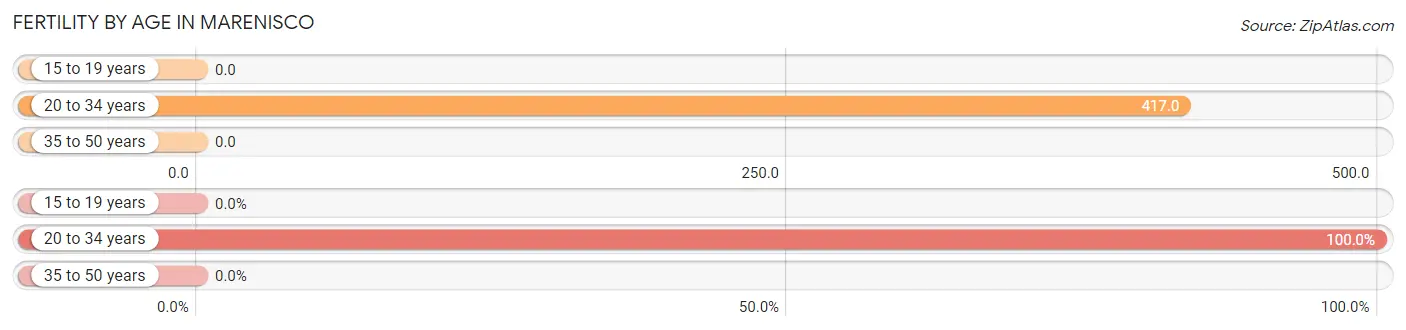
| Age Bracket | Women with Births | Births / 1,000 Women |
| 15 to 19 years | 0 (0.0%) | 0.0 |
| 20 to 34 years | 5 (100.0%) | 417.0 |
| 35 to 50 years | 0 (0.0%) | 0.0 |
| Total | 5 (100.0%) | 192.0 |
Fertility by Age by Marriage Status in Marenisco
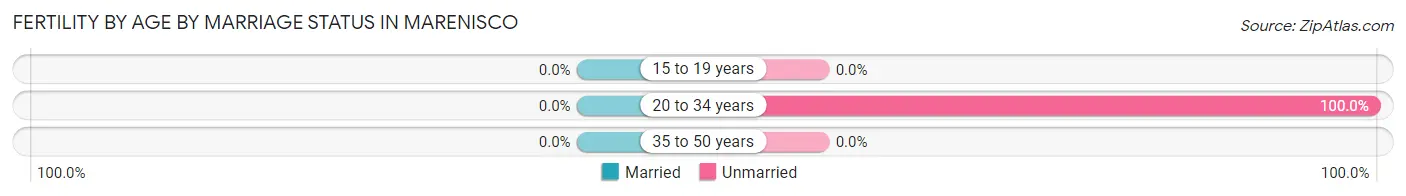
| Age Bracket | Married | Unmarried |
| 15 to 19 years | 0 (0.0%) | 0 (0.0%) |
| 20 to 34 years | 0 (0.0%) | 5 (100.0%) |
| 35 to 50 years | 0 (0.0%) | 0 (0.0%) |
| Total | 0 (0.0%) | 5 (100.0%) |
Fertility by Education in Marenisco
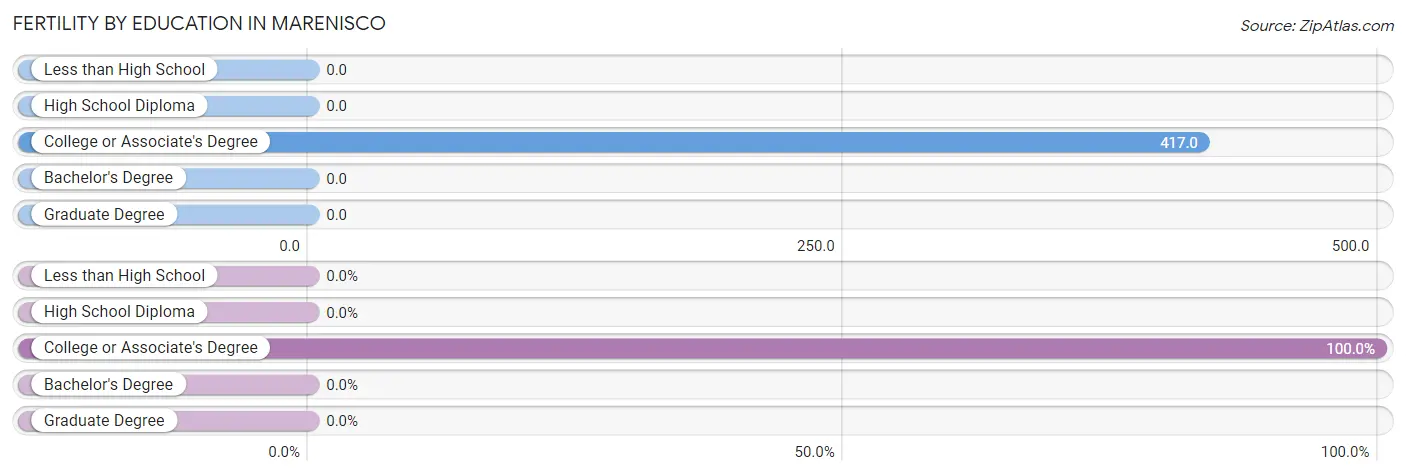
| Educational Attainment | Women with Births | Births / 1,000 Women |
| Less than High School | 0 (0.0%) | 0.0 |
| High School Diploma | 0 (0.0%) | 0.0 |
| College or Associate's Degree | 5 (100.0%) | 417.0 |
| Bachelor's Degree | 0 (0.0%) | 0.0 |
| Graduate Degree | 0 (0.0%) | 0.0 |
| Total | 5 (100.0%) | 192.0 |
Fertility by Education by Marriage Status in Marenisco
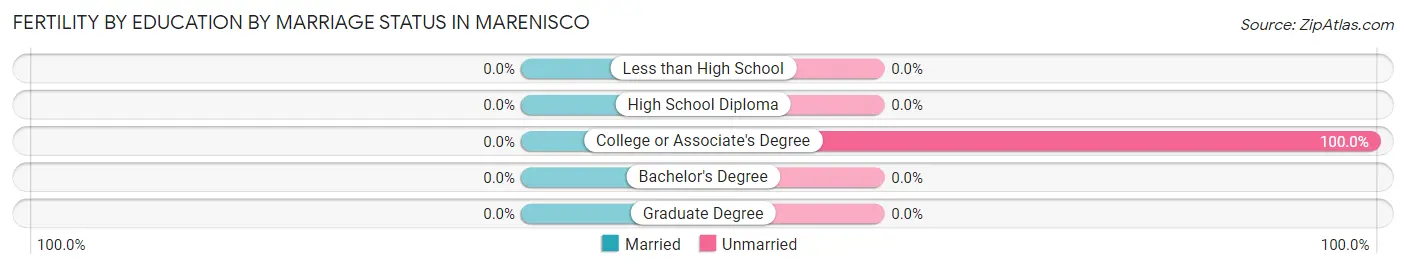
| Educational Attainment | Married | Unmarried |
| Less than High School | 0 (0.0%) | 0 (0.0%) |
| High School Diploma | 0 (0.0%) | 0 (0.0%) |
| College or Associate's Degree | 0 (0.0%) | 5 (100.0%) |
| Bachelor's Degree | 0 (0.0%) | 0 (0.0%) |
| Graduate Degree | 0 (0.0%) | 0 (0.0%) |
| Total | 0 (0.0%) | 5 (100.0%) |
Employment Characteristics in Marenisco
Employment by Class of Employer in Marenisco
Among the 77 employed individuals in Marenisco, local government employees (24 | 31.2%), private company employees (21 | 27.3%), and state government employees (11 | 14.3%) make up the most common classes of employment.
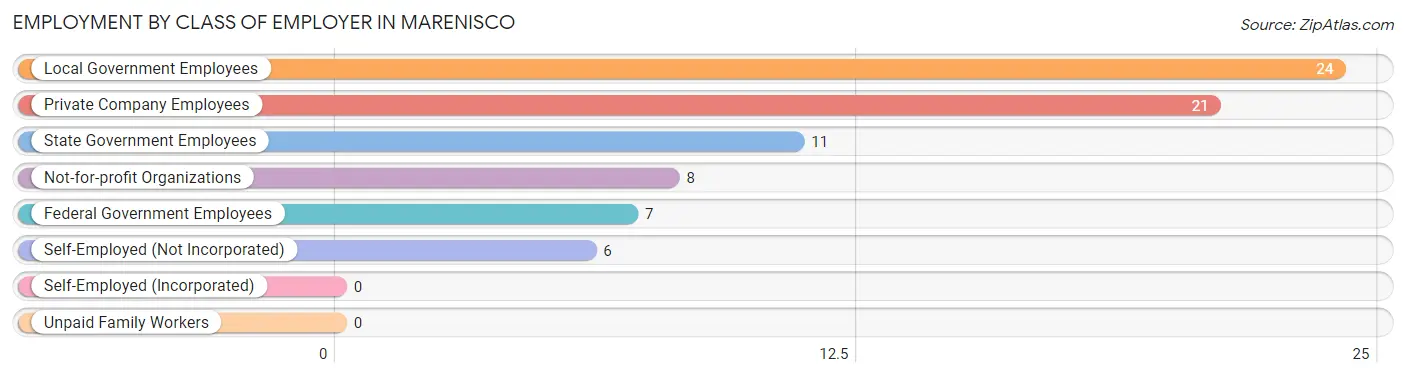
| Employer Class | # Employees | % Employees |
| Private Company Employees | 21 | 27.3% |
| Self-Employed (Incorporated) | 0 | 0.0% |
| Self-Employed (Not Incorporated) | 6 | 7.8% |
| Not-for-profit Organizations | 8 | 10.4% |
| Local Government Employees | 24 | 31.2% |
| State Government Employees | 11 | 14.3% |
| Federal Government Employees | 7 | 9.1% |
| Unpaid Family Workers | 0 | 0.0% |
| Total | 77 | 100.0% |
Employment Status by Age in Marenisco
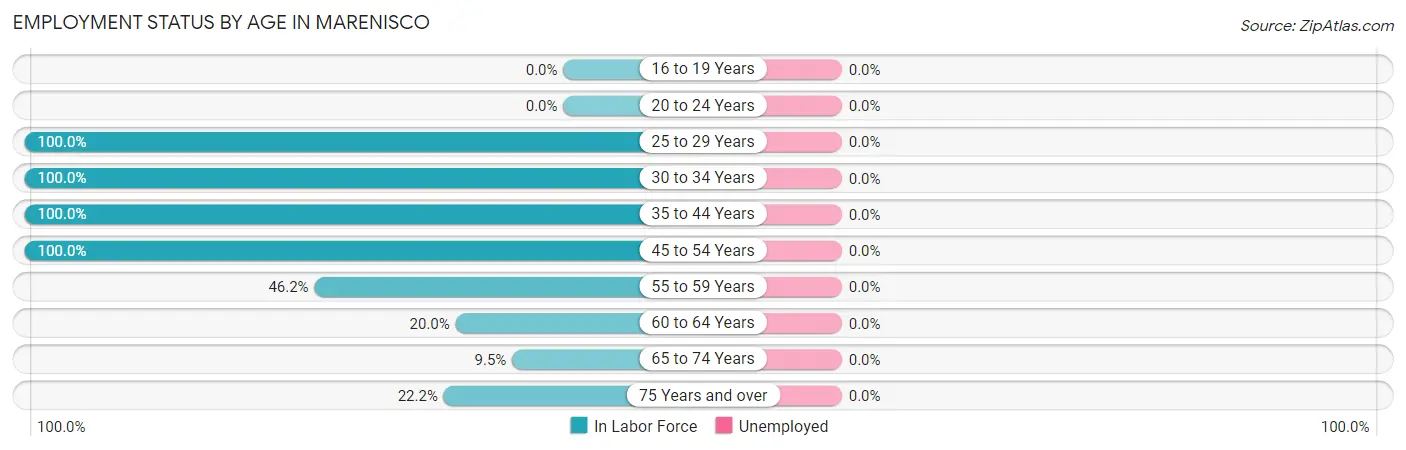
| Age Bracket | In Labor Force | Unemployed |
| 16 to 19 Years | 0 (0.0%) | 0 (0.0%) |
| 20 to 24 Years | 0 (0.0%) | 0 (0.0%) |
| 25 to 29 Years | 5 (100.0%) | 0 (0.0%) |
| 30 to 34 Years | 11 (100.0%) | 0 (0.0%) |
| 35 to 44 Years | 11 (100.0%) | 0 (0.0%) |
| 45 to 54 Years | 28 (100.0%) | 0 (0.0%) |
| 55 to 59 Years | 6 (46.2%) | 0 (0.0%) |
| 60 to 64 Years | 2 (20.0%) | 0 (0.0%) |
| 65 to 74 Years | 8 (9.5%) | 0 (0.0%) |
| 75 Years and over | 6 (22.2%) | 0 (0.0%) |
| Total | 77 (39.9%) | 0 (0.0%) |
Employment Status by Educational Attainment in Marenisco
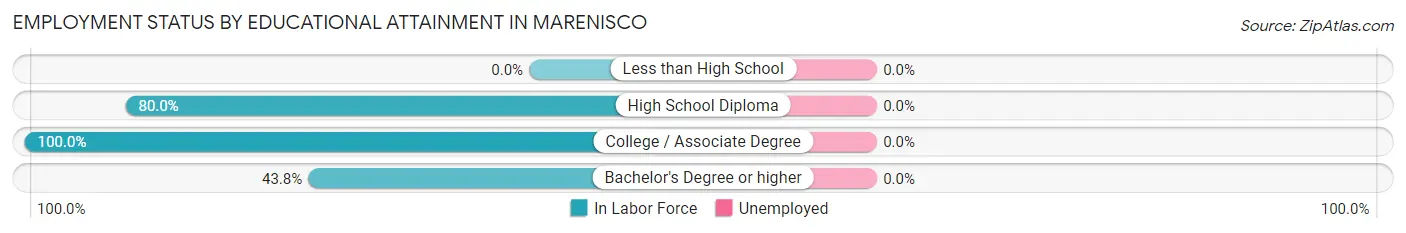
| Educational Attainment | In Labor Force | Unemployed |
| Less than High School | 0 (0.0%) | 0 (0.0%) |
| High School Diploma | 24 (80.0%) | 0 (0.0%) |
| College / Associate Degree | 32 (100.0%) | 0 (0.0%) |
| Bachelor's Degree or higher | 7 (43.8%) | 0 (0.0%) |
| Total | 63 (80.8%) | 0 (0.0%) |
Employment Occupations by Sex in Marenisco
Management, Business, Science and Arts Occupations
The most common Management, Business, Science and Arts occupations in Marenisco are Management (10 | 13.0%), Community & Social Service (4 | 5.2%), and Education Instruction & Library (4 | 5.2%).
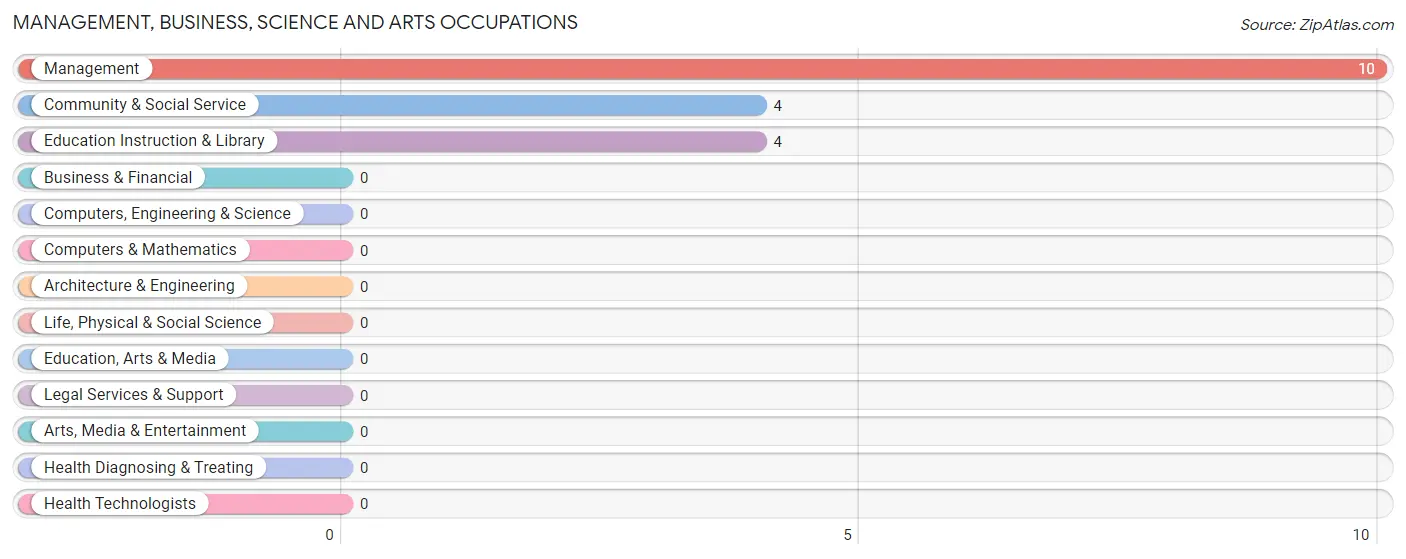
Management, Business, Science and Arts Occupations by Sex
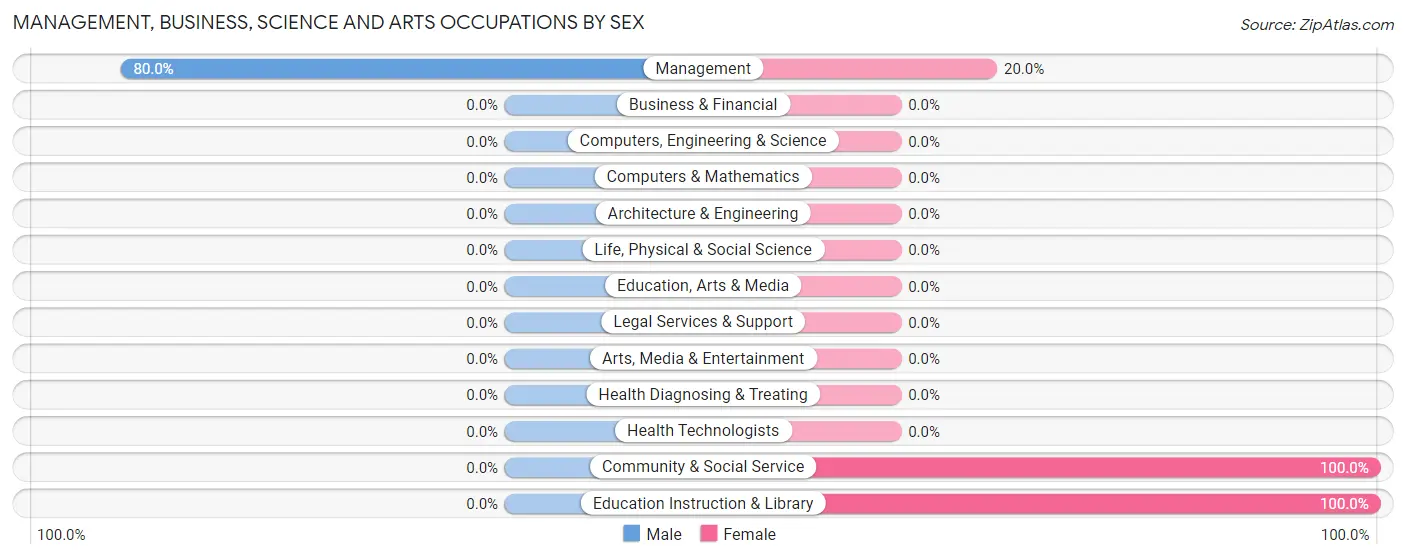
| Occupation | Male | Female |
| Management | 8 (80.0%) | 2 (20.0%) |
| Business & Financial | 0 (0.0%) | 0 (0.0%) |
| Computers, Engineering & Science | 0 (0.0%) | 0 (0.0%) |
| Computers & Mathematics | 0 (0.0%) | 0 (0.0%) |
| Architecture & Engineering | 0 (0.0%) | 0 (0.0%) |
| Life, Physical & Social Science | 0 (0.0%) | 0 (0.0%) |
| Community & Social Service | 0 (0.0%) | 4 (100.0%) |
| Education, Arts & Media | 0 (0.0%) | 0 (0.0%) |
| Legal Services & Support | 0 (0.0%) | 0 (0.0%) |
| Education Instruction & Library | 0 (0.0%) | 4 (100.0%) |
| Arts, Media & Entertainment | 0 (0.0%) | 0 (0.0%) |
| Health Diagnosing & Treating | 0 (0.0%) | 0 (0.0%) |
| Health Technologists | 0 (0.0%) | 0 (0.0%) |
| Total (Category) | 8 (57.1%) | 6 (42.9%) |
| Total (Overall) | 43 (55.8%) | 34 (44.2%) |
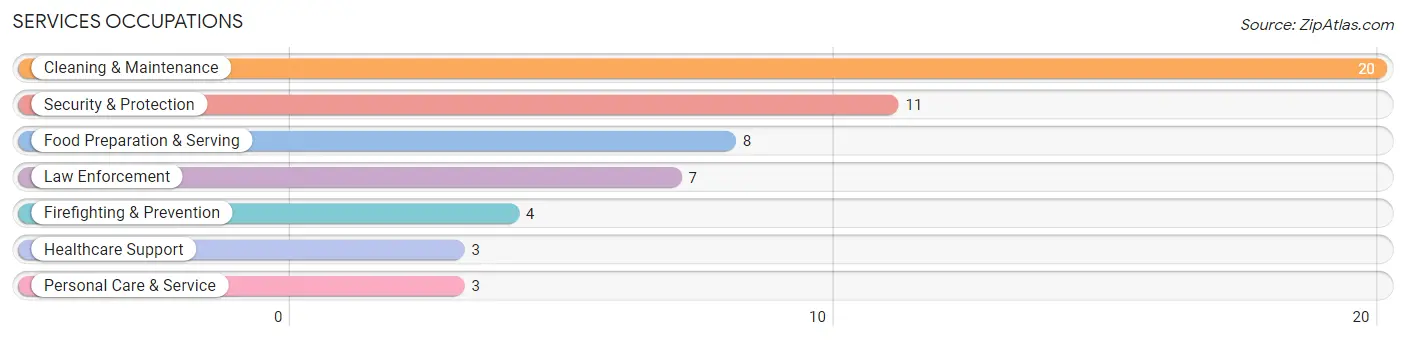
Services Occupations
The most common Services occupations in Marenisco are Cleaning & Maintenance (20 | 26.0%), Security & Protection (11 | 14.3%), Food Preparation & Serving (8 | 10.4%), Law Enforcement (7 | 9.1%), and Firefighting & Prevention (4 | 5.2%).
Services Occupations by Sex
Within the Services occupations in Marenisco, the most male-oriented occupations are Healthcare Support (100.0%), Law Enforcement (100.0%), and Cleaning & Maintenance (100.0%), while the most female-oriented occupations are Firefighting & Prevention (100.0%), Food Preparation & Serving (100.0%), and Personal Care & Service (100.0%).
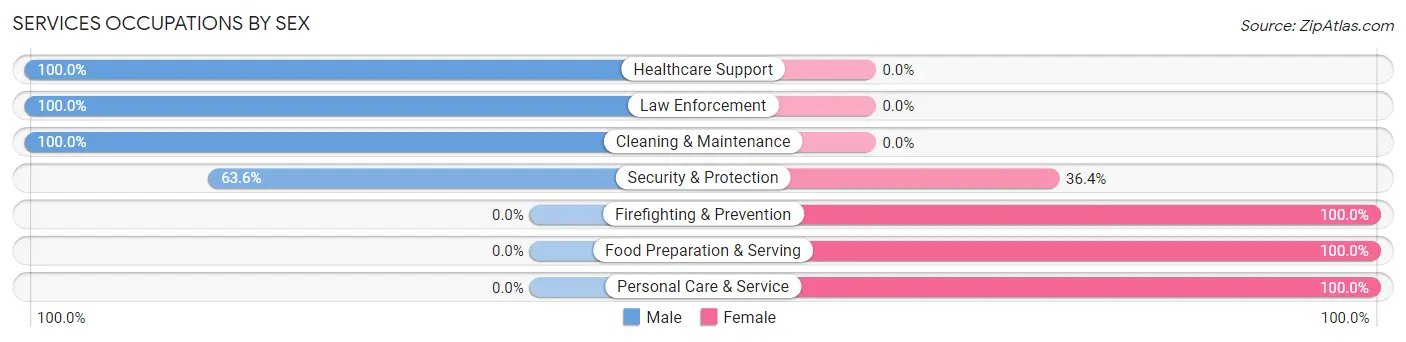
| Occupation | Male | Female |
| Healthcare Support | 3 (100.0%) | 0 (0.0%) |
| Security & Protection | 7 (63.6%) | 4 (36.4%) |
| Firefighting & Prevention | 0 (0.0%) | 4 (100.0%) |
| Law Enforcement | 7 (100.0%) | 0 (0.0%) |
| Food Preparation & Serving | 0 (0.0%) | 8 (100.0%) |
| Cleaning & Maintenance | 20 (100.0%) | 0 (0.0%) |
| Personal Care & Service | 0 (0.0%) | 3 (100.0%) |
| Total (Category) | 30 (66.7%) | 15 (33.3%) |
| Total (Overall) | 43 (55.8%) | 34 (44.2%) |
Sales and Office Occupations
The most common Sales and Office occupations in Marenisco are Office & Administration (13 | 16.9%), and Sales & Related (2 | 2.6%).
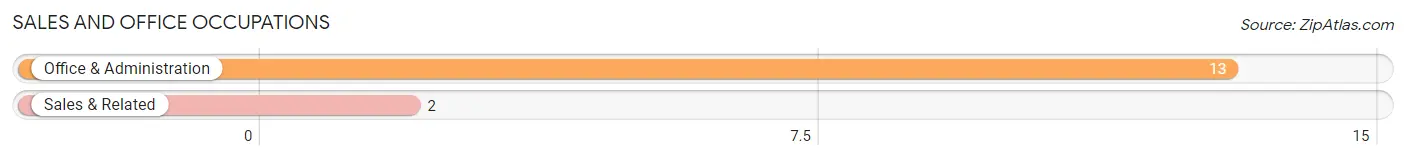
Sales and Office Occupations by Sex
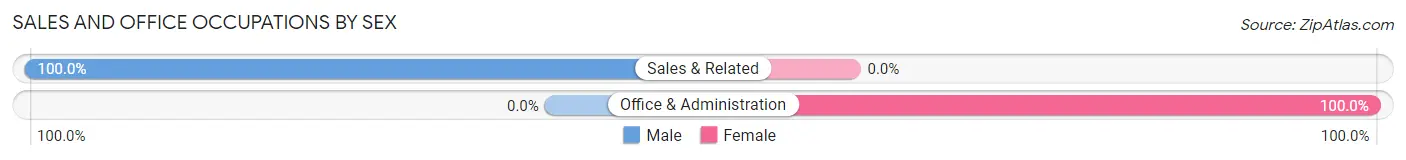
| Occupation | Male | Female |
| Sales & Related | 2 (100.0%) | 0 (0.0%) |
| Office & Administration | 0 (0.0%) | 13 (100.0%) |
| Total (Category) | 2 (13.3%) | 13 (86.7%) |
| Total (Overall) | 43 (55.8%) | 34 (44.2%) |
Natural Resources, Construction and Maintenance Occupations
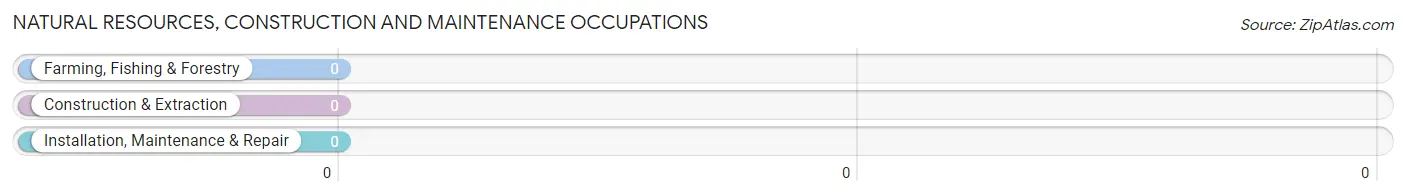
Natural Resources, Construction and Maintenance Occupations by Sex
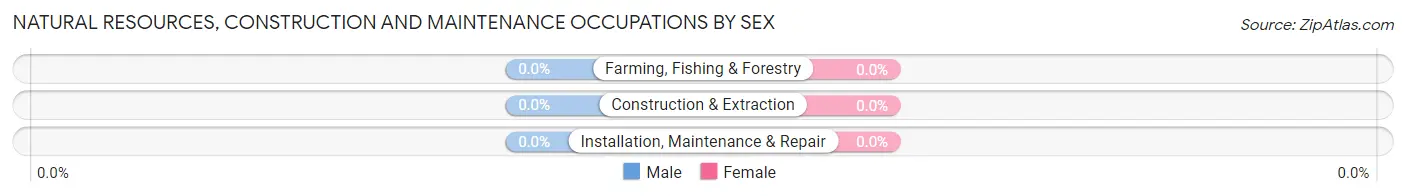
| Occupation | Male | Female |
| Farming, Fishing & Forestry | 0 (0.0%) | 0 (0.0%) |
| Construction & Extraction | 0 (0.0%) | 0 (0.0%) |
| Installation, Maintenance & Repair | 0 (0.0%) | 0 (0.0%) |
| Total (Category) | 0 (0.0%) | 0 (0.0%) |
| Total (Overall) | 43 (55.8%) | 34 (44.2%) |
Production, Transportation and Moving Occupations
The most common Production, Transportation and Moving occupations in Marenisco are , and Production (3 | 3.9%).
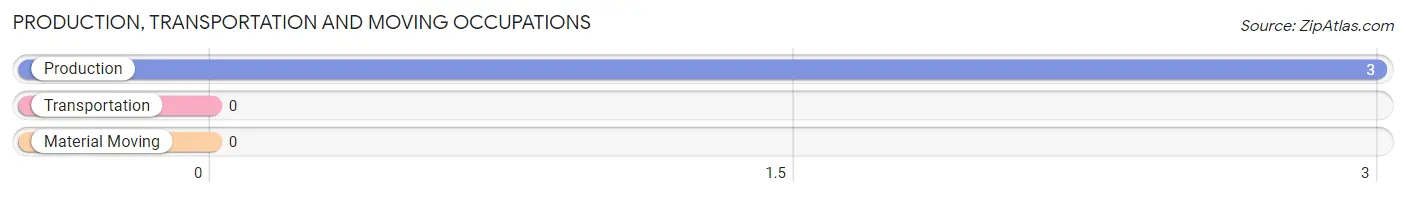
Production, Transportation and Moving Occupations by Sex
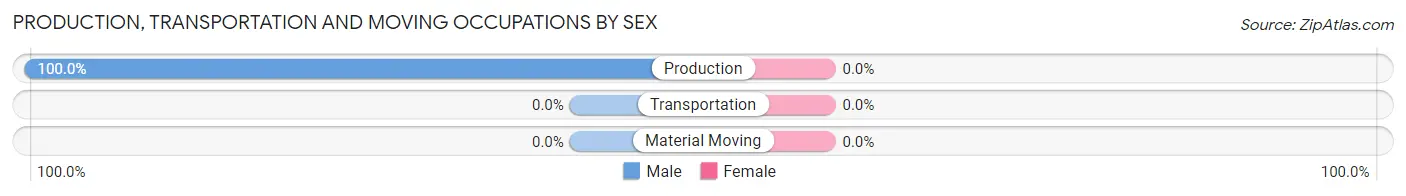
| Occupation | Male | Female |
| Production | 3 (100.0%) | 0 (0.0%) |
| Transportation | 0 (0.0%) | 0 (0.0%) |
| Material Moving | 0 (0.0%) | 0 (0.0%) |
| Total (Category) | 3 (100.0%) | 0 (0.0%) |
| Total (Overall) | 43 (55.8%) | 34 (44.2%) |
Employment Industries by Sex in Marenisco
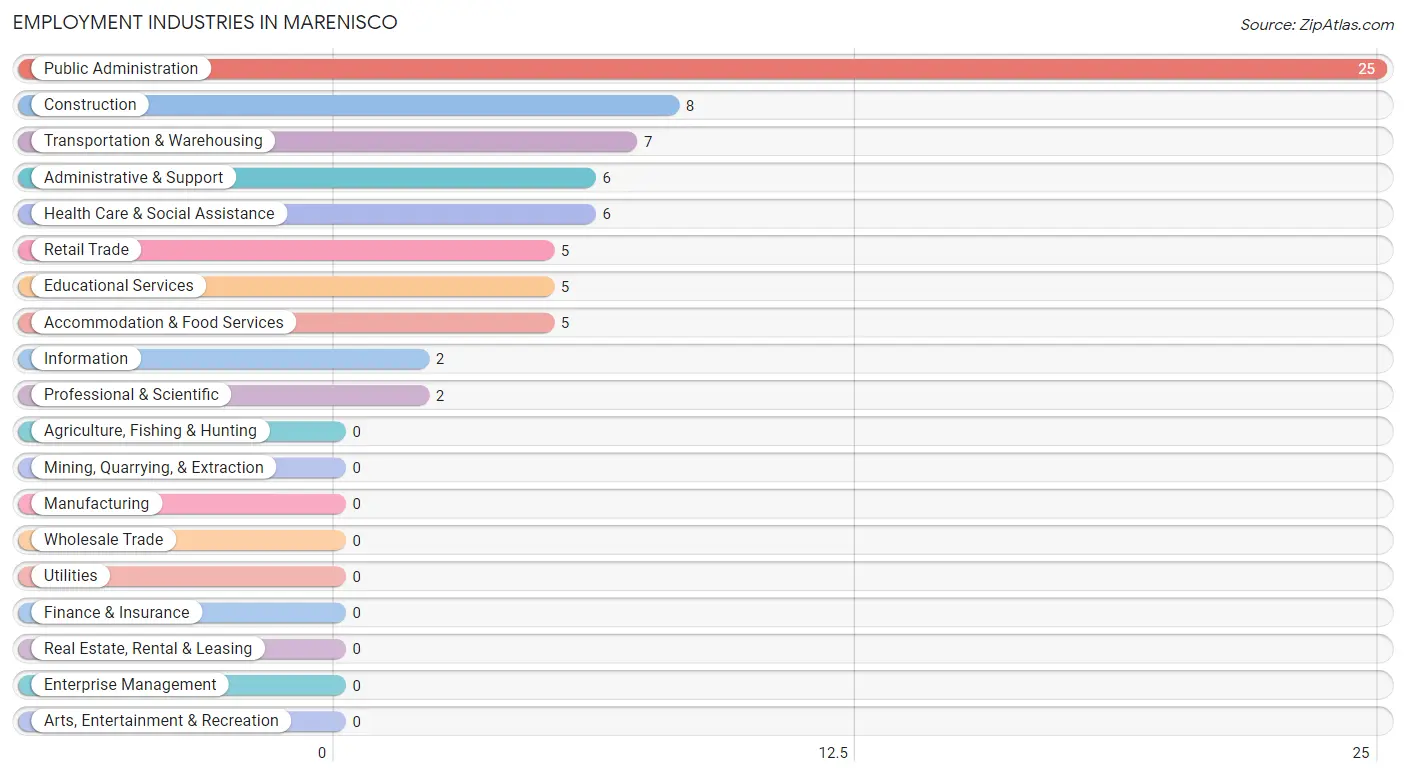
Employment Industries in Marenisco
The major employment industries in Marenisco include Public Administration (25 | 32.5%), Construction (8 | 10.4%), Transportation & Warehousing (7 | 9.1%), Administrative & Support (6 | 7.8%), and Health Care & Social Assistance (6 | 7.8%).
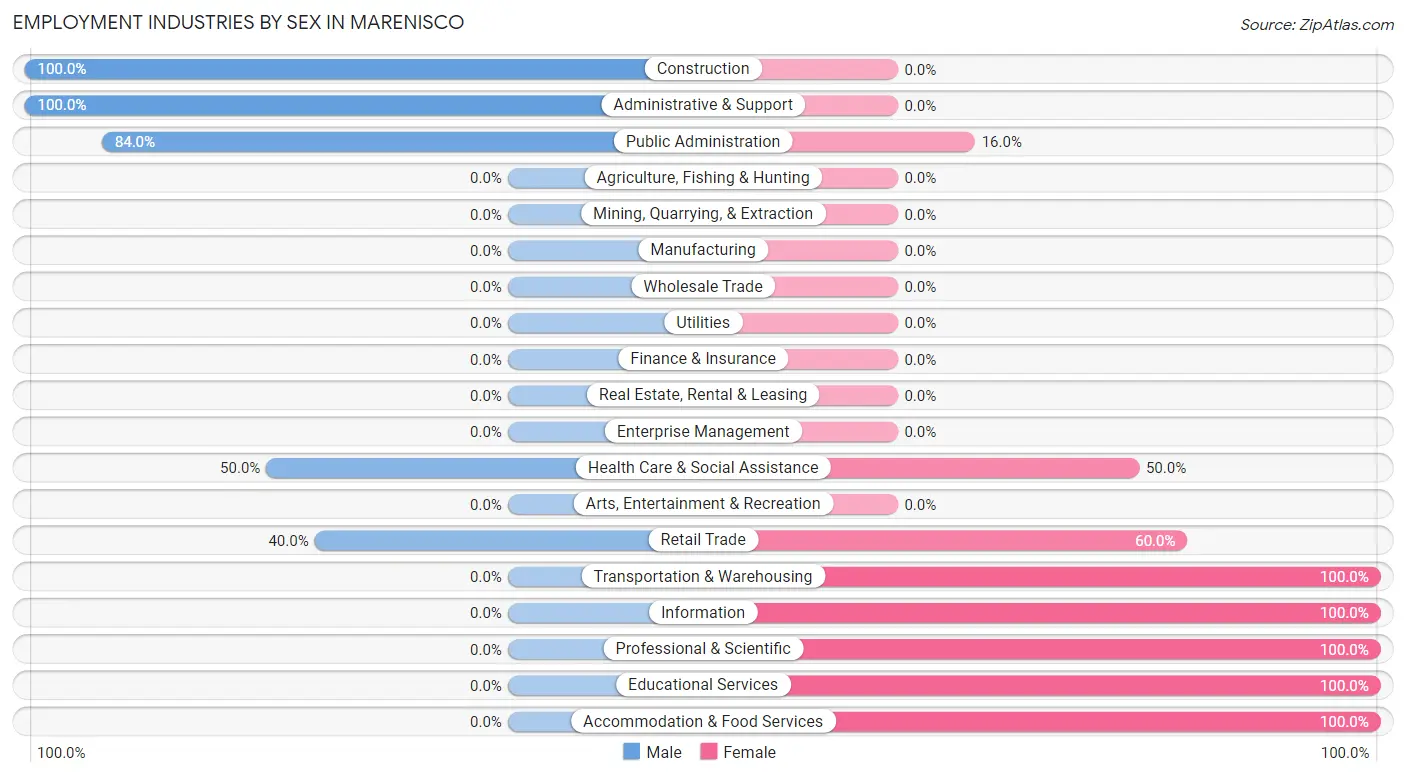
Employment Industries by Sex in Marenisco
The Marenisco industries that see more men than women are Construction (100.0%), Administrative & Support (100.0%), and Public Administration (84.0%), whereas the industries that tend to have a higher number of women are Transportation & Warehousing (100.0%), Information (100.0%), and Professional & Scientific (100.0%).
| Industry | Male | Female |
| Agriculture, Fishing & Hunting | 0 (0.0%) | 0 (0.0%) |
| Mining, Quarrying, & Extraction | 0 (0.0%) | 0 (0.0%) |
| Construction | 8 (100.0%) | 0 (0.0%) |
| Manufacturing | 0 (0.0%) | 0 (0.0%) |
| Wholesale Trade | 0 (0.0%) | 0 (0.0%) |
| Retail Trade | 2 (40.0%) | 3 (60.0%) |
| Transportation & Warehousing | 0 (0.0%) | 7 (100.0%) |
| Utilities | 0 (0.0%) | 0 (0.0%) |
| Information | 0 (0.0%) | 2 (100.0%) |
| Finance & Insurance | 0 (0.0%) | 0 (0.0%) |
| Real Estate, Rental & Leasing | 0 (0.0%) | 0 (0.0%) |
| Professional & Scientific | 0 (0.0%) | 2 (100.0%) |
| Enterprise Management | 0 (0.0%) | 0 (0.0%) |
| Administrative & Support | 6 (100.0%) | 0 (0.0%) |
| Educational Services | 0 (0.0%) | 5 (100.0%) |
| Health Care & Social Assistance | 3 (50.0%) | 3 (50.0%) |
| Arts, Entertainment & Recreation | 0 (0.0%) | 0 (0.0%) |
| Accommodation & Food Services | 0 (0.0%) | 5 (100.0%) |
| Public Administration | 21 (84.0%) | 4 (16.0%) |
| Total | 43 (55.8%) | 34 (44.2%) |
Education in Marenisco
School Enrollment in Marenisco
The most common levels of schooling among the 49 students in Marenisco are middle school (18 | 36.7%), high school (16 | 32.7%), and elementary school (10 | 20.4%).
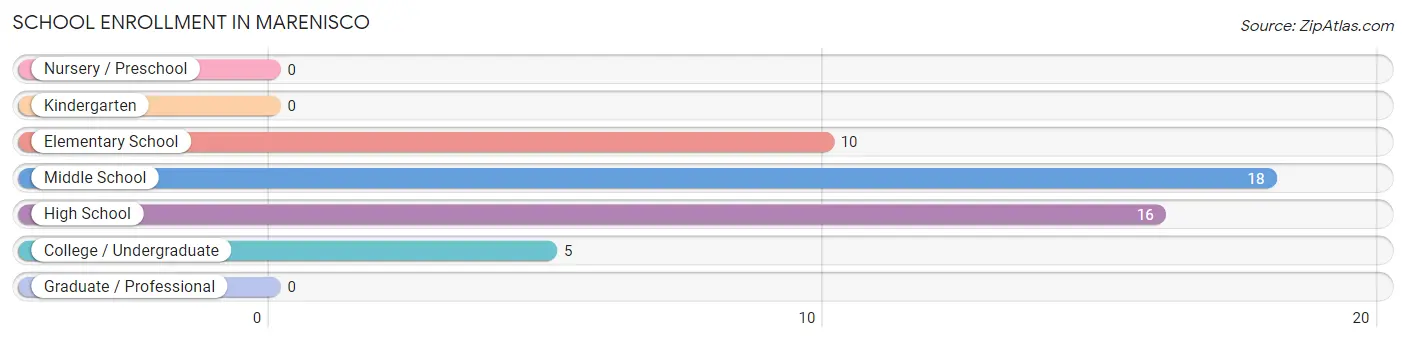
| School Level | # Students | % Students |
| Nursery / Preschool | 0 | 0.0% |
| Kindergarten | 0 | 0.0% |
| Elementary School | 10 | 20.4% |
| Middle School | 18 | 36.7% |
| High School | 16 | 32.7% |
| College / Undergraduate | 5 | 10.2% |
| Graduate / Professional | 0 | 0.0% |
| Total | 49 | 100.0% |
School Enrollment by Age by Funding Source in Marenisco
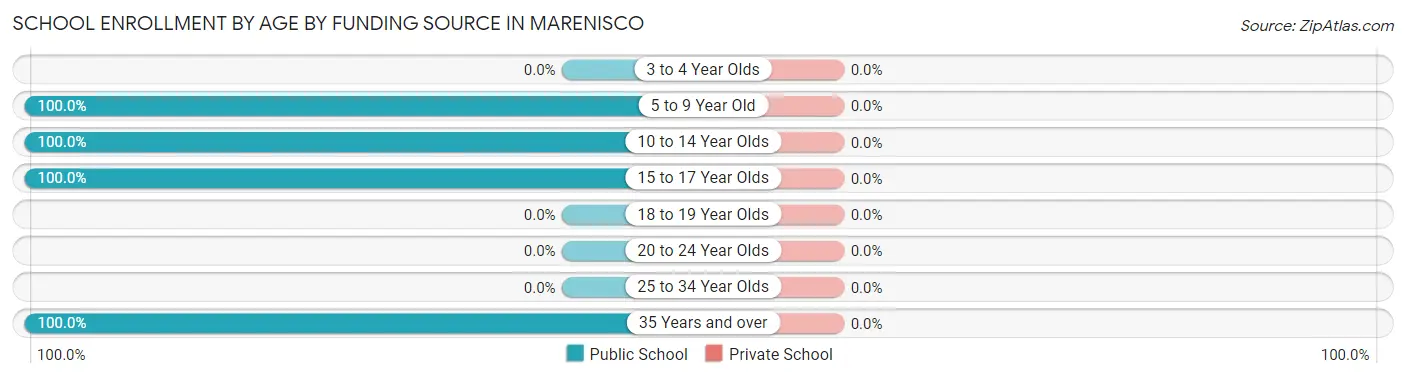
| Age Bracket | Public School | Private School |
| 3 to 4 Year Olds | 0 (0.0%) | 0 (0.0%) |
| 5 to 9 Year Old | 10 (100.0%) | 0 (0.0%) |
| 10 to 14 Year Olds | 26 (100.0%) | 0 (0.0%) |
| 15 to 17 Year Olds | 8 (100.0%) | 0 (0.0%) |
| 18 to 19 Year Olds | 0 (0.0%) | 0 (0.0%) |
| 20 to 24 Year Olds | 0 (0.0%) | 0 (0.0%) |
| 25 to 34 Year Olds | 0 (0.0%) | 0 (0.0%) |
| 35 Years and over | 5 (100.0%) | 0 (0.0%) |
| Total | 49 (100.0%) | 0 (0.0%) |
Educational Attainment by Field of Study in Marenisco
Science & technology (9 | 36.0%), education (7 | 28.0%), psychology (3 | 12.0%), social sciences (3 | 12.0%), and arts & humanities (3 | 12.0%) are the most common fields of study among 25 individuals in Marenisco who have obtained a bachelor's degree or higher.
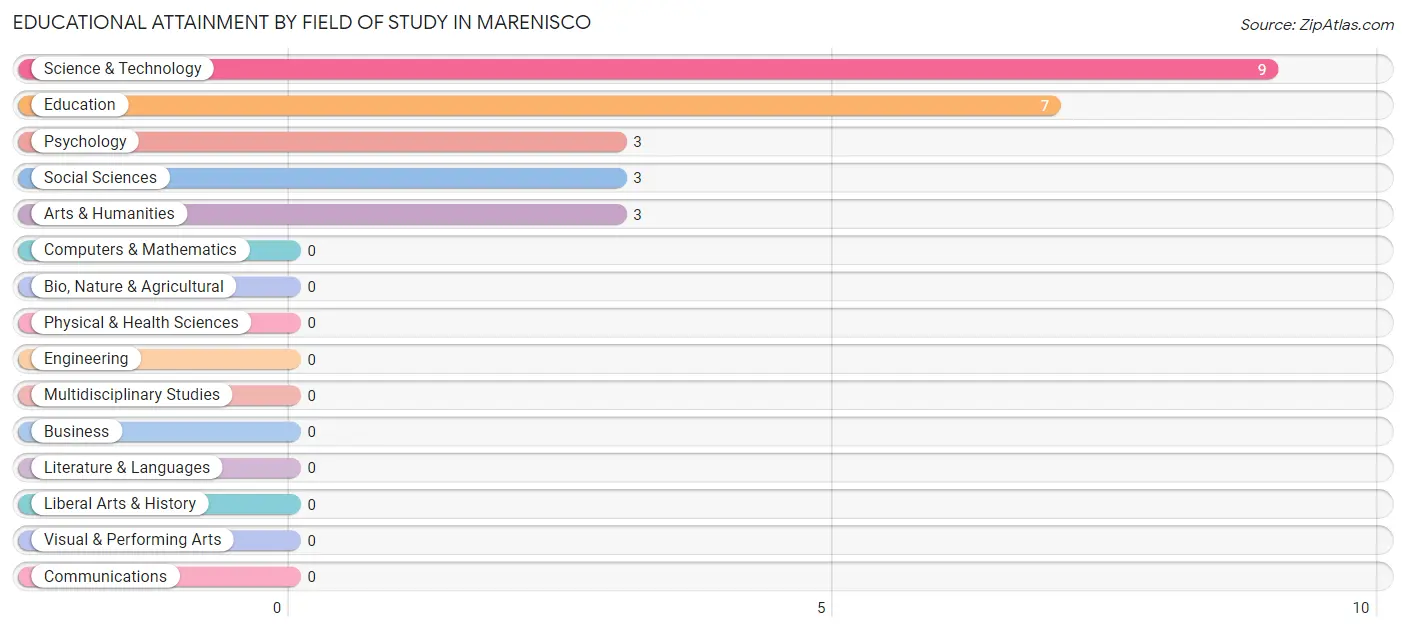
| Field of Study | # Graduates | % Graduates |
| Computers & Mathematics | 0 | 0.0% |
| Bio, Nature & Agricultural | 0 | 0.0% |
| Physical & Health Sciences | 0 | 0.0% |
| Psychology | 3 | 12.0% |
| Social Sciences | 3 | 12.0% |
| Engineering | 0 | 0.0% |
| Multidisciplinary Studies | 0 | 0.0% |
| Science & Technology | 9 | 36.0% |
| Business | 0 | 0.0% |
| Education | 7 | 28.0% |
| Literature & Languages | 0 | 0.0% |
| Liberal Arts & History | 0 | 0.0% |
| Visual & Performing Arts | 0 | 0.0% |
| Communications | 0 | 0.0% |
| Arts & Humanities | 3 | 12.0% |
| Total | 25 | 100.0% |
Transportation & Commute in Marenisco
Vehicle Availability by Sex in Marenisco
The most prevalent vehicle ownership categories in Marenisco are males with 2 vehicles (18, accounting for 41.9%) and females with 2 vehicles (15, making up 52.9%).
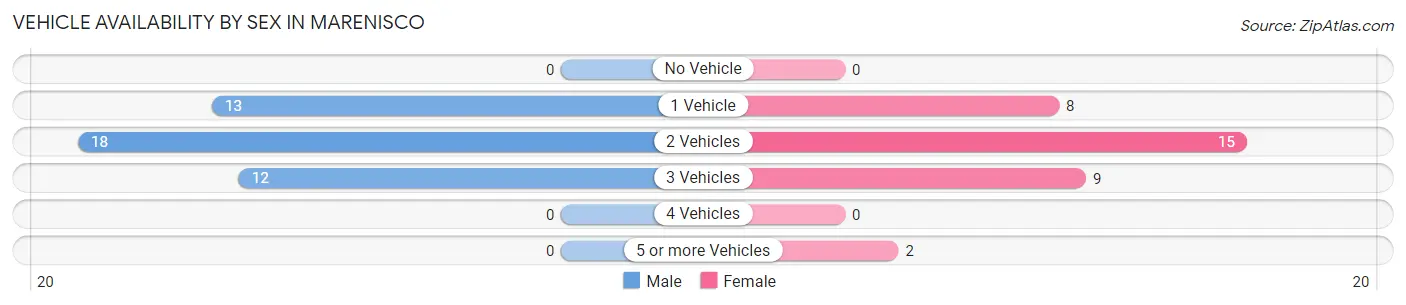
| Vehicles Available | Male | Female |
| No Vehicle | 0 (0.0%) | 0 (0.0%) |
| 1 Vehicle | 13 (30.2%) | 8 (23.5%) |
| 2 Vehicles | 18 (41.9%) | 15 (44.1%) |
| 3 Vehicles | 12 (27.9%) | 9 (26.5%) |
| 4 Vehicles | 0 (0.0%) | 0 (0.0%) |
| 5 or more Vehicles | 0 (0.0%) | 2 (5.9%) |
| Total | 43 (100.0%) | 34 (100.0%) |
Commute Time in Marenisco
The most frequently occuring commute durations in Marenisco are 40 to 44 minutes (14 commuters, 19.4%), 10 to 14 minutes (12 commuters, 16.7%), and less than 5 minutes (10 commuters, 13.9%).
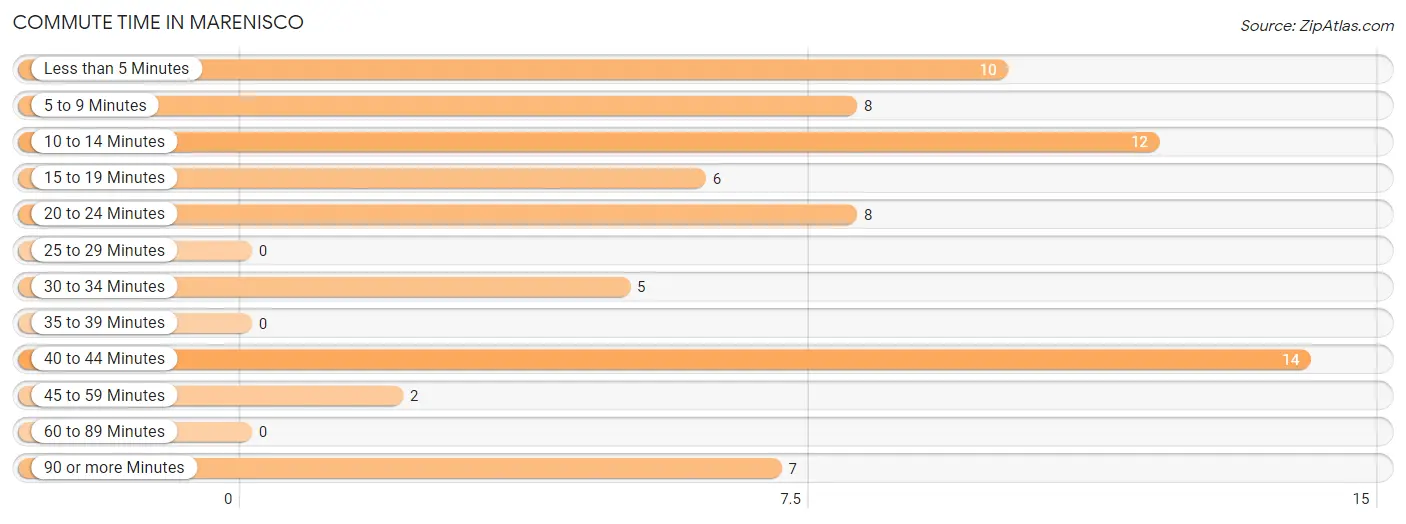
| Commute Time | # Commuters | % Commuters |
| Less than 5 Minutes | 10 | 13.9% |
| 5 to 9 Minutes | 8 | 11.1% |
| 10 to 14 Minutes | 12 | 16.7% |
| 15 to 19 Minutes | 6 | 8.3% |
| 20 to 24 Minutes | 8 | 11.1% |
| 25 to 29 Minutes | 0 | 0.0% |
| 30 to 34 Minutes | 5 | 6.9% |
| 35 to 39 Minutes | 0 | 0.0% |
| 40 to 44 Minutes | 14 | 19.4% |
| 45 to 59 Minutes | 2 | 2.8% |
| 60 to 89 Minutes | 0 | 0.0% |
| 90 or more Minutes | 7 | 9.7% |
Commute Time by Sex in Marenisco
The most common commute times in Marenisco are 40 to 44 minutes (14 commuters, 32.6%) for males and 90 or more minutes (7 commuters, 24.1%) for females.
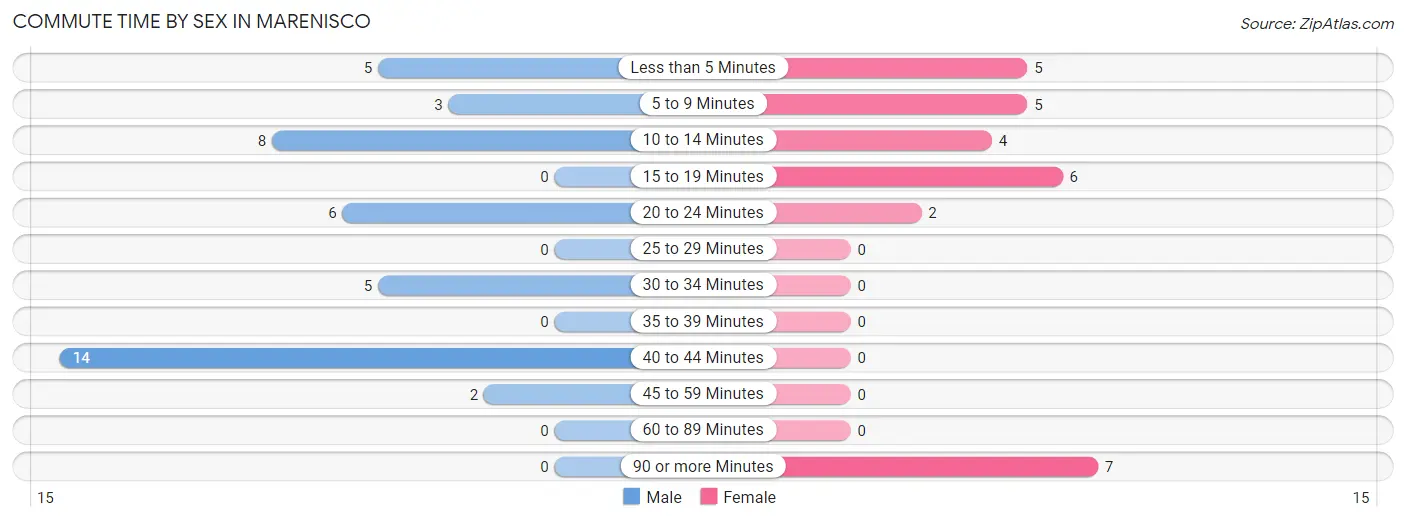
| Commute Time | Male | Female |
| Less than 5 Minutes | 5 (11.6%) | 5 (17.2%) |
| 5 to 9 Minutes | 3 (7.0%) | 5 (17.2%) |
| 10 to 14 Minutes | 8 (18.6%) | 4 (13.8%) |
| 15 to 19 Minutes | 0 (0.0%) | 6 (20.7%) |
| 20 to 24 Minutes | 6 (14.0%) | 2 (6.9%) |
| 25 to 29 Minutes | 0 (0.0%) | 0 (0.0%) |
| 30 to 34 Minutes | 5 (11.6%) | 0 (0.0%) |
| 35 to 39 Minutes | 0 (0.0%) | 0 (0.0%) |
| 40 to 44 Minutes | 14 (32.6%) | 0 (0.0%) |
| 45 to 59 Minutes | 2 (4.6%) | 0 (0.0%) |
| 60 to 89 Minutes | 0 (0.0%) | 0 (0.0%) |
| 90 or more Minutes | 0 (0.0%) | 7 (24.1%) |
Time of Departure to Work by Sex in Marenisco
The most frequent times of departure to work in Marenisco are 7:00 AM to 7:29 AM (19, 44.2%) for males and 7:00 AM to 7:29 AM (12, 41.4%) for females.
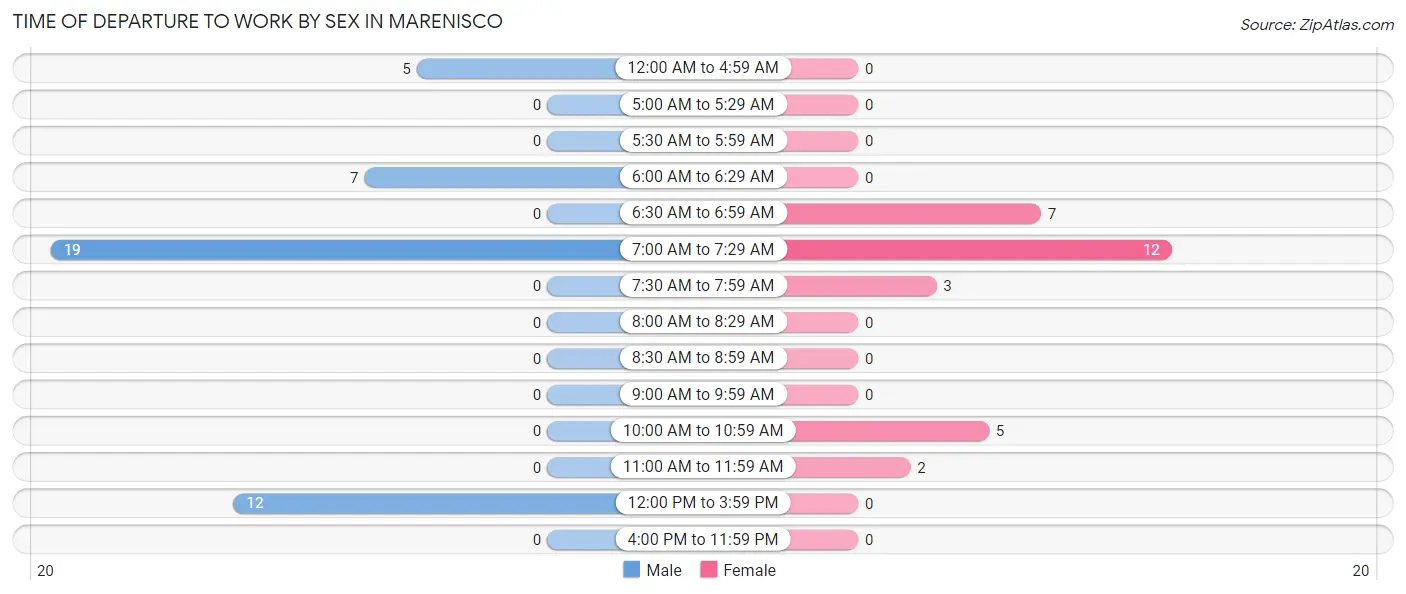
| Time of Departure | Male | Female |
| 12:00 AM to 4:59 AM | 5 (11.6%) | 0 (0.0%) |
| 5:00 AM to 5:29 AM | 0 (0.0%) | 0 (0.0%) |
| 5:30 AM to 5:59 AM | 0 (0.0%) | 0 (0.0%) |
| 6:00 AM to 6:29 AM | 7 (16.3%) | 0 (0.0%) |
| 6:30 AM to 6:59 AM | 0 (0.0%) | 7 (24.1%) |
| 7:00 AM to 7:29 AM | 19 (44.2%) | 12 (41.4%) |
| 7:30 AM to 7:59 AM | 0 (0.0%) | 3 (10.3%) |
| 8:00 AM to 8:29 AM | 0 (0.0%) | 0 (0.0%) |
| 8:30 AM to 8:59 AM | 0 (0.0%) | 0 (0.0%) |
| 9:00 AM to 9:59 AM | 0 (0.0%) | 0 (0.0%) |
| 10:00 AM to 10:59 AM | 0 (0.0%) | 5 (17.2%) |
| 11:00 AM to 11:59 AM | 0 (0.0%) | 2 (6.9%) |
| 12:00 PM to 3:59 PM | 12 (27.9%) | 0 (0.0%) |
| 4:00 PM to 11:59 PM | 0 (0.0%) | 0 (0.0%) |
| Total | 43 (100.0%) | 29 (100.0%) |
Housing Occupancy in Marenisco
Occupancy by Ownership in Marenisco
Of the total 121 dwellings in Marenisco, owner-occupied units account for 118 (97.5%), while renter-occupied units make up 3 (2.5%).
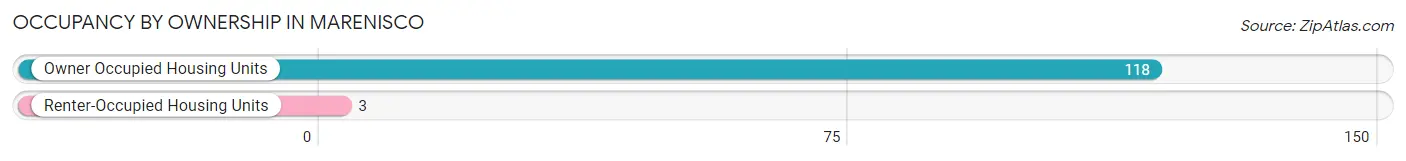
| Occupancy | # Housing Units | % Housing Units |
| Owner Occupied Housing Units | 118 | 97.5% |
| Renter-Occupied Housing Units | 3 | 2.5% |
| Total Occupied Housing Units | 121 | 100.0% |
Occupancy by Household Size in Marenisco
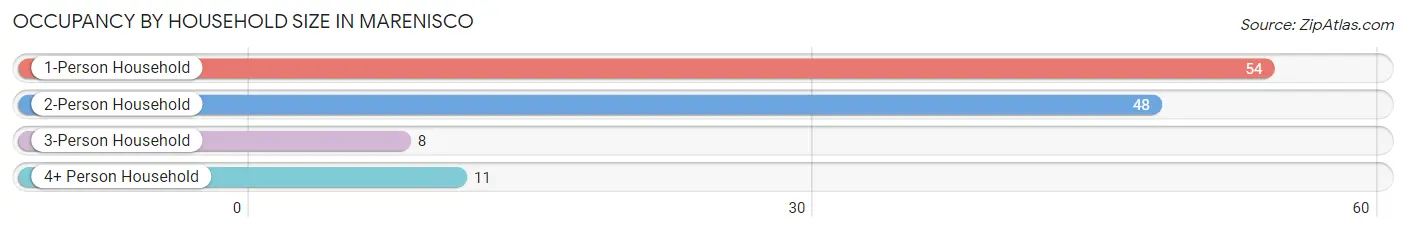
| Household Size | # Housing Units | % Housing Units |
| 1-Person Household | 54 | 44.6% |
| 2-Person Household | 48 | 39.7% |
| 3-Person Household | 8 | 6.6% |
| 4+ Person Household | 11 | 9.1% |
| Total Housing Units | 121 | 100.0% |
Occupancy by Ownership by Household Size in Marenisco
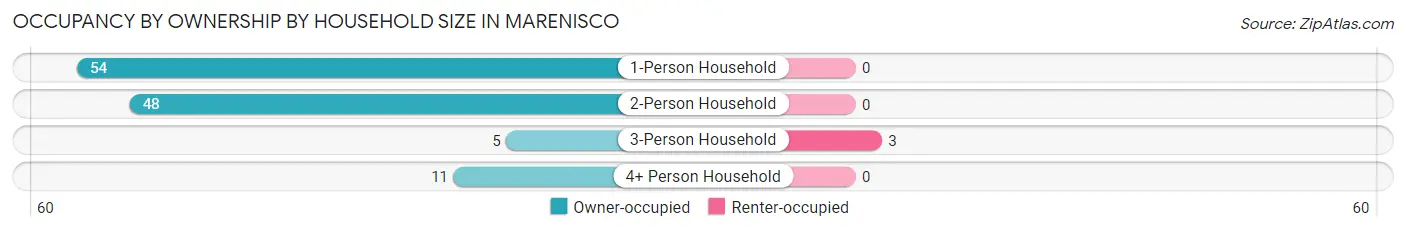
| Household Size | Owner-occupied | Renter-occupied |
| 1-Person Household | 54 (100.0%) | 0 (0.0%) |
| 2-Person Household | 48 (100.0%) | 0 (0.0%) |
| 3-Person Household | 5 (62.5%) | 3 (37.5%) |
| 4+ Person Household | 11 (100.0%) | 0 (0.0%) |
| Total Housing Units | 118 (97.5%) | 3 (2.5%) |
Occupancy by Educational Attainment in Marenisco
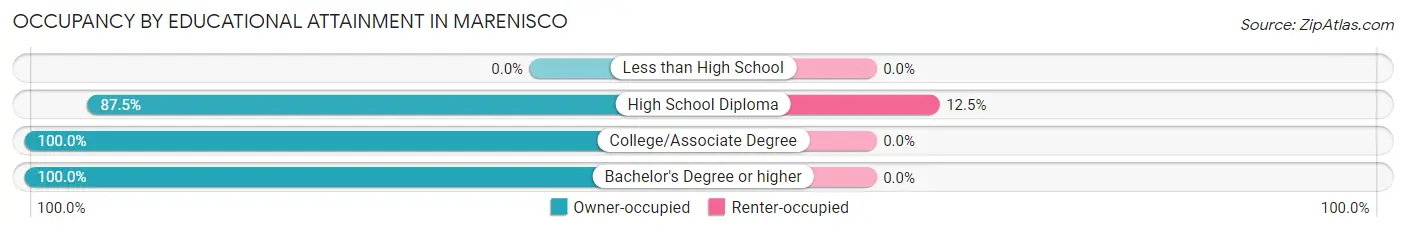
| Household Size | Owner-occupied | Renter-occupied |
| Less than High School | 0 (0.0%) | 0 (0.0%) |
| High School Diploma | 21 (87.5%) | 3 (12.5%) |
| College/Associate Degree | 75 (100.0%) | 0 (0.0%) |
| Bachelor's Degree or higher | 22 (100.0%) | 0 (0.0%) |
Occupancy by Age of Householder in Marenisco
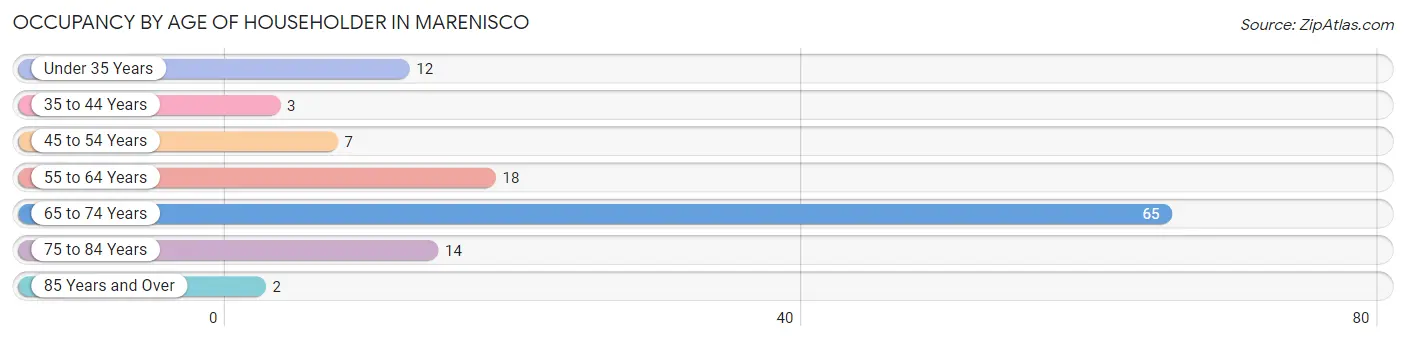
| Age Bracket | # Households | % Households |
| Under 35 Years | 12 | 9.9% |
| 35 to 44 Years | 3 | 2.5% |
| 45 to 54 Years | 7 | 5.8% |
| 55 to 64 Years | 18 | 14.9% |
| 65 to 74 Years | 65 | 53.7% |
| 75 to 84 Years | 14 | 11.6% |
| 85 Years and Over | 2 | 1.7% |
| Total | 121 | 100.0% |
Housing Finances in Marenisco
Median Income by Occupancy in Marenisco
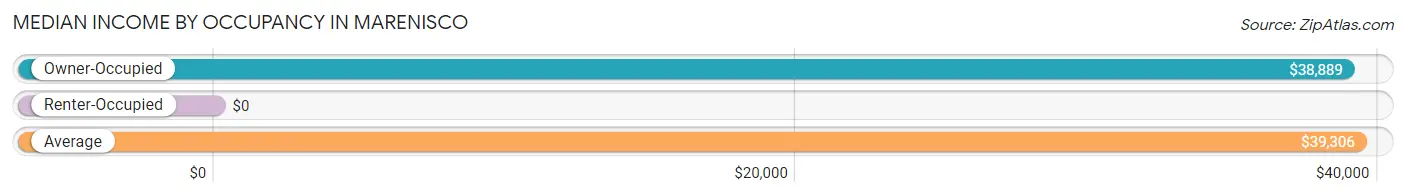
| Occupancy Type | # Households | Median Income |
| Owner-Occupied | 118 (97.5%) | $38,889 |
| Renter-Occupied | 3 (2.5%) | $0 |
| Average | 121 (100.0%) | $39,306 |
Occupancy by Householder Income Bracket in Marenisco
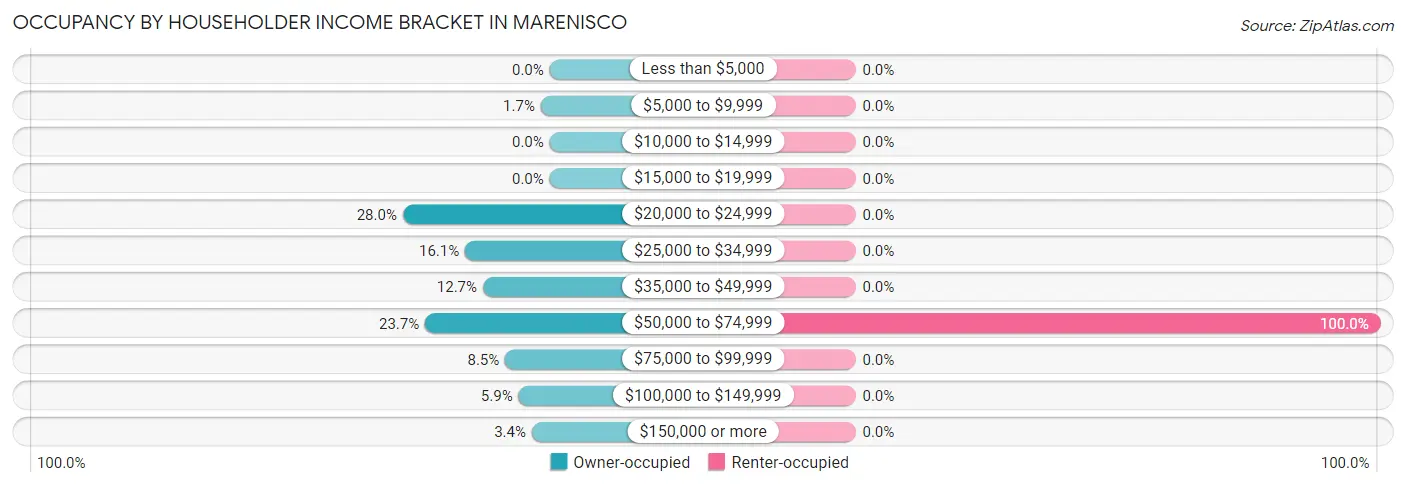
| Income Bracket | Owner-occupied | Renter-occupied |
| Less than $5,000 | 0 (0.0%) | 0 (0.0%) |
| $5,000 to $9,999 | 2 (1.7%) | 0 (0.0%) |
| $10,000 to $14,999 | 0 (0.0%) | 0 (0.0%) |
| $15,000 to $19,999 | 0 (0.0%) | 0 (0.0%) |
| $20,000 to $24,999 | 33 (28.0%) | 0 (0.0%) |
| $25,000 to $34,999 | 19 (16.1%) | 0 (0.0%) |
| $35,000 to $49,999 | 15 (12.7%) | 0 (0.0%) |
| $50,000 to $74,999 | 28 (23.7%) | 3 (100.0%) |
| $75,000 to $99,999 | 10 (8.5%) | 0 (0.0%) |
| $100,000 to $149,999 | 7 (5.9%) | 0 (0.0%) |
| $150,000 or more | 4 (3.4%) | 0 (0.0%) |
| Total | 118 (100.0%) | 3 (100.0%) |
Monthly Housing Cost Tiers in Marenisco
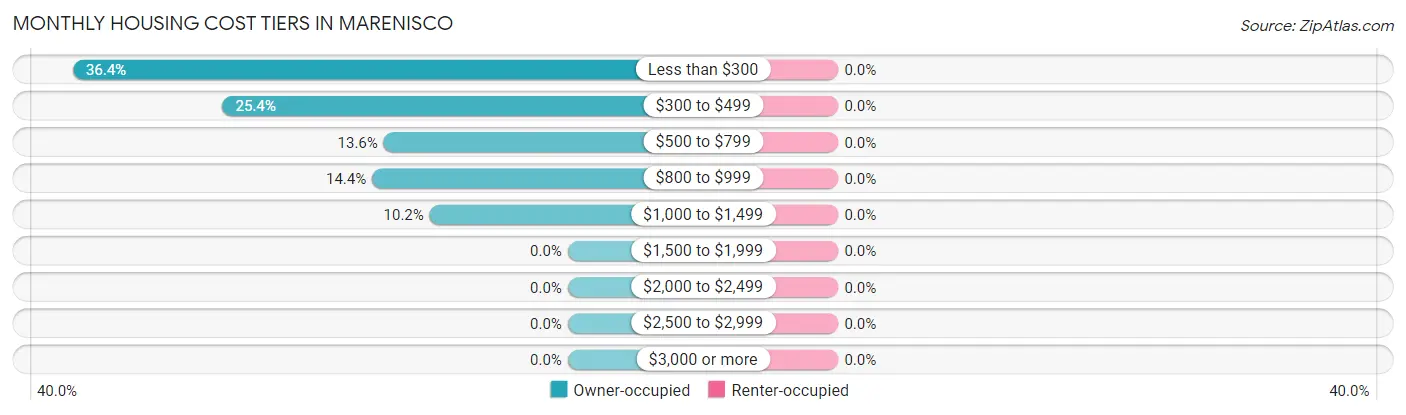
| Monthly Cost | Owner-occupied | Renter-occupied |
| Less than $300 | 43 (36.4%) | 0 (0.0%) |
| $300 to $499 | 30 (25.4%) | 0 (0.0%) |
| $500 to $799 | 16 (13.6%) | 0 (0.0%) |
| $800 to $999 | 17 (14.4%) | 0 (0.0%) |
| $1,000 to $1,499 | 12 (10.2%) | 0 (0.0%) |
| $1,500 to $1,999 | 0 (0.0%) | 0 (0.0%) |
| $2,000 to $2,499 | 0 (0.0%) | 0 (0.0%) |
| $2,500 to $2,999 | 0 (0.0%) | 0 (0.0%) |
| $3,000 or more | 0 (0.0%) | 0 (0.0%) |
| Total | 118 (100.0%) | 3 (100.0%) |
Physical Housing Characteristics in Marenisco
Housing Structures in Marenisco
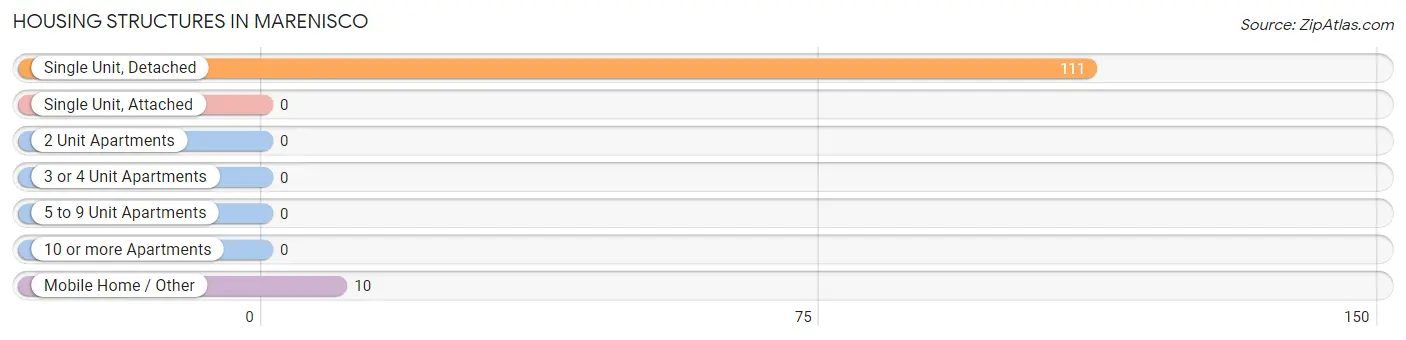
| Structure Type | # Housing Units | % Housing Units |
| Single Unit, Detached | 111 | 91.7% |
| Single Unit, Attached | 0 | 0.0% |
| 2 Unit Apartments | 0 | 0.0% |
| 3 or 4 Unit Apartments | 0 | 0.0% |
| 5 to 9 Unit Apartments | 0 | 0.0% |
| 10 or more Apartments | 0 | 0.0% |
| Mobile Home / Other | 10 | 8.3% |
| Total | 121 | 100.0% |
Housing Structures by Occupancy in Marenisco
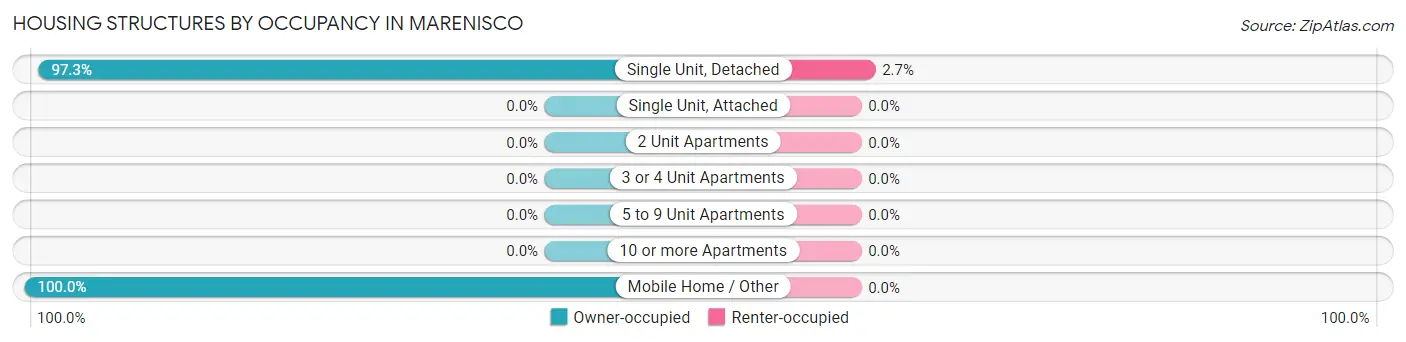
| Structure Type | Owner-occupied | Renter-occupied |
| Single Unit, Detached | 108 (97.3%) | 3 (2.7%) |
| Single Unit, Attached | 0 (0.0%) | 0 (0.0%) |
| 2 Unit Apartments | 0 (0.0%) | 0 (0.0%) |
| 3 or 4 Unit Apartments | 0 (0.0%) | 0 (0.0%) |
| 5 to 9 Unit Apartments | 0 (0.0%) | 0 (0.0%) |
| 10 or more Apartments | 0 (0.0%) | 0 (0.0%) |
| Mobile Home / Other | 10 (100.0%) | 0 (0.0%) |
| Total | 118 (97.5%) | 3 (2.5%) |
Housing Structures by Number of Rooms in Marenisco
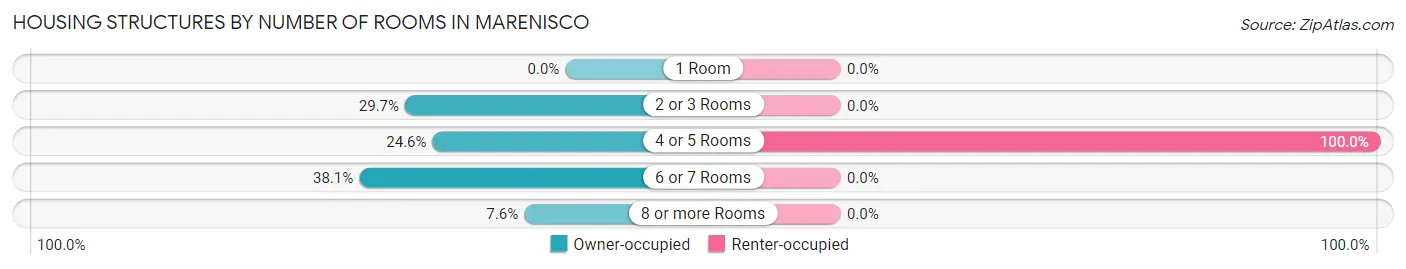
| Number of Rooms | Owner-occupied | Renter-occupied |
| 1 Room | 0 (0.0%) | 0 (0.0%) |
| 2 or 3 Rooms | 35 (29.7%) | 0 (0.0%) |
| 4 or 5 Rooms | 29 (24.6%) | 3 (100.0%) |
| 6 or 7 Rooms | 45 (38.1%) | 0 (0.0%) |
| 8 or more Rooms | 9 (7.6%) | 0 (0.0%) |
| Total | 118 (100.0%) | 3 (100.0%) |
Housing Structure by Heating Type in Marenisco
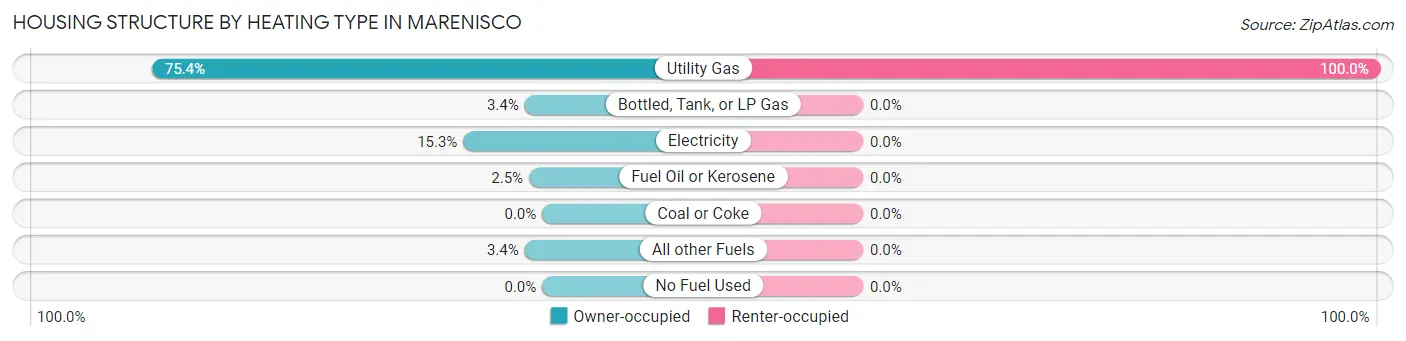
| Heating Type | Owner-occupied | Renter-occupied |
| Utility Gas | 89 (75.4%) | 3 (100.0%) |
| Bottled, Tank, or LP Gas | 4 (3.4%) | 0 (0.0%) |
| Electricity | 18 (15.2%) | 0 (0.0%) |
| Fuel Oil or Kerosene | 3 (2.5%) | 0 (0.0%) |
| Coal or Coke | 0 (0.0%) | 0 (0.0%) |
| All other Fuels | 4 (3.4%) | 0 (0.0%) |
| No Fuel Used | 0 (0.0%) | 0 (0.0%) |
| Total | 118 (100.0%) | 3 (100.0%) |
Household Vehicle Usage in Marenisco
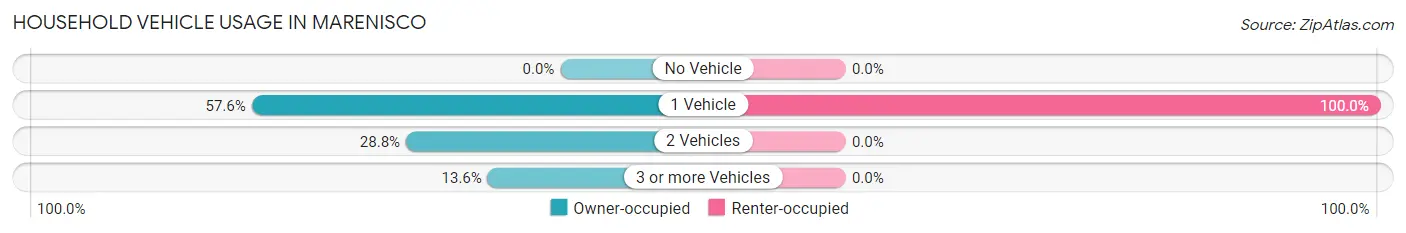
| Vehicles per Household | Owner-occupied | Renter-occupied |
| No Vehicle | 0 (0.0%) | 0 (0.0%) |
| 1 Vehicle | 68 (57.6%) | 3 (100.0%) |
| 2 Vehicles | 34 (28.8%) | 0 (0.0%) |
| 3 or more Vehicles | 16 (13.6%) | 0 (0.0%) |
| Total | 118 (100.0%) | 3 (100.0%) |
Real Estate & Mortgages in Marenisco
Real Estate and Mortgage Overview in Marenisco
| Characteristic | Without Mortgage | With Mortgage |
| Housing Units | 80 | 38 |
| Median Property Value | $42,200 | $50,000 |
| Median Household Income | $30,833 | $4 |
| Monthly Housing Costs | $250 | $0 |
| Real Estate Taxes | $295 | $0 |
Property Value by Mortgage Status in Marenisco
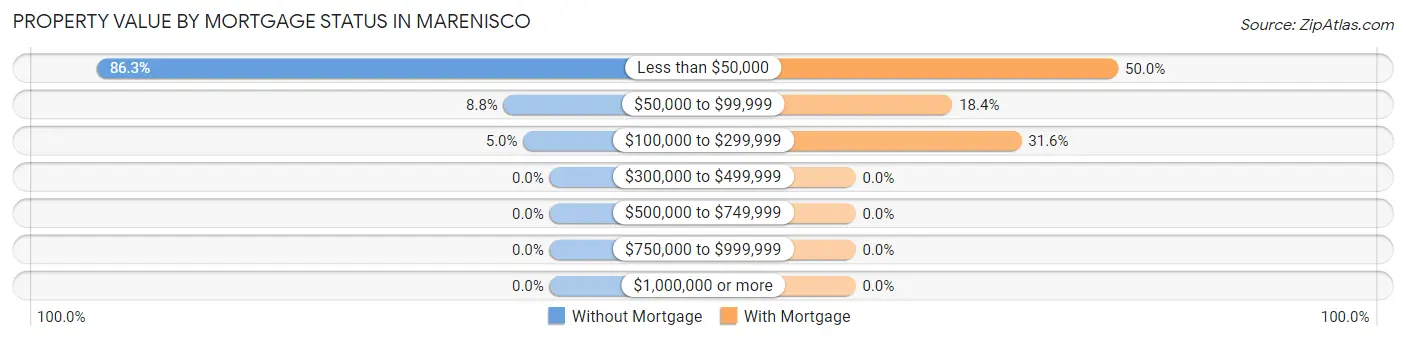
| Property Value | Without Mortgage | With Mortgage |
| Less than $50,000 | 69 (86.3%) | 19 (50.0%) |
| $50,000 to $99,999 | 7 (8.7%) | 7 (18.4%) |
| $100,000 to $299,999 | 4 (5.0%) | 12 (31.6%) |
| $300,000 to $499,999 | 0 (0.0%) | 0 (0.0%) |
| $500,000 to $749,999 | 0 (0.0%) | 0 (0.0%) |
| $750,000 to $999,999 | 0 (0.0%) | 0 (0.0%) |
| $1,000,000 or more | 0 (0.0%) | 0 (0.0%) |
| Total | 80 (100.0%) | 38 (100.0%) |
Household Income by Mortgage Status in Marenisco
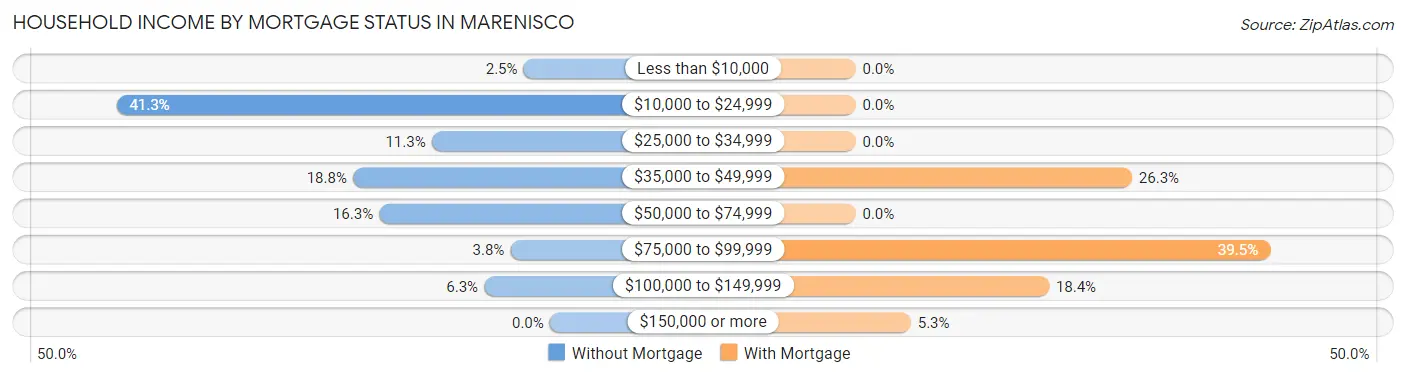
| Household Income | Without Mortgage | With Mortgage |
| Less than $10,000 | 2 (2.5%) | 0 (0.0%) |
| $10,000 to $24,999 | 33 (41.2%) | 0 (0.0%) |
| $25,000 to $34,999 | 9 (11.3%) | 0 (0.0%) |
| $35,000 to $49,999 | 15 (18.8%) | 10 (26.3%) |
| $50,000 to $74,999 | 13 (16.3%) | 0 (0.0%) |
| $75,000 to $99,999 | 3 (3.7%) | 15 (39.5%) |
| $100,000 to $149,999 | 5 (6.2%) | 7 (18.4%) |
| $150,000 or more | 0 (0.0%) | 2 (5.3%) |
| Total | 80 (100.0%) | 38 (100.0%) |
Property Value to Household Income Ratio in Marenisco
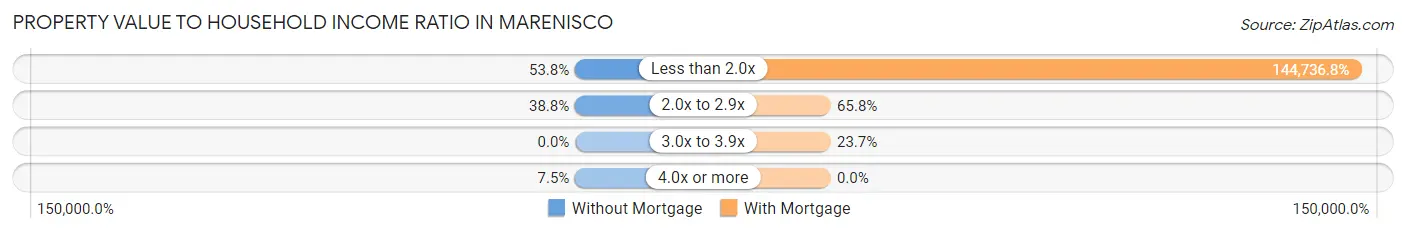
| Value-to-Income Ratio | Without Mortgage | With Mortgage |
| Less than 2.0x | 43 (53.7%) | 55,000 (144,736.8%) |
| 2.0x to 2.9x | 31 (38.8%) | 25 (65.8%) |
| 3.0x to 3.9x | 0 (0.0%) | 9 (23.7%) |
| 4.0x or more | 6 (7.5%) | 0 (0.0%) |
| Total | 80 (100.0%) | 38 (100.0%) |
Real Estate Taxes by Mortgage Status in Marenisco
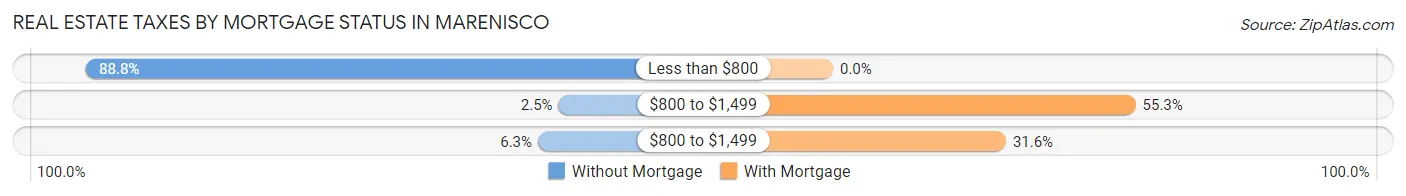
| Property Taxes | Without Mortgage | With Mortgage |
| Less than $800 | 71 (88.7%) | 0 (0.0%) |
| $800 to $1,499 | 2 (2.5%) | 21 (55.3%) |
| $800 to $1,499 | 5 (6.2%) | 12 (31.6%) |
| Total | 80 (100.0%) | 38 (100.0%) |
Health & Disability in Marenisco
Health Insurance Coverage by Age in Marenisco
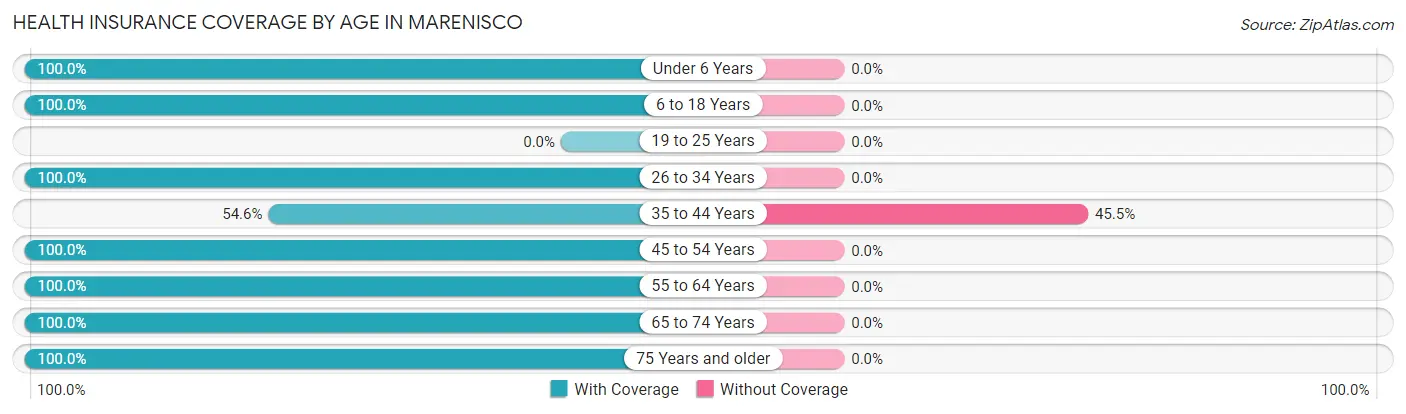
| Age Bracket | With Coverage | Without Coverage |
| Under 6 Years | 6 (100.0%) | 0 (0.0%) |
| 6 to 18 Years | 54 (100.0%) | 0 (0.0%) |
| 19 to 25 Years | 0 (0.0%) | 0 (0.0%) |
| 26 to 34 Years | 16 (100.0%) | 0 (0.0%) |
| 35 to 44 Years | 6 (54.5%) | 5 (45.5%) |
| 45 to 54 Years | 28 (100.0%) | 0 (0.0%) |
| 55 to 64 Years | 23 (100.0%) | 0 (0.0%) |
| 65 to 74 Years | 84 (100.0%) | 0 (0.0%) |
| 75 Years and older | 27 (100.0%) | 0 (0.0%) |
| Total | 244 (98.0%) | 5 (2.0%) |
Health Insurance Coverage by Citizenship Status in Marenisco
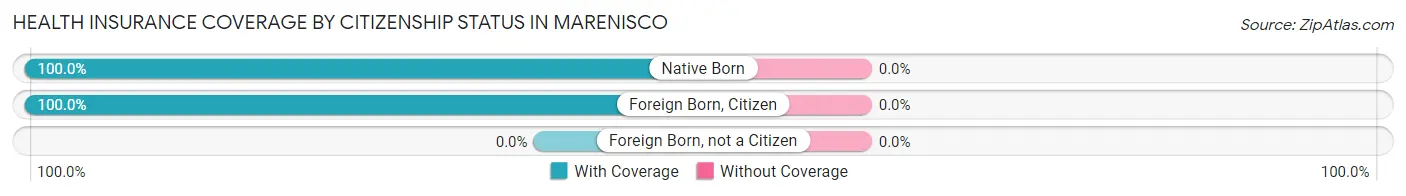
| Citizenship Status | With Coverage | Without Coverage |
| Native Born | 6 (100.0%) | 0 (0.0%) |
| Foreign Born, Citizen | 54 (100.0%) | 0 (0.0%) |
| Foreign Born, not a Citizen | 0 (0.0%) | 0 (0.0%) |
Health Insurance Coverage by Household Income in Marenisco
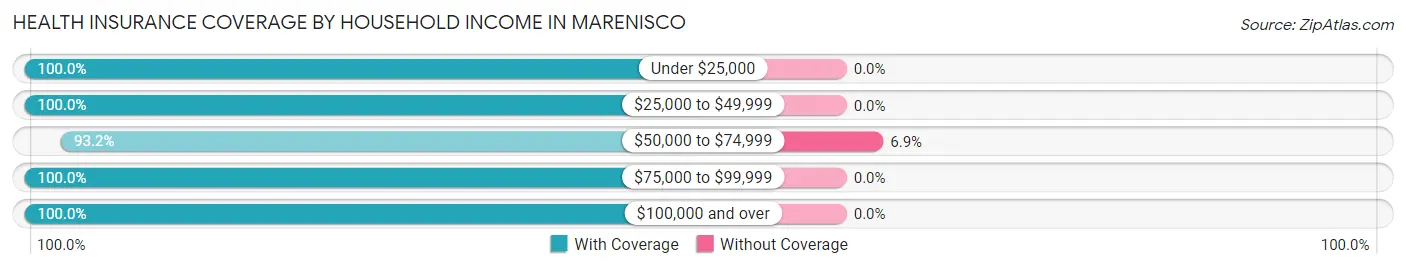
| Household Income | With Coverage | Without Coverage |
| Under $25,000 | 35 (100.0%) | 0 (0.0%) |
| $25,000 to $49,999 | 58 (100.0%) | 0 (0.0%) |
| $50,000 to $74,999 | 68 (93.1%) | 5 (6.9%) |
| $75,000 to $99,999 | 53 (100.0%) | 0 (0.0%) |
| $100,000 and over | 30 (100.0%) | 0 (0.0%) |
Public vs Private Health Insurance Coverage by Age in Marenisco
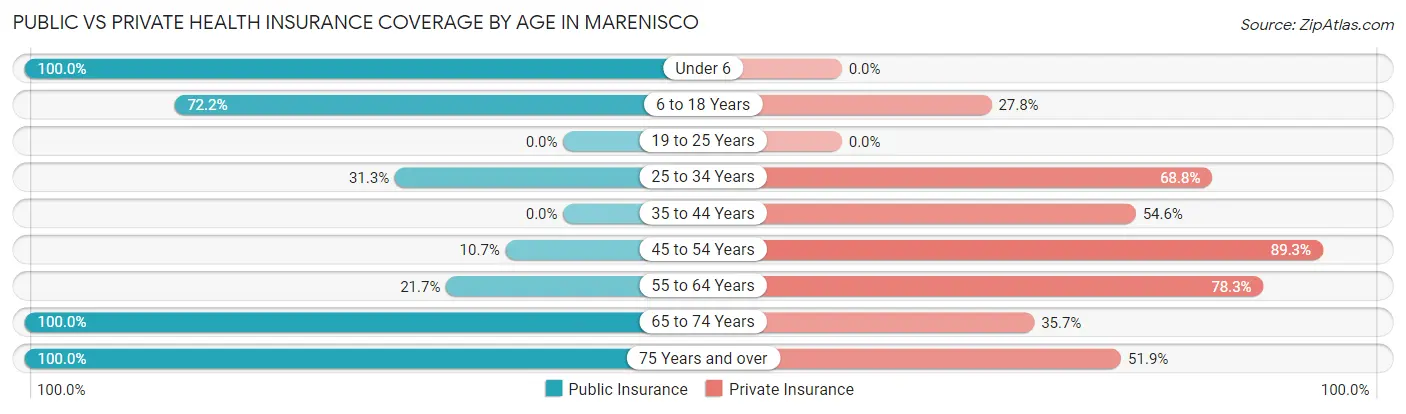
| Age Bracket | Public Insurance | Private Insurance |
| Under 6 | 6 (100.0%) | 0 (0.0%) |
| 6 to 18 Years | 39 (72.2%) | 15 (27.8%) |
| 19 to 25 Years | 0 (0.0%) | 0 (0.0%) |
| 25 to 34 Years | 5 (31.2%) | 11 (68.8%) |
| 35 to 44 Years | 0 (0.0%) | 6 (54.5%) |
| 45 to 54 Years | 3 (10.7%) | 25 (89.3%) |
| 55 to 64 Years | 5 (21.7%) | 18 (78.3%) |
| 65 to 74 Years | 84 (100.0%) | 30 (35.7%) |
| 75 Years and over | 27 (100.0%) | 14 (51.8%) |
| Total | 169 (67.9%) | 119 (47.8%) |
Disability Status by Sex by Age in Marenisco
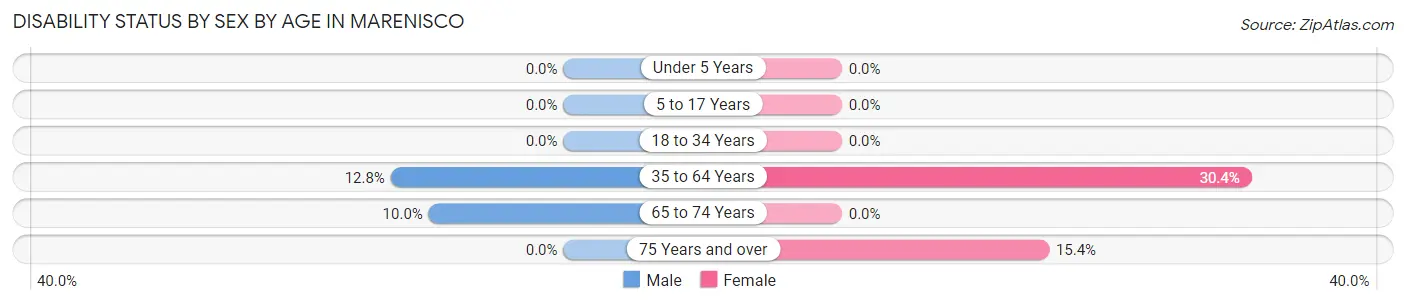
| Age Bracket | Male | Female |
| Under 5 Years | 0 (0.0%) | 0 (0.0%) |
| 5 to 17 Years | 0 (0.0%) | 0 (0.0%) |
| 18 to 34 Years | 0 (0.0%) | 0 (0.0%) |
| 35 to 64 Years | 5 (12.8%) | 7 (30.4%) |
| 65 to 74 Years | 6 (10.0%) | 0 (0.0%) |
| 75 Years and over | 0 (0.0%) | 2 (15.4%) |
Disability Class by Sex by Age in Marenisco
Disability Class: Hearing Difficulty
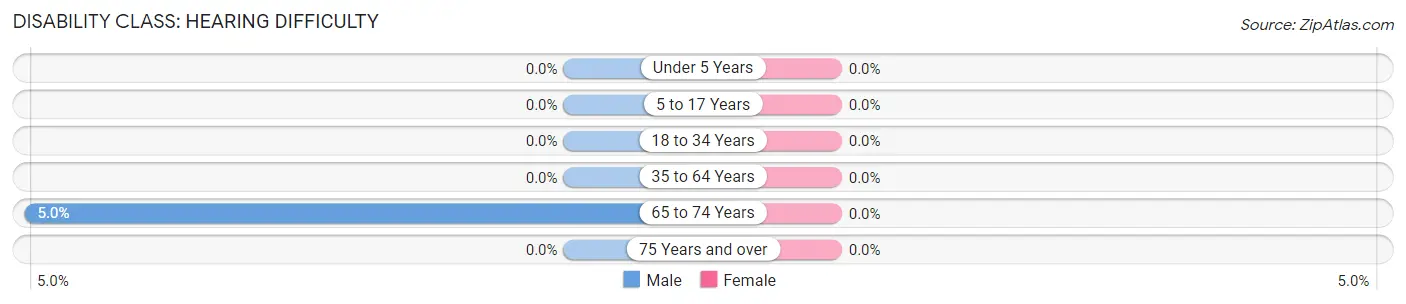
| Age Bracket | Male | Female |
| Under 5 Years | 0 (0.0%) | 0 (0.0%) |
| 5 to 17 Years | 0 (0.0%) | 0 (0.0%) |
| 18 to 34 Years | 0 (0.0%) | 0 (0.0%) |
| 35 to 64 Years | 0 (0.0%) | 0 (0.0%) |
| 65 to 74 Years | 3 (5.0%) | 0 (0.0%) |
| 75 Years and over | 0 (0.0%) | 0 (0.0%) |
Disability Class: Vision Difficulty
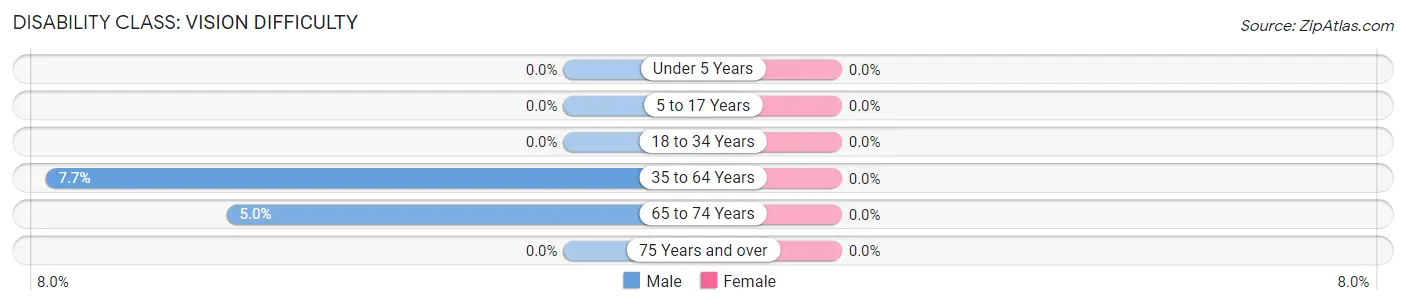
| Age Bracket | Male | Female |
| Under 5 Years | 0 (0.0%) | 0 (0.0%) |
| 5 to 17 Years | 0 (0.0%) | 0 (0.0%) |
| 18 to 34 Years | 0 (0.0%) | 0 (0.0%) |
| 35 to 64 Years | 3 (7.7%) | 0 (0.0%) |
| 65 to 74 Years | 3 (5.0%) | 0 (0.0%) |
| 75 Years and over | 0 (0.0%) | 0 (0.0%) |
Disability Class: Cognitive Difficulty
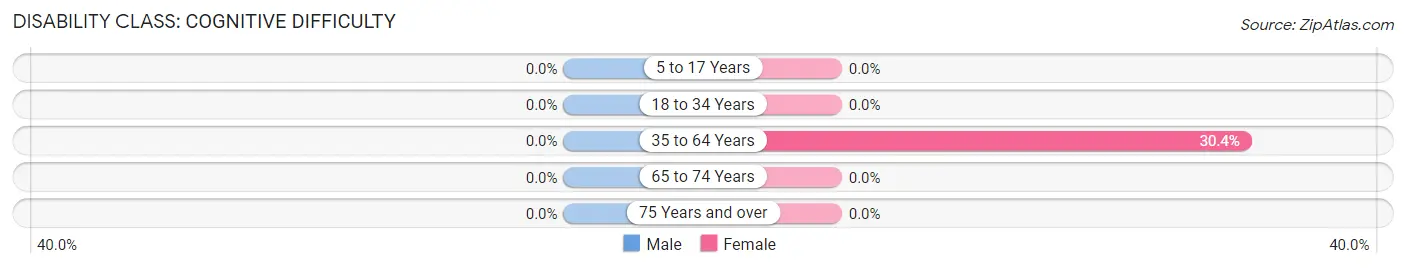
| Age Bracket | Male | Female |
| 5 to 17 Years | 0 (0.0%) | 0 (0.0%) |
| 18 to 34 Years | 0 (0.0%) | 0 (0.0%) |
| 35 to 64 Years | 0 (0.0%) | 7 (30.4%) |
| 65 to 74 Years | 0 (0.0%) | 0 (0.0%) |
| 75 Years and over | 0 (0.0%) | 0 (0.0%) |
Disability Class: Ambulatory Difficulty
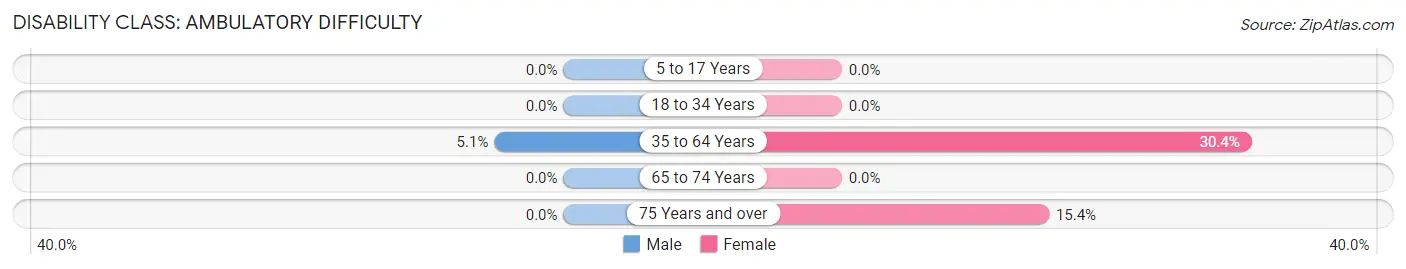
| Age Bracket | Male | Female |
| 5 to 17 Years | 0 (0.0%) | 0 (0.0%) |
| 18 to 34 Years | 0 (0.0%) | 0 (0.0%) |
| 35 to 64 Years | 2 (5.1%) | 7 (30.4%) |
| 65 to 74 Years | 0 (0.0%) | 0 (0.0%) |
| 75 Years and over | 0 (0.0%) | 2 (15.4%) |
Disability Class: Self-Care Difficulty
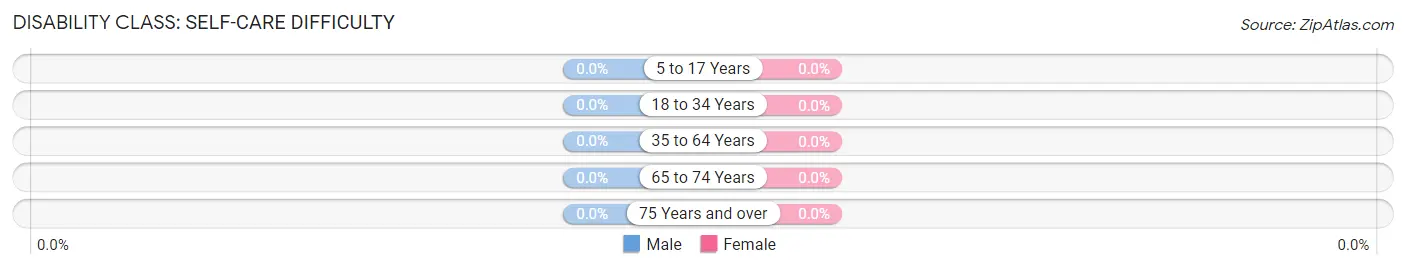
| Age Bracket | Male | Female |
| 5 to 17 Years | 0 (0.0%) | 0 (0.0%) |
| 18 to 34 Years | 0 (0.0%) | 0 (0.0%) |
| 35 to 64 Years | 0 (0.0%) | 0 (0.0%) |
| 65 to 74 Years | 0 (0.0%) | 0 (0.0%) |
| 75 Years and over | 0 (0.0%) | 0 (0.0%) |
Technology Access in Marenisco
Computing Device Access in Marenisco
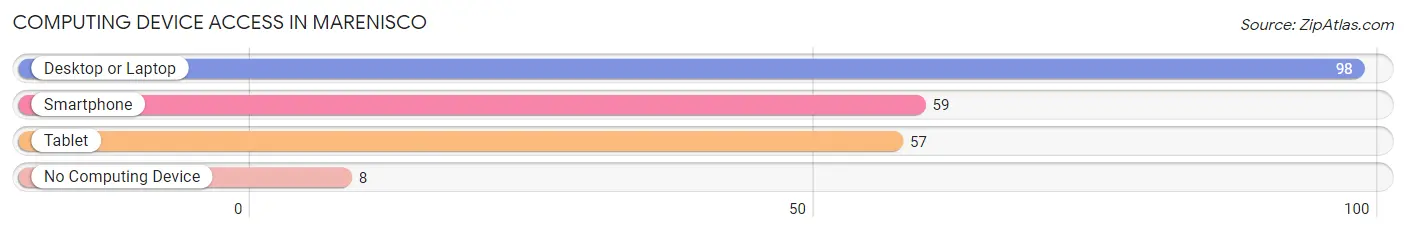
| Device Type | # Households | % Households |
| Desktop or Laptop | 98 | 81.0% |
| Smartphone | 59 | 48.8% |
| Tablet | 57 | 47.1% |
| No Computing Device | 8 | 6.6% |
| Total | 121 | 100.0% |
Internet Access in Marenisco
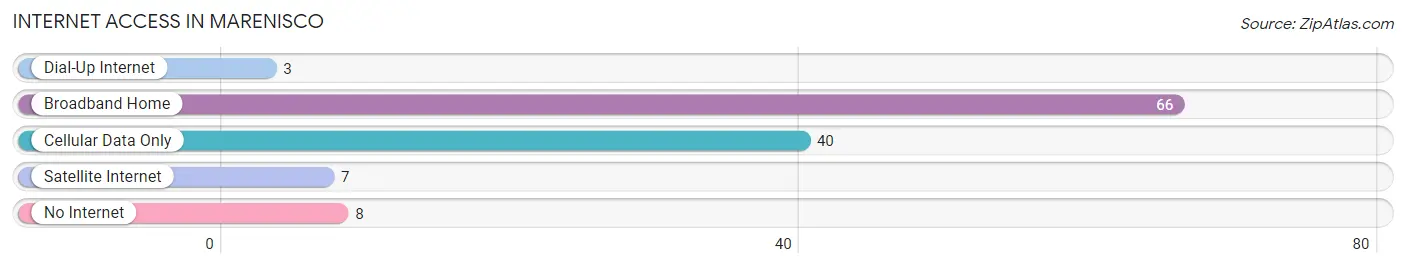
| Internet Type | # Households | % Households |
| Dial-Up Internet | 3 | 2.5% |
| Broadband Home | 66 | 54.5% |
| Cellular Data Only | 40 | 33.1% |
| Satellite Internet | 7 | 5.8% |
| No Internet | 8 | 6.6% |
| Total | 121 | 100.0% |
Marenisco Summary
Marenisco is a small unincorporated community located in the western Upper Peninsula of Michigan. It is situated in the Gogebic County, and is part of the Ironwood Township. The population of Marenisco was estimated to be around 545 in the year 2000.
History
Marenisco was first settled in the late 1800s by Finnish immigrants. The town was originally known as “Finn Town”, and was later renamed Marenisco, which is derived from the Finnish word “maren”, meaning “lake”. The town was officially incorporated in 1891.
Marenisco was a major logging town in the early 1900s, and the town’s economy was largely dependent on the logging industry. The town was also home to several sawmills and a paper mill. The paper mill was the largest employer in the town, and it provided jobs for many of the town’s residents.
The town was also home to a number of small businesses, including a general store, a barber shop, a blacksmith shop, and a hotel. The town also had a post office, a bank, and a school.
Geography
Marenisco is located in the western Upper Peninsula of Michigan, in Gogebic County. The town is situated on the shores of Lake Gogebic, which is the largest natural lake in the Upper Peninsula. The town is surrounded by forests and is located near the Porcupine Mountains State Park.
The town is located about 20 miles south of Ironwood, Michigan, and about 40 miles west of Marquette, Michigan. The town is also located about 30 miles north of the Wisconsin border.
Economy
The economy of Marenisco is largely dependent on tourism. The town is a popular destination for fishing, hunting, and camping. The town is also home to several resorts and lodges, which attract visitors from all over the country.
The town is also home to a number of small businesses, including a general store, a barber shop, a blacksmith shop, and a hotel. The town also has a post office, a bank, and a school.
Demographics
As of the year 2000, the population of Marenisco was estimated to be around 545. The town is predominantly white, with a small percentage of Native American and African American residents. The median household income in the town is around $30,000. The town has a high rate of poverty, with around 25% of the population living below the poverty line. The town also has a high rate of unemployment, with around 10% of the population unemployed.
Common Questions
What is Per Capita Income in Marenisco?
Per Capita income in Marenisco is $25,927.
What is the Median Family Income in Marenisco?
Median Family Income in Marenisco is $47,083.
What is the Median Household income in Marenisco?
Median Household Income in Marenisco is $39,306.
What is Inequality or Gini Index in Marenisco?
Inequality or Gini Index in Marenisco is 0.36.
What is the Total Population of Marenisco?
Total Population of Marenisco is 249.
What is the Total Male Population of Marenisco?
Total Male Population of Marenisco is 142.
What is the Total Female Population of Marenisco?
Total Female Population of Marenisco is 107.
What is the Ratio of Males per 100 Females in Marenisco?
There are 132.71 Males per 100 Females in Marenisco.
What is the Ratio of Females per 100 Males in Marenisco?
There are 75.35 Females per 100 Males in Marenisco.
What is the Median Population Age in Marenisco?
Median Population Age in Marenisco is 58.1 Years.
What is the Average Family Size in Marenisco
Average Family Size in Marenisco is 2.9 People.
What is the Average Household Size in Marenisco
Average Household Size in Marenisco is 2.1 People.
How Large is the Labor Force in Marenisco?
There are 77 People in the Labor Forcein in Marenisco.
What is the Percentage of People in the Labor Force in Marenisco?
39.9% of People are in the Labor Force in Marenisco.