Zip Codes with the Highest Percentage of Population Employed in Education, Arts & Media in Peoria, IL
RELATED REPORTS & OPTIONS
Education, Arts & Media
Peoria
Compare Zip Codes
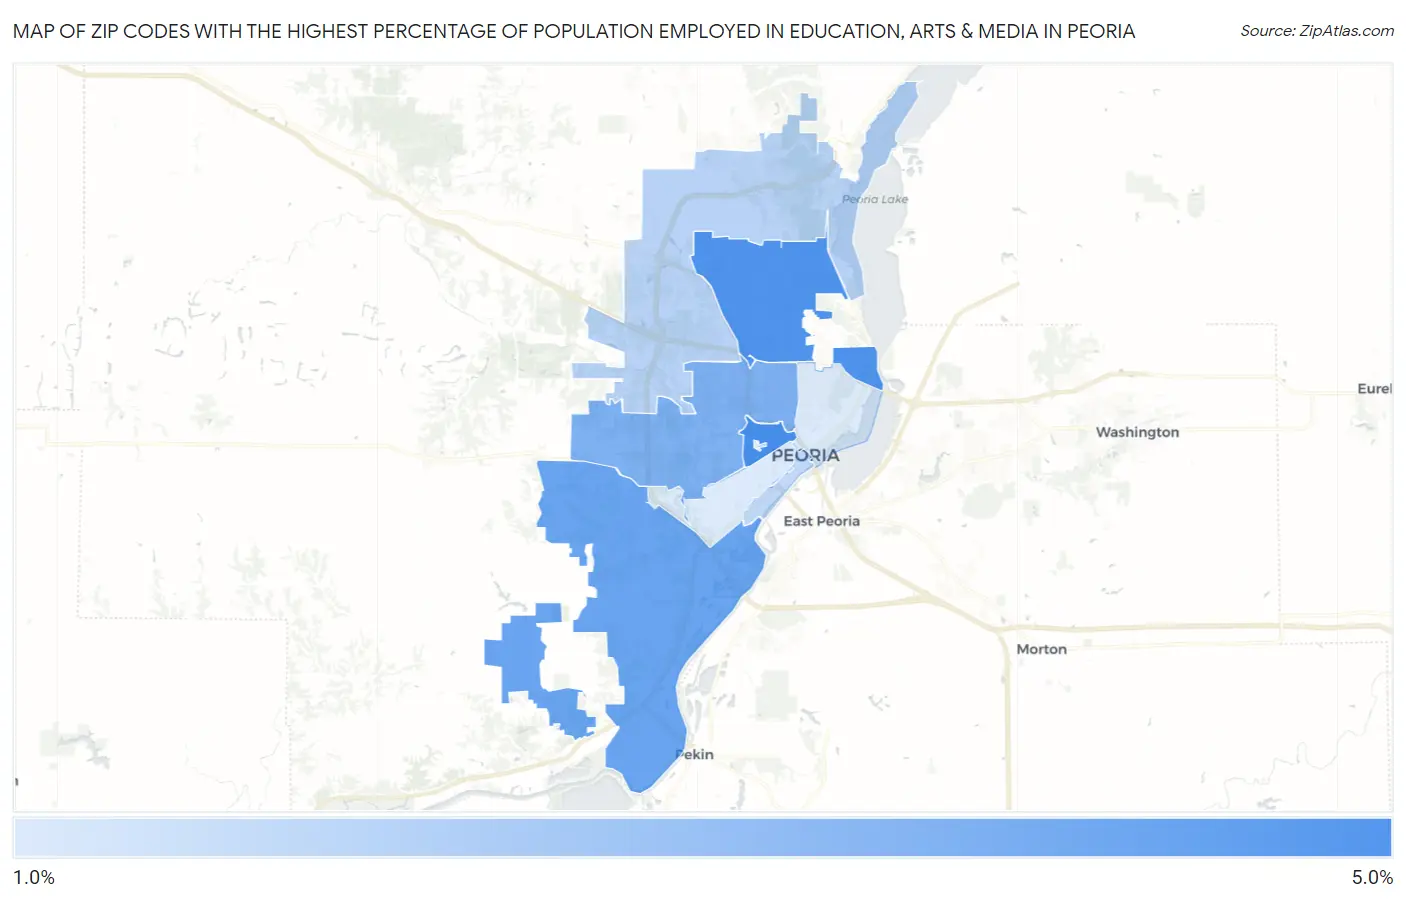
Map of Zip Codes with the Highest Percentage of Population Employed in Education, Arts & Media in Peoria
1.0%
4.2%
Zip Codes with the Highest Percentage of Population Employed in Education, Arts & Media in Peoria, IL
| Zip Code | % Employed | vs State | vs National | |
| 1. | 61606 | 4.2% | 1.7%(+2.47)#84 | 1.8%(+2.40)#2,240 |
| 2. | 61614 | 4.0% | 1.7%(+2.26)#95 | 1.8%(+2.19)#2,481 |
| 3. | 61607 | 3.4% | 1.7%(+1.73)#124 | 1.8%(+1.66)#3,369 |
| 4. | 61604 | 3.0% | 1.7%(+1.29)#176 | 1.8%(+1.22)#4,486 |
| 5. | 61615 | 1.8% | 1.7%(+0.113)#416 | 1.8%(+0.043)#10,926 |
| 6. | 61602 | 1.6% | 1.7%(-0.070)#474 | 1.8%(-0.140)#12,441 |
| 7. | 61603 | 1.1% | 1.7%(-0.649)#700 | 1.8%(-0.720)#17,884 |
| 8. | 61605 | 1.0% | 1.7%(-0.667)#712 | 1.8%(-0.737)#18,057 |
1
Common Questions
What are the Top 5 Zip Codes with the Highest Percentage of Population Employed in Education, Arts & Media in Peoria, IL?
Top 5 Zip Codes with the Highest Percentage of Population Employed in Education, Arts & Media in Peoria, IL are:
What zip code has the Highest Percentage of Population Employed in Education, Arts & Media in Peoria, IL?
61606 has the Highest Percentage of Population Employed in Education, Arts & Media in Peoria, IL with 4.2%.
What is the Percentage of Population Employed in Education, Arts & Media in Peoria, IL?
Percentage of Population Employed in Education, Arts & Media in Peoria is 2.4%.
What is the Percentage of Population Employed in Education, Arts & Media in Illinois?
Percentage of Population Employed in Education, Arts & Media in Illinois is 1.7%.
What is the Percentage of Population Employed in Education, Arts & Media in the United States?
Percentage of Population Employed in Education, Arts & Media in the United States is 1.8%.