Zip Codes with the Highest Percentage of Population with a Degree in Psychology in Connecticut
RELATED REPORTS & OPTIONS
Psychology
Connecticut
Compare Zip Codes
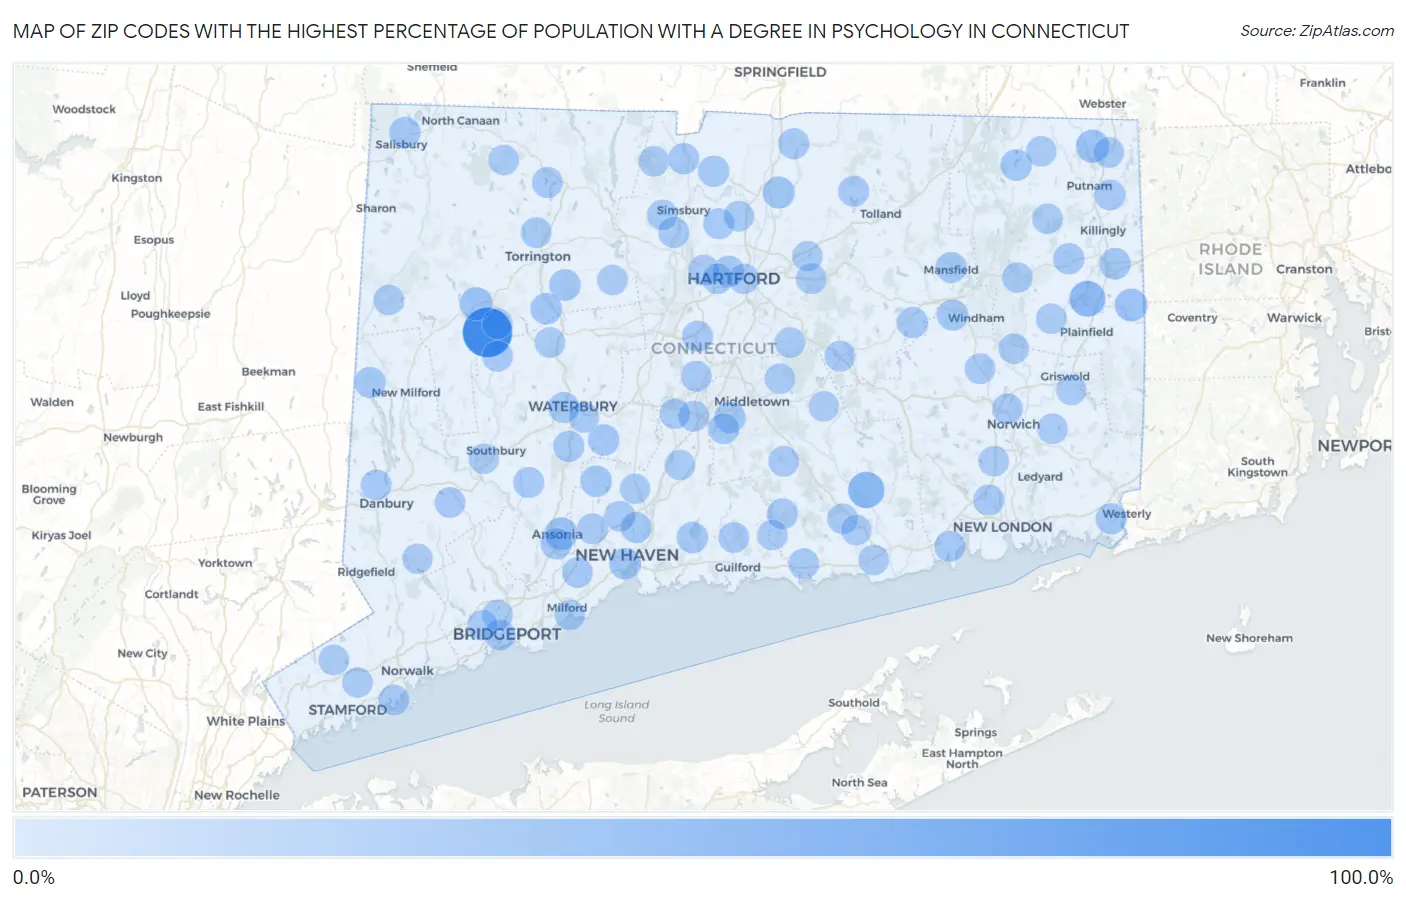
Map of Zip Codes with the Highest Percentage of Population with a Degree in Psychology in Connecticut
0.0%
100.0%
Zip Codes with the Highest Percentage of Population with a Degree in Psychology in Connecticut
| Zip Code | % Graduates | vs State | vs National | |
| 1. | 06758 | 100.0% | 5.9%(+94.1)#1 | 5.1%(+94.9)#29 |
| 2. | 06439 | 34.3% | 5.9%(+28.3)#2 | 5.1%(+29.2)#228 |
| 3. | 06332 | 32.1% | 5.9%(+26.1)#3 | 5.1%(+27.0)#266 |
| 4. | 06750 | 19.2% | 5.9%(+13.3)#4 | 5.1%(+14.2)#709 |
| 5. | 06255 | 19.0% | 5.9%(+13.0)#5 | 5.1%(+13.9)#726 |
| 6. | 06377 | 17.7% | 5.9%(+11.7)#6 | 5.1%(+12.6)#830 |
| 7. | 06401 | 17.4% | 5.9%(+11.4)#7 | 5.1%(+12.3)#864 |
| 8. | 06088 | 13.7% | 5.9%(+7.80)#8 | 5.1%(+8.70)#1,324 |
| 9. | 06791 | 12.3% | 5.9%(+6.34)#9 | 5.1%(+7.24)#1,652 |
| 10. | 06778 | 11.9% | 5.9%(+5.95)#10 | 5.1%(+6.84)#1,766 |
| 11. | 06239 | 11.8% | 5.9%(+5.88)#11 | 5.1%(+6.77)#1,783 |
| 12. | 06519 | 11.5% | 5.9%(+5.57)#12 | 5.1%(+6.46)#1,872 |
| 13. | 06282 | 11.5% | 5.9%(+5.51)#13 | 5.1%(+6.41)#1,890 |
| 14. | 06524 | 11.3% | 5.9%(+5.37)#14 | 5.1%(+6.27)#1,941 |
| 15. | 06712 | 11.2% | 5.9%(+5.26)#15 | 5.1%(+6.16)#1,973 |
| 16. | 06234 | 10.9% | 5.9%(+4.97)#16 | 5.1%(+5.87)#2,089 |
| 17. | 06026 | 10.8% | 5.9%(+4.90)#17 | 5.1%(+5.79)#2,120 |
| 18. | 06481 | 10.8% | 5.9%(+4.86)#18 | 5.1%(+5.76)#2,131 |
| 19. | 06418 | 10.7% | 5.9%(+4.76)#19 | 5.1%(+5.65)#2,173 |
| 20. | 06471 | 10.6% | 5.9%(+4.67)#20 | 5.1%(+5.57)#2,206 |
| 21. | 06226 | 10.6% | 5.9%(+4.64)#21 | 5.1%(+5.54)#2,222 |
| 22. | 06068 | 10.3% | 5.9%(+4.39)#22 | 5.1%(+5.28)#2,320 |
| 23. | 06237 | 10.3% | 5.9%(+4.36)#23 | 5.1%(+5.26)#2,336 |
| 24. | 06784 | 10.0% | 5.9%(+4.03)#24 | 5.1%(+4.92)#2,513 |
| 25. | 06250 | 9.8% | 5.9%(+3.87)#25 | 5.1%(+4.77)#2,592 |
| 26. | 06035 | 9.6% | 5.9%(+3.70)#26 | 5.1%(+4.59)#2,696 |
| 27. | 06770 | 9.4% | 5.9%(+3.48)#27 | 5.1%(+4.37)#2,829 |
| 28. | 06517 | 9.3% | 5.9%(+3.40)#28 | 5.1%(+4.30)#2,867 |
| 29. | 06105 | 9.3% | 5.9%(+3.38)#29 | 5.1%(+4.28)#2,881 |
| 30. | 06379 | 9.2% | 5.9%(+3.25)#30 | 5.1%(+4.15)#2,986 |
| 31. | 06708 | 9.1% | 5.9%(+3.10)#31 | 5.1%(+4.00)#3,101 |
| 32. | 06525 | 9.0% | 5.9%(+3.04)#32 | 5.1%(+3.94)#3,144 |
| 33. | 06002 | 9.0% | 5.9%(+3.04)#33 | 5.1%(+3.93)#3,146 |
| 34. | 06082 | 9.0% | 5.9%(+3.02)#34 | 5.1%(+3.91)#3,168 |
| 35. | 06098 | 8.9% | 5.9%(+2.98)#35 | 5.1%(+3.88)#3,199 |
| 36. | 06029 | 8.9% | 5.9%(+2.97)#36 | 5.1%(+3.87)#3,208 |
| 37. | 06051 | 8.9% | 5.9%(+2.95)#37 | 5.1%(+3.85)#3,222 |
| 38. | 06375 | 8.8% | 5.9%(+2.86)#38 | 5.1%(+3.75)#3,301 |
| 39. | 06450 | 8.7% | 5.9%(+2.72)#39 | 5.1%(+3.61)#3,442 |
| 40. | 06089 | 8.6% | 5.9%(+2.70)#40 | 5.1%(+3.60)#3,462 |
| 41. | 06751 | 8.6% | 5.9%(+2.67)#41 | 5.1%(+3.57)#3,487 |
| 42. | 06357 | 8.5% | 5.9%(+2.56)#42 | 5.1%(+3.46)#3,594 |
| 43. | 06478 | 8.5% | 5.9%(+2.53)#43 | 5.1%(+3.43)#3,622 |
| 44. | 06604 | 8.4% | 5.9%(+2.49)#44 | 5.1%(+3.39)#3,674 |
| 45. | 06419 | 8.4% | 5.9%(+2.43)#45 | 5.1%(+3.33)#3,727 |
| 46. | 06037 | 8.2% | 5.9%(+2.22)#46 | 5.1%(+3.11)#3,944 |
| 47. | 06811 | 8.2% | 5.9%(+2.22)#47 | 5.1%(+3.11)#3,946 |
| 48. | 06447 | 8.1% | 5.9%(+2.14)#48 | 5.1%(+3.03)#4,032 |
| 49. | 06360 | 8.1% | 5.9%(+2.13)#49 | 5.1%(+3.03)#4,033 |
| 50. | 06606 | 8.0% | 5.9%(+2.07)#50 | 5.1%(+2.97)#4,104 |
| 51. | 06040 | 7.9% | 5.9%(+1.99)#51 | 5.1%(+2.89)#4,206 |
| 52. | 06441 | 7.8% | 5.9%(+1.85)#52 | 5.1%(+2.75)#4,379 |
| 53. | 06514 | 7.7% | 5.9%(+1.78)#53 | 5.1%(+2.67)#4,456 |
| 54. | 06260 | 7.7% | 5.9%(+1.71)#54 | 5.1%(+2.61)#4,565 |
| 55. | 06790 | 7.6% | 5.9%(+1.69)#55 | 5.1%(+2.59)#4,586 |
| 56. | 06254 | 7.6% | 5.9%(+1.69)#56 | 5.1%(+2.58)#4,593 |
| 57. | 06117 | 7.6% | 5.9%(+1.63)#57 | 5.1%(+2.52)#4,693 |
| 58. | 06437 | 7.6% | 5.9%(+1.62)#58 | 5.1%(+2.52)#4,696 |
| 59. | 06853 | 7.6% | 5.9%(+1.61)#59 | 5.1%(+2.51)#4,720 |
| 60. | 06277 | 7.5% | 5.9%(+1.60)#60 | 5.1%(+2.50)#4,729 |
| 61. | 06413 | 7.5% | 5.9%(+1.53)#61 | 5.1%(+2.43)#4,864 |
| 62. | 06455 | 7.5% | 5.9%(+1.51)#62 | 5.1%(+2.40)#4,908 |
| 63. | 06477 | 7.4% | 5.9%(+1.43)#63 | 5.1%(+2.33)#5,008 |
| 64. | 06119 | 7.3% | 5.9%(+1.35)#64 | 5.1%(+2.25)#5,126 |
| 65. | 06092 | 7.3% | 5.9%(+1.32)#65 | 5.1%(+2.21)#5,195 |
| 66. | 06095 | 7.2% | 5.9%(+1.26)#66 | 5.1%(+2.16)#5,264 |
| 67. | 06259 | 7.2% | 5.9%(+1.25)#67 | 5.1%(+2.15)#5,281 |
| 68. | 06470 | 7.2% | 5.9%(+1.24)#68 | 5.1%(+2.14)#5,297 |
| 69. | 06475 | 7.2% | 5.9%(+1.23)#69 | 5.1%(+2.12)#5,327 |
| 70. | 06331 | 7.1% | 5.9%(+1.19)#70 | 5.1%(+2.08)#5,410 |
| 71. | 06424 | 7.1% | 5.9%(+1.17)#71 | 5.1%(+2.07)#5,426 |
| 72. | 06058 | 7.1% | 5.9%(+1.15)#72 | 5.1%(+2.04)#5,469 |
| 73. | 06417 | 7.0% | 5.9%(+1.07)#73 | 5.1%(+1.97)#5,594 |
| 74. | 06073 | 7.0% | 5.9%(+1.00)#74 | 5.1%(+1.90)#5,720 |
| 75. | 06787 | 6.9% | 5.9%(+0.991)#75 | 5.1%(+1.89)#5,747 |
| 76. | 06903 | 6.9% | 5.9%(+0.985)#76 | 5.1%(+1.88)#5,759 |
| 77. | 06013 | 6.9% | 5.9%(+0.978)#77 | 5.1%(+1.88)#5,769 |
| 78. | 06365 | 6.9% | 5.9%(+0.959)#78 | 5.1%(+1.86)#5,800 |
| 79. | 06247 | 6.9% | 5.9%(+0.937)#79 | 5.1%(+1.83)#5,840 |
| 80. | 06103 | 6.8% | 5.9%(+0.900)#80 | 5.1%(+1.80)#5,908 |
| 81. | 06409 | 6.8% | 5.9%(+0.852)#81 | 5.1%(+1.75)#6,005 |
| 82. | 06042 | 6.8% | 5.9%(+0.834)#82 | 5.1%(+1.73)#6,045 |
| 83. | 06763 | 6.7% | 5.9%(+0.801)#83 | 5.1%(+1.70)#6,108 |
| 84. | 06281 | 6.7% | 5.9%(+0.787)#84 | 5.1%(+1.68)#6,143 |
| 85. | 06443 | 6.7% | 5.9%(+0.784)#85 | 5.1%(+1.68)#6,153 |
| 86. | 06090 | 6.7% | 5.9%(+0.781)#86 | 5.1%(+1.68)#6,163 |
| 87. | 06757 | 6.7% | 5.9%(+0.727)#87 | 5.1%(+1.62)#6,277 |
| 88. | 06706 | 6.7% | 5.9%(+0.710)#88 | 5.1%(+1.61)#6,317 |
| 89. | 06460 | 6.6% | 5.9%(+0.644)#89 | 5.1%(+1.54)#6,463 |
| 90. | 06492 | 6.6% | 5.9%(+0.630)#90 | 5.1%(+1.53)#6,499 |
| 91. | 06825 | 6.6% | 5.9%(+0.604)#91 | 5.1%(+1.50)#6,540 |
| 92. | 06451 | 6.5% | 5.9%(+0.541)#92 | 5.1%(+1.44)#6,677 |
| 93. | 06488 | 6.5% | 5.9%(+0.516)#93 | 5.1%(+1.41)#6,730 |
| 94. | 06907 | 6.4% | 5.9%(+0.498)#94 | 5.1%(+1.40)#6,775 |
| 95. | 06480 | 6.4% | 5.9%(+0.462)#95 | 5.1%(+1.36)#6,868 |
| 96. | 06382 | 6.4% | 5.9%(+0.435)#96 | 5.1%(+1.33)#6,924 |
| 97. | 06330 | 6.3% | 5.9%(+0.396)#97 | 5.1%(+1.29)#7,031 |
| 98. | 06351 | 6.3% | 5.9%(+0.394)#98 | 5.1%(+1.29)#7,034 |
| 99. | 06518 | 6.2% | 5.9%(+0.301)#99 | 5.1%(+1.20)#7,266 |
| 100. | 06896 | 6.2% | 5.9%(+0.287)#100 | 5.1%(+1.18)#7,289 |
Common Questions
What are the Top 10 Zip Codes with the Highest Percentage of Population with a Degree in Psychology in Connecticut?
Top 10 Zip Codes with the Highest Percentage of Population with a Degree in Psychology in Connecticut are:
What zip code has the Highest Percentage of Population with a Degree in Psychology in Connecticut?
06758 has the Highest Percentage of Population with a Degree in Psychology in Connecticut with 100.0%.
What is the Percentage of Population with a Degree in Psychology in the State of Connecticut?
Percentage of Population with a Degree in Psychology in Connecticut is 5.9%.
What is the Percentage of Population with a Degree in Psychology in the United States?
Percentage of Population with a Degree in Psychology in the United States is 5.1%.