Carrsville, VA Map & Demographics
Carrsville Map
Carrsville Overview
$47,160
PER CAPITA INCOME
$131,369
AVG FAMILY INCOME
$99,453
AVG HOUSEHOLD INCOME
0.24
INEQUALITY / GINI INDEX
253
TOTAL POPULATION
156
MALE POPULATION
97
FEMALE POPULATION
160.82
MALES / 100 FEMALES
62.18
FEMALES / 100 MALES
47.2
MEDIAN AGE
2.5
AVG FAMILY SIZE
2.3
AVG HOUSEHOLD SIZE
128
LABOR FORCE [ PEOPLE ]
59.0%
PERCENT IN LABOR FORCE
Carrsville Zip Codes
Carrsville Area Codes
Income in Carrsville
Income Overview in Carrsville
Per Capita Income in Carrsville is $47,160, while median incomes of families and households are $131,369 and $99,453 respectively.
| Characteristic | Number | Measure |
| Per Capita Income | 253 | $47,160 |
| Median Family Income | 79 | $131,369 |
| Mean Family Income | 79 | $111,913 |
| Median Household Income | 109 | $99,453 |
| Mean Household Income | 109 | $105,801 |
| Income Deficit | 79 | $0 |
| Wage / Income Gap (%) | 253 | 0.00% |
| Wage / Income Gap ($) | 253 | 100.00¢ per $1 |
| Gini / Inequality Index | 253 | 0.24 |
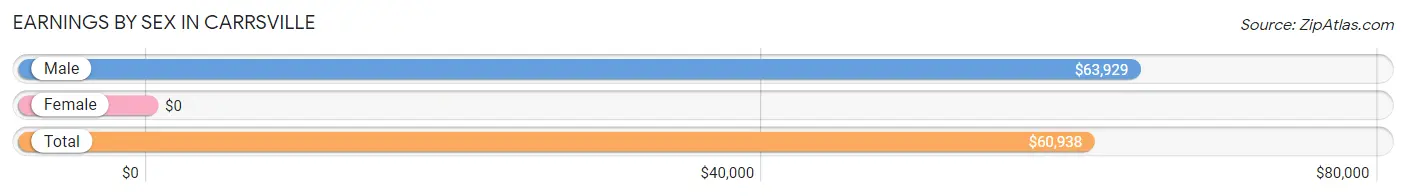
Earnings by Sex in Carrsville
| Sex | Number | Average Earnings |
| Male | 108 (68.3%) | $63,929 |
| Female | 50 (31.7%) | $0 |
| Total | 158 (100.0%) | $60,938 |
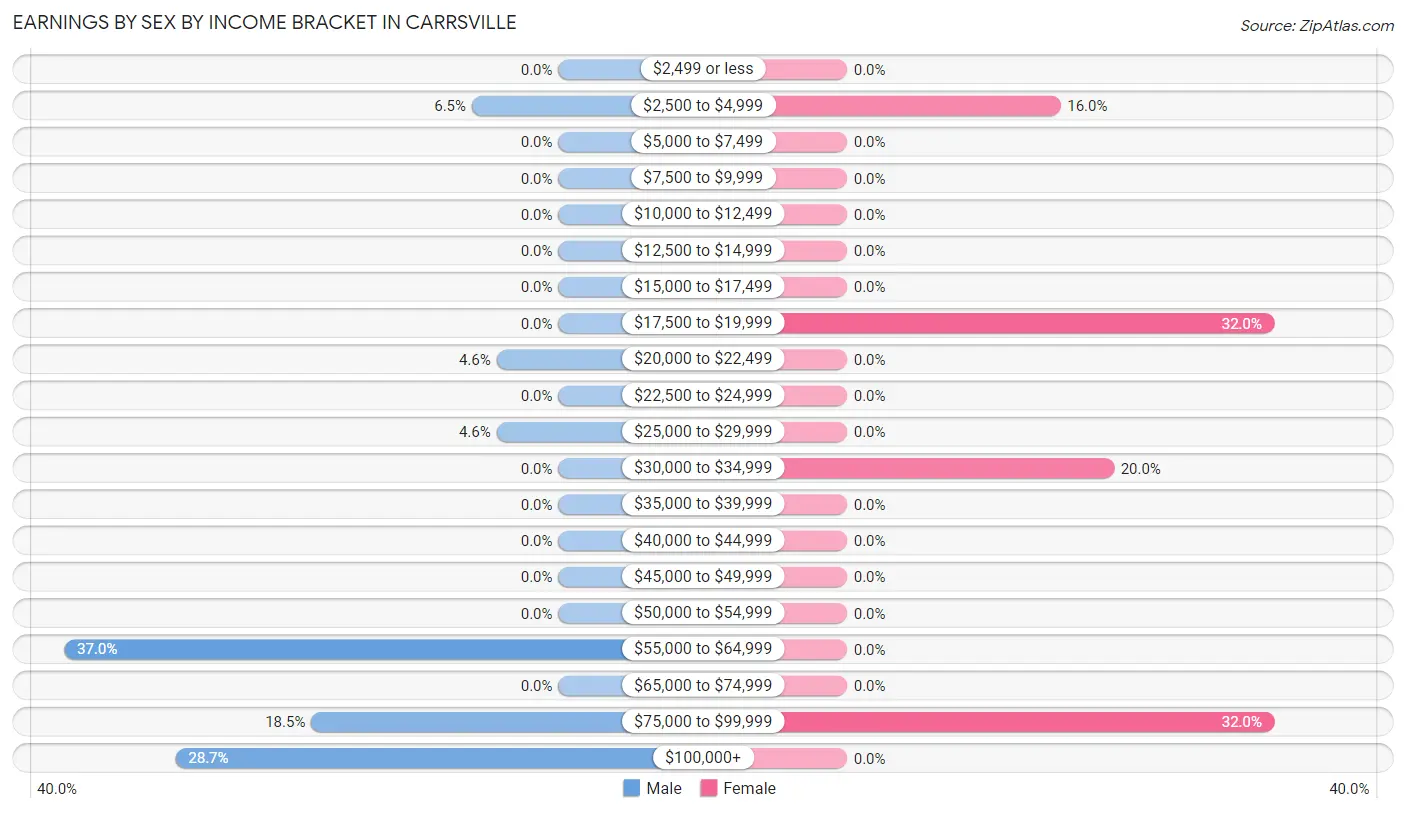
Earnings by Sex by Income Bracket in Carrsville
The most common earnings brackets in Carrsville are $55,000 to $64,999 for men (40 | 37.0%) and $17,500 to $19,999 for women (16 | 32.0%).
| Income | Male | Female |
| $2,499 or less | 0 (0.0%) | 0 (0.0%) |
| $2,500 to $4,999 | 7 (6.5%) | 8 (16.0%) |
| $5,000 to $7,499 | 0 (0.0%) | 0 (0.0%) |
| $7,500 to $9,999 | 0 (0.0%) | 0 (0.0%) |
| $10,000 to $12,499 | 0 (0.0%) | 0 (0.0%) |
| $12,500 to $14,999 | 0 (0.0%) | 0 (0.0%) |
| $15,000 to $17,499 | 0 (0.0%) | 0 (0.0%) |
| $17,500 to $19,999 | 0 (0.0%) | 16 (32.0%) |
| $20,000 to $22,499 | 5 (4.6%) | 0 (0.0%) |
| $22,500 to $24,999 | 0 (0.0%) | 0 (0.0%) |
| $25,000 to $29,999 | 5 (4.6%) | 0 (0.0%) |
| $30,000 to $34,999 | 0 (0.0%) | 10 (20.0%) |
| $35,000 to $39,999 | 0 (0.0%) | 0 (0.0%) |
| $40,000 to $44,999 | 0 (0.0%) | 0 (0.0%) |
| $45,000 to $49,999 | 0 (0.0%) | 0 (0.0%) |
| $50,000 to $54,999 | 0 (0.0%) | 0 (0.0%) |
| $55,000 to $64,999 | 40 (37.0%) | 0 (0.0%) |
| $65,000 to $74,999 | 0 (0.0%) | 0 (0.0%) |
| $75,000 to $99,999 | 20 (18.5%) | 16 (32.0%) |
| $100,000+ | 31 (28.7%) | 0 (0.0%) |
| Total | 108 (100.0%) | 50 (100.0%) |
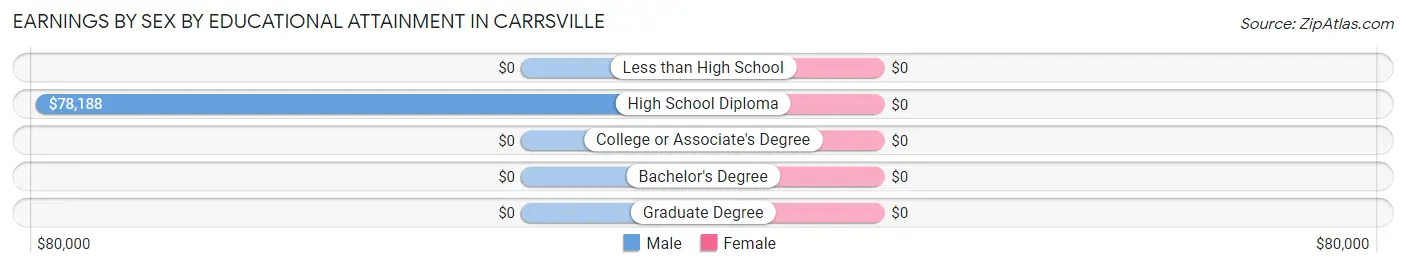
Earnings by Sex by Educational Attainment in Carrsville
| Educational Attainment | Male Income | Female Income |
| Less than High School | - | - |
| High School Diploma | $78,188 | $0 |
| College or Associate's Degree | - | - |
| Bachelor's Degree | - | - |
| Graduate Degree | - | - |
| Total | $63,929 | $0 |
Family Income in Carrsville
Family Income Brackets in Carrsville
According to the Carrsville family income data, there are 31 families falling into the $100,000 to $149,999 income range, which is the most common income bracket and makes up 39.2% of all families.
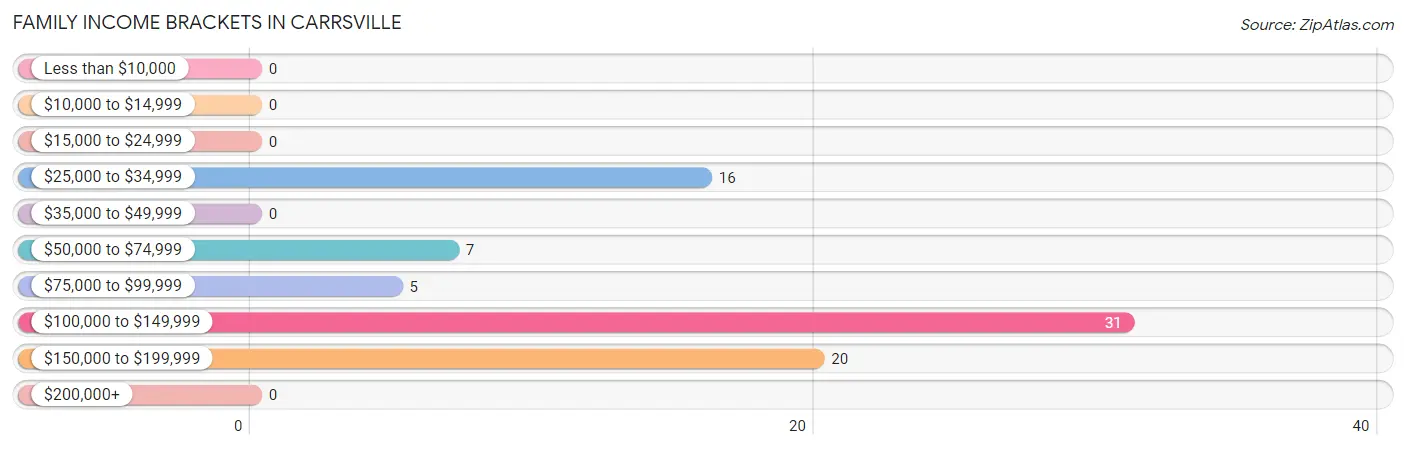
| Income Bracket | # Families | % Families |
| Less than $10,000 | 0 | 0.0% |
| $10,000 to $14,999 | 0 | 0.0% |
| $15,000 to $24,999 | 0 | 0.0% |
| $25,000 to $34,999 | 16 | 20.3% |
| $35,000 to $49,999 | 0 | 0.0% |
| $50,000 to $74,999 | 7 | 8.9% |
| $75,000 to $99,999 | 5 | 6.3% |
| $100,000 to $149,999 | 31 | 39.2% |
| $150,000 to $199,999 | 20 | 25.3% |
| $200,000+ | 0 | 0.0% |
Family Income by Famaliy Size in Carrsville
3-person families (42 | 53.2%) account for the highest median family income in Carrsville with $137,250 per family, while 2-person families (37 | 46.8%) have the highest median income of $65,149 per family member.
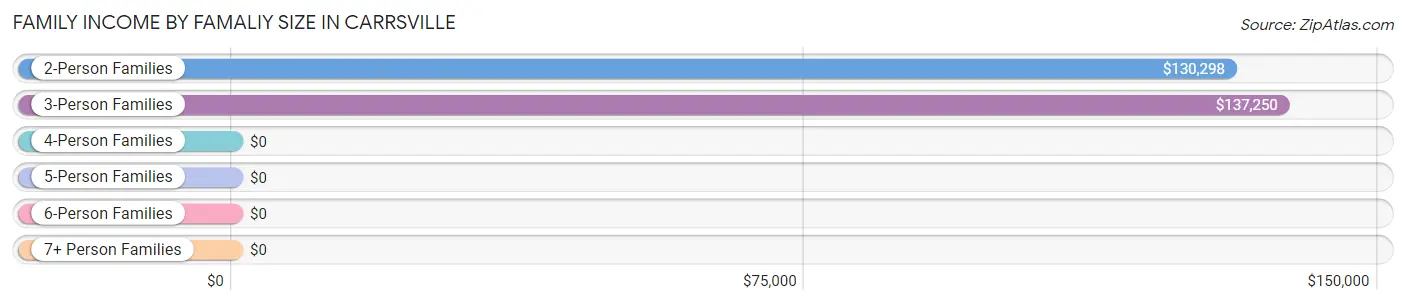
| Income Bracket | # Families | Median Income |
| 2-Person Families | 37 (46.8%) | $130,298 |
| 3-Person Families | 42 (53.2%) | $137,250 |
| 4-Person Families | 0 (0.0%) | $0 |
| 5-Person Families | 0 (0.0%) | $0 |
| 6-Person Families | 0 (0.0%) | $0 |
| 7+ Person Families | 0 (0.0%) | $0 |
| Total | 79 (100.0%) | $131,369 |
Family Income by Number of Earners in Carrsville
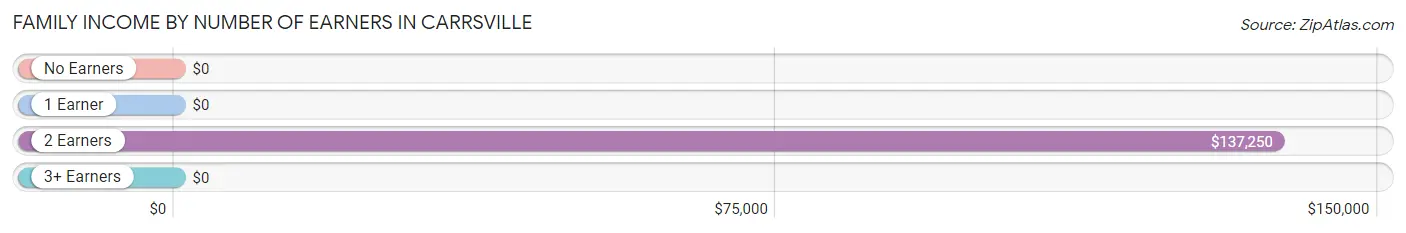
| Number of Earners | # Families | Median Income |
| No Earners | 11 (13.9%) | $0 |
| 1 Earner | 26 (32.9%) | $0 |
| 2 Earners | 42 (53.2%) | $137,250 |
| 3+ Earners | 0 (0.0%) | $0 |
| Total | 79 (100.0%) | $131,369 |
Household Income in Carrsville
Household Income Brackets in Carrsville
With 31 households falling in the category, the $100,000 to $149,999 income range is the most frequent in Carrsville, accounting for 28.4% of all households.
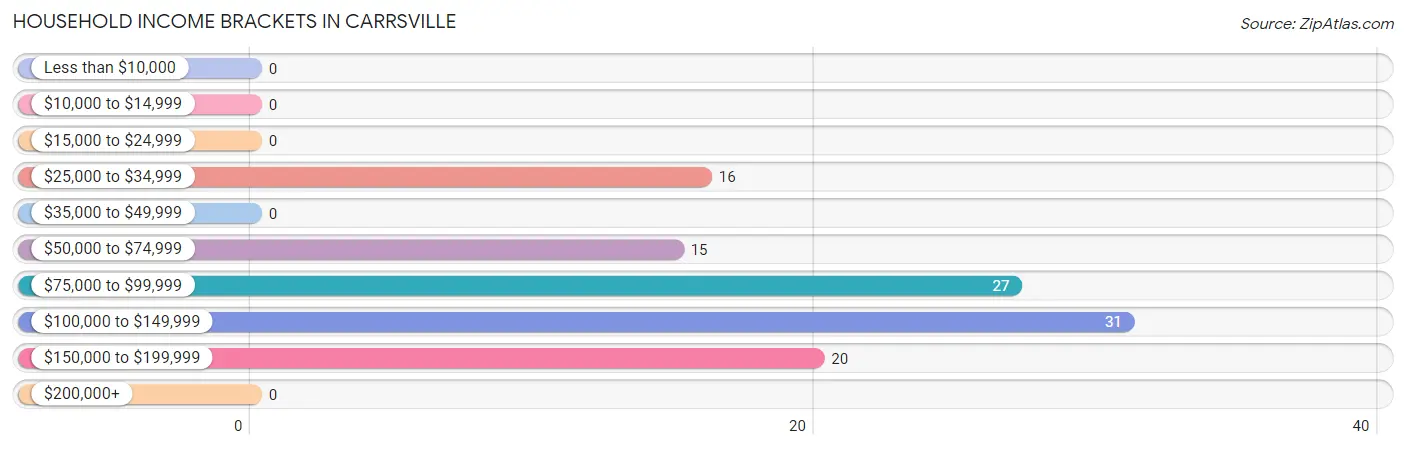
| Income Bracket | # Households | % Households |
| Less than $10,000 | 0 | 0.0% |
| $10,000 to $14,999 | 0 | 0.0% |
| $15,000 to $24,999 | 0 | 0.0% |
| $25,000 to $34,999 | 16 | 14.7% |
| $35,000 to $49,999 | 0 | 0.0% |
| $50,000 to $74,999 | 15 | 13.8% |
| $75,000 to $99,999 | 27 | 24.8% |
| $100,000 to $149,999 | 31 | 28.4% |
| $150,000 to $199,999 | 20 | 18.3% |
| $200,000+ | 0 | 0.0% |
Household Income by Householder Age in Carrsville
The median household income in Carrsville is $99,453, with the highest median household income of $130,833 found in the 45 to 64 years age bracket for the primary householder. A total of 68 households (62.4%) fall into this category.
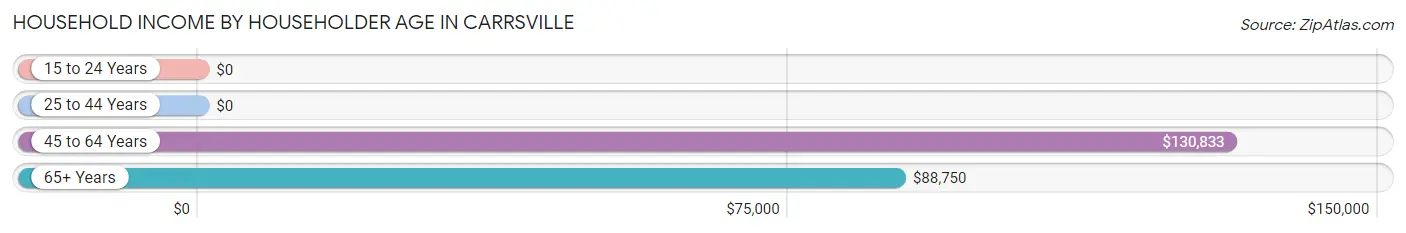
| Income Bracket | # Households | Median Income |
| 15 to 24 Years | 0 (0.0%) | $0 |
| 25 to 44 Years | 25 (22.9%) | $0 |
| 45 to 64 Years | 68 (62.4%) | $130,833 |
| 65+ Years | 16 (14.7%) | $88,750 |
| Total | 109 (100.0%) | $99,453 |
Poverty in Carrsville
Income Below Poverty by Sex and Age in Carrsville
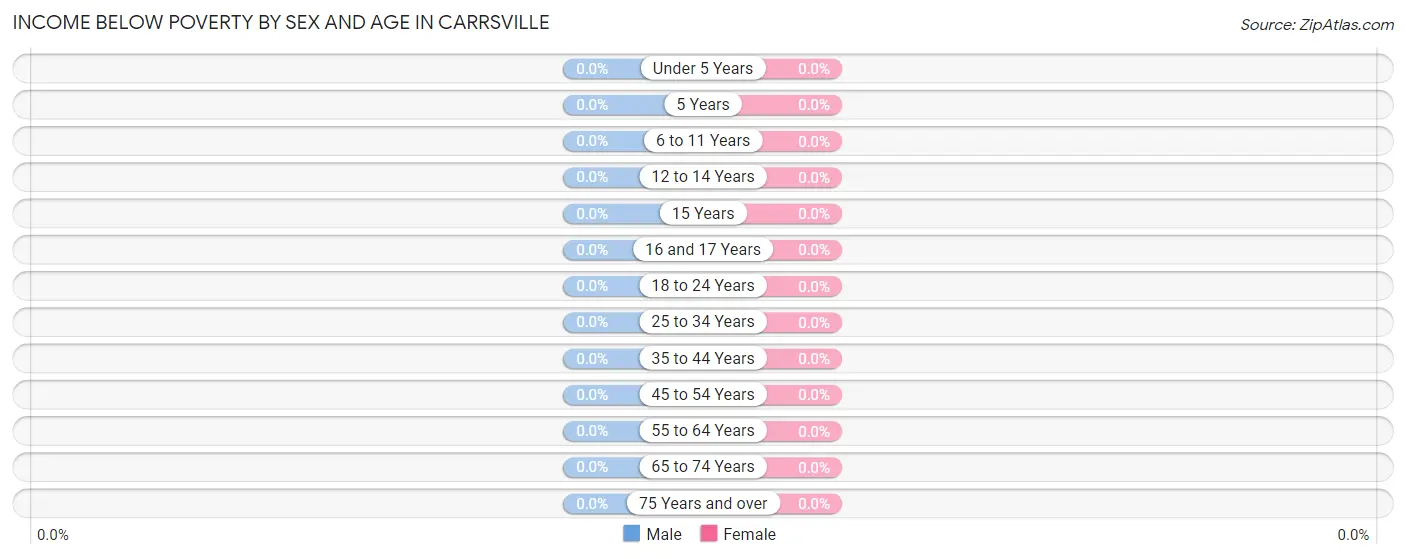
| Age Bracket | Male | Female |
| Under 5 Years | 0 (0.0%) | 0 (0.0%) |
| 5 Years | 0 (0.0%) | 0 (0.0%) |
| 6 to 11 Years | 0 (0.0%) | 0 (0.0%) |
| 12 to 14 Years | 0 (0.0%) | 0 (0.0%) |
| 15 Years | 0 (0.0%) | 0 (0.0%) |
| 16 and 17 Years | 0 (0.0%) | 0 (0.0%) |
| 18 to 24 Years | 0 (0.0%) | 0 (0.0%) |
| 25 to 34 Years | 0 (0.0%) | 0 (0.0%) |
| 35 to 44 Years | 0 (0.0%) | 0 (0.0%) |
| 45 to 54 Years | 0 (0.0%) | 0 (0.0%) |
| 55 to 64 Years | 0 (0.0%) | 0 (0.0%) |
| 65 to 74 Years | 0 (0.0%) | 0 (0.0%) |
| 75 Years and over | 0 (0.0%) | 0 (0.0%) |
| Total | 0 (0.0%) | 0 (0.0%) |
Income Above Poverty by Sex and Age in Carrsville
According to the poverty statistics in Carrsville, males aged 6 to 11 years and females aged 15 years are the age groups that are most secure financially, with 100.0% of males and 100.0% of females in these age groups living above the poverty line.
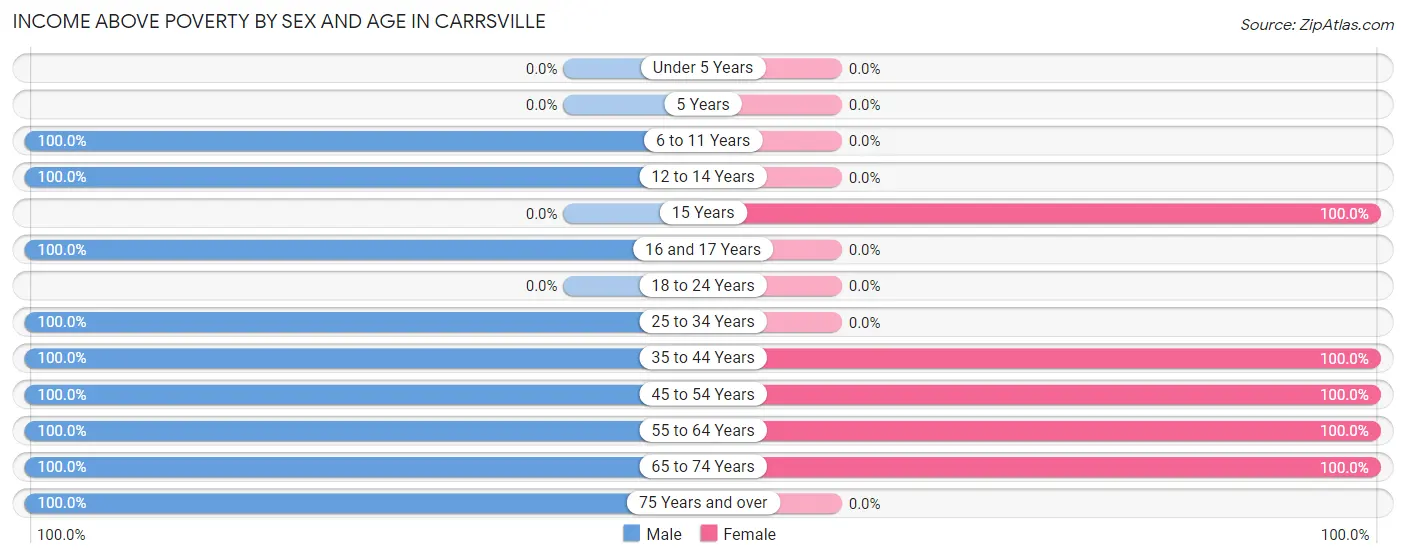
| Age Bracket | Male | Female |
| Under 5 Years | 0 (0.0%) | 0 (0.0%) |
| 5 Years | 0 (0.0%) | 0 (0.0%) |
| 6 to 11 Years | 7 (100.0%) | 0 (0.0%) |
| 12 to 14 Years | 19 (100.0%) | 0 (0.0%) |
| 15 Years | 0 (0.0%) | 10 (100.0%) |
| 16 and 17 Years | 5 (100.0%) | 0 (0.0%) |
| 18 to 24 Years | 0 (0.0%) | 0 (0.0%) |
| 25 to 34 Years | 8 (100.0%) | 0 (0.0%) |
| 35 to 44 Years | 32 (100.0%) | 18 (100.0%) |
| 45 to 54 Years | 37 (100.0%) | 52 (100.0%) |
| 55 to 64 Years | 21 (100.0%) | 11 (100.0%) |
| 65 to 74 Years | 21 (100.0%) | 6 (100.0%) |
| 75 Years and over | 6 (100.0%) | 0 (0.0%) |
| Total | 156 (100.0%) | 97 (100.0%) |
Income Below Poverty Among Married-Couple Families in Carrsville
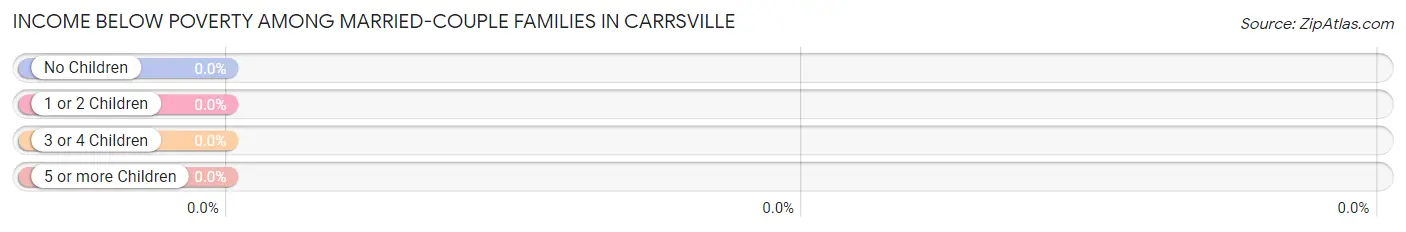
| Children | Above Poverty | Below Poverty |
| No Children | 37 (100.0%) | 0 (0.0%) |
| 1 or 2 Children | 37 (100.0%) | 0 (0.0%) |
| 3 or 4 Children | 0 (0.0%) | 0 (0.0%) |
| 5 or more Children | 0 (0.0%) | 0 (0.0%) |
| Total | 74 (100.0%) | 0 (0.0%) |
Income Below Poverty Among Single-Parent Households in Carrsville
| Children | Single Father | Single Mother |
| No Children | 0 (0.0%) | 0 (0.0%) |
| 1 or 2 Children | 0 (0.0%) | 0 (0.0%) |
| 3 or 4 Children | 0 (0.0%) | 0 (0.0%) |
| 5 or more Children | 0 (0.0%) | 0 (0.0%) |
| Total | 0 (0.0%) | 0 (0.0%) |
Income Below Poverty Among Married-Couple vs Single-Parent Households in Carrsville
| Children | Married-Couple Families | Single-Parent Households |
| No Children | 0 (0.0%) | 0 (0.0%) |
| 1 or 2 Children | 0 (0.0%) | 0 (0.0%) |
| 3 or 4 Children | 0 (0.0%) | 0 (0.0%) |
| 5 or more Children | 0 (0.0%) | 0 (0.0%) |
| Total | 0 (0.0%) | 0 (0.0%) |
Race in Carrsville
The most populous races in Carrsville are , and White / Caucasian (253 | 100.0%).
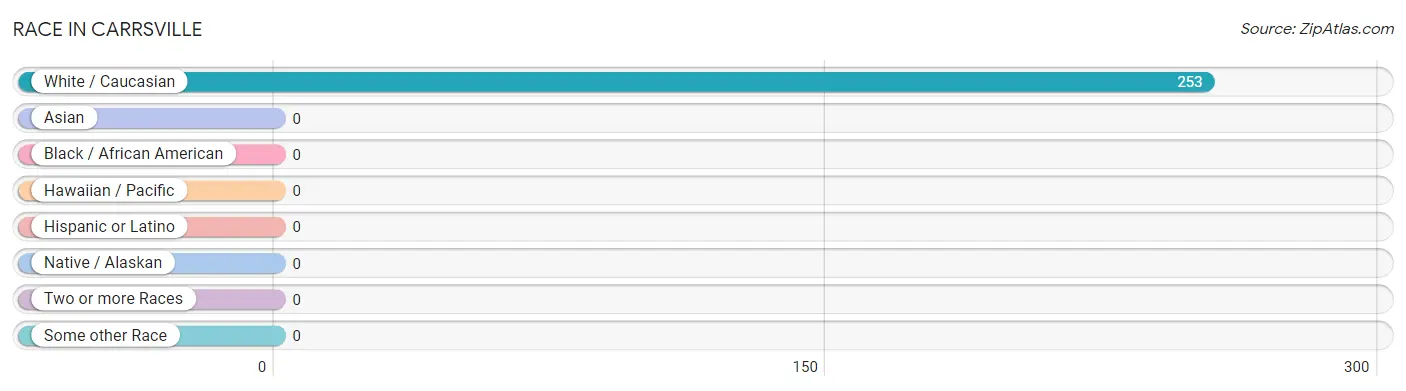
| Race | # Population | % Population |
| Asian | 0 | 0.0% |
| Black / African American | 0 | 0.0% |
| Hawaiian / Pacific | 0 | 0.0% |
| Hispanic or Latino | 0 | 0.0% |
| Native / Alaskan | 0 | 0.0% |
| White / Caucasian | 253 | 100.0% |
| Two or more Races | 0 | 0.0% |
| Some other Race | 0 | 0.0% |
| Total | 253 | 100.0% |
Ancestry in Carrsville
The most populous ancestries reported in Carrsville are American (93 | 36.8%), German (12 | 4.7%), English (11 | 4.3%), and Irish (6 | 2.4%), together accounting for 48.2% of all Carrsville residents.
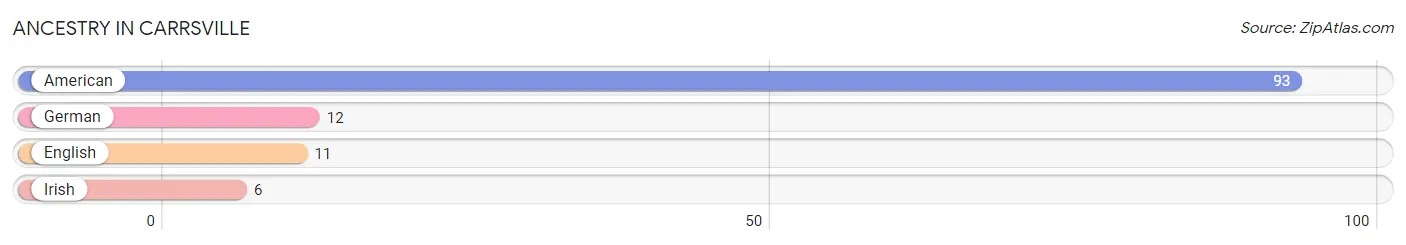
| Ancestry | # Population | % Population |
| American | 93 | 36.8% |
| English | 11 | 4.3% |
| German | 12 | 4.7% |
| Irish | 6 | 2.4% | View All 4 Rows |
Immigrants in Carrsville

| Immigration Origin | # Population | % Population | View All 0 Rows |
Sex and Age in Carrsville
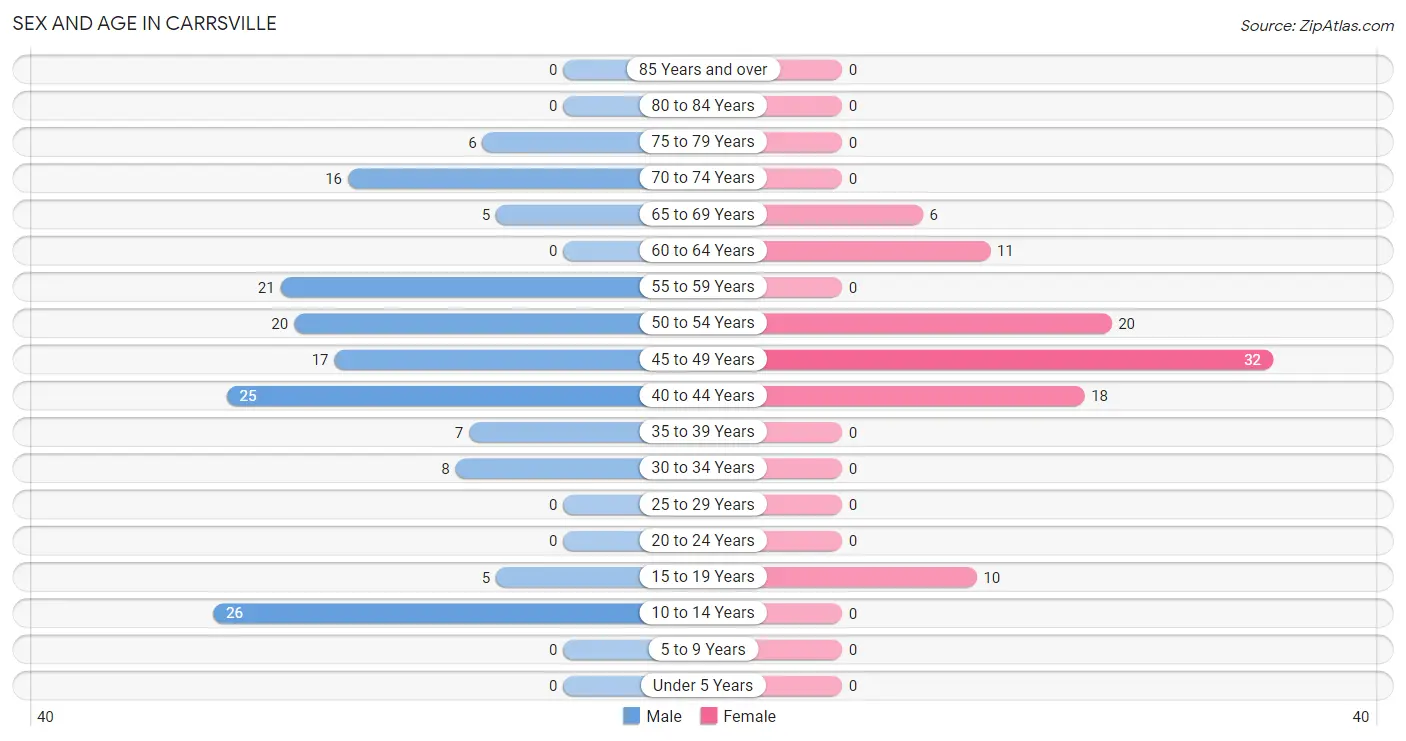
Sex and Age in Carrsville
The most populous age groups in Carrsville are 10 to 14 Years (26 | 16.7%) for men and 45 to 49 Years (32 | 33.0%) for women.
| Age Bracket | Male | Female |
| Under 5 Years | 0 (0.0%) | 0 (0.0%) |
| 5 to 9 Years | 0 (0.0%) | 0 (0.0%) |
| 10 to 14 Years | 26 (16.7%) | 0 (0.0%) |
| 15 to 19 Years | 5 (3.2%) | 10 (10.3%) |
| 20 to 24 Years | 0 (0.0%) | 0 (0.0%) |
| 25 to 29 Years | 0 (0.0%) | 0 (0.0%) |
| 30 to 34 Years | 8 (5.1%) | 0 (0.0%) |
| 35 to 39 Years | 7 (4.5%) | 0 (0.0%) |
| 40 to 44 Years | 25 (16.0%) | 18 (18.6%) |
| 45 to 49 Years | 17 (10.9%) | 32 (33.0%) |
| 50 to 54 Years | 20 (12.8%) | 20 (20.6%) |
| 55 to 59 Years | 21 (13.5%) | 0 (0.0%) |
| 60 to 64 Years | 0 (0.0%) | 11 (11.3%) |
| 65 to 69 Years | 5 (3.2%) | 6 (6.2%) |
| 70 to 74 Years | 16 (10.3%) | 0 (0.0%) |
| 75 to 79 Years | 6 (3.8%) | 0 (0.0%) |
| 80 to 84 Years | 0 (0.0%) | 0 (0.0%) |
| 85 Years and over | 0 (0.0%) | 0 (0.0%) |
| Total | 156 (100.0%) | 97 (100.0%) |
Families and Households in Carrsville
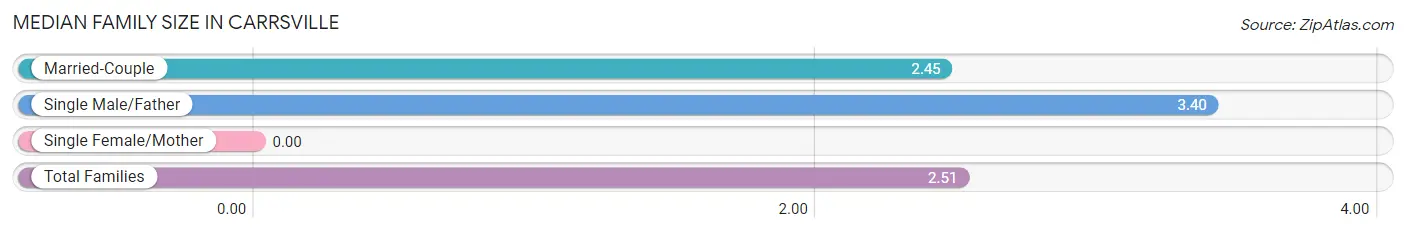
Median Family Size in Carrsville
| Family Type | # Families | Family Size |
| Married-Couple | 74 (93.7%) | 2.45 |
| Single Male/Father | 5 (6.3%) | 3.40 |
| Single Female/Mother | 0 (0.0%) | - |
| Total Families | 79 (100.0%) | 2.51 |
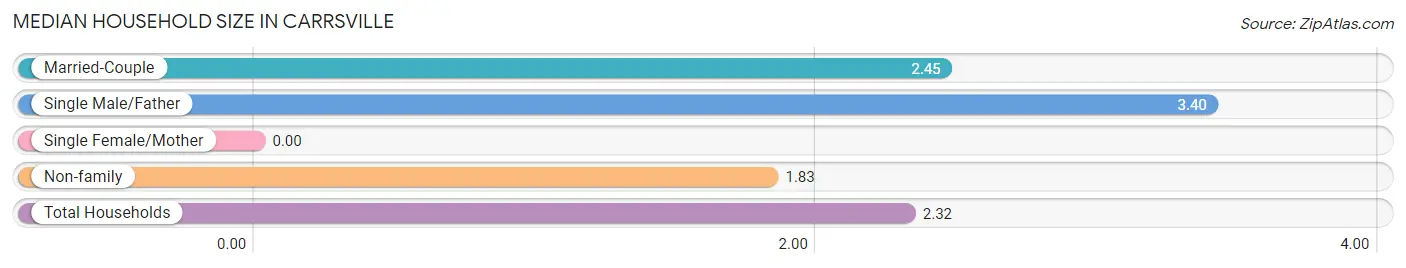
Median Household Size in Carrsville
| Household Type | # Households | Household Size |
| Married-Couple | 74 (67.9%) | 2.45 |
| Single Male/Father | 5 (4.6%) | 3.40 |
| Single Female/Mother | 0 (0.0%) | - |
| Non-family | 30 (27.5%) | 1.83 |
| Total Households | 109 (100.0%) | 2.32 |
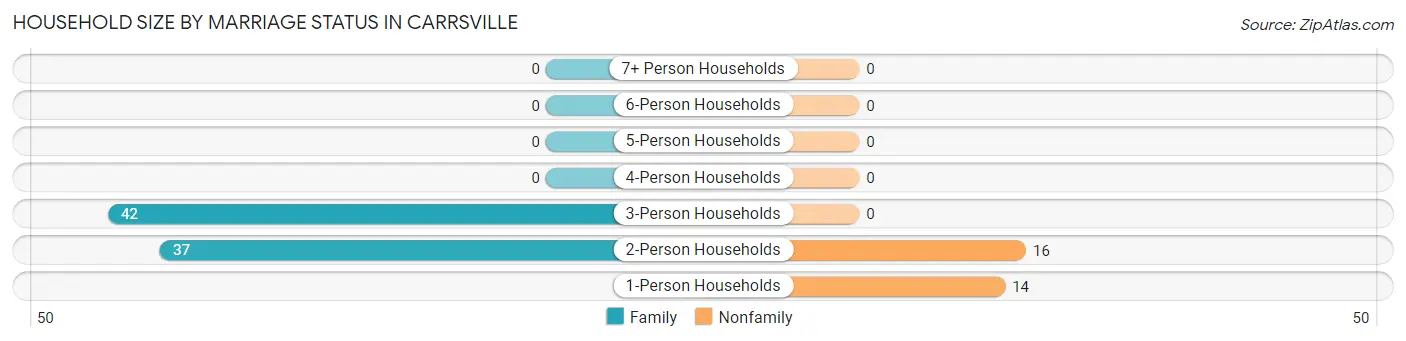
Household Size by Marriage Status in Carrsville
Out of a total of 109 households in Carrsville, 79 (72.5%) are family households, while 30 (27.5%) are nonfamily households. The most numerous type of family households are 3-person households, comprising 42, and the most common type of nonfamily households are 2-person households, comprising 16.
| Household Size | Family Households | Nonfamily Households |
| 1-Person Households | - | 14 (12.8%) |
| 2-Person Households | 37 (33.9%) | 16 (14.7%) |
| 3-Person Households | 42 (38.5%) | 0 (0.0%) |
| 4-Person Households | 0 (0.0%) | 0 (0.0%) |
| 5-Person Households | 0 (0.0%) | 0 (0.0%) |
| 6-Person Households | 0 (0.0%) | 0 (0.0%) |
| 7+ Person Households | 0 (0.0%) | 0 (0.0%) |
| Total | 79 (72.5%) | 30 (27.5%) |
Female Fertility in Carrsville
Fertility by Age in Carrsville
| Age Bracket | Women with Births | Births / 1,000 Women |
| 15 to 19 years | 0 (0.0%) | 0.0 |
| 20 to 34 years | 0 (0.0%) | 0.0 |
| 35 to 50 years | 0 (0.0%) | 0.0 |
| Total | 0 (0.0%) | 0.0 |
Fertility by Age by Marriage Status in Carrsville
| Age Bracket | Married | Unmarried |
| 15 to 19 years | 0 (0.0%) | 0 (0.0%) |
| 20 to 34 years | 0 (0.0%) | 0 (0.0%) |
| 35 to 50 years | 0 (0.0%) | 0 (0.0%) |
| Total | 0 (0.0%) | 0 (0.0%) |
Fertility by Education in Carrsville
| Educational Attainment | Women with Births | Births / 1,000 Women |
| Less than High School | 0 (0.0%) | 0.0 |
| High School Diploma | 0 (0.0%) | 0.0 |
| College or Associate's Degree | 0 (0.0%) | 0.0 |
| Bachelor's Degree | 0 (0.0%) | 0.0 |
| Graduate Degree | 0 (0.0%) | 0.0 |
| Total | 0 (0.0%) | 0.0 |
Fertility by Education by Marriage Status in Carrsville
| Educational Attainment | Married | Unmarried |
| Less than High School | 0 (0.0%) | 0 (0.0%) |
| High School Diploma | 0 (0.0%) | 0 (0.0%) |
| College or Associate's Degree | 0 (0.0%) | 0 (0.0%) |
| Bachelor's Degree | 0 (0.0%) | 0 (0.0%) |
| Graduate Degree | 0 (0.0%) | 0 (0.0%) |
| Total | 0 (0.0%) | 0 (0.0%) |
Employment Characteristics in Carrsville
Employment by Class of Employer in Carrsville
Among the 128 employed individuals in Carrsville, private company employees (103 | 80.5%), self-employed (not incorporated) (20 | 15.6%), and local government employees (5 | 3.9%) make up the most common classes of employment.
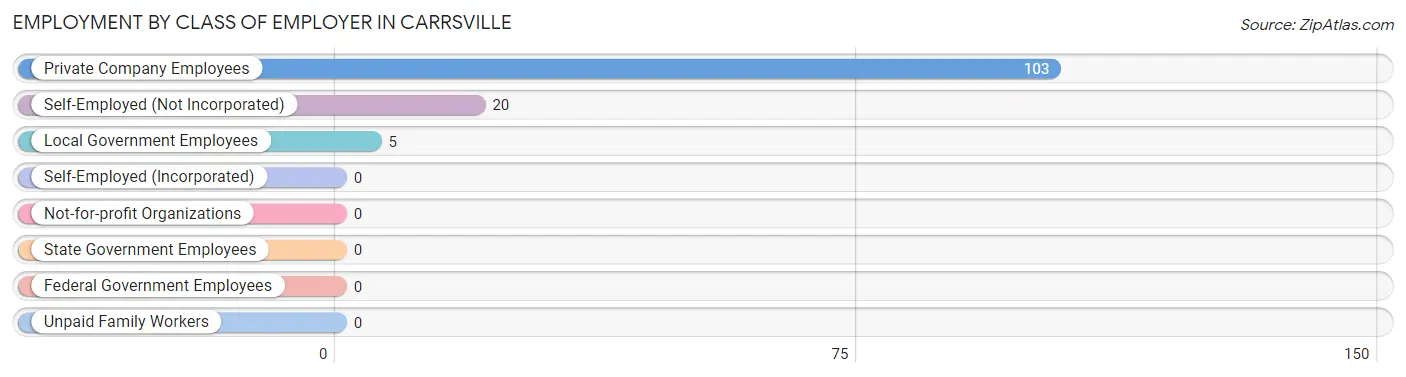
| Employer Class | # Employees | % Employees |
| Private Company Employees | 103 | 80.5% |
| Self-Employed (Incorporated) | 0 | 0.0% |
| Self-Employed (Not Incorporated) | 20 | 15.6% |
| Not-for-profit Organizations | 0 | 0.0% |
| Local Government Employees | 5 | 3.9% |
| State Government Employees | 0 | 0.0% |
| Federal Government Employees | 0 | 0.0% |
| Unpaid Family Workers | 0 | 0.0% |
| Total | 128 | 100.0% |
Employment Status by Age in Carrsville
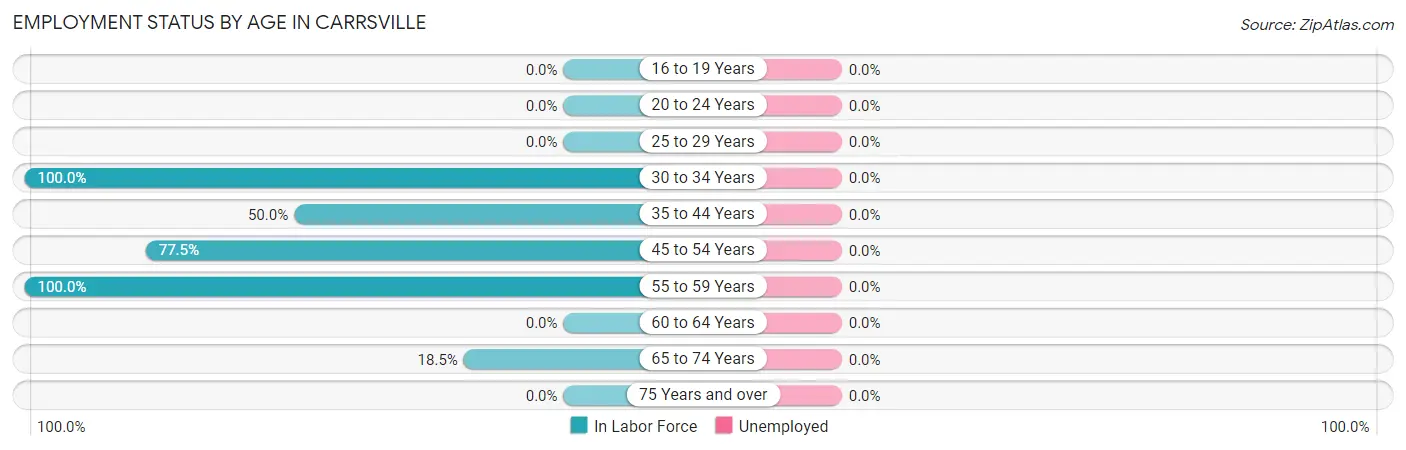
| Age Bracket | In Labor Force | Unemployed |
| 16 to 19 Years | 0 (0.0%) | 0 (0.0%) |
| 20 to 24 Years | 0 (0.0%) | 0 (0.0%) |
| 25 to 29 Years | 0 (0.0%) | 0 (0.0%) |
| 30 to 34 Years | 8 (100.0%) | 0 (0.0%) |
| 35 to 44 Years | 25 (50.0%) | 0 (0.0%) |
| 45 to 54 Years | 69 (77.5%) | 0 (0.0%) |
| 55 to 59 Years | 21 (100.0%) | 0 (0.0%) |
| 60 to 64 Years | 0 (0.0%) | 0 (0.0%) |
| 65 to 74 Years | 5 (18.5%) | 0 (0.0%) |
| 75 Years and over | 0 (0.0%) | 0 (0.0%) |
| Total | 128 (59.0%) | 0 (0.0%) |
Employment Status by Educational Attainment in Carrsville
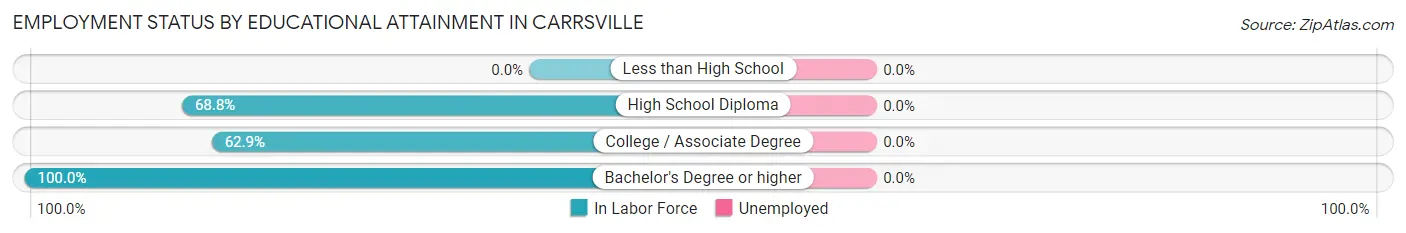
| Educational Attainment | In Labor Force | Unemployed |
| Less than High School | 0 (0.0%) | 0 (0.0%) |
| High School Diploma | 44 (68.8%) | 0 (0.0%) |
| College / Associate Degree | 61 (62.9%) | 0 (0.0%) |
| Bachelor's Degree or higher | 18 (100.0%) | 0 (0.0%) |
| Total | 123 (68.7%) | 0 (0.0%) |
Employment Occupations by Sex in Carrsville
Management, Business, Science and Arts Occupations
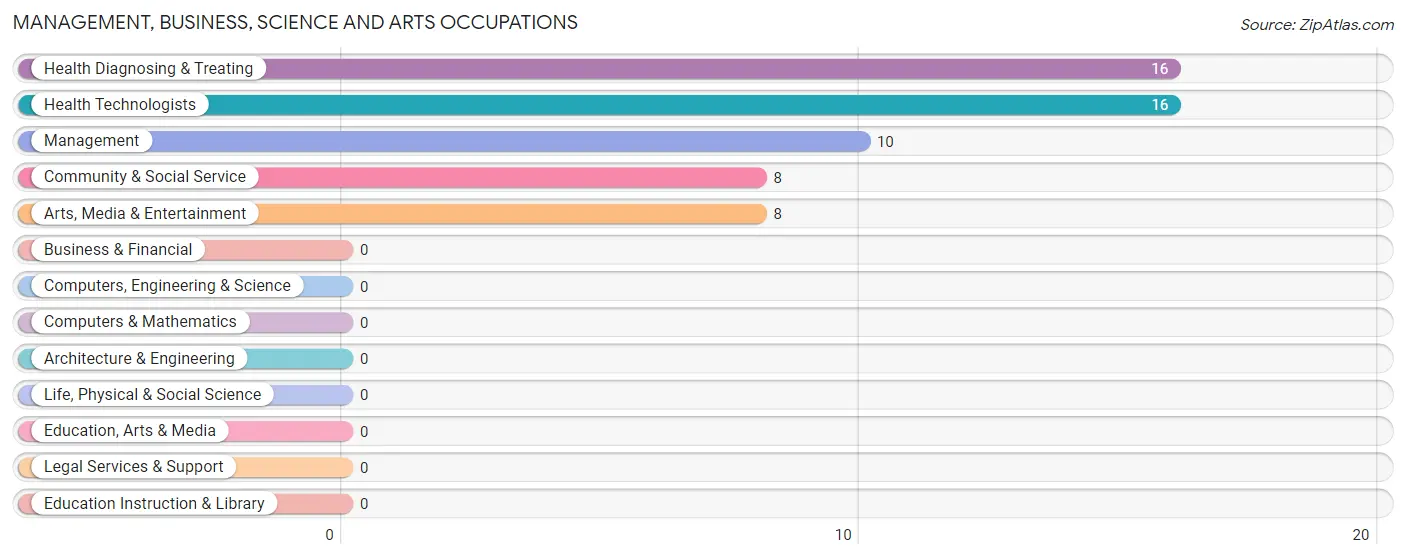
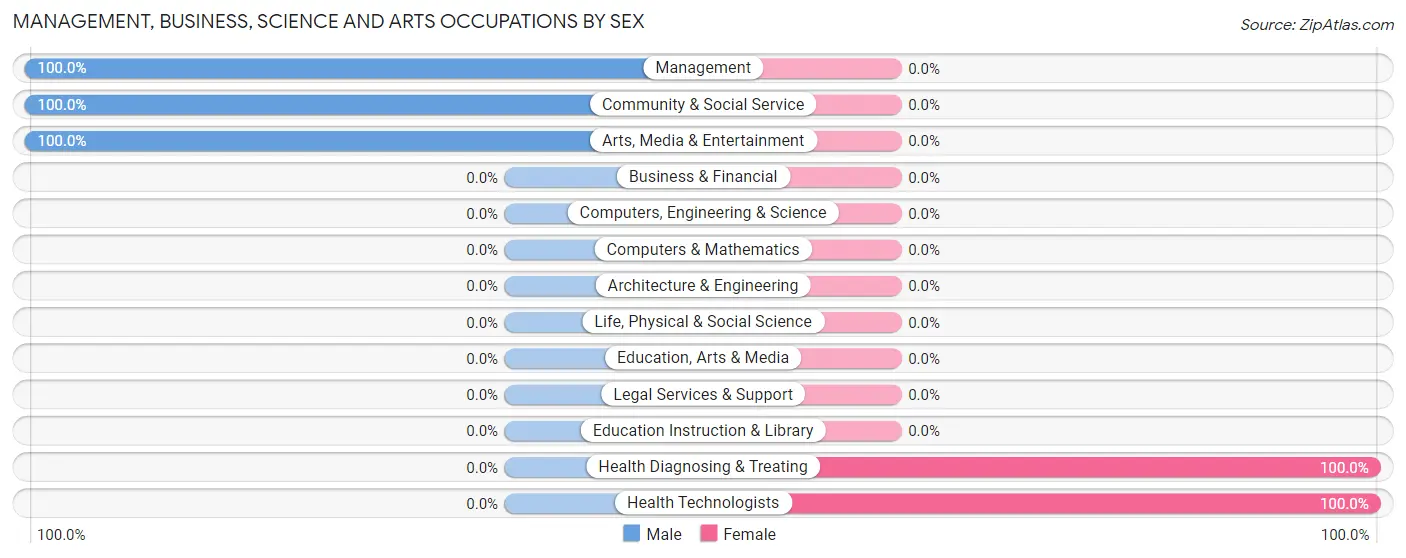
The most common Management, Business, Science and Arts occupations in Carrsville are Health Diagnosing & Treating (16 | 12.5%), Health Technologists (16 | 12.5%), Management (10 | 7.8%), Community & Social Service (8 | 6.2%), and Arts, Media & Entertainment (8 | 6.2%).
Management, Business, Science and Arts Occupations by Sex
Within the Management, Business, Science and Arts occupations in Carrsville, the most male-oriented occupations are Management (100.0%), Community & Social Service (100.0%), and Arts, Media & Entertainment (100.0%), while the most female-oriented occupations are Health Diagnosing & Treating (100.0%), and Health Technologists (100.0%).
| Occupation | Male | Female |
| Management | 10 (100.0%) | 0 (0.0%) |
| Business & Financial | 0 (0.0%) | 0 (0.0%) |
| Computers, Engineering & Science | 0 (0.0%) | 0 (0.0%) |
| Computers & Mathematics | 0 (0.0%) | 0 (0.0%) |
| Architecture & Engineering | 0 (0.0%) | 0 (0.0%) |
| Life, Physical & Social Science | 0 (0.0%) | 0 (0.0%) |
| Community & Social Service | 8 (100.0%) | 0 (0.0%) |
| Education, Arts & Media | 0 (0.0%) | 0 (0.0%) |
| Legal Services & Support | 0 (0.0%) | 0 (0.0%) |
| Education Instruction & Library | 0 (0.0%) | 0 (0.0%) |
| Arts, Media & Entertainment | 8 (100.0%) | 0 (0.0%) |
| Health Diagnosing & Treating | 0 (0.0%) | 16 (100.0%) |
| Health Technologists | 0 (0.0%) | 16 (100.0%) |
| Total (Category) | 18 (52.9%) | 16 (47.1%) |
| Total (Overall) | 78 (60.9%) | 50 (39.1%) |
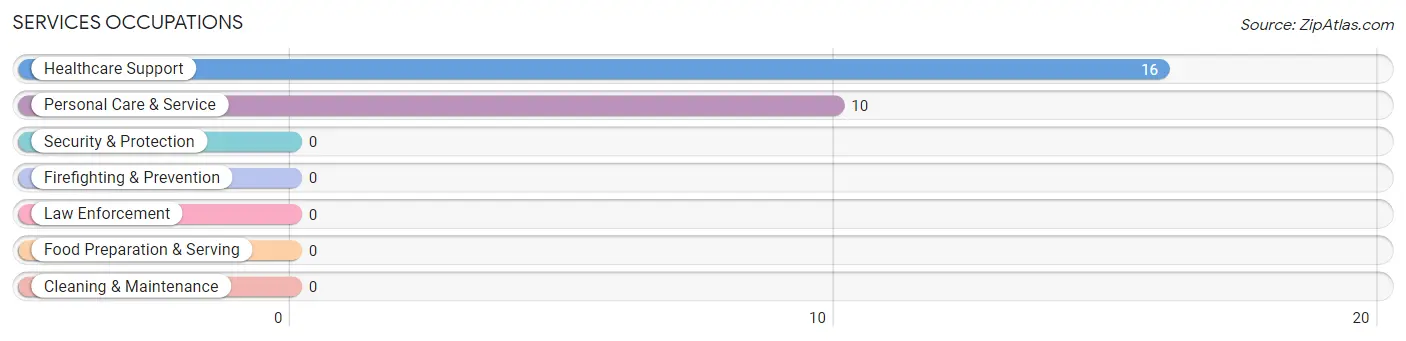
Services Occupations
The most common Services occupations in Carrsville are Healthcare Support (16 | 12.5%), and Personal Care & Service (10 | 7.8%).
Services Occupations by Sex
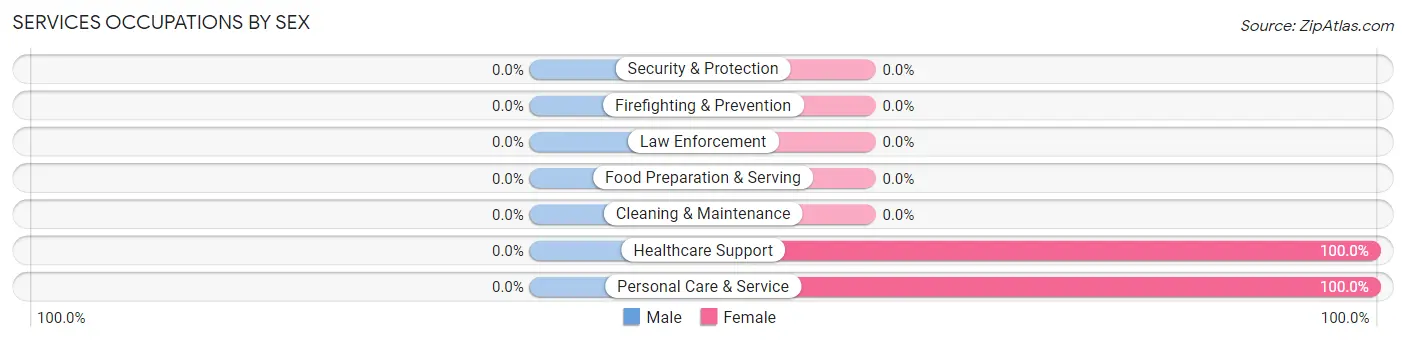
| Occupation | Male | Female |
| Healthcare Support | 0 (0.0%) | 16 (100.0%) |
| Security & Protection | 0 (0.0%) | 0 (0.0%) |
| Firefighting & Prevention | 0 (0.0%) | 0 (0.0%) |
| Law Enforcement | 0 (0.0%) | 0 (0.0%) |
| Food Preparation & Serving | 0 (0.0%) | 0 (0.0%) |
| Cleaning & Maintenance | 0 (0.0%) | 0 (0.0%) |
| Personal Care & Service | 0 (0.0%) | 10 (100.0%) |
| Total (Category) | 0 (0.0%) | 26 (100.0%) |
| Total (Overall) | 78 (60.9%) | 50 (39.1%) |
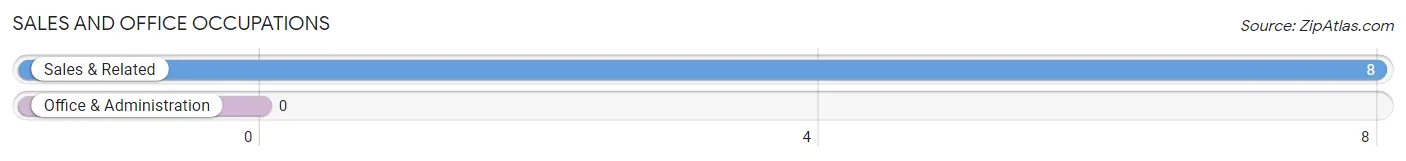
Sales and Office Occupations
The most common Sales and Office occupations in Carrsville are , and Sales & Related (8 | 6.2%).
Sales and Office Occupations by Sex
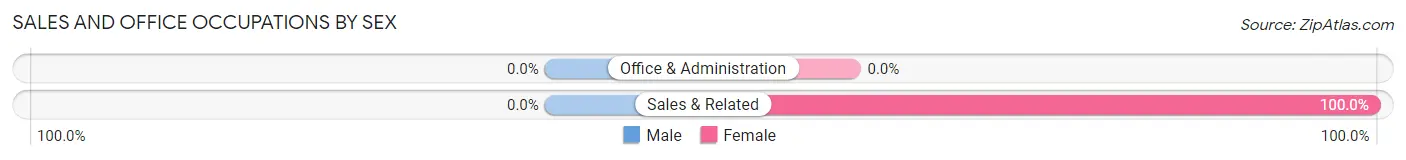
| Occupation | Male | Female |
| Sales & Related | 0 (0.0%) | 8 (100.0%) |
| Office & Administration | 0 (0.0%) | 0 (0.0%) |
| Total (Category) | 0 (0.0%) | 8 (100.0%) |
| Total (Overall) | 78 (60.9%) | 50 (39.1%) |
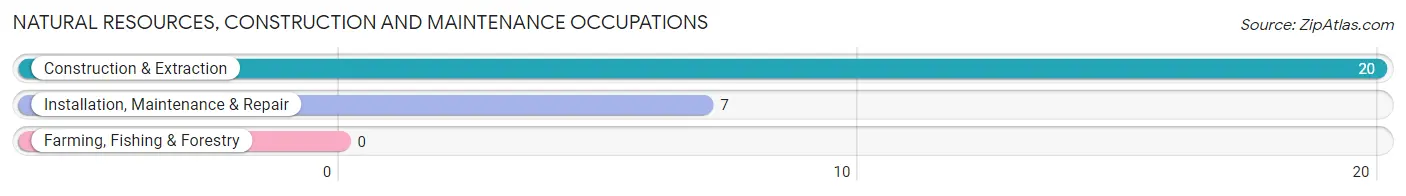
Natural Resources, Construction and Maintenance Occupations
The most common Natural Resources, Construction and Maintenance occupations in Carrsville are Construction & Extraction (20 | 15.6%), and Installation, Maintenance & Repair (7 | 5.5%).
Natural Resources, Construction and Maintenance Occupations by Sex
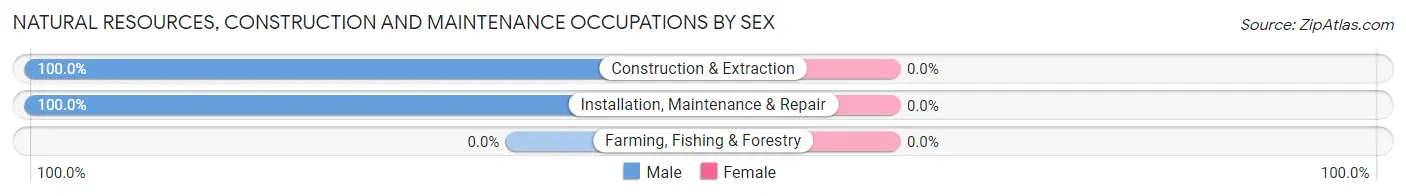
| Occupation | Male | Female |
| Farming, Fishing & Forestry | 0 (0.0%) | 0 (0.0%) |
| Construction & Extraction | 20 (100.0%) | 0 (0.0%) |
| Installation, Maintenance & Repair | 7 (100.0%) | 0 (0.0%) |
| Total (Category) | 27 (100.0%) | 0 (0.0%) |
| Total (Overall) | 78 (60.9%) | 50 (39.1%) |
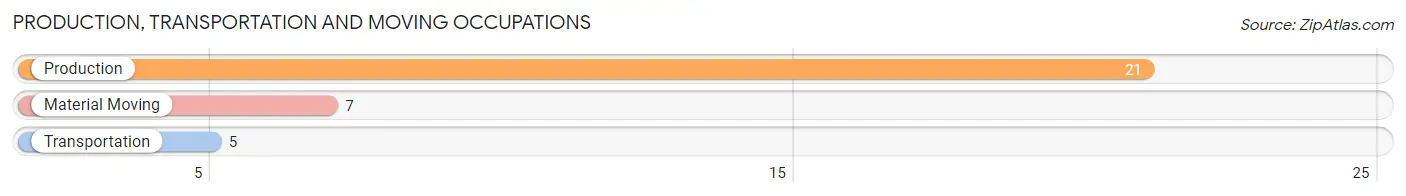
Production, Transportation and Moving Occupations
The most common Production, Transportation and Moving occupations in Carrsville are Production (21 | 16.4%), Material Moving (7 | 5.5%), and Transportation (5 | 3.9%).
Production, Transportation and Moving Occupations by Sex
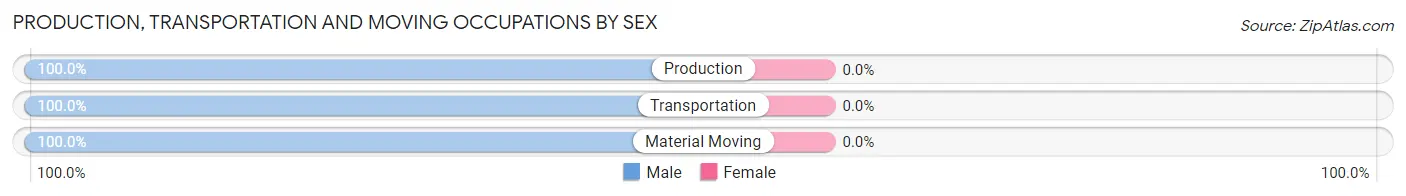
| Occupation | Male | Female |
| Production | 21 (100.0%) | 0 (0.0%) |
| Transportation | 5 (100.0%) | 0 (0.0%) |
| Material Moving | 7 (100.0%) | 0 (0.0%) |
| Total (Category) | 33 (100.0%) | 0 (0.0%) |
| Total (Overall) | 78 (60.9%) | 50 (39.1%) |
Employment Industries by Sex in Carrsville
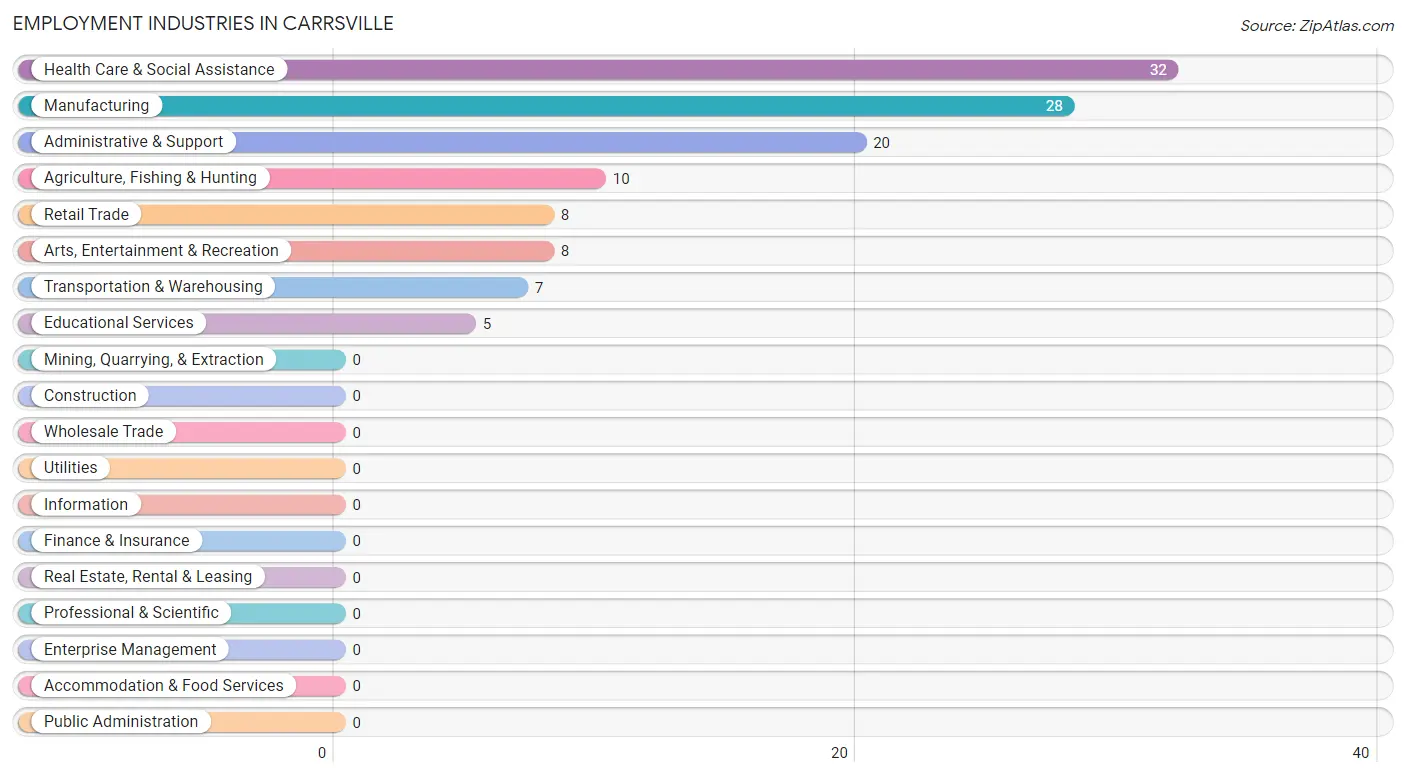
Employment Industries in Carrsville
The major employment industries in Carrsville include Health Care & Social Assistance (32 | 25.0%), Manufacturing (28 | 21.9%), Administrative & Support (20 | 15.6%), Agriculture, Fishing & Hunting (10 | 7.8%), and Retail Trade (8 | 6.2%).
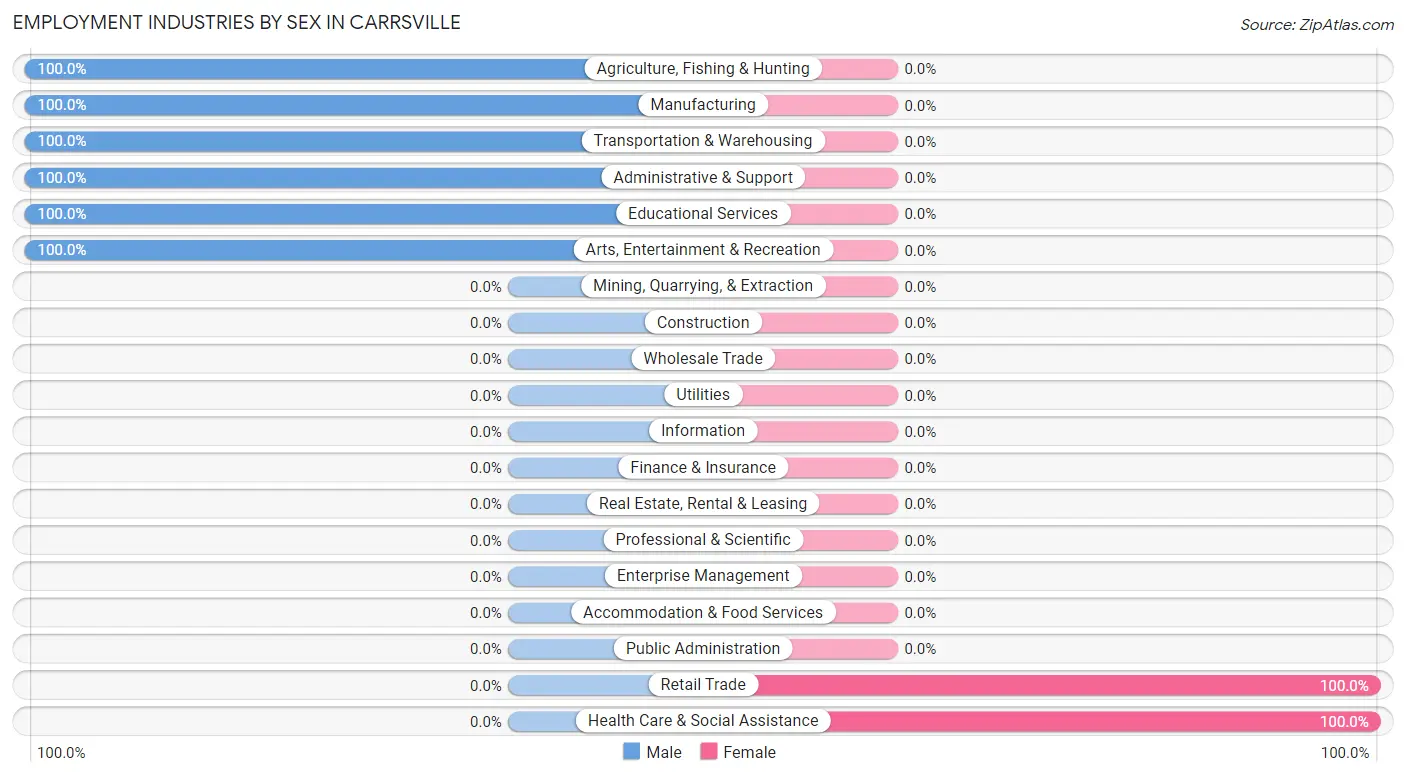
Employment Industries by Sex in Carrsville
The Carrsville industries that see more men than women are Agriculture, Fishing & Hunting (100.0%), Manufacturing (100.0%), and Transportation & Warehousing (100.0%), whereas the industries that tend to have a higher number of women are Retail Trade (100.0%), and Health Care & Social Assistance (100.0%).
| Industry | Male | Female |
| Agriculture, Fishing & Hunting | 10 (100.0%) | 0 (0.0%) |
| Mining, Quarrying, & Extraction | 0 (0.0%) | 0 (0.0%) |
| Construction | 0 (0.0%) | 0 (0.0%) |
| Manufacturing | 28 (100.0%) | 0 (0.0%) |
| Wholesale Trade | 0 (0.0%) | 0 (0.0%) |
| Retail Trade | 0 (0.0%) | 8 (100.0%) |
| Transportation & Warehousing | 7 (100.0%) | 0 (0.0%) |
| Utilities | 0 (0.0%) | 0 (0.0%) |
| Information | 0 (0.0%) | 0 (0.0%) |
| Finance & Insurance | 0 (0.0%) | 0 (0.0%) |
| Real Estate, Rental & Leasing | 0 (0.0%) | 0 (0.0%) |
| Professional & Scientific | 0 (0.0%) | 0 (0.0%) |
| Enterprise Management | 0 (0.0%) | 0 (0.0%) |
| Administrative & Support | 20 (100.0%) | 0 (0.0%) |
| Educational Services | 5 (100.0%) | 0 (0.0%) |
| Health Care & Social Assistance | 0 (0.0%) | 32 (100.0%) |
| Arts, Entertainment & Recreation | 8 (100.0%) | 0 (0.0%) |
| Accommodation & Food Services | 0 (0.0%) | 0 (0.0%) |
| Public Administration | 0 (0.0%) | 0 (0.0%) |
| Total | 78 (60.9%) | 50 (39.1%) |
Education in Carrsville
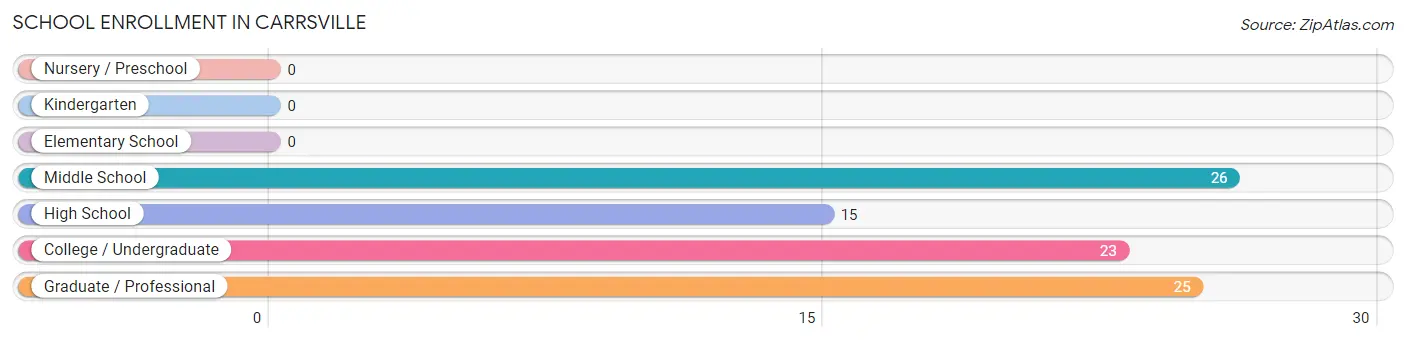
School Enrollment in Carrsville
The most common levels of schooling among the 89 students in Carrsville are middle school (26 | 29.2%), graduate / professional (25 | 28.1%), and college / undergraduate (23 | 25.8%).
| School Level | # Students | % Students |
| Nursery / Preschool | 0 | 0.0% |
| Kindergarten | 0 | 0.0% |
| Elementary School | 0 | 0.0% |
| Middle School | 26 | 29.2% |
| High School | 15 | 16.9% |
| College / Undergraduate | 23 | 25.8% |
| Graduate / Professional | 25 | 28.1% |
| Total | 89 | 100.0% |
School Enrollment by Age by Funding Source in Carrsville
Out of a total of 89 students who are enrolled in schools in Carrsville, 39 (43.8%) attend a private institution, while the remaining 50 (56.2%) are enrolled in public schools. The age group of 35 years and over has the highest likelihood of being enrolled in private schools, with 32 (66.7% in the age bracket) enrolled. Conversely, the age group of 15 to 17 year olds has the lowest likelihood of being enrolled in a private school, with 15 (100.0% in the age bracket) attending a public institution.
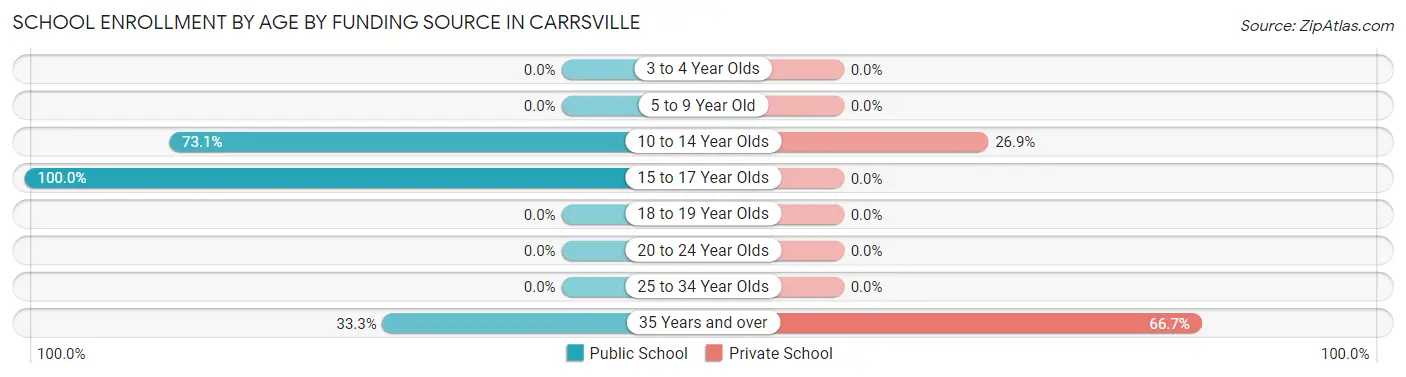
| Age Bracket | Public School | Private School |
| 3 to 4 Year Olds | 0 (0.0%) | 0 (0.0%) |
| 5 to 9 Year Old | 0 (0.0%) | 0 (0.0%) |
| 10 to 14 Year Olds | 19 (73.1%) | 7 (26.9%) |
| 15 to 17 Year Olds | 15 (100.0%) | 0 (0.0%) |
| 18 to 19 Year Olds | 0 (0.0%) | 0 (0.0%) |
| 20 to 24 Year Olds | 0 (0.0%) | 0 (0.0%) |
| 25 to 34 Year Olds | 0 (0.0%) | 0 (0.0%) |
| 35 Years and over | 16 (33.3%) | 32 (66.7%) |
| Total | 50 (56.2%) | 39 (43.8%) |
Educational Attainment by Field of Study in Carrsville
Literature & languages (10 | 41.7%), computers & mathematics (8 | 33.3%), and physical & health sciences (6 | 25.0%) are the most common fields of study among 24 individuals in Carrsville who have obtained a bachelor's degree or higher.
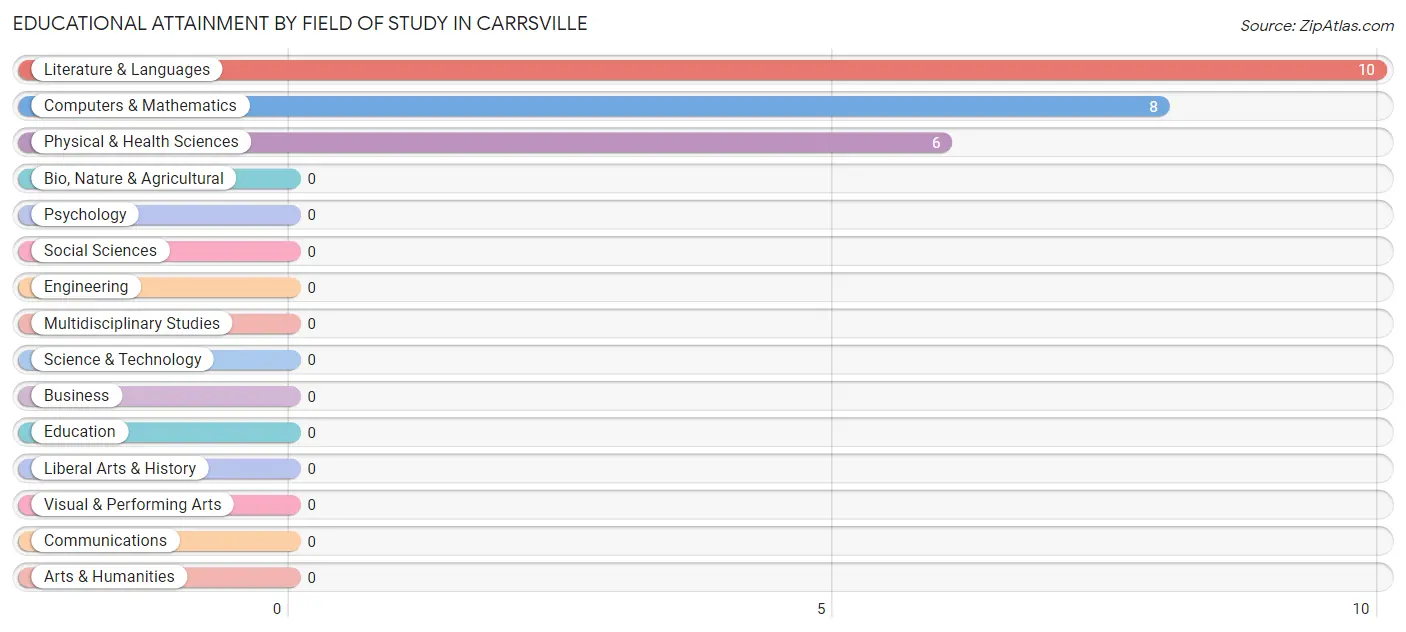
| Field of Study | # Graduates | % Graduates |
| Computers & Mathematics | 8 | 33.3% |
| Bio, Nature & Agricultural | 0 | 0.0% |
| Physical & Health Sciences | 6 | 25.0% |
| Psychology | 0 | 0.0% |
| Social Sciences | 0 | 0.0% |
| Engineering | 0 | 0.0% |
| Multidisciplinary Studies | 0 | 0.0% |
| Science & Technology | 0 | 0.0% |
| Business | 0 | 0.0% |
| Education | 0 | 0.0% |
| Literature & Languages | 10 | 41.7% |
| Liberal Arts & History | 0 | 0.0% |
| Visual & Performing Arts | 0 | 0.0% |
| Communications | 0 | 0.0% |
| Arts & Humanities | 0 | 0.0% |
| Total | 24 | 100.0% |
Transportation & Commute in Carrsville
Vehicle Availability by Sex in Carrsville
The most prevalent vehicle ownership categories in Carrsville are males with 3 vehicles (60, accounting for 76.9%) and females with 3 vehicles (40, making up 120.0%).
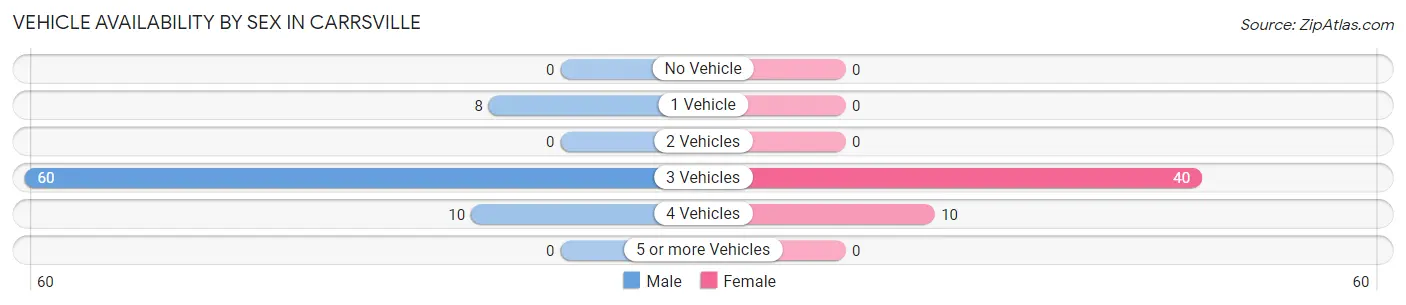
| Vehicles Available | Male | Female |
| No Vehicle | 0 (0.0%) | 0 (0.0%) |
| 1 Vehicle | 8 (10.3%) | 0 (0.0%) |
| 2 Vehicles | 0 (0.0%) | 0 (0.0%) |
| 3 Vehicles | 60 (76.9%) | 40 (80.0%) |
| 4 Vehicles | 10 (12.8%) | 10 (20.0%) |
| 5 or more Vehicles | 0 (0.0%) | 0 (0.0%) |
| Total | 78 (100.0%) | 50 (100.0%) |
Commute Time in Carrsville
The most frequently occuring commute durations in Carrsville are 60 to 89 minutes (41 commuters, 34.7%), 20 to 24 minutes (23 commuters, 19.5%), and 10 to 14 minutes (16 commuters, 13.6%).
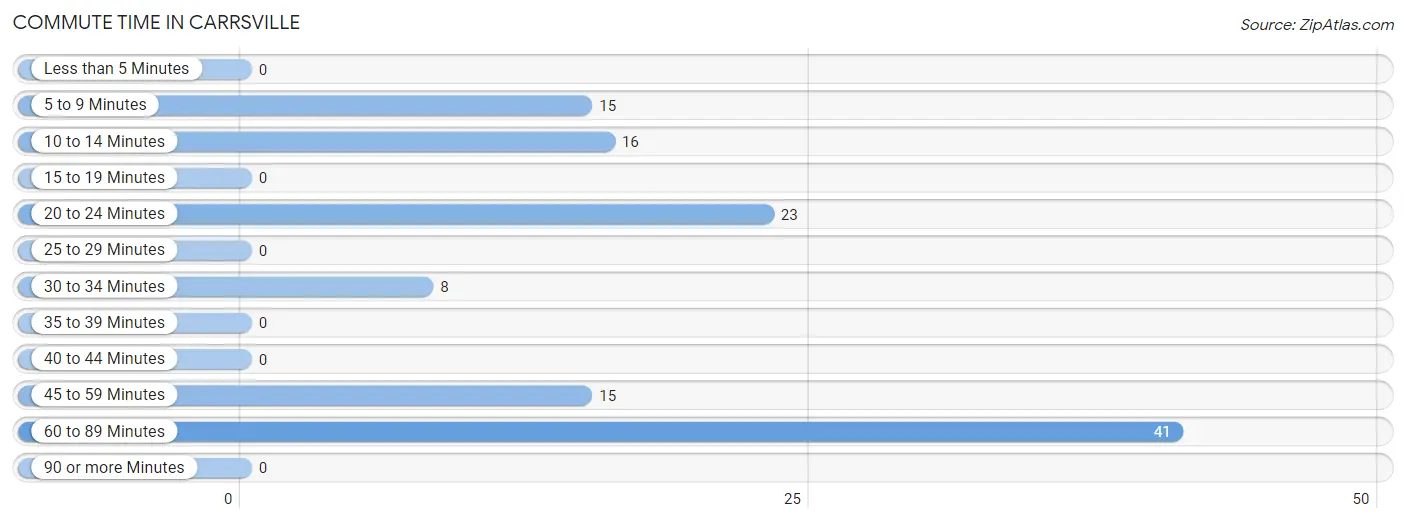
| Commute Time | # Commuters | % Commuters |
| Less than 5 Minutes | 0 | 0.0% |
| 5 to 9 Minutes | 15 | 12.7% |
| 10 to 14 Minutes | 16 | 13.6% |
| 15 to 19 Minutes | 0 | 0.0% |
| 20 to 24 Minutes | 23 | 19.5% |
| 25 to 29 Minutes | 0 | 0.0% |
| 30 to 34 Minutes | 8 | 6.8% |
| 35 to 39 Minutes | 0 | 0.0% |
| 40 to 44 Minutes | 0 | 0.0% |
| 45 to 59 Minutes | 15 | 12.7% |
| 60 to 89 Minutes | 41 | 34.7% |
| 90 or more Minutes | 0 | 0.0% |
Commute Time by Sex in Carrsville
The most common commute times in Carrsville are 60 to 89 minutes (41 commuters, 52.6%) for males and 10 to 14 minutes (16 commuters, 40.0%) for females.
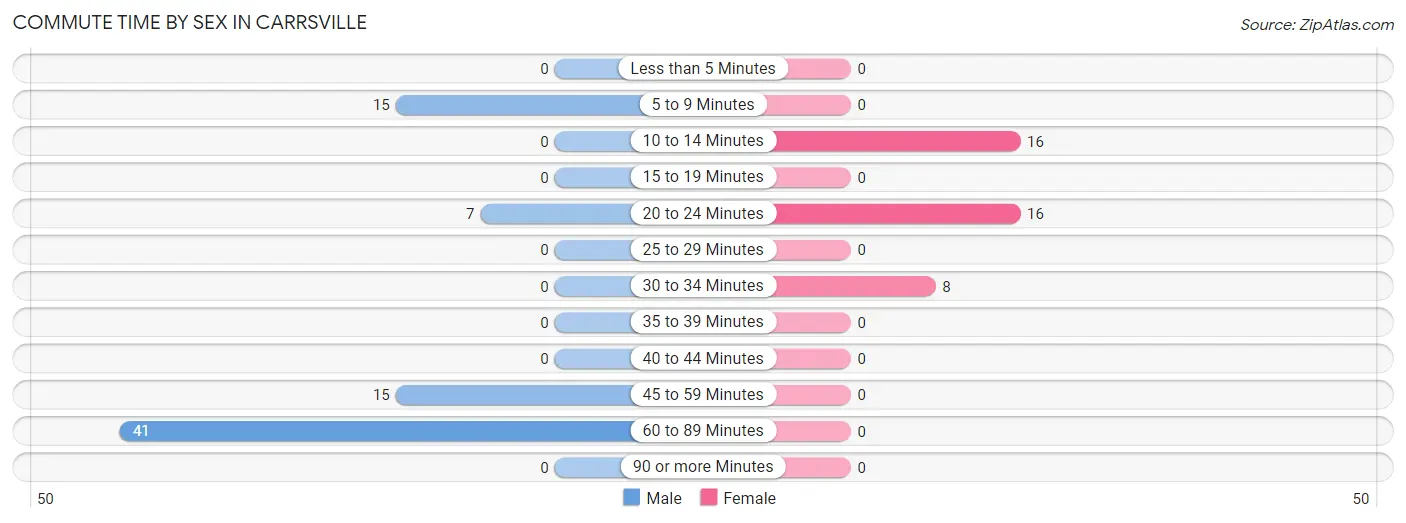
| Commute Time | Male | Female |
| Less than 5 Minutes | 0 (0.0%) | 0 (0.0%) |
| 5 to 9 Minutes | 15 (19.2%) | 0 (0.0%) |
| 10 to 14 Minutes | 0 (0.0%) | 16 (40.0%) |
| 15 to 19 Minutes | 0 (0.0%) | 0 (0.0%) |
| 20 to 24 Minutes | 7 (9.0%) | 16 (40.0%) |
| 25 to 29 Minutes | 0 (0.0%) | 0 (0.0%) |
| 30 to 34 Minutes | 0 (0.0%) | 8 (20.0%) |
| 35 to 39 Minutes | 0 (0.0%) | 0 (0.0%) |
| 40 to 44 Minutes | 0 (0.0%) | 0 (0.0%) |
| 45 to 59 Minutes | 15 (19.2%) | 0 (0.0%) |
| 60 to 89 Minutes | 41 (52.6%) | 0 (0.0%) |
| 90 or more Minutes | 0 (0.0%) | 0 (0.0%) |
Time of Departure to Work by Sex in Carrsville
The most frequent times of departure to work in Carrsville are 5:00 AM to 5:29 AM (36, 46.2%) for males and 6:30 AM to 6:59 AM (16, 40.0%) for females.
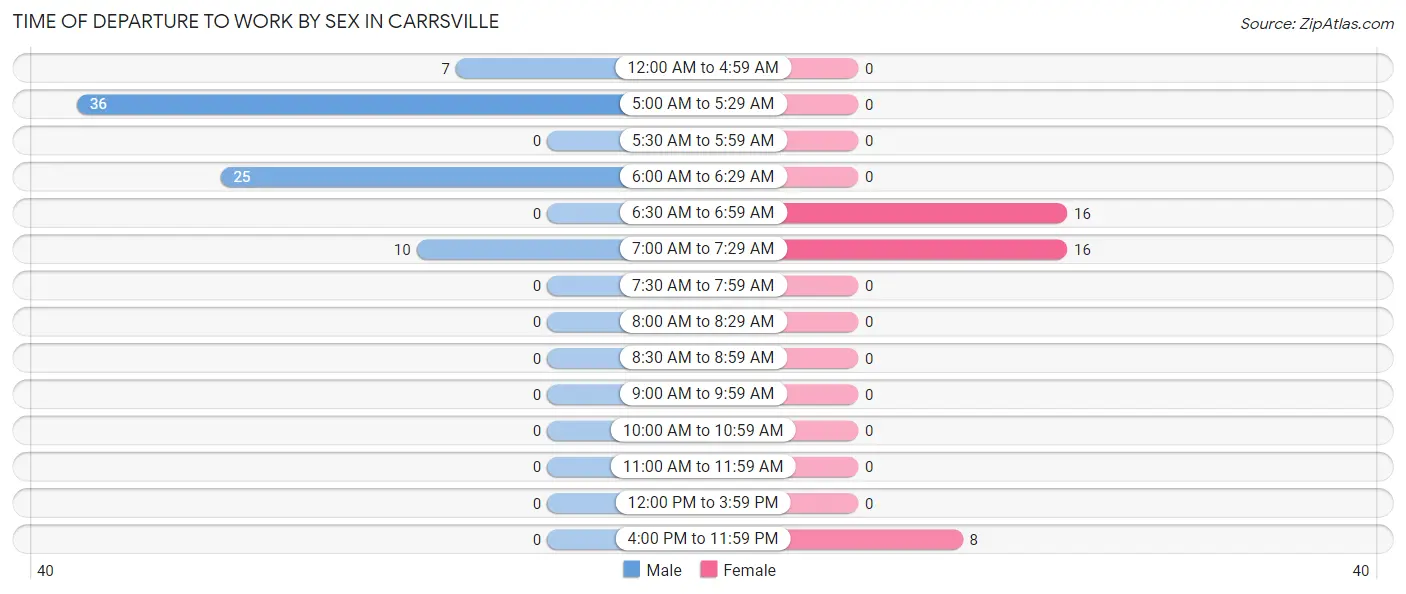
| Time of Departure | Male | Female |
| 12:00 AM to 4:59 AM | 7 (9.0%) | 0 (0.0%) |
| 5:00 AM to 5:29 AM | 36 (46.2%) | 0 (0.0%) |
| 5:30 AM to 5:59 AM | 0 (0.0%) | 0 (0.0%) |
| 6:00 AM to 6:29 AM | 25 (32.1%) | 0 (0.0%) |
| 6:30 AM to 6:59 AM | 0 (0.0%) | 16 (40.0%) |
| 7:00 AM to 7:29 AM | 10 (12.8%) | 16 (40.0%) |
| 7:30 AM to 7:59 AM | 0 (0.0%) | 0 (0.0%) |
| 8:00 AM to 8:29 AM | 0 (0.0%) | 0 (0.0%) |
| 8:30 AM to 8:59 AM | 0 (0.0%) | 0 (0.0%) |
| 9:00 AM to 9:59 AM | 0 (0.0%) | 0 (0.0%) |
| 10:00 AM to 10:59 AM | 0 (0.0%) | 0 (0.0%) |
| 11:00 AM to 11:59 AM | 0 (0.0%) | 0 (0.0%) |
| 12:00 PM to 3:59 PM | 0 (0.0%) | 0 (0.0%) |
| 4:00 PM to 11:59 PM | 0 (0.0%) | 8 (20.0%) |
| Total | 78 (100.0%) | 40 (100.0%) |
Housing Occupancy in Carrsville
Occupancy by Ownership in Carrsville
Of the total 109 dwellings in Carrsville, owner-occupied units account for 93 (85.3%), while renter-occupied units make up 16 (14.7%).
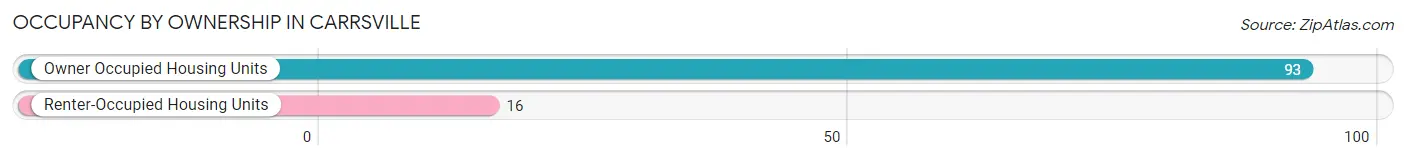
| Occupancy | # Housing Units | % Housing Units |
| Owner Occupied Housing Units | 93 | 85.3% |
| Renter-Occupied Housing Units | 16 | 14.7% |
| Total Occupied Housing Units | 109 | 100.0% |
Occupancy by Household Size in Carrsville
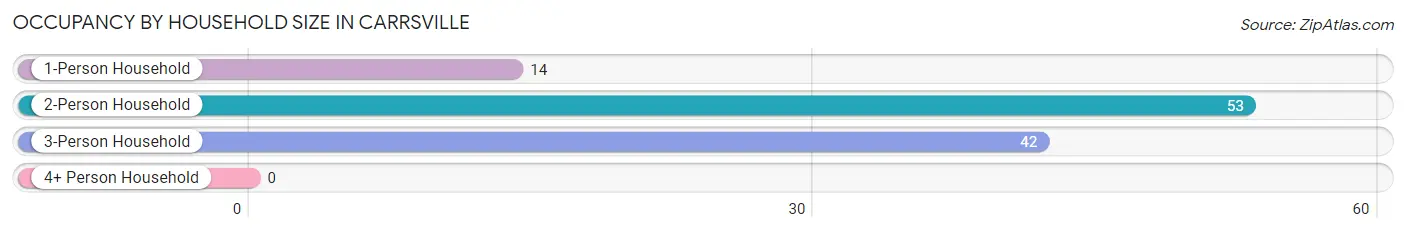
| Household Size | # Housing Units | % Housing Units |
| 1-Person Household | 14 | 12.8% |
| 2-Person Household | 53 | 48.6% |
| 3-Person Household | 42 | 38.5% |
| 4+ Person Household | 0 | 0.0% |
| Total Housing Units | 109 | 100.0% |
Occupancy by Ownership by Household Size in Carrsville
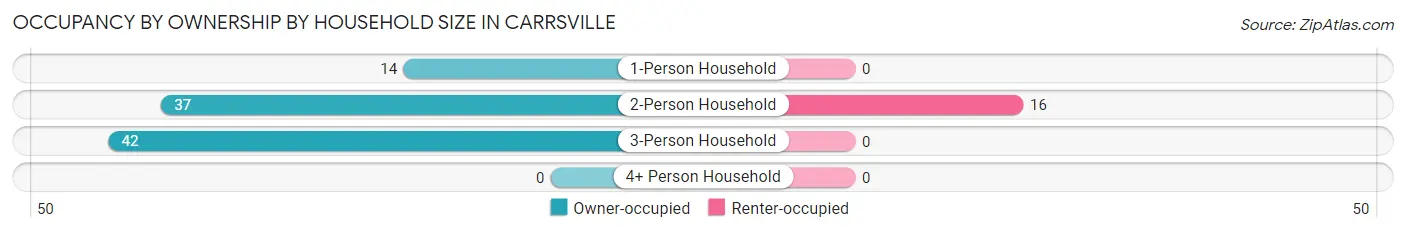
| Household Size | Owner-occupied | Renter-occupied |
| 1-Person Household | 14 (100.0%) | 0 (0.0%) |
| 2-Person Household | 37 (69.8%) | 16 (30.2%) |
| 3-Person Household | 42 (100.0%) | 0 (0.0%) |
| 4+ Person Household | 0 (0.0%) | 0 (0.0%) |
| Total Housing Units | 93 (85.3%) | 16 (14.7%) |
Occupancy by Educational Attainment in Carrsville
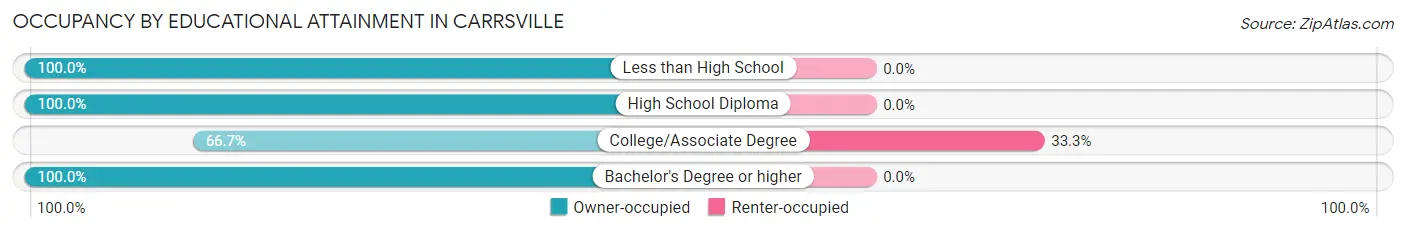
| Household Size | Owner-occupied | Renter-occupied |
| Less than High School | 5 (100.0%) | 0 (0.0%) |
| High School Diploma | 32 (100.0%) | 0 (0.0%) |
| College/Associate Degree | 32 (66.7%) | 16 (33.3%) |
| Bachelor's Degree or higher | 24 (100.0%) | 0 (0.0%) |
Occupancy by Age of Householder in Carrsville
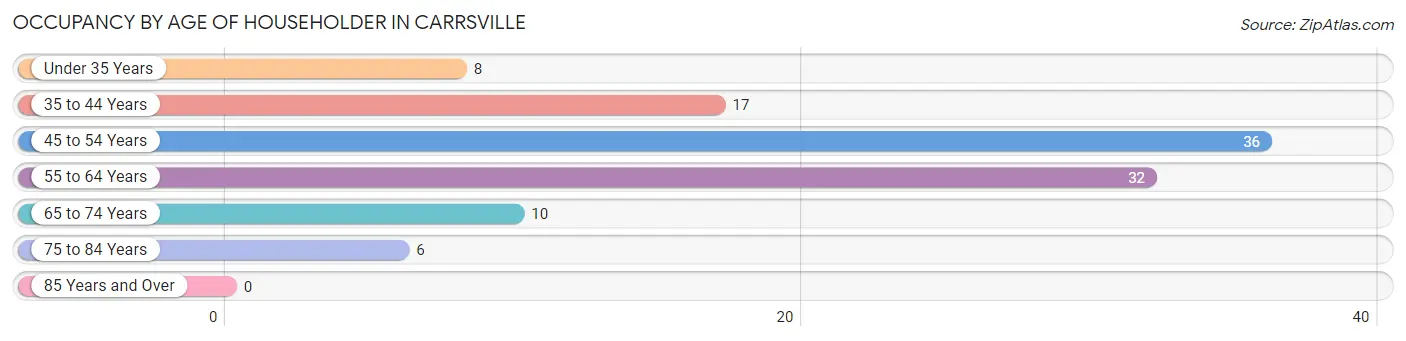
| Age Bracket | # Households | % Households |
| Under 35 Years | 8 | 7.3% |
| 35 to 44 Years | 17 | 15.6% |
| 45 to 54 Years | 36 | 33.0% |
| 55 to 64 Years | 32 | 29.4% |
| 65 to 74 Years | 10 | 9.2% |
| 75 to 84 Years | 6 | 5.5% |
| 85 Years and Over | 0 | 0.0% |
| Total | 109 | 100.0% |
Housing Finances in Carrsville
Median Income by Occupancy in Carrsville
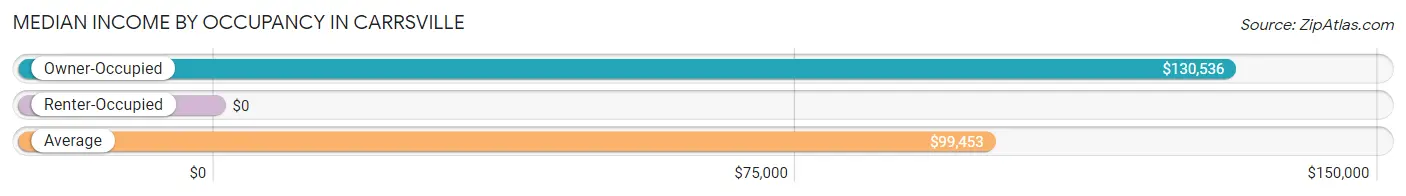
| Occupancy Type | # Households | Median Income |
| Owner-Occupied | 93 (85.3%) | $130,536 |
| Renter-Occupied | 16 (14.7%) | $0 |
| Average | 109 (100.0%) | $99,453 |
Occupancy by Householder Income Bracket in Carrsville
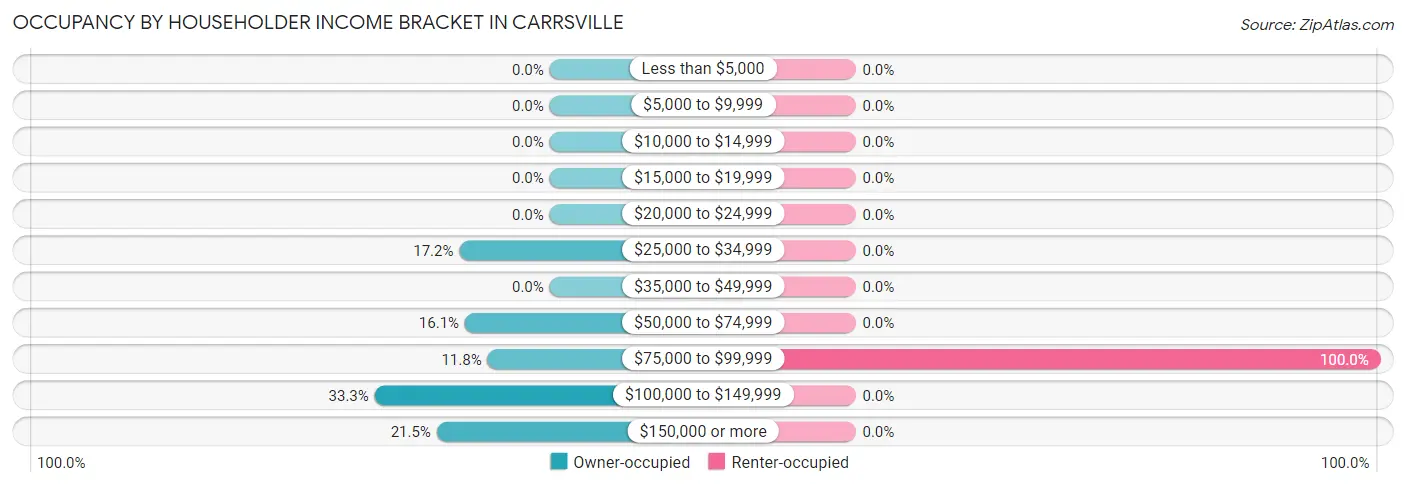
| Income Bracket | Owner-occupied | Renter-occupied |
| Less than $5,000 | 0 (0.0%) | 0 (0.0%) |
| $5,000 to $9,999 | 0 (0.0%) | 0 (0.0%) |
| $10,000 to $14,999 | 0 (0.0%) | 0 (0.0%) |
| $15,000 to $19,999 | 0 (0.0%) | 0 (0.0%) |
| $20,000 to $24,999 | 0 (0.0%) | 0 (0.0%) |
| $25,000 to $34,999 | 16 (17.2%) | 0 (0.0%) |
| $35,000 to $49,999 | 0 (0.0%) | 0 (0.0%) |
| $50,000 to $74,999 | 15 (16.1%) | 0 (0.0%) |
| $75,000 to $99,999 | 11 (11.8%) | 16 (100.0%) |
| $100,000 to $149,999 | 31 (33.3%) | 0 (0.0%) |
| $150,000 or more | 20 (21.5%) | 0 (0.0%) |
| Total | 93 (100.0%) | 16 (100.0%) |
Monthly Housing Cost Tiers in Carrsville
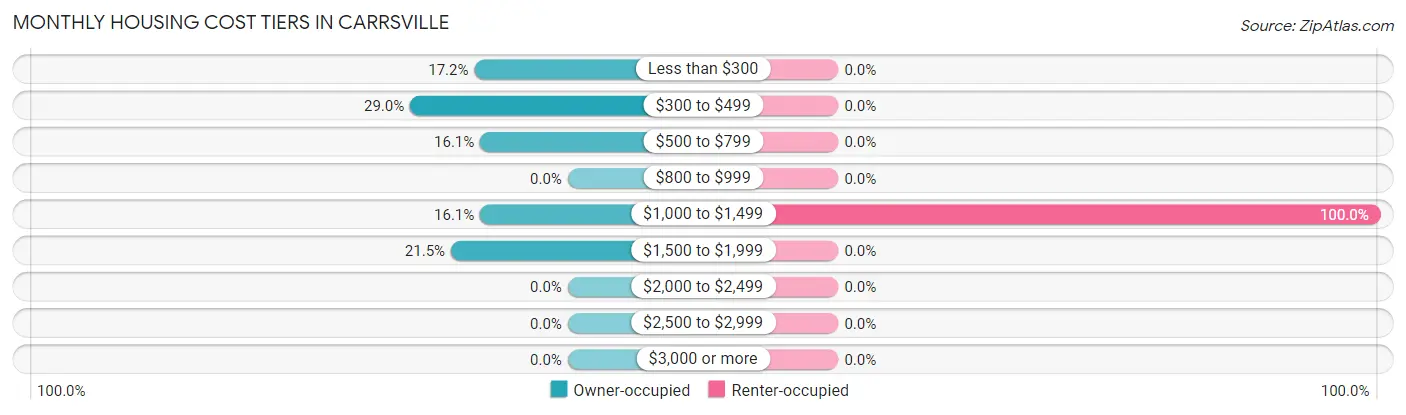
| Monthly Cost | Owner-occupied | Renter-occupied |
| Less than $300 | 16 (17.2%) | 0 (0.0%) |
| $300 to $499 | 27 (29.0%) | 0 (0.0%) |
| $500 to $799 | 15 (16.1%) | 0 (0.0%) |
| $800 to $999 | 0 (0.0%) | 0 (0.0%) |
| $1,000 to $1,499 | 15 (16.1%) | 16 (100.0%) |
| $1,500 to $1,999 | 20 (21.5%) | 0 (0.0%) |
| $2,000 to $2,499 | 0 (0.0%) | 0 (0.0%) |
| $2,500 to $2,999 | 0 (0.0%) | 0 (0.0%) |
| $3,000 or more | 0 (0.0%) | 0 (0.0%) |
| Total | 93 (100.0%) | 16 (100.0%) |
Physical Housing Characteristics in Carrsville
Housing Structures in Carrsville
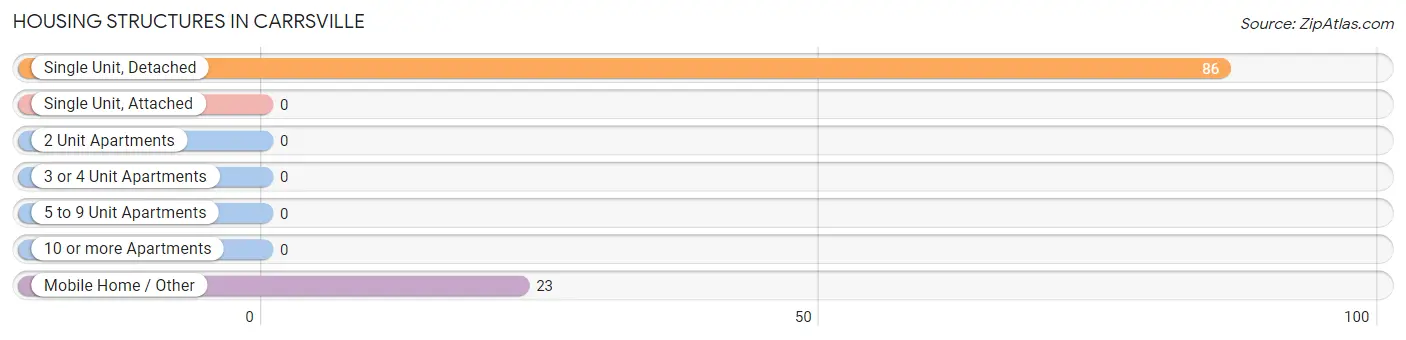
| Structure Type | # Housing Units | % Housing Units |
| Single Unit, Detached | 86 | 78.9% |
| Single Unit, Attached | 0 | 0.0% |
| 2 Unit Apartments | 0 | 0.0% |
| 3 or 4 Unit Apartments | 0 | 0.0% |
| 5 to 9 Unit Apartments | 0 | 0.0% |
| 10 or more Apartments | 0 | 0.0% |
| Mobile Home / Other | 23 | 21.1% |
| Total | 109 | 100.0% |
Housing Structures by Occupancy in Carrsville
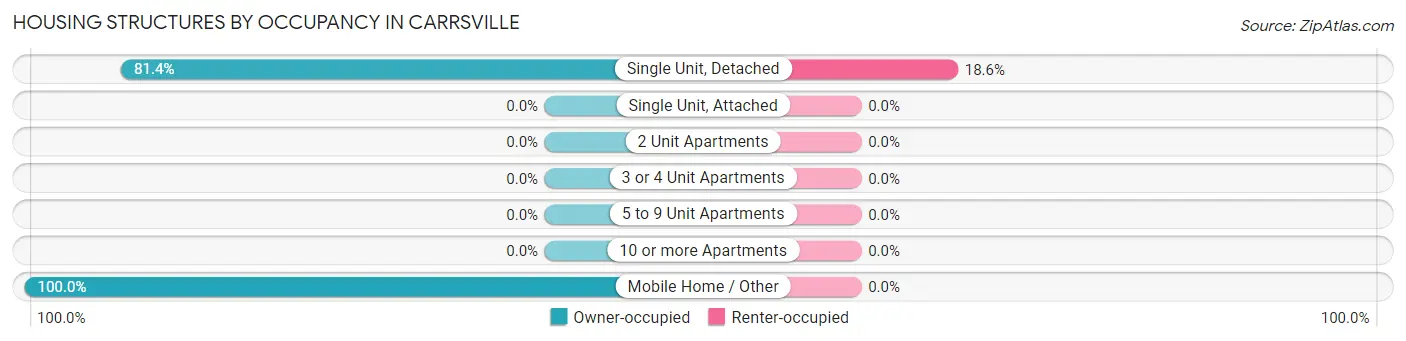
| Structure Type | Owner-occupied | Renter-occupied |
| Single Unit, Detached | 70 (81.4%) | 16 (18.6%) |
| Single Unit, Attached | 0 (0.0%) | 0 (0.0%) |
| 2 Unit Apartments | 0 (0.0%) | 0 (0.0%) |
| 3 or 4 Unit Apartments | 0 (0.0%) | 0 (0.0%) |
| 5 to 9 Unit Apartments | 0 (0.0%) | 0 (0.0%) |
| 10 or more Apartments | 0 (0.0%) | 0 (0.0%) |
| Mobile Home / Other | 23 (100.0%) | 0 (0.0%) |
| Total | 93 (85.3%) | 16 (14.7%) |
Housing Structures by Number of Rooms in Carrsville
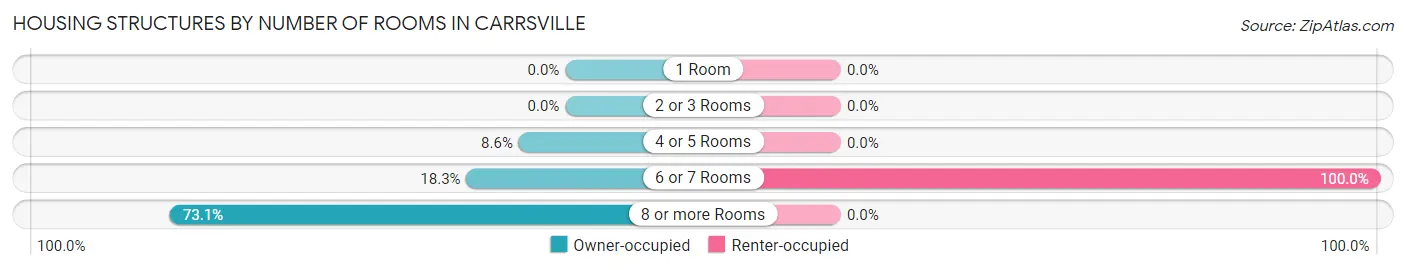
| Number of Rooms | Owner-occupied | Renter-occupied |
| 1 Room | 0 (0.0%) | 0 (0.0%) |
| 2 or 3 Rooms | 0 (0.0%) | 0 (0.0%) |
| 4 or 5 Rooms | 8 (8.6%) | 0 (0.0%) |
| 6 or 7 Rooms | 17 (18.3%) | 16 (100.0%) |
| 8 or more Rooms | 68 (73.1%) | 0 (0.0%) |
| Total | 93 (100.0%) | 16 (100.0%) |
Housing Structure by Heating Type in Carrsville
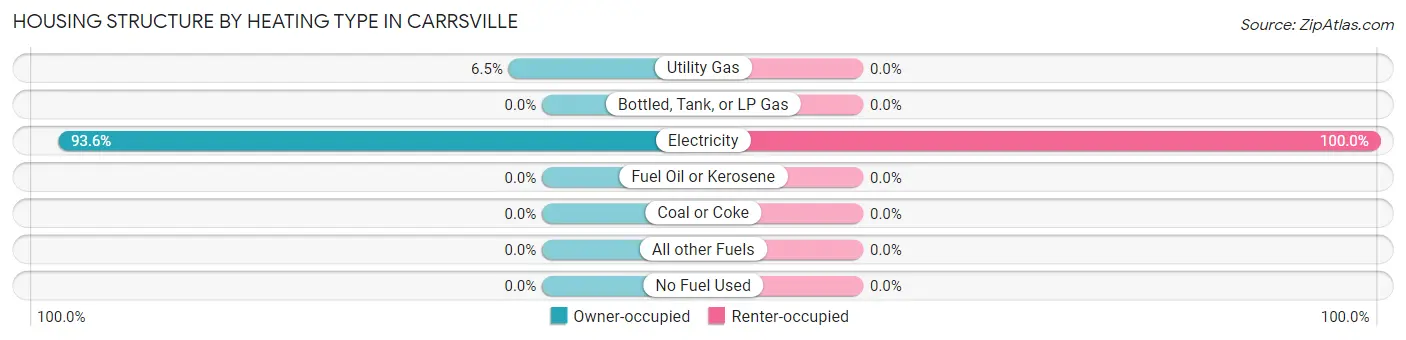
| Heating Type | Owner-occupied | Renter-occupied |
| Utility Gas | 6 (6.5%) | 0 (0.0%) |
| Bottled, Tank, or LP Gas | 0 (0.0%) | 0 (0.0%) |
| Electricity | 87 (93.5%) | 16 (100.0%) |
| Fuel Oil or Kerosene | 0 (0.0%) | 0 (0.0%) |
| Coal or Coke | 0 (0.0%) | 0 (0.0%) |
| All other Fuels | 0 (0.0%) | 0 (0.0%) |
| No Fuel Used | 0 (0.0%) | 0 (0.0%) |
| Total | 93 (100.0%) | 16 (100.0%) |
Household Vehicle Usage in Carrsville
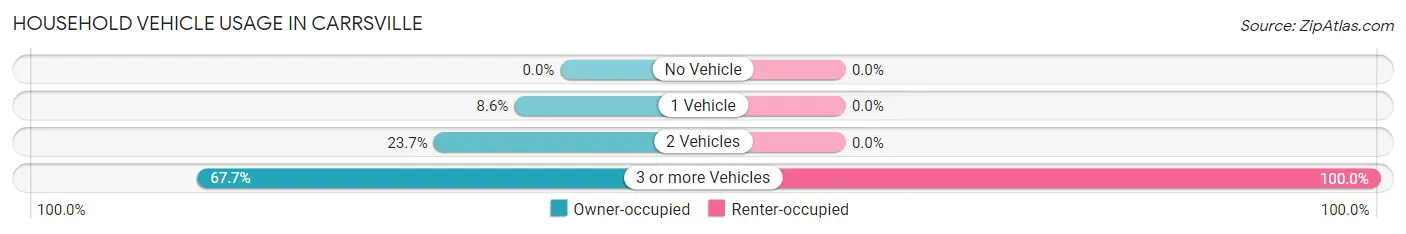
| Vehicles per Household | Owner-occupied | Renter-occupied |
| No Vehicle | 0 (0.0%) | 0 (0.0%) |
| 1 Vehicle | 8 (8.6%) | 0 (0.0%) |
| 2 Vehicles | 22 (23.7%) | 0 (0.0%) |
| 3 or more Vehicles | 63 (67.7%) | 16 (100.0%) |
| Total | 93 (100.0%) | 16 (100.0%) |
Real Estate & Mortgages in Carrsville
Real Estate and Mortgage Overview in Carrsville
| Characteristic | Without Mortgage | With Mortgage |
| Housing Units | 58 | 35 |
| Median Property Value | $225,000 | $256,300 |
| Median Household Income | $130,238 | $20 |
| Monthly Housing Costs | $331 | $0 |
| Real Estate Taxes | $1,440 | $0 |
Property Value by Mortgage Status in Carrsville
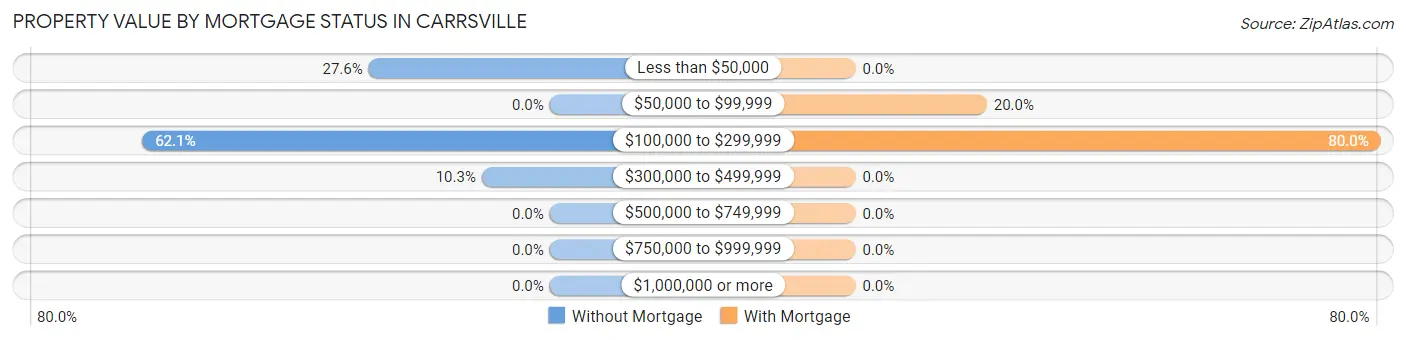
| Property Value | Without Mortgage | With Mortgage |
| Less than $50,000 | 16 (27.6%) | 0 (0.0%) |
| $50,000 to $99,999 | 0 (0.0%) | 7 (20.0%) |
| $100,000 to $299,999 | 36 (62.1%) | 28 (80.0%) |
| $300,000 to $499,999 | 6 (10.3%) | 0 (0.0%) |
| $500,000 to $749,999 | 0 (0.0%) | 0 (0.0%) |
| $750,000 to $999,999 | 0 (0.0%) | 0 (0.0%) |
| $1,000,000 or more | 0 (0.0%) | 0 (0.0%) |
| Total | 58 (100.0%) | 35 (100.0%) |
Household Income by Mortgage Status in Carrsville
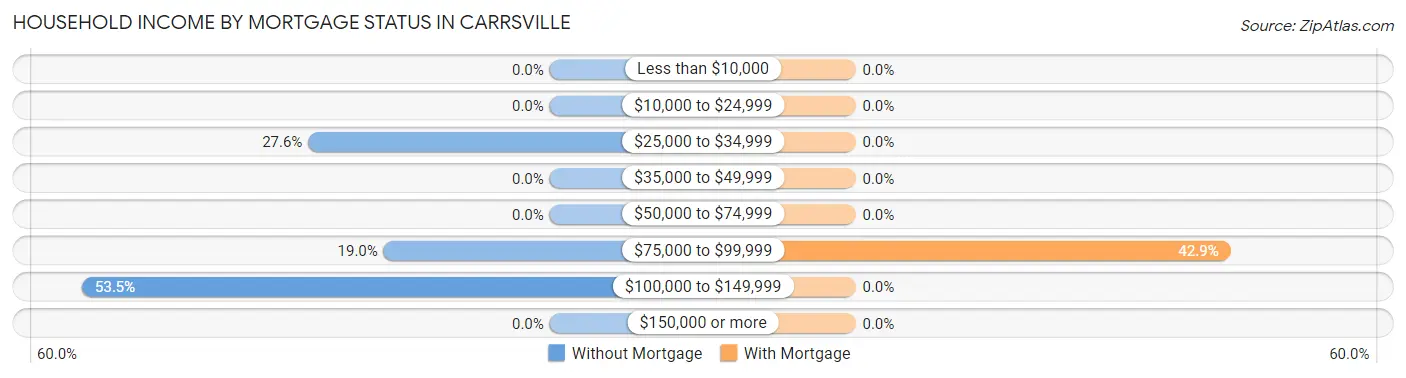
| Household Income | Without Mortgage | With Mortgage |
| Less than $10,000 | 0 (0.0%) | 0 (0.0%) |
| $10,000 to $24,999 | 0 (0.0%) | 0 (0.0%) |
| $25,000 to $34,999 | 16 (27.6%) | 0 (0.0%) |
| $35,000 to $49,999 | 0 (0.0%) | 0 (0.0%) |
| $50,000 to $74,999 | 0 (0.0%) | 0 (0.0%) |
| $75,000 to $99,999 | 11 (19.0%) | 15 (42.9%) |
| $100,000 to $149,999 | 31 (53.4%) | 0 (0.0%) |
| $150,000 or more | 0 (0.0%) | 0 (0.0%) |
| Total | 58 (100.0%) | 35 (100.0%) |
Property Value to Household Income Ratio in Carrsville
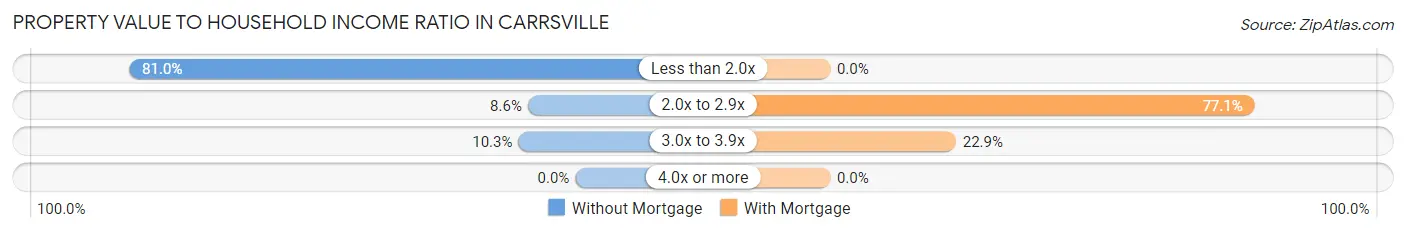
| Value-to-Income Ratio | Without Mortgage | With Mortgage |
| Less than 2.0x | 47 (81.0%) | 0 (0.0%) |
| 2.0x to 2.9x | 5 (8.6%) | 27 (77.1%) |
| 3.0x to 3.9x | 6 (10.3%) | 8 (22.9%) |
| 4.0x or more | 0 (0.0%) | 0 (0.0%) |
| Total | 58 (100.0%) | 35 (100.0%) |
Real Estate Taxes by Mortgage Status in Carrsville
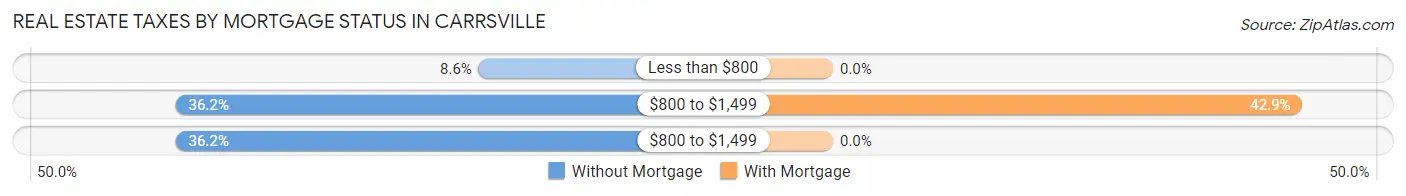
| Property Taxes | Without Mortgage | With Mortgage |
| Less than $800 | 5 (8.6%) | 0 (0.0%) |
| $800 to $1,499 | 21 (36.2%) | 15 (42.9%) |
| $800 to $1,499 | 21 (36.2%) | 0 (0.0%) |
| Total | 58 (100.0%) | 35 (100.0%) |
Health & Disability in Carrsville
Health Insurance Coverage by Age in Carrsville
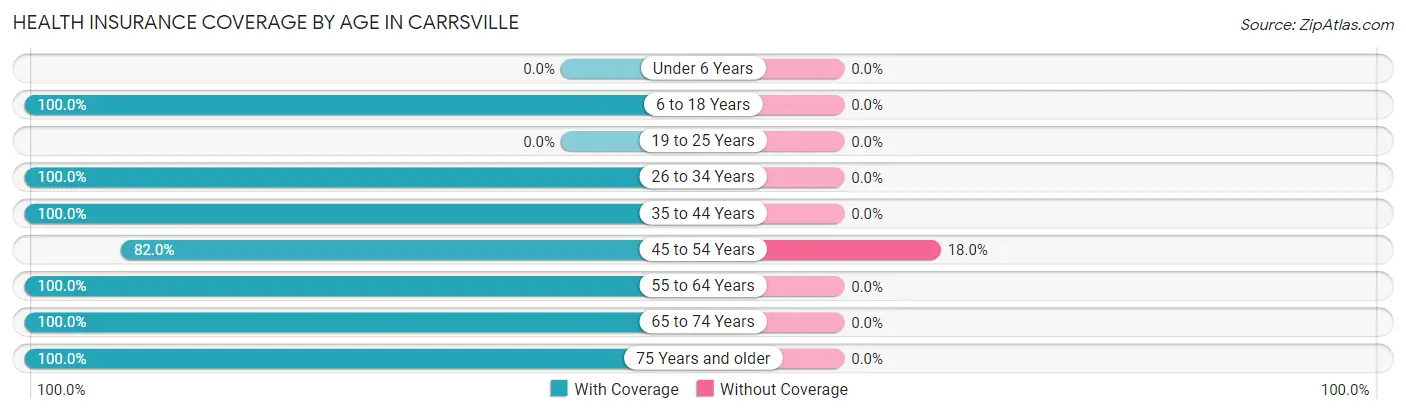
| Age Bracket | With Coverage | Without Coverage |
| Under 6 Years | 0 (0.0%) | 0 (0.0%) |
| 6 to 18 Years | 41 (100.0%) | 0 (0.0%) |
| 19 to 25 Years | 0 (0.0%) | 0 (0.0%) |
| 26 to 34 Years | 8 (100.0%) | 0 (0.0%) |
| 35 to 44 Years | 50 (100.0%) | 0 (0.0%) |
| 45 to 54 Years | 73 (82.0%) | 16 (18.0%) |
| 55 to 64 Years | 32 (100.0%) | 0 (0.0%) |
| 65 to 74 Years | 27 (100.0%) | 0 (0.0%) |
| 75 Years and older | 6 (100.0%) | 0 (0.0%) |
| Total | 237 (93.7%) | 16 (6.3%) |
Health Insurance Coverage by Citizenship Status in Carrsville
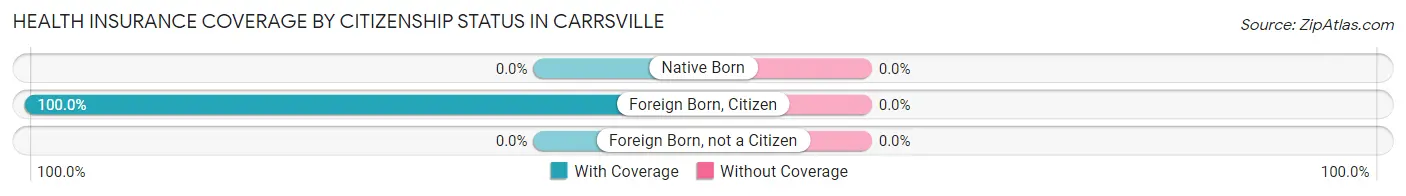
| Citizenship Status | With Coverage | Without Coverage |
| Native Born | 0 (0.0%) | 0 (0.0%) |
| Foreign Born, Citizen | 41 (100.0%) | 0 (0.0%) |
| Foreign Born, not a Citizen | 0 (0.0%) | 0 (0.0%) |
Health Insurance Coverage by Household Income in Carrsville
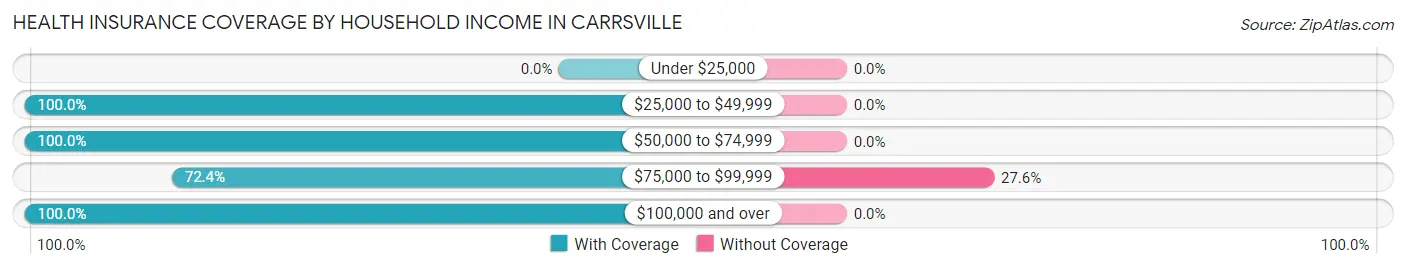
| Household Income | With Coverage | Without Coverage |
| Under $25,000 | 0 (0.0%) | 0 (0.0%) |
| $25,000 to $49,999 | 39 (100.0%) | 0 (0.0%) |
| $50,000 to $74,999 | 30 (100.0%) | 0 (0.0%) |
| $75,000 to $99,999 | 42 (72.4%) | 16 (27.6%) |
| $100,000 and over | 126 (100.0%) | 0 (0.0%) |
Public vs Private Health Insurance Coverage by Age in Carrsville
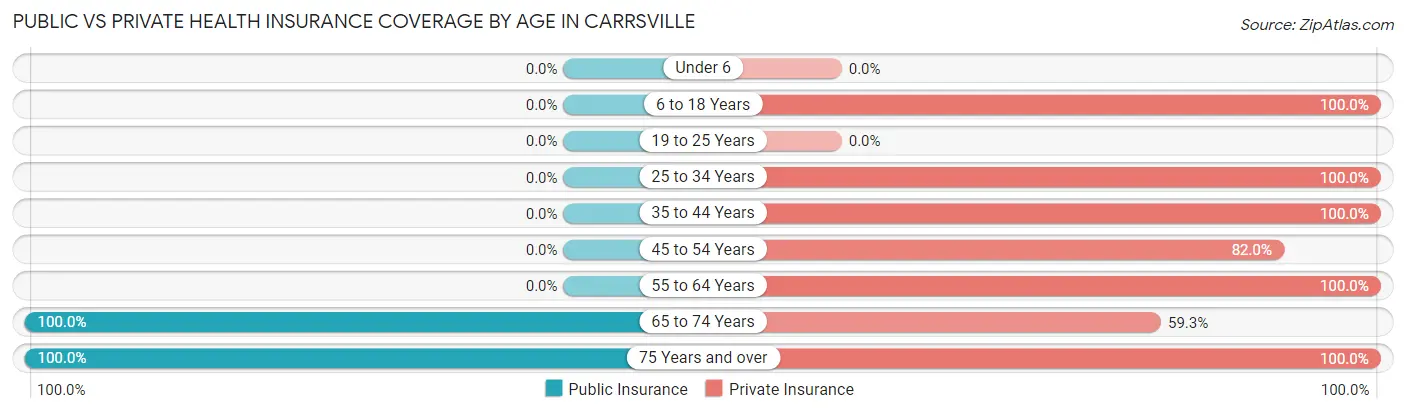
| Age Bracket | Public Insurance | Private Insurance |
| Under 6 | 0 (0.0%) | 0 (0.0%) |
| 6 to 18 Years | 0 (0.0%) | 41 (100.0%) |
| 19 to 25 Years | 0 (0.0%) | 0 (0.0%) |
| 25 to 34 Years | 0 (0.0%) | 8 (100.0%) |
| 35 to 44 Years | 0 (0.0%) | 50 (100.0%) |
| 45 to 54 Years | 0 (0.0%) | 73 (82.0%) |
| 55 to 64 Years | 0 (0.0%) | 32 (100.0%) |
| 65 to 74 Years | 27 (100.0%) | 16 (59.3%) |
| 75 Years and over | 6 (100.0%) | 6 (100.0%) |
| Total | 33 (13.0%) | 226 (89.3%) |
Disability Status by Sex by Age in Carrsville
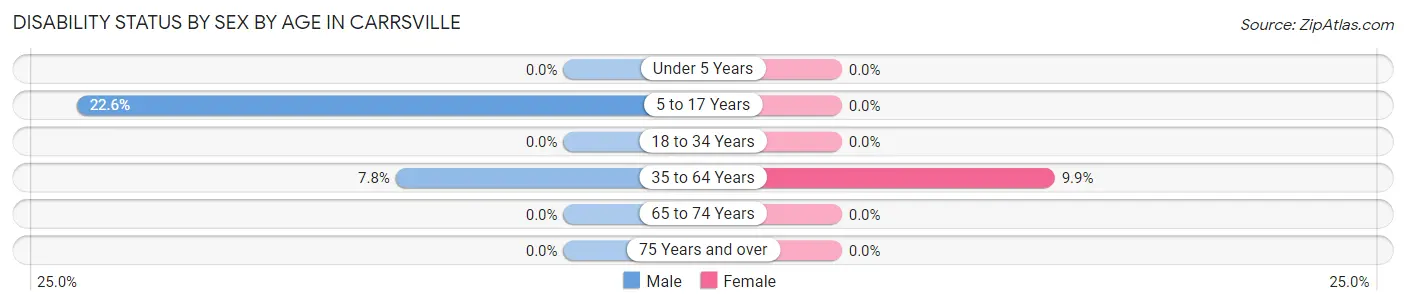
| Age Bracket | Male | Female |
| Under 5 Years | 0 (0.0%) | 0 (0.0%) |
| 5 to 17 Years | 7 (22.6%) | 0 (0.0%) |
| 18 to 34 Years | 0 (0.0%) | 0 (0.0%) |
| 35 to 64 Years | 7 (7.8%) | 8 (9.9%) |
| 65 to 74 Years | 0 (0.0%) | 0 (0.0%) |
| 75 Years and over | 0 (0.0%) | 0 (0.0%) |
Disability Class by Sex by Age in Carrsville
Disability Class: Hearing Difficulty
| Age Bracket | Male | Female |
| Under 5 Years | 0 (0.0%) | 0 (0.0%) |
| 5 to 17 Years | 0 (0.0%) | 0 (0.0%) |
| 18 to 34 Years | 0 (0.0%) | 0 (0.0%) |
| 35 to 64 Years | 0 (0.0%) | 0 (0.0%) |
| 65 to 74 Years | 0 (0.0%) | 0 (0.0%) |
| 75 Years and over | 0 (0.0%) | 0 (0.0%) |
Disability Class: Vision Difficulty
| Age Bracket | Male | Female |
| Under 5 Years | 0 (0.0%) | 0 (0.0%) |
| 5 to 17 Years | 0 (0.0%) | 0 (0.0%) |
| 18 to 34 Years | 0 (0.0%) | 0 (0.0%) |
| 35 to 64 Years | 0 (0.0%) | 0 (0.0%) |
| 65 to 74 Years | 0 (0.0%) | 0 (0.0%) |
| 75 Years and over | 0 (0.0%) | 0 (0.0%) |
Disability Class: Cognitive Difficulty
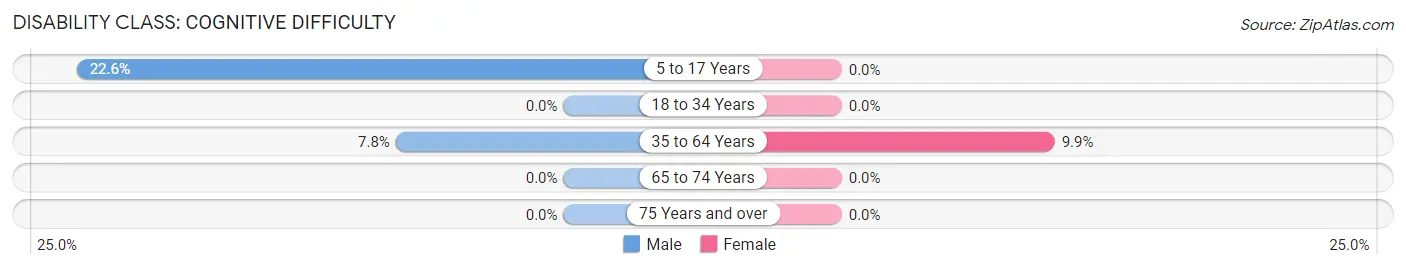
| Age Bracket | Male | Female |
| 5 to 17 Years | 7 (22.6%) | 0 (0.0%) |
| 18 to 34 Years | 0 (0.0%) | 0 (0.0%) |
| 35 to 64 Years | 7 (7.8%) | 8 (9.9%) |
| 65 to 74 Years | 0 (0.0%) | 0 (0.0%) |
| 75 Years and over | 0 (0.0%) | 0 (0.0%) |
Disability Class: Ambulatory Difficulty
| Age Bracket | Male | Female |
| 5 to 17 Years | 0 (0.0%) | 0 (0.0%) |
| 18 to 34 Years | 0 (0.0%) | 0 (0.0%) |
| 35 to 64 Years | 0 (0.0%) | 0 (0.0%) |
| 65 to 74 Years | 0 (0.0%) | 0 (0.0%) |
| 75 Years and over | 0 (0.0%) | 0 (0.0%) |
Disability Class: Self-Care Difficulty
| Age Bracket | Male | Female |
| 5 to 17 Years | 0 (0.0%) | 0 (0.0%) |
| 18 to 34 Years | 0 (0.0%) | 0 (0.0%) |
| 35 to 64 Years | 0 (0.0%) | 0 (0.0%) |
| 65 to 74 Years | 0 (0.0%) | 0 (0.0%) |
| 75 Years and over | 0 (0.0%) | 0 (0.0%) |
Technology Access in Carrsville
Computing Device Access in Carrsville
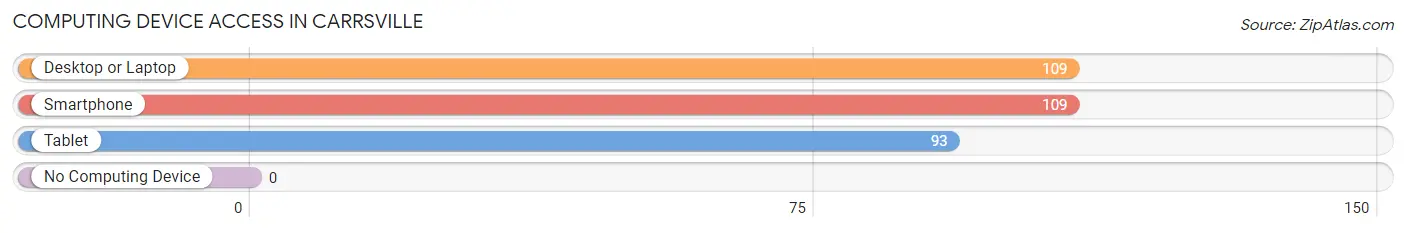
| Device Type | # Households | % Households |
| Desktop or Laptop | 109 | 100.0% |
| Smartphone | 109 | 100.0% |
| Tablet | 93 | 85.3% |
| No Computing Device | 0 | 0.0% |
| Total | 109 | 100.0% |
Internet Access in Carrsville
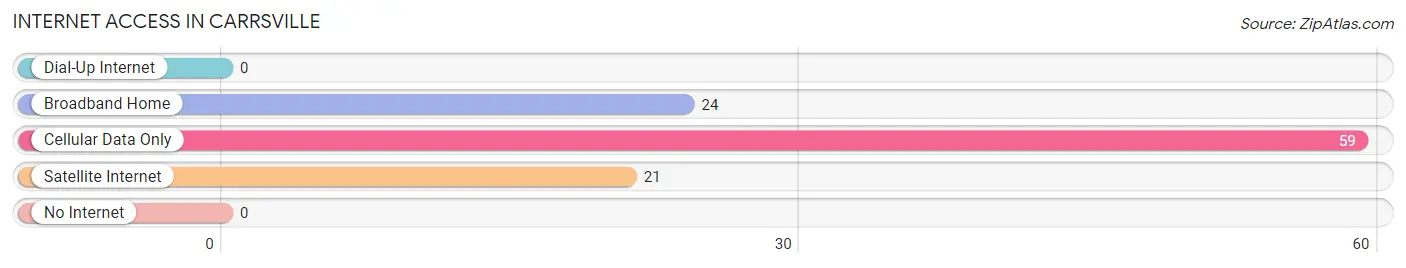
| Internet Type | # Households | % Households |
| Dial-Up Internet | 0 | 0.0% |
| Broadband Home | 24 | 22.0% |
| Cellular Data Only | 59 | 54.1% |
| Satellite Internet | 21 | 19.3% |
| No Internet | 0 | 0.0% |
| Total | 109 | 100.0% |
Carrsville Summary
Carrsville is an unincorporated community located in Isle of Wight County, Virginia. It is situated on the south side of the James River, approximately 10 miles east of Smithfield. The population of Carrsville was estimated to be 1,093 in 2019.
History
Carrsville was first settled in the early 1700s by the Carrs family, who were among the first settlers in Isle of Wight County. The Carrs family owned a large plantation in the area, and the community was named after them. The Carrsville post office was established in 1837.
In the late 1800s, Carrsville was a thriving community with a variety of businesses, including a general store, a blacksmith shop, a sawmill, and a gristmill. The Carrsville Baptist Church was established in 1867, and the Carrsville Methodist Church was established in 1871.
In the early 1900s, Carrsville was a popular destination for tourists, who came to enjoy the area’s natural beauty and recreational activities. The Carrsville Hotel was built in the early 1900s and served as a popular destination for visitors.
Geography
Carrsville is located in Isle of Wight County, Virginia, approximately 10 miles east of Smithfield. The community is situated on the south side of the James River, and is bordered by the towns of Windsor and Zuni. The terrain in the area is mostly flat, with some rolling hills. The climate is humid subtropical, with hot, humid summers and mild winters.
Economy
The economy of Carrsville is largely based on agriculture and tourism. The area is home to several farms, which produce a variety of crops, including corn, soybeans, wheat, and hay. The Carrsville Hotel is a popular destination for tourists, and the area is also home to several restaurants, shops, and other businesses.
Demographics
As of 2019, the population of Carrsville was estimated to be 1,093. The racial makeup of the community is 87.3% White, 8.2% African American, 0.7% Native American, 0.7% Asian, and 2.1% from other races. The median household income in Carrsville is $50,945, and the median home value is $179,400. The unemployment rate in Carrsville is 4.2%.
Conclusion
Carrsville is an unincorporated community located in Isle of Wight County, Virginia. It is situated on the south side of the James River, approximately 10 miles east of Smithfield. The population of Carrsville was estimated to be 1,093 in 2019. The economy of Carrsville is largely based on agriculture and tourism, and the area is home to several farms, restaurants, shops, and other businesses. The racial makeup of the community is 87.3% White, 8.2% African American, 0.7% Native American, 0.7% Asian, and 2.1% from other races. The median household income in Carrsville is $50,945, and the median home value is $179,400.
Common Questions
What is Per Capita Income in Carrsville?
Per Capita income in Carrsville is $47,160.
What is the Median Family Income in Carrsville?
Median Family Income in Carrsville is $131,369.
What is the Median Household income in Carrsville?
Median Household Income in Carrsville is $99,453.
What is Inequality or Gini Index in Carrsville?
Inequality or Gini Index in Carrsville is 0.24.
What is the Total Population of Carrsville?
Total Population of Carrsville is 253.
What is the Total Male Population of Carrsville?
Total Male Population of Carrsville is 156.
What is the Total Female Population of Carrsville?
Total Female Population of Carrsville is 97.
What is the Ratio of Males per 100 Females in Carrsville?
There are 160.82 Males per 100 Females in Carrsville.
What is the Ratio of Females per 100 Males in Carrsville?
There are 62.18 Females per 100 Males in Carrsville.
What is the Median Population Age in Carrsville?
Median Population Age in Carrsville is 47.2 Years.
What is the Average Family Size in Carrsville
Average Family Size in Carrsville is 2.5 People.
What is the Average Household Size in Carrsville
Average Household Size in Carrsville is 2.3 People.
How Large is the Labor Force in Carrsville?
There are 128 People in the Labor Forcein in Carrsville.
What is the Percentage of People in the Labor Force in Carrsville?
59.0% of People are in the Labor Force in Carrsville.