Gretna, VA Map & Demographics
Gretna Map
Gretna Overview
$21,884
PER CAPITA INCOME
$41,800
AVG FAMILY INCOME
$29,667
AVG HOUSEHOLD INCOME
29.0%
WAGE / INCOME GAP [ % ]
71.0¢/ $1
WAGE / INCOME GAP [ $ ]
0.47
INEQUALITY / GINI INDEX
1,227
TOTAL POPULATION
472
MALE POPULATION
755
FEMALE POPULATION
62.52
MALES / 100 FEMALES
159.96
FEMALES / 100 MALES
57.1
MEDIAN AGE
2.8
AVG FAMILY SIZE
1.9
AVG HOUSEHOLD SIZE
413
LABOR FORCE [ PEOPLE ]
38.8%
PERCENT IN LABOR FORCE
5.1%
UNEMPLOYMENT RATE
Gretna Zip Codes
Gretna Area Codes
Income in Gretna
Income Overview in Gretna
Per Capita Income in Gretna is $21,884, while median incomes of families and households are $41,800 and $29,667 respectively.
| Characteristic | Number | Measure |
| Per Capita Income | 1,227 | $21,884 |
| Median Family Income | 272 | $41,800 |
| Mean Family Income | 272 | $61,944 |
| Median Household Income | 612 | $29,667 |
| Mean Household Income | 612 | $41,867 |
| Income Deficit | 272 | $0 |
| Wage / Income Gap (%) | 1,227 | 29.04% |
| Wage / Income Gap ($) | 1,227 | 70.96¢ per $1 |
| Gini / Inequality Index | 1,227 | 0.47 |
Earnings by Sex in Gretna
Average Earnings in Gretna are $34,426, $42,083 for men and $29,861 for women, a difference of 29.0%.
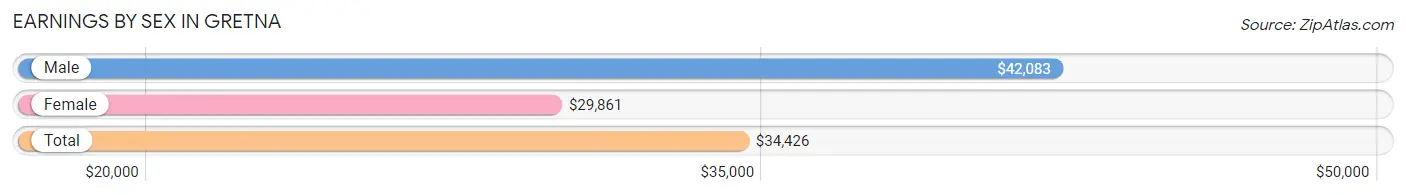
| Sex | Number | Average Earnings |
| Male | 160 (39.3%) | $42,083 |
| Female | 247 (60.7%) | $29,861 |
| Total | 407 (100.0%) | $34,426 |
Earnings by Sex by Income Bracket in Gretna
The most common earnings brackets in Gretna are $40,000 to $44,999 for men (31 | 19.4%) and $35,000 to $39,999 for women (38 | 15.4%).
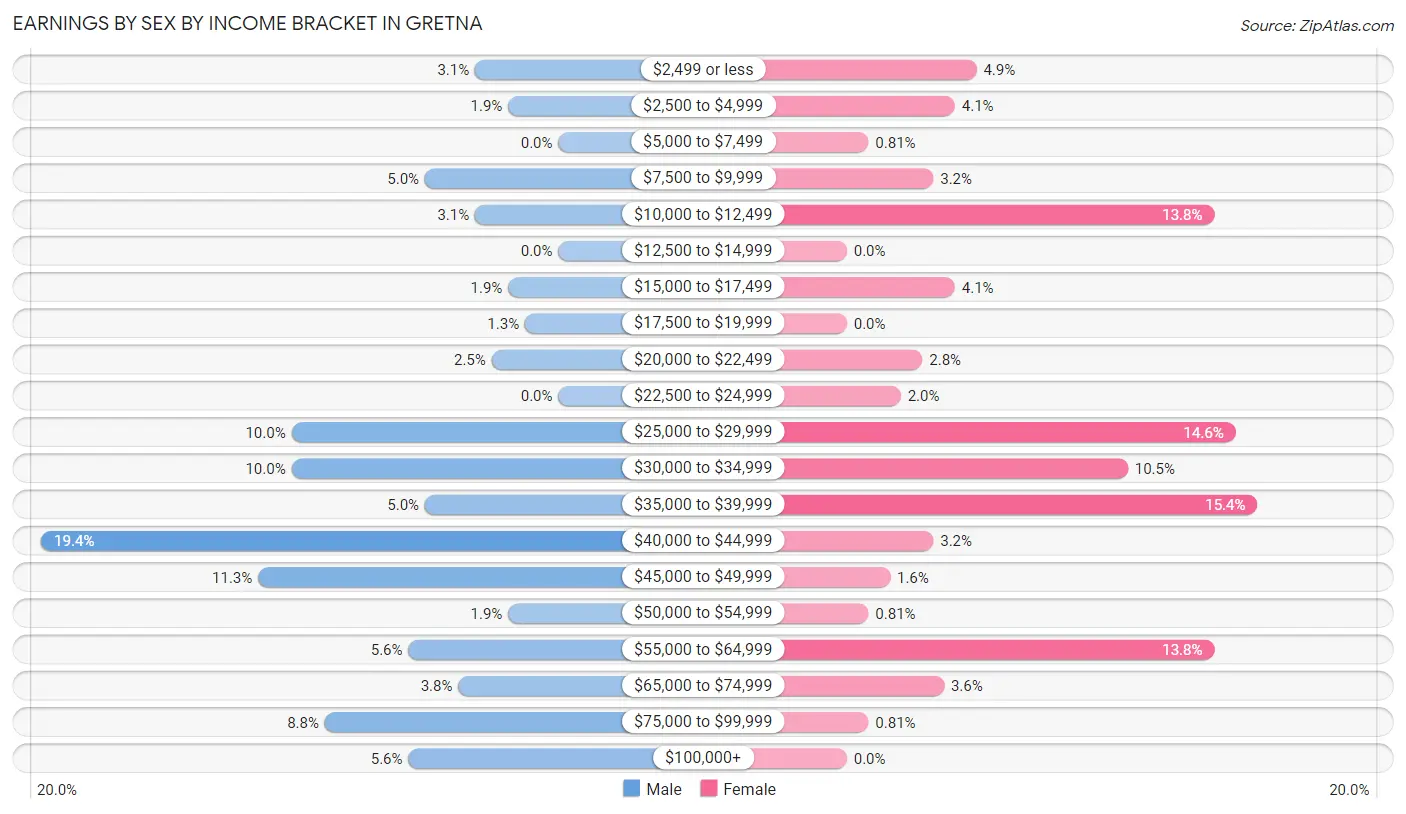
| Income | Male | Female |
| $2,499 or less | 5 (3.1%) | 12 (4.9%) |
| $2,500 to $4,999 | 3 (1.9%) | 10 (4.1%) |
| $5,000 to $7,499 | 0 (0.0%) | 2 (0.8%) |
| $7,500 to $9,999 | 8 (5.0%) | 8 (3.2%) |
| $10,000 to $12,499 | 5 (3.1%) | 34 (13.8%) |
| $12,500 to $14,999 | 0 (0.0%) | 0 (0.0%) |
| $15,000 to $17,499 | 3 (1.9%) | 10 (4.1%) |
| $17,500 to $19,999 | 2 (1.3%) | 0 (0.0%) |
| $20,000 to $22,499 | 4 (2.5%) | 7 (2.8%) |
| $22,500 to $24,999 | 0 (0.0%) | 5 (2.0%) |
| $25,000 to $29,999 | 16 (10.0%) | 36 (14.6%) |
| $30,000 to $34,999 | 16 (10.0%) | 26 (10.5%) |
| $35,000 to $39,999 | 8 (5.0%) | 38 (15.4%) |
| $40,000 to $44,999 | 31 (19.4%) | 8 (3.2%) |
| $45,000 to $49,999 | 18 (11.3%) | 4 (1.6%) |
| $50,000 to $54,999 | 3 (1.9%) | 2 (0.8%) |
| $55,000 to $64,999 | 9 (5.6%) | 34 (13.8%) |
| $65,000 to $74,999 | 6 (3.7%) | 9 (3.6%) |
| $75,000 to $99,999 | 14 (8.7%) | 2 (0.8%) |
| $100,000+ | 9 (5.6%) | 0 (0.0%) |
| Total | 160 (100.0%) | 247 (100.0%) |
Earnings by Sex by Educational Attainment in Gretna
Average earnings in Gretna are $43,618 for men and $32,000 for women, a difference of 26.6%. Men with an educational attainment of bachelor's degree enjoy the highest average annual earnings of $45,547, while those with college or associate's degree education earn the least with $33,438. Women with an educational attainment of bachelor's degree earn the most with the average annual earnings of $63,438, while those with less than high school education have the smallest earnings of $11,188.
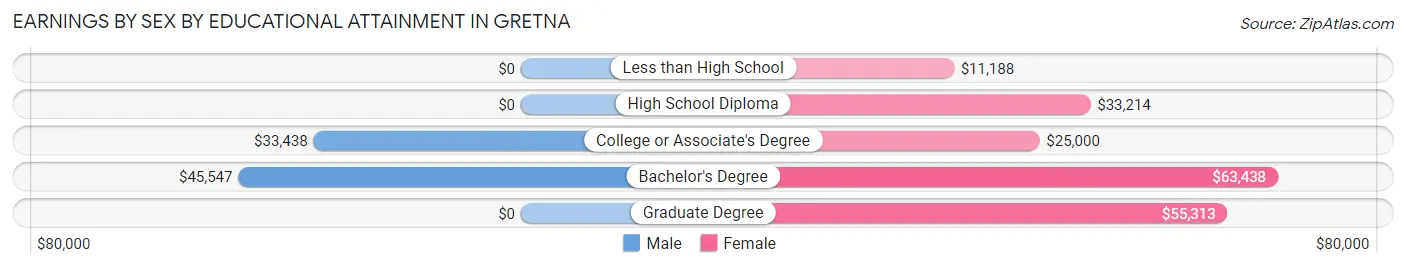
| Educational Attainment | Male Income | Female Income |
| Less than High School | - | - |
| High School Diploma | - | - |
| College or Associate's Degree | $33,438 | $25,000 |
| Bachelor's Degree | $45,547 | $63,438 |
| Graduate Degree | - | - |
| Total | $43,618 | $32,000 |
Family Income in Gretna
Family Income Brackets in Gretna
According to the Gretna family income data, there are 70 families falling into the $25,000 to $34,999 income range, which is the most common income bracket and makes up 25.7% of all families. Conversely, the $200,000+ income bracket is the least frequent group with only 6 families (2.2%) belonging to this category.
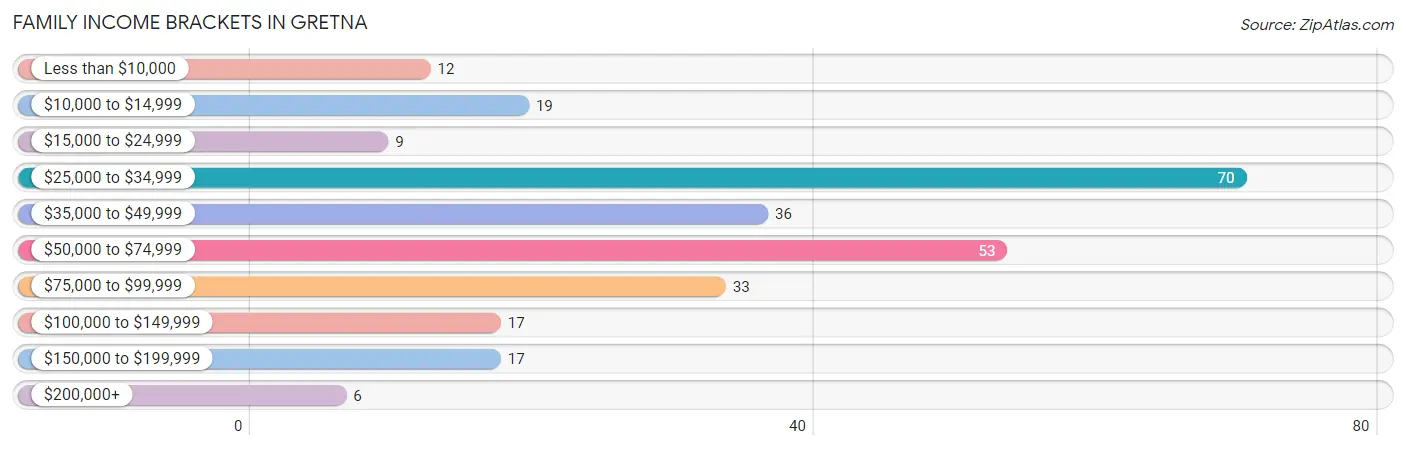
| Income Bracket | # Families | % Families |
| Less than $10,000 | 12 | 4.4% |
| $10,000 to $14,999 | 19 | 7.0% |
| $15,000 to $24,999 | 9 | 3.3% |
| $25,000 to $34,999 | 70 | 25.7% |
| $35,000 to $49,999 | 36 | 13.2% |
| $50,000 to $74,999 | 53 | 19.5% |
| $75,000 to $99,999 | 33 | 12.1% |
| $100,000 to $149,999 | 17 | 6.3% |
| $150,000 to $199,999 | 17 | 6.3% |
| $200,000+ | 6 | 2.2% |
Family Income by Famaliy Size in Gretna
3-person families (36 | 13.2%) account for the highest median family income in Gretna with $61,250 per family, while 2-person families (172 | 63.2%) have the highest median income of $28,125 per family member.
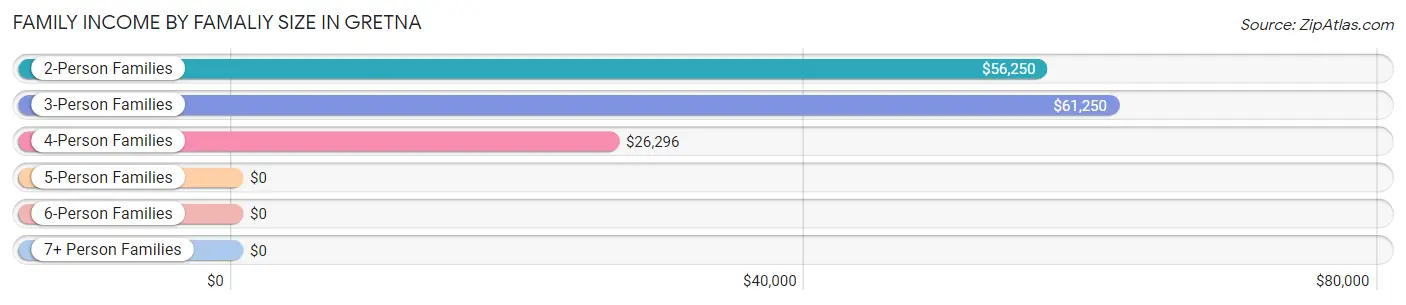
| Income Bracket | # Families | Median Income |
| 2-Person Families | 172 (63.2%) | $56,250 |
| 3-Person Families | 36 (13.2%) | $61,250 |
| 4-Person Families | 58 (21.3%) | $26,296 |
| 5-Person Families | 2 (0.7%) | $0 |
| 6-Person Families | 4 (1.5%) | $0 |
| 7+ Person Families | 0 (0.0%) | $0 |
| Total | 272 (100.0%) | $41,800 |
Family Income by Number of Earners in Gretna
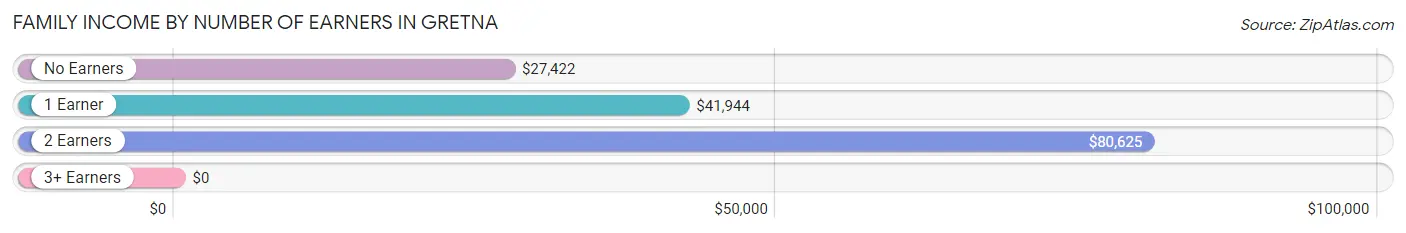
| Number of Earners | # Families | Median Income |
| No Earners | 87 (32.0%) | $27,422 |
| 1 Earner | 116 (42.6%) | $41,944 |
| 2 Earners | 64 (23.5%) | $80,625 |
| 3+ Earners | 5 (1.8%) | $0 |
| Total | 272 (100.0%) | $41,800 |
Household Income in Gretna
Household Income Brackets in Gretna
With 127 households falling in the category, the $25,000 to $34,999 income range is the most frequent in Gretna, accounting for 20.7% of all households. In contrast, only 6 households (1.0%) fall into the $200,000+ income bracket, making it the least populous group.
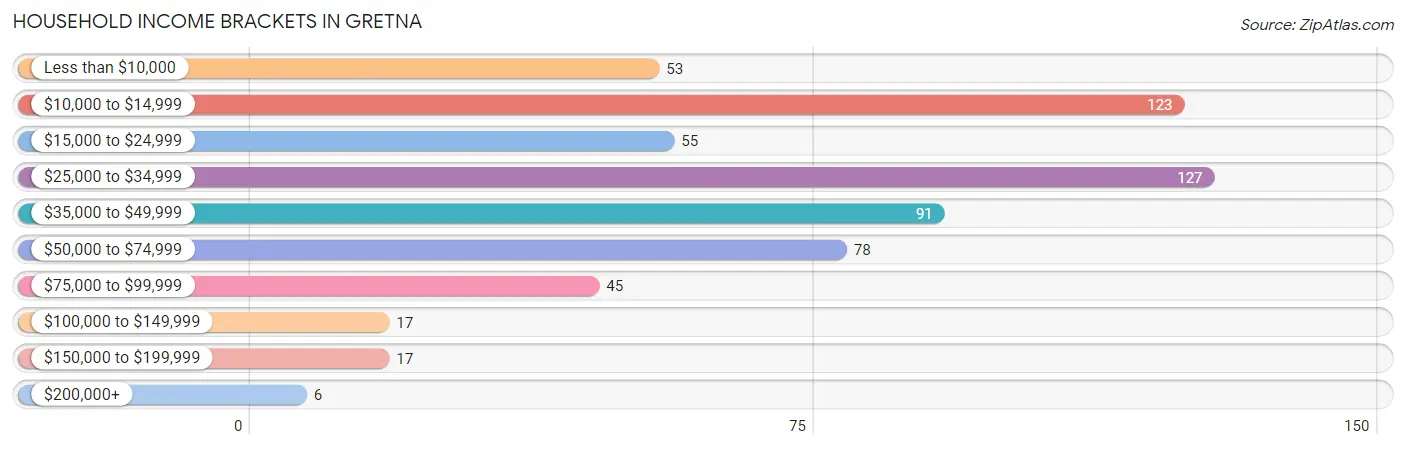
| Income Bracket | # Households | % Households |
| Less than $10,000 | 53 | 8.7% |
| $10,000 to $14,999 | 123 | 20.1% |
| $15,000 to $24,999 | 55 | 9.0% |
| $25,000 to $34,999 | 127 | 20.8% |
| $35,000 to $49,999 | 91 | 14.9% |
| $50,000 to $74,999 | 78 | 12.7% |
| $75,000 to $99,999 | 45 | 7.4% |
| $100,000 to $149,999 | 17 | 2.8% |
| $150,000 to $199,999 | 17 | 2.8% |
| $200,000+ | 6 | 1.0% |
Household Income by Householder Age in Gretna
The median household income in Gretna is $29,667, with the highest median household income of $40,294 found in the 25 to 44 years age bracket for the primary householder. A total of 136 households (22.2%) fall into this category. Meanwhile, the 65+ years age bracket for the primary householder has the lowest median household income of $25,804, with 274 households (44.8%) in this group.
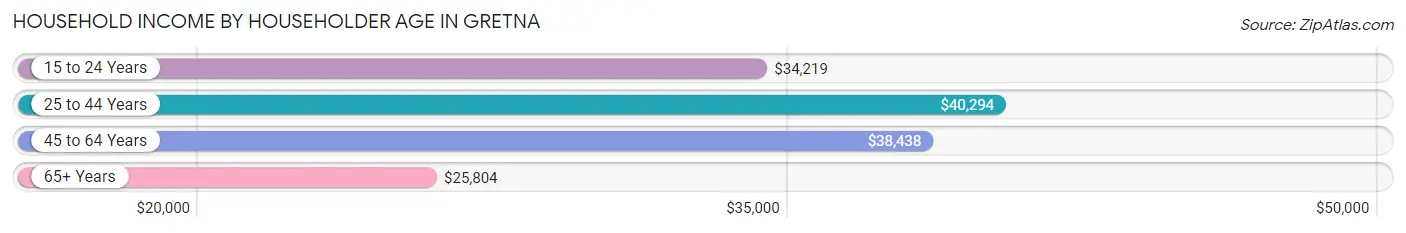
| Income Bracket | # Households | Median Income |
| 15 to 24 Years | 17 (2.8%) | $34,219 |
| 25 to 44 Years | 136 (22.2%) | $40,294 |
| 45 to 64 Years | 185 (30.2%) | $38,438 |
| 65+ Years | 274 (44.8%) | $25,804 |
| Total | 612 (100.0%) | $29,667 |
Poverty in Gretna
Income Below Poverty by Sex and Age in Gretna
With 15.1% poverty level for males and 43.6% for females among the residents of Gretna, 16 and 17 year old males and 5 year old females are the most vulnerable to poverty, with 19 males (70.4%) and 9 females (100.0%) in their respective age groups living below the poverty level.
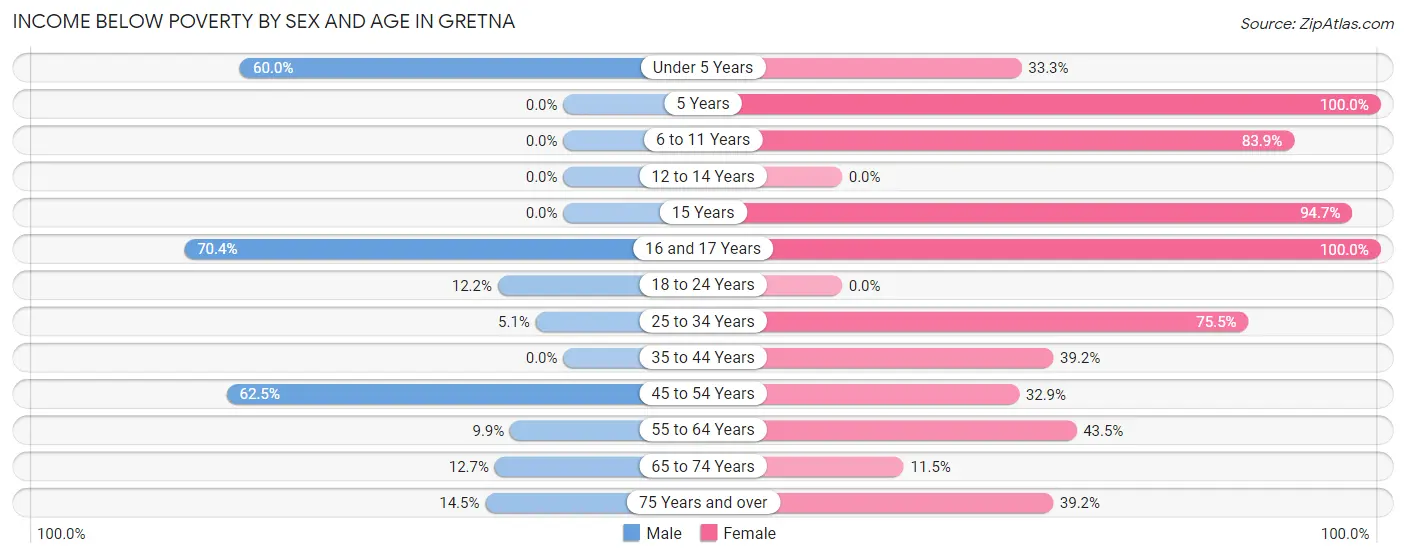
| Age Bracket | Male | Female |
| Under 5 Years | 3 (60.0%) | 11 (33.3%) |
| 5 Years | 0 (0.0%) | 9 (100.0%) |
| 6 to 11 Years | 0 (0.0%) | 47 (83.9%) |
| 12 to 14 Years | 0 (0.0%) | 0 (0.0%) |
| 15 Years | 0 (0.0%) | 18 (94.7%) |
| 16 and 17 Years | 19 (70.4%) | 2 (100.0%) |
| 18 to 24 Years | 9 (12.2%) | 0 (0.0%) |
| 25 to 34 Years | 2 (5.1%) | 40 (75.5%) |
| 35 to 44 Years | 0 (0.0%) | 20 (39.2%) |
| 45 to 54 Years | 10 (62.5%) | 23 (32.9%) |
| 55 to 64 Years | 8 (9.9%) | 57 (43.5%) |
| 65 to 74 Years | 7 (12.7%) | 7 (11.5%) |
| 75 Years and over | 10 (14.5%) | 67 (39.2%) |
| Total | 68 (15.1%) | 301 (43.6%) |
Income Above Poverty by Sex and Age in Gretna
According to the poverty statistics in Gretna, males aged 6 to 11 years and females aged 18 to 24 years are the age groups that are most secure financially, with 100.0% of males and 100.0% of females in these age groups living above the poverty line.
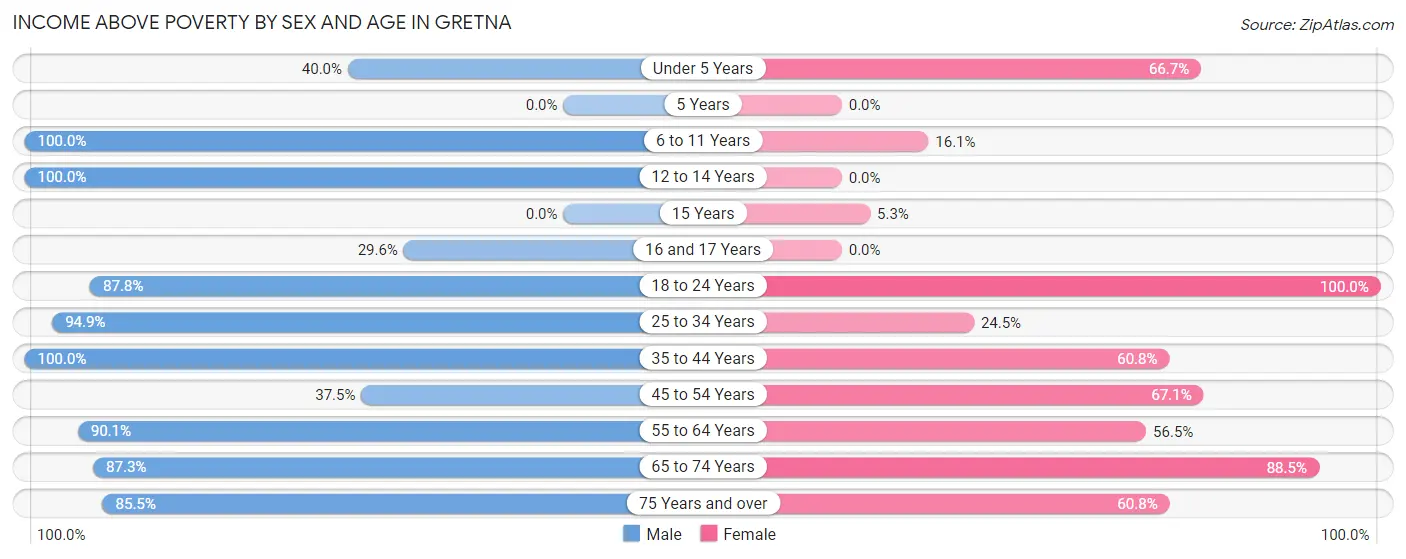
| Age Bracket | Male | Female |
| Under 5 Years | 2 (40.0%) | 22 (66.7%) |
| 5 Years | 0 (0.0%) | 0 (0.0%) |
| 6 to 11 Years | 28 (100.0%) | 9 (16.1%) |
| 12 to 14 Years | 12 (100.0%) | 0 (0.0%) |
| 15 Years | 0 (0.0%) | 1 (5.3%) |
| 16 and 17 Years | 8 (29.6%) | 0 (0.0%) |
| 18 to 24 Years | 65 (87.8%) | 34 (100.0%) |
| 25 to 34 Years | 37 (94.9%) | 13 (24.5%) |
| 35 to 44 Years | 44 (100.0%) | 31 (60.8%) |
| 45 to 54 Years | 6 (37.5%) | 47 (67.1%) |
| 55 to 64 Years | 73 (90.1%) | 74 (56.5%) |
| 65 to 74 Years | 48 (87.3%) | 54 (88.5%) |
| 75 Years and over | 59 (85.5%) | 104 (60.8%) |
| Total | 382 (84.9%) | 389 (56.4%) |
Income Below Poverty Among Married-Couple Families in Gretna
The poverty statistics for married-couple families in Gretna show that 18.0% or 27 of the total 150 families live below the poverty line. Families with 1 or 2 children have the highest poverty rate of 75.0%, comprising of 27 families. On the other hand, families with no children have the lowest poverty rate of 0.0%, which includes 0 families.
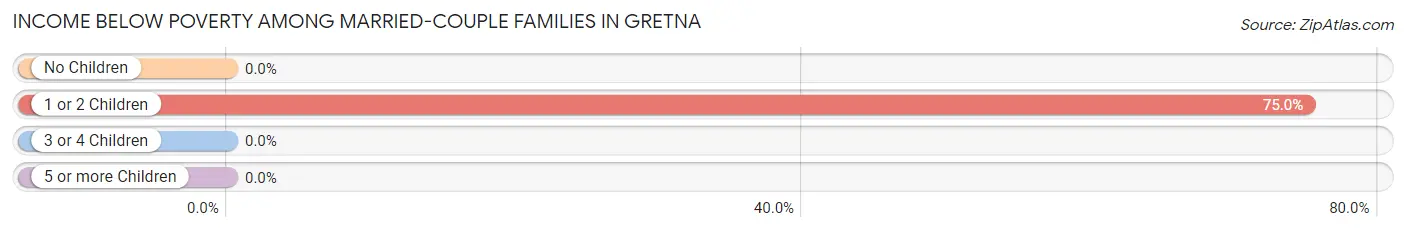
| Children | Above Poverty | Below Poverty |
| No Children | 110 (100.0%) | 0 (0.0%) |
| 1 or 2 Children | 9 (25.0%) | 27 (75.0%) |
| 3 or 4 Children | 4 (100.0%) | 0 (0.0%) |
| 5 or more Children | 0 (0.0%) | 0 (0.0%) |
| Total | 123 (82.0%) | 27 (18.0%) |
Income Below Poverty Among Single-Parent Households in Gretna
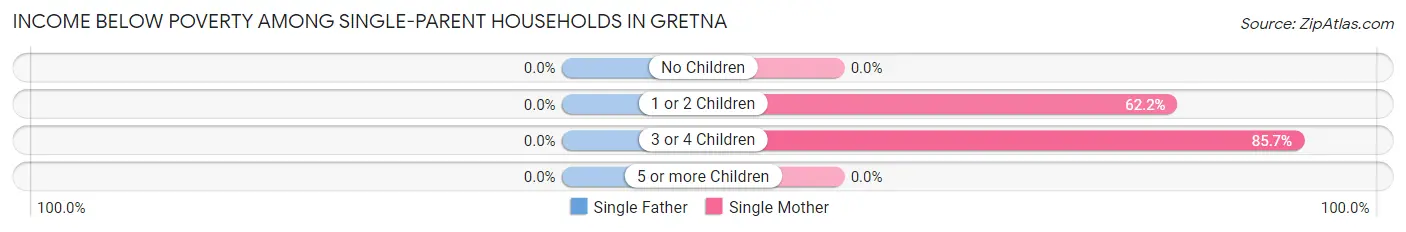
| Children | Single Father | Single Mother |
| No Children | 0 (0.0%) | 0 (0.0%) |
| 1 or 2 Children | 0 (0.0%) | 23 (62.2%) |
| 3 or 4 Children | 0 (0.0%) | 12 (85.7%) |
| 5 or more Children | 0 (0.0%) | 0 (0.0%) |
| Total | 0 (0.0%) | 35 (34.0%) |
Income Below Poverty Among Married-Couple vs Single-Parent Households in Gretna
The poverty data for Gretna shows that 27 of the married-couple family households (18.0%) and 35 of the single-parent households (28.7%) are living below the poverty level. Within the married-couple family households, those with 1 or 2 children have the highest poverty rate, with 27 households (75.0%) falling below the poverty line. Among the single-parent households, those with 3 or 4 children have the highest poverty rate, with 12 household (85.7%) living below poverty.
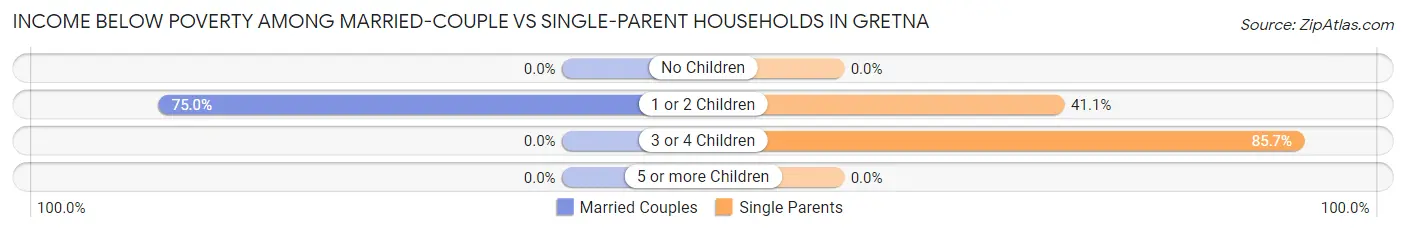
| Children | Married-Couple Families | Single-Parent Households |
| No Children | 0 (0.0%) | 0 (0.0%) |
| 1 or 2 Children | 27 (75.0%) | 23 (41.1%) |
| 3 or 4 Children | 0 (0.0%) | 12 (85.7%) |
| 5 or more Children | 0 (0.0%) | 0 (0.0%) |
| Total | 27 (18.0%) | 35 (28.7%) |
Race in Gretna
The most populous races in Gretna are White / Caucasian (802 | 65.4%), Black / African American (392 | 32.0%), and Two or more Races (33 | 2.7%).
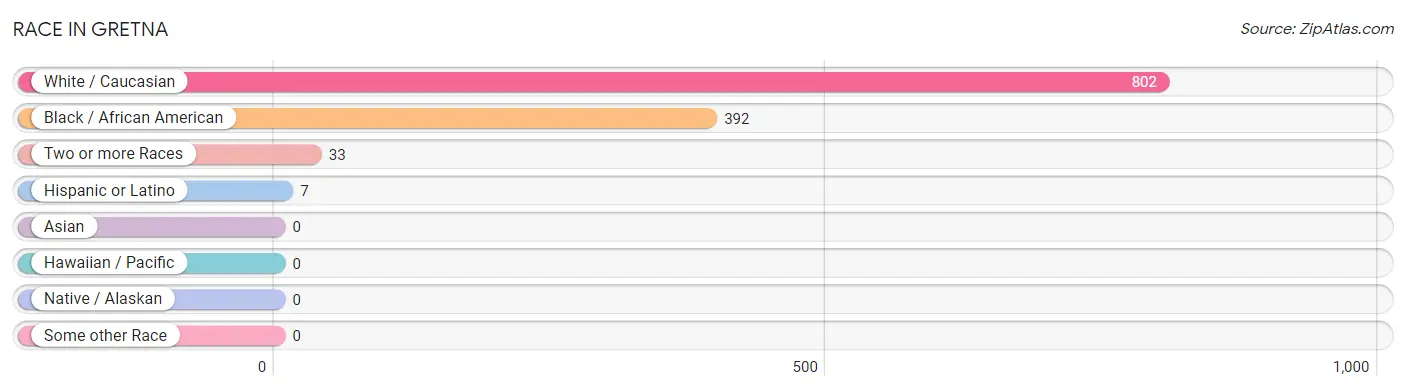
| Race | # Population | % Population |
| Asian | 0 | 0.0% |
| Black / African American | 392 | 32.0% |
| Hawaiian / Pacific | 0 | 0.0% |
| Hispanic or Latino | 7 | 0.6% |
| Native / Alaskan | 0 | 0.0% |
| White / Caucasian | 802 | 65.4% |
| Two or more Races | 33 | 2.7% |
| Some other Race | 0 | 0.0% |
| Total | 1,227 | 100.0% |
Ancestry in Gretna
The most populous ancestries reported in Gretna are American (297 | 24.2%), English (114 | 9.3%), German (75 | 6.1%), Irish (55 | 4.5%), and African (39 | 3.2%), together accounting for 47.3% of all Gretna residents.
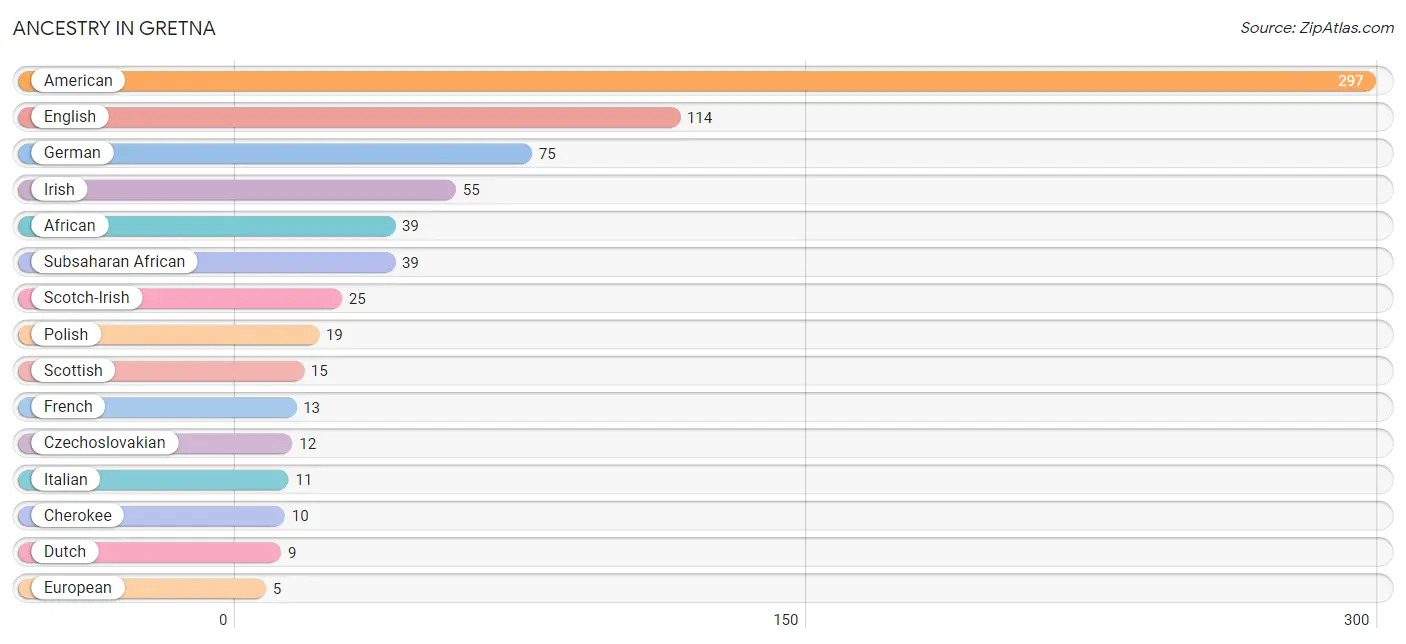
| Ancestry | # Population | % Population |
| African | 39 | 3.2% |
| American | 297 | 24.2% |
| Cherokee | 10 | 0.8% |
| Czech | 2 | 0.2% |
| Czechoslovakian | 12 | 1.0% |
| Dutch | 9 | 0.7% |
| English | 114 | 9.3% |
| European | 5 | 0.4% |
| French | 13 | 1.1% |
| German | 75 | 6.1% |
| Hungarian | 2 | 0.2% |
| Irish | 55 | 4.5% |
| Italian | 11 | 0.9% |
| Polish | 19 | 1.5% |
| Scotch-Irish | 25 | 2.0% |
| Scottish | 15 | 1.2% |
| Subsaharan African | 39 | 3.2% | View All 17 Rows |
Immigrants in Gretna
The most numerous immigrant groups reported in Gretna came from Europe (8 | 0.6%), Italy (8 | 0.6%), and Southern Europe (8 | 0.6%), together accounting for 1.9% of all Gretna residents.
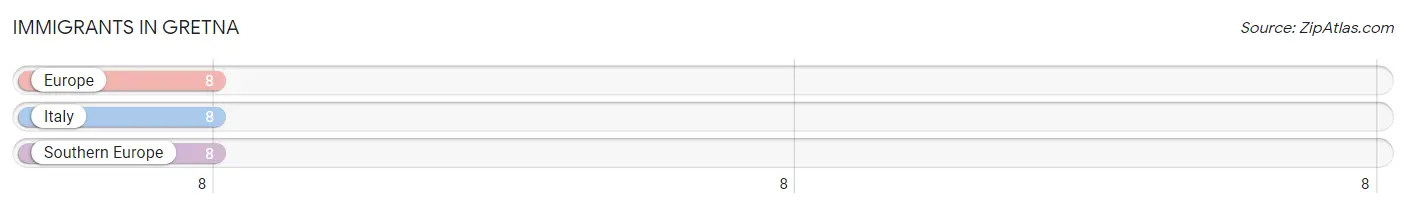
| Immigration Origin | # Population | % Population |
| Europe | 8 | 0.6% |
| Italy | 8 | 0.6% |
| Southern Europe | 8 | 0.6% | View All 3 Rows |
Sex and Age in Gretna
Sex and Age in Gretna
The most populous age groups in Gretna are 15 to 19 Years (76 | 16.1%) for men and 85 Years and over (117 | 15.5%) for women.
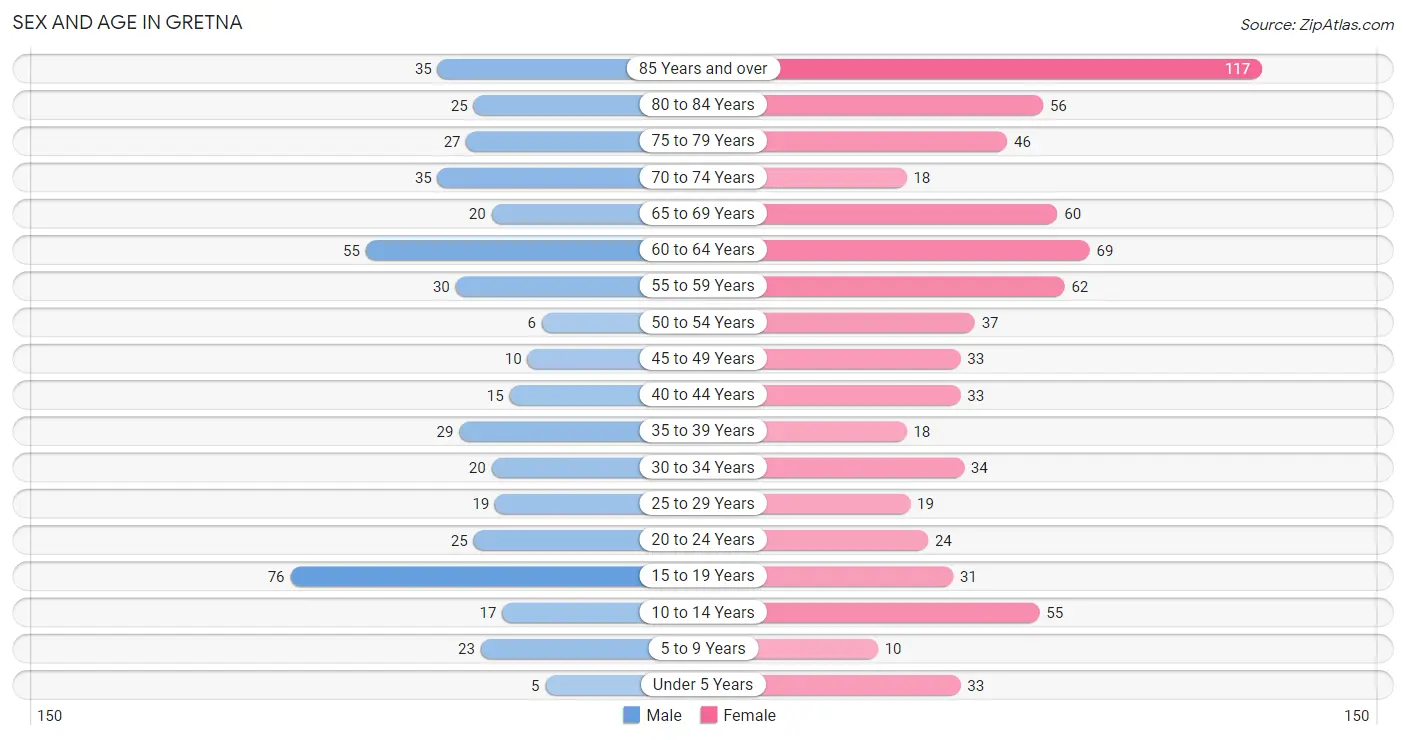
| Age Bracket | Male | Female |
| Under 5 Years | 5 (1.1%) | 33 (4.4%) |
| 5 to 9 Years | 23 (4.9%) | 10 (1.3%) |
| 10 to 14 Years | 17 (3.6%) | 55 (7.3%) |
| 15 to 19 Years | 76 (16.1%) | 31 (4.1%) |
| 20 to 24 Years | 25 (5.3%) | 24 (3.2%) |
| 25 to 29 Years | 19 (4.0%) | 19 (2.5%) |
| 30 to 34 Years | 20 (4.2%) | 34 (4.5%) |
| 35 to 39 Years | 29 (6.1%) | 18 (2.4%) |
| 40 to 44 Years | 15 (3.2%) | 33 (4.4%) |
| 45 to 49 Years | 10 (2.1%) | 33 (4.4%) |
| 50 to 54 Years | 6 (1.3%) | 37 (4.9%) |
| 55 to 59 Years | 30 (6.4%) | 62 (8.2%) |
| 60 to 64 Years | 55 (11.7%) | 69 (9.1%) |
| 65 to 69 Years | 20 (4.2%) | 60 (8.0%) |
| 70 to 74 Years | 35 (7.4%) | 18 (2.4%) |
| 75 to 79 Years | 27 (5.7%) | 46 (6.1%) |
| 80 to 84 Years | 25 (5.3%) | 56 (7.4%) |
| 85 Years and over | 35 (7.4%) | 117 (15.5%) |
| Total | 472 (100.0%) | 755 (100.0%) |
Families and Households in Gretna
Median Family Size in Gretna
The median family size in Gretna is 2.79 persons per family, with single female/mother families (103 | 37.9%) accounting for the largest median family size of 3.26 persons per family. On the other hand, married-couple families (150 | 55.1%) represent the smallest median family size with 2.44 persons per family.
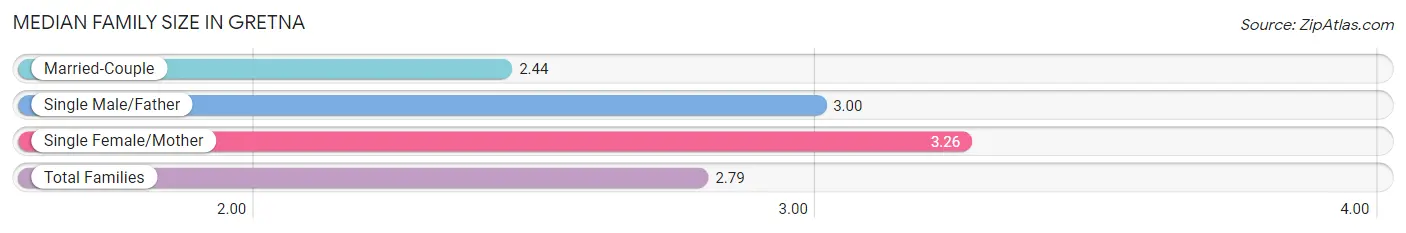
| Family Type | # Families | Family Size |
| Married-Couple | 150 (55.1%) | 2.44 |
| Single Male/Father | 19 (7.0%) | 3.00 |
| Single Female/Mother | 103 (37.9%) | 3.26 |
| Total Families | 272 (100.0%) | 2.79 |
Median Household Size in Gretna
The median household size in Gretna is 1.86 persons per household, with single female/mother households (103 | 16.8%) accounting for the largest median household size of 3.26 persons per household. non-family households (340 | 55.6%) represent the smallest median household size with 1.12 persons per household.
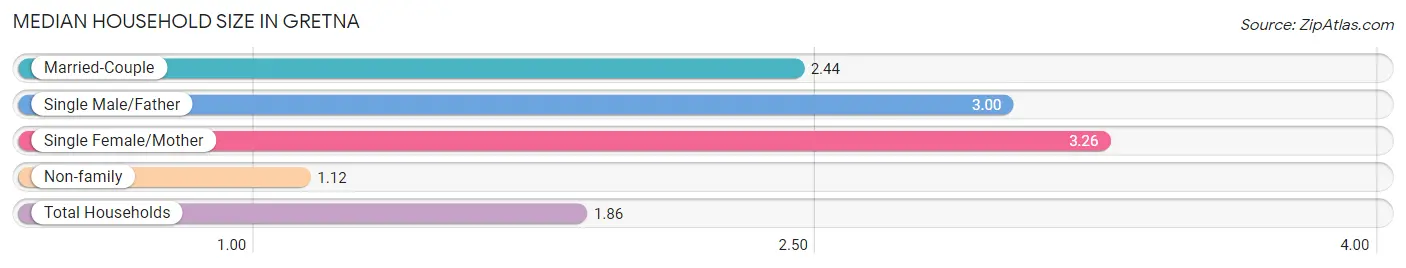
| Household Type | # Households | Household Size |
| Married-Couple | 150 (24.5%) | 2.44 |
| Single Male/Father | 19 (3.1%) | 3.00 |
| Single Female/Mother | 103 (16.8%) | 3.26 |
| Non-family | 340 (55.6%) | 1.12 |
| Total Households | 612 (100.0%) | 1.86 |
Household Size by Marriage Status in Gretna
Out of a total of 612 households in Gretna, 272 (44.4%) are family households, while 340 (55.6%) are nonfamily households. The most numerous type of family households are 2-person households, comprising 172, and the most common type of nonfamily households are 1-person households, comprising 311.
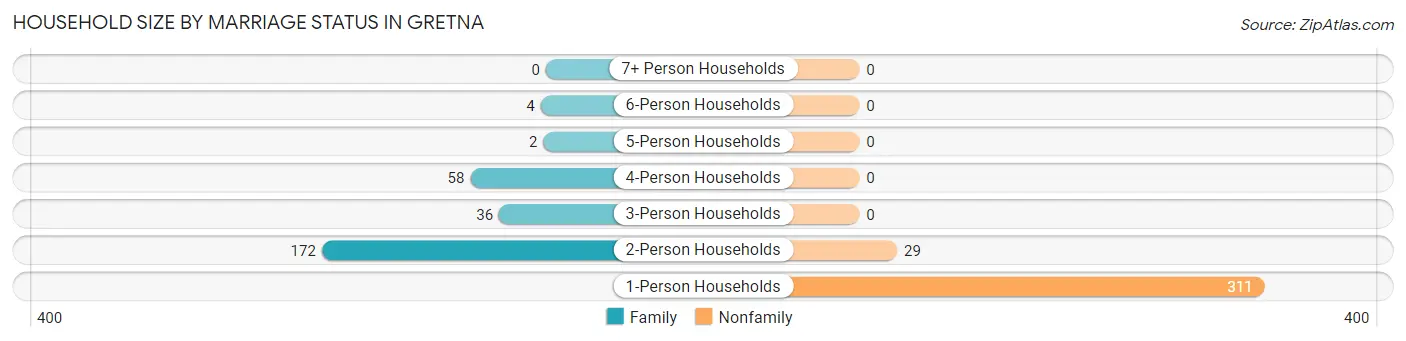
| Household Size | Family Households | Nonfamily Households |
| 1-Person Households | - | 311 (50.8%) |
| 2-Person Households | 172 (28.1%) | 29 (4.7%) |
| 3-Person Households | 36 (5.9%) | 0 (0.0%) |
| 4-Person Households | 58 (9.5%) | 0 (0.0%) |
| 5-Person Households | 2 (0.3%) | 0 (0.0%) |
| 6-Person Households | 4 (0.6%) | 0 (0.0%) |
| 7+ Person Households | 0 (0.0%) | 0 (0.0%) |
| Total | 272 (44.4%) | 340 (55.6%) |
Female Fertility in Gretna
Fertility by Age in Gretna
Average fertility rate in Gretna is 28.0 births per 1,000 women. Women in the age bracket of 20 to 34 years have the highest fertility rate with 78.0 births per 1,000 women. Women in the age bracket of 20 to 34 years acount for 100.0% of all women with births.
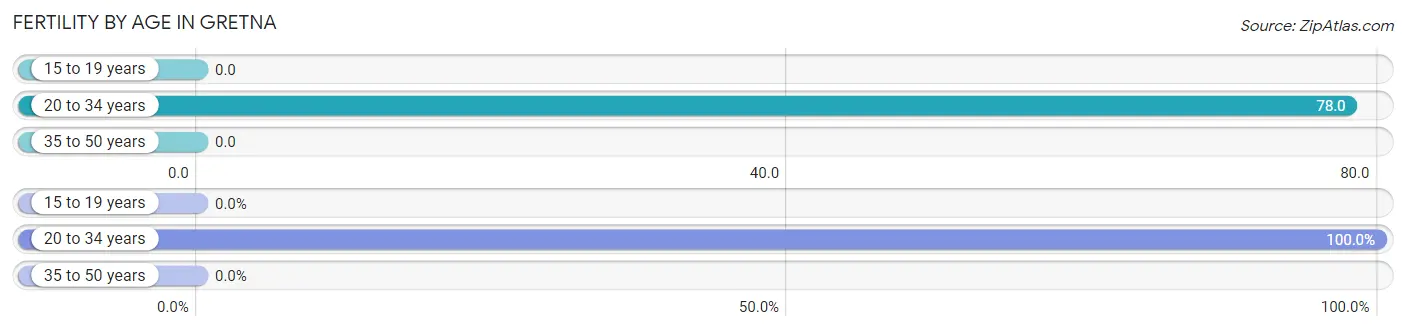
| Age Bracket | Women with Births | Births / 1,000 Women |
| 15 to 19 years | 0 (0.0%) | 0.0 |
| 20 to 34 years | 6 (100.0%) | 78.0 |
| 35 to 50 years | 0 (0.0%) | 0.0 |
| Total | 6 (100.0%) | 28.0 |
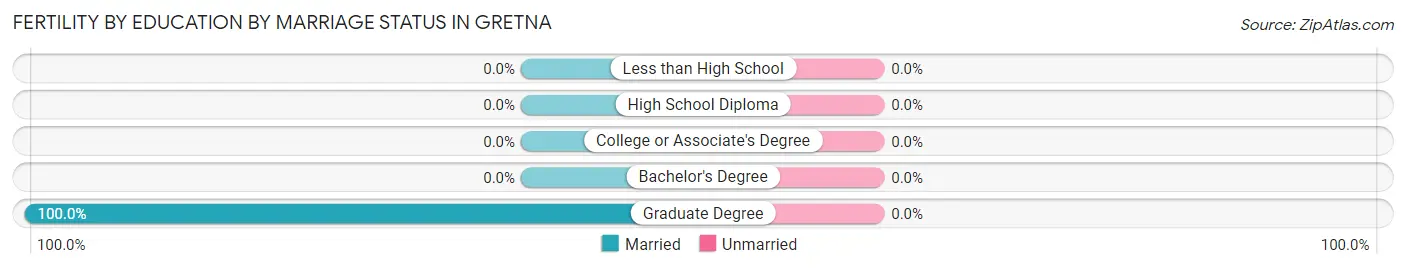
Fertility by Age by Marriage Status in Gretna
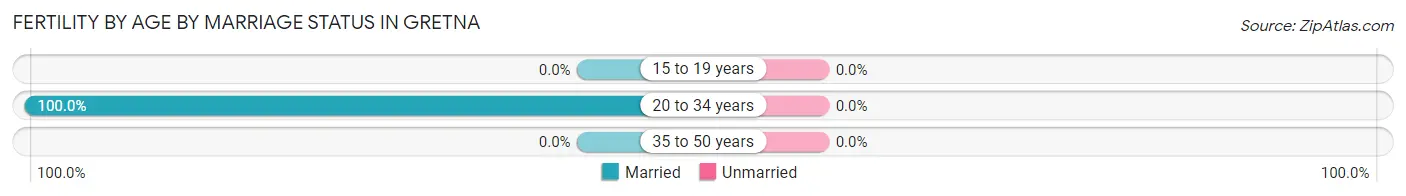
| Age Bracket | Married | Unmarried |
| 15 to 19 years | 0 (0.0%) | 0 (0.0%) |
| 20 to 34 years | 6 (100.0%) | 0 (0.0%) |
| 35 to 50 years | 0 (0.0%) | 0 (0.0%) |
| Total | 6 (100.0%) | 0 (0.0%) |
Fertility by Education in Gretna
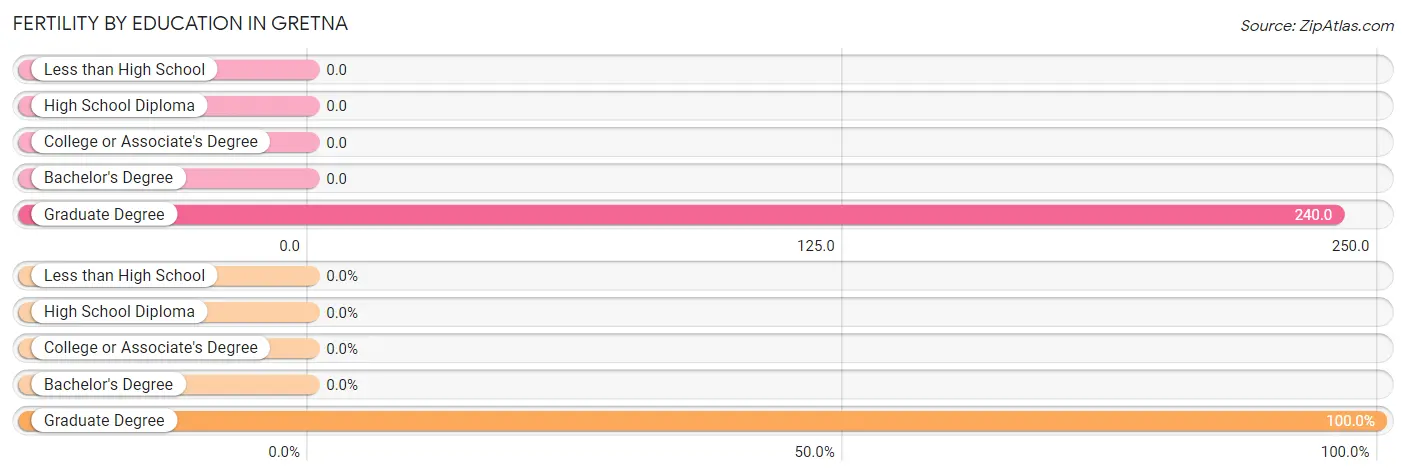
| Educational Attainment | Women with Births | Births / 1,000 Women |
| Less than High School | 0 (0.0%) | 0.0 |
| High School Diploma | 0 (0.0%) | 0.0 |
| College or Associate's Degree | 0 (0.0%) | 0.0 |
| Bachelor's Degree | 0 (0.0%) | 0.0 |
| Graduate Degree | 6 (100.0%) | 240.0 |
| Total | 6 (100.0%) | 28.0 |
Fertility by Education by Marriage Status in Gretna
| Educational Attainment | Married | Unmarried |
| Less than High School | 0 (0.0%) | 0 (0.0%) |
| High School Diploma | 0 (0.0%) | 0 (0.0%) |
| College or Associate's Degree | 0 (0.0%) | 0 (0.0%) |
| Bachelor's Degree | 0 (0.0%) | 0 (0.0%) |
| Graduate Degree | 6 (100.0%) | 0 (0.0%) |
| Total | 6 (100.0%) | 0 (0.0%) |
Employment Characteristics in Gretna
Employment by Class of Employer in Gretna
Among the 392 employed individuals in Gretna, private company employees (280 | 71.4%), state government employees (41 | 10.5%), and local government employees (21 | 5.4%) make up the most common classes of employment.
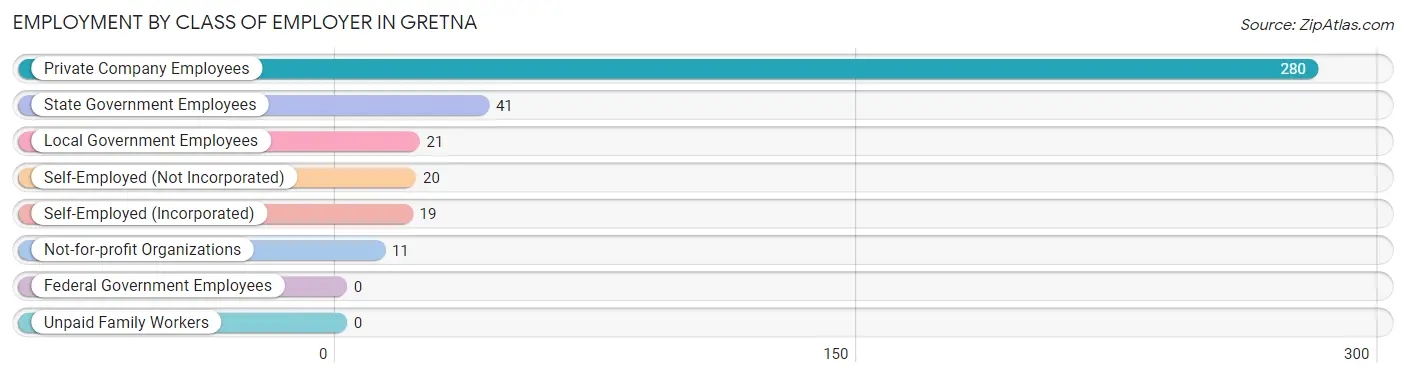
| Employer Class | # Employees | % Employees |
| Private Company Employees | 280 | 71.4% |
| Self-Employed (Incorporated) | 19 | 4.9% |
| Self-Employed (Not Incorporated) | 20 | 5.1% |
| Not-for-profit Organizations | 11 | 2.8% |
| Local Government Employees | 21 | 5.4% |
| State Government Employees | 41 | 10.5% |
| Federal Government Employees | 0 | 0.0% |
| Unpaid Family Workers | 0 | 0.0% |
| Total | 392 | 100.0% |
Employment Status by Age in Gretna
According to the labor force statistics for Gretna, out of the total population over 16 years of age (1,065), 38.8% or 413 individuals are in the labor force, with 5.1% or 21 of them unemployed. The age group with the highest labor force participation rate is 30 to 34 years, with 100.0% or 54 individuals in the labor force. Within the labor force, the 45 to 54 years age range has the highest percentage of unemployed individuals, with 13.5% or 10 of them being unemployed.
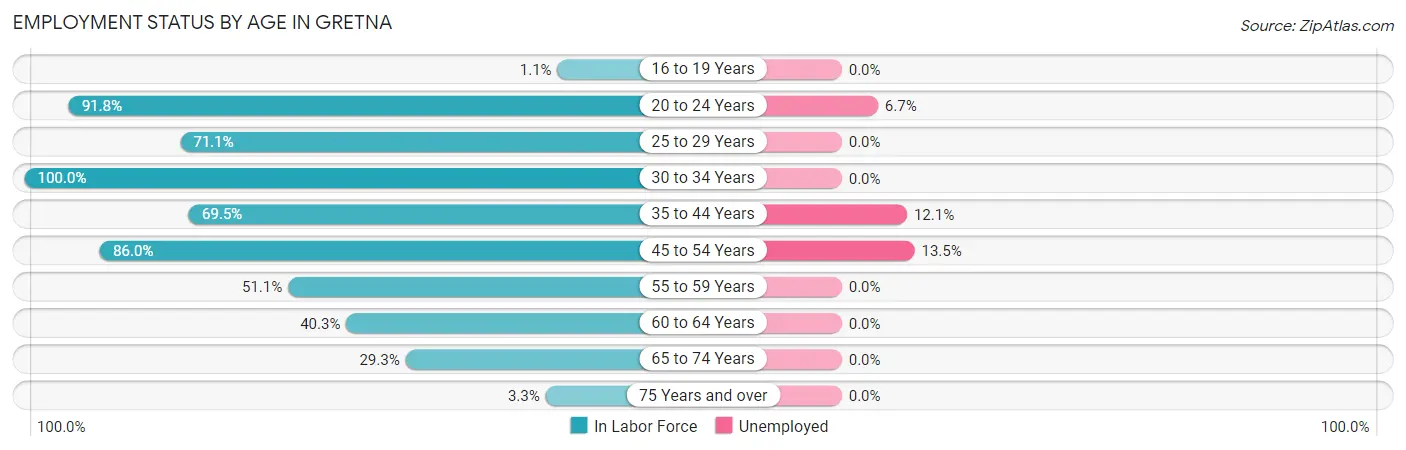
| Age Bracket | In Labor Force | Unemployed |
| 16 to 19 Years | 1 (1.1%) | 0 (0.0%) |
| 20 to 24 Years | 45 (91.8%) | 3 (6.7%) |
| 25 to 29 Years | 27 (71.1%) | 0 (0.0%) |
| 30 to 34 Years | 54 (100.0%) | 0 (0.0%) |
| 35 to 44 Years | 66 (69.5%) | 8 (12.1%) |
| 45 to 54 Years | 74 (86.0%) | 10 (13.5%) |
| 55 to 59 Years | 47 (51.1%) | 0 (0.0%) |
| 60 to 64 Years | 50 (40.3%) | 0 (0.0%) |
| 65 to 74 Years | 39 (29.3%) | 0 (0.0%) |
| 75 Years and over | 10 (3.3%) | 0 (0.0%) |
| Total | 413 (38.8%) | 21 (5.1%) |
Employment Status by Educational Attainment in Gretna
According to labor force statistics for Gretna, 65.0% of individuals (318) out of the total population between 25 and 64 years of age (489) are in the labor force, with 5.7% or 18 of them being unemployed. The group with the highest labor force participation rate are those with the educational attainment of bachelor's degree or higher, with 95.6% or 87 individuals in the labor force. Within the labor force, individuals with high school diploma education have the highest percentage of unemployment, with 12.4% or 18 of them being unemployed.
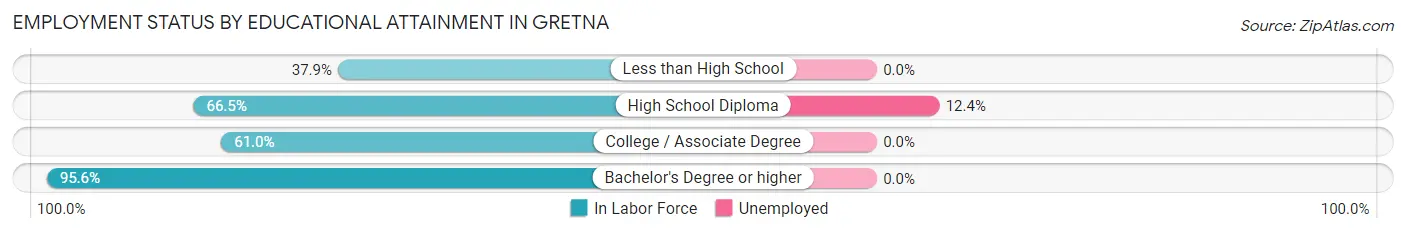
| Educational Attainment | In Labor Force | Unemployed |
| Less than High School | 39 (37.9%) | 0 (0.0%) |
| High School Diploma | 145 (66.5%) | 27 (12.4%) |
| College / Associate Degree | 47 (61.0%) | 0 (0.0%) |
| Bachelor's Degree or higher | 87 (95.6%) | 0 (0.0%) |
| Total | 318 (65.0%) | 28 (5.7%) |
Employment Occupations by Sex in Gretna
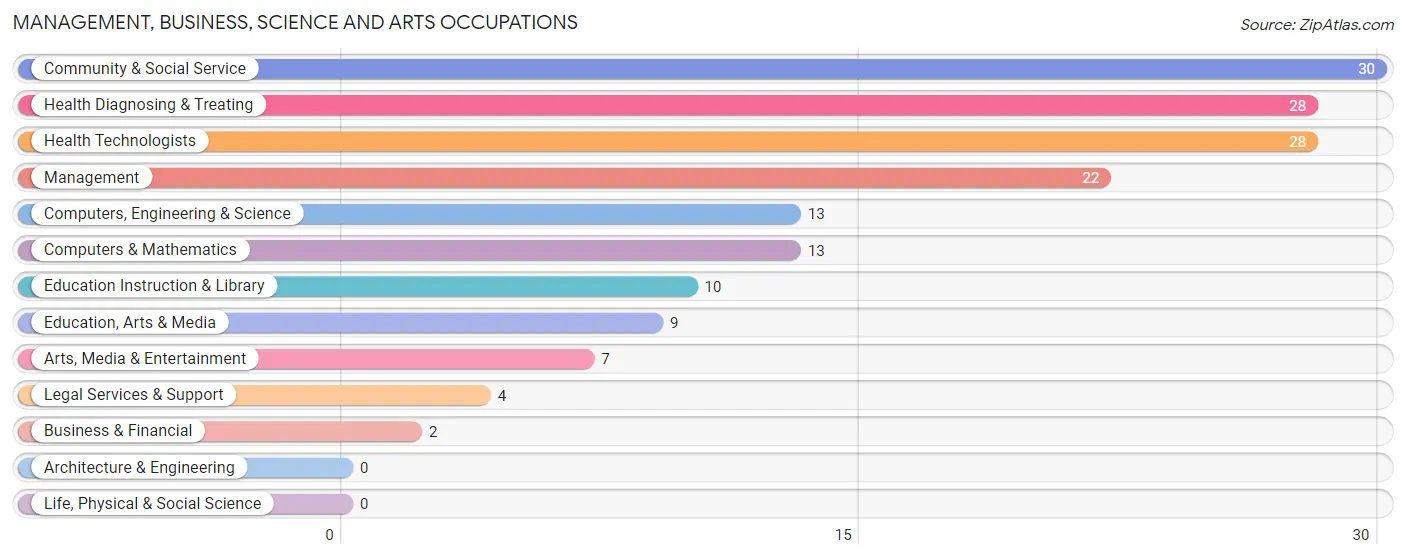
Management, Business, Science and Arts Occupations
The most common Management, Business, Science and Arts occupations in Gretna are Community & Social Service (30 | 7.6%), Health Diagnosing & Treating (28 | 7.1%), Health Technologists (28 | 7.1%), Management (22 | 5.6%), and Computers, Engineering & Science (13 | 3.3%).
Management, Business, Science and Arts Occupations by Sex
Within the Management, Business, Science and Arts occupations in Gretna, the most male-oriented occupations are Management (90.9%), Education Instruction & Library (20.0%), and Health Diagnosing & Treating (17.9%), while the most female-oriented occupations are Business & Financial (100.0%), Education, Arts & Media (100.0%), and Legal Services & Support (100.0%).
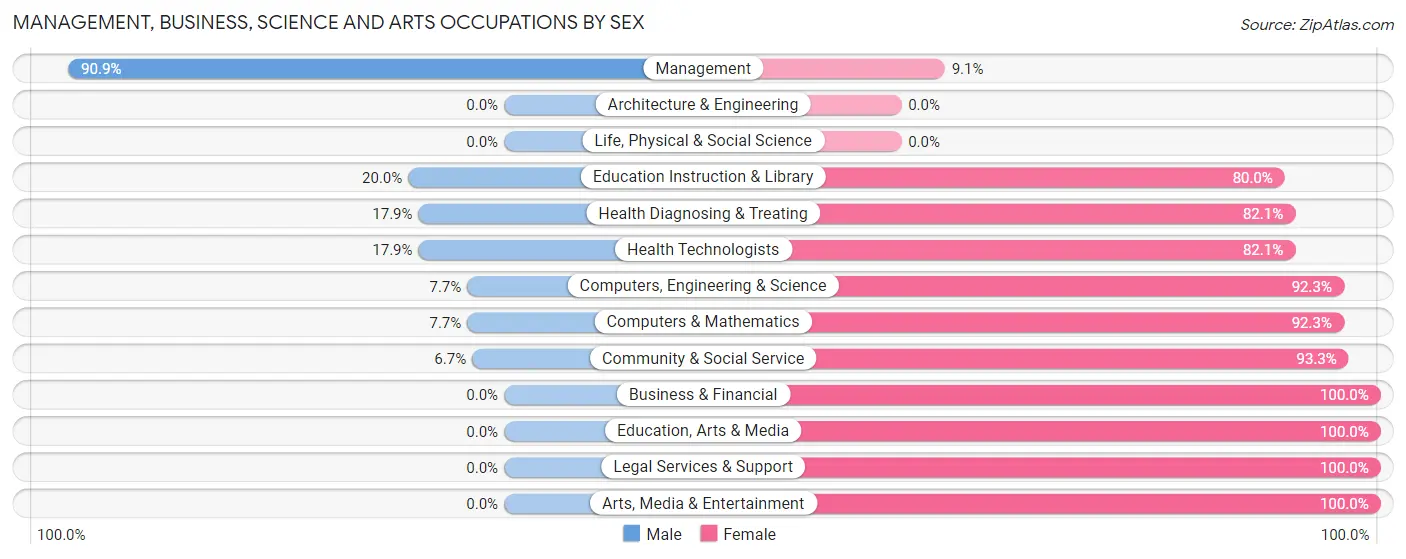
| Occupation | Male | Female |
| Management | 20 (90.9%) | 2 (9.1%) |
| Business & Financial | 0 (0.0%) | 2 (100.0%) |
| Computers, Engineering & Science | 1 (7.7%) | 12 (92.3%) |
| Computers & Mathematics | 1 (7.7%) | 12 (92.3%) |
| Architecture & Engineering | 0 (0.0%) | 0 (0.0%) |
| Life, Physical & Social Science | 0 (0.0%) | 0 (0.0%) |
| Community & Social Service | 2 (6.7%) | 28 (93.3%) |
| Education, Arts & Media | 0 (0.0%) | 9 (100.0%) |
| Legal Services & Support | 0 (0.0%) | 4 (100.0%) |
| Education Instruction & Library | 2 (20.0%) | 8 (80.0%) |
| Arts, Media & Entertainment | 0 (0.0%) | 7 (100.0%) |
| Health Diagnosing & Treating | 5 (17.9%) | 23 (82.1%) |
| Health Technologists | 5 (17.9%) | 23 (82.1%) |
| Total (Category) | 28 (29.5%) | 67 (70.5%) |
| Total (Overall) | 157 (40.1%) | 235 (60.0%) |
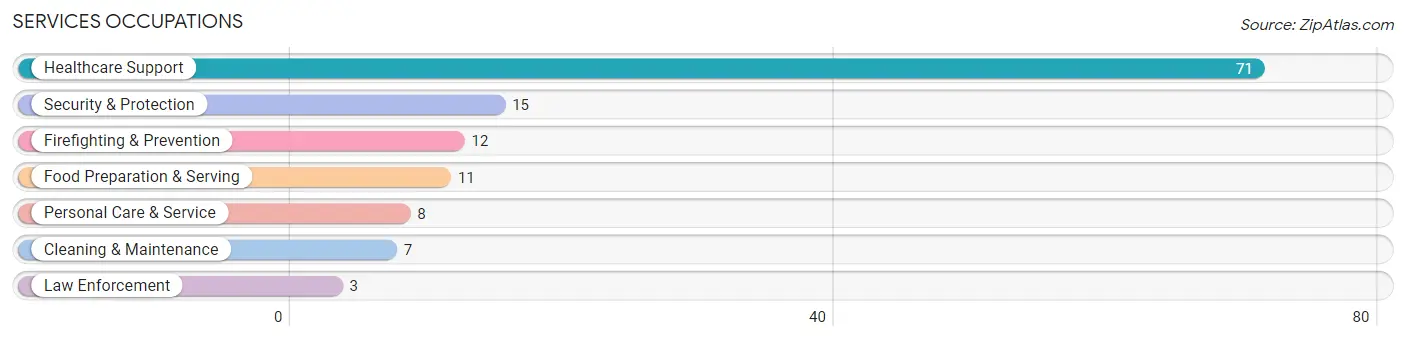
Services Occupations
The most common Services occupations in Gretna are Healthcare Support (71 | 18.1%), Security & Protection (15 | 3.8%), Firefighting & Prevention (12 | 3.1%), Food Preparation & Serving (11 | 2.8%), and Personal Care & Service (8 | 2.0%).
Services Occupations by Sex
Within the Services occupations in Gretna, the most male-oriented occupations are Law Enforcement (100.0%), Cleaning & Maintenance (100.0%), and Personal Care & Service (37.5%), while the most female-oriented occupations are Firefighting & Prevention (100.0%), Food Preparation & Serving (100.0%), and Healthcare Support (91.5%).
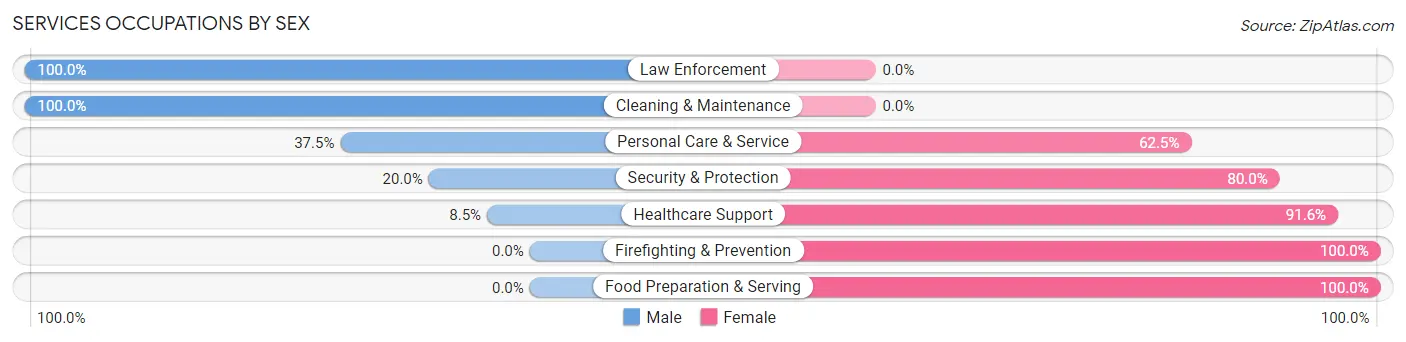
| Occupation | Male | Female |
| Healthcare Support | 6 (8.5%) | 65 (91.5%) |
| Security & Protection | 3 (20.0%) | 12 (80.0%) |
| Firefighting & Prevention | 0 (0.0%) | 12 (100.0%) |
| Law Enforcement | 3 (100.0%) | 0 (0.0%) |
| Food Preparation & Serving | 0 (0.0%) | 11 (100.0%) |
| Cleaning & Maintenance | 7 (100.0%) | 0 (0.0%) |
| Personal Care & Service | 3 (37.5%) | 5 (62.5%) |
| Total (Category) | 19 (17.0%) | 93 (83.0%) |
| Total (Overall) | 157 (40.1%) | 235 (60.0%) |
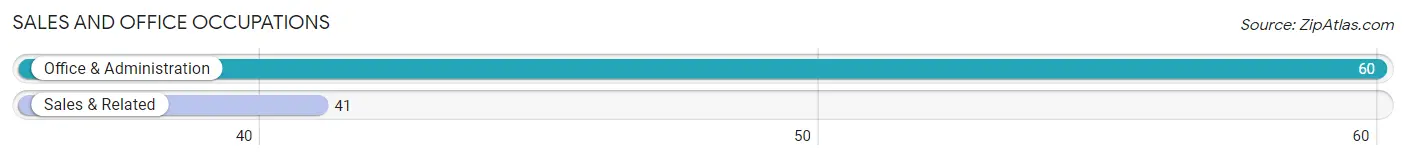
Sales and Office Occupations
The most common Sales and Office occupations in Gretna are Office & Administration (60 | 15.3%), and Sales & Related (41 | 10.5%).
Sales and Office Occupations by Sex
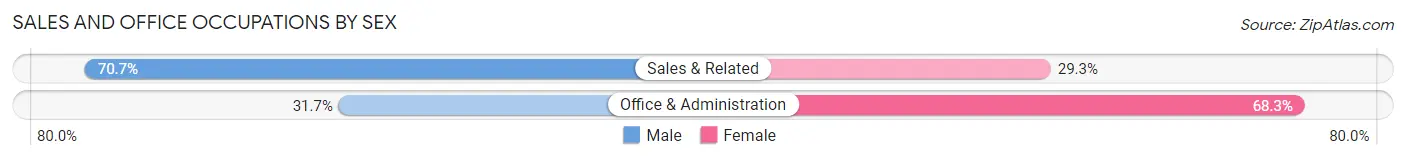
| Occupation | Male | Female |
| Sales & Related | 29 (70.7%) | 12 (29.3%) |
| Office & Administration | 19 (31.7%) | 41 (68.3%) |
| Total (Category) | 48 (47.5%) | 53 (52.5%) |
| Total (Overall) | 157 (40.1%) | 235 (60.0%) |
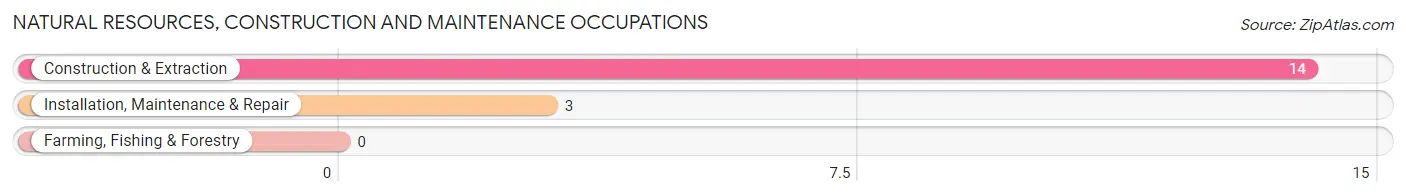
Natural Resources, Construction and Maintenance Occupations
The most common Natural Resources, Construction and Maintenance occupations in Gretna are Construction & Extraction (14 | 3.6%), and Installation, Maintenance & Repair (3 | 0.8%).
Natural Resources, Construction and Maintenance Occupations by Sex
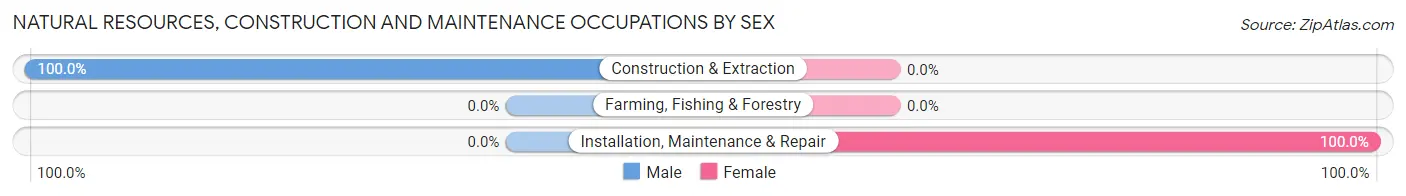
| Occupation | Male | Female |
| Farming, Fishing & Forestry | 0 (0.0%) | 0 (0.0%) |
| Construction & Extraction | 14 (100.0%) | 0 (0.0%) |
| Installation, Maintenance & Repair | 0 (0.0%) | 3 (100.0%) |
| Total (Category) | 14 (82.4%) | 3 (17.6%) |
| Total (Overall) | 157 (40.1%) | 235 (60.0%) |
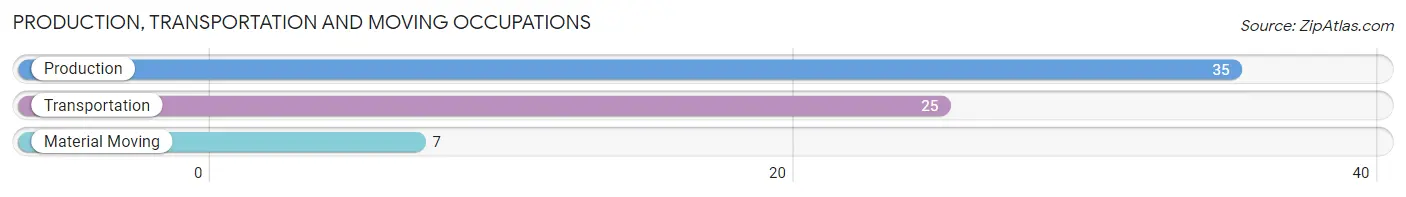
Production, Transportation and Moving Occupations
The most common Production, Transportation and Moving occupations in Gretna are Production (35 | 8.9%), Transportation (25 | 6.4%), and Material Moving (7 | 1.8%).
Production, Transportation and Moving Occupations by Sex
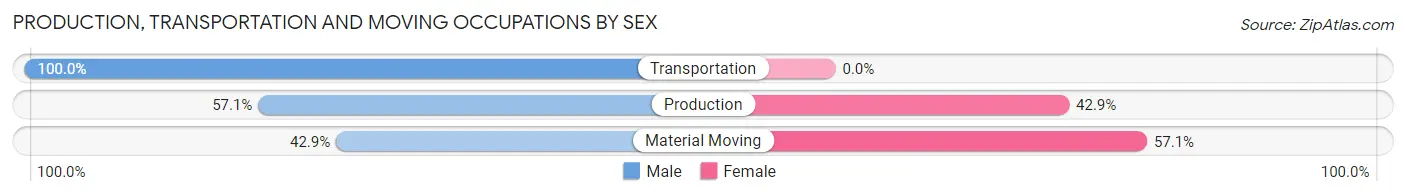
| Occupation | Male | Female |
| Production | 20 (57.1%) | 15 (42.9%) |
| Transportation | 25 (100.0%) | 0 (0.0%) |
| Material Moving | 3 (42.9%) | 4 (57.1%) |
| Total (Category) | 48 (71.6%) | 19 (28.4%) |
| Total (Overall) | 157 (40.1%) | 235 (60.0%) |
Employment Industries by Sex in Gretna
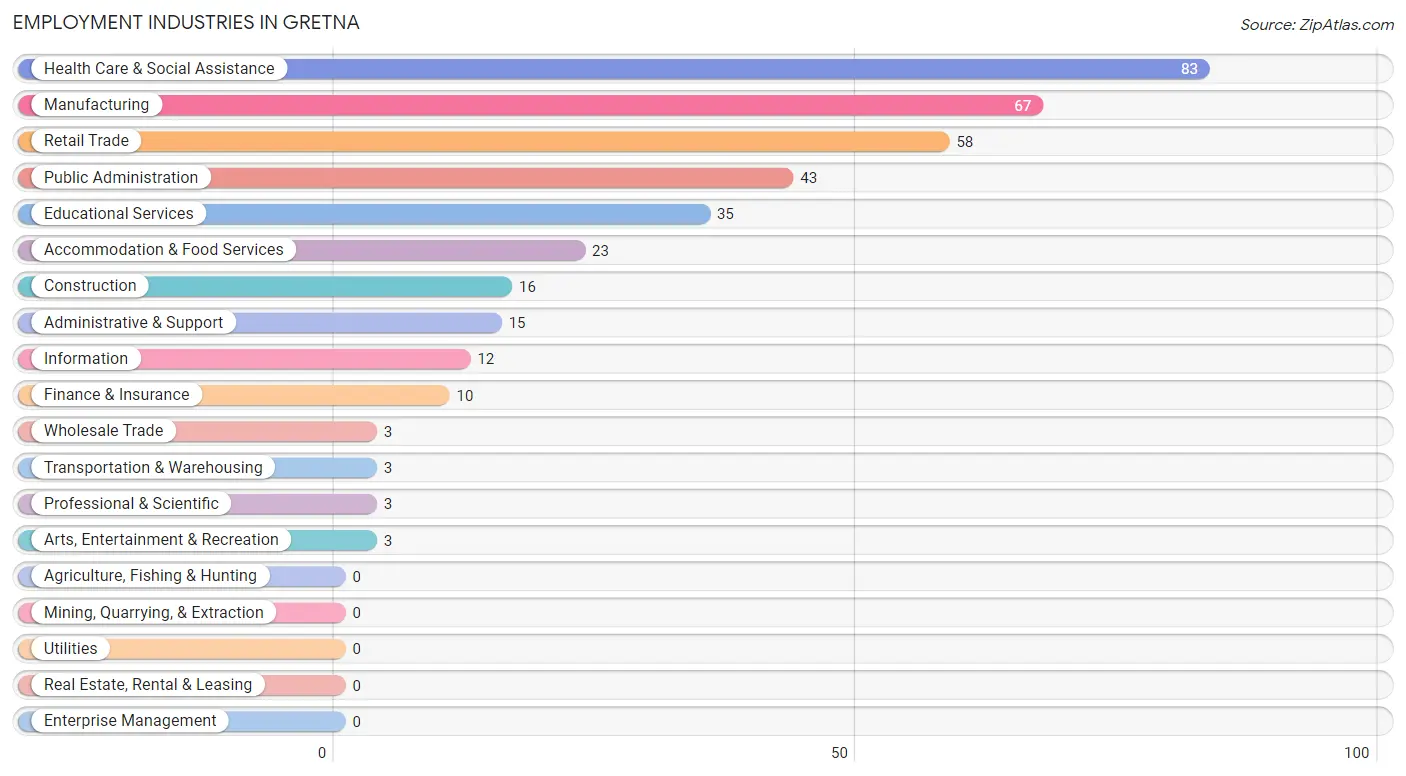
Employment Industries in Gretna
The major employment industries in Gretna include Health Care & Social Assistance (83 | 21.2%), Manufacturing (67 | 17.1%), Retail Trade (58 | 14.8%), Public Administration (43 | 11.0%), and Educational Services (35 | 8.9%).
Employment Industries by Sex in Gretna
The Gretna industries that see more men than women are Construction (100.0%), Wholesale Trade (100.0%), and Transportation & Warehousing (100.0%), whereas the industries that tend to have a higher number of women are Information (100.0%), Finance & Insurance (100.0%), and Administrative & Support (100.0%).
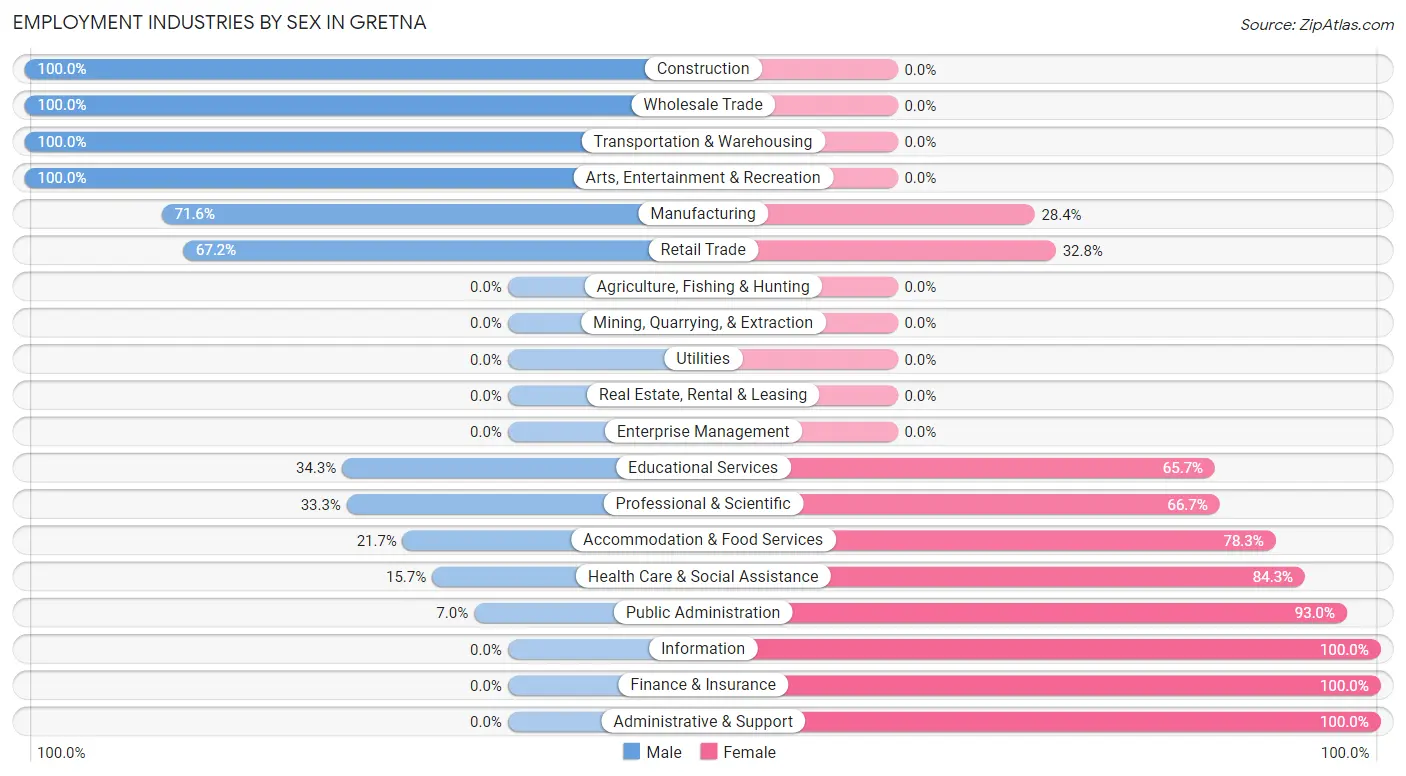
| Industry | Male | Female |
| Agriculture, Fishing & Hunting | 0 (0.0%) | 0 (0.0%) |
| Mining, Quarrying, & Extraction | 0 (0.0%) | 0 (0.0%) |
| Construction | 16 (100.0%) | 0 (0.0%) |
| Manufacturing | 48 (71.6%) | 19 (28.4%) |
| Wholesale Trade | 3 (100.0%) | 0 (0.0%) |
| Retail Trade | 39 (67.2%) | 19 (32.8%) |
| Transportation & Warehousing | 3 (100.0%) | 0 (0.0%) |
| Utilities | 0 (0.0%) | 0 (0.0%) |
| Information | 0 (0.0%) | 12 (100.0%) |
| Finance & Insurance | 0 (0.0%) | 10 (100.0%) |
| Real Estate, Rental & Leasing | 0 (0.0%) | 0 (0.0%) |
| Professional & Scientific | 1 (33.3%) | 2 (66.7%) |
| Enterprise Management | 0 (0.0%) | 0 (0.0%) |
| Administrative & Support | 0 (0.0%) | 15 (100.0%) |
| Educational Services | 12 (34.3%) | 23 (65.7%) |
| Health Care & Social Assistance | 13 (15.7%) | 70 (84.3%) |
| Arts, Entertainment & Recreation | 3 (100.0%) | 0 (0.0%) |
| Accommodation & Food Services | 5 (21.7%) | 18 (78.3%) |
| Public Administration | 3 (7.0%) | 40 (93.0%) |
| Total | 157 (40.1%) | 235 (60.0%) |
Education in Gretna
School Enrollment in Gretna
The most common levels of schooling among the 199 students in Gretna are elementary school (72 | 36.2%), high school (44 | 22.1%), and college / undergraduate (33 | 16.6%).
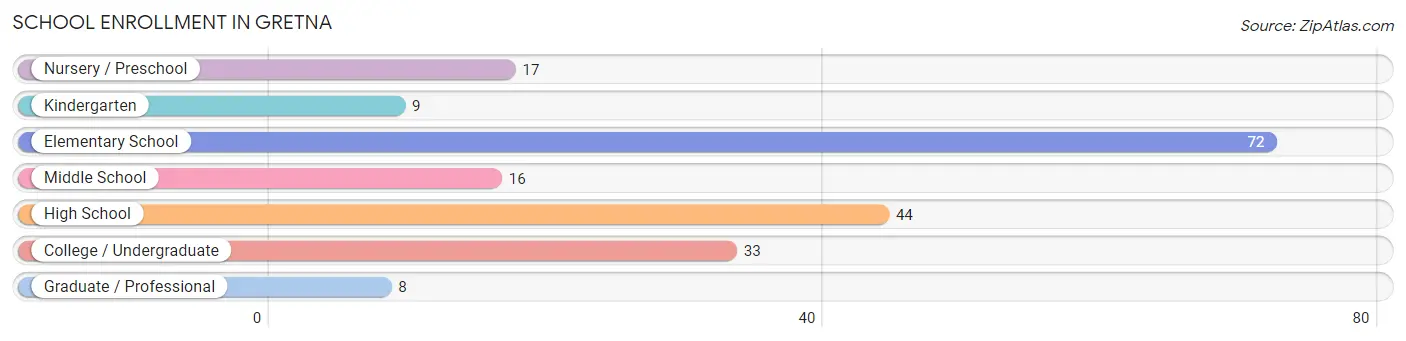
| School Level | # Students | % Students |
| Nursery / Preschool | 17 | 8.5% |
| Kindergarten | 9 | 4.5% |
| Elementary School | 72 | 36.2% |
| Middle School | 16 | 8.0% |
| High School | 44 | 22.1% |
| College / Undergraduate | 33 | 16.6% |
| Graduate / Professional | 8 | 4.0% |
| Total | 199 | 100.0% |
School Enrollment by Age by Funding Source in Gretna
Out of a total of 199 students who are enrolled in schools in Gretna, 26 (13.1%) attend a private institution, while the remaining 173 (86.9%) are enrolled in public schools. The age group of 25 to 34 year olds has the highest likelihood of being enrolled in private schools, with 6 (100.0% in the age bracket) enrolled. Conversely, the age group of 5 to 9 year old has the lowest likelihood of being enrolled in a private school, with 26 (100.0% in the age bracket) attending a public institution.
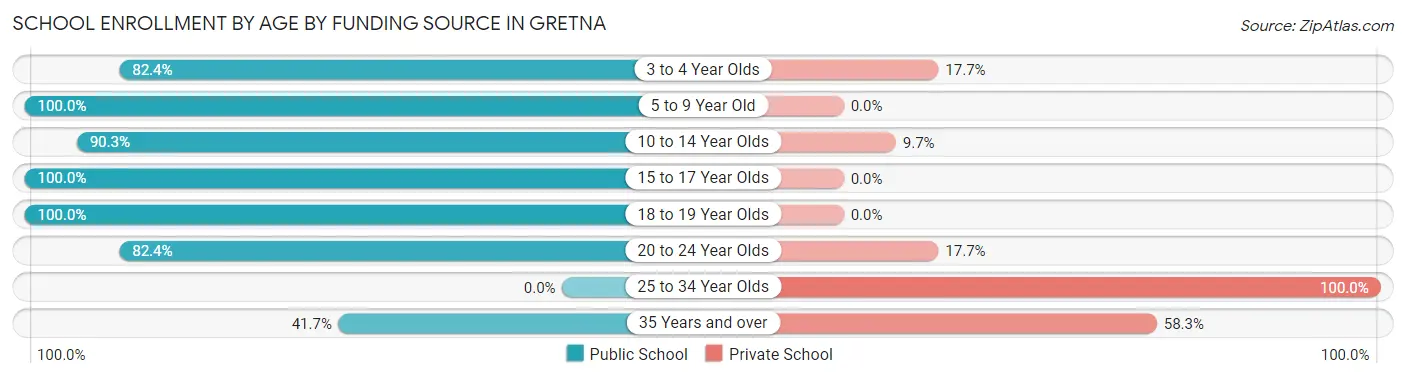
| Age Bracket | Public School | Private School |
| 3 to 4 Year Olds | 14 (82.4%) | 3 (17.6%) |
| 5 to 9 Year Old | 26 (100.0%) | 0 (0.0%) |
| 10 to 14 Year Olds | 65 (90.3%) | 7 (9.7%) |
| 15 to 17 Year Olds | 48 (100.0%) | 0 (0.0%) |
| 18 to 19 Year Olds | 1 (100.0%) | 0 (0.0%) |
| 20 to 24 Year Olds | 14 (82.4%) | 3 (17.6%) |
| 25 to 34 Year Olds | 0 (0.0%) | 6 (100.0%) |
| 35 Years and over | 5 (41.7%) | 7 (58.3%) |
| Total | 173 (86.9%) | 26 (13.1%) |
Educational Attainment by Field of Study in Gretna
Education (35 | 26.5%), business (33 | 25.0%), computers & mathematics (23 | 17.4%), science & technology (23 | 17.4%), and bio, nature & agricultural (5 | 3.8%) are the most common fields of study among 132 individuals in Gretna who have obtained a bachelor's degree or higher.
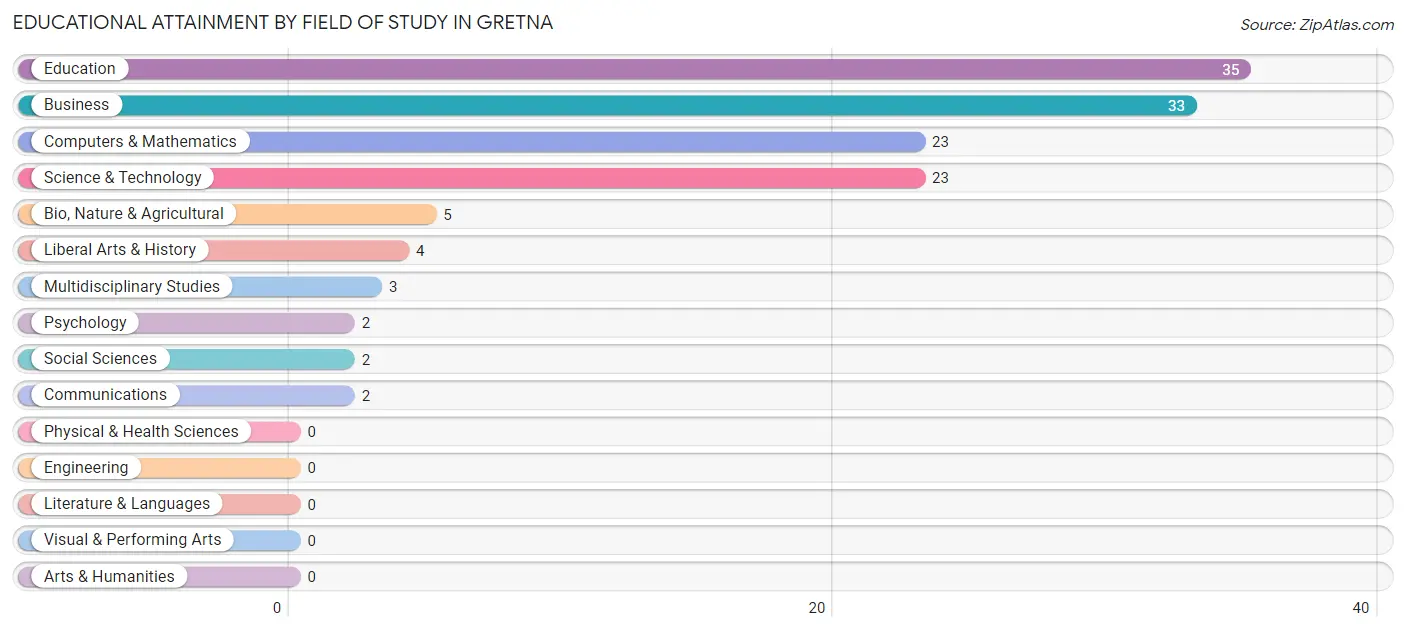
| Field of Study | # Graduates | % Graduates |
| Computers & Mathematics | 23 | 17.4% |
| Bio, Nature & Agricultural | 5 | 3.8% |
| Physical & Health Sciences | 0 | 0.0% |
| Psychology | 2 | 1.5% |
| Social Sciences | 2 | 1.5% |
| Engineering | 0 | 0.0% |
| Multidisciplinary Studies | 3 | 2.3% |
| Science & Technology | 23 | 17.4% |
| Business | 33 | 25.0% |
| Education | 35 | 26.5% |
| Literature & Languages | 0 | 0.0% |
| Liberal Arts & History | 4 | 3.0% |
| Visual & Performing Arts | 0 | 0.0% |
| Communications | 2 | 1.5% |
| Arts & Humanities | 0 | 0.0% |
| Total | 132 | 100.0% |
Transportation & Commute in Gretna
Vehicle Availability by Sex in Gretna
The most prevalent vehicle ownership categories in Gretna are males with 2 vehicles (55, accounting for 35.0%) and females with 2 vehicles (94, making up 23.4%).
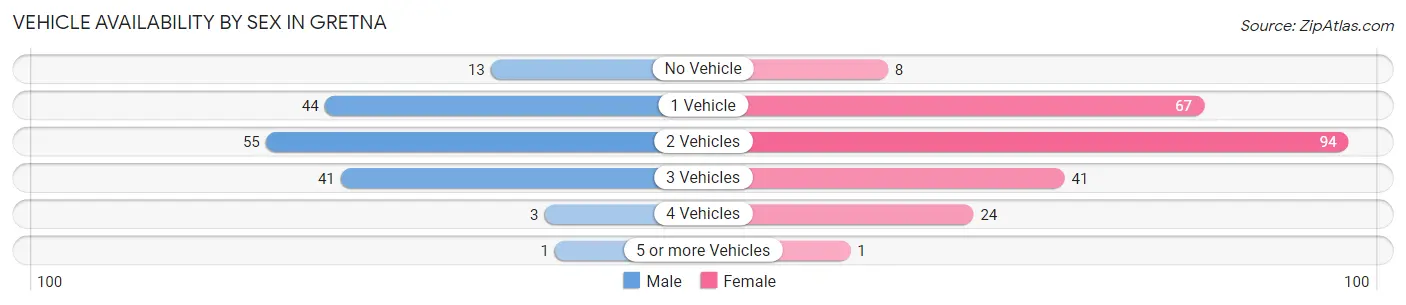
| Vehicles Available | Male | Female |
| No Vehicle | 13 (8.3%) | 8 (3.4%) |
| 1 Vehicle | 44 (28.0%) | 67 (28.5%) |
| 2 Vehicles | 55 (35.0%) | 94 (40.0%) |
| 3 Vehicles | 41 (26.1%) | 41 (17.4%) |
| 4 Vehicles | 3 (1.9%) | 24 (10.2%) |
| 5 or more Vehicles | 1 (0.6%) | 1 (0.4%) |
| Total | 157 (100.0%) | 235 (100.0%) |
Commute Time in Gretna
The most frequently occuring commute durations in Gretna are 5 to 9 minutes (80 commuters, 24.2%), 45 to 59 minutes (53 commuters, 16.0%), and 15 to 19 minutes (40 commuters, 12.1%).
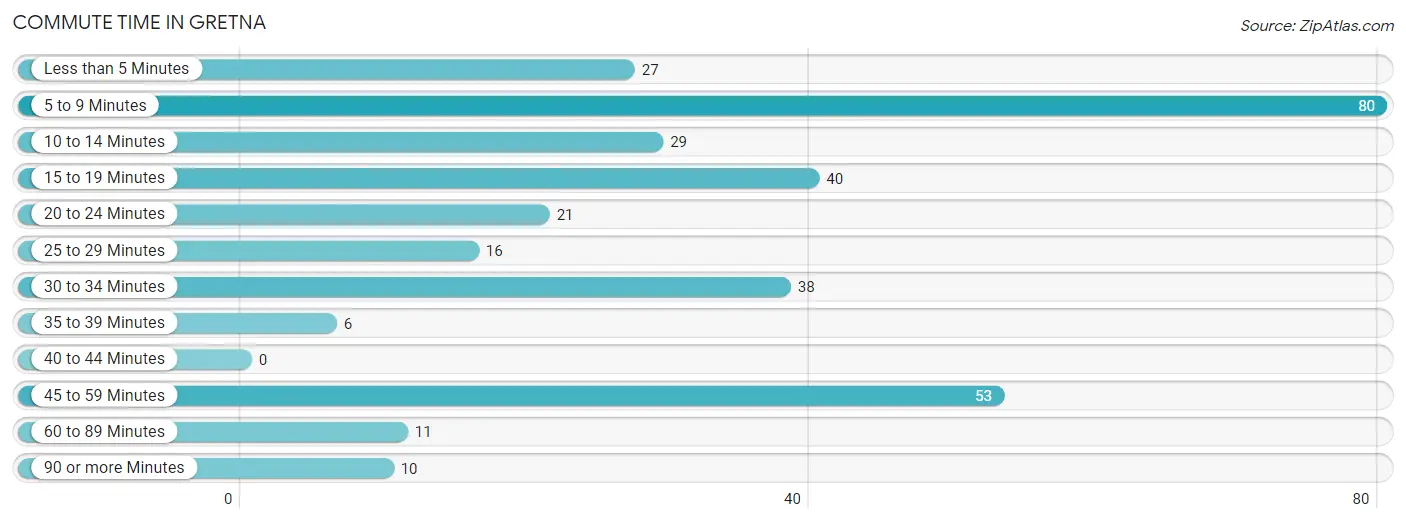
| Commute Time | # Commuters | % Commuters |
| Less than 5 Minutes | 27 | 8.2% |
| 5 to 9 Minutes | 80 | 24.2% |
| 10 to 14 Minutes | 29 | 8.8% |
| 15 to 19 Minutes | 40 | 12.1% |
| 20 to 24 Minutes | 21 | 6.3% |
| 25 to 29 Minutes | 16 | 4.8% |
| 30 to 34 Minutes | 38 | 11.5% |
| 35 to 39 Minutes | 6 | 1.8% |
| 40 to 44 Minutes | 0 | 0.0% |
| 45 to 59 Minutes | 53 | 16.0% |
| 60 to 89 Minutes | 11 | 3.3% |
| 90 or more Minutes | 10 | 3.0% |
Commute Time by Sex in Gretna
The most common commute times in Gretna are 45 to 59 minutes (28 commuters, 18.5%) for males and 5 to 9 minutes (56 commuters, 31.1%) for females.
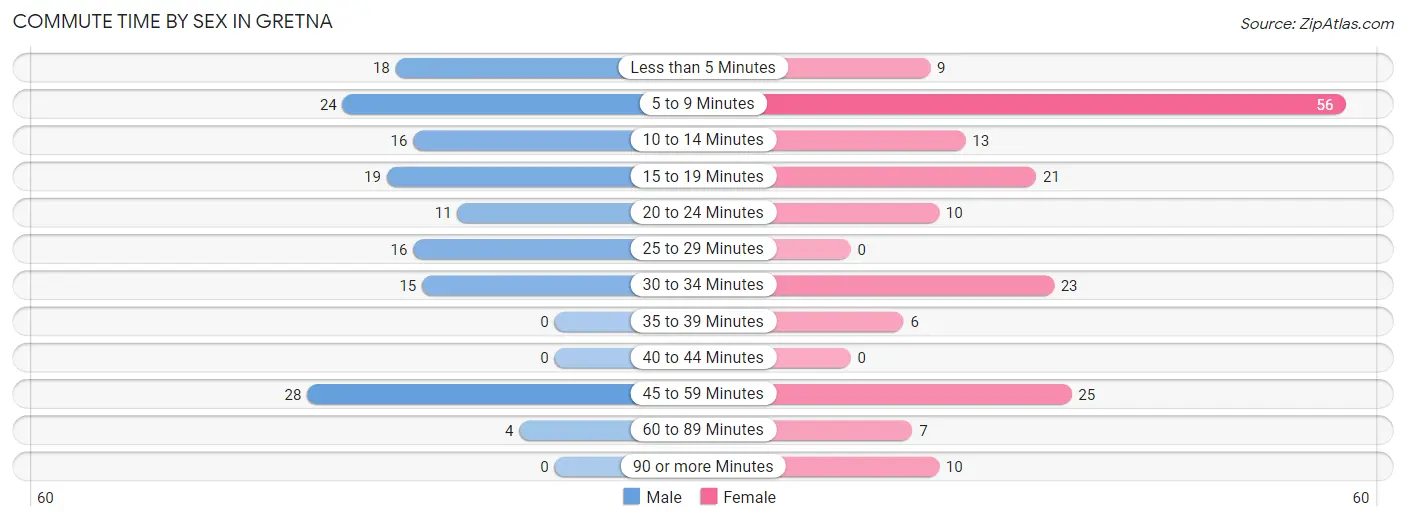
| Commute Time | Male | Female |
| Less than 5 Minutes | 18 (11.9%) | 9 (5.0%) |
| 5 to 9 Minutes | 24 (15.9%) | 56 (31.1%) |
| 10 to 14 Minutes | 16 (10.6%) | 13 (7.2%) |
| 15 to 19 Minutes | 19 (12.6%) | 21 (11.7%) |
| 20 to 24 Minutes | 11 (7.3%) | 10 (5.6%) |
| 25 to 29 Minutes | 16 (10.6%) | 0 (0.0%) |
| 30 to 34 Minutes | 15 (9.9%) | 23 (12.8%) |
| 35 to 39 Minutes | 0 (0.0%) | 6 (3.3%) |
| 40 to 44 Minutes | 0 (0.0%) | 0 (0.0%) |
| 45 to 59 Minutes | 28 (18.5%) | 25 (13.9%) |
| 60 to 89 Minutes | 4 (2.6%) | 7 (3.9%) |
| 90 or more Minutes | 0 (0.0%) | 10 (5.6%) |
Time of Departure to Work by Sex in Gretna
The most frequent times of departure to work in Gretna are 7:30 AM to 7:59 AM (57, 37.8%) for males and 8:30 AM to 8:59 AM (32, 17.8%) for females.
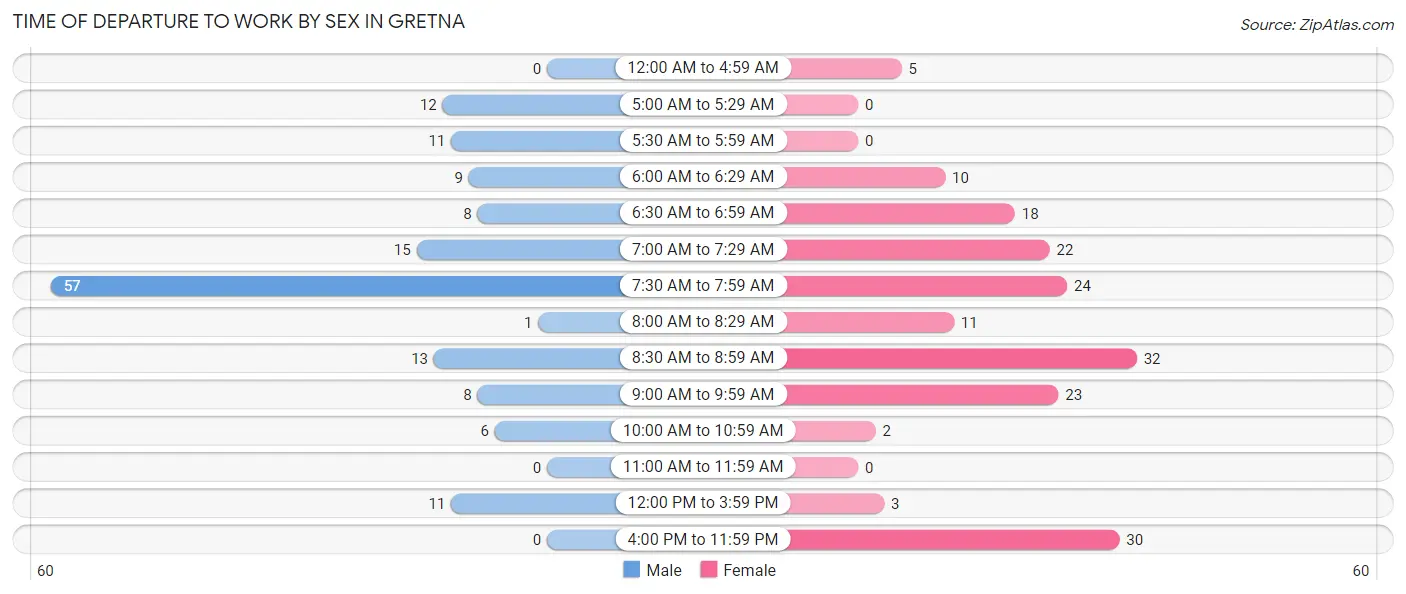
| Time of Departure | Male | Female |
| 12:00 AM to 4:59 AM | 0 (0.0%) | 5 (2.8%) |
| 5:00 AM to 5:29 AM | 12 (8.0%) | 0 (0.0%) |
| 5:30 AM to 5:59 AM | 11 (7.3%) | 0 (0.0%) |
| 6:00 AM to 6:29 AM | 9 (6.0%) | 10 (5.6%) |
| 6:30 AM to 6:59 AM | 8 (5.3%) | 18 (10.0%) |
| 7:00 AM to 7:29 AM | 15 (9.9%) | 22 (12.2%) |
| 7:30 AM to 7:59 AM | 57 (37.8%) | 24 (13.3%) |
| 8:00 AM to 8:29 AM | 1 (0.7%) | 11 (6.1%) |
| 8:30 AM to 8:59 AM | 13 (8.6%) | 32 (17.8%) |
| 9:00 AM to 9:59 AM | 8 (5.3%) | 23 (12.8%) |
| 10:00 AM to 10:59 AM | 6 (4.0%) | 2 (1.1%) |
| 11:00 AM to 11:59 AM | 0 (0.0%) | 0 (0.0%) |
| 12:00 PM to 3:59 PM | 11 (7.3%) | 3 (1.7%) |
| 4:00 PM to 11:59 PM | 0 (0.0%) | 30 (16.7%) |
| Total | 151 (100.0%) | 180 (100.0%) |
Housing Occupancy in Gretna
Occupancy by Ownership in Gretna
Of the total 612 dwellings in Gretna, owner-occupied units account for 287 (46.9%), while renter-occupied units make up 325 (53.1%).
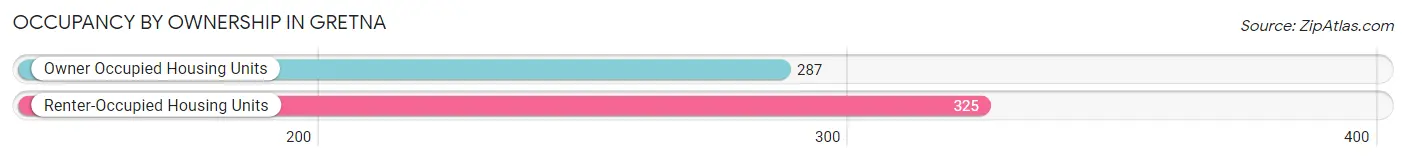
| Occupancy | # Housing Units | % Housing Units |
| Owner Occupied Housing Units | 287 | 46.9% |
| Renter-Occupied Housing Units | 325 | 53.1% |
| Total Occupied Housing Units | 612 | 100.0% |
Occupancy by Household Size in Gretna
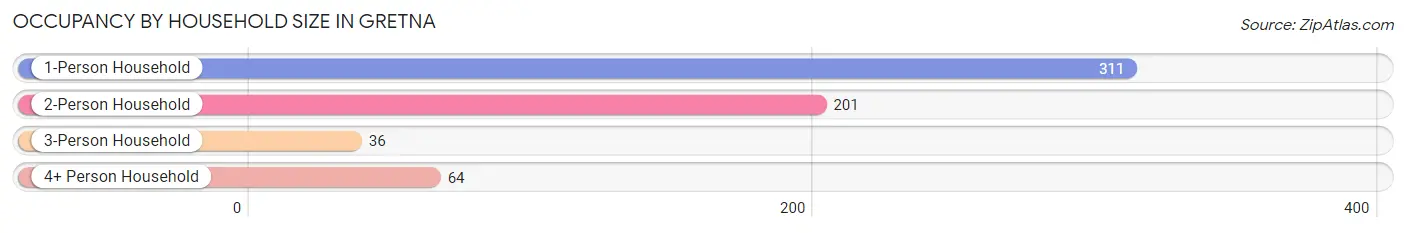
| Household Size | # Housing Units | % Housing Units |
| 1-Person Household | 311 | 50.8% |
| 2-Person Household | 201 | 32.8% |
| 3-Person Household | 36 | 5.9% |
| 4+ Person Household | 64 | 10.5% |
| Total Housing Units | 612 | 100.0% |
Occupancy by Ownership by Household Size in Gretna
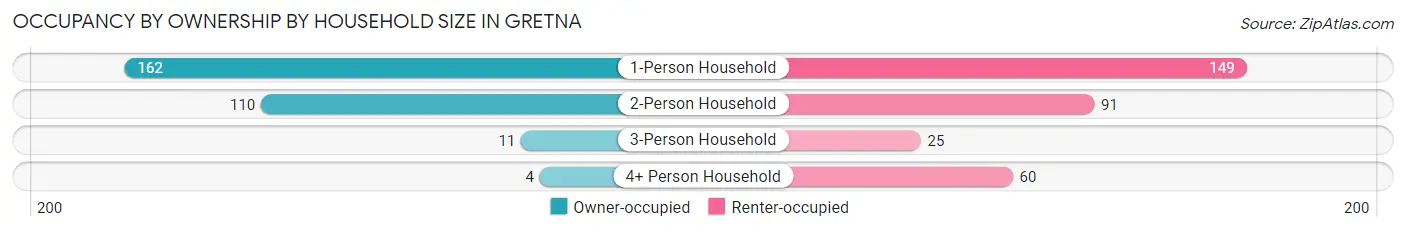
| Household Size | Owner-occupied | Renter-occupied |
| 1-Person Household | 162 (52.1%) | 149 (47.9%) |
| 2-Person Household | 110 (54.7%) | 91 (45.3%) |
| 3-Person Household | 11 (30.6%) | 25 (69.4%) |
| 4+ Person Household | 4 (6.2%) | 60 (93.8%) |
| Total Housing Units | 287 (46.9%) | 325 (53.1%) |
Occupancy by Educational Attainment in Gretna
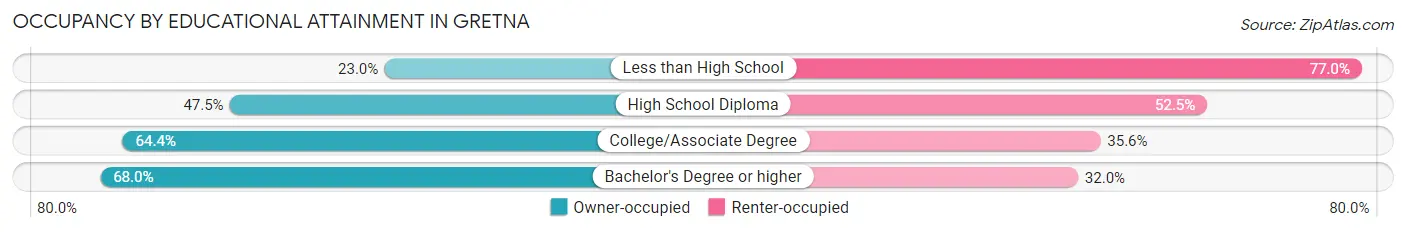
| Household Size | Owner-occupied | Renter-occupied |
| Less than High School | 37 (23.0%) | 124 (77.0%) |
| High School Diploma | 124 (47.5%) | 137 (52.5%) |
| College/Associate Degree | 58 (64.4%) | 32 (35.6%) |
| Bachelor's Degree or higher | 68 (68.0%) | 32 (32.0%) |
Occupancy by Age of Householder in Gretna
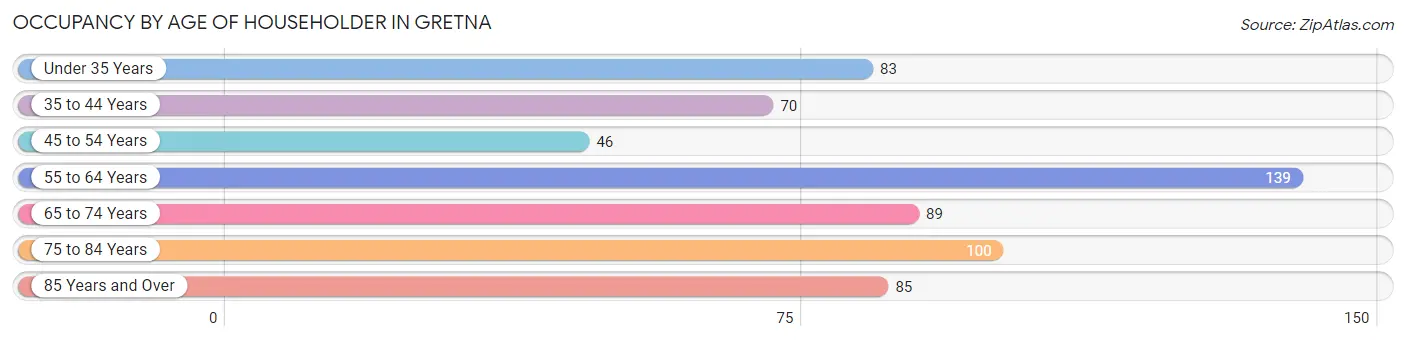
| Age Bracket | # Households | % Households |
| Under 35 Years | 83 | 13.6% |
| 35 to 44 Years | 70 | 11.4% |
| 45 to 54 Years | 46 | 7.5% |
| 55 to 64 Years | 139 | 22.7% |
| 65 to 74 Years | 89 | 14.5% |
| 75 to 84 Years | 100 | 16.3% |
| 85 Years and Over | 85 | 13.9% |
| Total | 612 | 100.0% |
Housing Finances in Gretna
Median Income by Occupancy in Gretna
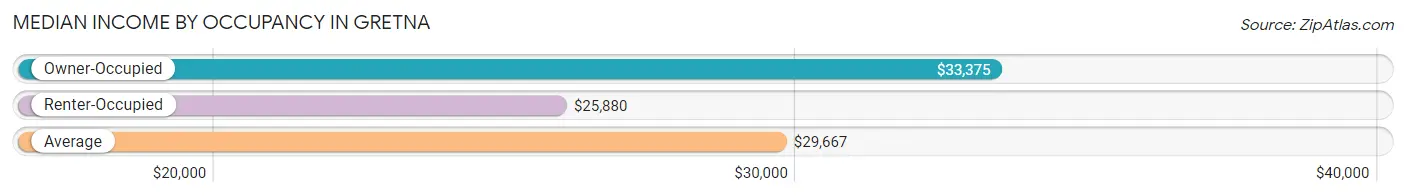
| Occupancy Type | # Households | Median Income |
| Owner-Occupied | 287 (46.9%) | $33,375 |
| Renter-Occupied | 325 (53.1%) | $25,880 |
| Average | 612 (100.0%) | $29,667 |
Occupancy by Householder Income Bracket in Gretna
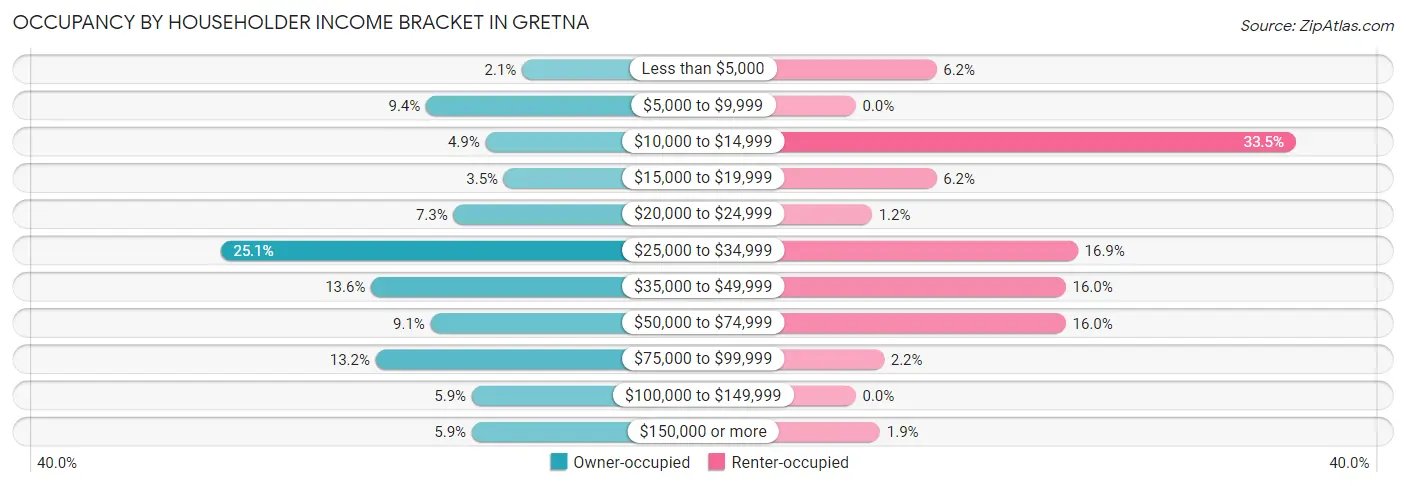
| Income Bracket | Owner-occupied | Renter-occupied |
| Less than $5,000 | 6 (2.1%) | 20 (6.1%) |
| $5,000 to $9,999 | 27 (9.4%) | 0 (0.0%) |
| $10,000 to $14,999 | 14 (4.9%) | 109 (33.5%) |
| $15,000 to $19,999 | 10 (3.5%) | 20 (6.1%) |
| $20,000 to $24,999 | 21 (7.3%) | 4 (1.2%) |
| $25,000 to $34,999 | 72 (25.1%) | 55 (16.9%) |
| $35,000 to $49,999 | 39 (13.6%) | 52 (16.0%) |
| $50,000 to $74,999 | 26 (9.1%) | 52 (16.0%) |
| $75,000 to $99,999 | 38 (13.2%) | 7 (2.1%) |
| $100,000 to $149,999 | 17 (5.9%) | 0 (0.0%) |
| $150,000 or more | 17 (5.9%) | 6 (1.8%) |
| Total | 287 (100.0%) | 325 (100.0%) |
Monthly Housing Cost Tiers in Gretna
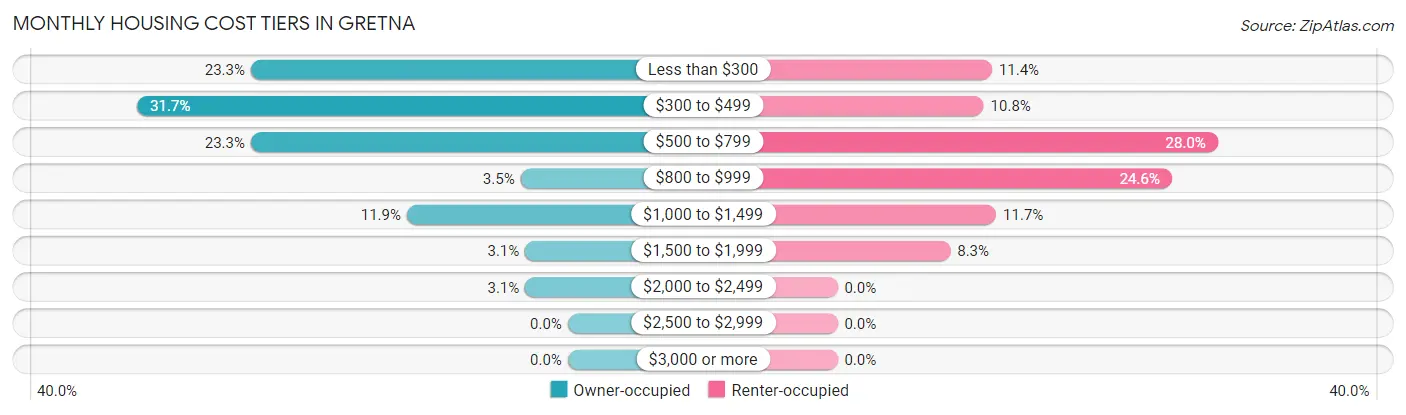
| Monthly Cost | Owner-occupied | Renter-occupied |
| Less than $300 | 67 (23.3%) | 37 (11.4%) |
| $300 to $499 | 91 (31.7%) | 35 (10.8%) |
| $500 to $799 | 67 (23.3%) | 91 (28.0%) |
| $800 to $999 | 10 (3.5%) | 80 (24.6%) |
| $1,000 to $1,499 | 34 (11.8%) | 38 (11.7%) |
| $1,500 to $1,999 | 9 (3.1%) | 27 (8.3%) |
| $2,000 to $2,499 | 9 (3.1%) | 0 (0.0%) |
| $2,500 to $2,999 | 0 (0.0%) | 0 (0.0%) |
| $3,000 or more | 0 (0.0%) | 0 (0.0%) |
| Total | 287 (100.0%) | 325 (100.0%) |
Physical Housing Characteristics in Gretna
Housing Structures in Gretna
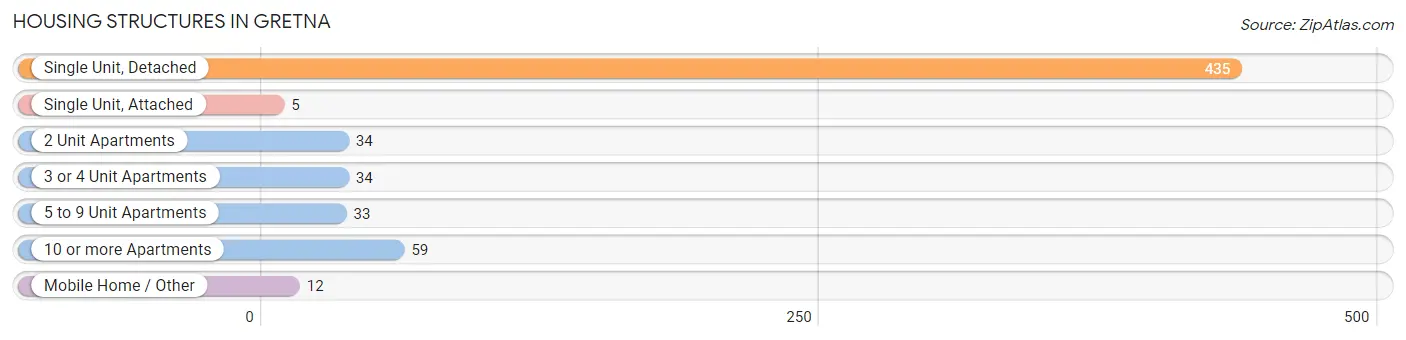
| Structure Type | # Housing Units | % Housing Units |
| Single Unit, Detached | 435 | 71.1% |
| Single Unit, Attached | 5 | 0.8% |
| 2 Unit Apartments | 34 | 5.6% |
| 3 or 4 Unit Apartments | 34 | 5.6% |
| 5 to 9 Unit Apartments | 33 | 5.4% |
| 10 or more Apartments | 59 | 9.6% |
| Mobile Home / Other | 12 | 2.0% |
| Total | 612 | 100.0% |
Housing Structures by Occupancy in Gretna
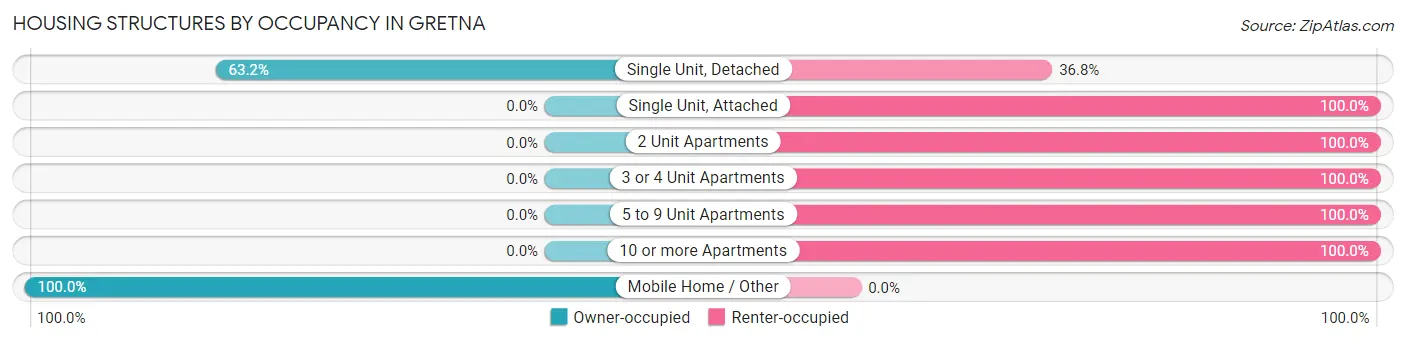
| Structure Type | Owner-occupied | Renter-occupied |
| Single Unit, Detached | 275 (63.2%) | 160 (36.8%) |
| Single Unit, Attached | 0 (0.0%) | 5 (100.0%) |
| 2 Unit Apartments | 0 (0.0%) | 34 (100.0%) |
| 3 or 4 Unit Apartments | 0 (0.0%) | 34 (100.0%) |
| 5 to 9 Unit Apartments | 0 (0.0%) | 33 (100.0%) |
| 10 or more Apartments | 0 (0.0%) | 59 (100.0%) |
| Mobile Home / Other | 12 (100.0%) | 0 (0.0%) |
| Total | 287 (46.9%) | 325 (53.1%) |
Housing Structures by Number of Rooms in Gretna
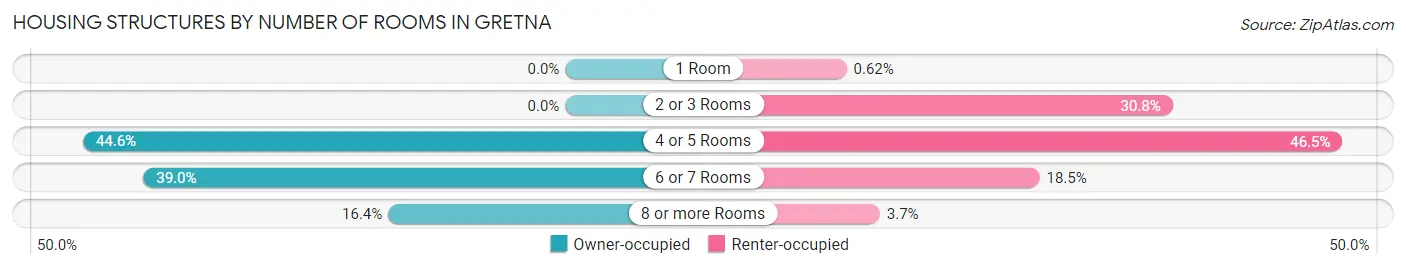
| Number of Rooms | Owner-occupied | Renter-occupied |
| 1 Room | 0 (0.0%) | 2 (0.6%) |
| 2 or 3 Rooms | 0 (0.0%) | 100 (30.8%) |
| 4 or 5 Rooms | 128 (44.6%) | 151 (46.5%) |
| 6 or 7 Rooms | 112 (39.0%) | 60 (18.5%) |
| 8 or more Rooms | 47 (16.4%) | 12 (3.7%) |
| Total | 287 (100.0%) | 325 (100.0%) |
Housing Structure by Heating Type in Gretna
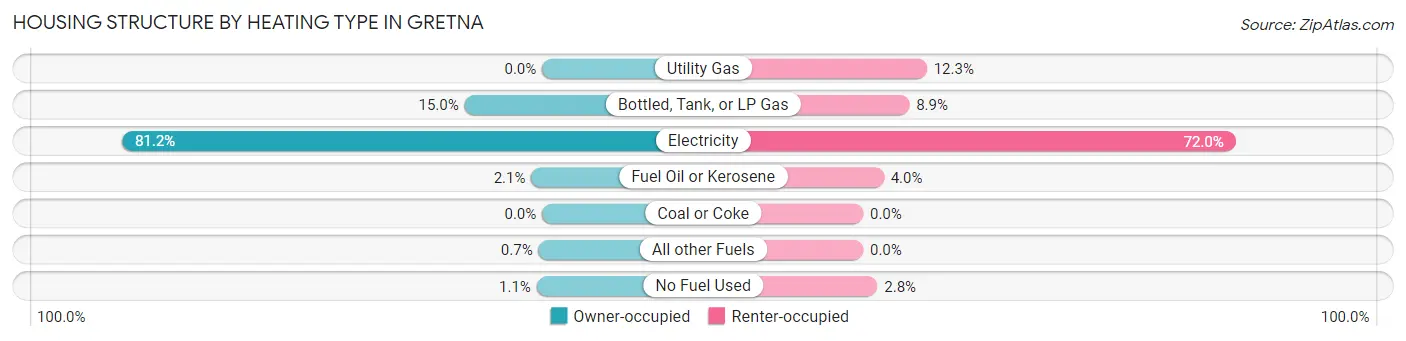
| Heating Type | Owner-occupied | Renter-occupied |
| Utility Gas | 0 (0.0%) | 40 (12.3%) |
| Bottled, Tank, or LP Gas | 43 (15.0%) | 29 (8.9%) |
| Electricity | 233 (81.2%) | 234 (72.0%) |
| Fuel Oil or Kerosene | 6 (2.1%) | 13 (4.0%) |
| Coal or Coke | 0 (0.0%) | 0 (0.0%) |
| All other Fuels | 2 (0.7%) | 0 (0.0%) |
| No Fuel Used | 3 (1.1%) | 9 (2.8%) |
| Total | 287 (100.0%) | 325 (100.0%) |
Household Vehicle Usage in Gretna
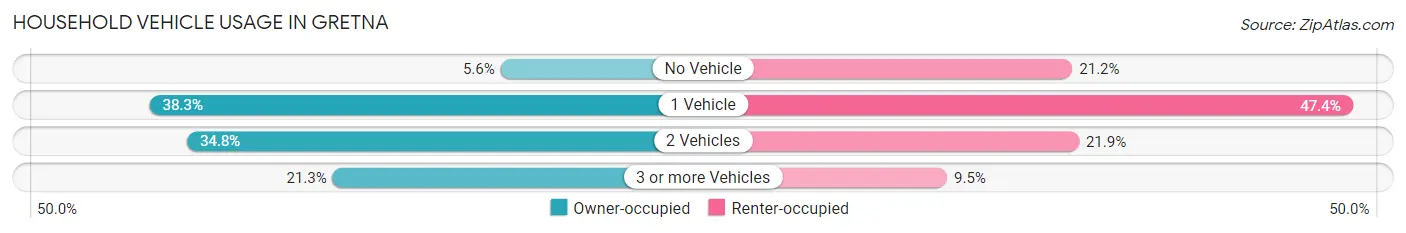
| Vehicles per Household | Owner-occupied | Renter-occupied |
| No Vehicle | 16 (5.6%) | 69 (21.2%) |
| 1 Vehicle | 110 (38.3%) | 154 (47.4%) |
| 2 Vehicles | 100 (34.8%) | 71 (21.8%) |
| 3 or more Vehicles | 61 (21.2%) | 31 (9.5%) |
| Total | 287 (100.0%) | 325 (100.0%) |
Real Estate & Mortgages in Gretna
Real Estate and Mortgage Overview in Gretna
| Characteristic | Without Mortgage | With Mortgage |
| Housing Units | 208 | 79 |
| Median Property Value | $138,100 | $133,900 |
| Median Household Income | $31,625 | $0 |
| Monthly Housing Costs | $371 | $0 |
| Real Estate Taxes | $828 | $0 |
Property Value by Mortgage Status in Gretna
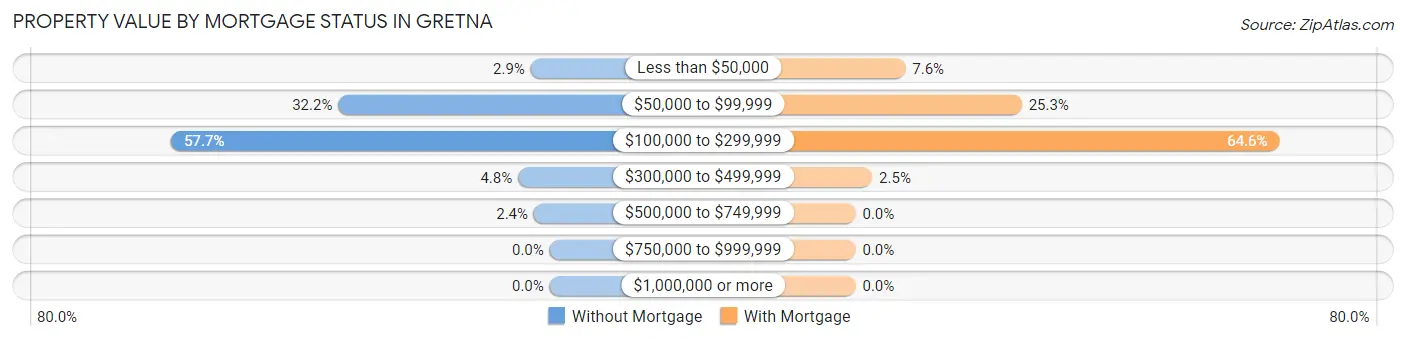
| Property Value | Without Mortgage | With Mortgage |
| Less than $50,000 | 6 (2.9%) | 6 (7.6%) |
| $50,000 to $99,999 | 67 (32.2%) | 20 (25.3%) |
| $100,000 to $299,999 | 120 (57.7%) | 51 (64.6%) |
| $300,000 to $499,999 | 10 (4.8%) | 2 (2.5%) |
| $500,000 to $749,999 | 5 (2.4%) | 0 (0.0%) |
| $750,000 to $999,999 | 0 (0.0%) | 0 (0.0%) |
| $1,000,000 or more | 0 (0.0%) | 0 (0.0%) |
| Total | 208 (100.0%) | 79 (100.0%) |
Household Income by Mortgage Status in Gretna
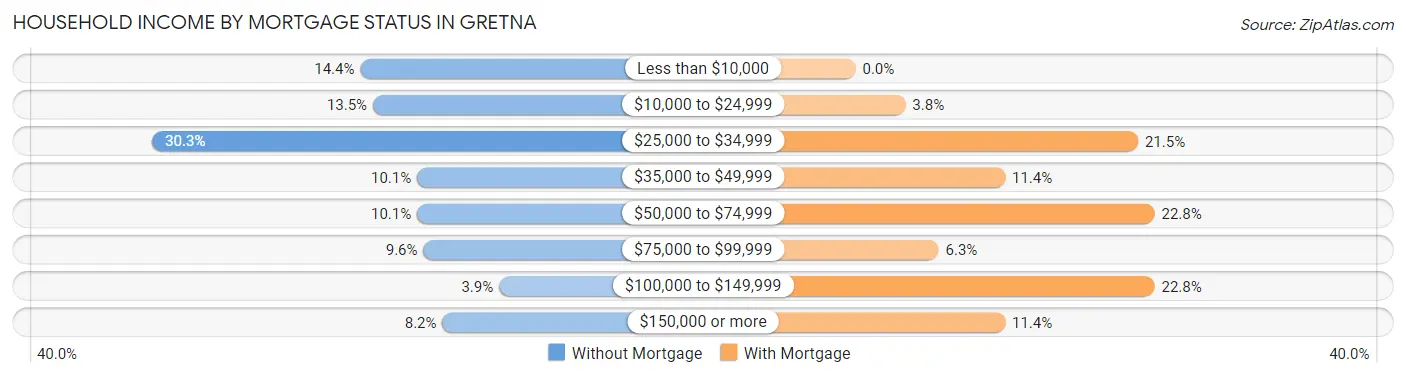
| Household Income | Without Mortgage | With Mortgage |
| Less than $10,000 | 30 (14.4%) | 0 (0.0%) |
| $10,000 to $24,999 | 28 (13.5%) | 3 (3.8%) |
| $25,000 to $34,999 | 63 (30.3%) | 17 (21.5%) |
| $35,000 to $49,999 | 21 (10.1%) | 9 (11.4%) |
| $50,000 to $74,999 | 21 (10.1%) | 18 (22.8%) |
| $75,000 to $99,999 | 20 (9.6%) | 5 (6.3%) |
| $100,000 to $149,999 | 8 (3.8%) | 18 (22.8%) |
| $150,000 or more | 17 (8.2%) | 9 (11.4%) |
| Total | 208 (100.0%) | 79 (100.0%) |
Property Value to Household Income Ratio in Gretna
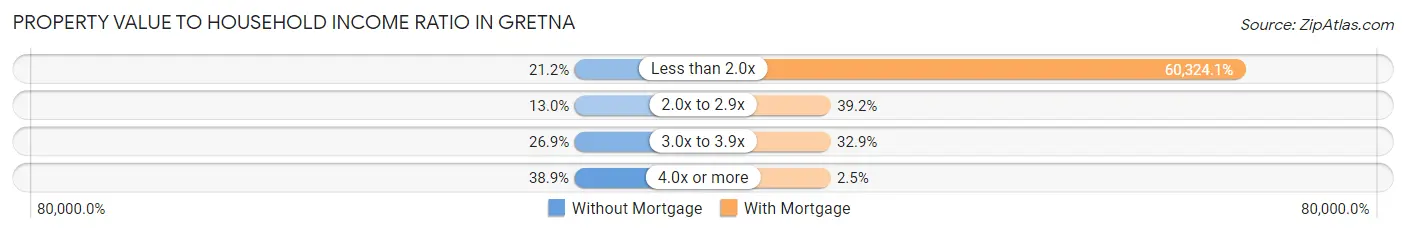
| Value-to-Income Ratio | Without Mortgage | With Mortgage |
| Less than 2.0x | 44 (21.1%) | 47,656 (60,324.0%) |
| 2.0x to 2.9x | 27 (13.0%) | 31 (39.2%) |
| 3.0x to 3.9x | 56 (26.9%) | 26 (32.9%) |
| 4.0x or more | 81 (38.9%) | 2 (2.5%) |
| Total | 208 (100.0%) | 79 (100.0%) |
Real Estate Taxes by Mortgage Status in Gretna
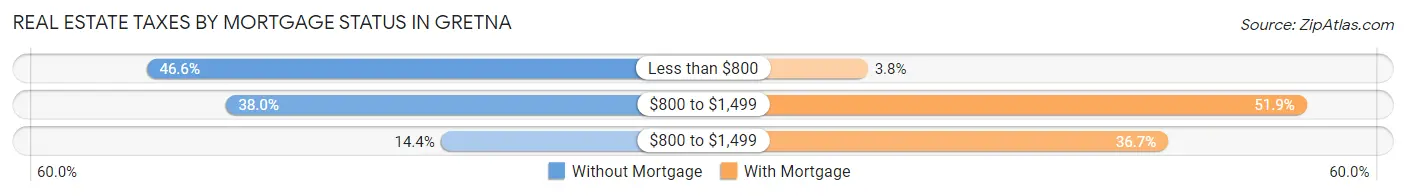
| Property Taxes | Without Mortgage | With Mortgage |
| Less than $800 | 97 (46.6%) | 3 (3.8%) |
| $800 to $1,499 | 79 (38.0%) | 41 (51.9%) |
| $800 to $1,499 | 30 (14.4%) | 29 (36.7%) |
| Total | 208 (100.0%) | 79 (100.0%) |
Health & Disability in Gretna
Health Insurance Coverage by Age in Gretna
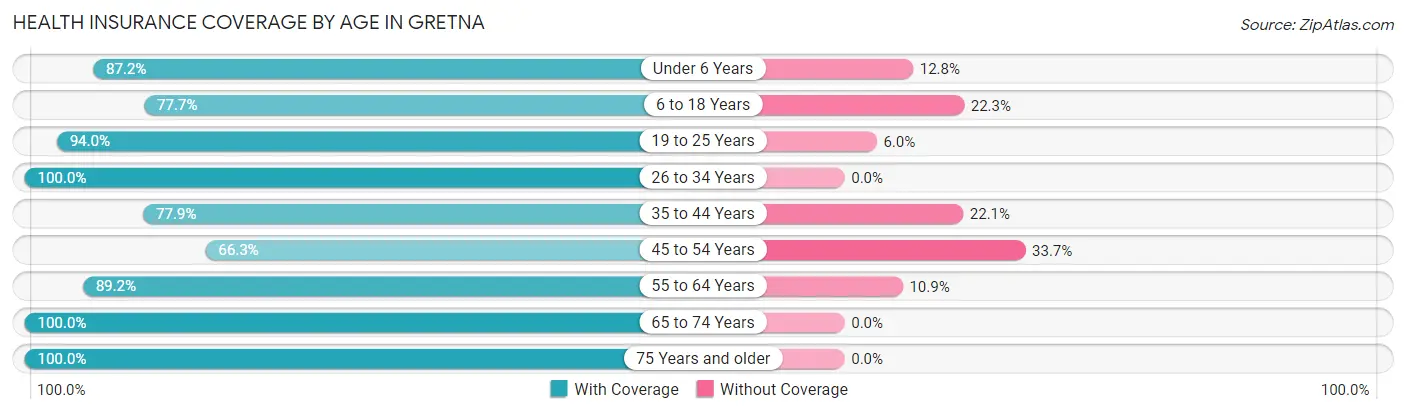
| Age Bracket | With Coverage | Without Coverage |
| Under 6 Years | 41 (87.2%) | 6 (12.8%) |
| 6 to 18 Years | 157 (77.7%) | 45 (22.3%) |
| 19 to 25 Years | 47 (94.0%) | 3 (6.0%) |
| 26 to 34 Years | 92 (100.0%) | 0 (0.0%) |
| 35 to 44 Years | 74 (77.9%) | 21 (22.1%) |
| 45 to 54 Years | 57 (66.3%) | 29 (33.7%) |
| 55 to 64 Years | 189 (89.1%) | 23 (10.8%) |
| 65 to 74 Years | 116 (100.0%) | 0 (0.0%) |
| 75 Years and older | 240 (100.0%) | 0 (0.0%) |
| Total | 1,013 (88.9%) | 127 (11.1%) |
Health Insurance Coverage by Citizenship Status in Gretna
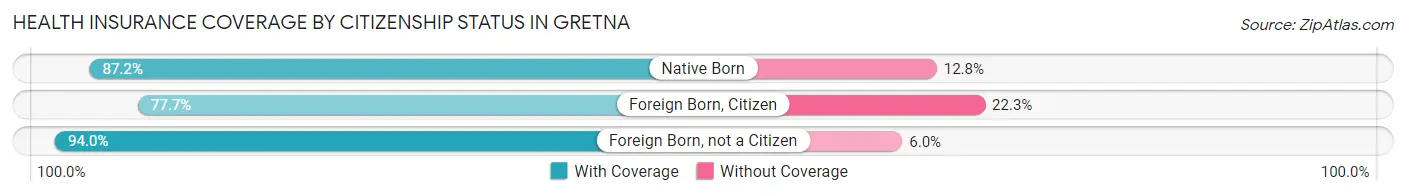
| Citizenship Status | With Coverage | Without Coverage |
| Native Born | 41 (87.2%) | 6 (12.8%) |
| Foreign Born, Citizen | 157 (77.7%) | 45 (22.3%) |
| Foreign Born, not a Citizen | 47 (94.0%) | 3 (6.0%) |
Health Insurance Coverage by Household Income in Gretna
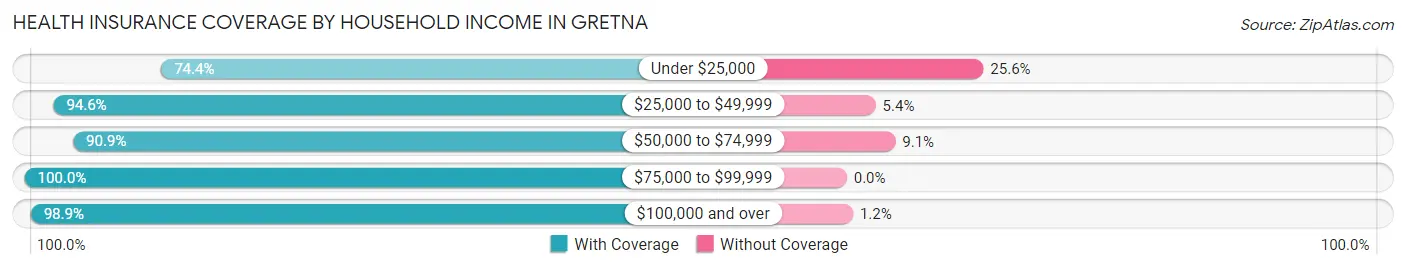
| Household Income | With Coverage | Without Coverage |
| Under $25,000 | 247 (74.4%) | 85 (25.6%) |
| $25,000 to $49,999 | 385 (94.6%) | 22 (5.4%) |
| $50,000 to $74,999 | 190 (90.9%) | 19 (9.1%) |
| $75,000 to $99,999 | 105 (100.0%) | 0 (0.0%) |
| $100,000 and over | 86 (98.9%) | 1 (1.1%) |
Public vs Private Health Insurance Coverage by Age in Gretna
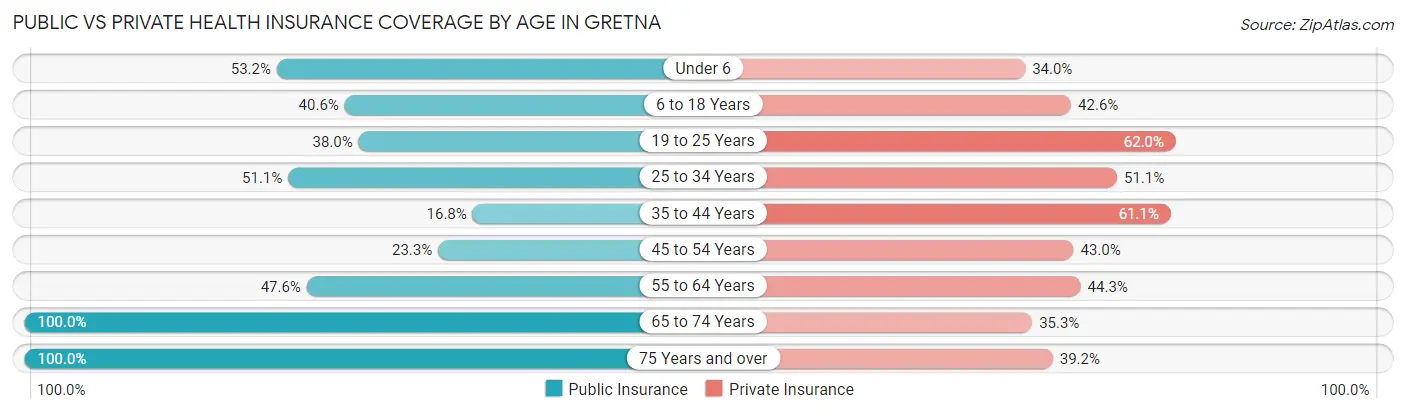
| Age Bracket | Public Insurance | Private Insurance |
| Under 6 | 25 (53.2%) | 16 (34.0%) |
| 6 to 18 Years | 82 (40.6%) | 86 (42.6%) |
| 19 to 25 Years | 19 (38.0%) | 31 (62.0%) |
| 25 to 34 Years | 47 (51.1%) | 47 (51.1%) |
| 35 to 44 Years | 16 (16.8%) | 58 (61.1%) |
| 45 to 54 Years | 20 (23.3%) | 37 (43.0%) |
| 55 to 64 Years | 101 (47.6%) | 94 (44.3%) |
| 65 to 74 Years | 116 (100.0%) | 41 (35.3%) |
| 75 Years and over | 240 (100.0%) | 94 (39.2%) |
| Total | 666 (58.4%) | 504 (44.2%) |
Disability Status by Sex by Age in Gretna
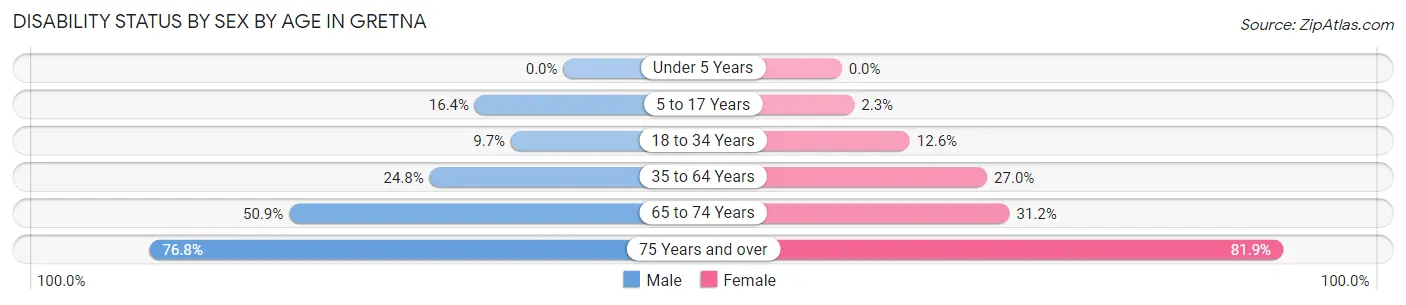
| Age Bracket | Male | Female |
| Under 5 Years | 0 (0.0%) | 0 (0.0%) |
| 5 to 17 Years | 11 (16.4%) | 2 (2.3%) |
| 18 to 34 Years | 11 (9.7%) | 11 (12.6%) |
| 35 to 64 Years | 35 (24.8%) | 68 (27.0%) |
| 65 to 74 Years | 28 (50.9%) | 19 (31.1%) |
| 75 Years and over | 53 (76.8%) | 140 (81.9%) |
Disability Class by Sex by Age in Gretna
Disability Class: Hearing Difficulty
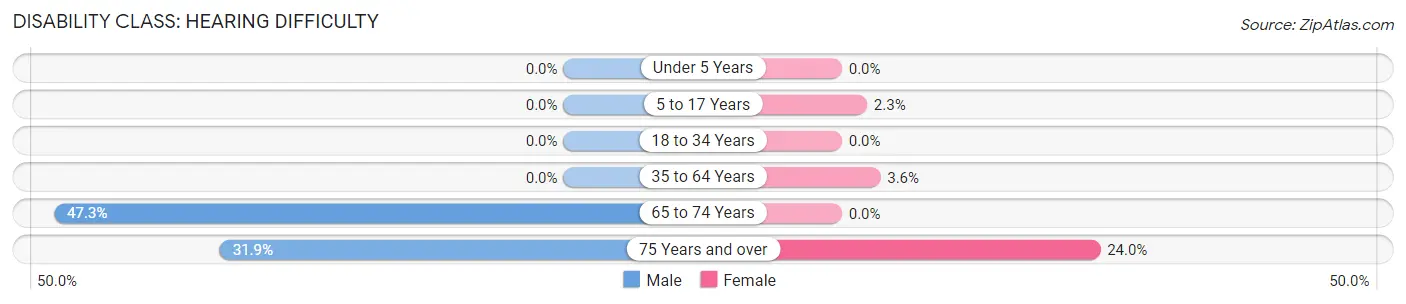
| Age Bracket | Male | Female |
| Under 5 Years | 0 (0.0%) | 0 (0.0%) |
| 5 to 17 Years | 0 (0.0%) | 2 (2.3%) |
| 18 to 34 Years | 0 (0.0%) | 0 (0.0%) |
| 35 to 64 Years | 0 (0.0%) | 9 (3.6%) |
| 65 to 74 Years | 26 (47.3%) | 0 (0.0%) |
| 75 Years and over | 22 (31.9%) | 41 (24.0%) |
Disability Class: Vision Difficulty
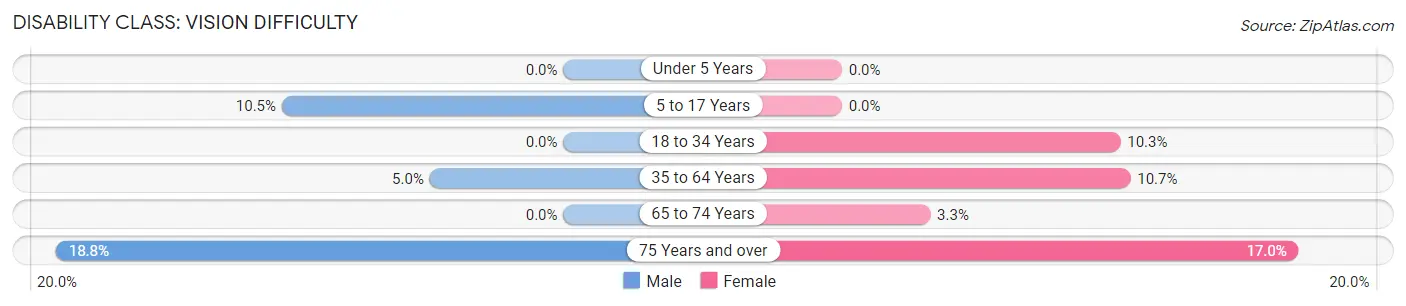
| Age Bracket | Male | Female |
| Under 5 Years | 0 (0.0%) | 0 (0.0%) |
| 5 to 17 Years | 7 (10.4%) | 0 (0.0%) |
| 18 to 34 Years | 0 (0.0%) | 9 (10.3%) |
| 35 to 64 Years | 7 (5.0%) | 27 (10.7%) |
| 65 to 74 Years | 0 (0.0%) | 2 (3.3%) |
| 75 Years and over | 13 (18.8%) | 29 (17.0%) |
Disability Class: Cognitive Difficulty
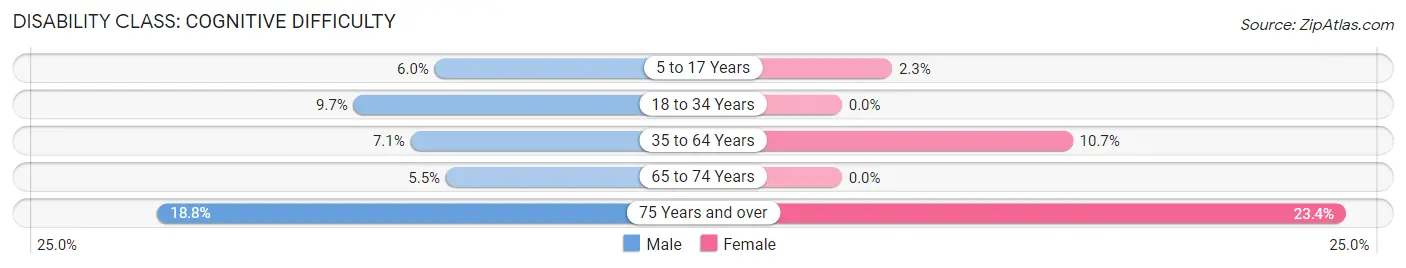
| Age Bracket | Male | Female |
| 5 to 17 Years | 4 (6.0%) | 2 (2.3%) |
| 18 to 34 Years | 11 (9.7%) | 0 (0.0%) |
| 35 to 64 Years | 10 (7.1%) | 27 (10.7%) |
| 65 to 74 Years | 3 (5.4%) | 0 (0.0%) |
| 75 Years and over | 13 (18.8%) | 40 (23.4%) |
Disability Class: Ambulatory Difficulty
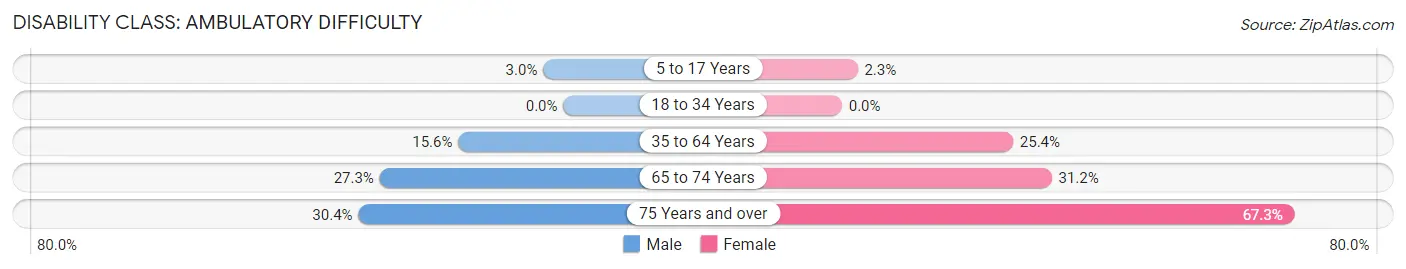
| Age Bracket | Male | Female |
| 5 to 17 Years | 2 (3.0%) | 2 (2.3%) |
| 18 to 34 Years | 0 (0.0%) | 0 (0.0%) |
| 35 to 64 Years | 22 (15.6%) | 64 (25.4%) |
| 65 to 74 Years | 15 (27.3%) | 19 (31.1%) |
| 75 Years and over | 21 (30.4%) | 115 (67.2%) |
Disability Class: Self-Care Difficulty
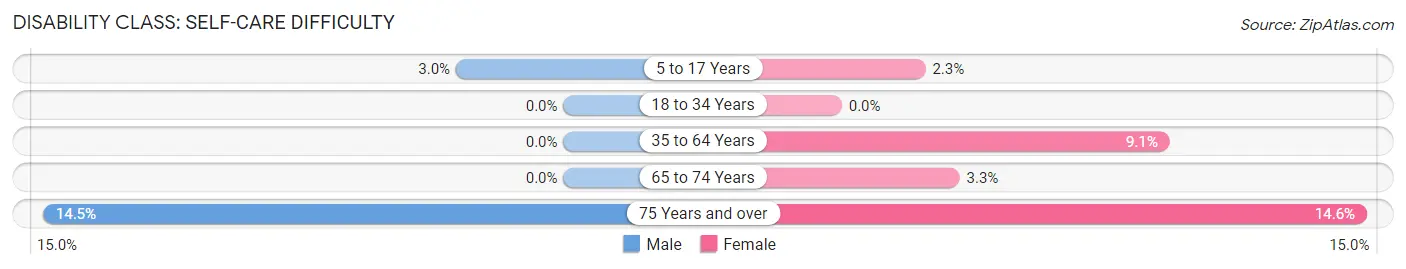
| Age Bracket | Male | Female |
| 5 to 17 Years | 2 (3.0%) | 2 (2.3%) |
| 18 to 34 Years | 0 (0.0%) | 0 (0.0%) |
| 35 to 64 Years | 0 (0.0%) | 23 (9.1%) |
| 65 to 74 Years | 0 (0.0%) | 2 (3.3%) |
| 75 Years and over | 10 (14.5%) | 25 (14.6%) |
Technology Access in Gretna
Computing Device Access in Gretna
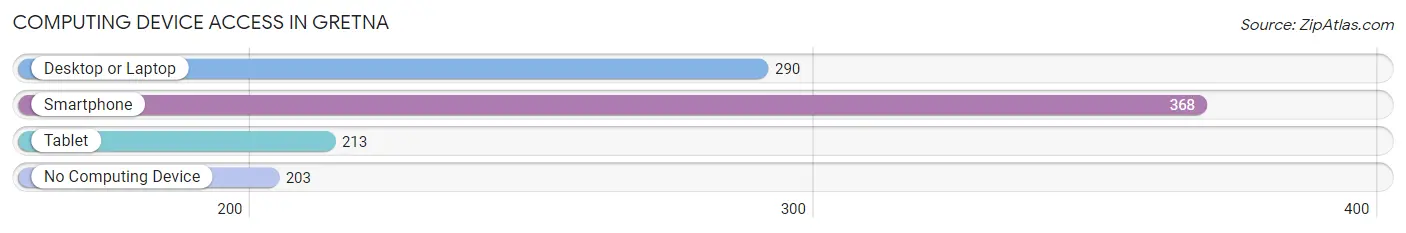
| Device Type | # Households | % Households |
| Desktop or Laptop | 290 | 47.4% |
| Smartphone | 368 | 60.1% |
| Tablet | 213 | 34.8% |
| No Computing Device | 203 | 33.2% |
| Total | 612 | 100.0% |
Internet Access in Gretna
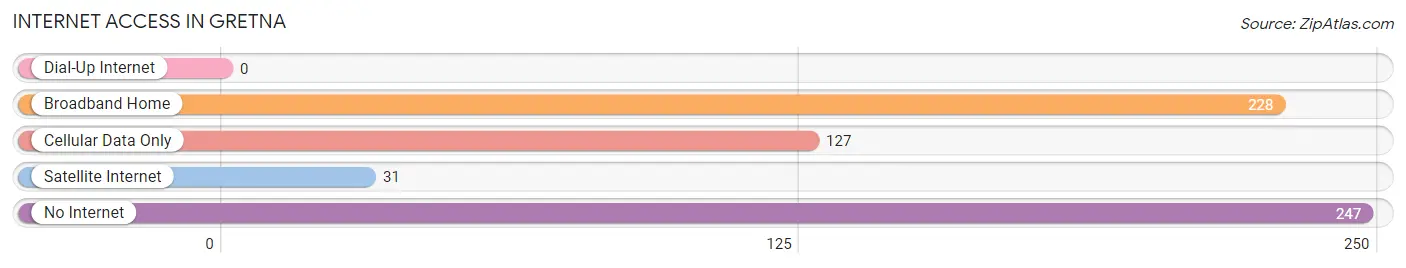
| Internet Type | # Households | % Households |
| Dial-Up Internet | 0 | 0.0% |
| Broadband Home | 228 | 37.2% |
| Cellular Data Only | 127 | 20.7% |
| Satellite Internet | 31 | 5.1% |
| No Internet | 247 | 40.4% |
| Total | 612 | 100.0% |
Gretna Summary
Gretna is a small town located in Pittsylvania County, Virginia. It is situated in the foothills of the Blue Ridge Mountains, about 25 miles south of Lynchburg. The town was founded in 1790 and has a population of 1,845 as of the 2010 census.
History
Gretna was founded in 1790 by a group of settlers from Pennsylvania. The town was named after the Scottish town of Gretna Green, which was known for its elopements. The town was originally a farming community, but it soon became a center for the production of tobacco and other agricultural products.
In the late 19th century, Gretna became a popular tourist destination due to its proximity to the Blue Ridge Mountains. The town was also home to several resorts, including the Gretna Inn, which was built in 1891.
Geography
Gretna is located in Pittsylvania County, Virginia. It is situated in the foothills of the Blue Ridge Mountains, about 25 miles south of Lynchburg. The town is located at the intersection of US Route 29 and State Route 40.
The town has a total area of 1.3 square miles, all of which is land. The terrain is mostly flat, with some rolling hills. The town is located in a humid subtropical climate zone, with hot, humid summers and mild winters.
Economy
Gretna’s economy is largely based on agriculture. The town is home to several farms, which produce tobacco, corn, soybeans, and other crops. The town is also home to several small businesses, including restaurants, retail stores, and service providers.
Demographics
As of the 2010 census, Gretna had a population of 1,845. The racial makeup of the town was 87.3% White, 9.2% African American, 0.7% Native American, 0.3% Asian, 0.1% Pacific Islander, and 2.4% from other races. The median household income was $31,250, and the median family income was $37,500.
Conclusion
Gretna is a small town located in Pittsylvania County, Virginia. It was founded in 1790 and has a population of 1,845 as of the 2010 census. The town is situated in the foothills of the Blue Ridge Mountains and is a popular tourist destination. The economy is largely based on agriculture, and the town is home to several small businesses. The racial makeup of the town is mostly White, with a small percentage of African Americans, Native Americans, Asians, and Pacific Islanders.
Common Questions
What is Per Capita Income in Gretna?
Per Capita income in Gretna is $21,884.
What is the Median Family Income in Gretna?
Median Family Income in Gretna is $41,800.
What is the Median Household income in Gretna?
Median Household Income in Gretna is $29,667.
What is Income or Wage Gap in Gretna?
Income or Wage Gap in Gretna is 29.0%.
Women in Gretna earn 71.0 cents for every dollar earned by a man.
What is Inequality or Gini Index in Gretna?
Inequality or Gini Index in Gretna is 0.47.
What is the Total Population of Gretna?
Total Population of Gretna is 1,227.
What is the Total Male Population of Gretna?
Total Male Population of Gretna is 472.
What is the Total Female Population of Gretna?
Total Female Population of Gretna is 755.
What is the Ratio of Males per 100 Females in Gretna?
There are 62.52 Males per 100 Females in Gretna.
What is the Ratio of Females per 100 Males in Gretna?
There are 159.96 Females per 100 Males in Gretna.
What is the Median Population Age in Gretna?
Median Population Age in Gretna is 57.1 Years.
What is the Average Family Size in Gretna
Average Family Size in Gretna is 2.8 People.
What is the Average Household Size in Gretna
Average Household Size in Gretna is 1.9 People.
How Large is the Labor Force in Gretna?
There are 413 People in the Labor Forcein in Gretna.
What is the Percentage of People in the Labor Force in Gretna?
38.8% of People are in the Labor Force in Gretna.
What is the Unemployment Rate in Gretna?
Unemployment Rate in Gretna is 5.1%.