Matoaca, VA Map & Demographics
Matoaca Map
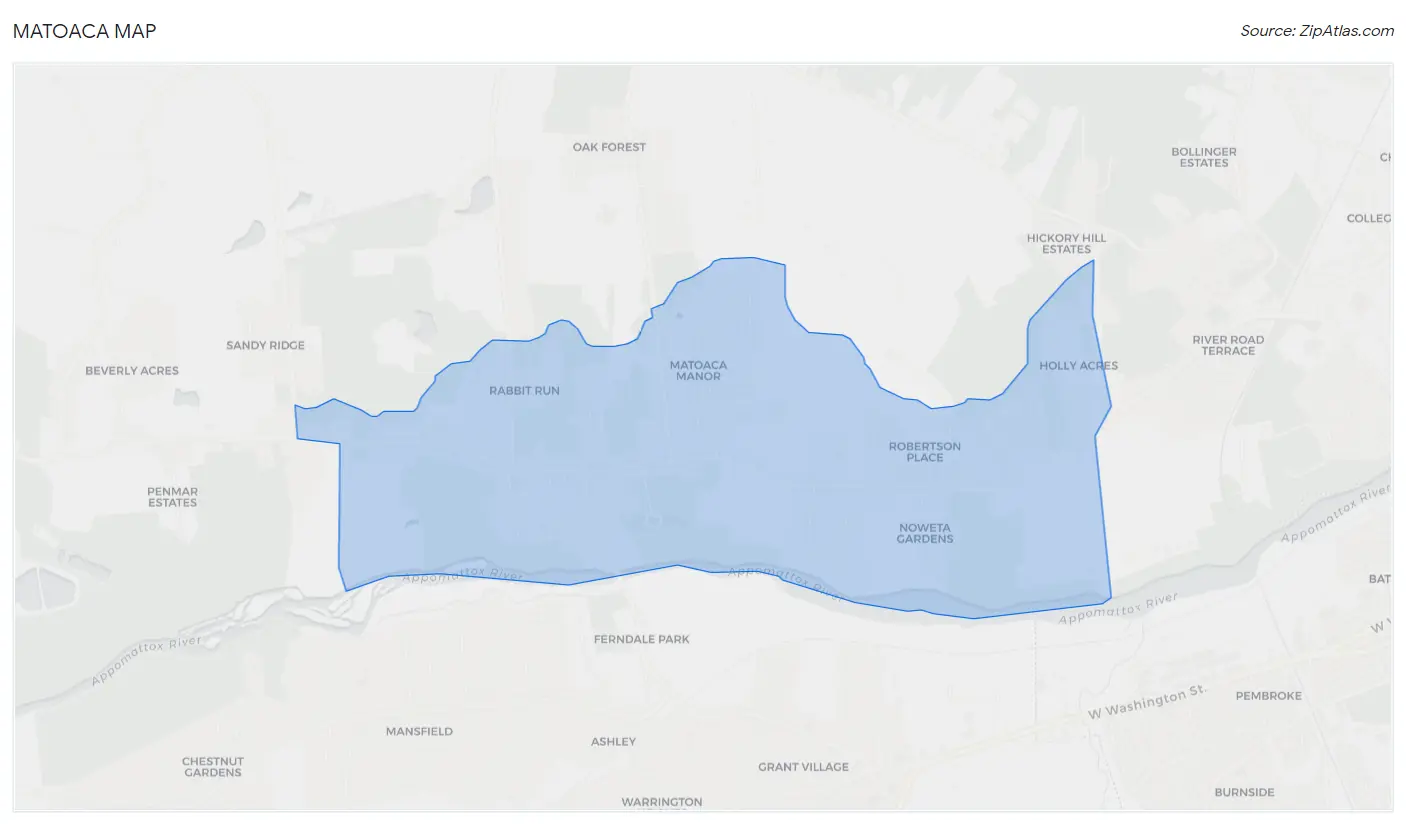
Matoaca Overview
$30,697
PER CAPITA INCOME
$70,317
AVG FAMILY INCOME
$54,966
AVG HOUSEHOLD INCOME
22.3%
WAGE / INCOME GAP [ % ]
77.7¢/ $1
WAGE / INCOME GAP [ $ ]
0.35
INEQUALITY / GINI INDEX
2,374
TOTAL POPULATION
1,013
MALE POPULATION
1,361
FEMALE POPULATION
74.43
MALES / 100 FEMALES
134.35
FEMALES / 100 MALES
31.3
MEDIAN AGE
2.9
AVG FAMILY SIZE
2.4
AVG HOUSEHOLD SIZE
1,358
LABOR FORCE [ PEOPLE ]
77.4%
PERCENT IN LABOR FORCE
Income in Matoaca
Income Overview in Matoaca
Per Capita Income in Matoaca is $30,697, while median incomes of families and households are $70,317 and $54,966 respectively.
| Characteristic | Number | Measure |
| Per Capita Income | 2,374 | $30,697 |
| Median Family Income | 669 | $70,317 |
| Mean Family Income | 669 | $90,234 |
| Median Household Income | 982 | $54,966 |
| Mean Household Income | 982 | $77,926 |
| Income Deficit | 669 | $0 |
| Wage / Income Gap (%) | 2,374 | 22.27% |
| Wage / Income Gap ($) | 2,374 | 77.73¢ per $1 |
| Gini / Inequality Index | 2,374 | 0.35 |
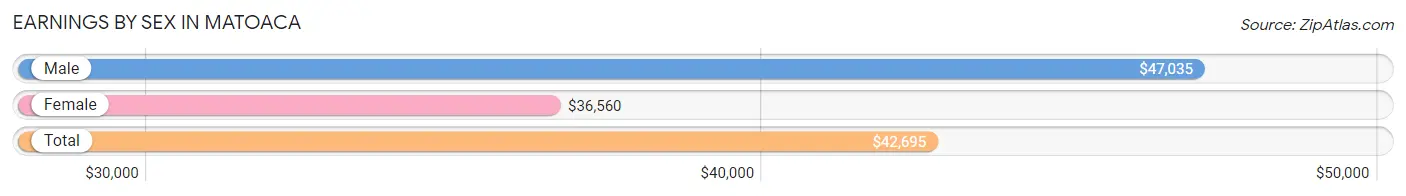
Earnings by Sex in Matoaca
Average Earnings in Matoaca are $42,695, $47,035 for men and $36,560 for women, a difference of 22.3%.
| Sex | Number | Average Earnings |
| Male | 636 (43.3%) | $47,035 |
| Female | 833 (56.7%) | $36,560 |
| Total | 1,469 (100.0%) | $42,695 |
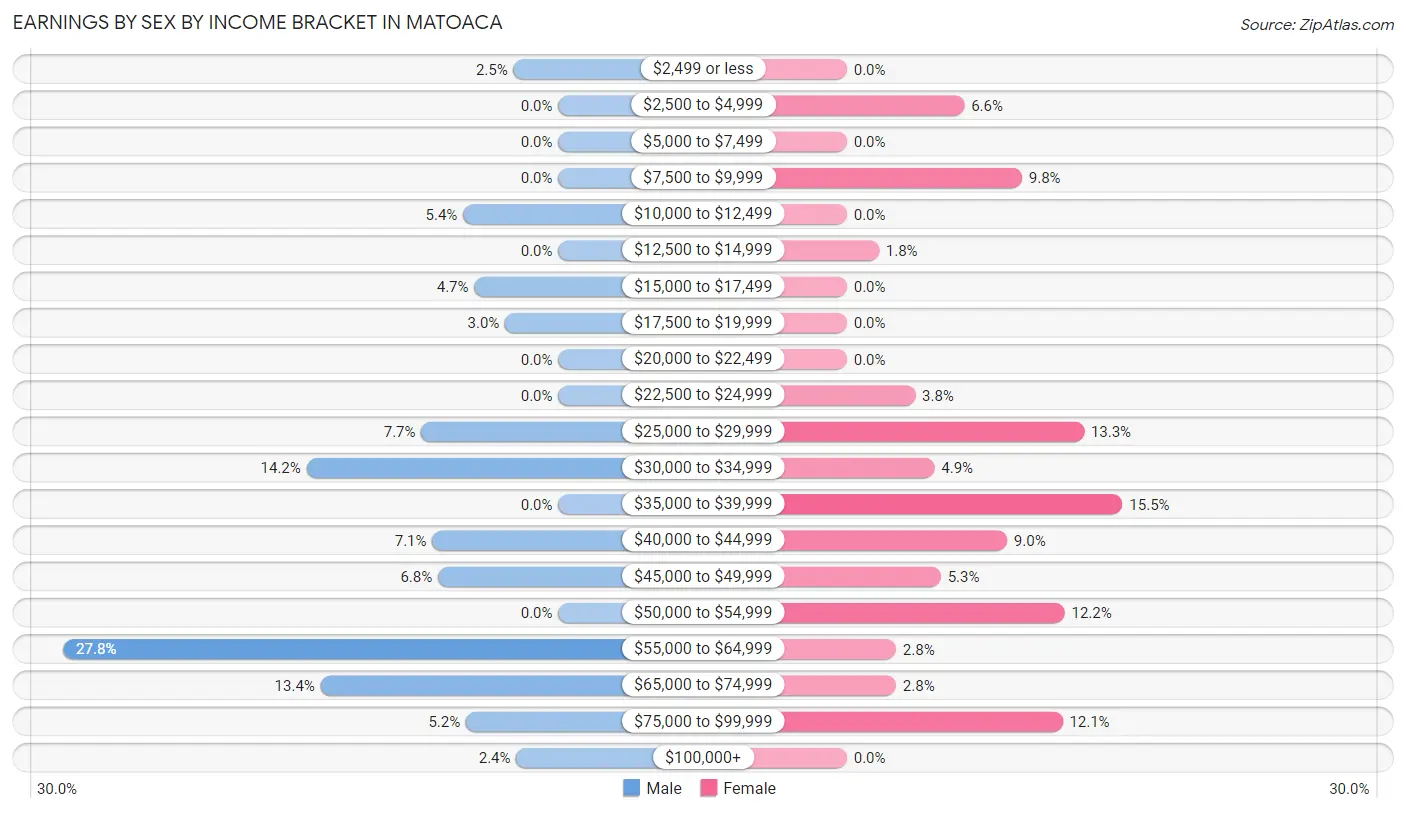
Earnings by Sex by Income Bracket in Matoaca
The most common earnings brackets in Matoaca are $55,000 to $64,999 for men (177 | 27.8%) and $35,000 to $39,999 for women (129 | 15.5%).
| Income | Male | Female |
| $2,499 or less | 16 (2.5%) | 0 (0.0%) |
| $2,500 to $4,999 | 0 (0.0%) | 55 (6.6%) |
| $5,000 to $7,499 | 0 (0.0%) | 0 (0.0%) |
| $7,500 to $9,999 | 0 (0.0%) | 82 (9.8%) |
| $10,000 to $12,499 | 34 (5.3%) | 0 (0.0%) |
| $12,500 to $14,999 | 0 (0.0%) | 15 (1.8%) |
| $15,000 to $17,499 | 30 (4.7%) | 0 (0.0%) |
| $17,500 to $19,999 | 19 (3.0%) | 0 (0.0%) |
| $20,000 to $22,499 | 0 (0.0%) | 0 (0.0%) |
| $22,500 to $24,999 | 0 (0.0%) | 32 (3.8%) |
| $25,000 to $29,999 | 49 (7.7%) | 111 (13.3%) |
| $30,000 to $34,999 | 90 (14.1%) | 41 (4.9%) |
| $35,000 to $39,999 | 0 (0.0%) | 129 (15.5%) |
| $40,000 to $44,999 | 45 (7.1%) | 75 (9.0%) |
| $45,000 to $49,999 | 43 (6.8%) | 44 (5.3%) |
| $50,000 to $54,999 | 0 (0.0%) | 102 (12.2%) |
| $55,000 to $64,999 | 177 (27.8%) | 23 (2.8%) |
| $65,000 to $74,999 | 85 (13.4%) | 23 (2.8%) |
| $75,000 to $99,999 | 33 (5.2%) | 101 (12.1%) |
| $100,000+ | 15 (2.4%) | 0 (0.0%) |
| Total | 636 (100.0%) | 833 (100.0%) |
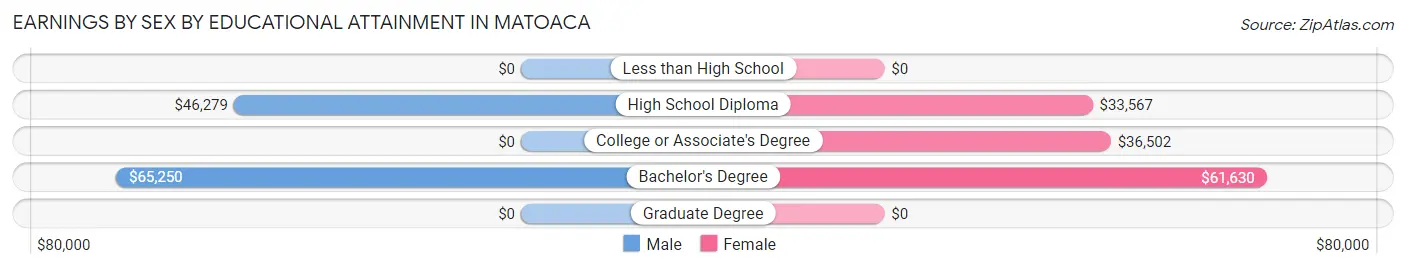
Earnings by Sex by Educational Attainment in Matoaca
Average earnings in Matoaca are $60,324 for men and $37,345 for women, a difference of 38.1%. Men with an educational attainment of bachelor's degree enjoy the highest average annual earnings of $65,250, while those with high school diploma education earn the least with $46,279. Women with an educational attainment of bachelor's degree earn the most with the average annual earnings of $61,630, while those with high school diploma education have the smallest earnings of $33,567.
| Educational Attainment | Male Income | Female Income |
| Less than High School | - | - |
| High School Diploma | $46,279 | $33,567 |
| College or Associate's Degree | - | - |
| Bachelor's Degree | $65,250 | $61,630 |
| Graduate Degree | - | - |
| Total | $60,324 | $37,345 |
Family Income in Matoaca
Family Income Brackets in Matoaca
According to the Matoaca family income data, there are 187 families falling into the $50,000 to $74,999 income range, which is the most common income bracket and makes up 28.0% of all families.
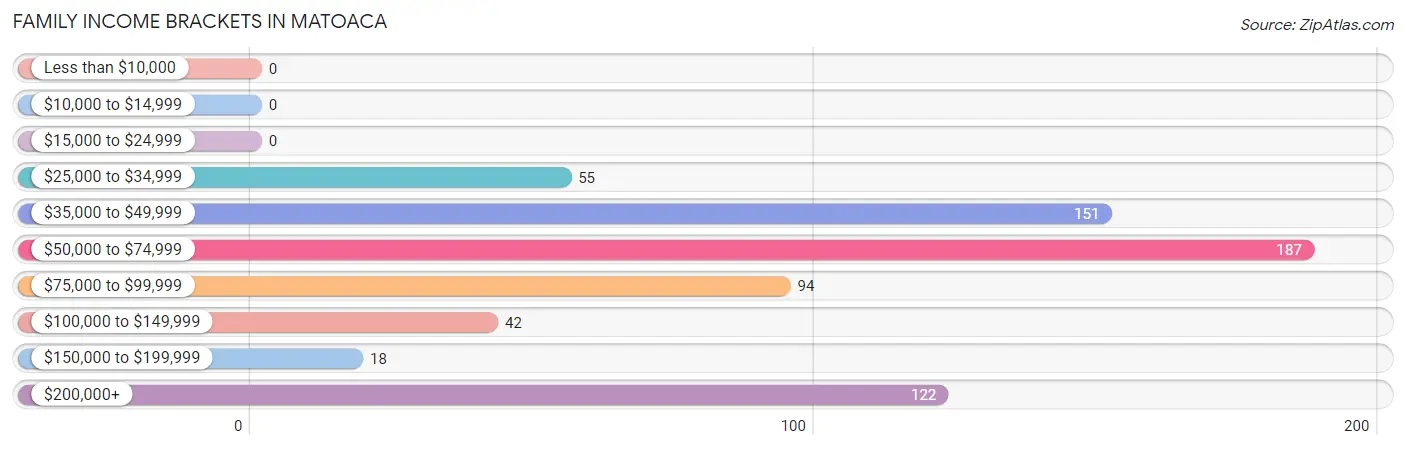
| Income Bracket | # Families | % Families |
| Less than $10,000 | 0 | 0.0% |
| $10,000 to $14,999 | 0 | 0.0% |
| $15,000 to $24,999 | 0 | 0.0% |
| $25,000 to $34,999 | 55 | 8.2% |
| $35,000 to $49,999 | 151 | 22.6% |
| $50,000 to $74,999 | 187 | 28.0% |
| $75,000 to $99,999 | 94 | 14.1% |
| $100,000 to $149,999 | 42 | 6.3% |
| $150,000 to $199,999 | 18 | 2.7% |
| $200,000+ | 122 | 18.2% |
Family Income by Famaliy Size in Matoaca
4-person families (145 | 21.7%) account for the highest median family income in Matoaca with $70,653 per family, while 2-person families (210 | 31.4%) have the highest median income of $26,652 per family member.
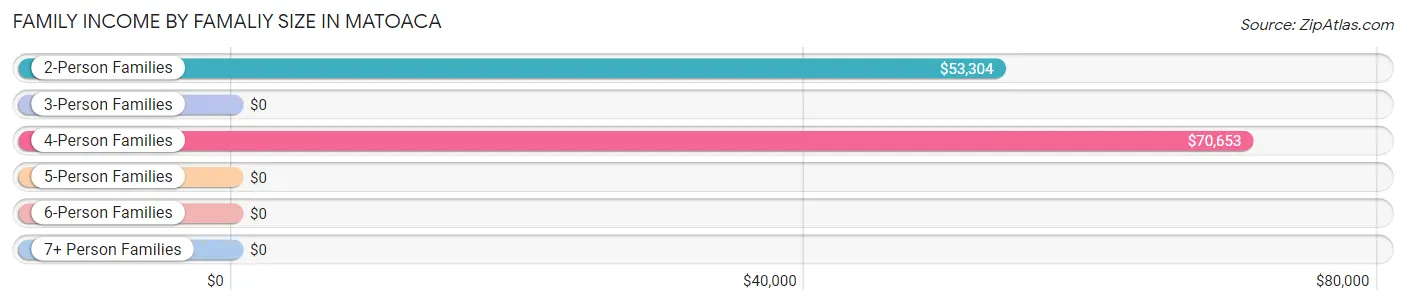
| Income Bracket | # Families | Median Income |
| 2-Person Families | 210 (31.4%) | $53,304 |
| 3-Person Families | 207 (30.9%) | $0 |
| 4-Person Families | 145 (21.7%) | $70,653 |
| 5-Person Families | 107 (16.0%) | $0 |
| 6-Person Families | 0 (0.0%) | $0 |
| 7+ Person Families | 0 (0.0%) | $0 |
| Total | 669 (100.0%) | $70,317 |
Family Income by Number of Earners in Matoaca
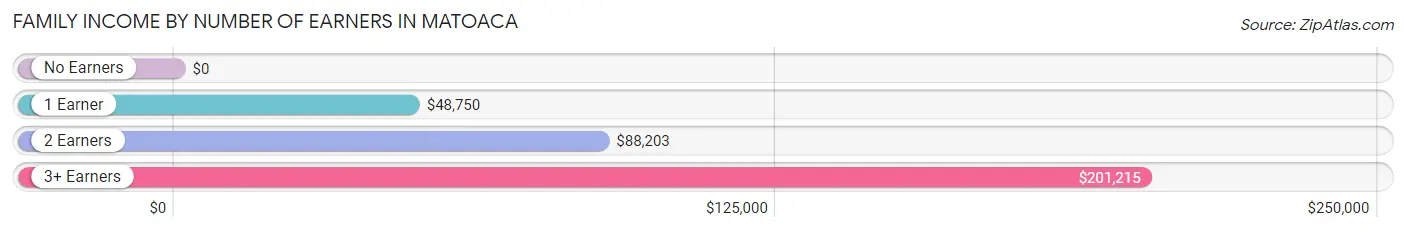
| Number of Earners | # Families | Median Income |
| No Earners | 21 (3.1%) | $0 |
| 1 Earner | 292 (43.6%) | $48,750 |
| 2 Earners | 216 (32.3%) | $88,203 |
| 3+ Earners | 140 (20.9%) | $201,215 |
| Total | 669 (100.0%) | $70,317 |
Household Income in Matoaca
Household Income Brackets in Matoaca
With 316 households falling in the category, the $50,000 to $74,999 income range is the most frequent in Matoaca, accounting for 32.2% of all households.
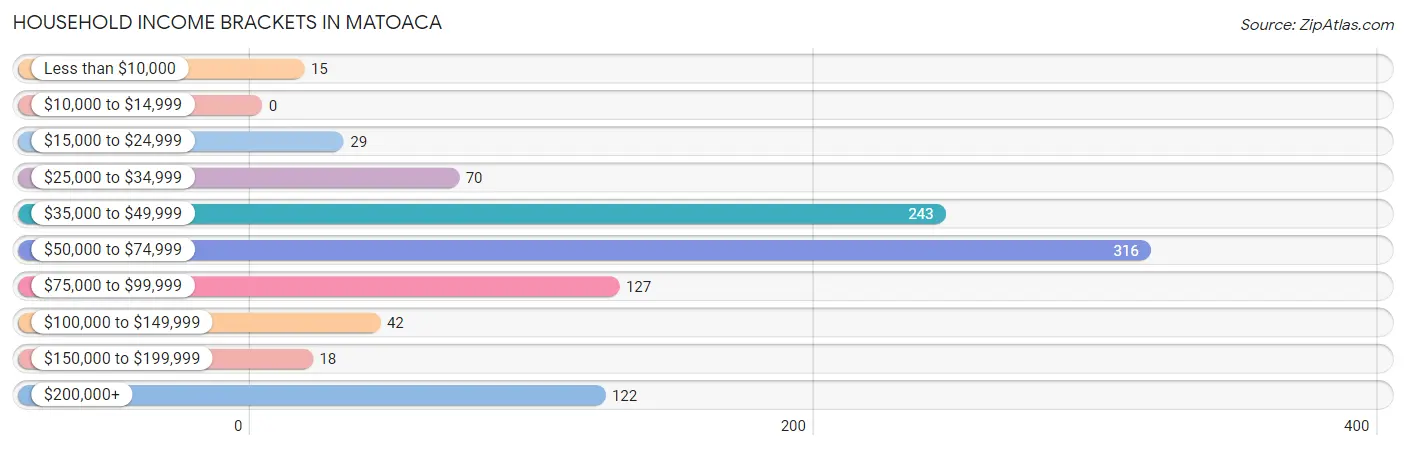
| Income Bracket | # Households | % Households |
| Less than $10,000 | 15 | 1.5% |
| $10,000 to $14,999 | 0 | 0.0% |
| $15,000 to $24,999 | 29 | 3.0% |
| $25,000 to $34,999 | 70 | 7.1% |
| $35,000 to $49,999 | 243 | 24.7% |
| $50,000 to $74,999 | 316 | 32.2% |
| $75,000 to $99,999 | 127 | 12.9% |
| $100,000 to $149,999 | 42 | 4.3% |
| $150,000 to $199,999 | 18 | 1.8% |
| $200,000+ | 122 | 12.4% |
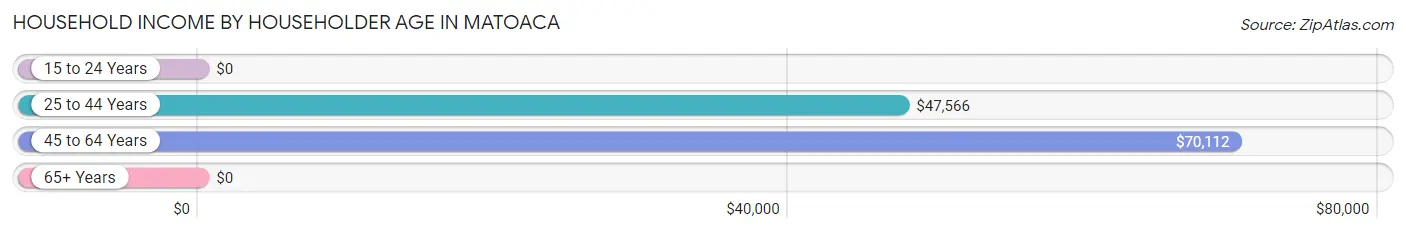
Household Income by Householder Age in Matoaca
The median household income in Matoaca is $54,966, with the highest median household income of $70,112 found in the 45 to 64 years age bracket for the primary householder. A total of 332 households (33.8%) fall into this category. Meanwhile, the 15 to 24 years age bracket for the primary householder has the lowest median household income of $0, with 24 households (2.4%) in this group.
| Income Bracket | # Households | Median Income |
| 15 to 24 Years | 24 (2.4%) | $0 |
| 25 to 44 Years | 403 (41.0%) | $47,566 |
| 45 to 64 Years | 332 (33.8%) | $70,112 |
| 65+ Years | 223 (22.7%) | $0 |
| Total | 982 (100.0%) | $54,966 |
Poverty in Matoaca
Income Below Poverty by Sex and Age in Matoaca
With 5.1% poverty level for males and 6.1% for females among the residents of Matoaca, 18 to 24 year old males and 18 to 24 year old females are the most vulnerable to poverty, with 34 males (27.0%) and 50 females (100.0%) in their respective age groups living below the poverty level.
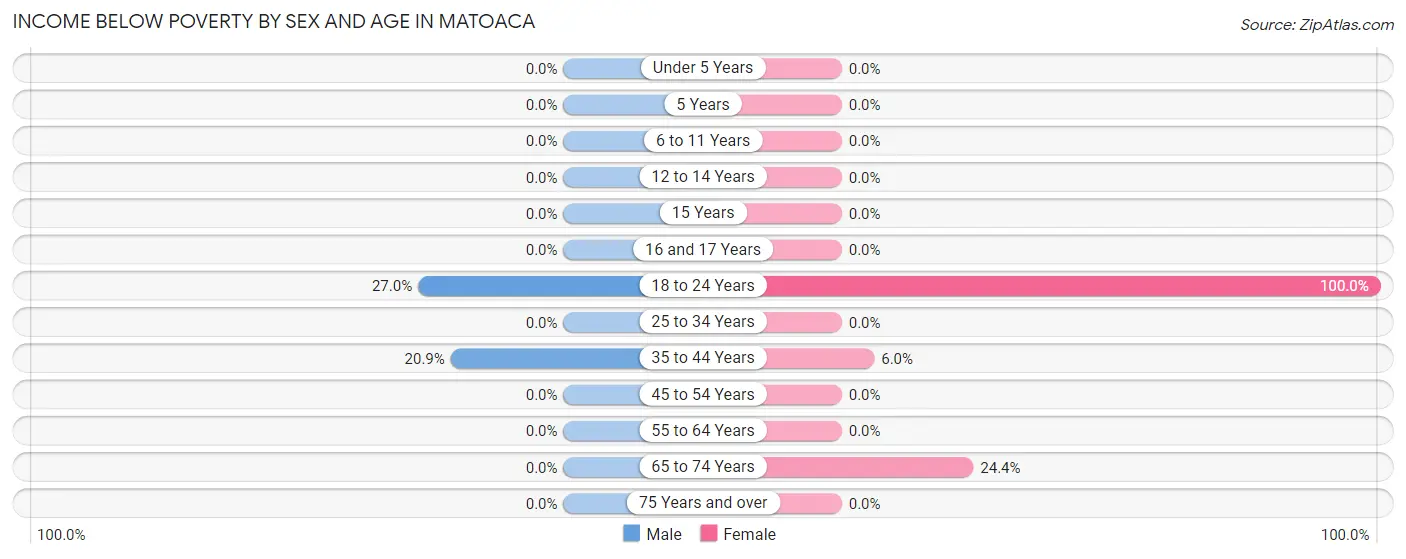
| Age Bracket | Male | Female |
| Under 5 Years | 0 (0.0%) | 0 (0.0%) |
| 5 Years | 0 (0.0%) | 0 (0.0%) |
| 6 to 11 Years | 0 (0.0%) | 0 (0.0%) |
| 12 to 14 Years | 0 (0.0%) | 0 (0.0%) |
| 15 Years | 0 (0.0%) | 0 (0.0%) |
| 16 and 17 Years | 0 (0.0%) | 0 (0.0%) |
| 18 to 24 Years | 34 (27.0%) | 50 (100.0%) |
| 25 to 34 Years | 0 (0.0%) | 0 (0.0%) |
| 35 to 44 Years | 18 (20.9%) | 12 (6.0%) |
| 45 to 54 Years | 0 (0.0%) | 0 (0.0%) |
| 55 to 64 Years | 0 (0.0%) | 0 (0.0%) |
| 65 to 74 Years | 0 (0.0%) | 21 (24.4%) |
| 75 Years and over | 0 (0.0%) | 0 (0.0%) |
| Total | 52 (5.1%) | 83 (6.1%) |
Income Above Poverty by Sex and Age in Matoaca
According to the poverty statistics in Matoaca, males aged under 5 years and females aged under 5 years are the age groups that are most secure financially, with 100.0% of males and 100.0% of females in these age groups living above the poverty line.
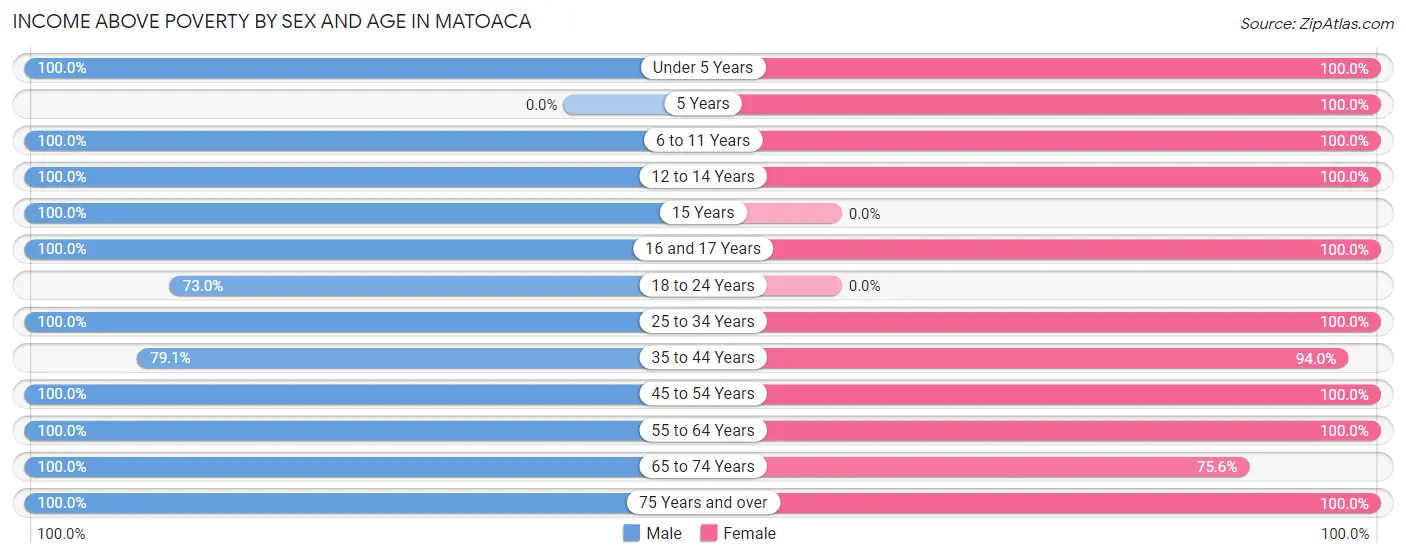
| Age Bracket | Male | Female |
| Under 5 Years | 109 (100.0%) | 44 (100.0%) |
| 5 Years | 0 (0.0%) | 133 (100.0%) |
| 6 to 11 Years | 36 (100.0%) | 34 (100.0%) |
| 12 to 14 Years | 95 (100.0%) | 131 (100.0%) |
| 15 Years | 38 (100.0%) | 0 (0.0%) |
| 16 and 17 Years | 42 (100.0%) | 55 (100.0%) |
| 18 to 24 Years | 92 (73.0%) | 0 (0.0%) |
| 25 to 34 Years | 121 (100.0%) | 278 (100.0%) |
| 35 to 44 Years | 68 (79.1%) | 187 (94.0%) |
| 45 to 54 Years | 161 (100.0%) | 243 (100.0%) |
| 55 to 64 Years | 19 (100.0%) | 72 (100.0%) |
| 65 to 74 Years | 125 (100.0%) | 65 (75.6%) |
| 75 Years and over | 55 (100.0%) | 36 (100.0%) |
| Total | 961 (94.9%) | 1,278 (93.9%) |
Income Below Poverty Among Married-Couple Families in Matoaca
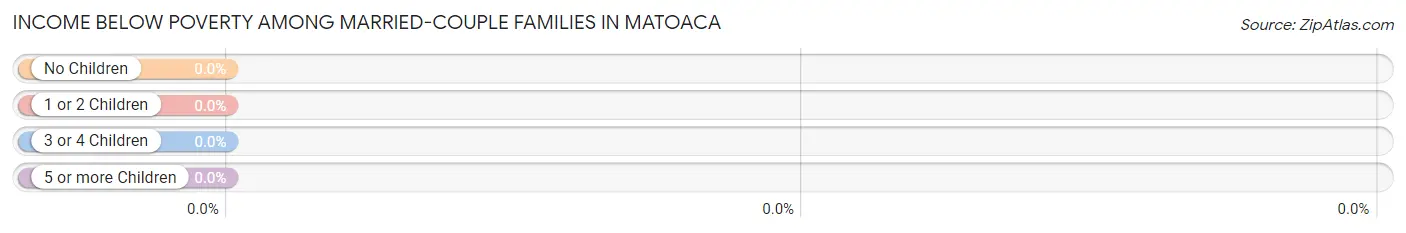
| Children | Above Poverty | Below Poverty |
| No Children | 79 (100.0%) | 0 (0.0%) |
| 1 or 2 Children | 230 (100.0%) | 0 (0.0%) |
| 3 or 4 Children | 0 (0.0%) | 0 (0.0%) |
| 5 or more Children | 0 (0.0%) | 0 (0.0%) |
| Total | 309 (100.0%) | 0 (0.0%) |
Income Below Poverty Among Single-Parent Households in Matoaca
| Children | Single Father | Single Mother |
| No Children | 0 (0.0%) | 0 (0.0%) |
| 1 or 2 Children | 0 (0.0%) | 0 (0.0%) |
| 3 or 4 Children | 0 (0.0%) | 0 (0.0%) |
| 5 or more Children | 0 (0.0%) | 0 (0.0%) |
| Total | 0 (0.0%) | 0 (0.0%) |
Income Below Poverty Among Married-Couple vs Single-Parent Households in Matoaca
| Children | Married-Couple Families | Single-Parent Households |
| No Children | 0 (0.0%) | 0 (0.0%) |
| 1 or 2 Children | 0 (0.0%) | 0 (0.0%) |
| 3 or 4 Children | 0 (0.0%) | 0 (0.0%) |
| 5 or more Children | 0 (0.0%) | 0 (0.0%) |
| Total | 0 (0.0%) | 0 (0.0%) |
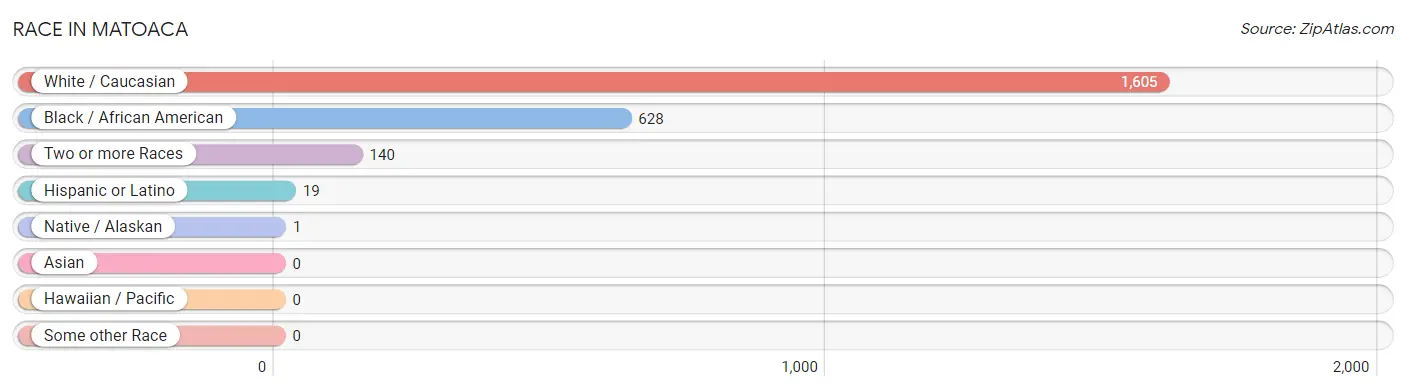
Race in Matoaca
The most populous races in Matoaca are White / Caucasian (1,605 | 67.6%), Black / African American (628 | 26.5%), and Two or more Races (140 | 5.9%).
| Race | # Population | % Population |
| Asian | 0 | 0.0% |
| Black / African American | 628 | 26.5% |
| Hawaiian / Pacific | 0 | 0.0% |
| Hispanic or Latino | 19 | 0.8% |
| Native / Alaskan | 1 | 0.0% |
| White / Caucasian | 1,605 | 67.6% |
| Two or more Races | 140 | 5.9% |
| Some other Race | 0 | 0.0% |
| Total | 2,374 | 100.0% |
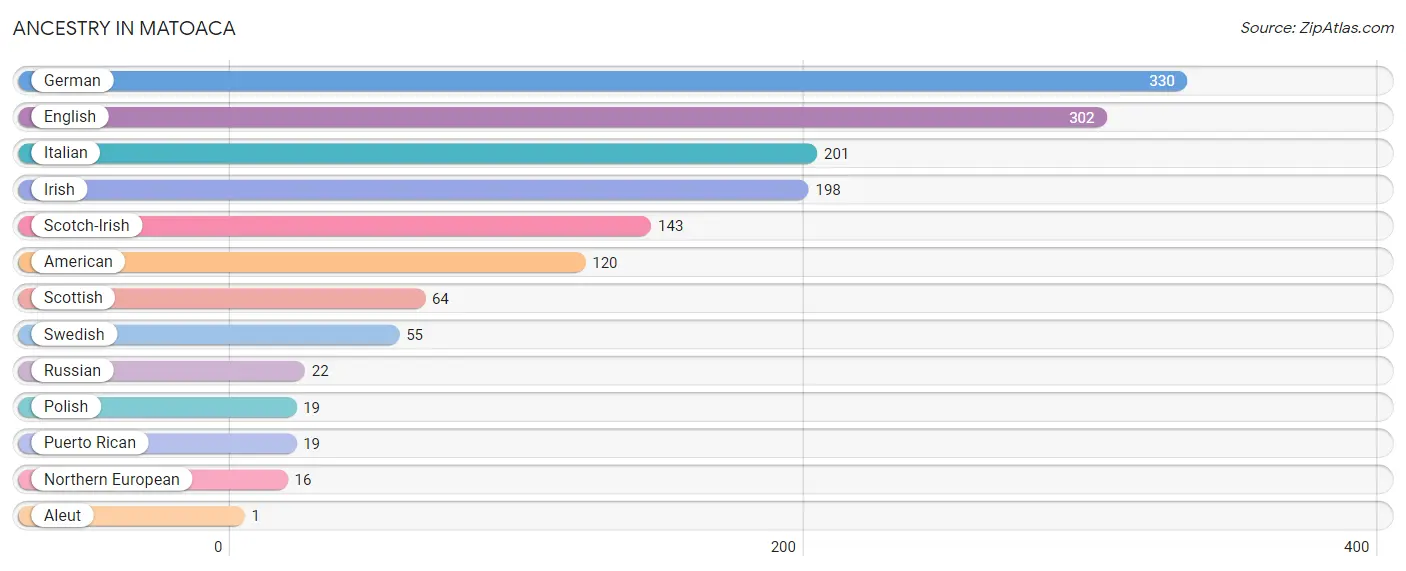
Ancestry in Matoaca
The most populous ancestries reported in Matoaca are German (330 | 13.9%), English (302 | 12.7%), Italian (201 | 8.5%), Irish (198 | 8.3%), and Scotch-Irish (143 | 6.0%), together accounting for 49.4% of all Matoaca residents.
| Ancestry | # Population | % Population |
| Aleut | 1 | 0.0% |
| American | 120 | 5.1% |
| English | 302 | 12.7% |
| German | 330 | 13.9% |
| Irish | 198 | 8.3% |
| Italian | 201 | 8.5% |
| Northern European | 16 | 0.7% |
| Polish | 19 | 0.8% |
| Puerto Rican | 19 | 0.8% |
| Russian | 22 | 0.9% |
| Scotch-Irish | 143 | 6.0% |
| Scottish | 64 | 2.7% |
| Swedish | 55 | 2.3% | View All 13 Rows |
Immigrants in Matoaca
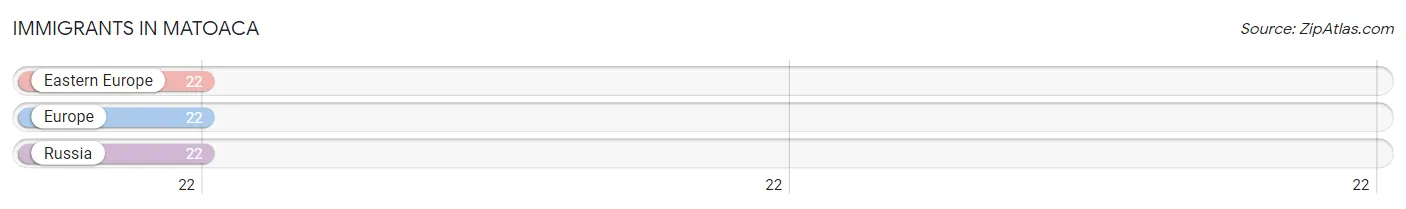
The most numerous immigrant groups reported in Matoaca came from Eastern Europe (22 | 0.9%), Europe (22 | 0.9%), and Russia (22 | 0.9%), together accounting for 2.8% of all Matoaca residents.
| Immigration Origin | # Population | % Population |
| Eastern Europe | 22 | 0.9% |
| Europe | 22 | 0.9% |
| Russia | 22 | 0.9% | View All 3 Rows |
Sex and Age in Matoaca
Sex and Age in Matoaca
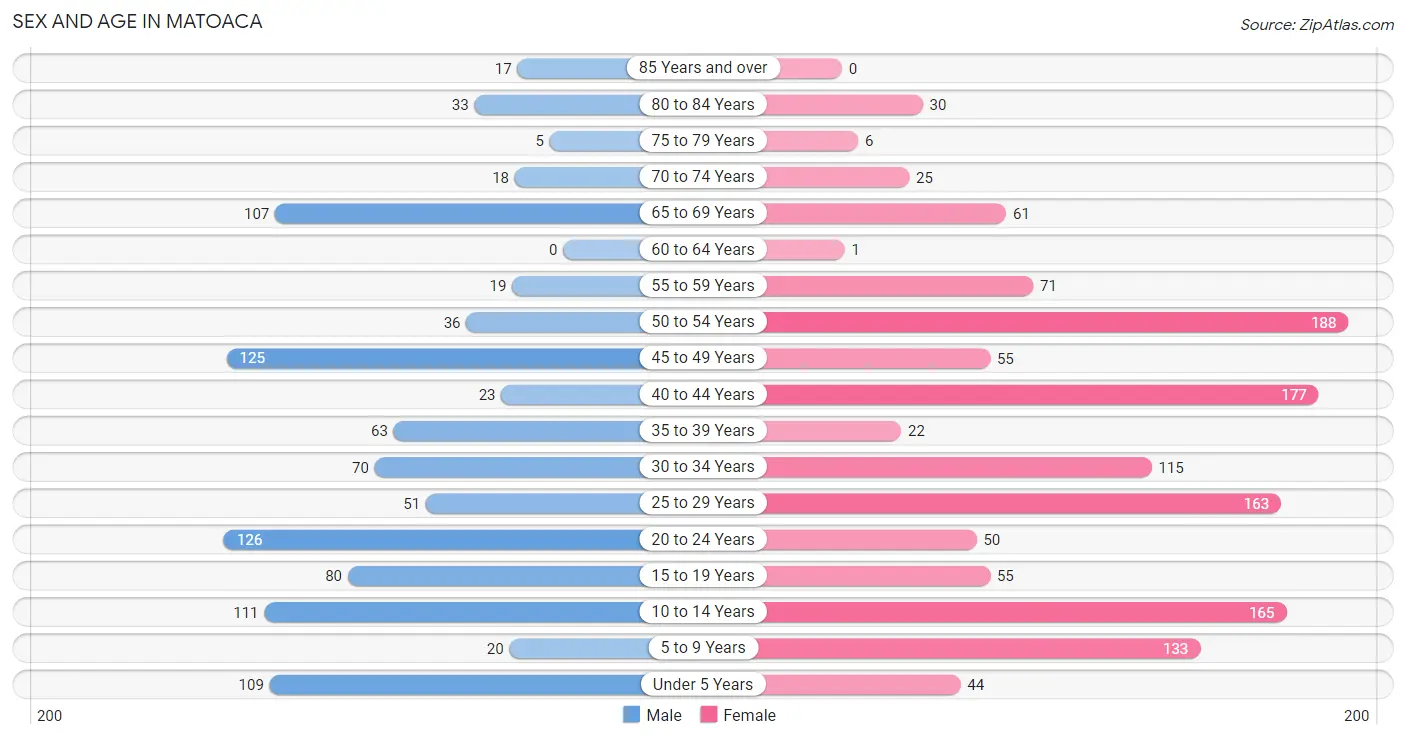
The most populous age groups in Matoaca are 20 to 24 Years (126 | 12.4%) for men and 50 to 54 Years (188 | 13.8%) for women.
| Age Bracket | Male | Female |
| Under 5 Years | 109 (10.8%) | 44 (3.2%) |
| 5 to 9 Years | 20 (2.0%) | 133 (9.8%) |
| 10 to 14 Years | 111 (11.0%) | 165 (12.1%) |
| 15 to 19 Years | 80 (7.9%) | 55 (4.0%) |
| 20 to 24 Years | 126 (12.4%) | 50 (3.7%) |
| 25 to 29 Years | 51 (5.0%) | 163 (12.0%) |
| 30 to 34 Years | 70 (6.9%) | 115 (8.5%) |
| 35 to 39 Years | 63 (6.2%) | 22 (1.6%) |
| 40 to 44 Years | 23 (2.3%) | 177 (13.0%) |
| 45 to 49 Years | 125 (12.3%) | 55 (4.0%) |
| 50 to 54 Years | 36 (3.5%) | 188 (13.8%) |
| 55 to 59 Years | 19 (1.9%) | 71 (5.2%) |
| 60 to 64 Years | 0 (0.0%) | 1 (0.1%) |
| 65 to 69 Years | 107 (10.6%) | 61 (4.5%) |
| 70 to 74 Years | 18 (1.8%) | 25 (1.8%) |
| 75 to 79 Years | 5 (0.5%) | 6 (0.4%) |
| 80 to 84 Years | 33 (3.3%) | 30 (2.2%) |
| 85 Years and over | 17 (1.7%) | 0 (0.0%) |
| Total | 1,013 (100.0%) | 1,361 (100.0%) |
Families and Households in Matoaca
Median Family Size in Matoaca
The median family size in Matoaca is 2.86 persons per family, with single male/father families (44 | 6.6%) accounting for the largest median family size of 3.89 persons per family. On the other hand, single female/mother families (316 | 47.2%) represent the smallest median family size with 2.75 persons per family.

| Family Type | # Families | Family Size |
| Married-Couple | 309 (46.2%) | 2.82 |
| Single Male/Father | 44 (6.6%) | 3.89 |
| Single Female/Mother | 316 (47.2%) | 2.75 |
| Total Families | 669 (100.0%) | 2.86 |
Median Household Size in Matoaca
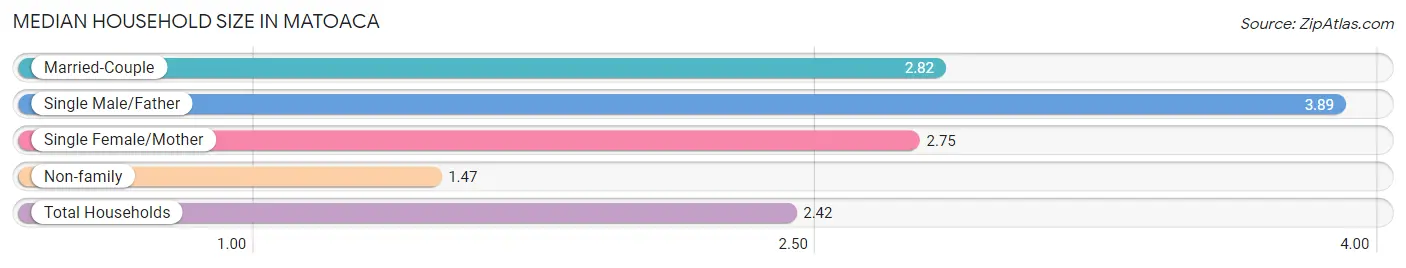
The median household size in Matoaca is 2.42 persons per household, with single male/father households (44 | 4.5%) accounting for the largest median household size of 3.89 persons per household. non-family households (313 | 31.9%) represent the smallest median household size with 1.47 persons per household.
| Household Type | # Households | Household Size |
| Married-Couple | 309 (31.5%) | 2.82 |
| Single Male/Father | 44 (4.5%) | 3.89 |
| Single Female/Mother | 316 (32.2%) | 2.75 |
| Non-family | 313 (31.9%) | 1.47 |
| Total Households | 982 (100.0%) | 2.42 |
Household Size by Marriage Status in Matoaca
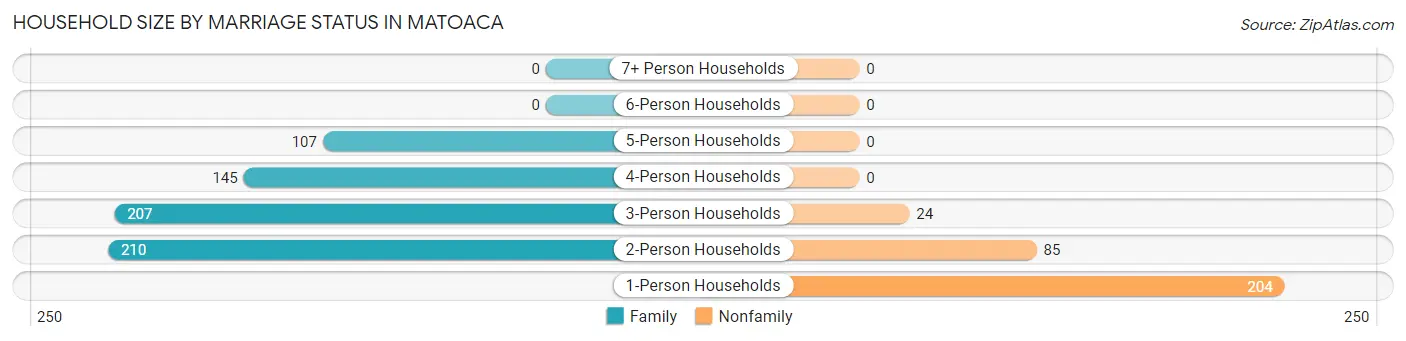
Out of a total of 982 households in Matoaca, 669 (68.1%) are family households, while 313 (31.9%) are nonfamily households. The most numerous type of family households are 2-person households, comprising 210, and the most common type of nonfamily households are 1-person households, comprising 204.
| Household Size | Family Households | Nonfamily Households |
| 1-Person Households | - | 204 (20.8%) |
| 2-Person Households | 210 (21.4%) | 85 (8.7%) |
| 3-Person Households | 207 (21.1%) | 24 (2.4%) |
| 4-Person Households | 145 (14.8%) | 0 (0.0%) |
| 5-Person Households | 107 (10.9%) | 0 (0.0%) |
| 6-Person Households | 0 (0.0%) | 0 (0.0%) |
| 7+ Person Households | 0 (0.0%) | 0 (0.0%) |
| Total | 669 (68.1%) | 313 (31.9%) |
Female Fertility in Matoaca
Fertility by Age in Matoaca
| Age Bracket | Women with Births | Births / 1,000 Women |
| 15 to 19 years | 0 (0.0%) | 0.0 |
| 20 to 34 years | 0 (0.0%) | 0.0 |
| 35 to 50 years | 0 (0.0%) | 0.0 |
| Total | 0 (0.0%) | 0.0 |
Fertility by Age by Marriage Status in Matoaca
| Age Bracket | Married | Unmarried |
| 15 to 19 years | 0 (0.0%) | 0 (0.0%) |
| 20 to 34 years | 0 (0.0%) | 0 (0.0%) |
| 35 to 50 years | 0 (0.0%) | 0 (0.0%) |
| Total | 0 (0.0%) | 0 (0.0%) |
Fertility by Education in Matoaca
| Educational Attainment | Women with Births | Births / 1,000 Women |
| Less than High School | 0 (0.0%) | 0.0 |
| High School Diploma | 0 (0.0%) | 0.0 |
| College or Associate's Degree | 0 (0.0%) | 0.0 |
| Bachelor's Degree | 0 (0.0%) | 0.0 |
| Graduate Degree | 0 (0.0%) | 0.0 |
| Total | 0 (0.0%) | 0.0 |
Fertility by Education by Marriage Status in Matoaca
| Educational Attainment | Married | Unmarried |
| Less than High School | 0 (0.0%) | 0 (0.0%) |
| High School Diploma | 0 (0.0%) | 0 (0.0%) |
| College or Associate's Degree | 0 (0.0%) | 0 (0.0%) |
| Bachelor's Degree | 0 (0.0%) | 0 (0.0%) |
| Graduate Degree | 0 (0.0%) | 0 (0.0%) |
| Total | 0 (0.0%) | 0 (0.0%) |
Employment Characteristics in Matoaca
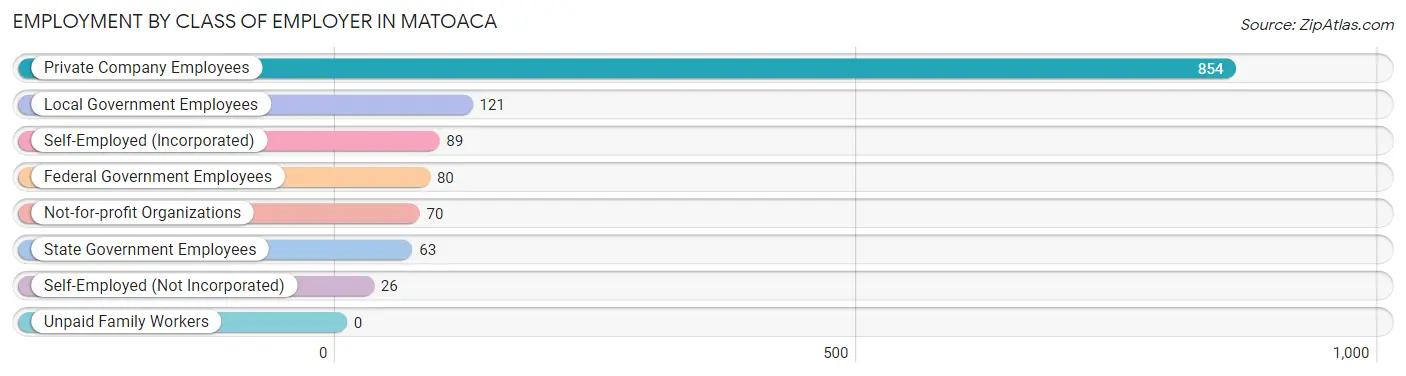
Employment by Class of Employer in Matoaca
Among the 1,303 employed individuals in Matoaca, private company employees (854 | 65.5%), local government employees (121 | 9.3%), and self-employed (incorporated) (89 | 6.8%) make up the most common classes of employment.
| Employer Class | # Employees | % Employees |
| Private Company Employees | 854 | 65.5% |
| Self-Employed (Incorporated) | 89 | 6.8% |
| Self-Employed (Not Incorporated) | 26 | 2.0% |
| Not-for-profit Organizations | 70 | 5.4% |
| Local Government Employees | 121 | 9.3% |
| State Government Employees | 63 | 4.8% |
| Federal Government Employees | 80 | 6.1% |
| Unpaid Family Workers | 0 | 0.0% |
| Total | 1,303 | 100.0% |
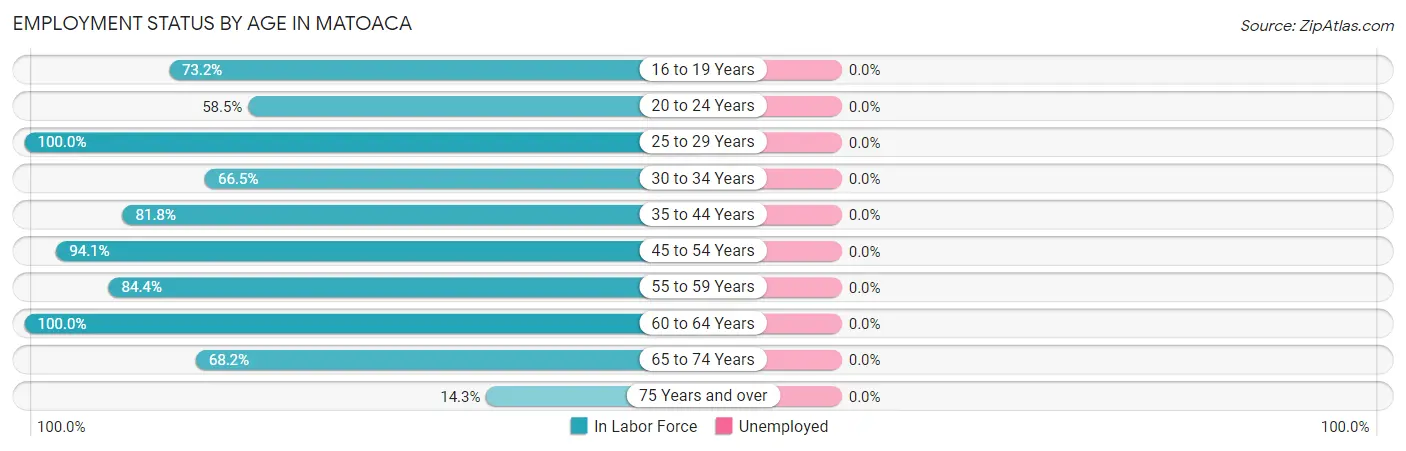
Employment Status by Age in Matoaca
| Age Bracket | In Labor Force | Unemployed |
| 16 to 19 Years | 71 (73.2%) | 0 (0.0%) |
| 20 to 24 Years | 103 (58.5%) | 0 (0.0%) |
| 25 to 29 Years | 214 (100.0%) | 0 (0.0%) |
| 30 to 34 Years | 123 (66.5%) | 0 (0.0%) |
| 35 to 44 Years | 233 (81.8%) | 0 (0.0%) |
| 45 to 54 Years | 380 (94.1%) | 0 (0.0%) |
| 55 to 59 Years | 76 (84.4%) | 0 (0.0%) |
| 60 to 64 Years | 1 (100.0%) | 0 (0.0%) |
| 65 to 74 Years | 144 (68.2%) | 0 (0.0%) |
| 75 Years and over | 13 (14.3%) | 0 (0.0%) |
| Total | 1,358 (77.4%) | 0 (0.0%) |
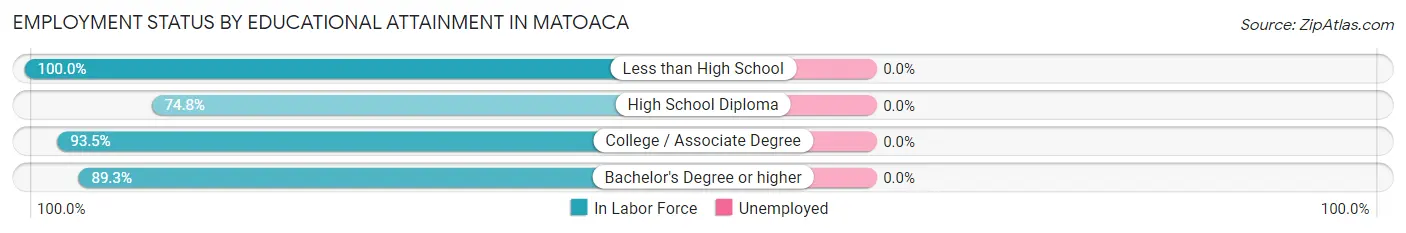
Employment Status by Educational Attainment in Matoaca
| Educational Attainment | In Labor Force | Unemployed |
| Less than High School | 58 (100.0%) | 0 (0.0%) |
| High School Diploma | 267 (74.8%) | 0 (0.0%) |
| College / Associate Degree | 434 (93.5%) | 0 (0.0%) |
| Bachelor's Degree or higher | 268 (89.3%) | 0 (0.0%) |
| Total | 1,027 (87.1%) | 0 (0.0%) |
Employment Occupations by Sex in Matoaca
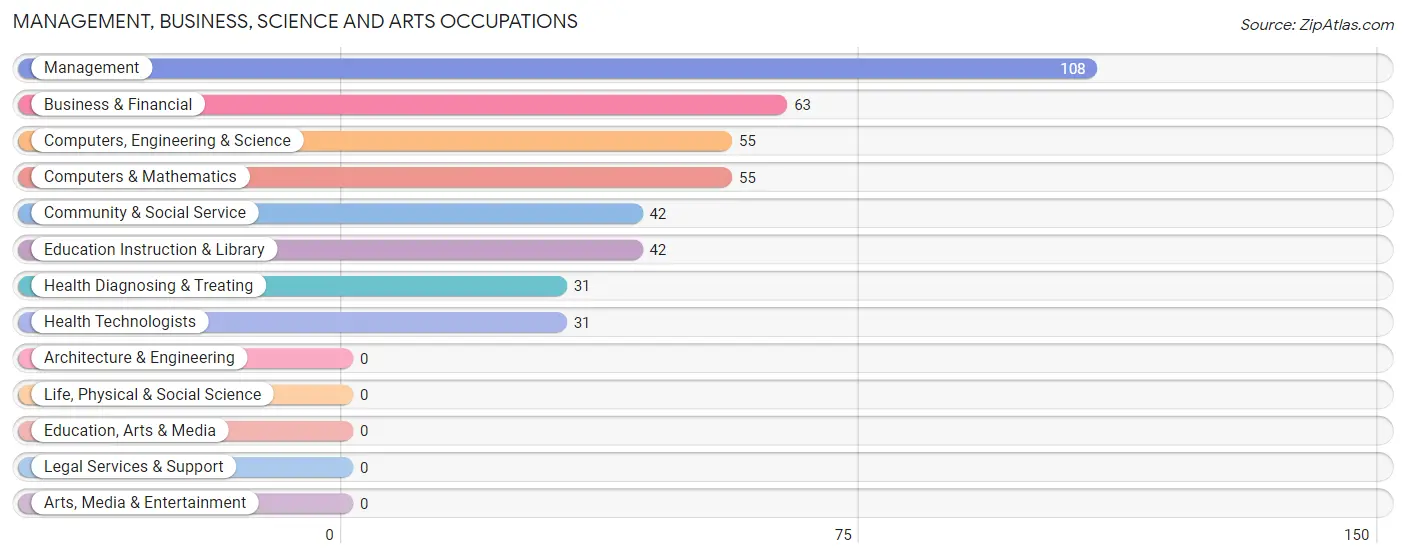
Management, Business, Science and Arts Occupations
The most common Management, Business, Science and Arts occupations in Matoaca are Management (108 | 8.2%), Business & Financial (63 | 4.8%), Computers, Engineering & Science (55 | 4.2%), Computers & Mathematics (55 | 4.2%), and Community & Social Service (42 | 3.2%).
Management, Business, Science and Arts Occupations by Sex
Within the Management, Business, Science and Arts occupations in Matoaca, the most male-oriented occupations are Health Diagnosing & Treating (48.4%), Health Technologists (48.4%), and Computers, Engineering & Science (41.8%), while the most female-oriented occupations are Business & Financial (100.0%), Community & Social Service (100.0%), and Education Instruction & Library (100.0%).

| Occupation | Male | Female |
| Management | 22 (20.4%) | 86 (79.6%) |
| Business & Financial | 0 (0.0%) | 63 (100.0%) |
| Computers, Engineering & Science | 23 (41.8%) | 32 (58.2%) |
| Computers & Mathematics | 23 (41.8%) | 32 (58.2%) |
| Architecture & Engineering | 0 (0.0%) | 0 (0.0%) |
| Life, Physical & Social Science | 0 (0.0%) | 0 (0.0%) |
| Community & Social Service | 0 (0.0%) | 42 (100.0%) |
| Education, Arts & Media | 0 (0.0%) | 0 (0.0%) |
| Legal Services & Support | 0 (0.0%) | 0 (0.0%) |
| Education Instruction & Library | 0 (0.0%) | 42 (100.0%) |
| Arts, Media & Entertainment | 0 (0.0%) | 0 (0.0%) |
| Health Diagnosing & Treating | 15 (48.4%) | 16 (51.6%) |
| Health Technologists | 15 (48.4%) | 16 (51.6%) |
| Total (Category) | 60 (20.1%) | 239 (79.9%) |
| Total (Overall) | 517 (39.2%) | 801 (60.8%) |
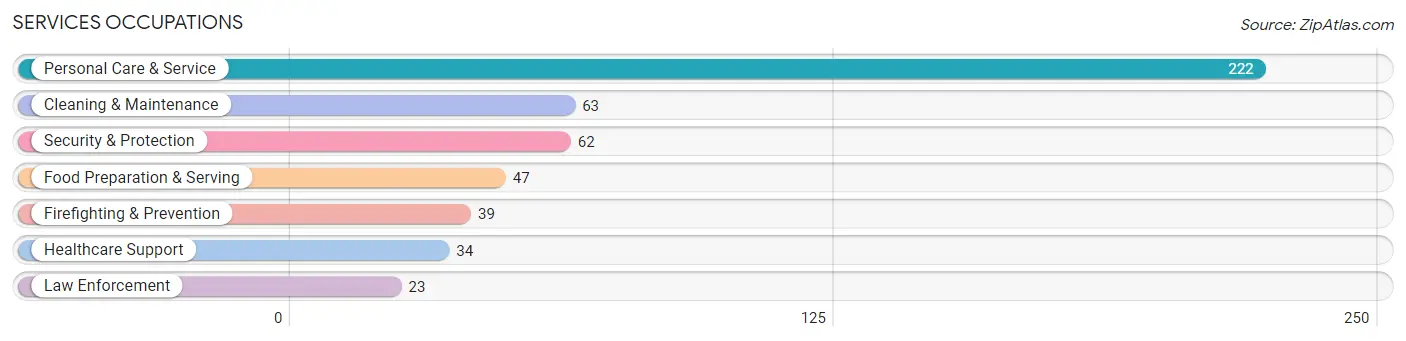
Services Occupations
The most common Services occupations in Matoaca are Personal Care & Service (222 | 16.8%), Cleaning & Maintenance (63 | 4.8%), Security & Protection (62 | 4.7%), Food Preparation & Serving (47 | 3.6%), and Firefighting & Prevention (39 | 3.0%).
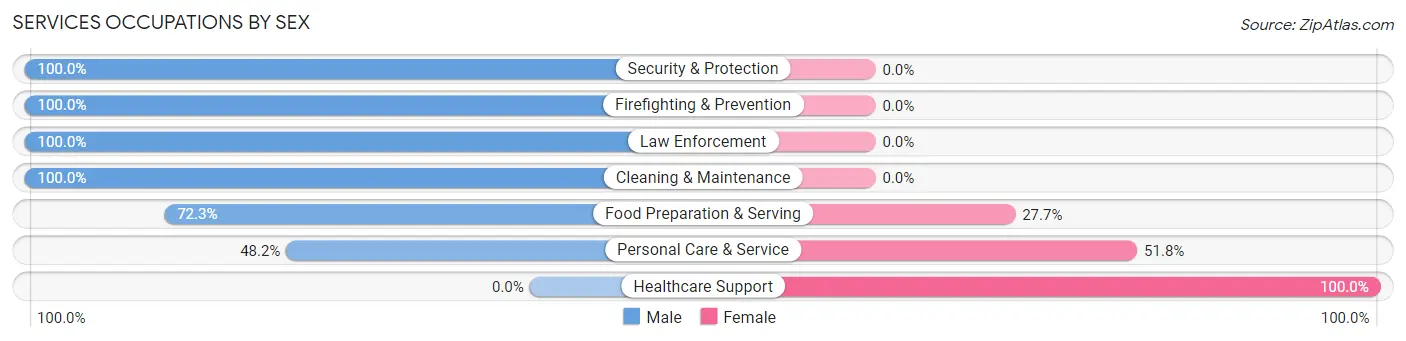
Services Occupations by Sex
Within the Services occupations in Matoaca, the most male-oriented occupations are Security & Protection (100.0%), Firefighting & Prevention (100.0%), and Law Enforcement (100.0%), while the most female-oriented occupations are Healthcare Support (100.0%), Personal Care & Service (51.8%), and Food Preparation & Serving (27.7%).
| Occupation | Male | Female |
| Healthcare Support | 0 (0.0%) | 34 (100.0%) |
| Security & Protection | 62 (100.0%) | 0 (0.0%) |
| Firefighting & Prevention | 39 (100.0%) | 0 (0.0%) |
| Law Enforcement | 23 (100.0%) | 0 (0.0%) |
| Food Preparation & Serving | 34 (72.3%) | 13 (27.7%) |
| Cleaning & Maintenance | 63 (100.0%) | 0 (0.0%) |
| Personal Care & Service | 107 (48.2%) | 115 (51.8%) |
| Total (Category) | 266 (62.2%) | 162 (37.9%) |
| Total (Overall) | 517 (39.2%) | 801 (60.8%) |
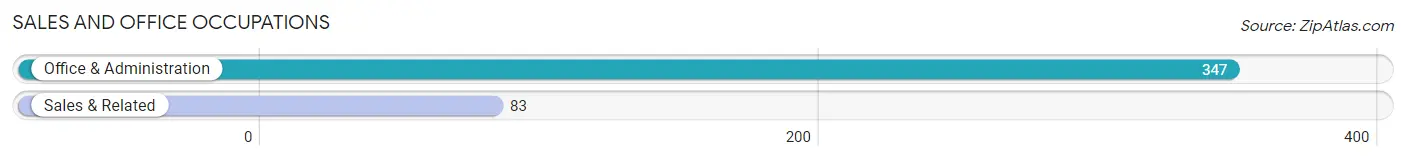
Sales and Office Occupations
The most common Sales and Office occupations in Matoaca are Office & Administration (347 | 26.3%), and Sales & Related (83 | 6.3%).
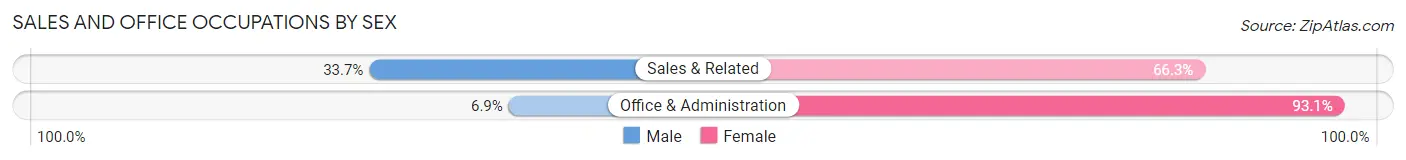
Sales and Office Occupations by Sex
| Occupation | Male | Female |
| Sales & Related | 28 (33.7%) | 55 (66.3%) |
| Office & Administration | 24 (6.9%) | 323 (93.1%) |
| Total (Category) | 52 (12.1%) | 378 (87.9%) |
| Total (Overall) | 517 (39.2%) | 801 (60.8%) |
Natural Resources, Construction and Maintenance Occupations
The most common Natural Resources, Construction and Maintenance occupations in Matoaca are Construction & Extraction (78 | 5.9%), and Installation, Maintenance & Repair (43 | 3.3%).
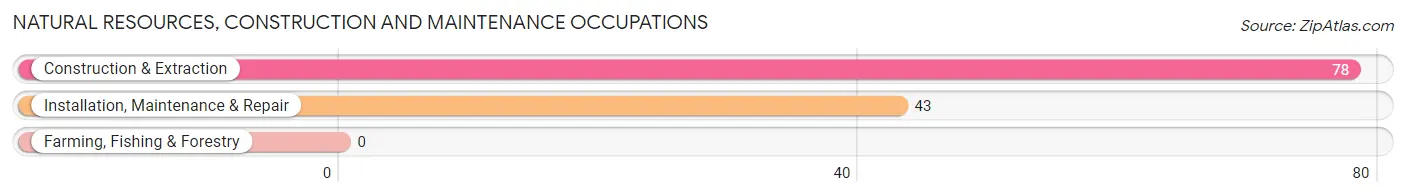
Natural Resources, Construction and Maintenance Occupations by Sex
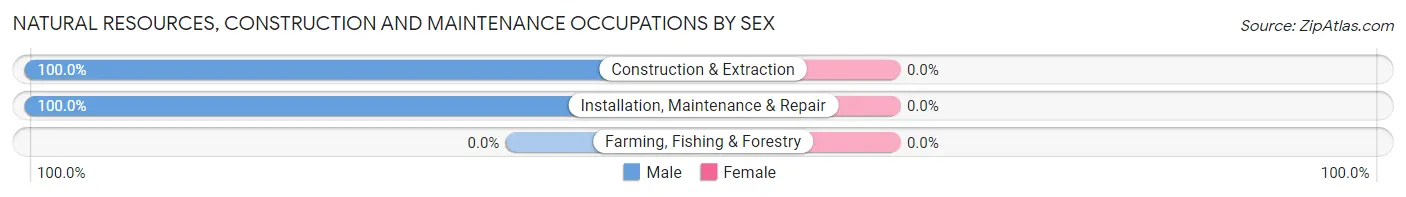
| Occupation | Male | Female |
| Farming, Fishing & Forestry | 0 (0.0%) | 0 (0.0%) |
| Construction & Extraction | 78 (100.0%) | 0 (0.0%) |
| Installation, Maintenance & Repair | 43 (100.0%) | 0 (0.0%) |
| Total (Category) | 121 (100.0%) | 0 (0.0%) |
| Total (Overall) | 517 (39.2%) | 801 (60.8%) |
Production, Transportation and Moving Occupations
The most common Production, Transportation and Moving occupations in Matoaca are , and Production (40 | 3.0%).
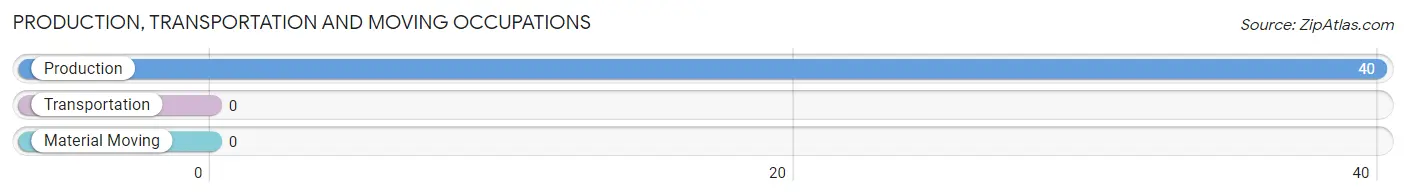
Production, Transportation and Moving Occupations by Sex
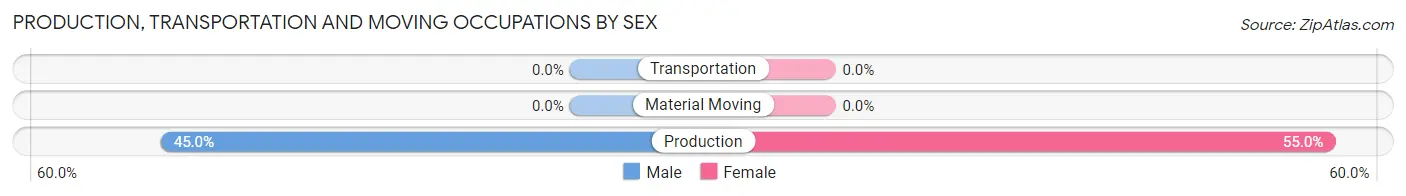
| Occupation | Male | Female |
| Production | 18 (45.0%) | 22 (55.0%) |
| Transportation | 0 (0.0%) | 0 (0.0%) |
| Material Moving | 0 (0.0%) | 0 (0.0%) |
| Total (Category) | 18 (45.0%) | 22 (55.0%) |
| Total (Overall) | 517 (39.2%) | 801 (60.8%) |
Employment Industries by Sex in Matoaca
Employment Industries in Matoaca
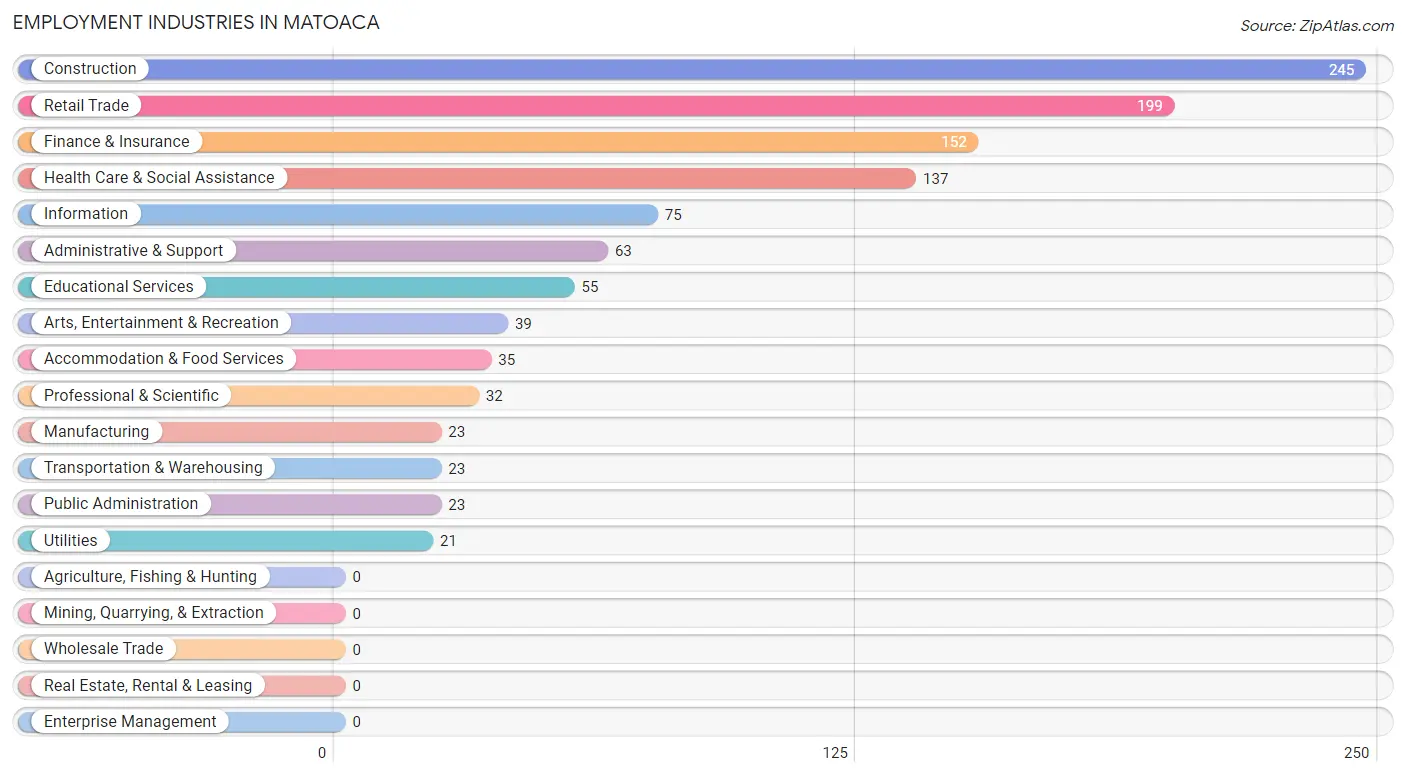
The major employment industries in Matoaca include Construction (245 | 18.6%), Retail Trade (199 | 15.1%), Finance & Insurance (152 | 11.5%), Health Care & Social Assistance (137 | 10.4%), and Information (75 | 5.7%).
Employment Industries by Sex in Matoaca
The Matoaca industries that see more men than women are Manufacturing (100.0%), Utilities (100.0%), and Administrative & Support (100.0%), whereas the industries that tend to have a higher number of women are Transportation & Warehousing (100.0%), Finance & Insurance (100.0%), and Professional & Scientific (100.0%).
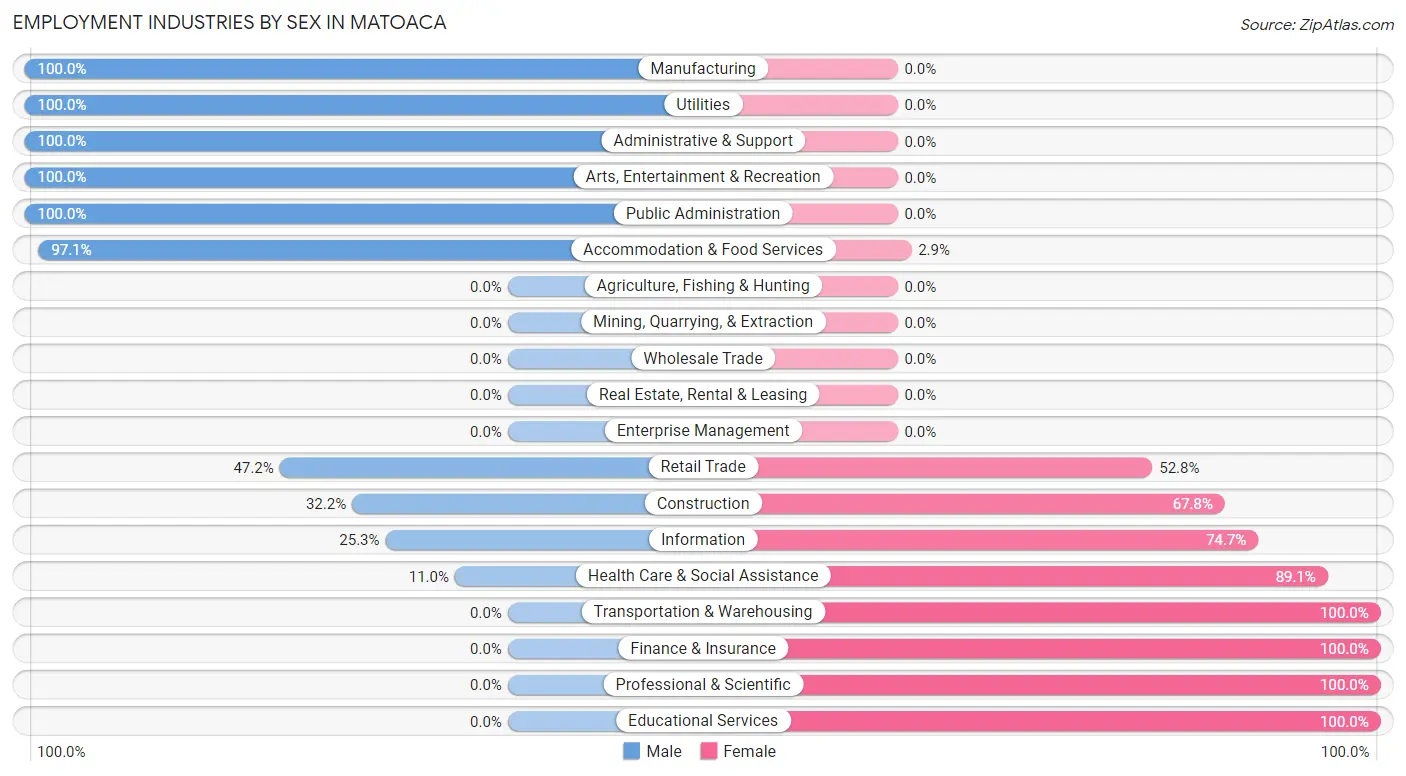
| Industry | Male | Female |
| Agriculture, Fishing & Hunting | 0 (0.0%) | 0 (0.0%) |
| Mining, Quarrying, & Extraction | 0 (0.0%) | 0 (0.0%) |
| Construction | 79 (32.2%) | 166 (67.8%) |
| Manufacturing | 23 (100.0%) | 0 (0.0%) |
| Wholesale Trade | 0 (0.0%) | 0 (0.0%) |
| Retail Trade | 94 (47.2%) | 105 (52.8%) |
| Transportation & Warehousing | 0 (0.0%) | 23 (100.0%) |
| Utilities | 21 (100.0%) | 0 (0.0%) |
| Information | 19 (25.3%) | 56 (74.7%) |
| Finance & Insurance | 0 (0.0%) | 152 (100.0%) |
| Real Estate, Rental & Leasing | 0 (0.0%) | 0 (0.0%) |
| Professional & Scientific | 0 (0.0%) | 32 (100.0%) |
| Enterprise Management | 0 (0.0%) | 0 (0.0%) |
| Administrative & Support | 63 (100.0%) | 0 (0.0%) |
| Educational Services | 0 (0.0%) | 55 (100.0%) |
| Health Care & Social Assistance | 15 (11.0%) | 122 (89.0%) |
| Arts, Entertainment & Recreation | 39 (100.0%) | 0 (0.0%) |
| Accommodation & Food Services | 34 (97.1%) | 1 (2.9%) |
| Public Administration | 23 (100.0%) | 0 (0.0%) |
| Total | 517 (39.2%) | 801 (60.8%) |
Education in Matoaca
School Enrollment in Matoaca
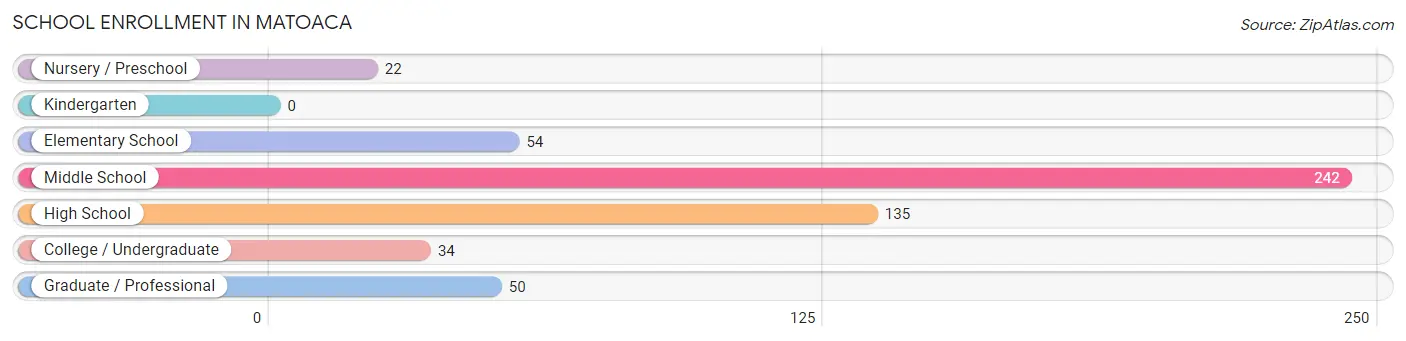
The most common levels of schooling among the 537 students in Matoaca are middle school (242 | 45.1%), high school (135 | 25.1%), and elementary school (54 | 10.1%).
| School Level | # Students | % Students |
| Nursery / Preschool | 22 | 4.1% |
| Kindergarten | 0 | 0.0% |
| Elementary School | 54 | 10.1% |
| Middle School | 242 | 45.1% |
| High School | 135 | 25.1% |
| College / Undergraduate | 34 | 6.3% |
| Graduate / Professional | 50 | 9.3% |
| Total | 537 | 100.0% |
School Enrollment by Age by Funding Source in Matoaca
Out of a total of 537 students who are enrolled in schools in Matoaca, 26 (4.8%) attend a private institution, while the remaining 511 (95.2%) are enrolled in public schools. The age group of 20 to 24 year olds has the highest likelihood of being enrolled in private schools, with 26 (30.9% in the age bracket) enrolled. Conversely, the age group of 5 to 9 year old has the lowest likelihood of being enrolled in a private school, with 42 (100.0% in the age bracket) attending a public institution.

| Age Bracket | Public School | Private School |
| 3 to 4 Year Olds | 0 (0.0%) | 0 (0.0%) |
| 5 to 9 Year Old | 42 (100.0%) | 0 (0.0%) |
| 10 to 14 Year Olds | 276 (100.0%) | 0 (0.0%) |
| 15 to 17 Year Olds | 135 (100.0%) | 0 (0.0%) |
| 18 to 19 Year Olds | 0 (0.0%) | 0 (0.0%) |
| 20 to 24 Year Olds | 58 (69.1%) | 26 (30.9%) |
| 25 to 34 Year Olds | 0 (0.0%) | 0 (0.0%) |
| 35 Years and over | 0 (0.0%) | 0 (0.0%) |
| Total | 511 (95.2%) | 26 (4.8%) |
Educational Attainment by Field of Study in Matoaca
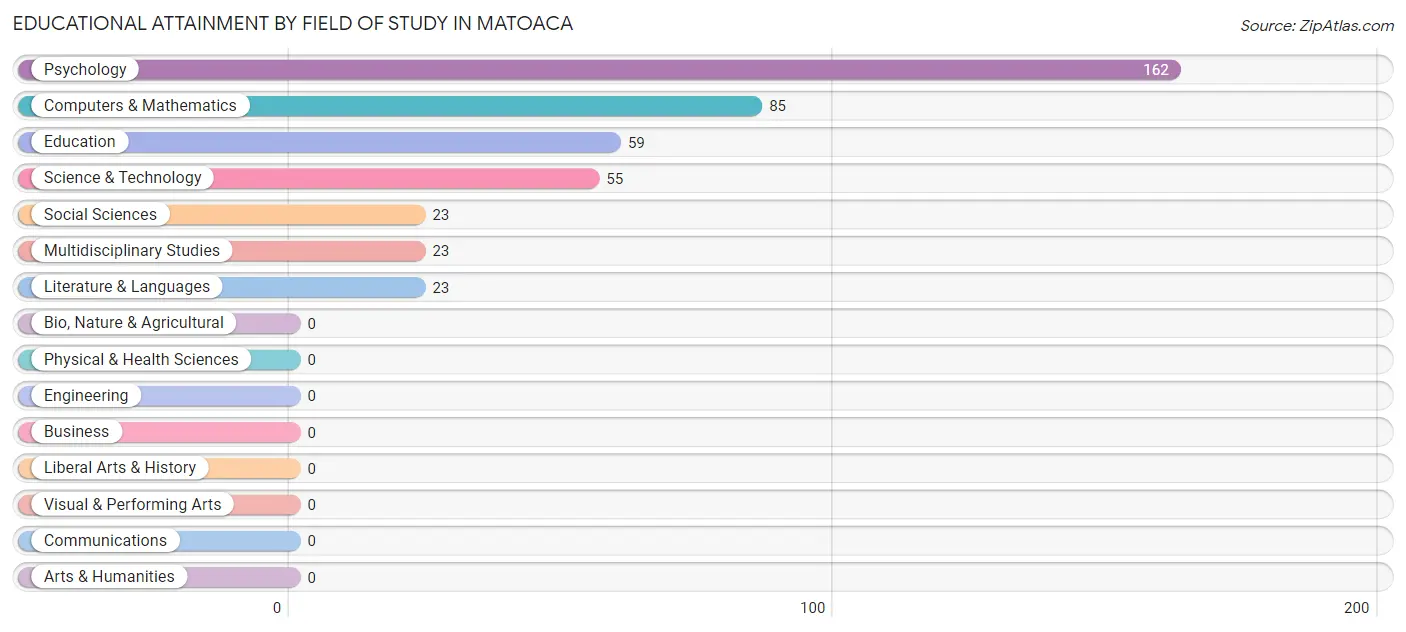
Psychology (162 | 37.7%), computers & mathematics (85 | 19.8%), education (59 | 13.7%), science & technology (55 | 12.8%), and social sciences (23 | 5.3%) are the most common fields of study among 430 individuals in Matoaca who have obtained a bachelor's degree or higher.
| Field of Study | # Graduates | % Graduates |
| Computers & Mathematics | 85 | 19.8% |
| Bio, Nature & Agricultural | 0 | 0.0% |
| Physical & Health Sciences | 0 | 0.0% |
| Psychology | 162 | 37.7% |
| Social Sciences | 23 | 5.3% |
| Engineering | 0 | 0.0% |
| Multidisciplinary Studies | 23 | 5.3% |
| Science & Technology | 55 | 12.8% |
| Business | 0 | 0.0% |
| Education | 59 | 13.7% |
| Literature & Languages | 23 | 5.3% |
| Liberal Arts & History | 0 | 0.0% |
| Visual & Performing Arts | 0 | 0.0% |
| Communications | 0 | 0.0% |
| Arts & Humanities | 0 | 0.0% |
| Total | 430 | 100.0% |
Transportation & Commute in Matoaca
Vehicle Availability by Sex in Matoaca
The most prevalent vehicle ownership categories in Matoaca are males with 2 vehicles (173, accounting for 31.1%) and females with 2 vehicles (207, making up 23.2%).
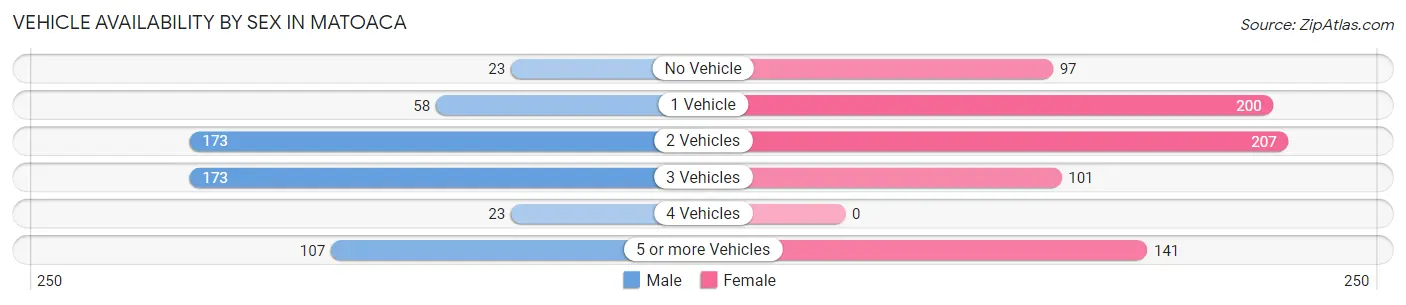
| Vehicles Available | Male | Female |
| No Vehicle | 23 (4.1%) | 97 (13.0%) |
| 1 Vehicle | 58 (10.4%) | 200 (26.8%) |
| 2 Vehicles | 173 (31.1%) | 207 (27.8%) |
| 3 Vehicles | 173 (31.1%) | 101 (13.5%) |
| 4 Vehicles | 23 (4.1%) | 0 (0.0%) |
| 5 or more Vehicles | 107 (19.2%) | 141 (18.9%) |
| Total | 557 (100.0%) | 746 (100.0%) |
Commute Time in Matoaca
The most frequently occuring commute durations in Matoaca are 45 to 59 minutes (272 commuters, 24.2%), 30 to 34 minutes (250 commuters, 22.3%), and 20 to 24 minutes (166 commuters, 14.8%).
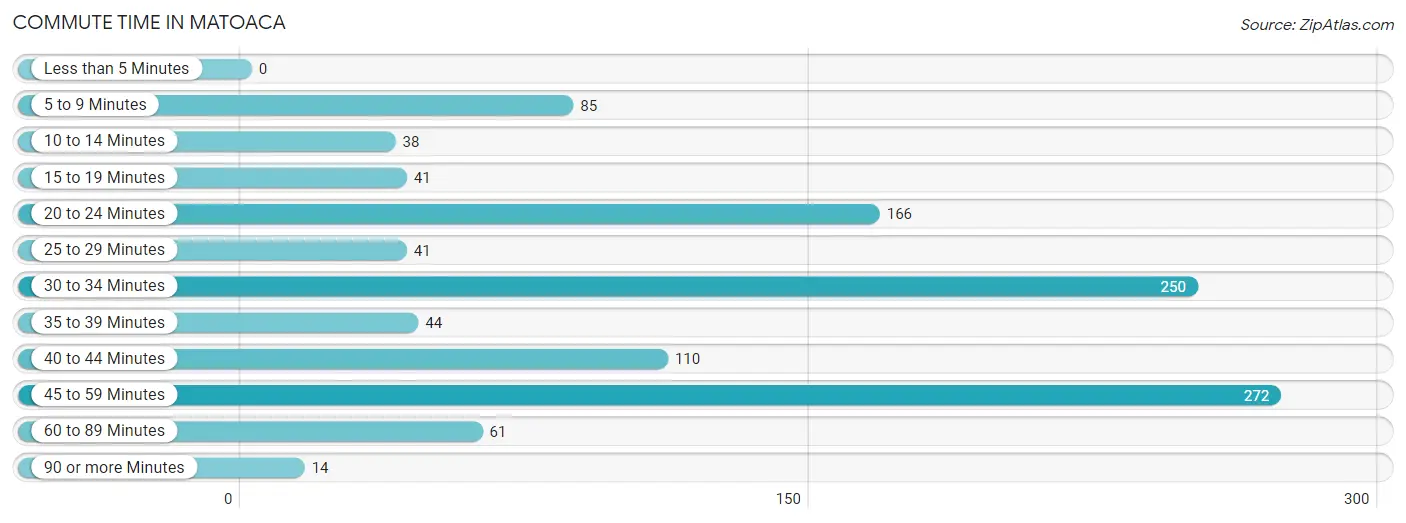
| Commute Time | # Commuters | % Commuters |
| Less than 5 Minutes | 0 | 0.0% |
| 5 to 9 Minutes | 85 | 7.6% |
| 10 to 14 Minutes | 38 | 3.4% |
| 15 to 19 Minutes | 41 | 3.6% |
| 20 to 24 Minutes | 166 | 14.8% |
| 25 to 29 Minutes | 41 | 3.6% |
| 30 to 34 Minutes | 250 | 22.3% |
| 35 to 39 Minutes | 44 | 3.9% |
| 40 to 44 Minutes | 110 | 9.8% |
| 45 to 59 Minutes | 272 | 24.2% |
| 60 to 89 Minutes | 61 | 5.4% |
| 90 or more Minutes | 14 | 1.3% |
Commute Time by Sex in Matoaca
The most common commute times in Matoaca are 45 to 59 minutes (158 commuters, 28.4%) for males and 30 to 34 minutes (146 commuters, 25.8%) for females.
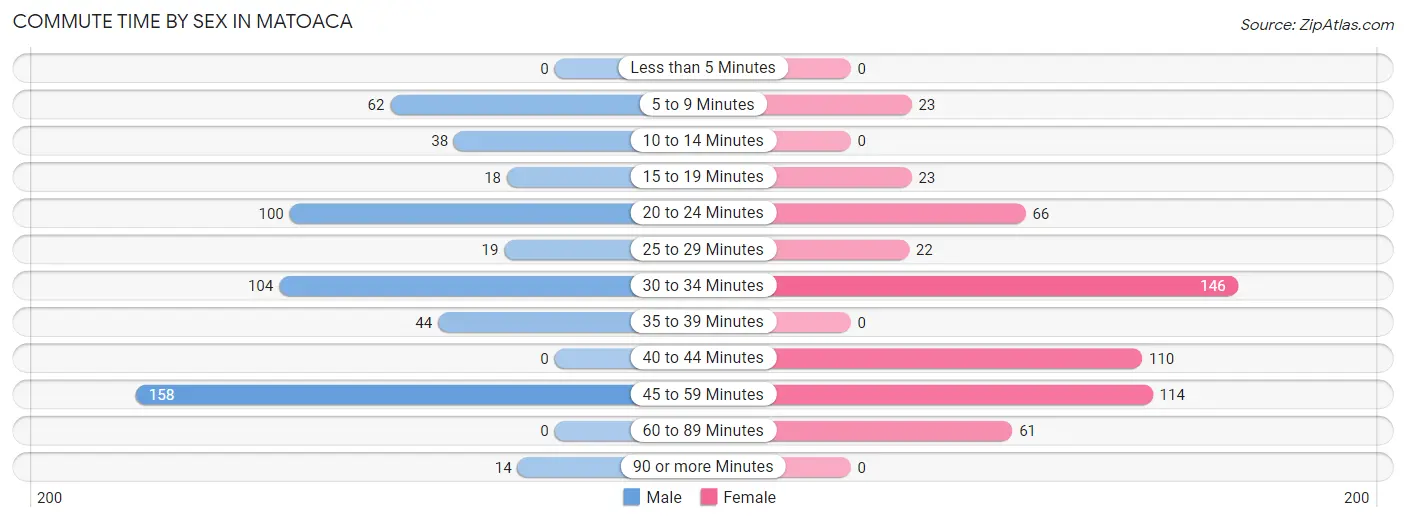
| Commute Time | Male | Female |
| Less than 5 Minutes | 0 (0.0%) | 0 (0.0%) |
| 5 to 9 Minutes | 62 (11.1%) | 23 (4.1%) |
| 10 to 14 Minutes | 38 (6.8%) | 0 (0.0%) |
| 15 to 19 Minutes | 18 (3.2%) | 23 (4.1%) |
| 20 to 24 Minutes | 100 (17.9%) | 66 (11.7%) |
| 25 to 29 Minutes | 19 (3.4%) | 22 (3.9%) |
| 30 to 34 Minutes | 104 (18.7%) | 146 (25.8%) |
| 35 to 39 Minutes | 44 (7.9%) | 0 (0.0%) |
| 40 to 44 Minutes | 0 (0.0%) | 110 (19.5%) |
| 45 to 59 Minutes | 158 (28.4%) | 114 (20.2%) |
| 60 to 89 Minutes | 0 (0.0%) | 61 (10.8%) |
| 90 or more Minutes | 14 (2.5%) | 0 (0.0%) |
Time of Departure to Work by Sex in Matoaca
The most frequent times of departure to work in Matoaca are 7:00 AM to 7:29 AM (165, 29.6%) for males and 7:30 AM to 7:59 AM (128, 22.7%) for females.
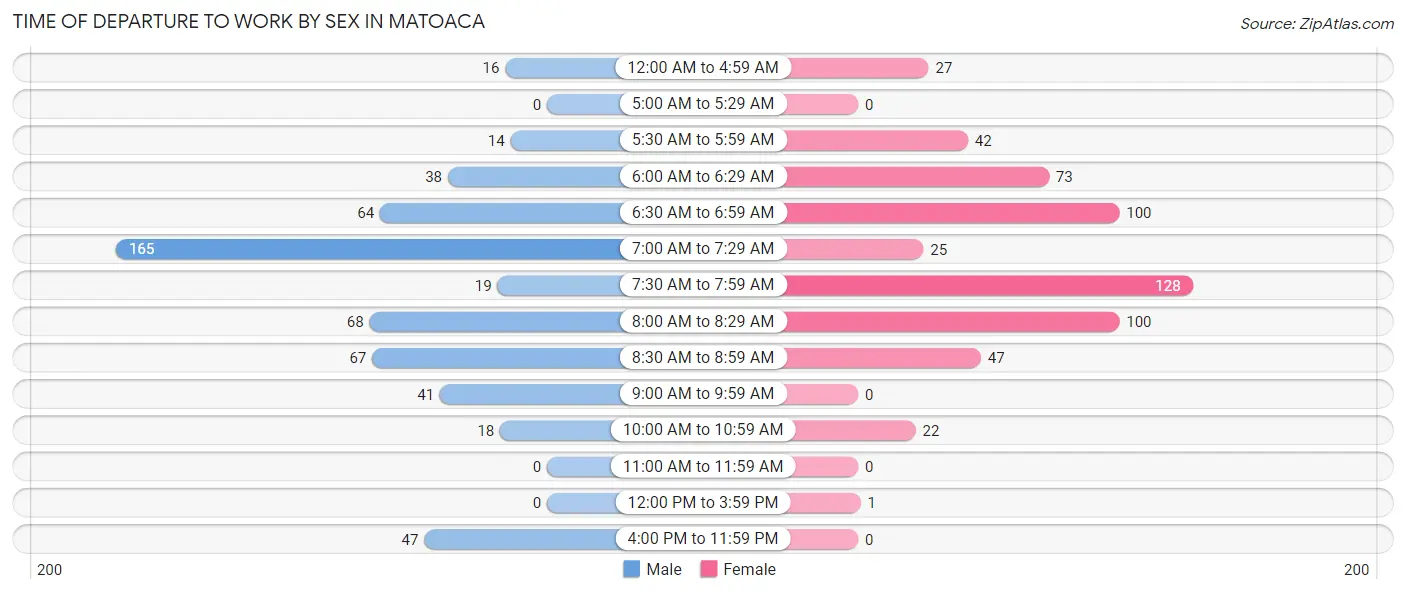
| Time of Departure | Male | Female |
| 12:00 AM to 4:59 AM | 16 (2.9%) | 27 (4.8%) |
| 5:00 AM to 5:29 AM | 0 (0.0%) | 0 (0.0%) |
| 5:30 AM to 5:59 AM | 14 (2.5%) | 42 (7.4%) |
| 6:00 AM to 6:29 AM | 38 (6.8%) | 73 (12.9%) |
| 6:30 AM to 6:59 AM | 64 (11.5%) | 100 (17.7%) |
| 7:00 AM to 7:29 AM | 165 (29.6%) | 25 (4.4%) |
| 7:30 AM to 7:59 AM | 19 (3.4%) | 128 (22.7%) |
| 8:00 AM to 8:29 AM | 68 (12.2%) | 100 (17.7%) |
| 8:30 AM to 8:59 AM | 67 (12.0%) | 47 (8.3%) |
| 9:00 AM to 9:59 AM | 41 (7.4%) | 0 (0.0%) |
| 10:00 AM to 10:59 AM | 18 (3.2%) | 22 (3.9%) |
| 11:00 AM to 11:59 AM | 0 (0.0%) | 0 (0.0%) |
| 12:00 PM to 3:59 PM | 0 (0.0%) | 1 (0.2%) |
| 4:00 PM to 11:59 PM | 47 (8.4%) | 0 (0.0%) |
| Total | 557 (100.0%) | 565 (100.0%) |
Housing Occupancy in Matoaca
Occupancy by Ownership in Matoaca
Of the total 982 dwellings in Matoaca, owner-occupied units account for 747 (76.1%), while renter-occupied units make up 235 (23.9%).
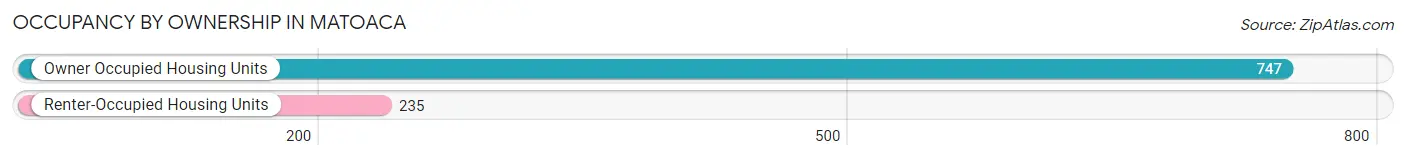
| Occupancy | # Housing Units | % Housing Units |
| Owner Occupied Housing Units | 747 | 76.1% |
| Renter-Occupied Housing Units | 235 | 23.9% |
| Total Occupied Housing Units | 982 | 100.0% |
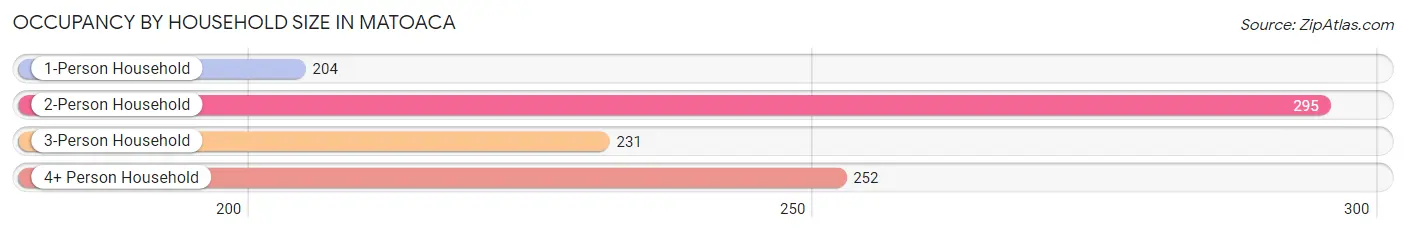
Occupancy by Household Size in Matoaca
| Household Size | # Housing Units | % Housing Units |
| 1-Person Household | 204 | 20.8% |
| 2-Person Household | 295 | 30.0% |
| 3-Person Household | 231 | 23.5% |
| 4+ Person Household | 252 | 25.7% |
| Total Housing Units | 982 | 100.0% |
Occupancy by Ownership by Household Size in Matoaca
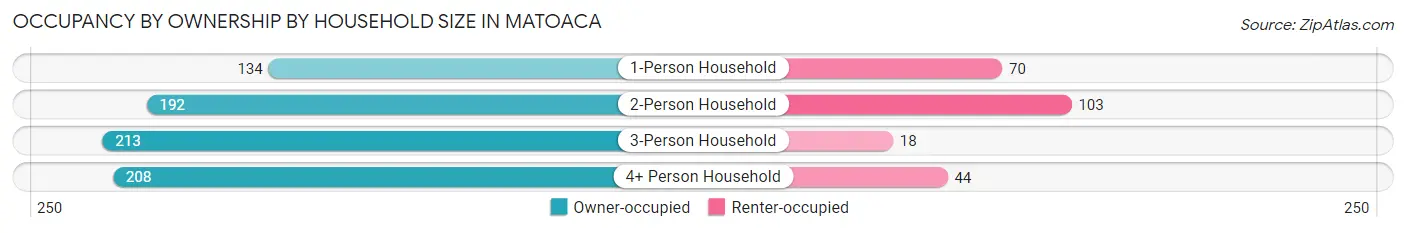
| Household Size | Owner-occupied | Renter-occupied |
| 1-Person Household | 134 (65.7%) | 70 (34.3%) |
| 2-Person Household | 192 (65.1%) | 103 (34.9%) |
| 3-Person Household | 213 (92.2%) | 18 (7.8%) |
| 4+ Person Household | 208 (82.5%) | 44 (17.5%) |
| Total Housing Units | 747 (76.1%) | 235 (23.9%) |
Occupancy by Educational Attainment in Matoaca
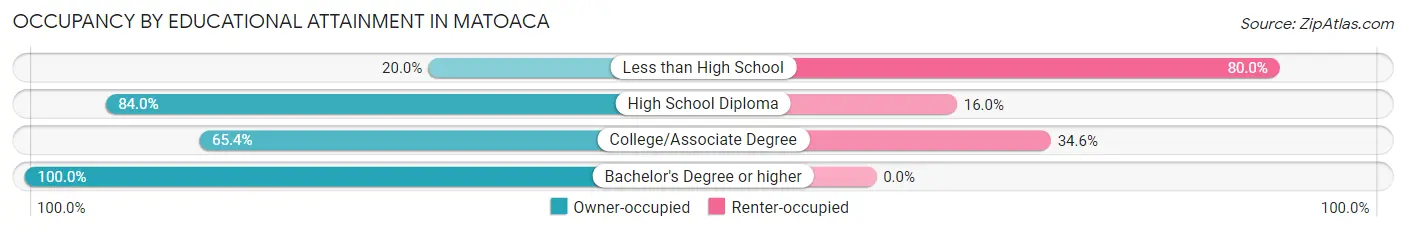
| Household Size | Owner-occupied | Renter-occupied |
| Less than High School | 14 (20.0%) | 56 (80.0%) |
| High School Diploma | 226 (84.0%) | 43 (16.0%) |
| College/Associate Degree | 257 (65.4%) | 136 (34.6%) |
| Bachelor's Degree or higher | 250 (100.0%) | 0 (0.0%) |
Occupancy by Age of Householder in Matoaca
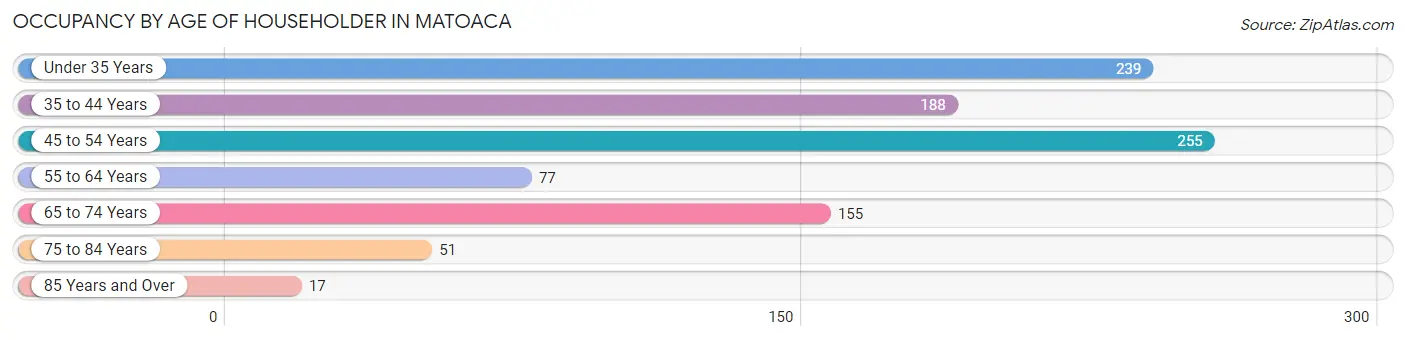
| Age Bracket | # Households | % Households |
| Under 35 Years | 239 | 24.3% |
| 35 to 44 Years | 188 | 19.1% |
| 45 to 54 Years | 255 | 26.0% |
| 55 to 64 Years | 77 | 7.8% |
| 65 to 74 Years | 155 | 15.8% |
| 75 to 84 Years | 51 | 5.2% |
| 85 Years and Over | 17 | 1.7% |
| Total | 982 | 100.0% |
Housing Finances in Matoaca
Median Income by Occupancy in Matoaca
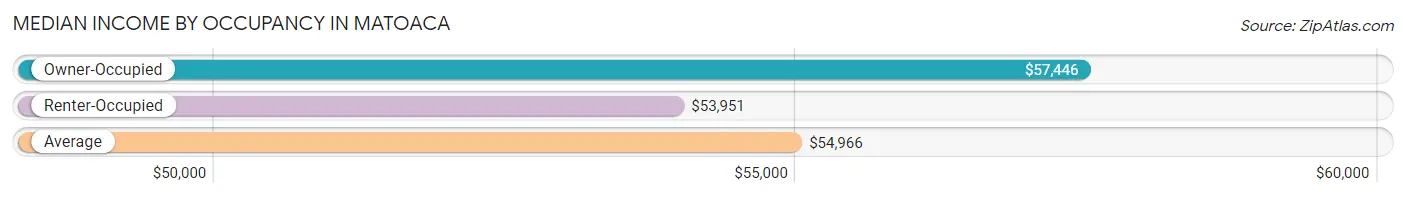
| Occupancy Type | # Households | Median Income |
| Owner-Occupied | 747 (76.1%) | $57,446 |
| Renter-Occupied | 235 (23.9%) | $53,951 |
| Average | 982 (100.0%) | $54,966 |
Occupancy by Householder Income Bracket in Matoaca
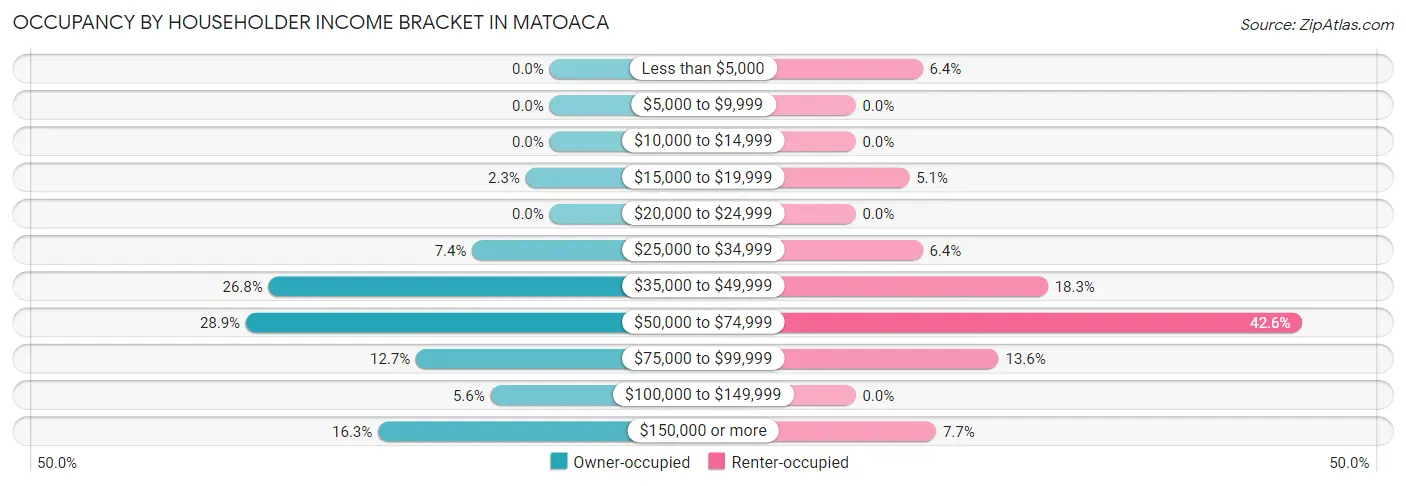
| Income Bracket | Owner-occupied | Renter-occupied |
| Less than $5,000 | 0 (0.0%) | 15 (6.4%) |
| $5,000 to $9,999 | 0 (0.0%) | 0 (0.0%) |
| $10,000 to $14,999 | 0 (0.0%) | 0 (0.0%) |
| $15,000 to $19,999 | 17 (2.3%) | 12 (5.1%) |
| $20,000 to $24,999 | 0 (0.0%) | 0 (0.0%) |
| $25,000 to $34,999 | 55 (7.4%) | 15 (6.4%) |
| $35,000 to $49,999 | 200 (26.8%) | 43 (18.3%) |
| $50,000 to $74,999 | 216 (28.9%) | 100 (42.5%) |
| $75,000 to $99,999 | 95 (12.7%) | 32 (13.6%) |
| $100,000 to $149,999 | 42 (5.6%) | 0 (0.0%) |
| $150,000 or more | 122 (16.3%) | 18 (7.7%) |
| Total | 747 (100.0%) | 235 (100.0%) |
Monthly Housing Cost Tiers in Matoaca
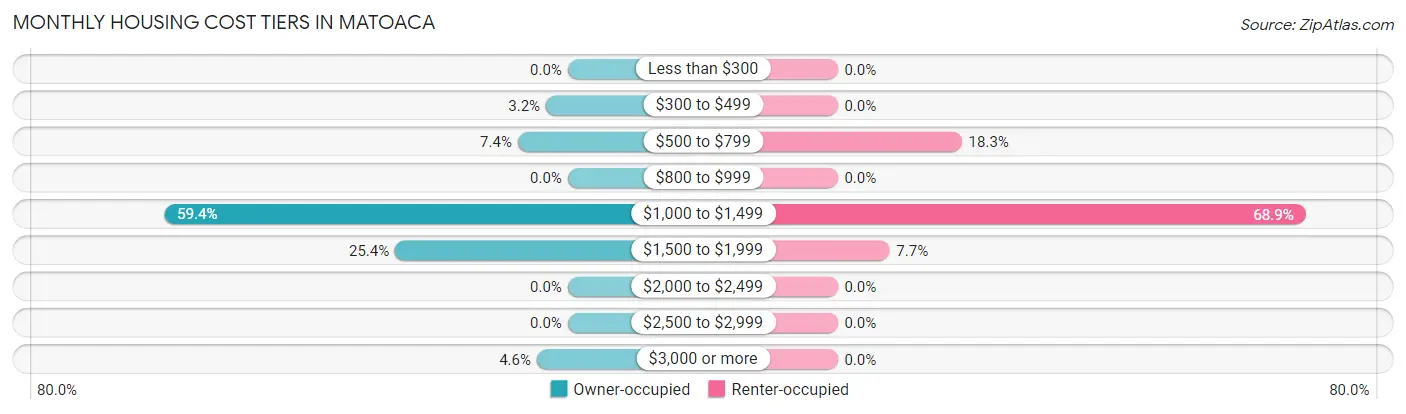
| Monthly Cost | Owner-occupied | Renter-occupied |
| Less than $300 | 0 (0.0%) | 0 (0.0%) |
| $300 to $499 | 24 (3.2%) | 0 (0.0%) |
| $500 to $799 | 55 (7.4%) | 43 (18.3%) |
| $800 to $999 | 0 (0.0%) | 0 (0.0%) |
| $1,000 to $1,499 | 444 (59.4%) | 162 (68.9%) |
| $1,500 to $1,999 | 190 (25.4%) | 18 (7.7%) |
| $2,000 to $2,499 | 0 (0.0%) | 0 (0.0%) |
| $2,500 to $2,999 | 0 (0.0%) | 0 (0.0%) |
| $3,000 or more | 34 (4.5%) | 0 (0.0%) |
| Total | 747 (100.0%) | 235 (100.0%) |
Physical Housing Characteristics in Matoaca
Housing Structures in Matoaca
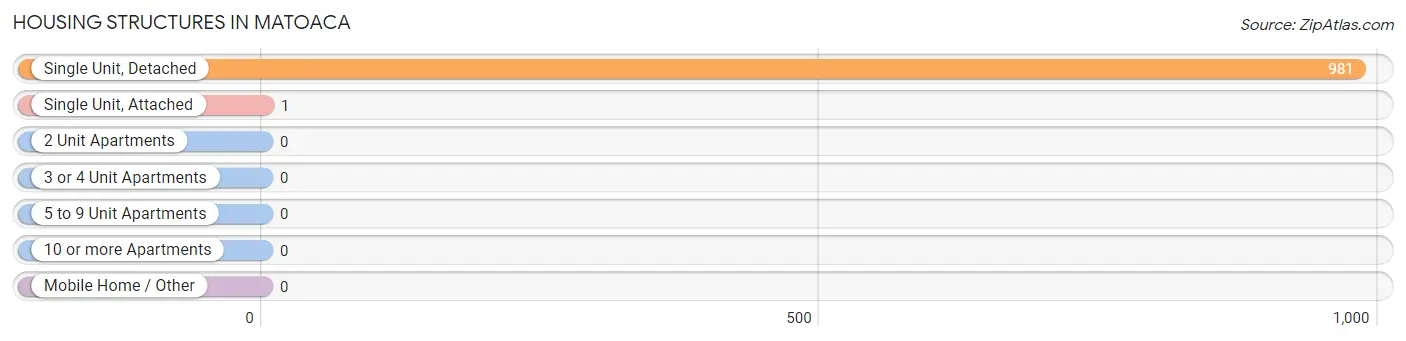
| Structure Type | # Housing Units | % Housing Units |
| Single Unit, Detached | 981 | 99.9% |
| Single Unit, Attached | 1 | 0.1% |
| 2 Unit Apartments | 0 | 0.0% |
| 3 or 4 Unit Apartments | 0 | 0.0% |
| 5 to 9 Unit Apartments | 0 | 0.0% |
| 10 or more Apartments | 0 | 0.0% |
| Mobile Home / Other | 0 | 0.0% |
| Total | 982 | 100.0% |
Housing Structures by Occupancy in Matoaca
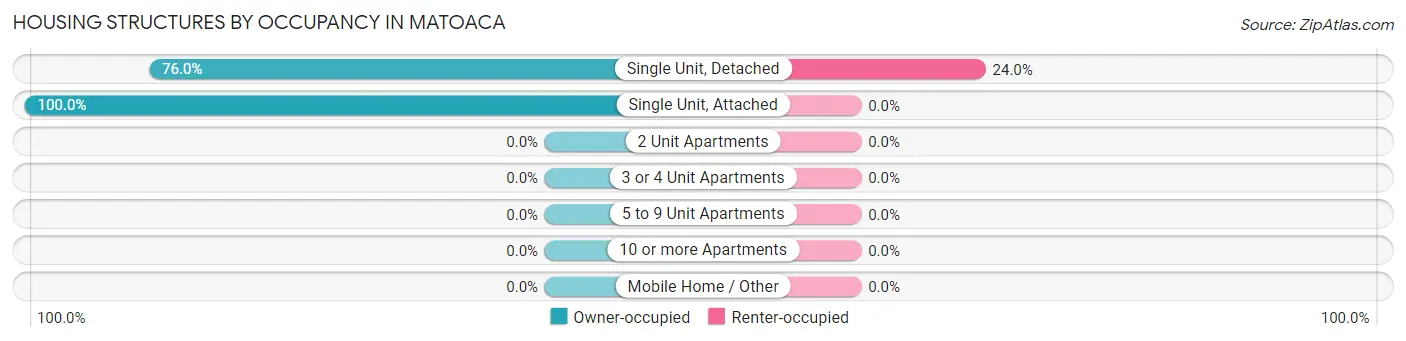
| Structure Type | Owner-occupied | Renter-occupied |
| Single Unit, Detached | 746 (76.0%) | 235 (24.0%) |
| Single Unit, Attached | 1 (100.0%) | 0 (0.0%) |
| 2 Unit Apartments | 0 (0.0%) | 0 (0.0%) |
| 3 or 4 Unit Apartments | 0 (0.0%) | 0 (0.0%) |
| 5 to 9 Unit Apartments | 0 (0.0%) | 0 (0.0%) |
| 10 or more Apartments | 0 (0.0%) | 0 (0.0%) |
| Mobile Home / Other | 0 (0.0%) | 0 (0.0%) |
| Total | 747 (76.1%) | 235 (23.9%) |
Housing Structures by Number of Rooms in Matoaca
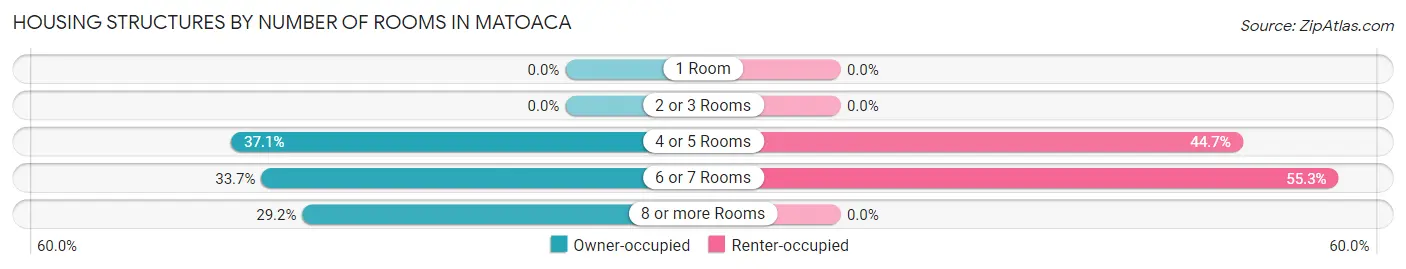
| Number of Rooms | Owner-occupied | Renter-occupied |
| 1 Room | 0 (0.0%) | 0 (0.0%) |
| 2 or 3 Rooms | 0 (0.0%) | 0 (0.0%) |
| 4 or 5 Rooms | 277 (37.1%) | 105 (44.7%) |
| 6 or 7 Rooms | 252 (33.7%) | 130 (55.3%) |
| 8 or more Rooms | 218 (29.2%) | 0 (0.0%) |
| Total | 747 (100.0%) | 235 (100.0%) |
Housing Structure by Heating Type in Matoaca
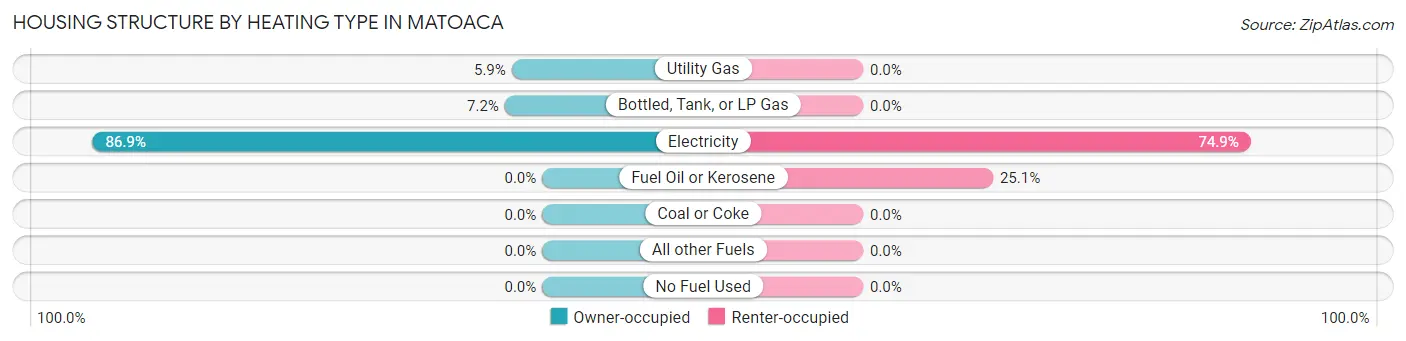
| Heating Type | Owner-occupied | Renter-occupied |
| Utility Gas | 44 (5.9%) | 0 (0.0%) |
| Bottled, Tank, or LP Gas | 54 (7.2%) | 0 (0.0%) |
| Electricity | 649 (86.9%) | 176 (74.9%) |
| Fuel Oil or Kerosene | 0 (0.0%) | 59 (25.1%) |
| Coal or Coke | 0 (0.0%) | 0 (0.0%) |
| All other Fuels | 0 (0.0%) | 0 (0.0%) |
| No Fuel Used | 0 (0.0%) | 0 (0.0%) |
| Total | 747 (100.0%) | 235 (100.0%) |
Household Vehicle Usage in Matoaca
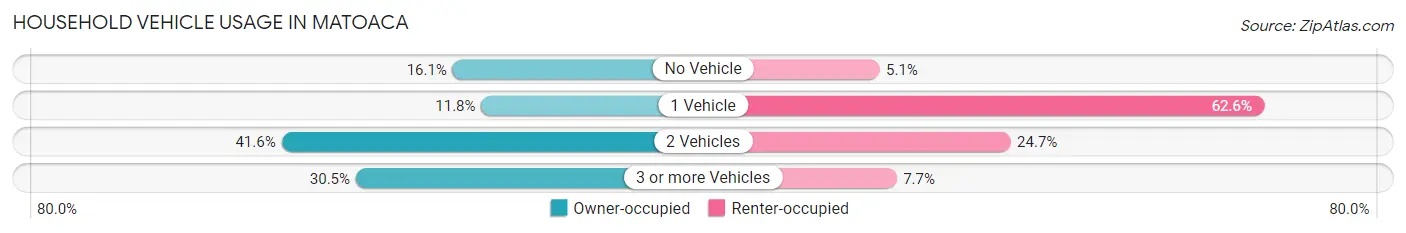
| Vehicles per Household | Owner-occupied | Renter-occupied |
| No Vehicle | 120 (16.1%) | 12 (5.1%) |
| 1 Vehicle | 88 (11.8%) | 147 (62.5%) |
| 2 Vehicles | 311 (41.6%) | 58 (24.7%) |
| 3 or more Vehicles | 228 (30.5%) | 18 (7.7%) |
| Total | 747 (100.0%) | 235 (100.0%) |
Real Estate & Mortgages in Matoaca
Real Estate and Mortgage Overview in Matoaca
| Characteristic | Without Mortgage | With Mortgage |
| Housing Units | 62 | 685 |
| Median Property Value | $193,400 | $187,200 |
| Median Household Income | $48,026 | $122 |
| Monthly Housing Costs | $532 | $34 |
| Real Estate Taxes | $1,931 | $0 |
Property Value by Mortgage Status in Matoaca
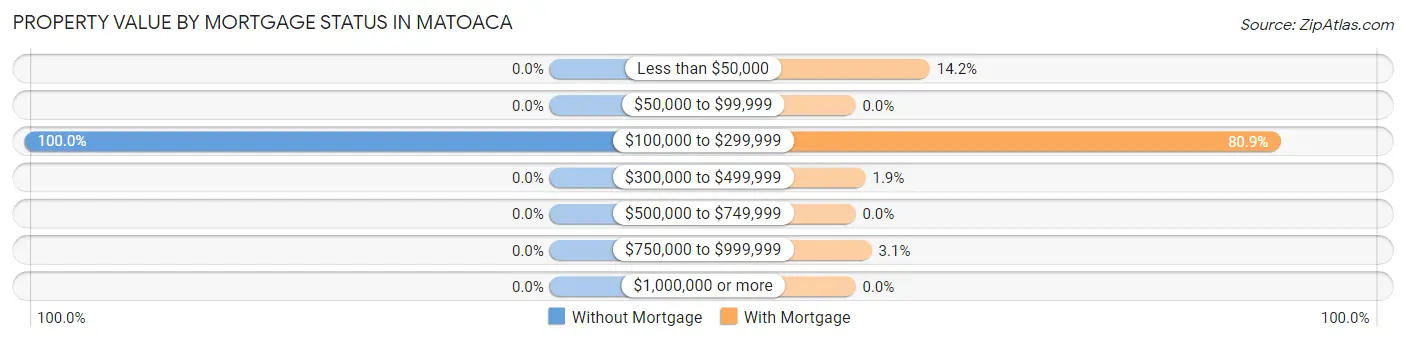
| Property Value | Without Mortgage | With Mortgage |
| Less than $50,000 | 0 (0.0%) | 97 (14.2%) |
| $50,000 to $99,999 | 0 (0.0%) | 0 (0.0%) |
| $100,000 to $299,999 | 62 (100.0%) | 554 (80.9%) |
| $300,000 to $499,999 | 0 (0.0%) | 13 (1.9%) |
| $500,000 to $749,999 | 0 (0.0%) | 0 (0.0%) |
| $750,000 to $999,999 | 0 (0.0%) | 21 (3.1%) |
| $1,000,000 or more | 0 (0.0%) | 0 (0.0%) |
| Total | 62 (100.0%) | 685 (100.0%) |
Household Income by Mortgage Status in Matoaca
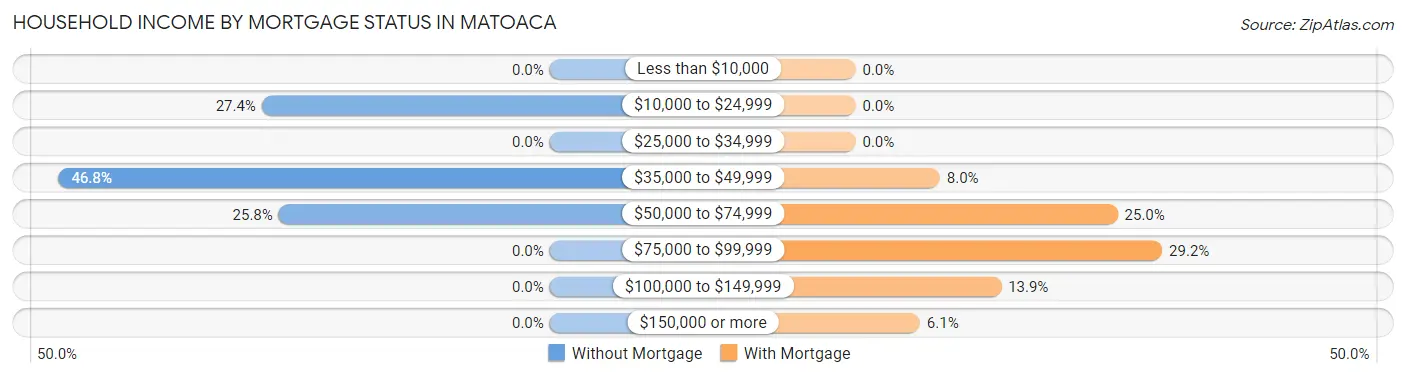
| Household Income | Without Mortgage | With Mortgage |
| Less than $10,000 | 0 (0.0%) | 0 (0.0%) |
| $10,000 to $24,999 | 17 (27.4%) | 0 (0.0%) |
| $25,000 to $34,999 | 0 (0.0%) | 0 (0.0%) |
| $35,000 to $49,999 | 29 (46.8%) | 55 (8.0%) |
| $50,000 to $74,999 | 16 (25.8%) | 171 (25.0%) |
| $75,000 to $99,999 | 0 (0.0%) | 200 (29.2%) |
| $100,000 to $149,999 | 0 (0.0%) | 95 (13.9%) |
| $150,000 or more | 0 (0.0%) | 42 (6.1%) |
| Total | 62 (100.0%) | 685 (100.0%) |
Property Value to Household Income Ratio in Matoaca
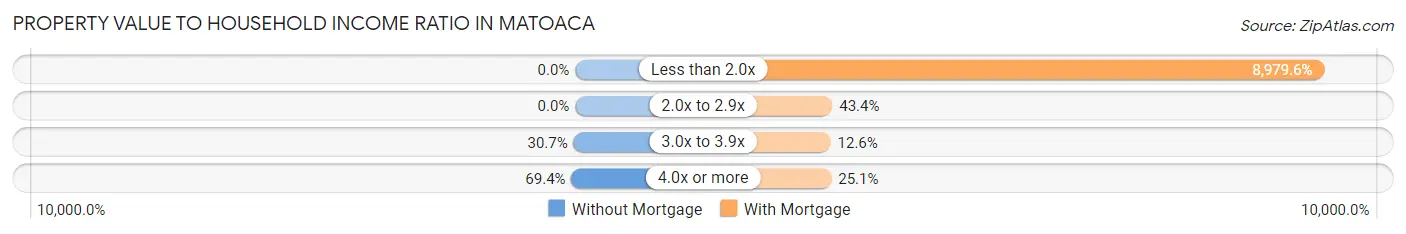
| Value-to-Income Ratio | Without Mortgage | With Mortgage |
| Less than 2.0x | 0 (0.0%) | 61,510 (8,979.6%) |
| 2.0x to 2.9x | 0 (0.0%) | 297 (43.4%) |
| 3.0x to 3.9x | 19 (30.6%) | 86 (12.6%) |
| 4.0x or more | 43 (69.4%) | 172 (25.1%) |
| Total | 62 (100.0%) | 685 (100.0%) |
Real Estate Taxes by Mortgage Status in Matoaca
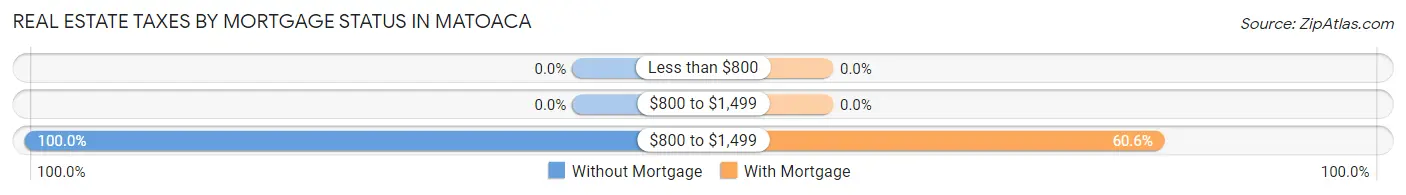
| Property Taxes | Without Mortgage | With Mortgage |
| Less than $800 | 0 (0.0%) | 0 (0.0%) |
| $800 to $1,499 | 0 (0.0%) | 0 (0.0%) |
| $800 to $1,499 | 62 (100.0%) | 415 (60.6%) |
| Total | 62 (100.0%) | 685 (100.0%) |
Health & Disability in Matoaca
Health Insurance Coverage by Age in Matoaca
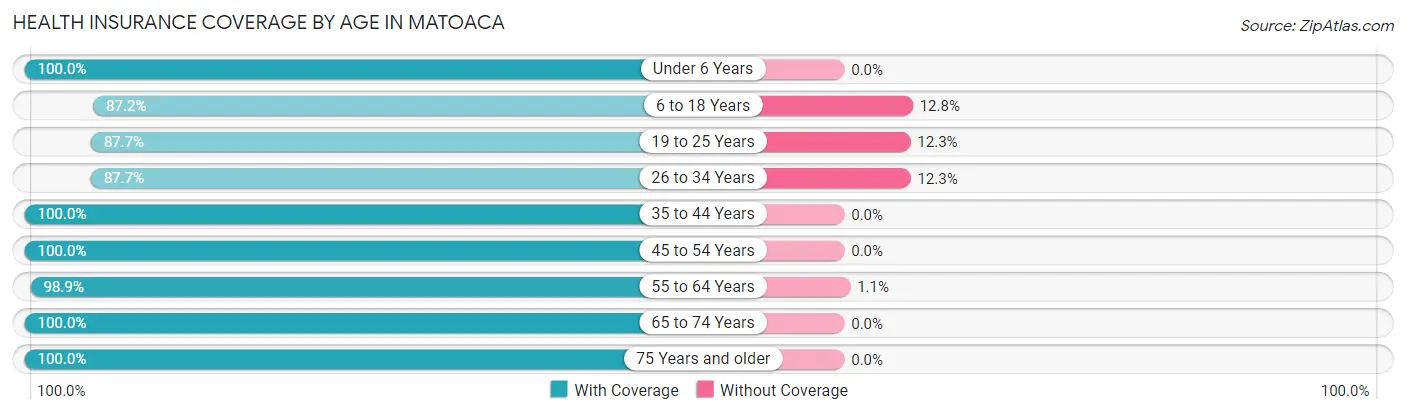
| Age Bracket | With Coverage | Without Coverage |
| Under 6 Years | 286 (100.0%) | 0 (0.0%) |
| 6 to 18 Years | 376 (87.2%) | 55 (12.8%) |
| 19 to 25 Years | 199 (87.7%) | 28 (12.3%) |
| 26 to 34 Years | 270 (87.7%) | 38 (12.3%) |
| 35 to 44 Years | 285 (100.0%) | 0 (0.0%) |
| 45 to 54 Years | 404 (100.0%) | 0 (0.0%) |
| 55 to 64 Years | 90 (98.9%) | 1 (1.1%) |
| 65 to 74 Years | 211 (100.0%) | 0 (0.0%) |
| 75 Years and older | 91 (100.0%) | 0 (0.0%) |
| Total | 2,212 (94.8%) | 122 (5.2%) |
Health Insurance Coverage by Citizenship Status in Matoaca
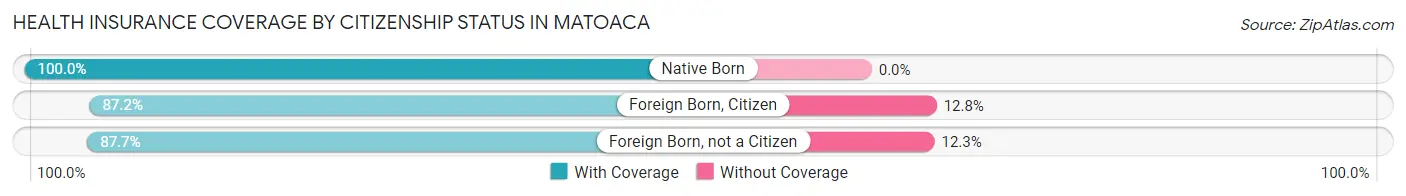
| Citizenship Status | With Coverage | Without Coverage |
| Native Born | 286 (100.0%) | 0 (0.0%) |
| Foreign Born, Citizen | 376 (87.2%) | 55 (12.8%) |
| Foreign Born, not a Citizen | 199 (87.7%) | 28 (12.3%) |
Health Insurance Coverage by Household Income in Matoaca
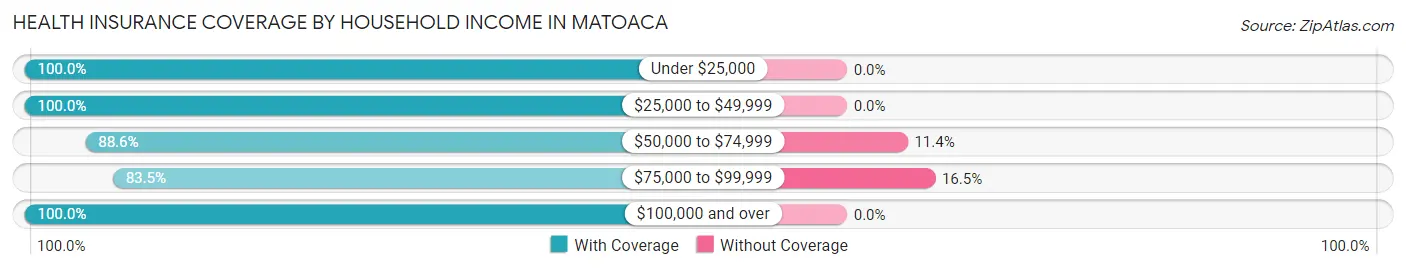
| Household Income | With Coverage | Without Coverage |
| Under $25,000 | 44 (100.0%) | 0 (0.0%) |
| $25,000 to $49,999 | 780 (100.0%) | 0 (0.0%) |
| $50,000 to $74,999 | 655 (88.6%) | 84 (11.4%) |
| $75,000 to $99,999 | 192 (83.5%) | 38 (16.5%) |
| $100,000 and over | 541 (100.0%) | 0 (0.0%) |
Public vs Private Health Insurance Coverage by Age in Matoaca
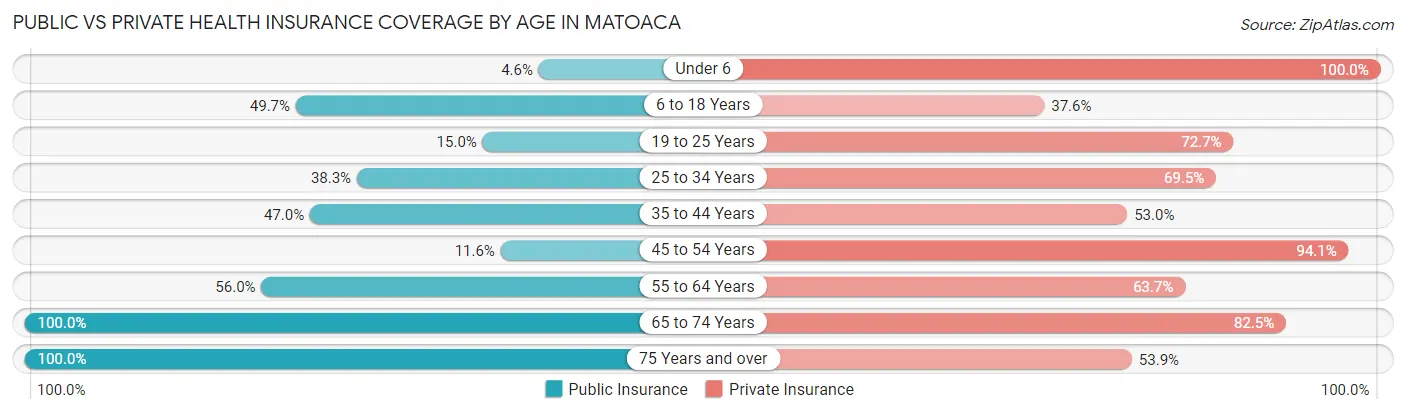
| Age Bracket | Public Insurance | Private Insurance |
| Under 6 | 13 (4.5%) | 286 (100.0%) |
| 6 to 18 Years | 214 (49.6%) | 162 (37.6%) |
| 19 to 25 Years | 34 (15.0%) | 165 (72.7%) |
| 25 to 34 Years | 118 (38.3%) | 214 (69.5%) |
| 35 to 44 Years | 134 (47.0%) | 151 (53.0%) |
| 45 to 54 Years | 47 (11.6%) | 380 (94.1%) |
| 55 to 64 Years | 51 (56.0%) | 58 (63.7%) |
| 65 to 74 Years | 211 (100.0%) | 174 (82.5%) |
| 75 Years and over | 91 (100.0%) | 49 (53.8%) |
| Total | 913 (39.1%) | 1,639 (70.2%) |
Disability Status by Sex by Age in Matoaca
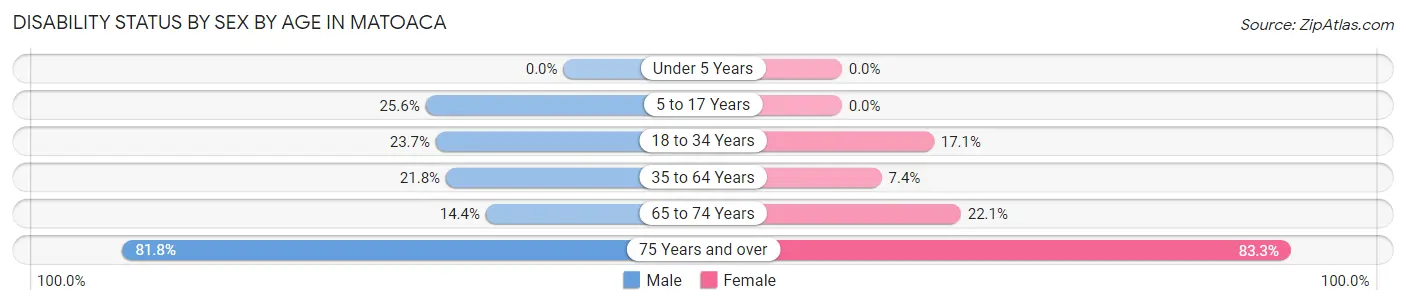
| Age Bracket | Male | Female |
| Under 5 Years | 0 (0.0%) | 0 (0.0%) |
| 5 to 17 Years | 54 (25.6%) | 0 (0.0%) |
| 18 to 34 Years | 49 (23.7%) | 56 (17.1%) |
| 35 to 64 Years | 58 (21.8%) | 38 (7.4%) |
| 65 to 74 Years | 18 (14.4%) | 19 (22.1%) |
| 75 Years and over | 45 (81.8%) | 30 (83.3%) |
Disability Class by Sex by Age in Matoaca
Disability Class: Hearing Difficulty
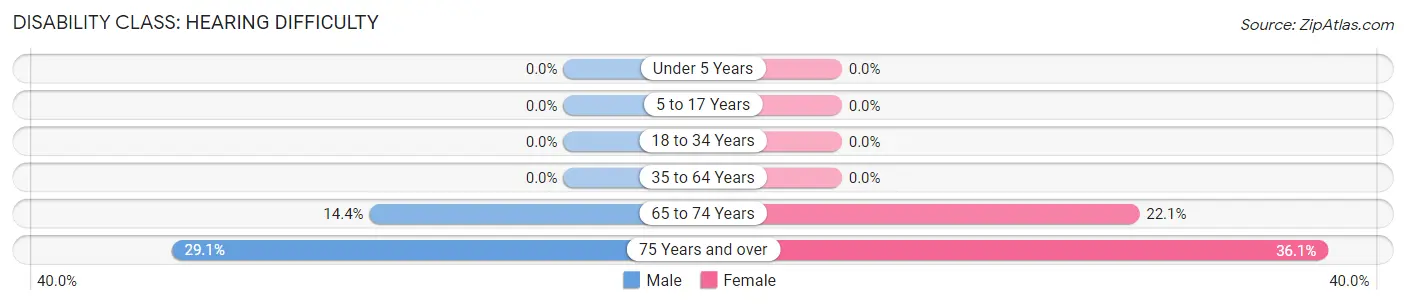
| Age Bracket | Male | Female |
| Under 5 Years | 0 (0.0%) | 0 (0.0%) |
| 5 to 17 Years | 0 (0.0%) | 0 (0.0%) |
| 18 to 34 Years | 0 (0.0%) | 0 (0.0%) |
| 35 to 64 Years | 0 (0.0%) | 0 (0.0%) |
| 65 to 74 Years | 18 (14.4%) | 19 (22.1%) |
| 75 Years and over | 16 (29.1%) | 13 (36.1%) |
Disability Class: Vision Difficulty
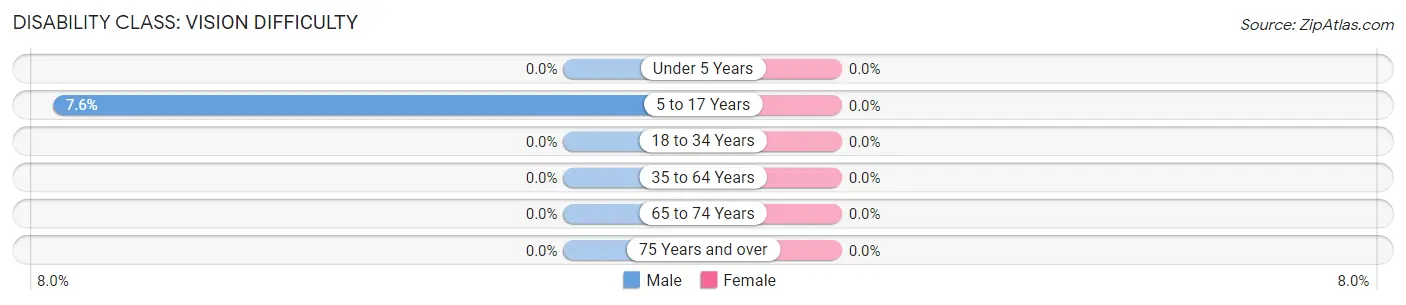
| Age Bracket | Male | Female |
| Under 5 Years | 0 (0.0%) | 0 (0.0%) |
| 5 to 17 Years | 16 (7.6%) | 0 (0.0%) |
| 18 to 34 Years | 0 (0.0%) | 0 (0.0%) |
| 35 to 64 Years | 0 (0.0%) | 0 (0.0%) |
| 65 to 74 Years | 0 (0.0%) | 0 (0.0%) |
| 75 Years and over | 0 (0.0%) | 0 (0.0%) |
Disability Class: Cognitive Difficulty
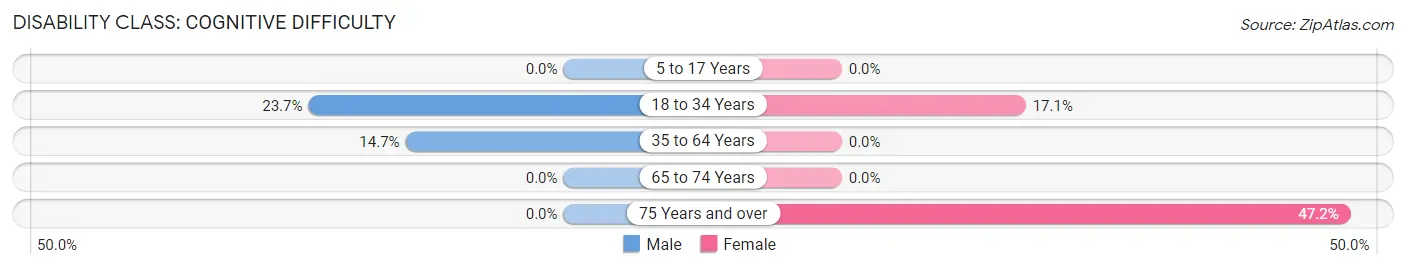
| Age Bracket | Male | Female |
| 5 to 17 Years | 0 (0.0%) | 0 (0.0%) |
| 18 to 34 Years | 49 (23.7%) | 56 (17.1%) |
| 35 to 64 Years | 39 (14.7%) | 0 (0.0%) |
| 65 to 74 Years | 0 (0.0%) | 0 (0.0%) |
| 75 Years and over | 0 (0.0%) | 17 (47.2%) |
Disability Class: Ambulatory Difficulty
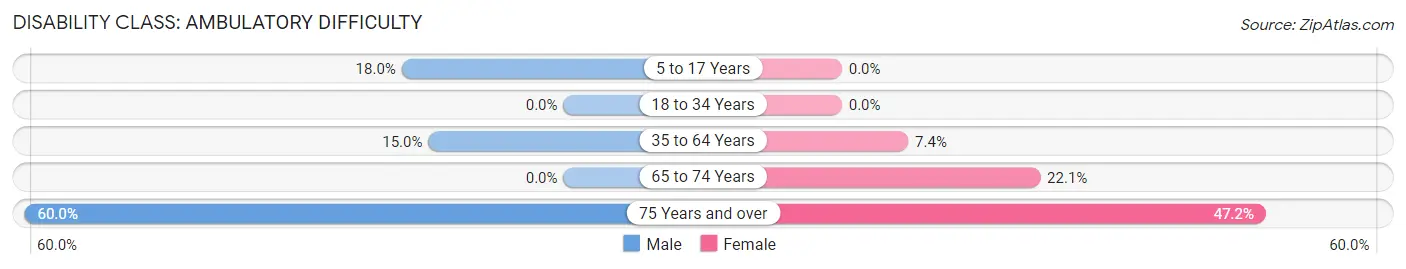
| Age Bracket | Male | Female |
| 5 to 17 Years | 38 (18.0%) | 0 (0.0%) |
| 18 to 34 Years | 0 (0.0%) | 0 (0.0%) |
| 35 to 64 Years | 40 (15.0%) | 38 (7.4%) |
| 65 to 74 Years | 0 (0.0%) | 19 (22.1%) |
| 75 Years and over | 33 (60.0%) | 17 (47.2%) |
Disability Class: Self-Care Difficulty
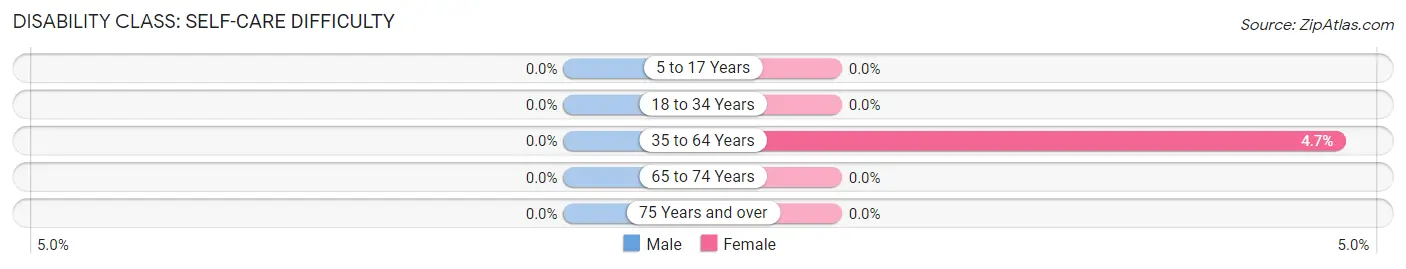
| Age Bracket | Male | Female |
| 5 to 17 Years | 0 (0.0%) | 0 (0.0%) |
| 18 to 34 Years | 0 (0.0%) | 0 (0.0%) |
| 35 to 64 Years | 0 (0.0%) | 24 (4.7%) |
| 65 to 74 Years | 0 (0.0%) | 0 (0.0%) |
| 75 Years and over | 0 (0.0%) | 0 (0.0%) |
Technology Access in Matoaca
Computing Device Access in Matoaca
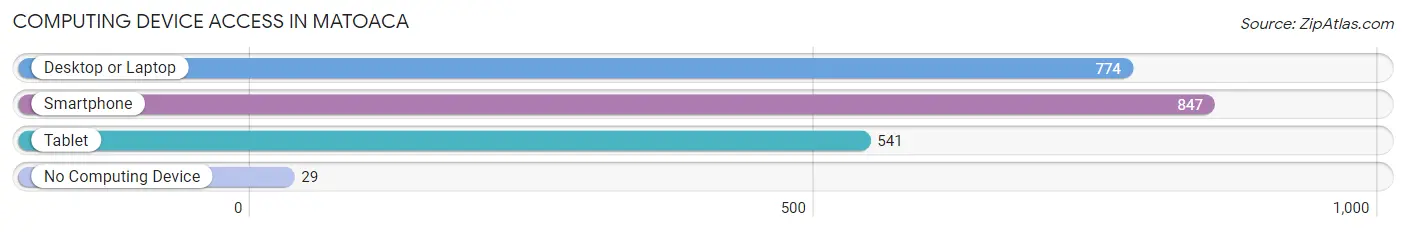
| Device Type | # Households | % Households |
| Desktop or Laptop | 774 | 78.8% |
| Smartphone | 847 | 86.3% |
| Tablet | 541 | 55.1% |
| No Computing Device | 29 | 2.9% |
| Total | 982 | 100.0% |
Internet Access in Matoaca
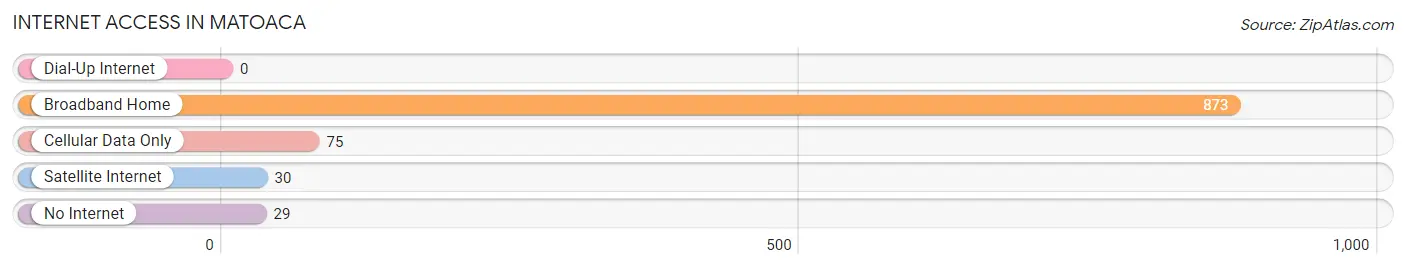
| Internet Type | # Households | % Households |
| Dial-Up Internet | 0 | 0.0% |
| Broadband Home | 873 | 88.9% |
| Cellular Data Only | 75 | 7.6% |
| Satellite Internet | 30 | 3.0% |
| No Internet | 29 | 2.9% |
| Total | 982 | 100.0% |
Matoaca Summary
Matoaca is a census-designated place (CDP) located in Chesterfield County, Virginia. It is located approximately 20 miles south of Richmond, the state capital. The population of Matoaca was 8,919 at the 2010 census.
History
Matoaca was first settled in the early 1700s by the English. The name Matoaca is derived from the Native American word for “meeting place”. The area was originally part of Henrico County, but was annexed by Chesterfield County in 1749.
In the early 1800s, Matoaca was a small farming community. The area was home to several plantations, including the Matoaca Plantation, which was owned by the Bolling family. The Bollings were prominent members of the local community and were involved in politics and business.
In the late 1800s, the area began to develop as a railroad town. The Richmond, Fredericksburg and Potomac Railroad (RF&P) built a line through Matoaca in 1881. This line connected Matoaca to Richmond and other cities in the region. The railroad brought new economic opportunities to the area and helped to spur growth.
In the early 1900s, Matoaca continued to grow. The area was home to several businesses, including a sawmill, a gristmill, and a brickyard. The town also had several churches, a school, and a post office.
In the mid-1900s, Matoaca began to experience rapid growth. The area was annexed by the City of Richmond in 1968, and the population of Matoaca increased significantly. The area was also home to several large industrial plants, including a paper mill and a chemical plant.
Geography
Matoaca is located in the Piedmont region of Virginia. The area is located in the southeastern part of Chesterfield County, approximately 20 miles south of Richmond. The area is bordered by the Appomattox River to the east and the James River to the west.
The terrain of Matoaca is mostly flat, with some rolling hills. The area is mostly wooded, with some open fields. The climate is humid subtropical, with hot, humid summers and mild winters.
Economy
Matoaca’s economy is largely based on manufacturing and services. The area is home to several large industrial plants, including a paper mill and a chemical plant. The area is also home to several retail stores, restaurants, and other businesses.
The area is also home to several government agencies, including the U.S. Army Corps of Engineers and the U.S. Department of Agriculture. The area is also home to several educational institutions, including Virginia State University and John Tyler Community College.
Demographics
As of the 2010 census, the population of Matoaca was 8,919. The racial makeup of the area was 79.3% White, 15.2% African American, 0.7% Native American, 1.2% Asian, 0.1% Pacific Islander, and 3.5% from other races. Hispanic or Latino of any race were 4.2% of the population.
The median household income in Matoaca was $50,945, and the median family income was $60,945. The per capita income was $25,945. About 8.3% of families and 10.2% of the population were below the poverty line.
Common Questions
What is Per Capita Income in Matoaca?
Per Capita income in Matoaca is $30,697.
What is the Median Family Income in Matoaca?
Median Family Income in Matoaca is $70,317.
What is the Median Household income in Matoaca?
Median Household Income in Matoaca is $54,966.
What is Income or Wage Gap in Matoaca?
Income or Wage Gap in Matoaca is 22.3%.
Women in Matoaca earn 77.7 cents for every dollar earned by a man.
What is Inequality or Gini Index in Matoaca?
Inequality or Gini Index in Matoaca is 0.35.
What is the Total Population of Matoaca?
Total Population of Matoaca is 2,374.
What is the Total Male Population of Matoaca?
Total Male Population of Matoaca is 1,013.
What is the Total Female Population of Matoaca?
Total Female Population of Matoaca is 1,361.
What is the Ratio of Males per 100 Females in Matoaca?
There are 74.43 Males per 100 Females in Matoaca.
What is the Ratio of Females per 100 Males in Matoaca?
There are 134.35 Females per 100 Males in Matoaca.
What is the Median Population Age in Matoaca?
Median Population Age in Matoaca is 31.3 Years.
What is the Average Family Size in Matoaca
Average Family Size in Matoaca is 2.9 People.
What is the Average Household Size in Matoaca
Average Household Size in Matoaca is 2.4 People.
How Large is the Labor Force in Matoaca?
There are 1,358 People in the Labor Forcein in Matoaca.
What is the Percentage of People in the Labor Force in Matoaca?
77.4% of People are in the Labor Force in Matoaca.