Zip Codes with the Highest Percentage of Population with a Degree in Computers and Mathematics in Virginia
RELATED REPORTS & OPTIONS
Computers and Mathematics
Virginia
Compare Zip Codes
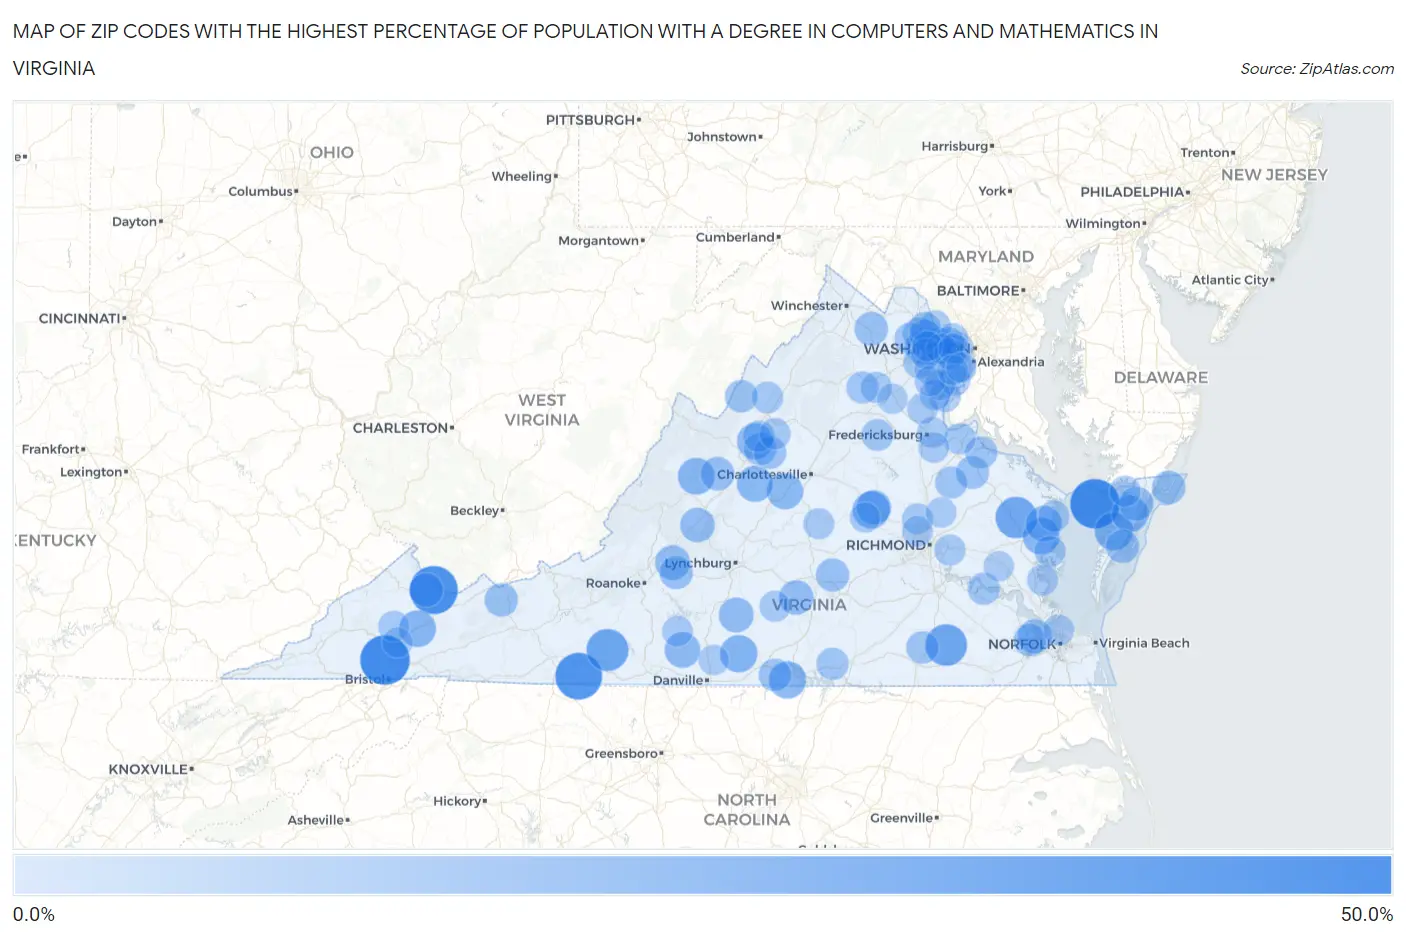
Map of Zip Codes with the Highest Percentage of Population with a Degree in Computers and Mathematics in Virginia
0.0%
50.0%
Zip Codes with the Highest Percentage of Population with a Degree in Computers and Mathematics in Virginia
| Zip Code | % Graduates | vs State | vs National | |
| 1. | 24270 | 50.0% | 6.6%(+43.4)#1 | 4.9%(+45.1)#79 |
| 2. | 23440 | 50.0% | 6.6%(+43.4)#2 | 4.9%(+45.1)#80 |
| 3. | 24622 | 46.9% | 6.6%(+40.3)#3 | 4.9%(+42.0)#99 |
| 4. | 24053 | 44.1% | 6.6%(+37.5)#4 | 4.9%(+39.2)#112 |
| 5. | 24185 | 33.8% | 6.6%(+27.3)#5 | 4.9%(+29.0)#179 |
| 6. | 23897 | 33.1% | 6.6%(+26.5)#6 | 4.9%(+28.2)#196 |
| 7. | 23079 | 32.5% | 6.6%(+26.0)#7 | 4.9%(+27.6)#198 |
| 8. | 23422 | 25.7% | 6.6%(+19.1)#8 | 4.9%(+20.8)#291 |
| 9. | 24597 | 24.4% | 6.6%(+17.8)#9 | 4.9%(+19.5)#315 |
| 10. | 24580 | 24.1% | 6.6%(+17.5)#10 | 4.9%(+19.2)#325 |
| 11. | 23153 | 23.7% | 6.6%(+17.1)#11 | 4.9%(+18.8)#345 |
| 12. | 23169 | 23.0% | 6.6%(+16.4)#12 | 4.9%(+18.1)#363 |
| 13. | 24439 | 22.9% | 6.6%(+16.3)#13 | 4.9%(+18.0)#366 |
| 14. | 24280 | 22.9% | 6.6%(+16.3)#14 | 4.9%(+18.0)#367 |
| 15. | 23357 | 22.9% | 6.6%(+16.3)#15 | 4.9%(+18.0)#368 |
| 16. | 22931 | 21.7% | 6.6%(+15.1)#16 | 4.9%(+16.8)#404 |
| 17. | 22952 | 21.7% | 6.6%(+15.1)#17 | 4.9%(+16.8)#405 |
| 18. | 24467 | 21.2% | 6.6%(+14.6)#18 | 4.9%(+16.3)#420 |
| 19. | 22576 | 21.2% | 6.6%(+14.6)#19 | 4.9%(+16.3)#421 |
| 20. | 24530 | 20.6% | 6.6%(+14.1)#20 | 4.9%(+15.7)#442 |
| 21. | 24569 | 19.0% | 6.6%(+12.5)#21 | 4.9%(+14.2)#503 |
| 22. | 24122 | 18.8% | 6.6%(+12.2)#22 | 4.9%(+13.9)#520 |
| 23. | 23065 | 18.5% | 6.6%(+11.9)#23 | 4.9%(+13.6)#532 |
| 24. | 24555 | 18.4% | 6.6%(+11.8)#24 | 4.9%(+13.5)#548 |
| 25. | 23934 | 18.1% | 6.6%(+11.6)#25 | 4.9%(+13.2)#559 |
| 26. | 23308 | 17.6% | 6.6%(+11.1)#26 | 4.9%(+12.7)#581 |
| 27. | 23436 | 17.5% | 6.6%(+10.9)#27 | 4.9%(+12.6)#589 |
| 28. | 24657 | 16.7% | 6.6%(+10.1)#28 | 4.9%(+11.8)#652 |
| 29. | 24459 | 16.5% | 6.6%(+9.92)#29 | 4.9%(+11.6)#659 |
| 30. | 20130 | 16.4% | 6.6%(+9.78)#30 | 4.9%(+11.5)#669 |
| 31. | 23336 | 16.1% | 6.6%(+9.53)#31 | 4.9%(+11.2)#694 |
| 32. | 23423 | 16.1% | 6.6%(+9.53)#32 | 4.9%(+11.2)#696 |
| 33. | 24174 | 15.8% | 6.6%(+9.22)#33 | 4.9%(+10.9)#719 |
| 34. | 24314 | 15.7% | 6.6%(+9.11)#34 | 4.9%(+10.8)#733 |
| 35. | 23966 | 15.7% | 6.6%(+9.10)#35 | 4.9%(+10.8)#734 |
| 36. | 22436 | 15.2% | 6.6%(+8.58)#36 | 4.9%(+10.3)#774 |
| 37. | 24437 | 14.9% | 6.6%(+8.35)#37 | 4.9%(+10.0)#796 |
| 38. | 22033 | 14.7% | 6.6%(+8.13)#38 | 4.9%(+9.80)#820 |
| 39. | 20152 | 14.4% | 6.6%(+7.87)#39 | 4.9%(+9.55)#849 |
| 40. | 23432 | 14.3% | 6.6%(+7.75)#40 | 4.9%(+9.43)#859 |
| 41. | 22831 | 14.3% | 6.6%(+7.71)#41 | 4.9%(+9.39)#868 |
| 42. | 24598 | 14.2% | 6.6%(+7.59)#42 | 4.9%(+9.27)#893 |
| 43. | 24431 | 14.1% | 6.6%(+7.55)#43 | 4.9%(+9.23)#896 |
| 44. | 23867 | 14.0% | 6.6%(+7.39)#44 | 4.9%(+9.07)#912 |
| 45. | 20148 | 13.7% | 6.6%(+7.13)#45 | 4.9%(+8.81)#945 |
| 46. | 22514 | 13.7% | 6.6%(+7.09)#46 | 4.9%(+8.77)#949 |
| 47. | 23915 | 13.6% | 6.6%(+7.04)#47 | 4.9%(+8.72)#957 |
| 48. | 23899 | 13.5% | 6.6%(+6.97)#48 | 4.9%(+8.65)#972 |
| 49. | 22443 | 13.4% | 6.6%(+6.81)#49 | 4.9%(+8.49)#998 |
| 50. | 22746 | 13.3% | 6.6%(+6.70)#50 | 4.9%(+8.38)#1,012 |
| 51. | 22542 | 12.8% | 6.6%(+6.28)#51 | 4.9%(+7.96)#1,071 |
| 52. | 20171 | 12.8% | 6.6%(+6.27)#52 | 4.9%(+7.95)#1,074 |
| 53. | 20165 | 12.7% | 6.6%(+6.09)#53 | 4.9%(+7.77)#1,100 |
| 54. | 22043 | 12.3% | 6.6%(+5.76)#54 | 4.9%(+7.44)#1,160 |
| 55. | 20105 | 12.3% | 6.6%(+5.75)#55 | 4.9%(+7.43)#1,165 |
| 56. | 22834 | 12.3% | 6.6%(+5.70)#56 | 4.9%(+7.38)#1,172 |
| 57. | 22026 | 12.1% | 6.6%(+5.58)#57 | 4.9%(+7.25)#1,191 |
| 58. | 24486 | 11.8% | 6.6%(+5.20)#58 | 4.9%(+6.88)#1,259 |
| 59. | 20109 | 11.8% | 6.6%(+5.18)#59 | 4.9%(+6.86)#1,275 |
| 60. | 22102 | 11.7% | 6.6%(+5.17)#60 | 4.9%(+6.84)#1,277 |
| 61. | 20166 | 11.7% | 6.6%(+5.10)#61 | 4.9%(+6.78)#1,288 |
| 62. | 22485 | 11.6% | 6.6%(+5.02)#62 | 4.9%(+6.70)#1,308 |
| 63. | 23035 | 11.6% | 6.6%(+4.99)#63 | 4.9%(+6.67)#1,317 |
| 64. | 22724 | 11.5% | 6.6%(+4.96)#64 | 4.9%(+6.63)#1,326 |
| 65. | 22150 | 11.5% | 6.6%(+4.95)#65 | 4.9%(+6.63)#1,327 |
| 66. | 24471 | 11.4% | 6.6%(+4.84)#66 | 4.9%(+6.52)#1,347 |
| 67. | 22182 | 11.4% | 6.6%(+4.78)#67 | 4.9%(+6.46)#1,361 |
| 68. | 23150 | 11.3% | 6.6%(+4.76)#68 | 4.9%(+6.44)#1,367 |
| 69. | 20147 | 11.3% | 6.6%(+4.70)#69 | 4.9%(+6.37)#1,389 |
| 70. | 22482 | 11.2% | 6.6%(+4.64)#70 | 4.9%(+6.32)#1,400 |
| 71. | 24225 | 11.1% | 6.6%(+4.54)#71 | 4.9%(+6.22)#1,420 |
| 72. | 23427 | 11.1% | 6.6%(+4.54)#72 | 4.9%(+6.22)#1,429 |
| 73. | 20111 | 11.0% | 6.6%(+4.46)#73 | 4.9%(+6.14)#1,449 |
| 74. | 23059 | 10.8% | 6.6%(+4.27)#74 | 4.9%(+5.95)#1,496 |
| 75. | 23004 | 10.8% | 6.6%(+4.22)#75 | 4.9%(+5.90)#1,504 |
| 76. | 23959 | 10.8% | 6.6%(+4.19)#76 | 4.9%(+5.87)#1,511 |
| 77. | 22079 | 10.7% | 6.6%(+4.14)#77 | 4.9%(+5.82)#1,528 |
| 78. | 23072 | 10.6% | 6.6%(+4.06)#78 | 4.9%(+5.74)#1,542 |
| 79. | 22405 | 10.6% | 6.6%(+4.06)#79 | 4.9%(+5.74)#1,543 |
| 80. | 23294 | 10.6% | 6.6%(+4.05)#80 | 4.9%(+5.73)#1,546 |
| 81. | 22556 | 10.6% | 6.6%(+4.04)#81 | 4.9%(+5.71)#1,551 |
| 82. | 22172 | 10.6% | 6.6%(+3.98)#82 | 4.9%(+5.66)#1,567 |
| 83. | 20120 | 10.4% | 6.6%(+3.83)#83 | 4.9%(+5.51)#1,614 |
| 84. | 23511 | 10.4% | 6.6%(+3.80)#84 | 4.9%(+5.48)#1,619 |
| 85. | 24137 | 10.3% | 6.6%(+3.73)#85 | 4.9%(+5.41)#1,651 |
| 86. | 22408 | 10.2% | 6.6%(+3.66)#86 | 4.9%(+5.34)#1,680 |
| 87. | 22031 | 10.2% | 6.6%(+3.58)#87 | 4.9%(+5.26)#1,705 |
| 88. | 22193 | 10.2% | 6.6%(+3.58)#88 | 4.9%(+5.26)#1,707 |
| 89. | 22124 | 10.1% | 6.6%(+3.52)#89 | 4.9%(+5.20)#1,717 |
| 90. | 20112 | 10.0% | 6.6%(+3.42)#90 | 4.9%(+5.10)#1,766 |
| 91. | 23069 | 9.9% | 6.6%(+3.36)#91 | 4.9%(+5.03)#1,784 |
| 92. | 22712 | 9.8% | 6.6%(+3.21)#92 | 4.9%(+4.89)#1,841 |
| 93. | 23168 | 9.8% | 6.6%(+3.21)#93 | 4.9%(+4.89)#1,842 |
| 94. | 20151 | 9.7% | 6.6%(+3.15)#94 | 4.9%(+4.83)#1,871 |
| 95. | 22027 | 9.6% | 6.6%(+3.08)#95 | 4.9%(+4.76)#1,906 |
| 96. | 22153 | 9.6% | 6.6%(+3.07)#96 | 4.9%(+4.75)#1,907 |
| 97. | 24527 | 9.6% | 6.6%(+3.02)#97 | 4.9%(+4.70)#1,930 |
| 98. | 24266 | 9.6% | 6.6%(+2.98)#98 | 4.9%(+4.66)#1,940 |
| 99. | 23063 | 9.5% | 6.6%(+2.94)#99 | 4.9%(+4.62)#1,961 |
| 100. | 22315 | 9.5% | 6.6%(+2.93)#100 | 4.9%(+4.61)#1,965 |
Common Questions
What are the Top 10 Zip Codes with the Highest Percentage of Population with a Degree in Computers and Mathematics in Virginia?
Top 10 Zip Codes with the Highest Percentage of Population with a Degree in Computers and Mathematics in Virginia are:
What zip code has the Highest Percentage of Population with a Degree in Computers and Mathematics in Virginia?
24270 has the Highest Percentage of Population with a Degree in Computers and Mathematics in Virginia with 50.0%.
What is the Percentage of Population with a Degree in Computers and Mathematics in the State of Virginia?
Percentage of Population with a Degree in Computers and Mathematics in Virginia is 6.6%.
What is the Percentage of Population with a Degree in Computers and Mathematics in the United States?
Percentage of Population with a Degree in Computers and Mathematics in the United States is 4.9%.