Lake Caroline, VA Map & Demographics
Lake Caroline Map
Lake Caroline Overview
$40,409
PER CAPITA INCOME
$95,014
AVG FAMILY INCOME
$83,371
AVG HOUSEHOLD INCOME
32.4%
WAGE / INCOME GAP [ % ]
67.6¢/ $1
WAGE / INCOME GAP [ $ ]
0.36
INEQUALITY / GINI INDEX
2,652
TOTAL POPULATION
1,287
MALE POPULATION
1,365
FEMALE POPULATION
94.29
MALES / 100 FEMALES
106.06
FEMALES / 100 MALES
32.4
MEDIAN AGE
2.6
AVG FAMILY SIZE
2.5
AVG HOUSEHOLD SIZE
1,472
LABOR FORCE [ PEOPLE ]
78.7%
PERCENT IN LABOR FORCE
Income in Lake Caroline
Income Overview in Lake Caroline
Per Capita Income in Lake Caroline is $40,409, while median incomes of families and households are $95,014 and $83,371 respectively.
| Characteristic | Number | Measure |
| Per Capita Income | 2,652 | $40,409 |
| Median Family Income | 741 | $95,014 |
| Mean Family Income | 741 | $88,332 |
| Median Household Income | 1,054 | $83,371 |
| Mean Household Income | 1,054 | $103,044 |
| Income Deficit | 741 | $0 |
| Wage / Income Gap (%) | 2,652 | 32.37% |
| Wage / Income Gap ($) | 2,652 | 67.63¢ per $1 |
| Gini / Inequality Index | 2,652 | 0.36 |
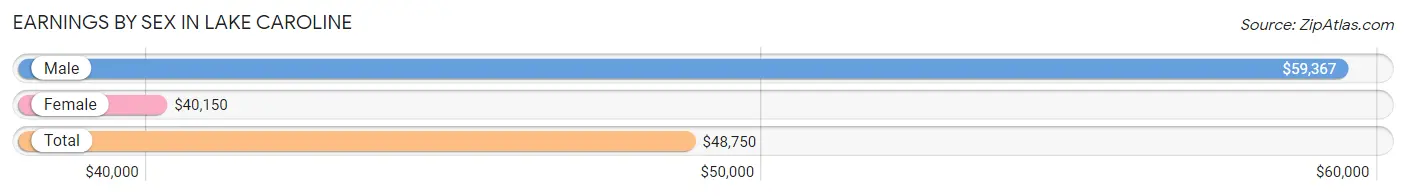
Earnings by Sex in Lake Caroline
Average Earnings in Lake Caroline are $48,750, $59,367 for men and $40,150 for women, a difference of 32.4%.
| Sex | Number | Average Earnings |
| Male | 813 (53.3%) | $59,367 |
| Female | 711 (46.7%) | $40,150 |
| Total | 1,524 (100.0%) | $48,750 |
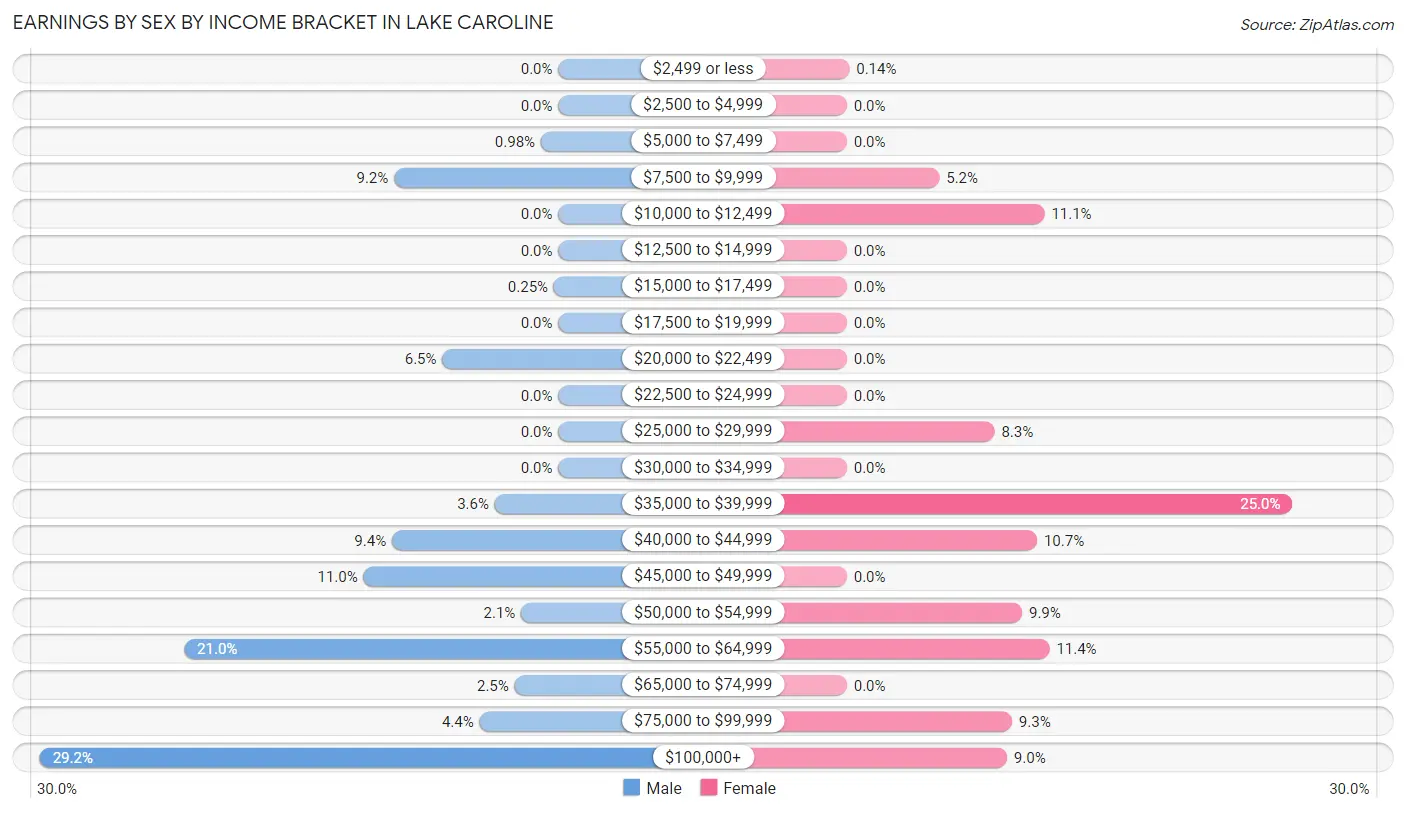
Earnings by Sex by Income Bracket in Lake Caroline
The most common earnings brackets in Lake Caroline are $100,000+ for men (237 | 29.1%) and $35,000 to $39,999 for women (178 | 25.0%).
| Income | Male | Female |
| $2,499 or less | 0 (0.0%) | 1 (0.1%) |
| $2,500 to $4,999 | 0 (0.0%) | 0 (0.0%) |
| $5,000 to $7,499 | 8 (1.0%) | 0 (0.0%) |
| $7,500 to $9,999 | 75 (9.2%) | 37 (5.2%) |
| $10,000 to $12,499 | 0 (0.0%) | 79 (11.1%) |
| $12,500 to $14,999 | 0 (0.0%) | 0 (0.0%) |
| $15,000 to $17,499 | 2 (0.3%) | 0 (0.0%) |
| $17,500 to $19,999 | 0 (0.0%) | 0 (0.0%) |
| $20,000 to $22,499 | 53 (6.5%) | 0 (0.0%) |
| $22,500 to $24,999 | 0 (0.0%) | 0 (0.0%) |
| $25,000 to $29,999 | 0 (0.0%) | 59 (8.3%) |
| $30,000 to $34,999 | 0 (0.0%) | 0 (0.0%) |
| $35,000 to $39,999 | 29 (3.6%) | 178 (25.0%) |
| $40,000 to $44,999 | 76 (9.3%) | 76 (10.7%) |
| $45,000 to $49,999 | 89 (11.0%) | 0 (0.0%) |
| $50,000 to $54,999 | 17 (2.1%) | 70 (9.9%) |
| $55,000 to $64,999 | 171 (21.0%) | 81 (11.4%) |
| $65,000 to $74,999 | 20 (2.5%) | 0 (0.0%) |
| $75,000 to $99,999 | 36 (4.4%) | 66 (9.3%) |
| $100,000+ | 237 (29.1%) | 64 (9.0%) |
| Total | 813 (100.0%) | 711 (100.0%) |
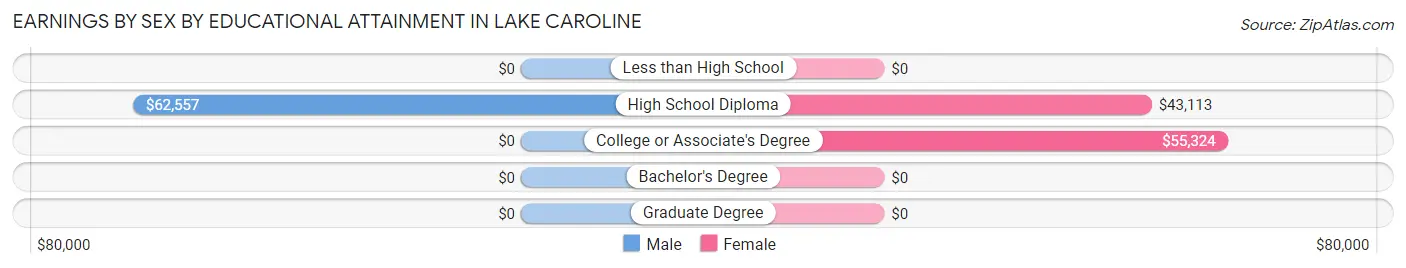
Earnings by Sex by Educational Attainment in Lake Caroline
Average earnings in Lake Caroline are $59,562 for men and $43,382 for women, a difference of 27.2%. Men with an educational attainment of high school diploma enjoy the highest average annual earnings of $62,557, while those with high school diploma education earn the least with $62,557. Women with an educational attainment of college or associate's degree earn the most with the average annual earnings of $55,324, while those with high school diploma education have the smallest earnings of $43,113.
| Educational Attainment | Male Income | Female Income |
| Less than High School | - | - |
| High School Diploma | $62,557 | $43,113 |
| College or Associate's Degree | - | - |
| Bachelor's Degree | - | - |
| Graduate Degree | - | - |
| Total | $59,562 | $43,382 |
Family Income in Lake Caroline
Family Income Brackets in Lake Caroline
According to the Lake Caroline family income data, there are 147 families falling into the $150,000 to $199,999 income range, which is the most common income bracket and makes up 19.8% of all families.
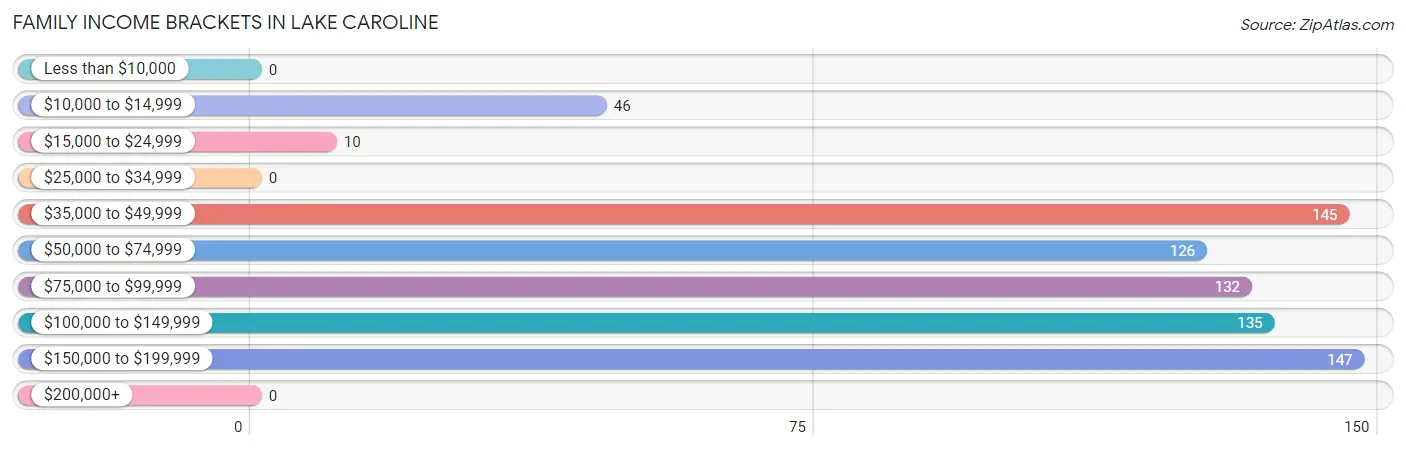
| Income Bracket | # Families | % Families |
| Less than $10,000 | 0 | 0.0% |
| $10,000 to $14,999 | 46 | 6.2% |
| $15,000 to $24,999 | 10 | 1.3% |
| $25,000 to $34,999 | 0 | 0.0% |
| $35,000 to $49,999 | 145 | 19.6% |
| $50,000 to $74,999 | 126 | 17.0% |
| $75,000 to $99,999 | 132 | 17.8% |
| $100,000 to $149,999 | 135 | 18.2% |
| $150,000 to $199,999 | 147 | 19.8% |
| $200,000+ | 0 | 0.0% |
Family Income by Famaliy Size in Lake Caroline
4-person families (175 | 23.6%) account for the highest median family income in Lake Caroline with $152,254 per family, while 4-person families (175 | 23.6%) have the highest median income of $38,064 per family member.
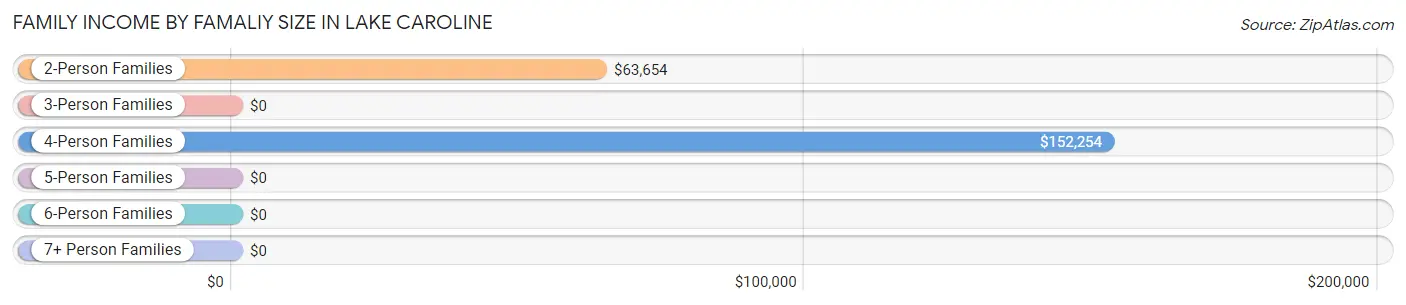
| Income Bracket | # Families | Median Income |
| 2-Person Families | 442 (59.7%) | $63,654 |
| 3-Person Families | 114 (15.4%) | $0 |
| 4-Person Families | 175 (23.6%) | $152,254 |
| 5-Person Families | 10 (1.3%) | $0 |
| 6-Person Families | 0 (0.0%) | $0 |
| 7+ Person Families | 0 (0.0%) | $0 |
| Total | 741 (100.0%) | $95,014 |
Family Income by Number of Earners in Lake Caroline
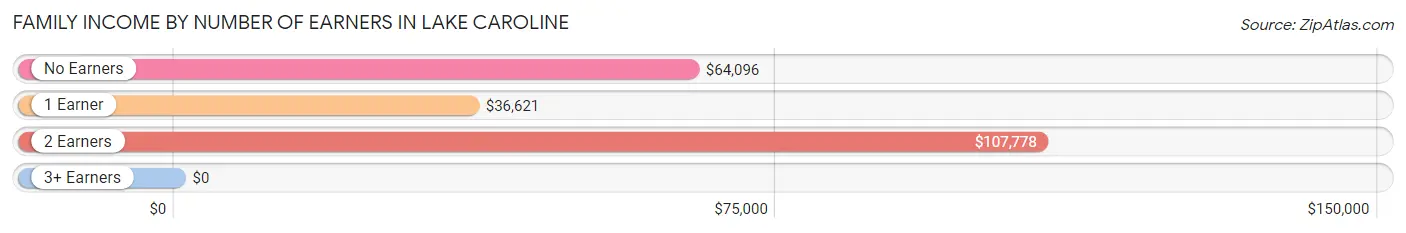
| Number of Earners | # Families | Median Income |
| No Earners | 83 (11.2%) | $64,096 |
| 1 Earner | 300 (40.5%) | $36,621 |
| 2 Earners | 358 (48.3%) | $107,778 |
| 3+ Earners | 0 (0.0%) | $0 |
| Total | 741 (100.0%) | $95,014 |
Household Income in Lake Caroline
Household Income Brackets in Lake Caroline
With 294 households falling in the category, the $50,000 to $74,999 income range is the most frequent in Lake Caroline, accounting for 27.9% of all households.
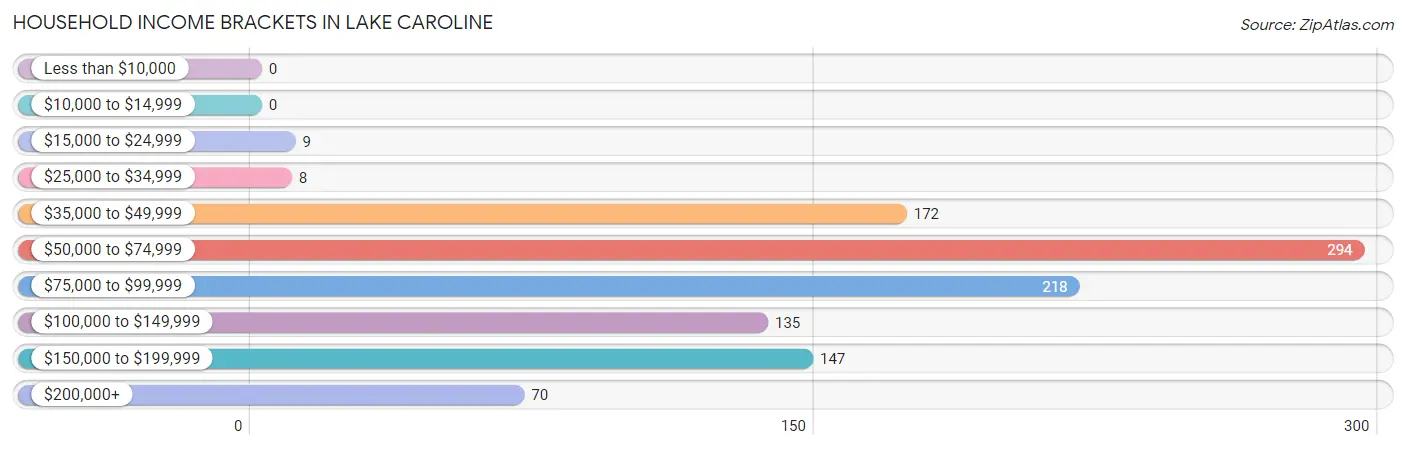
| Income Bracket | # Households | % Households |
| Less than $10,000 | 0 | 0.0% |
| $10,000 to $14,999 | 0 | 0.0% |
| $15,000 to $24,999 | 9 | 0.9% |
| $25,000 to $34,999 | 8 | 0.8% |
| $35,000 to $49,999 | 172 | 16.3% |
| $50,000 to $74,999 | 294 | 27.9% |
| $75,000 to $99,999 | 218 | 20.7% |
| $100,000 to $149,999 | 135 | 12.8% |
| $150,000 to $199,999 | 147 | 13.9% |
| $200,000+ | 70 | 6.6% |
Household Income by Householder Age in Lake Caroline
The median household income in Lake Caroline is $83,371, with the highest median household income of $96,166 found in the 45 to 64 years age bracket for the primary householder. A total of 293 households (27.8%) fall into this category. Meanwhile, the 15 to 24 years age bracket for the primary householder has the lowest median household income of $0, with 46 households (4.4%) in this group.
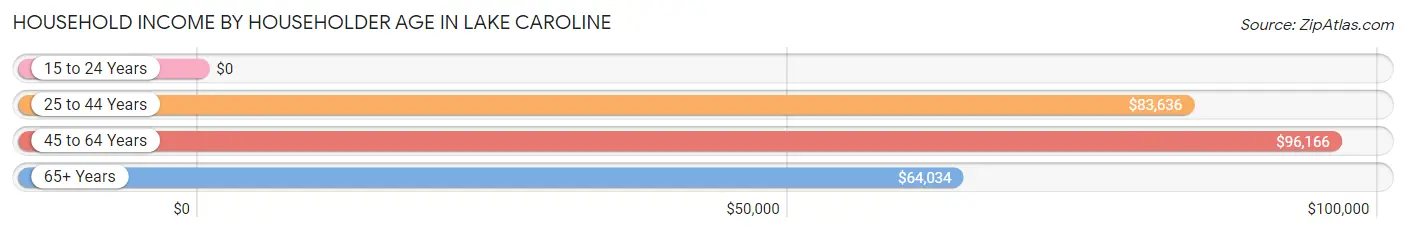
| Income Bracket | # Households | Median Income |
| 15 to 24 Years | 46 (4.4%) | $0 |
| 25 to 44 Years | 564 (53.5%) | $83,636 |
| 45 to 64 Years | 293 (27.8%) | $96,166 |
| 65+ Years | 151 (14.3%) | $64,034 |
| Total | 1,054 (100.0%) | $83,371 |
Poverty in Lake Caroline
Income Below Poverty by Sex and Age in Lake Caroline
With 8.2% poverty level for males and 25.5% for females among the residents of Lake Caroline, under 5 year old males and 5 year old females are the most vulnerable to poverty, with 20 males (39.2%) and 28 females (100.0%) in their respective age groups living below the poverty level.
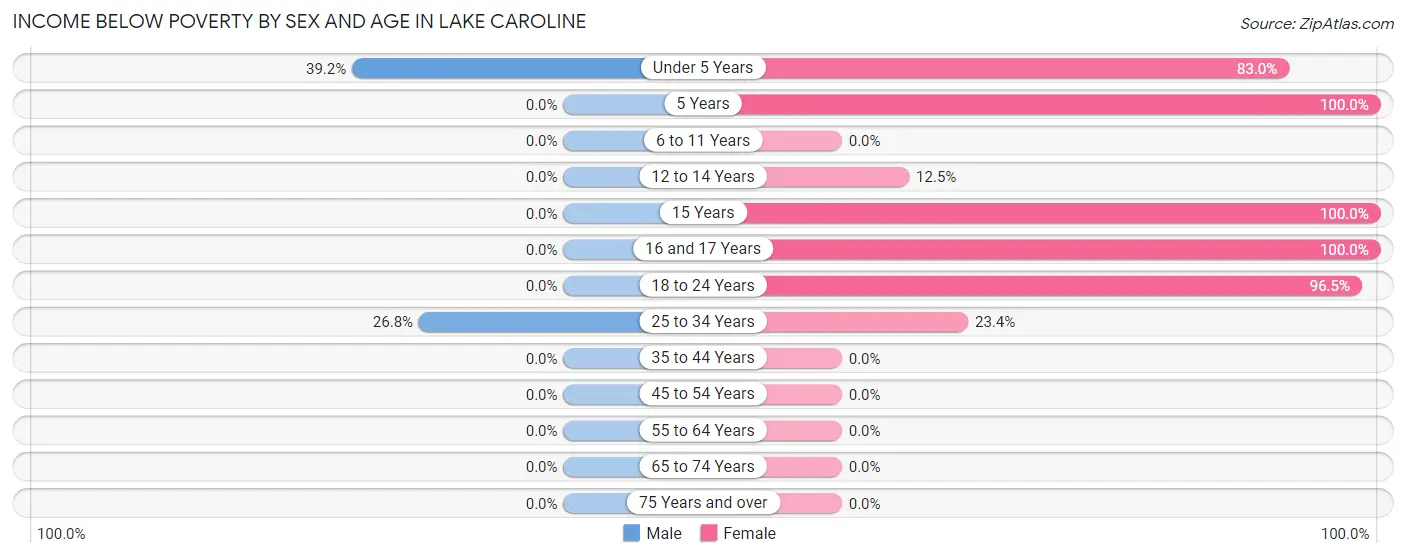
| Age Bracket | Male | Female |
| Under 5 Years | 20 (39.2%) | 44 (83.0%) |
| 5 Years | 0 (0.0%) | 28 (100.0%) |
| 6 to 11 Years | 0 (0.0%) | 0 (0.0%) |
| 12 to 14 Years | 0 (0.0%) | 27 (12.5%) |
| 15 Years | 0 (0.0%) | 55 (100.0%) |
| 16 and 17 Years | 0 (0.0%) | 55 (100.0%) |
| 18 to 24 Years | 0 (0.0%) | 83 (96.5%) |
| 25 to 34 Years | 85 (26.8%) | 56 (23.4%) |
| 35 to 44 Years | 0 (0.0%) | 0 (0.0%) |
| 45 to 54 Years | 0 (0.0%) | 0 (0.0%) |
| 55 to 64 Years | 0 (0.0%) | 0 (0.0%) |
| 65 to 74 Years | 0 (0.0%) | 0 (0.0%) |
| 75 Years and over | 0 (0.0%) | 0 (0.0%) |
| Total | 105 (8.2%) | 348 (25.5%) |
Income Above Poverty by Sex and Age in Lake Caroline
According to the poverty statistics in Lake Caroline, males aged 6 to 11 years and females aged 6 to 11 years are the age groups that are most secure financially, with 100.0% of males and 100.0% of females in these age groups living above the poverty line.
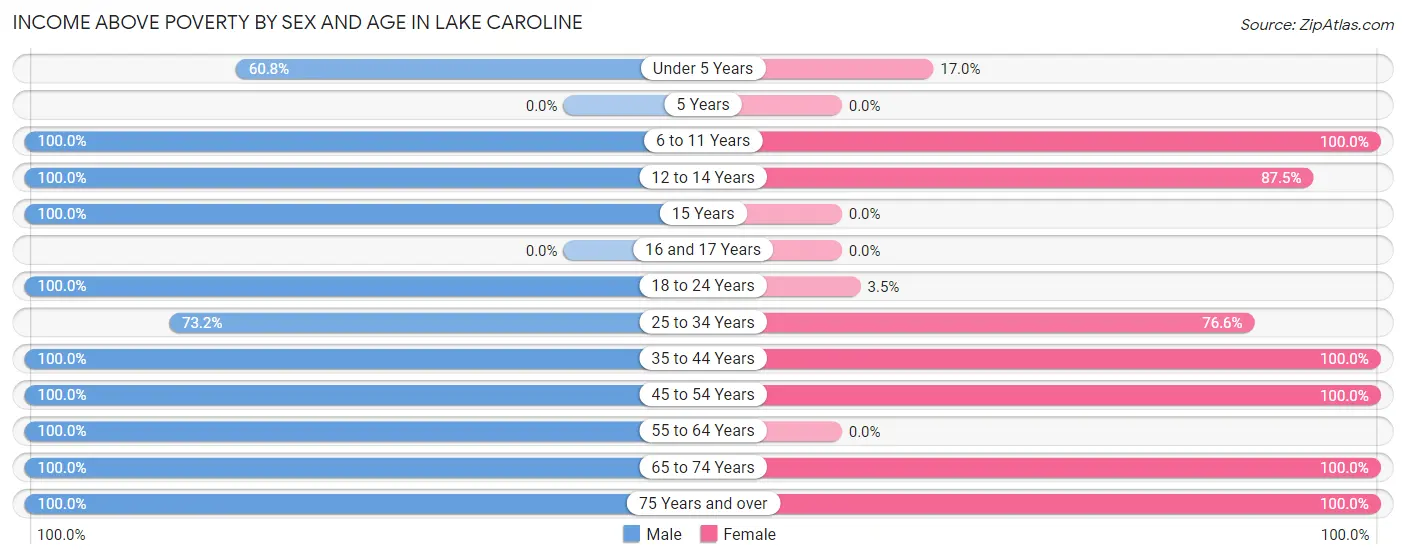
| Age Bracket | Male | Female |
| Under 5 Years | 31 (60.8%) | 9 (17.0%) |
| 5 Years | 0 (0.0%) | 0 (0.0%) |
| 6 to 11 Years | 69 (100.0%) | 38 (100.0%) |
| 12 to 14 Years | 179 (100.0%) | 189 (87.5%) |
| 15 Years | 92 (100.0%) | 0 (0.0%) |
| 16 and 17 Years | 0 (0.0%) | 0 (0.0%) |
| 18 to 24 Years | 12 (100.0%) | 3 (3.5%) |
| 25 to 34 Years | 232 (73.2%) | 183 (76.6%) |
| 35 to 44 Years | 138 (100.0%) | 328 (100.0%) |
| 45 to 54 Years | 89 (100.0%) | 81 (100.0%) |
| 55 to 64 Years | 204 (100.0%) | 0 (0.0%) |
| 65 to 74 Years | 110 (100.0%) | 137 (100.0%) |
| 75 Years and over | 26 (100.0%) | 49 (100.0%) |
| Total | 1,182 (91.8%) | 1,017 (74.5%) |
Income Below Poverty Among Married-Couple Families in Lake Caroline
The poverty statistics for married-couple families in Lake Caroline show that 2.1% or 10 of the total 484 families live below the poverty line. Families with 3 or 4 children have the highest poverty rate of 100.0%, comprising of 10 families. On the other hand, families with no children have the lowest poverty rate of 0.0%, which includes 0 families.
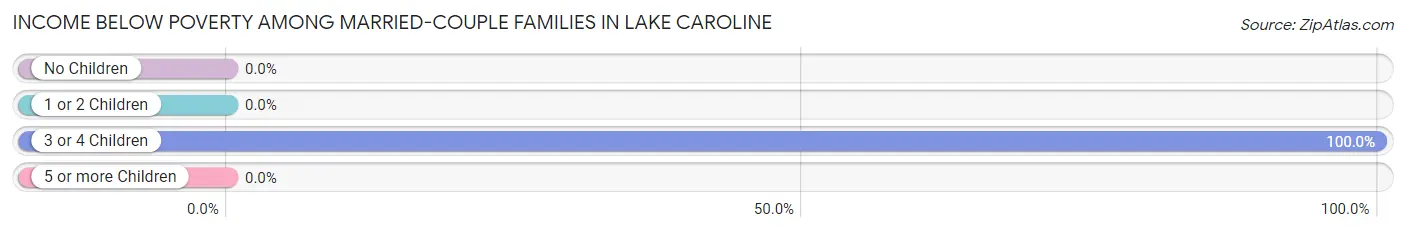
| Children | Above Poverty | Below Poverty |
| No Children | 252 (100.0%) | 0 (0.0%) |
| 1 or 2 Children | 222 (100.0%) | 0 (0.0%) |
| 3 or 4 Children | 0 (0.0%) | 10 (100.0%) |
| 5 or more Children | 0 (0.0%) | 0 (0.0%) |
| Total | 474 (97.9%) | 10 (2.1%) |
Income Below Poverty Among Single-Parent Households in Lake Caroline
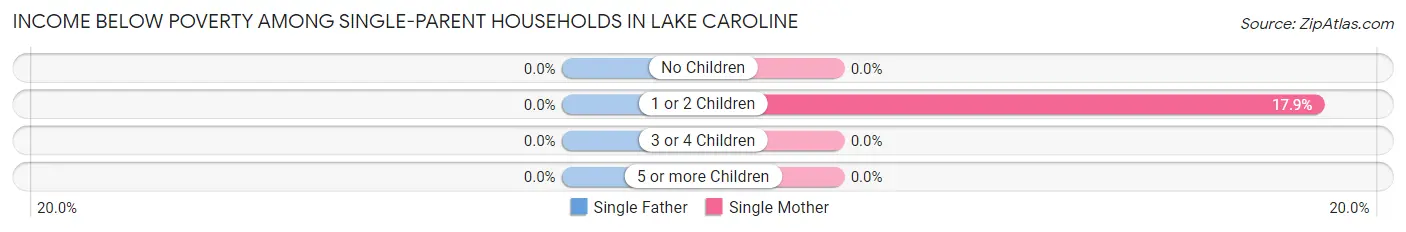
| Children | Single Father | Single Mother |
| No Children | 0 (0.0%) | 0 (0.0%) |
| 1 or 2 Children | 0 (0.0%) | 46 (17.9%) |
| 3 or 4 Children | 0 (0.0%) | 0 (0.0%) |
| 5 or more Children | 0 (0.0%) | 0 (0.0%) |
| Total | 0 (0.0%) | 46 (17.9%) |
Income Below Poverty Among Married-Couple vs Single-Parent Households in Lake Caroline
The poverty data for Lake Caroline shows that 10 of the married-couple family households (2.1%) and 46 of the single-parent households (17.9%) are living below the poverty level. Within the married-couple family households, those with 3 or 4 children have the highest poverty rate, with 10 households (100.0%) falling below the poverty line. Among the single-parent households, those with 1 or 2 children have the highest poverty rate, with 46 household (17.9%) living below poverty.
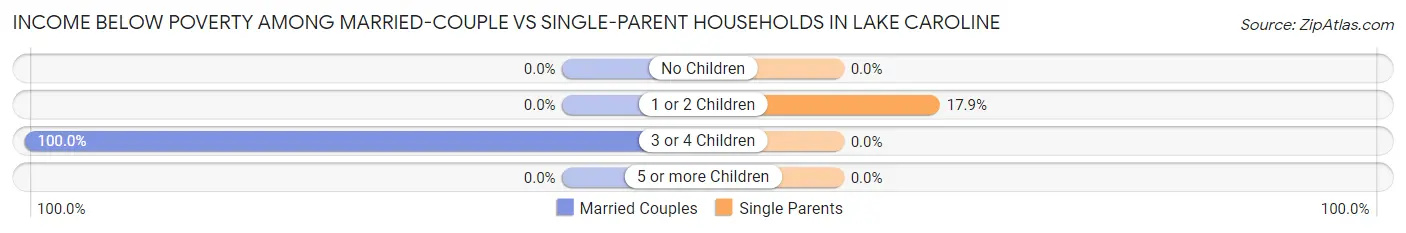
| Children | Married-Couple Families | Single-Parent Households |
| No Children | 0 (0.0%) | 0 (0.0%) |
| 1 or 2 Children | 0 (0.0%) | 46 (17.9%) |
| 3 or 4 Children | 10 (100.0%) | 0 (0.0%) |
| 5 or more Children | 0 (0.0%) | 0 (0.0%) |
| Total | 10 (2.1%) | 46 (17.9%) |
Race in Lake Caroline
The most populous races in Lake Caroline are White / Caucasian (1,793 | 67.6%), Black / African American (636 | 24.0%), and Hispanic or Latino (289 | 10.9%).
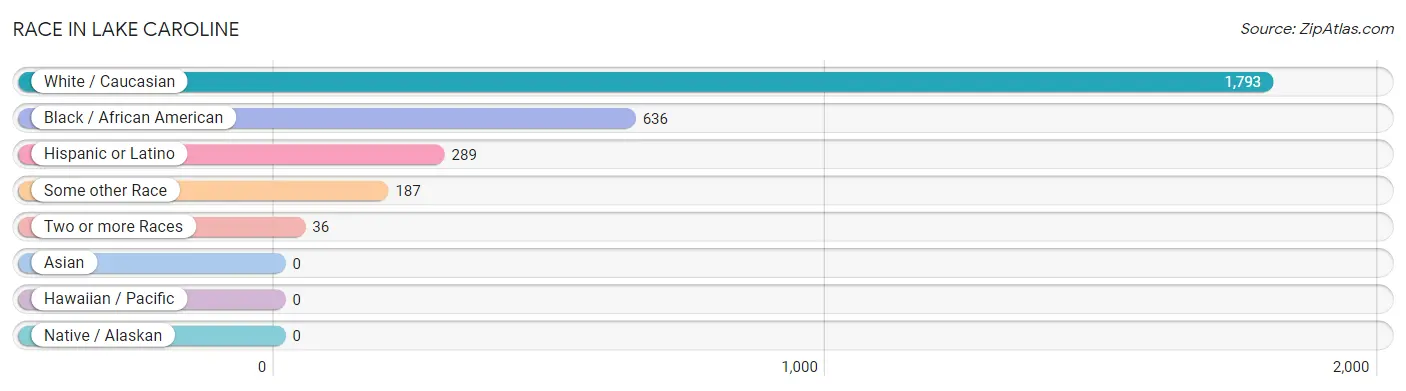
| Race | # Population | % Population |
| Asian | 0 | 0.0% |
| Black / African American | 636 | 24.0% |
| Hawaiian / Pacific | 0 | 0.0% |
| Hispanic or Latino | 289 | 10.9% |
| Native / Alaskan | 0 | 0.0% |
| White / Caucasian | 1,793 | 67.6% |
| Two or more Races | 36 | 1.4% |
| Some other Race | 187 | 7.0% |
| Total | 2,652 | 100.0% |
Ancestry in Lake Caroline
The most populous ancestries reported in Lake Caroline are English (610 | 23.0%), Irish (327 | 12.3%), Central American (188 | 7.1%), German (186 | 7.0%), and Honduran (108 | 4.1%), together accounting for 53.5% of all Lake Caroline residents.
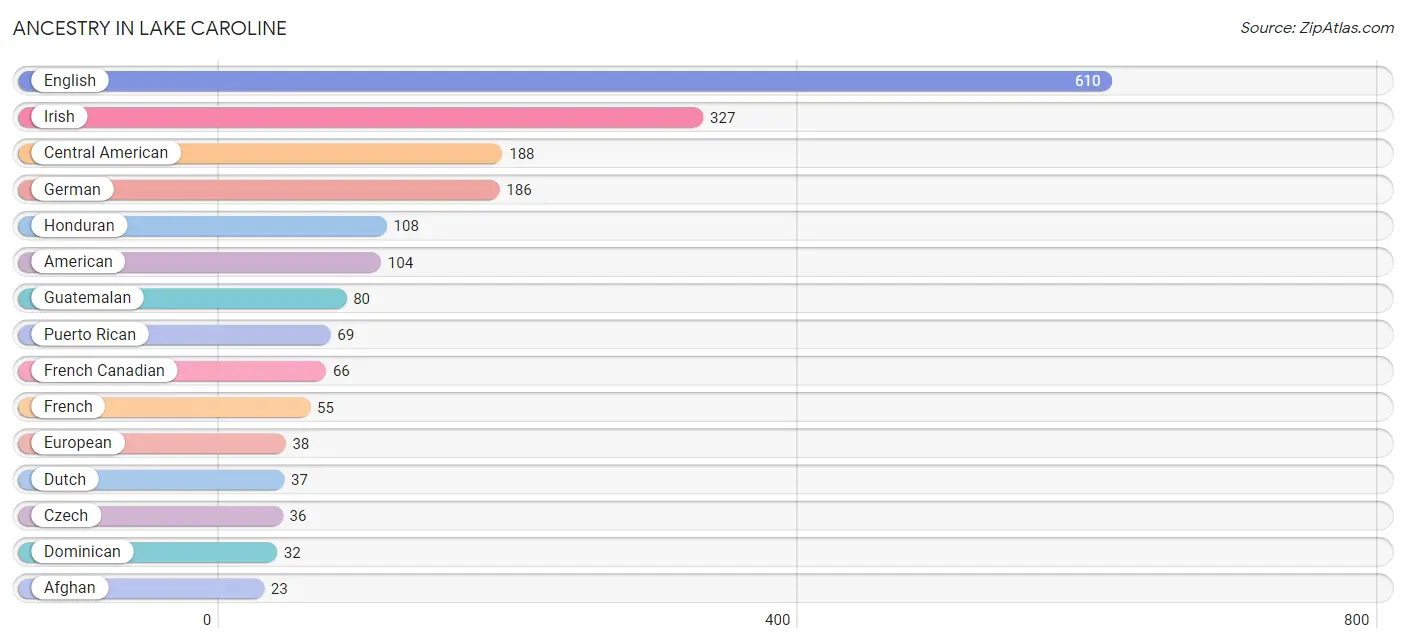
| Ancestry | # Population | % Population |
| Afghan | 23 | 0.9% |
| Albanian | 20 | 0.7% |
| American | 104 | 3.9% |
| Central American | 188 | 7.1% |
| Czech | 36 | 1.4% |
| Dominican | 32 | 1.2% |
| Dutch | 37 | 1.4% |
| English | 610 | 23.0% |
| European | 38 | 1.4% |
| French | 55 | 2.1% |
| French Canadian | 66 | 2.5% |
| German | 186 | 7.0% |
| Guatemalan | 80 | 3.0% |
| Honduran | 108 | 4.1% |
| Hungarian | 2 | 0.1% |
| Irish | 327 | 12.3% |
| Puerto Rican | 69 | 2.6% |
| Slovak | 2 | 0.1% | View All 18 Rows |
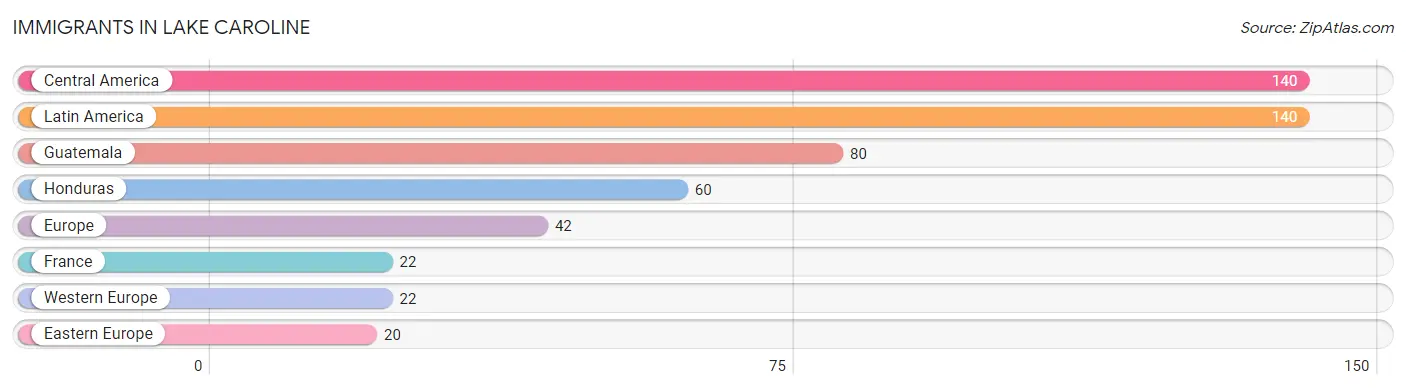
Immigrants in Lake Caroline
The most numerous immigrant groups reported in Lake Caroline came from Central America (140 | 5.3%), Latin America (140 | 5.3%), Guatemala (80 | 3.0%), Honduras (60 | 2.3%), and Europe (42 | 1.6%), together accounting for 17.4% of all Lake Caroline residents.
| Immigration Origin | # Population | % Population |
| Central America | 140 | 5.3% |
| Eastern Europe | 20 | 0.7% |
| Europe | 42 | 1.6% |
| France | 22 | 0.8% |
| Guatemala | 80 | 3.0% |
| Honduras | 60 | 2.3% |
| Latin America | 140 | 5.3% |
| Western Europe | 22 | 0.8% | View All 8 Rows |
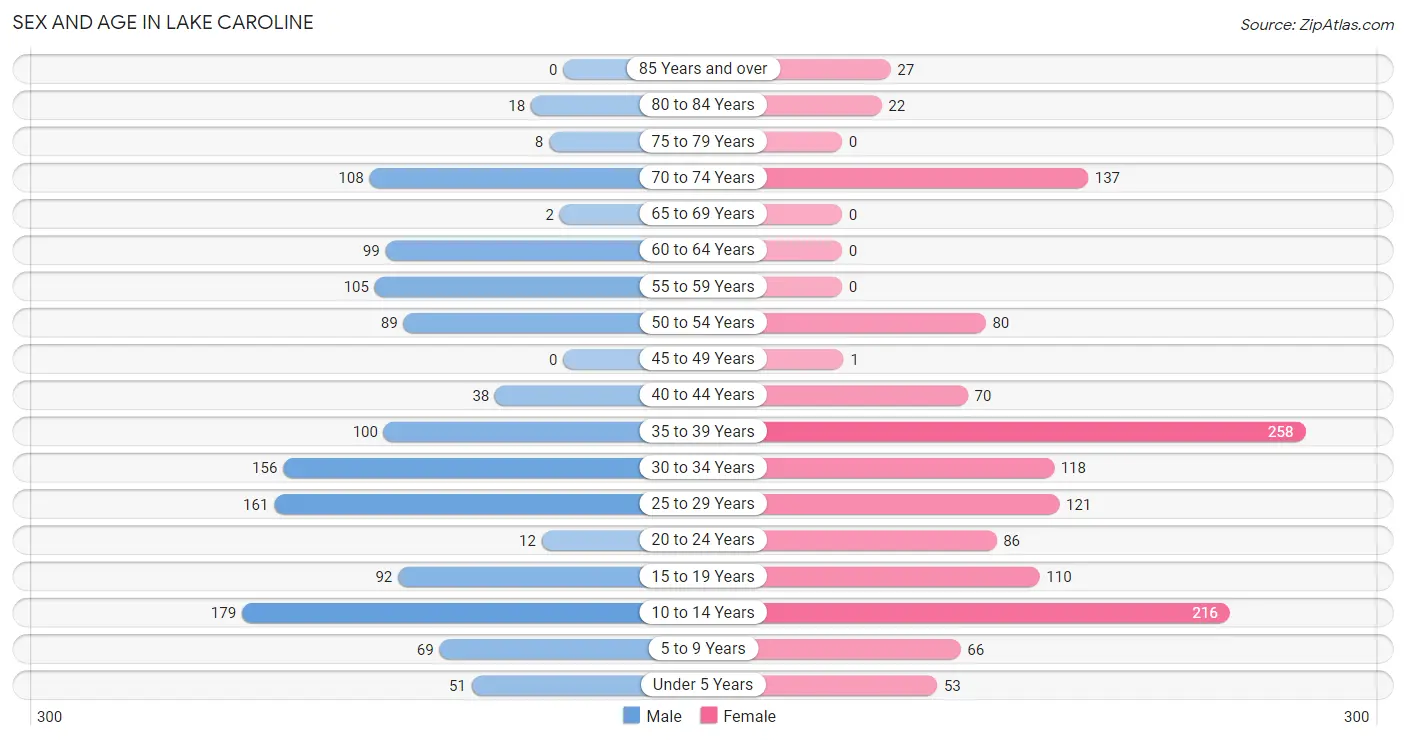
Sex and Age in Lake Caroline
Sex and Age in Lake Caroline
The most populous age groups in Lake Caroline are 10 to 14 Years (179 | 13.9%) for men and 35 to 39 Years (258 | 18.9%) for women.
| Age Bracket | Male | Female |
| Under 5 Years | 51 (4.0%) | 53 (3.9%) |
| 5 to 9 Years | 69 (5.4%) | 66 (4.8%) |
| 10 to 14 Years | 179 (13.9%) | 216 (15.8%) |
| 15 to 19 Years | 92 (7.1%) | 110 (8.1%) |
| 20 to 24 Years | 12 (0.9%) | 86 (6.3%) |
| 25 to 29 Years | 161 (12.5%) | 121 (8.9%) |
| 30 to 34 Years | 156 (12.1%) | 118 (8.6%) |
| 35 to 39 Years | 100 (7.8%) | 258 (18.9%) |
| 40 to 44 Years | 38 (2.9%) | 70 (5.1%) |
| 45 to 49 Years | 0 (0.0%) | 1 (0.1%) |
| 50 to 54 Years | 89 (6.9%) | 80 (5.9%) |
| 55 to 59 Years | 105 (8.2%) | 0 (0.0%) |
| 60 to 64 Years | 99 (7.7%) | 0 (0.0%) |
| 65 to 69 Years | 2 (0.2%) | 0 (0.0%) |
| 70 to 74 Years | 108 (8.4%) | 137 (10.0%) |
| 75 to 79 Years | 8 (0.6%) | 0 (0.0%) |
| 80 to 84 Years | 18 (1.4%) | 22 (1.6%) |
| 85 Years and over | 0 (0.0%) | 27 (2.0%) |
| Total | 1,287 (100.0%) | 1,365 (100.0%) |
Families and Households in Lake Caroline
Median Family Size in Lake Caroline
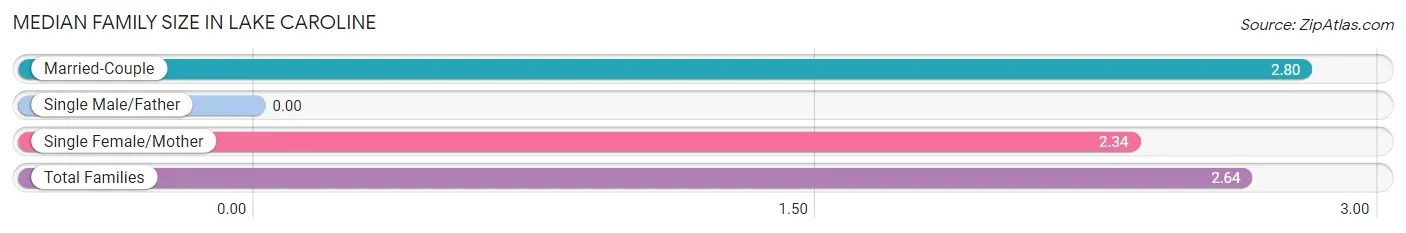
| Family Type | # Families | Family Size |
| Married-Couple | 484 (65.3%) | 2.80 |
| Single Male/Father | 0 (0.0%) | - |
| Single Female/Mother | 257 (34.7%) | 2.34 |
| Total Families | 741 (100.0%) | 2.64 |
Median Household Size in Lake Caroline
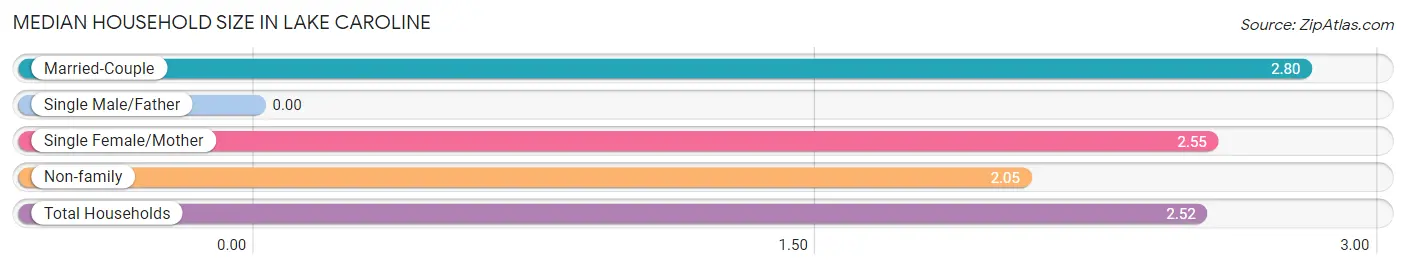
| Household Type | # Households | Household Size |
| Married-Couple | 484 (45.9%) | 2.80 |
| Single Male/Father | 0 (0.0%) | - |
| Single Female/Mother | 257 (24.4%) | 2.55 |
| Non-family | 313 (29.7%) | 2.05 |
| Total Households | 1,054 (100.0%) | 2.52 |
Household Size by Marriage Status in Lake Caroline
Out of a total of 1,054 households in Lake Caroline, 741 (70.3%) are family households, while 313 (29.7%) are nonfamily households. The most numerous type of family households are 2-person households, comprising 396, and the most common type of nonfamily households are 1-person households, comprising 157.
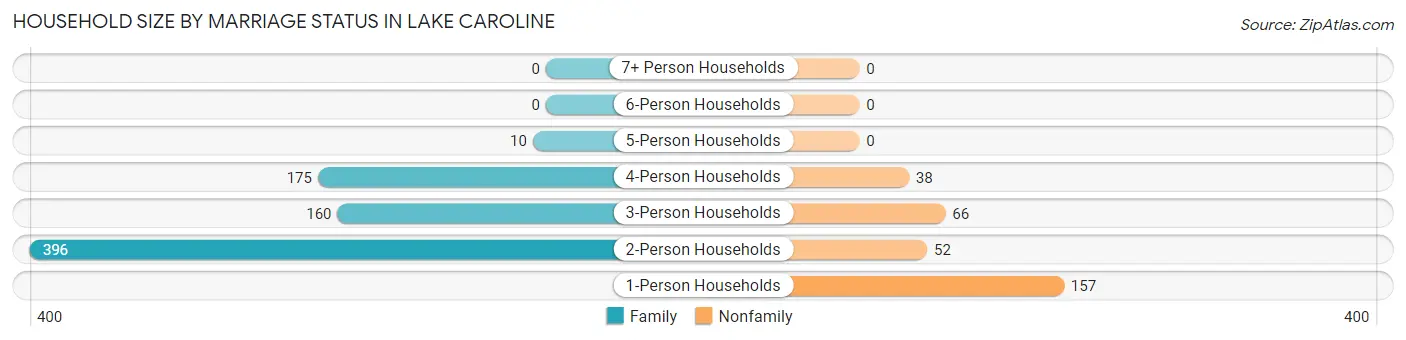
| Household Size | Family Households | Nonfamily Households |
| 1-Person Households | - | 157 (14.9%) |
| 2-Person Households | 396 (37.6%) | 52 (4.9%) |
| 3-Person Households | 160 (15.2%) | 66 (6.3%) |
| 4-Person Households | 175 (16.6%) | 38 (3.6%) |
| 5-Person Households | 10 (0.9%) | 0 (0.0%) |
| 6-Person Households | 0 (0.0%) | 0 (0.0%) |
| 7+ Person Households | 0 (0.0%) | 0 (0.0%) |
| Total | 741 (70.3%) | 313 (29.7%) |
Female Fertility in Lake Caroline
Fertility by Age in Lake Caroline
Average fertility rate in Lake Caroline is 33.0 births per 1,000 women. Women in the age bracket of 20 to 34 years have the highest fertility rate with 77.0 births per 1,000 women. Women in the age bracket of 20 to 34 years acount for 100.0% of all women with births.
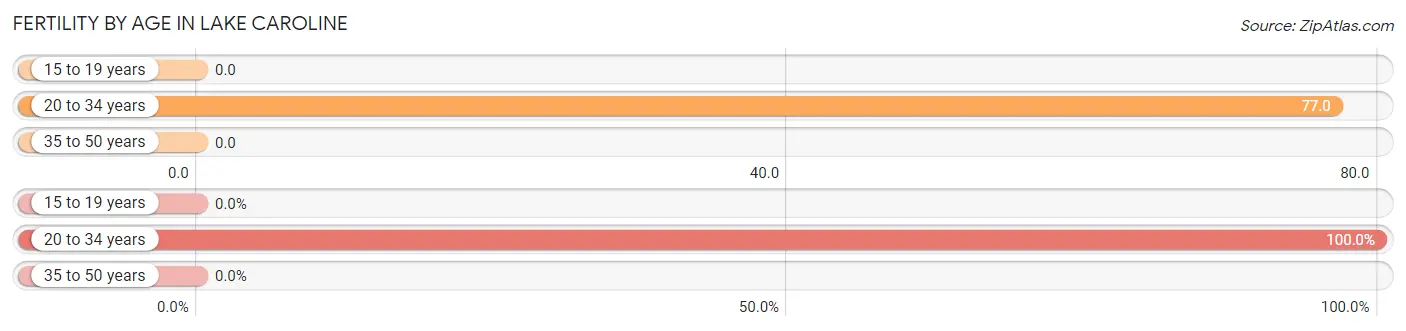
| Age Bracket | Women with Births | Births / 1,000 Women |
| 15 to 19 years | 0 (0.0%) | 0.0 |
| 20 to 34 years | 25 (100.0%) | 77.0 |
| 35 to 50 years | 0 (0.0%) | 0.0 |
| Total | 25 (100.0%) | 33.0 |
Fertility by Age by Marriage Status in Lake Caroline
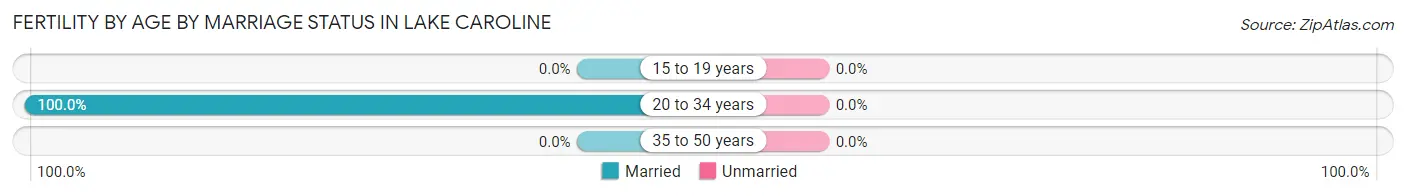
| Age Bracket | Married | Unmarried |
| 15 to 19 years | 0 (0.0%) | 0 (0.0%) |
| 20 to 34 years | 25 (100.0%) | 0 (0.0%) |
| 35 to 50 years | 0 (0.0%) | 0 (0.0%) |
| Total | 25 (100.0%) | 0 (0.0%) |
Fertility by Education in Lake Caroline
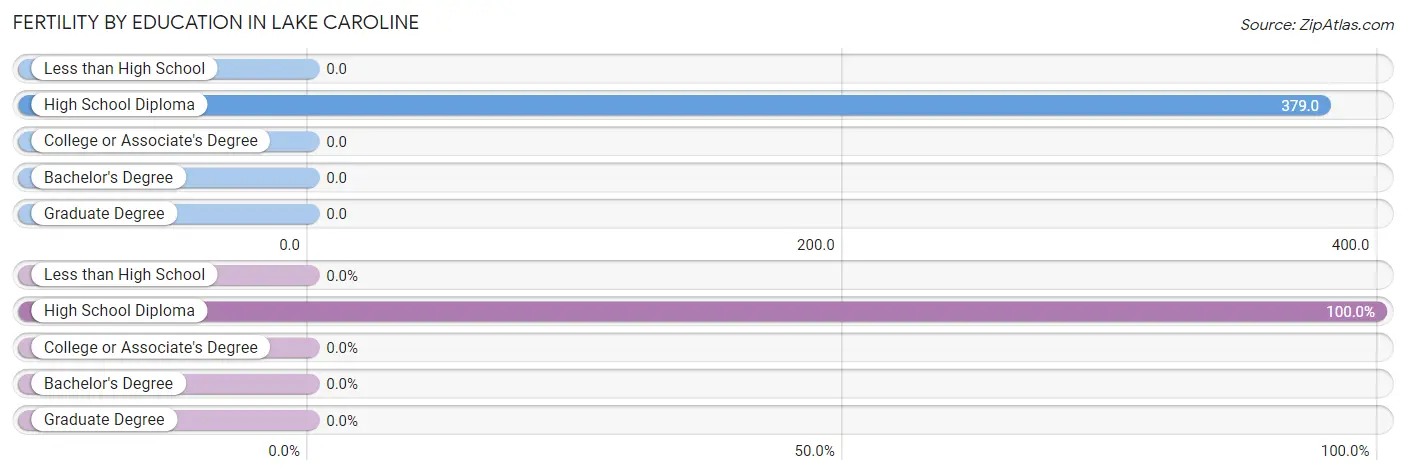
| Educational Attainment | Women with Births | Births / 1,000 Women |
| Less than High School | 0 (0.0%) | 0.0 |
| High School Diploma | 25 (100.0%) | 379.0 |
| College or Associate's Degree | 0 (0.0%) | 0.0 |
| Bachelor's Degree | 0 (0.0%) | 0.0 |
| Graduate Degree | 0 (0.0%) | 0.0 |
| Total | 25 (100.0%) | 33.0 |
Fertility by Education by Marriage Status in Lake Caroline
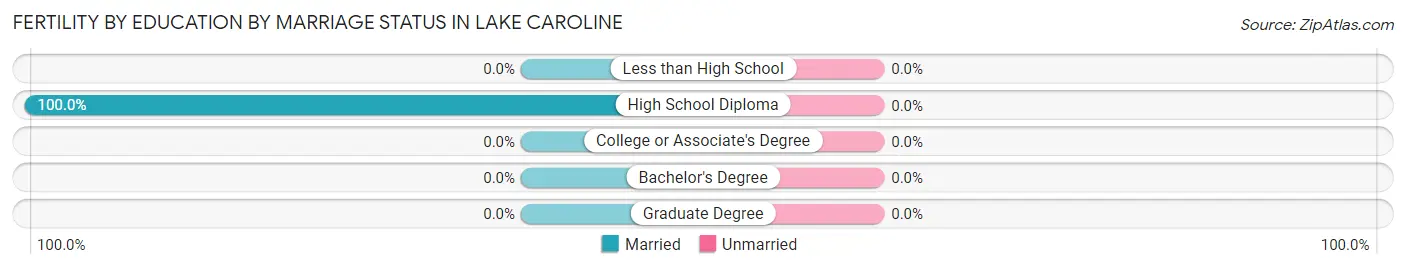
| Educational Attainment | Married | Unmarried |
| Less than High School | 0 (0.0%) | 0 (0.0%) |
| High School Diploma | 25 (100.0%) | 0 (0.0%) |
| College or Associate's Degree | 0 (0.0%) | 0 (0.0%) |
| Bachelor's Degree | 0 (0.0%) | 0 (0.0%) |
| Graduate Degree | 0 (0.0%) | 0 (0.0%) |
| Total | 25 (100.0%) | 0 (0.0%) |
Employment Characteristics in Lake Caroline
Employment by Class of Employer in Lake Caroline
Among the 1,473 employed individuals in Lake Caroline, private company employees (795 | 54.0%), state government employees (292 | 19.8%), and not-for-profit organizations (231 | 15.7%) make up the most common classes of employment.
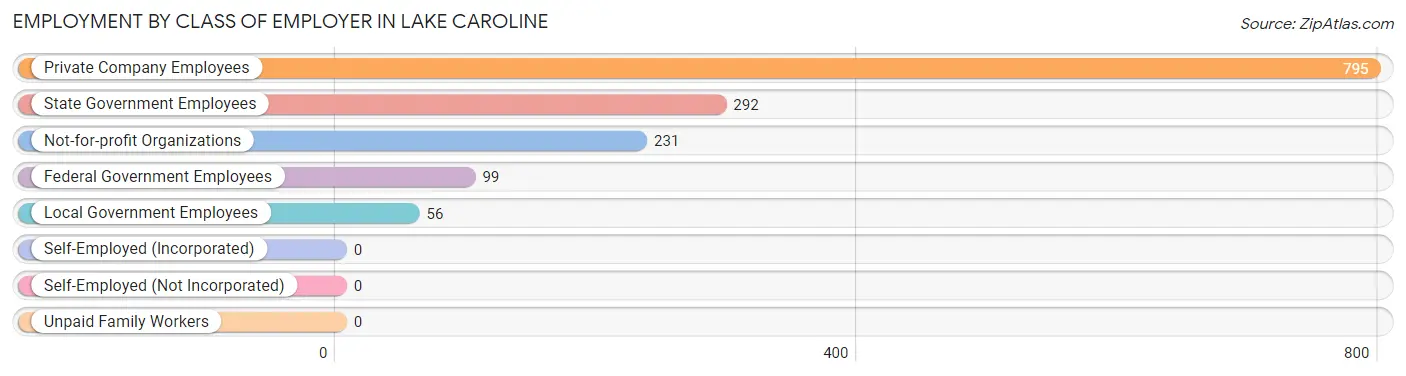
| Employer Class | # Employees | % Employees |
| Private Company Employees | 795 | 54.0% |
| Self-Employed (Incorporated) | 0 | 0.0% |
| Self-Employed (Not Incorporated) | 0 | 0.0% |
| Not-for-profit Organizations | 231 | 15.7% |
| Local Government Employees | 56 | 3.8% |
| State Government Employees | 292 | 19.8% |
| Federal Government Employees | 99 | 6.7% |
| Unpaid Family Workers | 0 | 0.0% |
| Total | 1,473 | 100.0% |
Employment Status by Age in Lake Caroline
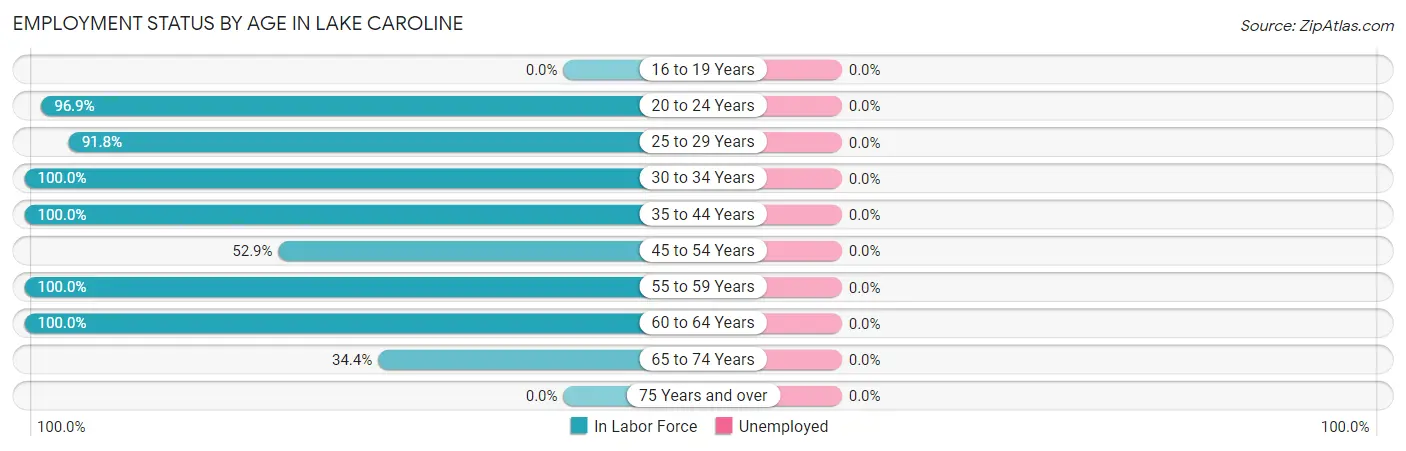
| Age Bracket | In Labor Force | Unemployed |
| 16 to 19 Years | 0 (0.0%) | 0 (0.0%) |
| 20 to 24 Years | 95 (96.9%) | 0 (0.0%) |
| 25 to 29 Years | 259 (91.8%) | 0 (0.0%) |
| 30 to 34 Years | 274 (100.0%) | 0 (0.0%) |
| 35 to 44 Years | 466 (100.0%) | 0 (0.0%) |
| 45 to 54 Years | 90 (52.9%) | 0 (0.0%) |
| 55 to 59 Years | 105 (100.0%) | 0 (0.0%) |
| 60 to 64 Years | 99 (100.0%) | 0 (0.0%) |
| 65 to 74 Years | 85 (34.4%) | 0 (0.0%) |
| 75 Years and over | 0 (0.0%) | 0 (0.0%) |
| Total | 1,472 (78.7%) | 0 (0.0%) |
Employment Status by Educational Attainment in Lake Caroline
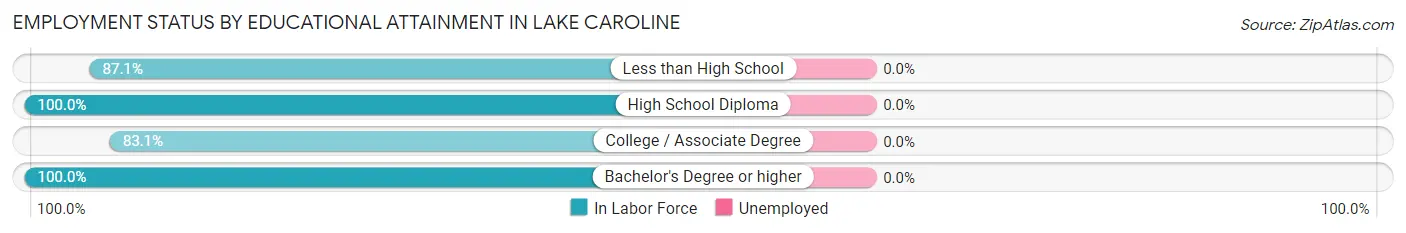
| Educational Attainment | In Labor Force | Unemployed |
| Less than High School | 155 (87.1%) | 0 (0.0%) |
| High School Diploma | 350 (100.0%) | 0 (0.0%) |
| College / Associate Degree | 392 (83.1%) | 0 (0.0%) |
| Bachelor's Degree or higher | 396 (100.0%) | 0 (0.0%) |
| Total | 1,293 (92.6%) | 0 (0.0%) |
Employment Occupations by Sex in Lake Caroline
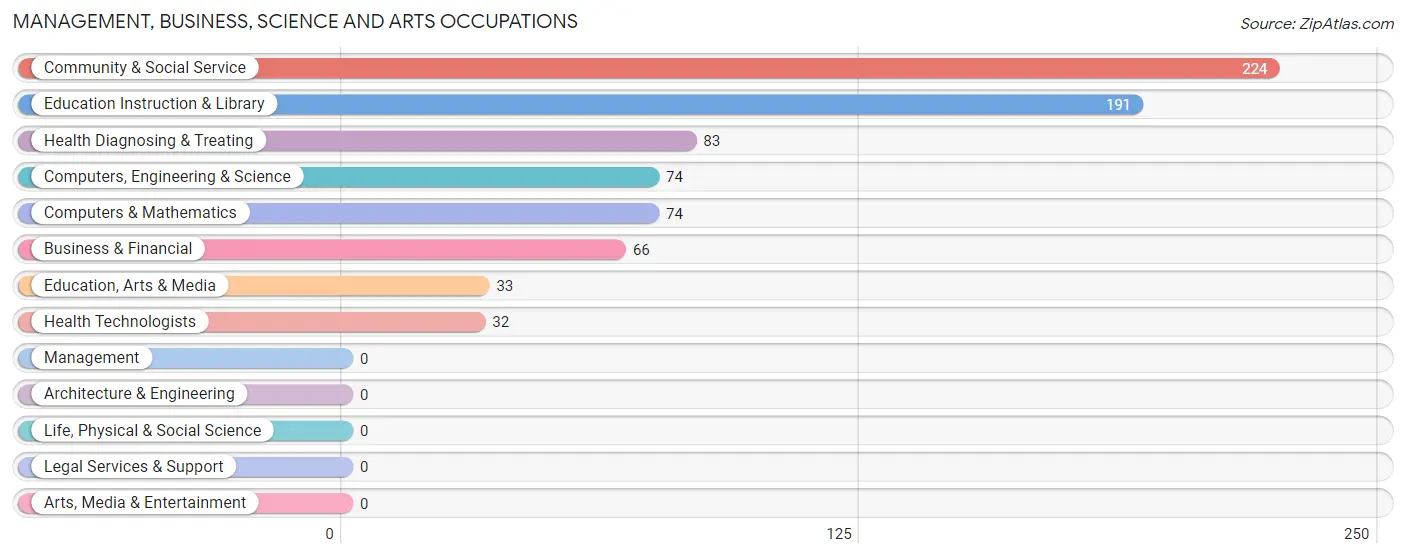
Management, Business, Science and Arts Occupations
The most common Management, Business, Science and Arts occupations in Lake Caroline are Community & Social Service (224 | 15.2%), Education Instruction & Library (191 | 13.0%), Health Diagnosing & Treating (83 | 5.6%), Computers, Engineering & Science (74 | 5.0%), and Computers & Mathematics (74 | 5.0%).
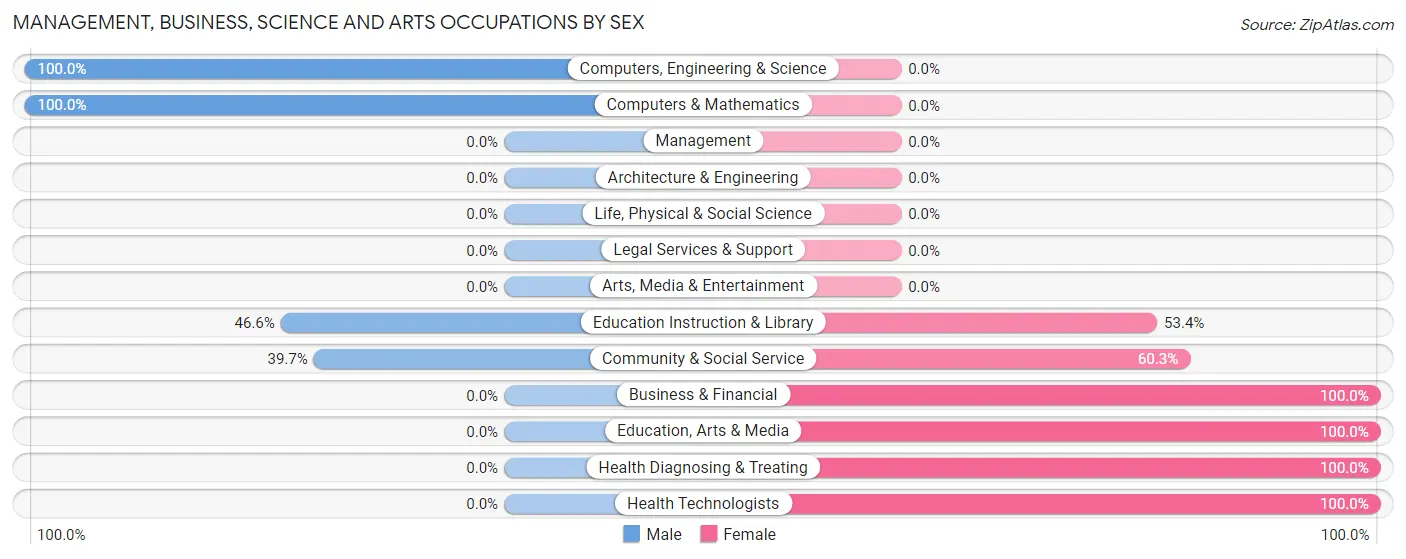
Management, Business, Science and Arts Occupations by Sex
Within the Management, Business, Science and Arts occupations in Lake Caroline, the most male-oriented occupations are Computers, Engineering & Science (100.0%), Computers & Mathematics (100.0%), and Education Instruction & Library (46.6%), while the most female-oriented occupations are Business & Financial (100.0%), Education, Arts & Media (100.0%), and Health Diagnosing & Treating (100.0%).
| Occupation | Male | Female |
| Management | 0 (0.0%) | 0 (0.0%) |
| Business & Financial | 0 (0.0%) | 66 (100.0%) |
| Computers, Engineering & Science | 74 (100.0%) | 0 (0.0%) |
| Computers & Mathematics | 74 (100.0%) | 0 (0.0%) |
| Architecture & Engineering | 0 (0.0%) | 0 (0.0%) |
| Life, Physical & Social Science | 0 (0.0%) | 0 (0.0%) |
| Community & Social Service | 89 (39.7%) | 135 (60.3%) |
| Education, Arts & Media | 0 (0.0%) | 33 (100.0%) |
| Legal Services & Support | 0 (0.0%) | 0 (0.0%) |
| Education Instruction & Library | 89 (46.6%) | 102 (53.4%) |
| Arts, Media & Entertainment | 0 (0.0%) | 0 (0.0%) |
| Health Diagnosing & Treating | 0 (0.0%) | 83 (100.0%) |
| Health Technologists | 0 (0.0%) | 32 (100.0%) |
| Total (Category) | 163 (36.5%) | 284 (63.5%) |
| Total (Overall) | 762 (51.7%) | 711 (48.3%) |
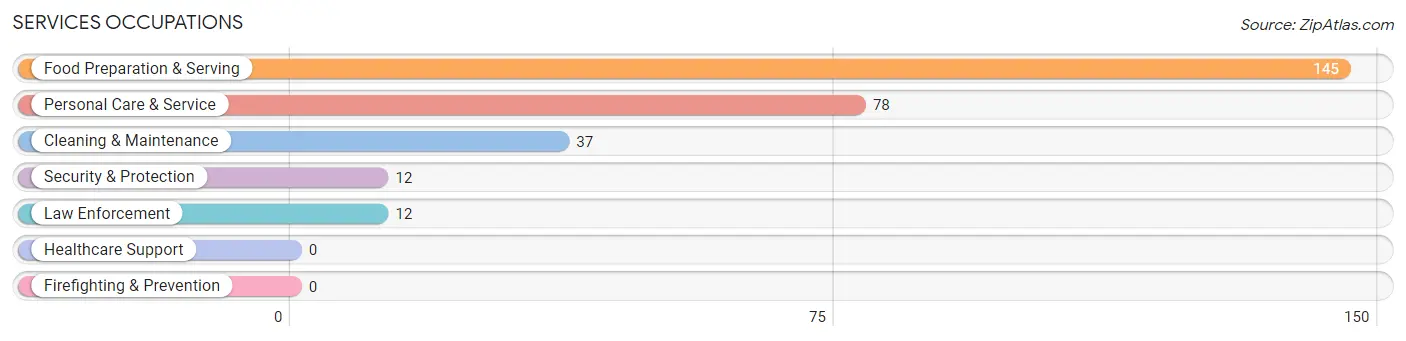
Services Occupations
The most common Services occupations in Lake Caroline are Food Preparation & Serving (145 | 9.8%), Personal Care & Service (78 | 5.3%), Cleaning & Maintenance (37 | 2.5%), Security & Protection (12 | 0.8%), and Law Enforcement (12 | 0.8%).
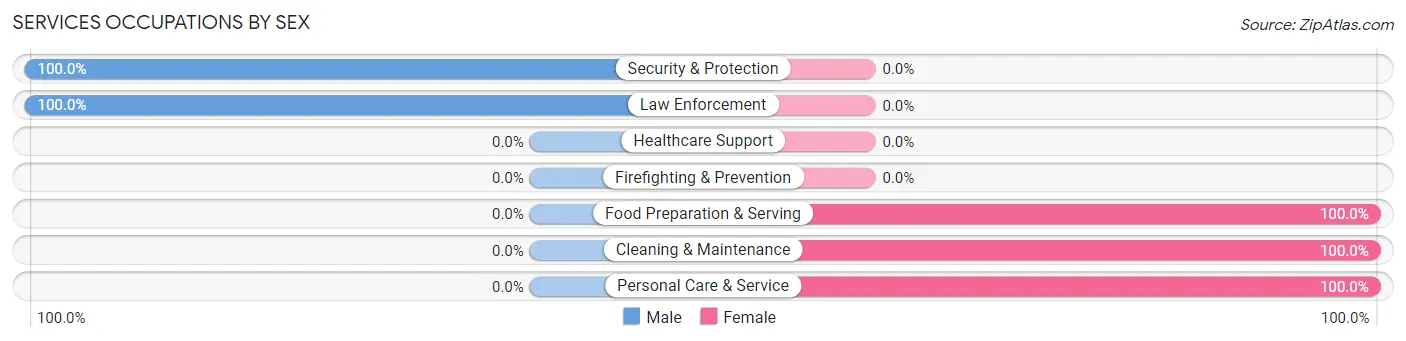
Services Occupations by Sex
Within the Services occupations in Lake Caroline, the most male-oriented occupations are Security & Protection (100.0%), and Law Enforcement (100.0%), while the most female-oriented occupations are Food Preparation & Serving (100.0%), Cleaning & Maintenance (100.0%), and Personal Care & Service (100.0%).
| Occupation | Male | Female |
| Healthcare Support | 0 (0.0%) | 0 (0.0%) |
| Security & Protection | 12 (100.0%) | 0 (0.0%) |
| Firefighting & Prevention | 0 (0.0%) | 0 (0.0%) |
| Law Enforcement | 12 (100.0%) | 0 (0.0%) |
| Food Preparation & Serving | 0 (0.0%) | 145 (100.0%) |
| Cleaning & Maintenance | 0 (0.0%) | 37 (100.0%) |
| Personal Care & Service | 0 (0.0%) | 78 (100.0%) |
| Total (Category) | 12 (4.4%) | 260 (95.6%) |
| Total (Overall) | 762 (51.7%) | 711 (48.3%) |
Sales and Office Occupations
The most common Sales and Office occupations in Lake Caroline are , and Office & Administration (162 | 11.0%).
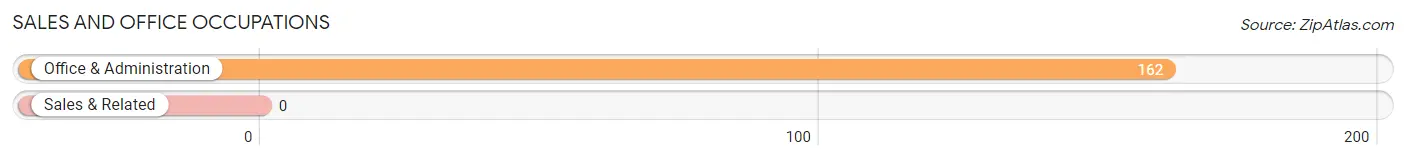
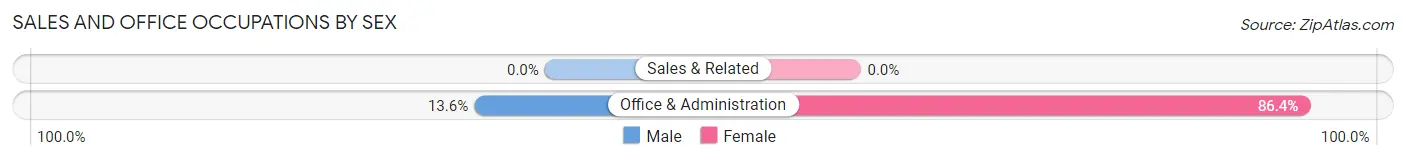
Sales and Office Occupations by Sex
| Occupation | Male | Female |
| Sales & Related | 0 (0.0%) | 0 (0.0%) |
| Office & Administration | 22 (13.6%) | 140 (86.4%) |
| Total (Category) | 22 (13.6%) | 140 (86.4%) |
| Total (Overall) | 762 (51.7%) | 711 (48.3%) |
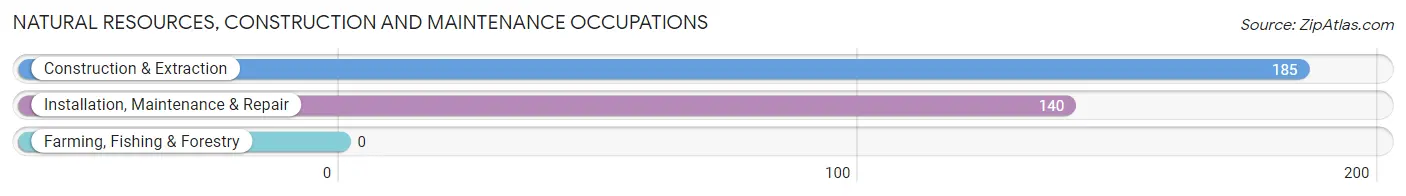
Natural Resources, Construction and Maintenance Occupations
The most common Natural Resources, Construction and Maintenance occupations in Lake Caroline are Construction & Extraction (185 | 12.6%), and Installation, Maintenance & Repair (140 | 9.5%).
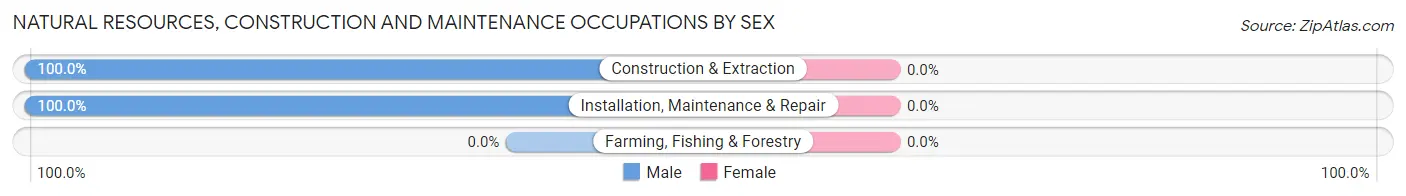
Natural Resources, Construction and Maintenance Occupations by Sex
| Occupation | Male | Female |
| Farming, Fishing & Forestry | 0 (0.0%) | 0 (0.0%) |
| Construction & Extraction | 185 (100.0%) | 0 (0.0%) |
| Installation, Maintenance & Repair | 140 (100.0%) | 0 (0.0%) |
| Total (Category) | 325 (100.0%) | 0 (0.0%) |
| Total (Overall) | 762 (51.7%) | 711 (48.3%) |
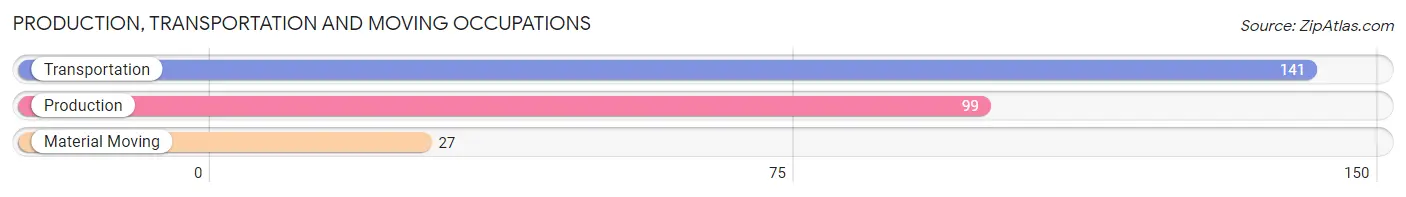
Production, Transportation and Moving Occupations
The most common Production, Transportation and Moving occupations in Lake Caroline are Transportation (141 | 9.6%), Production (99 | 6.7%), and Material Moving (27 | 1.8%).
Production, Transportation and Moving Occupations by Sex
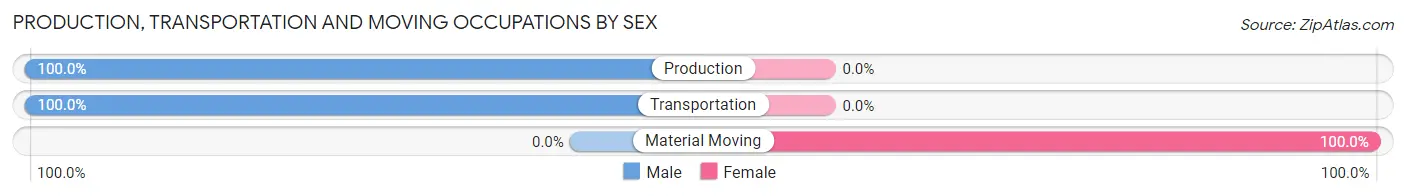
| Occupation | Male | Female |
| Production | 99 (100.0%) | 0 (0.0%) |
| Transportation | 141 (100.0%) | 0 (0.0%) |
| Material Moving | 0 (0.0%) | 27 (100.0%) |
| Total (Category) | 240 (89.9%) | 27 (10.1%) |
| Total (Overall) | 762 (51.7%) | 711 (48.3%) |
Employment Industries by Sex in Lake Caroline
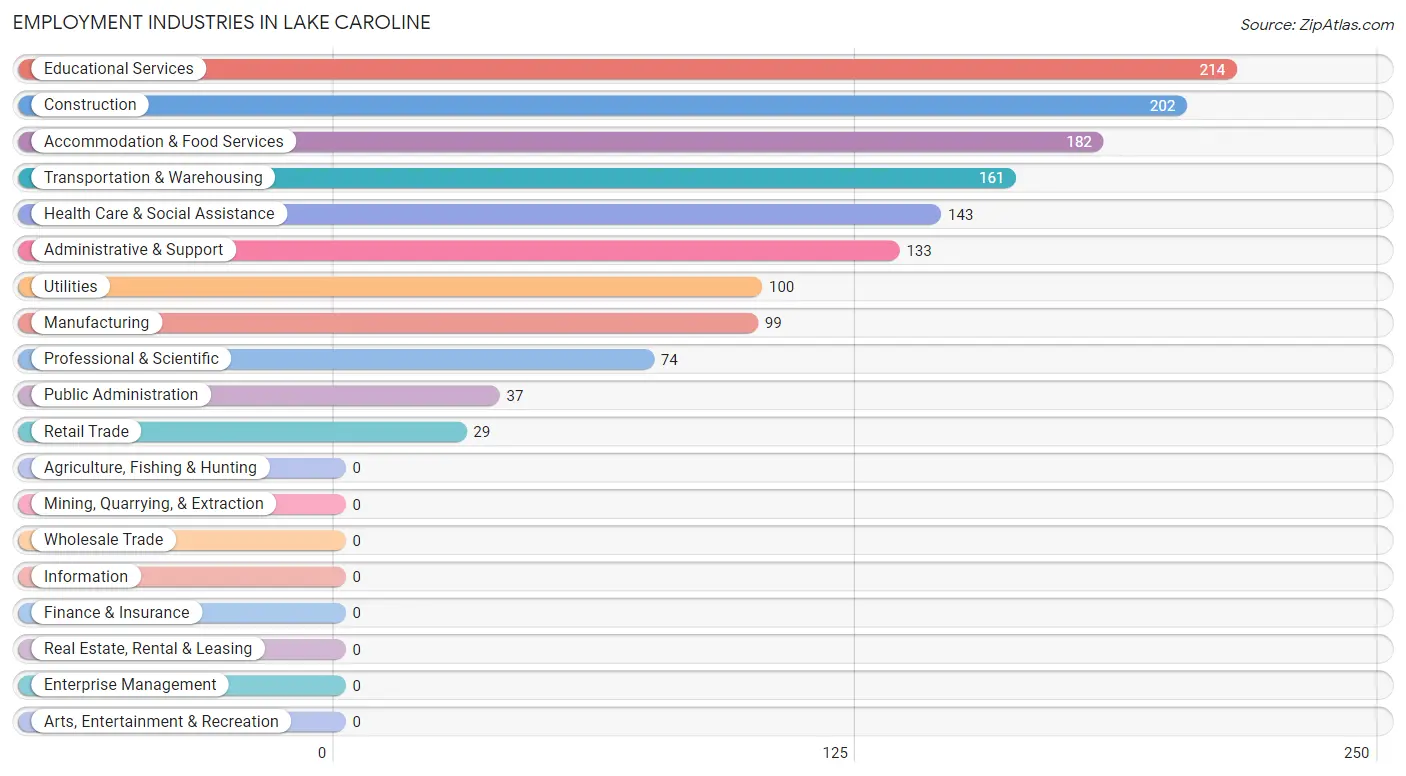
Employment Industries in Lake Caroline
The major employment industries in Lake Caroline include Educational Services (214 | 14.5%), Construction (202 | 13.7%), Accommodation & Food Services (182 | 12.4%), Transportation & Warehousing (161 | 10.9%), and Health Care & Social Assistance (143 | 9.7%).
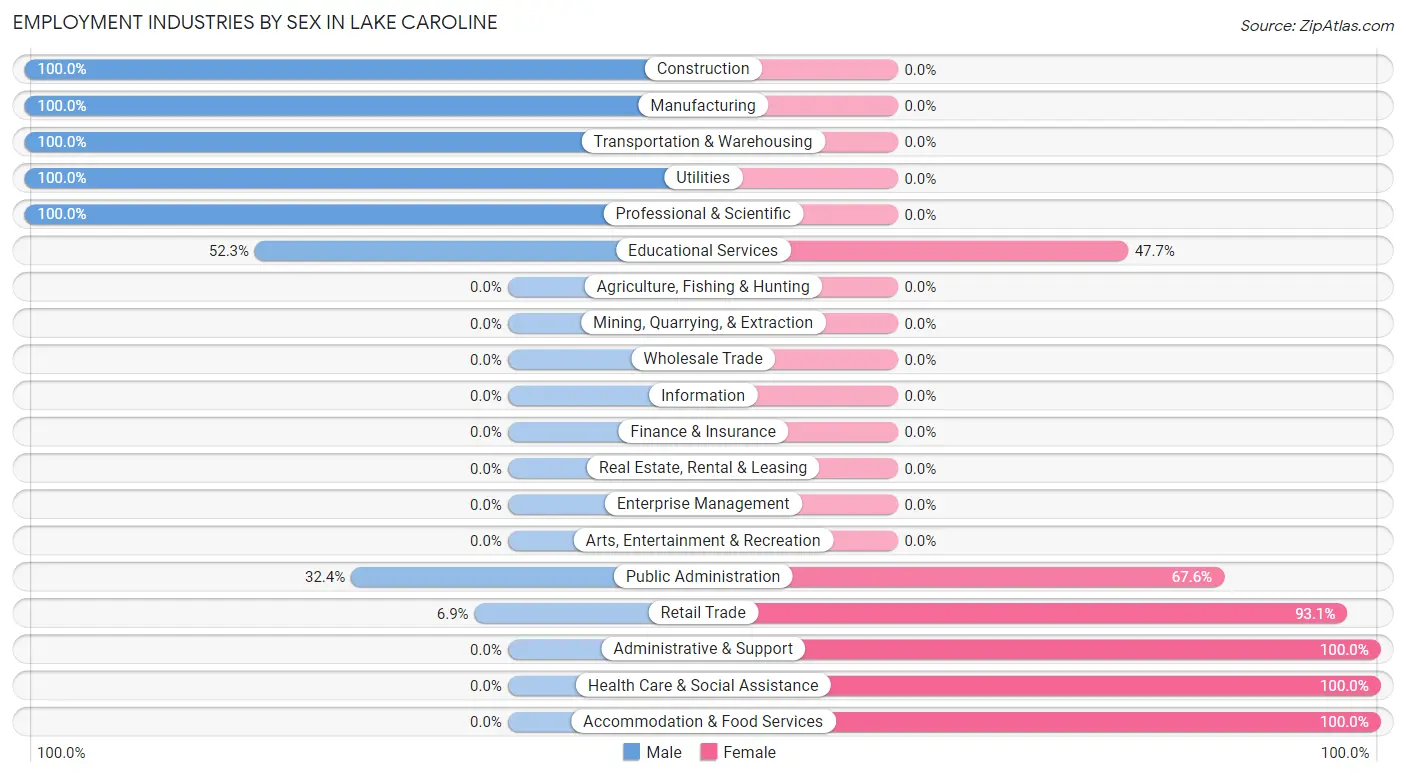
Employment Industries by Sex in Lake Caroline
The Lake Caroline industries that see more men than women are Construction (100.0%), Manufacturing (100.0%), and Transportation & Warehousing (100.0%), whereas the industries that tend to have a higher number of women are Administrative & Support (100.0%), Health Care & Social Assistance (100.0%), and Accommodation & Food Services (100.0%).
| Industry | Male | Female |
| Agriculture, Fishing & Hunting | 0 (0.0%) | 0 (0.0%) |
| Mining, Quarrying, & Extraction | 0 (0.0%) | 0 (0.0%) |
| Construction | 202 (100.0%) | 0 (0.0%) |
| Manufacturing | 99 (100.0%) | 0 (0.0%) |
| Wholesale Trade | 0 (0.0%) | 0 (0.0%) |
| Retail Trade | 2 (6.9%) | 27 (93.1%) |
| Transportation & Warehousing | 161 (100.0%) | 0 (0.0%) |
| Utilities | 100 (100.0%) | 0 (0.0%) |
| Information | 0 (0.0%) | 0 (0.0%) |
| Finance & Insurance | 0 (0.0%) | 0 (0.0%) |
| Real Estate, Rental & Leasing | 0 (0.0%) | 0 (0.0%) |
| Professional & Scientific | 74 (100.0%) | 0 (0.0%) |
| Enterprise Management | 0 (0.0%) | 0 (0.0%) |
| Administrative & Support | 0 (0.0%) | 133 (100.0%) |
| Educational Services | 112 (52.3%) | 102 (47.7%) |
| Health Care & Social Assistance | 0 (0.0%) | 143 (100.0%) |
| Arts, Entertainment & Recreation | 0 (0.0%) | 0 (0.0%) |
| Accommodation & Food Services | 0 (0.0%) | 182 (100.0%) |
| Public Administration | 12 (32.4%) | 25 (67.6%) |
| Total | 762 (51.7%) | 711 (48.3%) |
Education in Lake Caroline
School Enrollment in Lake Caroline
The most common levels of schooling among the 834 students in Lake Caroline are middle school (450 | 54.0%), high school (147 | 17.6%), and elementary school (107 | 12.8%).
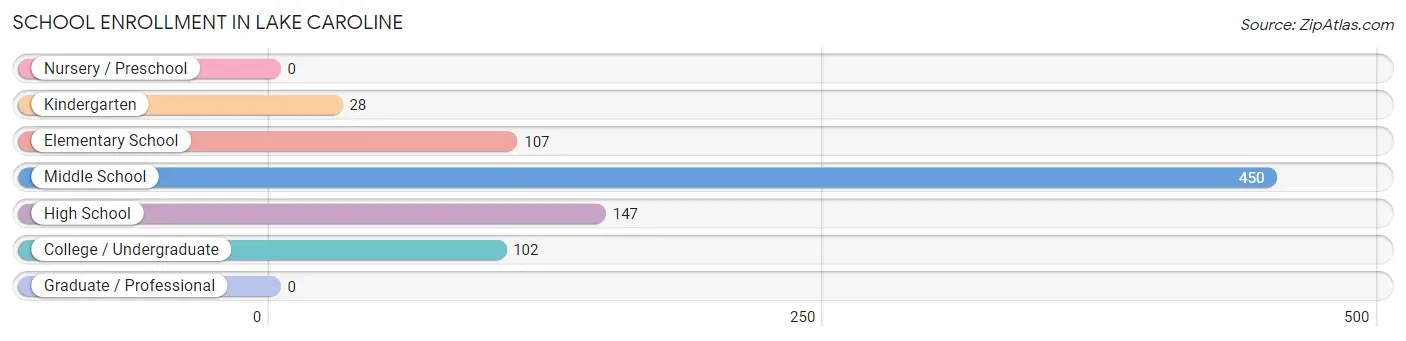
| School Level | # Students | % Students |
| Nursery / Preschool | 0 | 0.0% |
| Kindergarten | 28 | 3.4% |
| Elementary School | 107 | 12.8% |
| Middle School | 450 | 54.0% |
| High School | 147 | 17.6% |
| College / Undergraduate | 102 | 12.2% |
| Graduate / Professional | 0 | 0.0% |
| Total | 834 | 100.0% |
School Enrollment by Age by Funding Source in Lake Caroline
Out of a total of 834 students who are enrolled in schools in Lake Caroline, 140 (16.8%) attend a private institution, while the remaining 694 (83.2%) are enrolled in public schools. The age group of 20 to 24 year olds has the highest likelihood of being enrolled in private schools, with 49 (100.0% in the age bracket) enrolled. Conversely, the age group of 10 to 14 year olds has the lowest likelihood of being enrolled in a private school, with 395 (100.0% in the age bracket) attending a public institution.
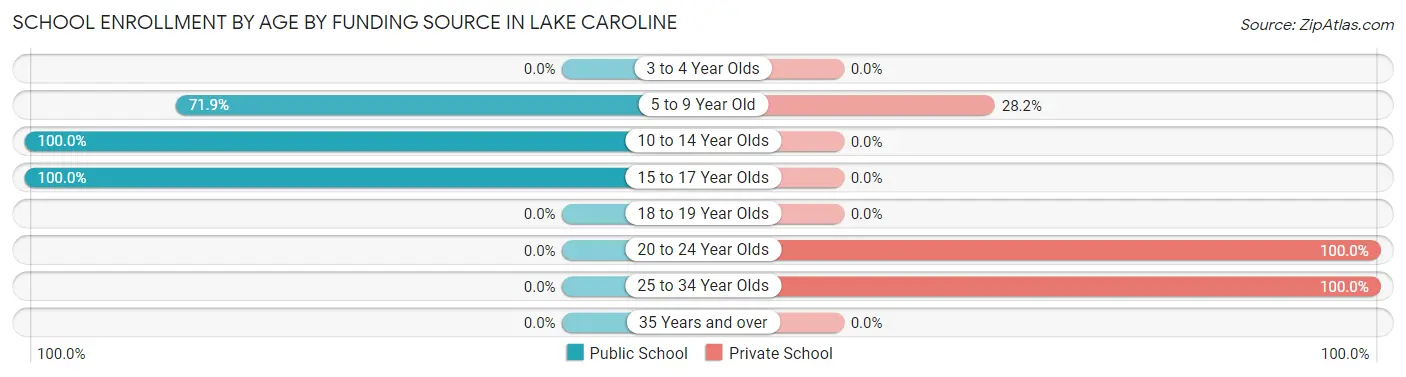
| Age Bracket | Public School | Private School |
| 3 to 4 Year Olds | 0 (0.0%) | 0 (0.0%) |
| 5 to 9 Year Old | 97 (71.9%) | 38 (28.1%) |
| 10 to 14 Year Olds | 395 (100.0%) | 0 (0.0%) |
| 15 to 17 Year Olds | 202 (100.0%) | 0 (0.0%) |
| 18 to 19 Year Olds | 0 (0.0%) | 0 (0.0%) |
| 20 to 24 Year Olds | 0 (0.0%) | 49 (100.0%) |
| 25 to 34 Year Olds | 0 (0.0%) | 53 (100.0%) |
| 35 Years and over | 0 (0.0%) | 0 (0.0%) |
| Total | 694 (83.2%) | 140 (16.8%) |
Educational Attainment by Field of Study in Lake Caroline
Education (174 | 35.7%), computers & mathematics (74 | 15.2%), business (66 | 13.5%), psychology (63 | 12.9%), and science & technology (47 | 9.6%) are the most common fields of study among 488 individuals in Lake Caroline who have obtained a bachelor's degree or higher.
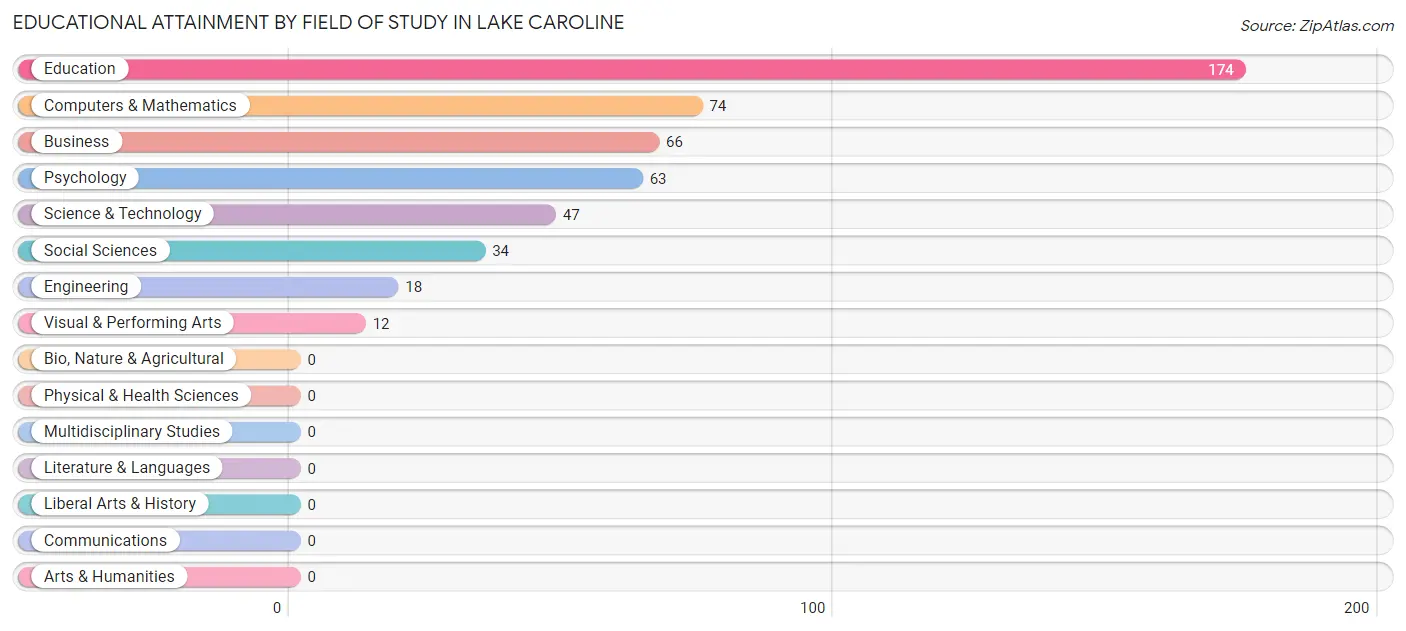
| Field of Study | # Graduates | % Graduates |
| Computers & Mathematics | 74 | 15.2% |
| Bio, Nature & Agricultural | 0 | 0.0% |
| Physical & Health Sciences | 0 | 0.0% |
| Psychology | 63 | 12.9% |
| Social Sciences | 34 | 7.0% |
| Engineering | 18 | 3.7% |
| Multidisciplinary Studies | 0 | 0.0% |
| Science & Technology | 47 | 9.6% |
| Business | 66 | 13.5% |
| Education | 174 | 35.7% |
| Literature & Languages | 0 | 0.0% |
| Liberal Arts & History | 0 | 0.0% |
| Visual & Performing Arts | 12 | 2.5% |
| Communications | 0 | 0.0% |
| Arts & Humanities | 0 | 0.0% |
| Total | 488 | 100.0% |
Transportation & Commute in Lake Caroline
Vehicle Availability by Sex in Lake Caroline
The most prevalent vehicle ownership categories in Lake Caroline are males with 3 vehicles (272, accounting for 35.7%) and females with 3 vehicles (173, making up 38.3%).
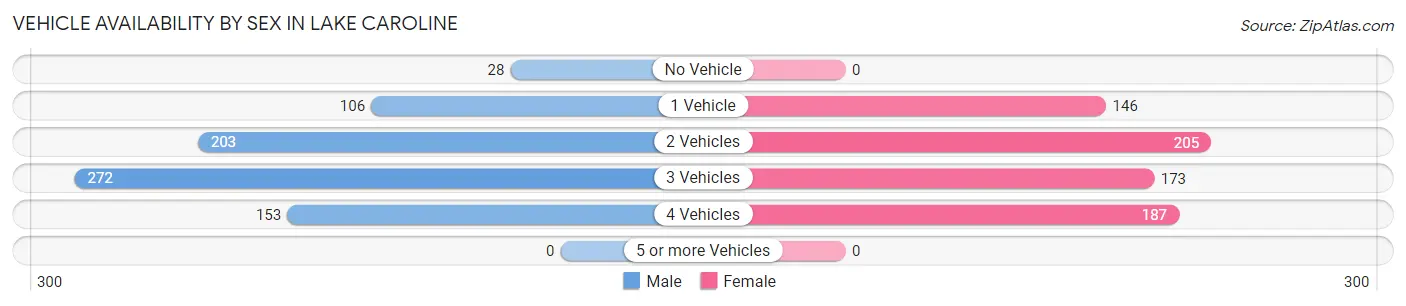
| Vehicles Available | Male | Female |
| No Vehicle | 28 (3.7%) | 0 (0.0%) |
| 1 Vehicle | 106 (13.9%) | 146 (20.5%) |
| 2 Vehicles | 203 (26.6%) | 205 (28.8%) |
| 3 Vehicles | 272 (35.7%) | 173 (24.3%) |
| 4 Vehicles | 153 (20.1%) | 187 (26.3%) |
| 5 or more Vehicles | 0 (0.0%) | 0 (0.0%) |
| Total | 762 (100.0%) | 711 (100.0%) |
Commute Time in Lake Caroline
The most frequently occuring commute durations in Lake Caroline are 60 to 89 minutes (438 commuters, 30.5%), 30 to 34 minutes (383 commuters, 26.7%), and 90 or more minutes (236 commuters, 16.5%).
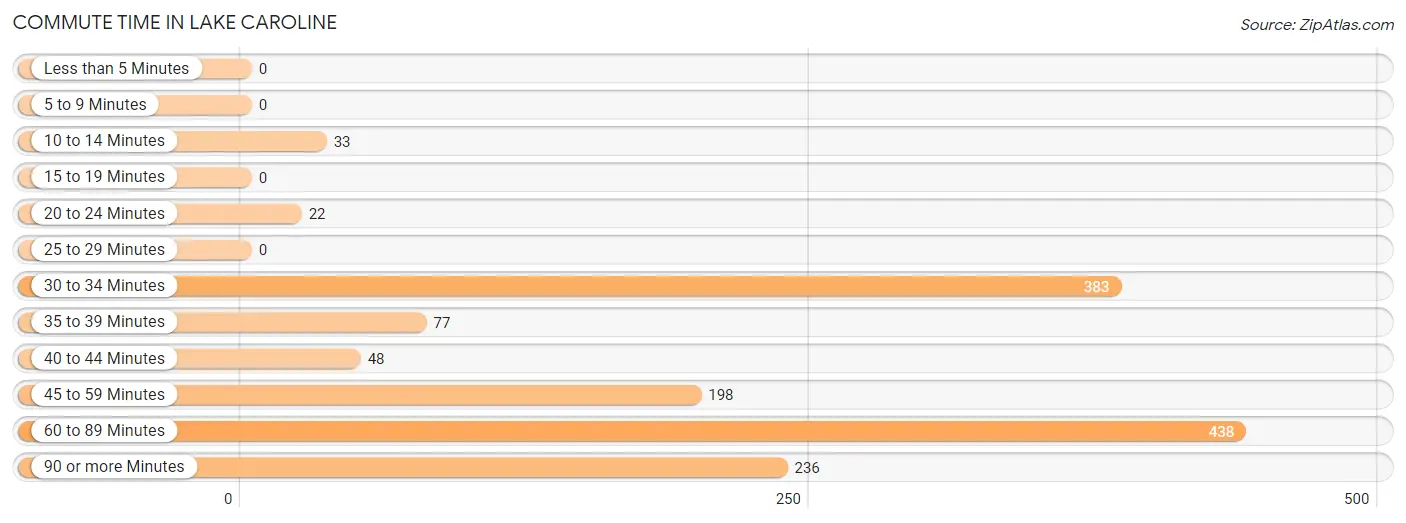
| Commute Time | # Commuters | % Commuters |
| Less than 5 Minutes | 0 | 0.0% |
| 5 to 9 Minutes | 0 | 0.0% |
| 10 to 14 Minutes | 33 | 2.3% |
| 15 to 19 Minutes | 0 | 0.0% |
| 20 to 24 Minutes | 22 | 1.5% |
| 25 to 29 Minutes | 0 | 0.0% |
| 30 to 34 Minutes | 383 | 26.7% |
| 35 to 39 Minutes | 77 | 5.4% |
| 40 to 44 Minutes | 48 | 3.3% |
| 45 to 59 Minutes | 198 | 13.8% |
| 60 to 89 Minutes | 438 | 30.5% |
| 90 or more Minutes | 236 | 16.5% |
Commute Time by Sex in Lake Caroline
The most common commute times in Lake Caroline are 60 to 89 minutes (438 commuters, 60.5%) for males and 30 to 34 minutes (292 commuters, 41.1%) for females.
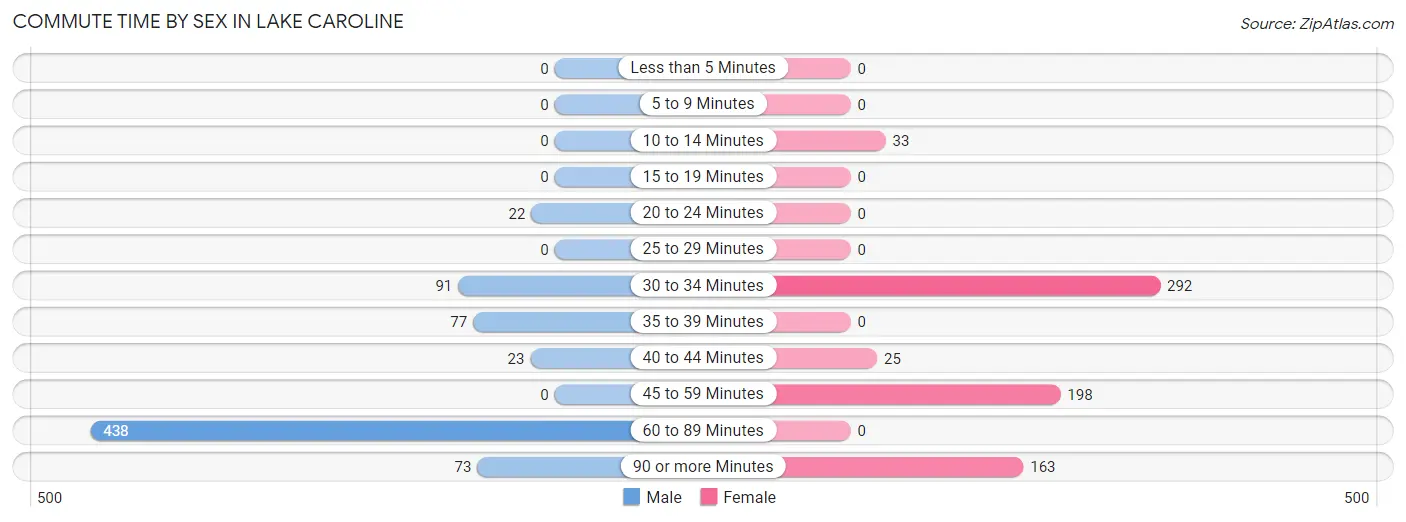
| Commute Time | Male | Female |
| Less than 5 Minutes | 0 (0.0%) | 0 (0.0%) |
| 5 to 9 Minutes | 0 (0.0%) | 0 (0.0%) |
| 10 to 14 Minutes | 0 (0.0%) | 33 (4.6%) |
| 15 to 19 Minutes | 0 (0.0%) | 0 (0.0%) |
| 20 to 24 Minutes | 22 (3.0%) | 0 (0.0%) |
| 25 to 29 Minutes | 0 (0.0%) | 0 (0.0%) |
| 30 to 34 Minutes | 91 (12.6%) | 292 (41.1%) |
| 35 to 39 Minutes | 77 (10.6%) | 0 (0.0%) |
| 40 to 44 Minutes | 23 (3.2%) | 25 (3.5%) |
| 45 to 59 Minutes | 0 (0.0%) | 198 (27.9%) |
| 60 to 89 Minutes | 438 (60.5%) | 0 (0.0%) |
| 90 or more Minutes | 73 (10.1%) | 163 (22.9%) |
Time of Departure to Work by Sex in Lake Caroline
The most frequent times of departure to work in Lake Caroline are 12:00 AM to 4:59 AM (240, 33.2%) for males and 12:00 AM to 4:59 AM (209, 29.4%) for females.
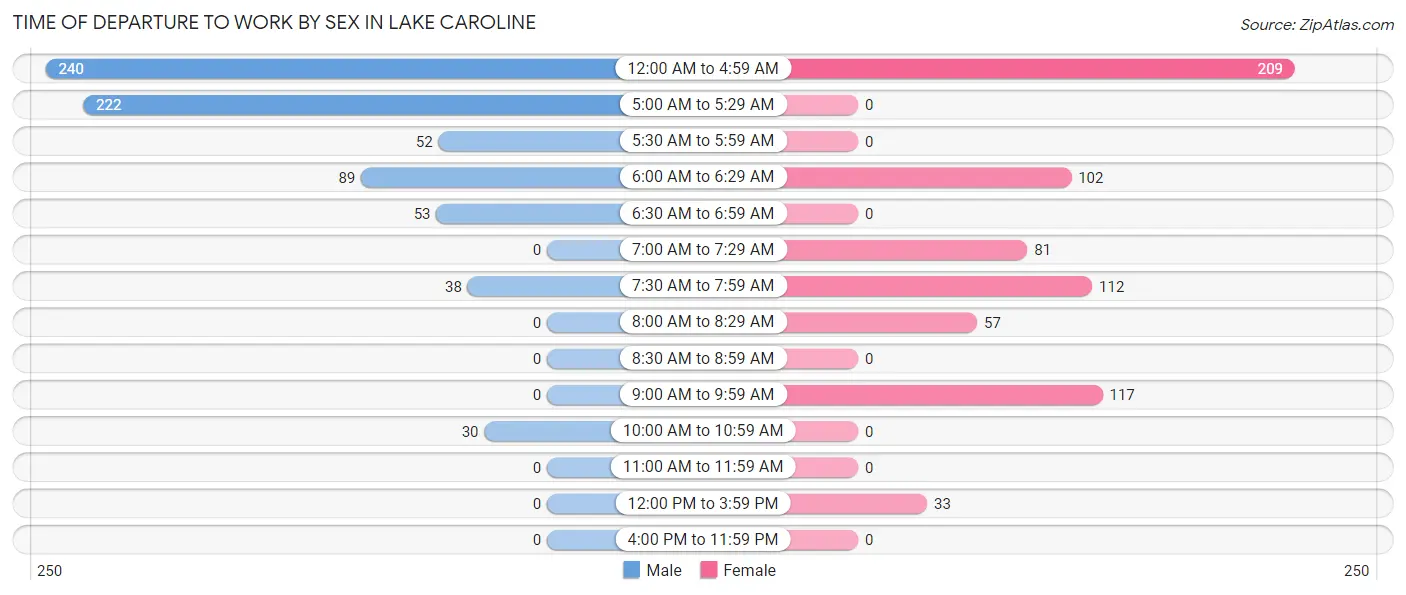
| Time of Departure | Male | Female |
| 12:00 AM to 4:59 AM | 240 (33.2%) | 209 (29.4%) |
| 5:00 AM to 5:29 AM | 222 (30.7%) | 0 (0.0%) |
| 5:30 AM to 5:59 AM | 52 (7.2%) | 0 (0.0%) |
| 6:00 AM to 6:29 AM | 89 (12.3%) | 102 (14.3%) |
| 6:30 AM to 6:59 AM | 53 (7.3%) | 0 (0.0%) |
| 7:00 AM to 7:29 AM | 0 (0.0%) | 81 (11.4%) |
| 7:30 AM to 7:59 AM | 38 (5.2%) | 112 (15.8%) |
| 8:00 AM to 8:29 AM | 0 (0.0%) | 57 (8.0%) |
| 8:30 AM to 8:59 AM | 0 (0.0%) | 0 (0.0%) |
| 9:00 AM to 9:59 AM | 0 (0.0%) | 117 (16.5%) |
| 10:00 AM to 10:59 AM | 30 (4.1%) | 0 (0.0%) |
| 11:00 AM to 11:59 AM | 0 (0.0%) | 0 (0.0%) |
| 12:00 PM to 3:59 PM | 0 (0.0%) | 33 (4.6%) |
| 4:00 PM to 11:59 PM | 0 (0.0%) | 0 (0.0%) |
| Total | 724 (100.0%) | 711 (100.0%) |
Housing Occupancy in Lake Caroline
Occupancy by Ownership in Lake Caroline
Of the total 1,054 dwellings in Lake Caroline, owner-occupied units account for 859 (81.5%), while renter-occupied units make up 195 (18.5%).
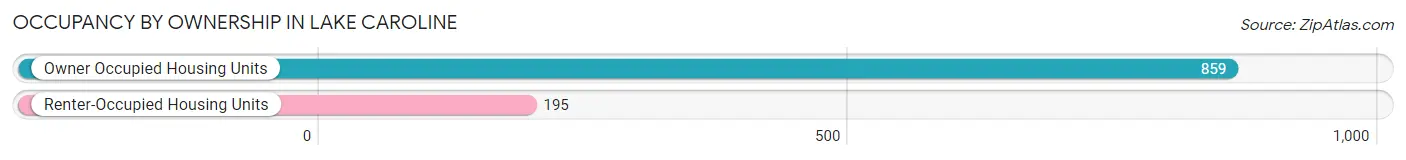
| Occupancy | # Housing Units | % Housing Units |
| Owner Occupied Housing Units | 859 | 81.5% |
| Renter-Occupied Housing Units | 195 | 18.5% |
| Total Occupied Housing Units | 1,054 | 100.0% |
Occupancy by Household Size in Lake Caroline
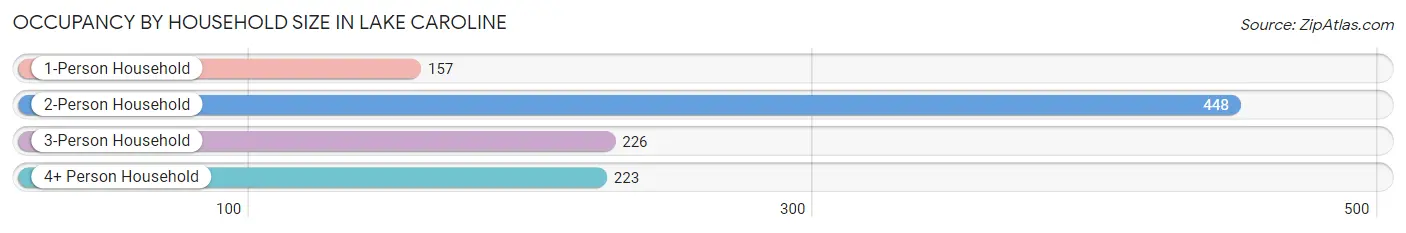
| Household Size | # Housing Units | % Housing Units |
| 1-Person Household | 157 | 14.9% |
| 2-Person Household | 448 | 42.5% |
| 3-Person Household | 226 | 21.4% |
| 4+ Person Household | 223 | 21.2% |
| Total Housing Units | 1,054 | 100.0% |
Occupancy by Ownership by Household Size in Lake Caroline
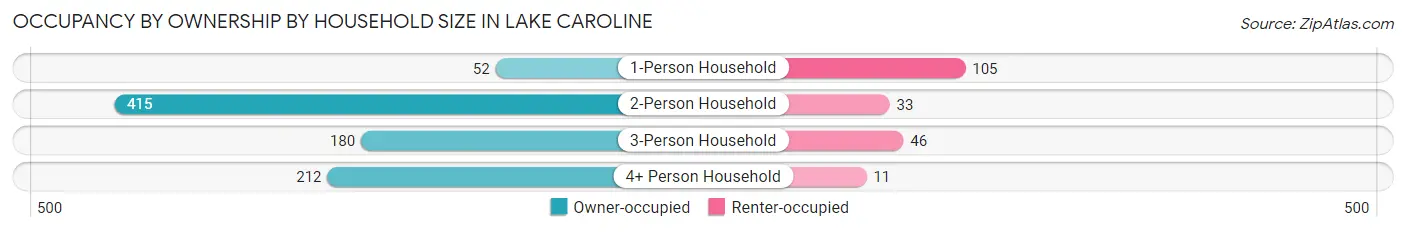
| Household Size | Owner-occupied | Renter-occupied |
| 1-Person Household | 52 (33.1%) | 105 (66.9%) |
| 2-Person Household | 415 (92.6%) | 33 (7.4%) |
| 3-Person Household | 180 (79.6%) | 46 (20.3%) |
| 4+ Person Household | 212 (95.1%) | 11 (4.9%) |
| Total Housing Units | 859 (81.5%) | 195 (18.5%) |
Occupancy by Educational Attainment in Lake Caroline
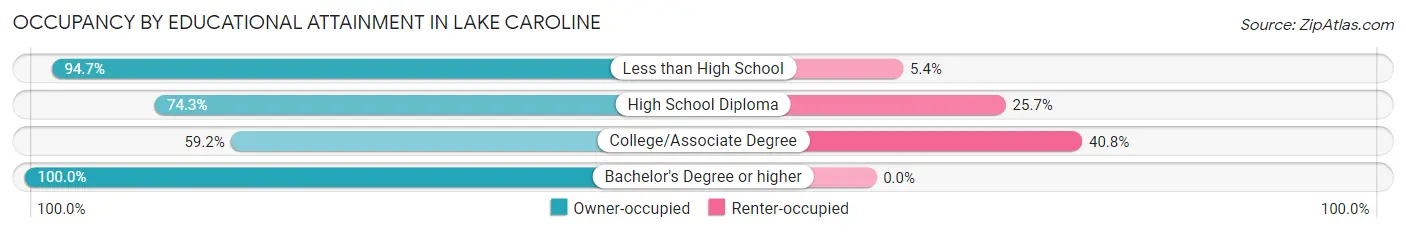
| Household Size | Owner-occupied | Renter-occupied |
| Less than High School | 177 (94.7%) | 10 (5.3%) |
| High School Diploma | 304 (74.3%) | 105 (25.7%) |
| College/Associate Degree | 116 (59.2%) | 80 (40.8%) |
| Bachelor's Degree or higher | 262 (100.0%) | 0 (0.0%) |
Occupancy by Age of Householder in Lake Caroline
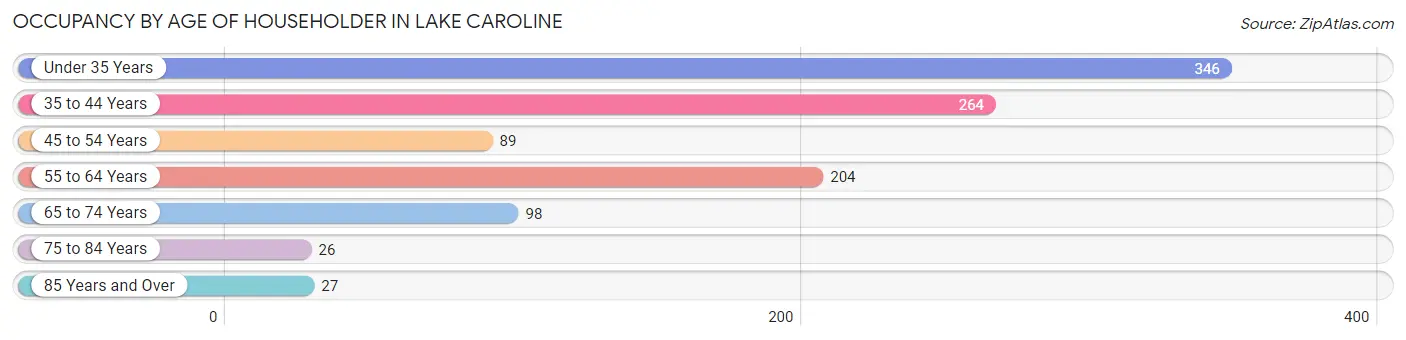
| Age Bracket | # Households | % Households |
| Under 35 Years | 346 | 32.8% |
| 35 to 44 Years | 264 | 25.1% |
| 45 to 54 Years | 89 | 8.4% |
| 55 to 64 Years | 204 | 19.4% |
| 65 to 74 Years | 98 | 9.3% |
| 75 to 84 Years | 26 | 2.5% |
| 85 Years and Over | 27 | 2.6% |
| Total | 1,054 | 100.0% |
Housing Finances in Lake Caroline
Median Income by Occupancy in Lake Caroline
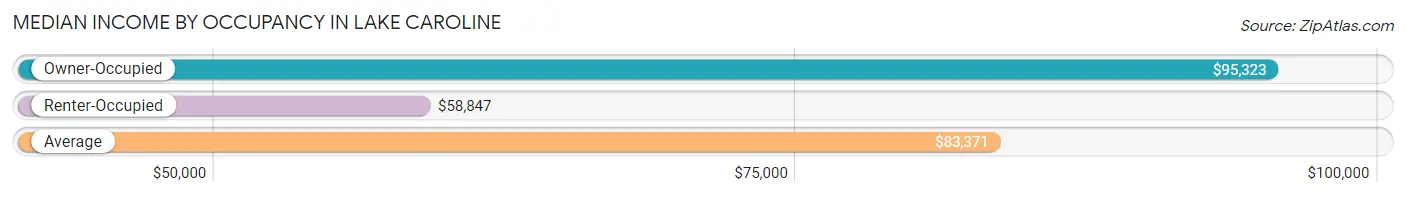
| Occupancy Type | # Households | Median Income |
| Owner-Occupied | 859 (81.5%) | $95,323 |
| Renter-Occupied | 195 (18.5%) | $58,847 |
| Average | 1,054 (100.0%) | $83,371 |
Occupancy by Householder Income Bracket in Lake Caroline
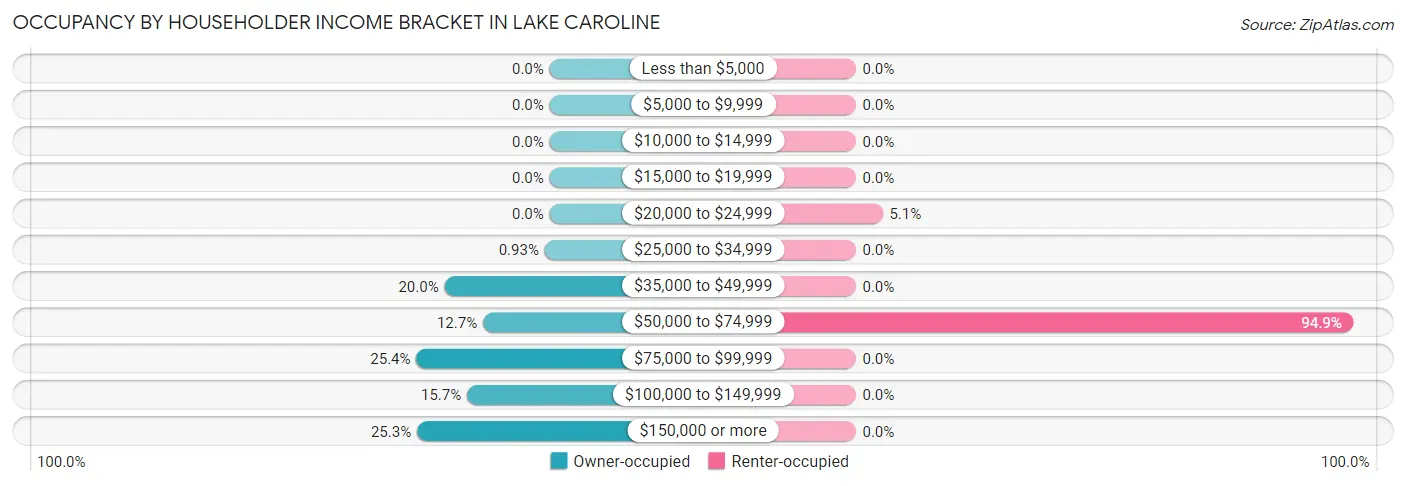
| Income Bracket | Owner-occupied | Renter-occupied |
| Less than $5,000 | 0 (0.0%) | 0 (0.0%) |
| $5,000 to $9,999 | 0 (0.0%) | 0 (0.0%) |
| $10,000 to $14,999 | 0 (0.0%) | 0 (0.0%) |
| $15,000 to $19,999 | 0 (0.0%) | 0 (0.0%) |
| $20,000 to $24,999 | 0 (0.0%) | 10 (5.1%) |
| $25,000 to $34,999 | 8 (0.9%) | 0 (0.0%) |
| $35,000 to $49,999 | 172 (20.0%) | 0 (0.0%) |
| $50,000 to $74,999 | 109 (12.7%) | 185 (94.9%) |
| $75,000 to $99,999 | 218 (25.4%) | 0 (0.0%) |
| $100,000 to $149,999 | 135 (15.7%) | 0 (0.0%) |
| $150,000 or more | 217 (25.3%) | 0 (0.0%) |
| Total | 859 (100.0%) | 195 (100.0%) |
Monthly Housing Cost Tiers in Lake Caroline
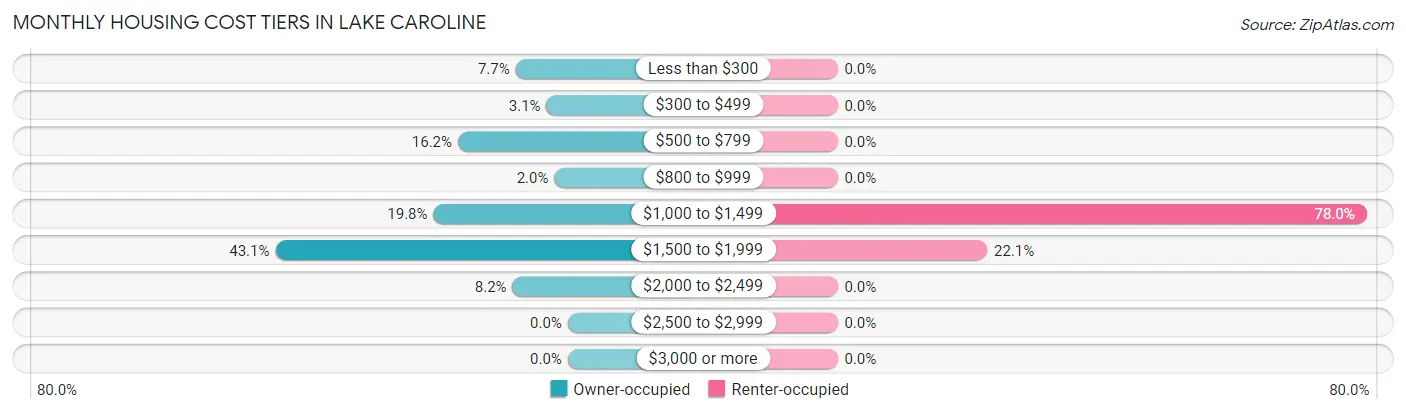
| Monthly Cost | Owner-occupied | Renter-occupied |
| Less than $300 | 66 (7.7%) | 0 (0.0%) |
| $300 to $499 | 27 (3.1%) | 0 (0.0%) |
| $500 to $799 | 139 (16.2%) | 0 (0.0%) |
| $800 to $999 | 17 (2.0%) | 0 (0.0%) |
| $1,000 to $1,499 | 170 (19.8%) | 152 (77.9%) |
| $1,500 to $1,999 | 370 (43.1%) | 43 (22.1%) |
| $2,000 to $2,499 | 70 (8.2%) | 0 (0.0%) |
| $2,500 to $2,999 | 0 (0.0%) | 0 (0.0%) |
| $3,000 or more | 0 (0.0%) | 0 (0.0%) |
| Total | 859 (100.0%) | 195 (100.0%) |
Physical Housing Characteristics in Lake Caroline
Housing Structures in Lake Caroline
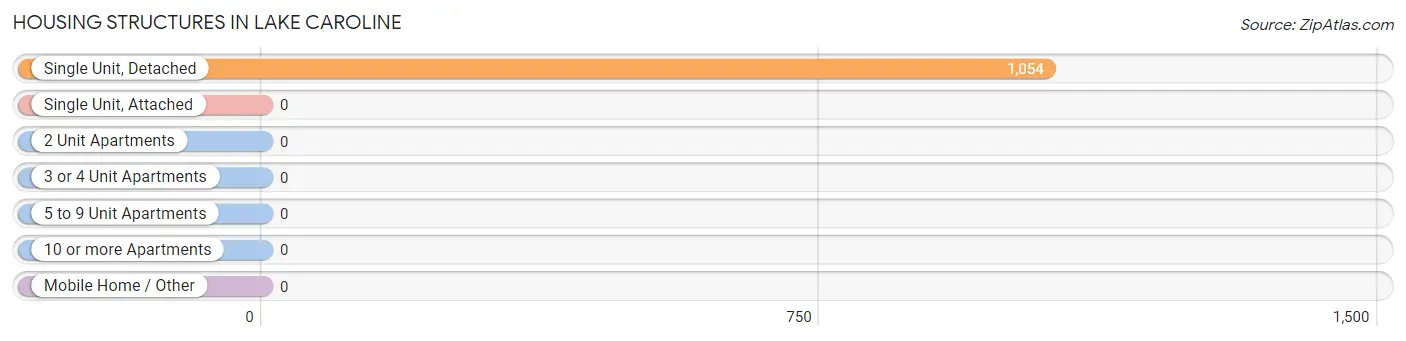
| Structure Type | # Housing Units | % Housing Units |
| Single Unit, Detached | 1,054 | 100.0% |
| Single Unit, Attached | 0 | 0.0% |
| 2 Unit Apartments | 0 | 0.0% |
| 3 or 4 Unit Apartments | 0 | 0.0% |
| 5 to 9 Unit Apartments | 0 | 0.0% |
| 10 or more Apartments | 0 | 0.0% |
| Mobile Home / Other | 0 | 0.0% |
| Total | 1,054 | 100.0% |
Housing Structures by Occupancy in Lake Caroline
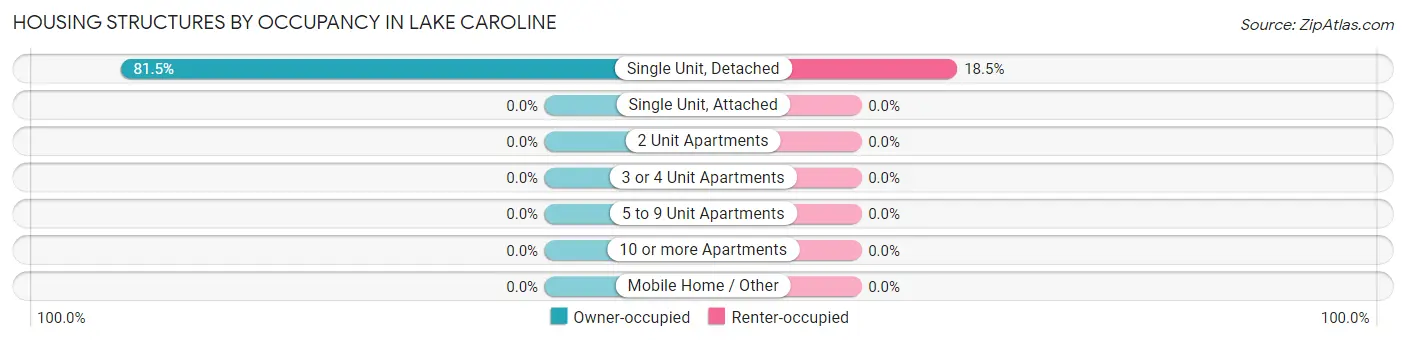
| Structure Type | Owner-occupied | Renter-occupied |
| Single Unit, Detached | 859 (81.5%) | 195 (18.5%) |
| Single Unit, Attached | 0 (0.0%) | 0 (0.0%) |
| 2 Unit Apartments | 0 (0.0%) | 0 (0.0%) |
| 3 or 4 Unit Apartments | 0 (0.0%) | 0 (0.0%) |
| 5 to 9 Unit Apartments | 0 (0.0%) | 0 (0.0%) |
| 10 or more Apartments | 0 (0.0%) | 0 (0.0%) |
| Mobile Home / Other | 0 (0.0%) | 0 (0.0%) |
| Total | 859 (81.5%) | 195 (18.5%) |
Housing Structures by Number of Rooms in Lake Caroline
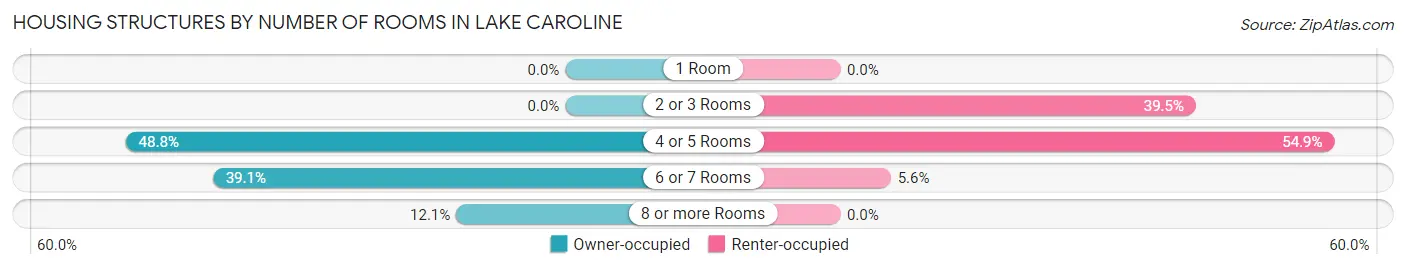
| Number of Rooms | Owner-occupied | Renter-occupied |
| 1 Room | 0 (0.0%) | 0 (0.0%) |
| 2 or 3 Rooms | 0 (0.0%) | 77 (39.5%) |
| 4 or 5 Rooms | 419 (48.8%) | 107 (54.9%) |
| 6 or 7 Rooms | 336 (39.1%) | 11 (5.6%) |
| 8 or more Rooms | 104 (12.1%) | 0 (0.0%) |
| Total | 859 (100.0%) | 195 (100.0%) |
Housing Structure by Heating Type in Lake Caroline
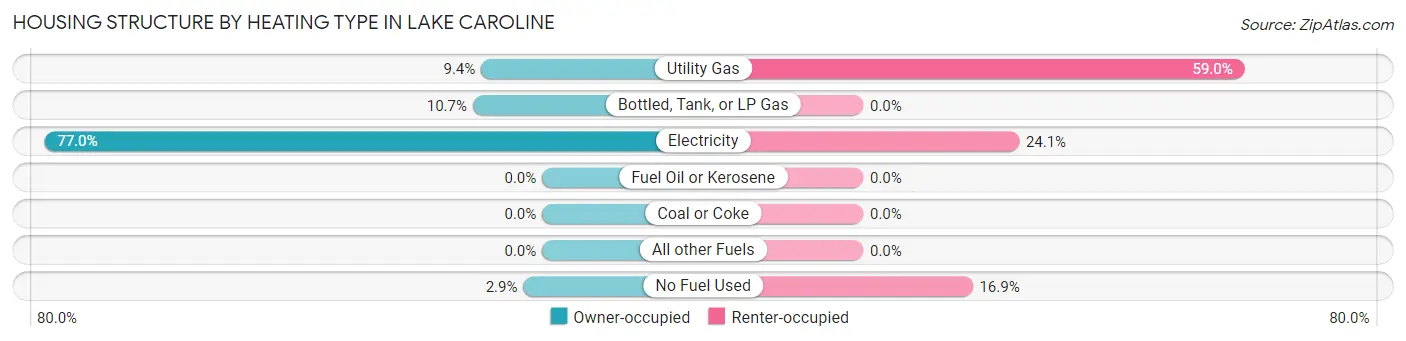
| Heating Type | Owner-occupied | Renter-occupied |
| Utility Gas | 81 (9.4%) | 115 (59.0%) |
| Bottled, Tank, or LP Gas | 92 (10.7%) | 0 (0.0%) |
| Electricity | 661 (76.9%) | 47 (24.1%) |
| Fuel Oil or Kerosene | 0 (0.0%) | 0 (0.0%) |
| Coal or Coke | 0 (0.0%) | 0 (0.0%) |
| All other Fuels | 0 (0.0%) | 0 (0.0%) |
| No Fuel Used | 25 (2.9%) | 33 (16.9%) |
| Total | 859 (100.0%) | 195 (100.0%) |
Household Vehicle Usage in Lake Caroline
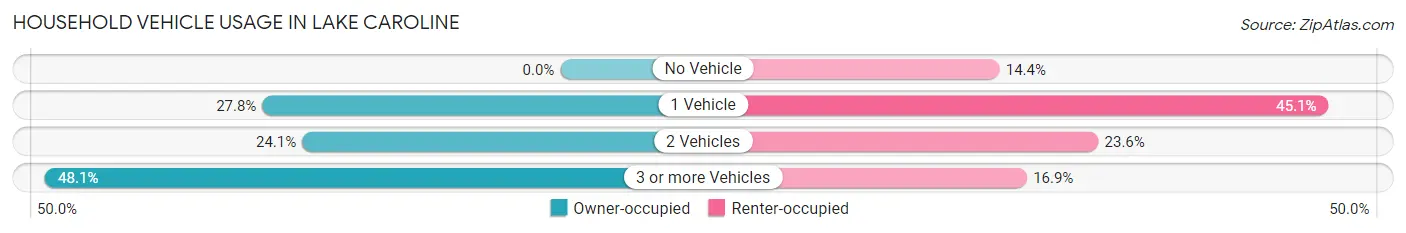
| Vehicles per Household | Owner-occupied | Renter-occupied |
| No Vehicle | 0 (0.0%) | 28 (14.4%) |
| 1 Vehicle | 239 (27.8%) | 88 (45.1%) |
| 2 Vehicles | 207 (24.1%) | 46 (23.6%) |
| 3 or more Vehicles | 413 (48.1%) | 33 (16.9%) |
| Total | 859 (100.0%) | 195 (100.0%) |
Real Estate & Mortgages in Lake Caroline
Real Estate and Mortgage Overview in Lake Caroline
| Characteristic | Without Mortgage | With Mortgage |
| Housing Units | 100 | 759 |
| Median Property Value | $196,000 | $299,800 |
| Median Household Income | $63,077 | $217 |
| Monthly Housing Costs | $540 | $0 |
| Real Estate Taxes | $1,273 | $27 |
Property Value by Mortgage Status in Lake Caroline
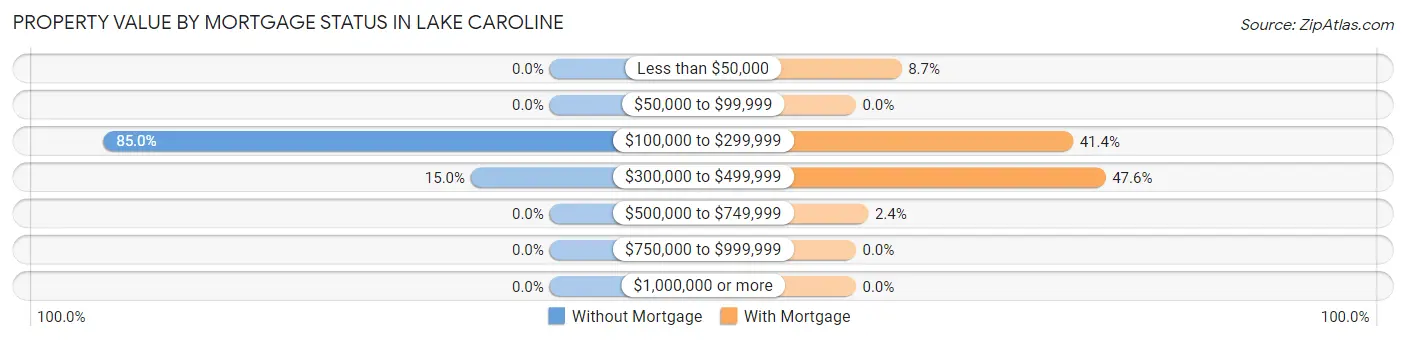
| Property Value | Without Mortgage | With Mortgage |
| Less than $50,000 | 0 (0.0%) | 66 (8.7%) |
| $50,000 to $99,999 | 0 (0.0%) | 0 (0.0%) |
| $100,000 to $299,999 | 85 (85.0%) | 314 (41.4%) |
| $300,000 to $499,999 | 15 (15.0%) | 361 (47.6%) |
| $500,000 to $749,999 | 0 (0.0%) | 18 (2.4%) |
| $750,000 to $999,999 | 0 (0.0%) | 0 (0.0%) |
| $1,000,000 or more | 0 (0.0%) | 0 (0.0%) |
| Total | 100 (100.0%) | 759 (100.0%) |
Household Income by Mortgage Status in Lake Caroline
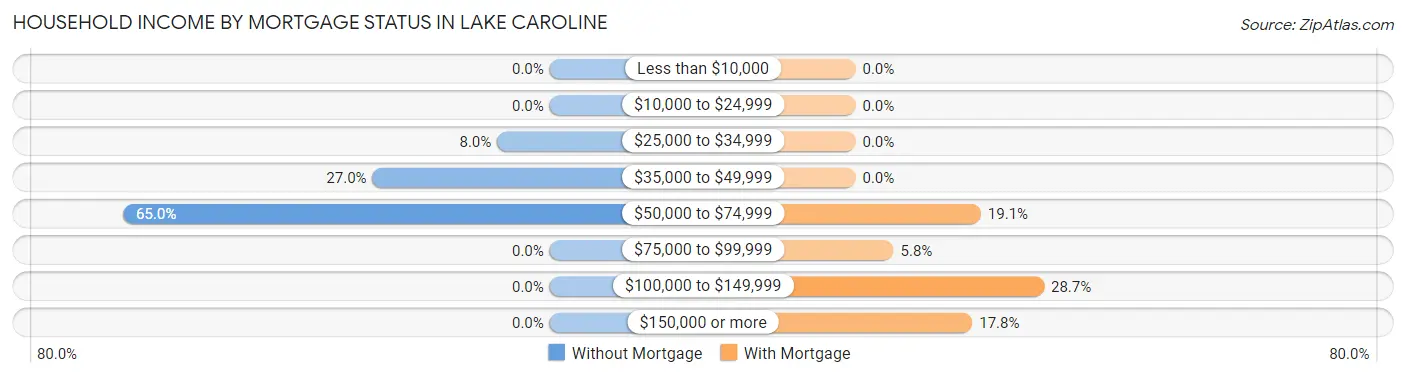
| Household Income | Without Mortgage | With Mortgage |
| Less than $10,000 | 0 (0.0%) | 0 (0.0%) |
| $10,000 to $24,999 | 0 (0.0%) | 0 (0.0%) |
| $25,000 to $34,999 | 8 (8.0%) | 0 (0.0%) |
| $35,000 to $49,999 | 27 (27.0%) | 0 (0.0%) |
| $50,000 to $74,999 | 65 (65.0%) | 145 (19.1%) |
| $75,000 to $99,999 | 0 (0.0%) | 44 (5.8%) |
| $100,000 to $149,999 | 0 (0.0%) | 218 (28.7%) |
| $150,000 or more | 0 (0.0%) | 135 (17.8%) |
| Total | 100 (100.0%) | 759 (100.0%) |
Property Value to Household Income Ratio in Lake Caroline
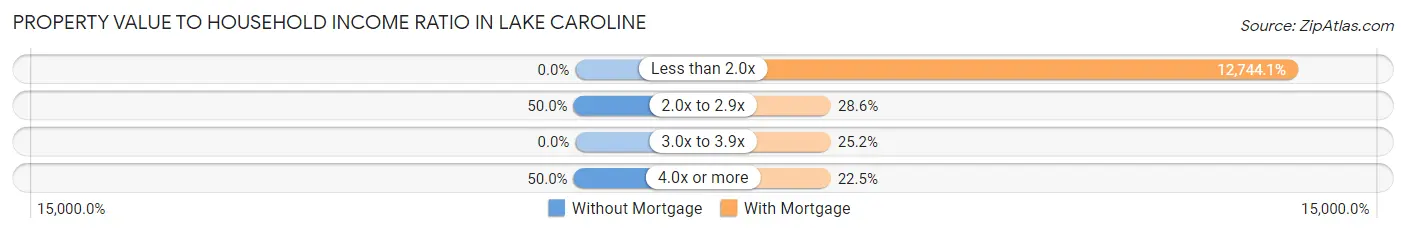
| Value-to-Income Ratio | Without Mortgage | With Mortgage |
| Less than 2.0x | 0 (0.0%) | 96,728 (12,744.1%) |
| 2.0x to 2.9x | 50 (50.0%) | 217 (28.6%) |
| 3.0x to 3.9x | 0 (0.0%) | 191 (25.2%) |
| 4.0x or more | 50 (50.0%) | 171 (22.5%) |
| Total | 100 (100.0%) | 759 (100.0%) |
Real Estate Taxes by Mortgage Status in Lake Caroline
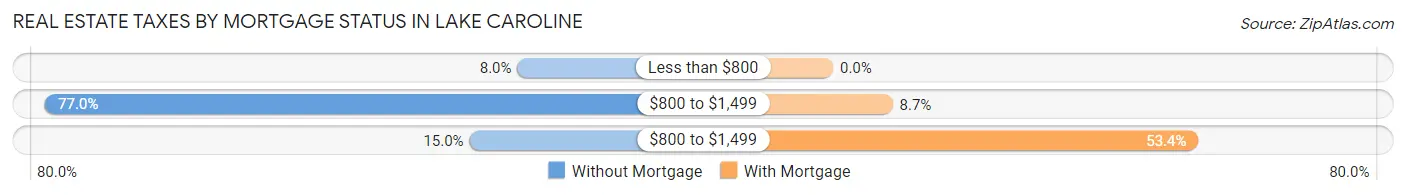
| Property Taxes | Without Mortgage | With Mortgage |
| Less than $800 | 8 (8.0%) | 0 (0.0%) |
| $800 to $1,499 | 77 (77.0%) | 66 (8.7%) |
| $800 to $1,499 | 15 (15.0%) | 405 (53.4%) |
| Total | 100 (100.0%) | 759 (100.0%) |
Health & Disability in Lake Caroline
Health Insurance Coverage by Age in Lake Caroline
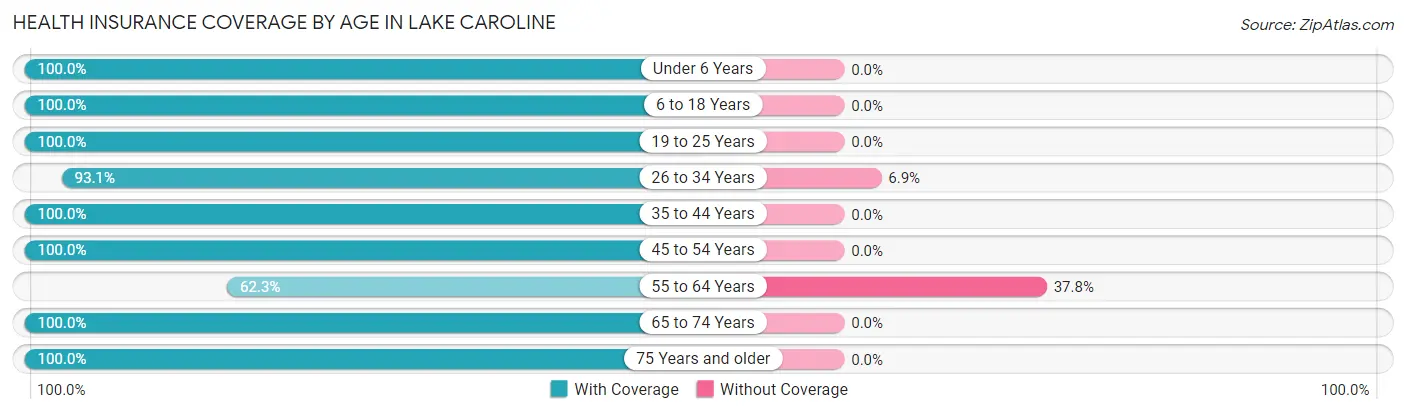
| Age Bracket | With Coverage | Without Coverage |
| Under 6 Years | 132 (100.0%) | 0 (0.0%) |
| 6 to 18 Years | 704 (100.0%) | 0 (0.0%) |
| 19 to 25 Years | 220 (100.0%) | 0 (0.0%) |
| 26 to 34 Years | 404 (93.1%) | 30 (6.9%) |
| 35 to 44 Years | 466 (100.0%) | 0 (0.0%) |
| 45 to 54 Years | 170 (100.0%) | 0 (0.0%) |
| 55 to 64 Years | 127 (62.3%) | 77 (37.8%) |
| 65 to 74 Years | 247 (100.0%) | 0 (0.0%) |
| 75 Years and older | 75 (100.0%) | 0 (0.0%) |
| Total | 2,545 (96.0%) | 107 (4.0%) |
Health Insurance Coverage by Citizenship Status in Lake Caroline
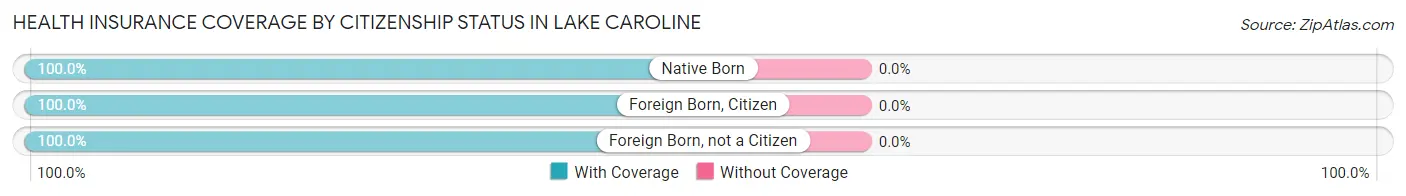
| Citizenship Status | With Coverage | Without Coverage |
| Native Born | 132 (100.0%) | 0 (0.0%) |
| Foreign Born, Citizen | 704 (100.0%) | 0 (0.0%) |
| Foreign Born, not a Citizen | 220 (100.0%) | 0 (0.0%) |
Health Insurance Coverage by Household Income in Lake Caroline
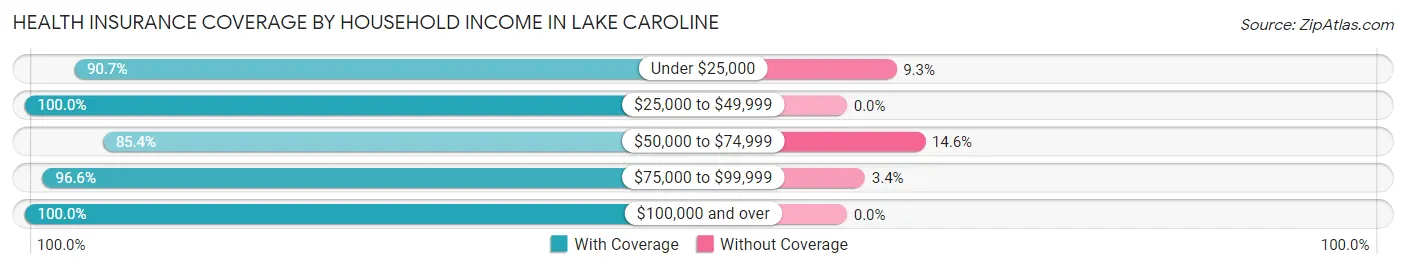
| Household Income | With Coverage | Without Coverage |
| Under $25,000 | 98 (90.7%) | 10 (9.3%) |
| $25,000 to $49,999 | 272 (100.0%) | 0 (0.0%) |
| $50,000 to $74,999 | 449 (85.4%) | 77 (14.6%) |
| $75,000 to $99,999 | 572 (96.6%) | 20 (3.4%) |
| $100,000 and over | 1,154 (100.0%) | 0 (0.0%) |
Public vs Private Health Insurance Coverage by Age in Lake Caroline
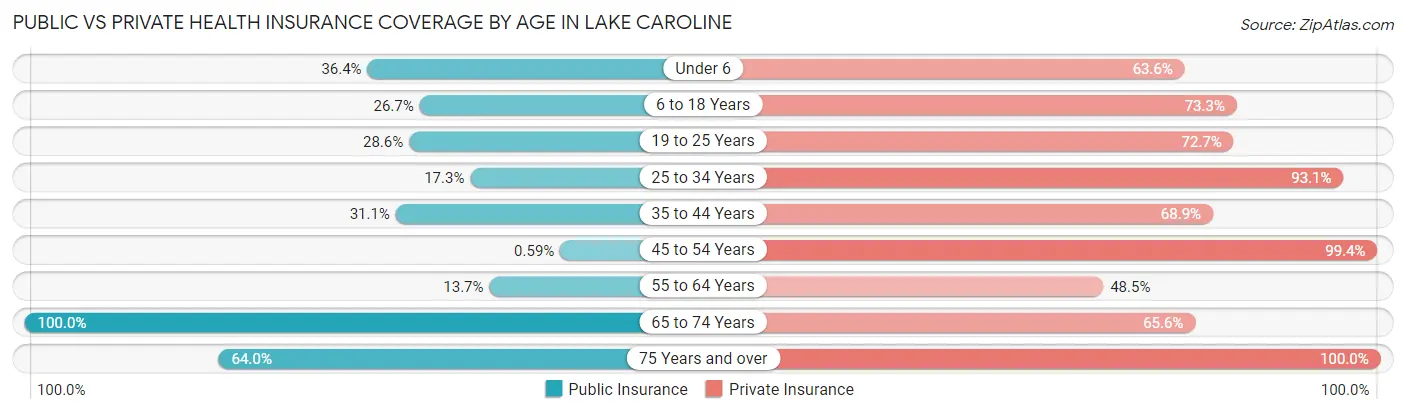
| Age Bracket | Public Insurance | Private Insurance |
| Under 6 | 48 (36.4%) | 84 (63.6%) |
| 6 to 18 Years | 188 (26.7%) | 516 (73.3%) |
| 19 to 25 Years | 63 (28.6%) | 160 (72.7%) |
| 25 to 34 Years | 75 (17.3%) | 404 (93.1%) |
| 35 to 44 Years | 145 (31.1%) | 321 (68.9%) |
| 45 to 54 Years | 1 (0.6%) | 169 (99.4%) |
| 55 to 64 Years | 28 (13.7%) | 99 (48.5%) |
| 65 to 74 Years | 247 (100.0%) | 162 (65.6%) |
| 75 Years and over | 48 (64.0%) | 75 (100.0%) |
| Total | 843 (31.8%) | 1,990 (75.0%) |
Disability Status by Sex by Age in Lake Caroline
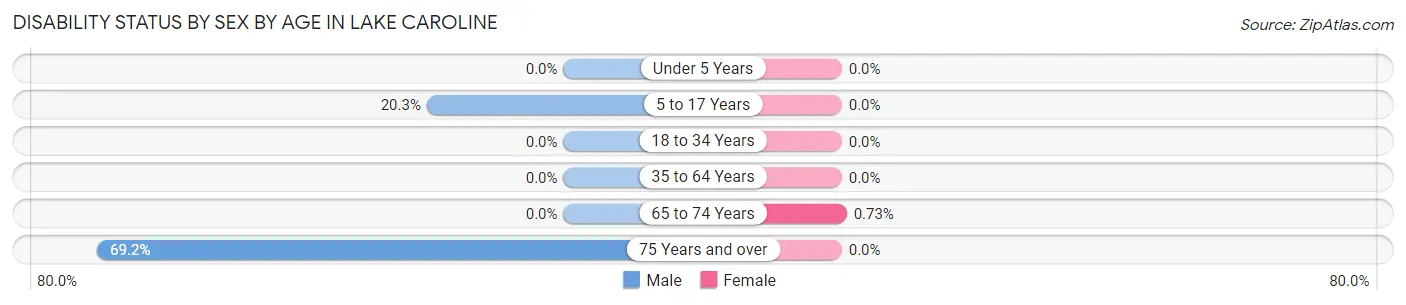
| Age Bracket | Male | Female |
| Under 5 Years | 0 (0.0%) | 0 (0.0%) |
| 5 to 17 Years | 69 (20.3%) | 0 (0.0%) |
| 18 to 34 Years | 0 (0.0%) | 0 (0.0%) |
| 35 to 64 Years | 0 (0.0%) | 0 (0.0%) |
| 65 to 74 Years | 0 (0.0%) | 1 (0.7%) |
| 75 Years and over | 18 (69.2%) | 0 (0.0%) |
Disability Class by Sex by Age in Lake Caroline
Disability Class: Hearing Difficulty
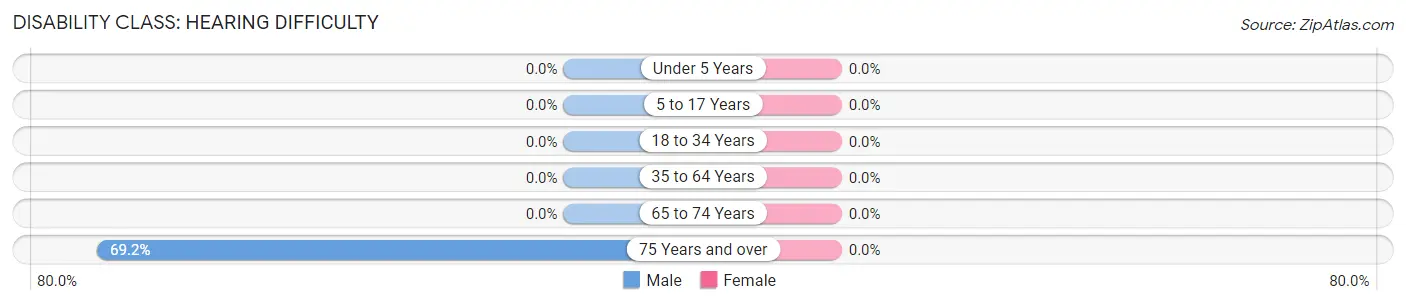
| Age Bracket | Male | Female |
| Under 5 Years | 0 (0.0%) | 0 (0.0%) |
| 5 to 17 Years | 0 (0.0%) | 0 (0.0%) |
| 18 to 34 Years | 0 (0.0%) | 0 (0.0%) |
| 35 to 64 Years | 0 (0.0%) | 0 (0.0%) |
| 65 to 74 Years | 0 (0.0%) | 0 (0.0%) |
| 75 Years and over | 18 (69.2%) | 0 (0.0%) |
Disability Class: Vision Difficulty
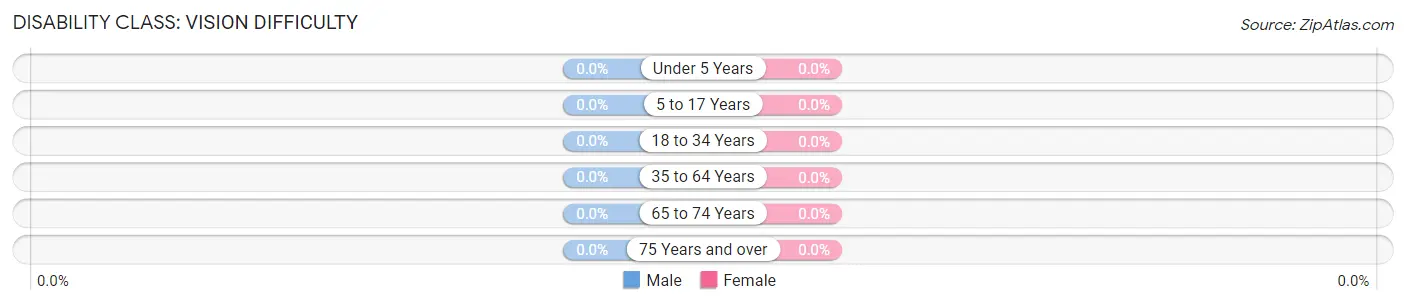
| Age Bracket | Male | Female |
| Under 5 Years | 0 (0.0%) | 0 (0.0%) |
| 5 to 17 Years | 0 (0.0%) | 0 (0.0%) |
| 18 to 34 Years | 0 (0.0%) | 0 (0.0%) |
| 35 to 64 Years | 0 (0.0%) | 0 (0.0%) |
| 65 to 74 Years | 0 (0.0%) | 0 (0.0%) |
| 75 Years and over | 0 (0.0%) | 0 (0.0%) |
Disability Class: Cognitive Difficulty
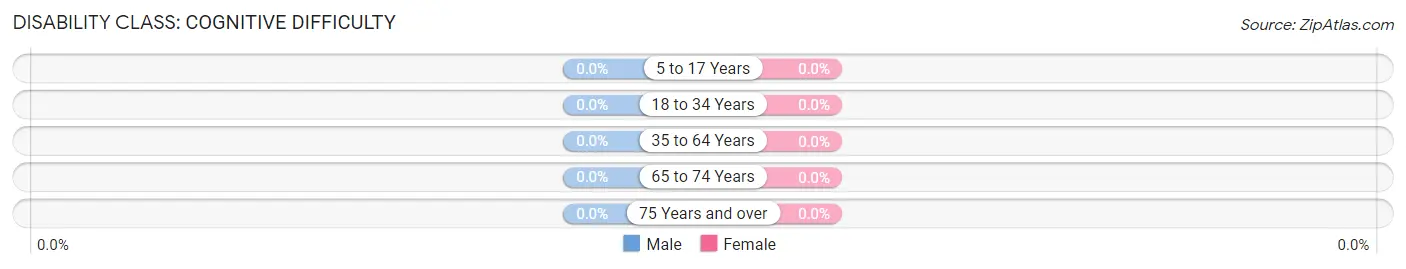
| Age Bracket | Male | Female |
| 5 to 17 Years | 0 (0.0%) | 0 (0.0%) |
| 18 to 34 Years | 0 (0.0%) | 0 (0.0%) |
| 35 to 64 Years | 0 (0.0%) | 0 (0.0%) |
| 65 to 74 Years | 0 (0.0%) | 0 (0.0%) |
| 75 Years and over | 0 (0.0%) | 0 (0.0%) |
Disability Class: Ambulatory Difficulty
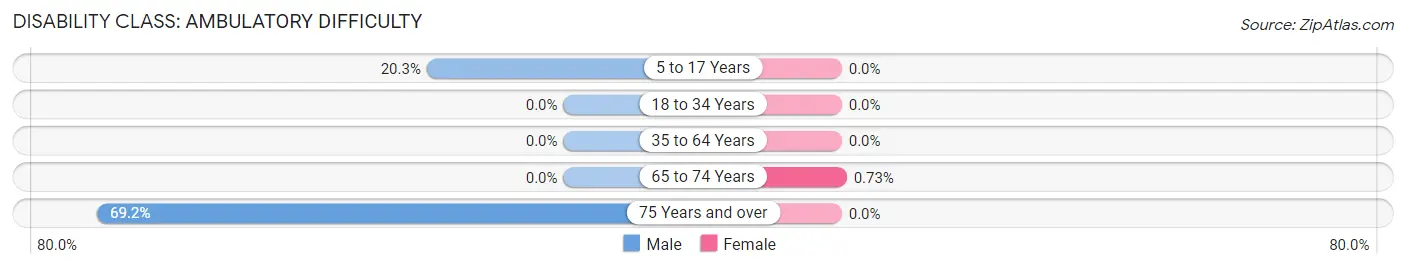
| Age Bracket | Male | Female |
| 5 to 17 Years | 69 (20.3%) | 0 (0.0%) |
| 18 to 34 Years | 0 (0.0%) | 0 (0.0%) |
| 35 to 64 Years | 0 (0.0%) | 0 (0.0%) |
| 65 to 74 Years | 0 (0.0%) | 1 (0.7%) |
| 75 Years and over | 18 (69.2%) | 0 (0.0%) |
Disability Class: Self-Care Difficulty
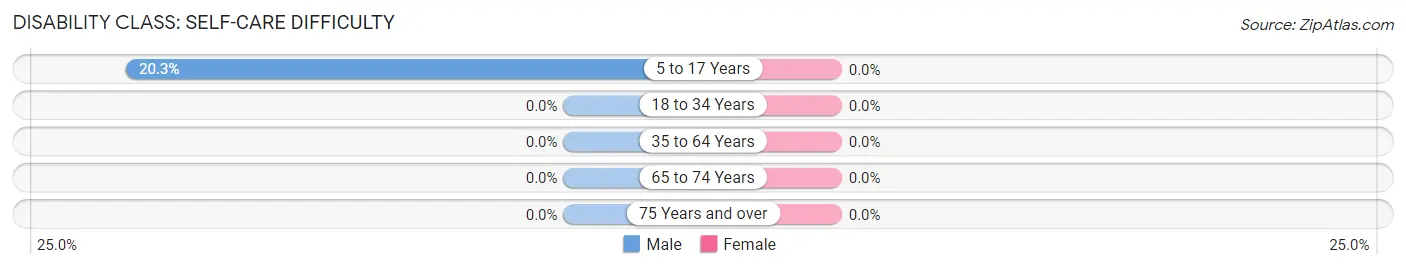
| Age Bracket | Male | Female |
| 5 to 17 Years | 69 (20.3%) | 0 (0.0%) |
| 18 to 34 Years | 0 (0.0%) | 0 (0.0%) |
| 35 to 64 Years | 0 (0.0%) | 0 (0.0%) |
| 65 to 74 Years | 0 (0.0%) | 0 (0.0%) |
| 75 Years and over | 0 (0.0%) | 0 (0.0%) |
Technology Access in Lake Caroline
Computing Device Access in Lake Caroline
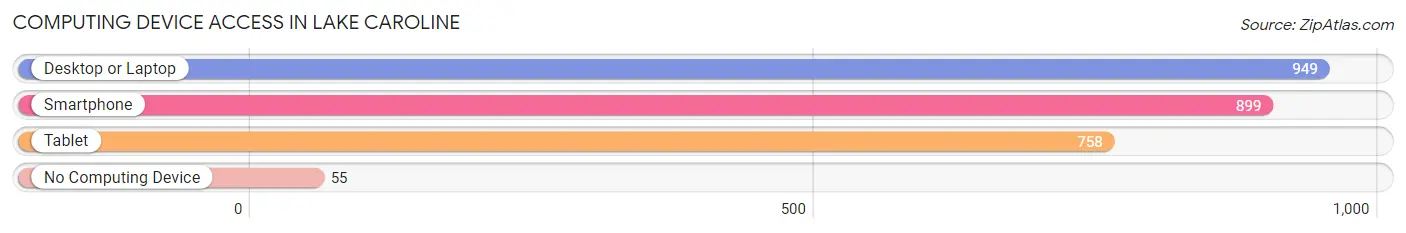
| Device Type | # Households | % Households |
| Desktop or Laptop | 949 | 90.0% |
| Smartphone | 899 | 85.3% |
| Tablet | 758 | 71.9% |
| No Computing Device | 55 | 5.2% |
| Total | 1,054 | 100.0% |
Internet Access in Lake Caroline
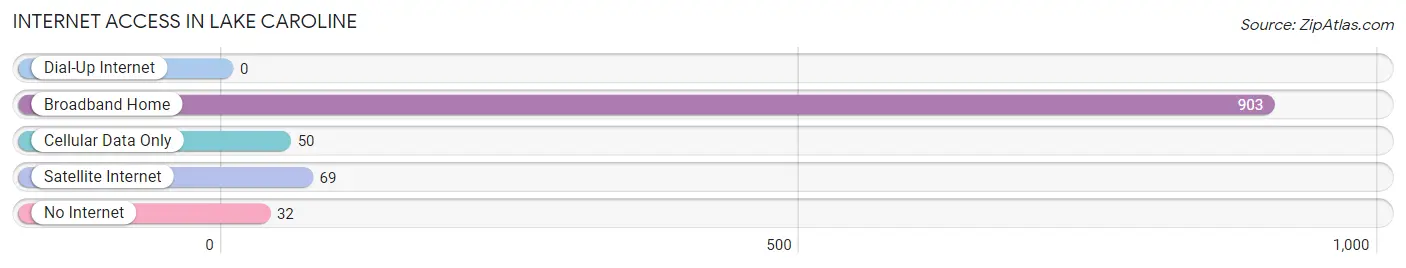
| Internet Type | # Households | % Households |
| Dial-Up Internet | 0 | 0.0% |
| Broadband Home | 903 | 85.7% |
| Cellular Data Only | 50 | 4.7% |
| Satellite Internet | 69 | 6.6% |
| No Internet | 32 | 3.0% |
| Total | 1,054 | 100.0% |
Lake Caroline Summary
Caroline County, Virginia is located in the central part of the state, just south of the city of Richmond. It is bordered by Hanover County to the north, Spotsylvania County to the east, King George County to the south, and Louisa County to the west. The county seat is the town of Bowling Green.
History
Caroline County was formed in 1728 from parts of King and Queen County. It was named for Caroline of Ansbach, the wife of King George II. The county was originally divided into four parishes: St. Mary's, St. Stephen's, St. Paul's, and St. Thomas'.
In 1732, the county seat was moved from Port Royal to Bowling Green. The county courthouse was built in 1742 and is still in use today.
During the American Revolution, Caroline County was a hotbed of Patriot activity. The county was home to several prominent Patriot leaders, including Thomas Jefferson, James Madison, and Patrick Henry.
In the 19th century, Caroline County was a major center of the tobacco industry. The county was home to several large tobacco plantations, and the town of Bowling Green was a major tobacco port.
Geography
Caroline County is located in the central part of Virginia, just south of the city of Richmond. It is bordered by Hanover County to the north, Spotsylvania County to the east, King George County to the south, and Louisa County to the west.
The county is mostly flat, with rolling hills in the northern and western parts. The Mattaponi and Pamunkey Rivers flow through the county, and Lake Caroline is located in the northern part of the county.
Economy
The economy of Caroline County is largely based on agriculture. The county is home to several large farms, and the town of Bowling Green is a major tobacco port.
The county is also home to several manufacturing companies, including a paper mill, a furniture factory, and a plastics plant.
Demographics
As of the 2010 census, Caroline County had a population of 28,545. The racial makeup of the county was 79.3% White, 17.3% African American, 0.5% Native American, 0.7% Asian, 0.1% Pacific Islander, and 1.2% from other races. Hispanic or Latino of any race were 2.3% of the population.
The median household income in the county was $50,945, and the median family income was $60,945. The per capita income was $25,945. About 11.3% of families and 14.2% of the population were below the poverty line.
Common Questions
What is Per Capita Income in Lake Caroline?
Per Capita income in Lake Caroline is $40,409.
What is the Median Family Income in Lake Caroline?
Median Family Income in Lake Caroline is $95,014.
What is the Median Household income in Lake Caroline?
Median Household Income in Lake Caroline is $83,371.
What is Income or Wage Gap in Lake Caroline?
Income or Wage Gap in Lake Caroline is 32.4%.
Women in Lake Caroline earn 67.6 cents for every dollar earned by a man.
What is Inequality or Gini Index in Lake Caroline?
Inequality or Gini Index in Lake Caroline is 0.36.
What is the Total Population of Lake Caroline?
Total Population of Lake Caroline is 2,652.
What is the Total Male Population of Lake Caroline?
Total Male Population of Lake Caroline is 1,287.
What is the Total Female Population of Lake Caroline?
Total Female Population of Lake Caroline is 1,365.
What is the Ratio of Males per 100 Females in Lake Caroline?
There are 94.29 Males per 100 Females in Lake Caroline.
What is the Ratio of Females per 100 Males in Lake Caroline?
There are 106.06 Females per 100 Males in Lake Caroline.
What is the Median Population Age in Lake Caroline?
Median Population Age in Lake Caroline is 32.4 Years.
What is the Average Family Size in Lake Caroline
Average Family Size in Lake Caroline is 2.6 People.
What is the Average Household Size in Lake Caroline
Average Household Size in Lake Caroline is 2.5 People.
How Large is the Labor Force in Lake Caroline?
There are 1,472 People in the Labor Forcein in Lake Caroline.
What is the Percentage of People in the Labor Force in Lake Caroline?
78.7% of People are in the Labor Force in Lake Caroline.