Claremont, VA Map & Demographics
Claremont Map
Claremont Overview
$37,889
PER CAPITA INCOME
$100,294
AVG FAMILY INCOME
$54,583
AVG HOUSEHOLD INCOME
10.2%
WAGE / INCOME GAP [ % ]
89.8¢/ $1
WAGE / INCOME GAP [ $ ]
0.40
INEQUALITY / GINI INDEX
421
TOTAL POPULATION
252
MALE POPULATION
169
FEMALE POPULATION
149.11
MALES / 100 FEMALES
67.06
FEMALES / 100 MALES
60.9
MEDIAN AGE
2.5
AVG FAMILY SIZE
1.9
AVG HOUSEHOLD SIZE
182
LABOR FORCE [ PEOPLE ]
45.8%
PERCENT IN LABOR FORCE
Claremont Zip Codes
Claremont Area Codes
Income in Claremont
Income Overview in Claremont
Per Capita Income in Claremont is $37,889, while median incomes of families and households are $100,294 and $54,583 respectively.
| Characteristic | Number | Measure |
| Per Capita Income | 421 | $37,889 |
| Median Family Income | 128 | $100,294 |
| Mean Family Income | 128 | $97,062 |
| Median Household Income | 218 | $54,583 |
| Mean Household Income | 218 | $70,116 |
| Income Deficit | 128 | $0 |
| Wage / Income Gap (%) | 421 | 10.16% |
| Wage / Income Gap ($) | 421 | 89.84¢ per $1 |
| Gini / Inequality Index | 421 | 0.40 |
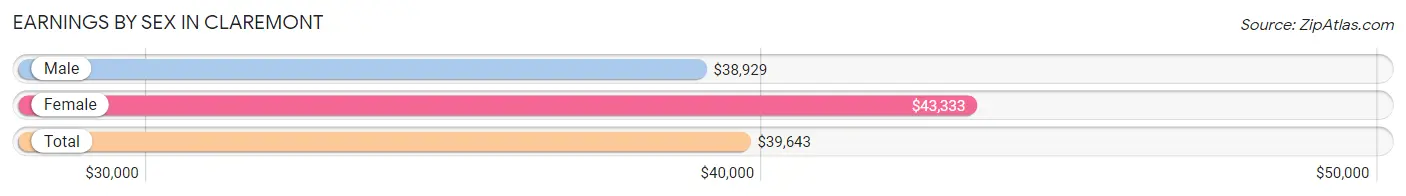
Earnings by Sex in Claremont
Average Earnings in Claremont are $39,643, $38,929 for men and $43,333 for women, a difference of 10.2%.
| Sex | Number | Average Earnings |
| Male | 108 (57.5%) | $38,929 |
| Female | 80 (42.5%) | $43,333 |
| Total | 188 (100.0%) | $39,643 |
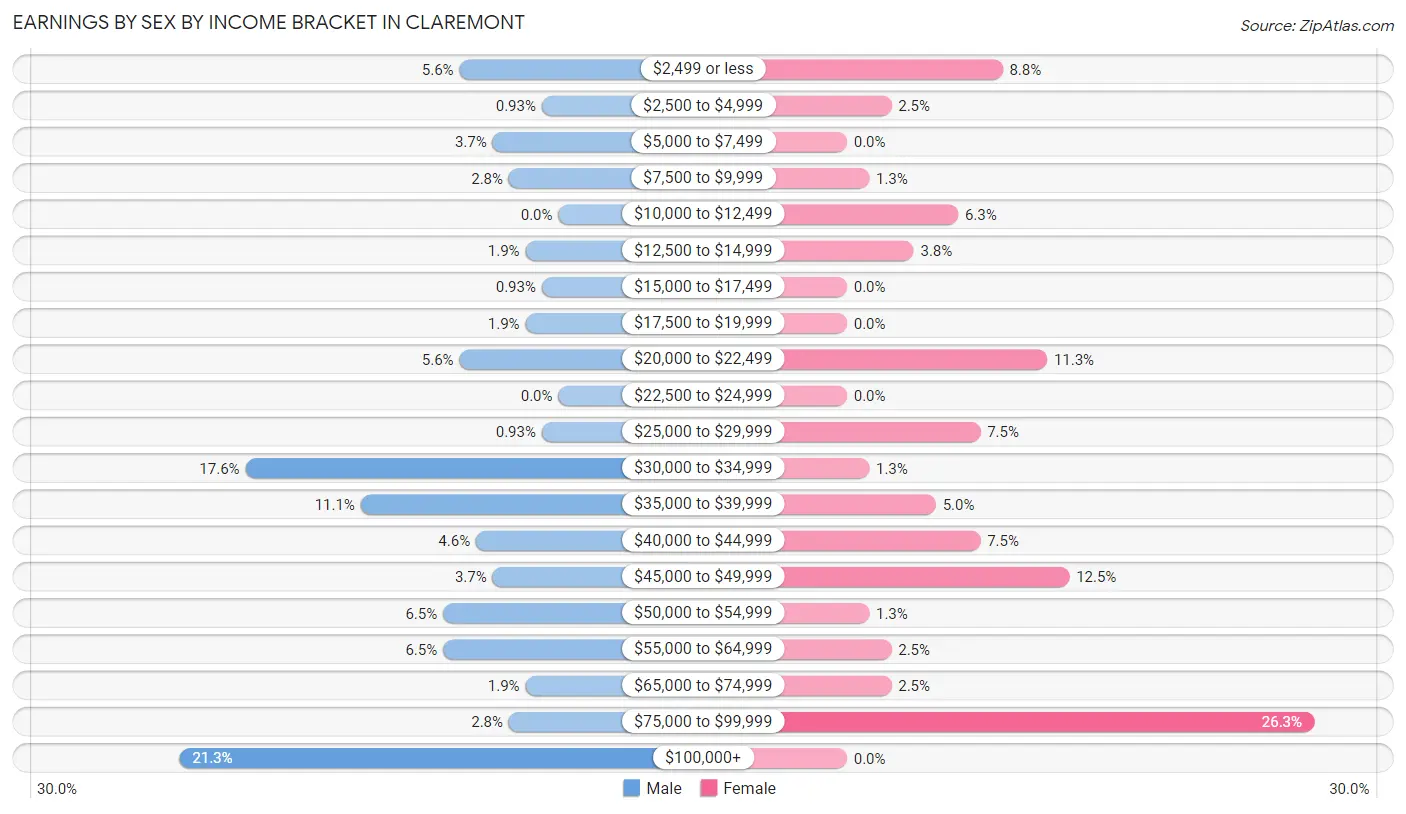
Earnings by Sex by Income Bracket in Claremont
The most common earnings brackets in Claremont are $100,000+ for men (23 | 21.3%) and $75,000 to $99,999 for women (21 | 26.3%).
| Income | Male | Female |
| $2,499 or less | 6 (5.6%) | 7 (8.7%) |
| $2,500 to $4,999 | 1 (0.9%) | 2 (2.5%) |
| $5,000 to $7,499 | 4 (3.7%) | 0 (0.0%) |
| $7,500 to $9,999 | 3 (2.8%) | 1 (1.3%) |
| $10,000 to $12,499 | 0 (0.0%) | 5 (6.2%) |
| $12,500 to $14,999 | 2 (1.8%) | 3 (3.7%) |
| $15,000 to $17,499 | 1 (0.9%) | 0 (0.0%) |
| $17,500 to $19,999 | 2 (1.8%) | 0 (0.0%) |
| $20,000 to $22,499 | 6 (5.6%) | 9 (11.3%) |
| $22,500 to $24,999 | 0 (0.0%) | 0 (0.0%) |
| $25,000 to $29,999 | 1 (0.9%) | 6 (7.5%) |
| $30,000 to $34,999 | 19 (17.6%) | 1 (1.3%) |
| $35,000 to $39,999 | 12 (11.1%) | 4 (5.0%) |
| $40,000 to $44,999 | 5 (4.6%) | 6 (7.5%) |
| $45,000 to $49,999 | 4 (3.7%) | 10 (12.5%) |
| $50,000 to $54,999 | 7 (6.5%) | 1 (1.3%) |
| $55,000 to $64,999 | 7 (6.5%) | 2 (2.5%) |
| $65,000 to $74,999 | 2 (1.8%) | 2 (2.5%) |
| $75,000 to $99,999 | 3 (2.8%) | 21 (26.3%) |
| $100,000+ | 23 (21.3%) | 0 (0.0%) |
| Total | 108 (100.0%) | 80 (100.0%) |
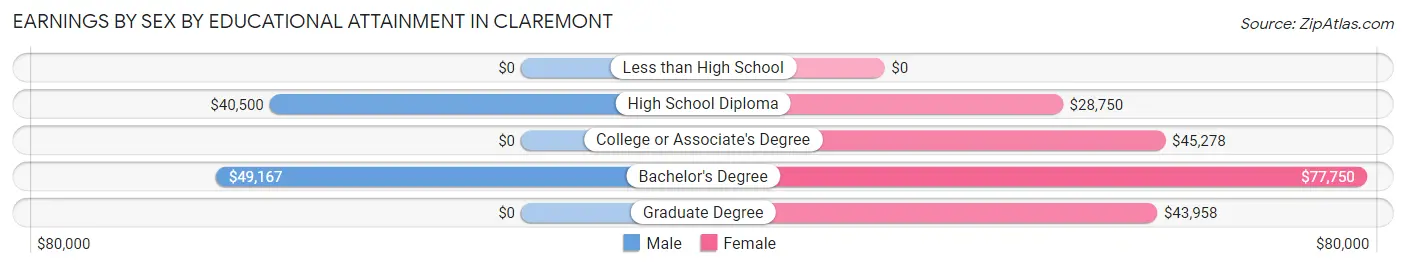
Earnings by Sex by Educational Attainment in Claremont
Average earnings in Claremont are $41,250 for men and $44,583 for women, a difference of 7.5%. Men with an educational attainment of bachelor's degree enjoy the highest average annual earnings of $49,167, while those with high school diploma education earn the least with $40,500. Women with an educational attainment of bachelor's degree earn the most with the average annual earnings of $77,750, while those with high school diploma education have the smallest earnings of $28,750.
| Educational Attainment | Male Income | Female Income |
| Less than High School | - | - |
| High School Diploma | $40,500 | $28,750 |
| College or Associate's Degree | - | - |
| Bachelor's Degree | $49,167 | $77,750 |
| Graduate Degree | - | - |
| Total | $41,250 | $44,583 |
Family Income in Claremont
Family Income Brackets in Claremont
According to the Claremont family income data, there are 40 families falling into the $100,000 to $149,999 income range, which is the most common income bracket and makes up 31.2% of all families. Conversely, the $15,000 to $24,999 income bracket is the least frequent group with only 1 families (0.8%) belonging to this category.
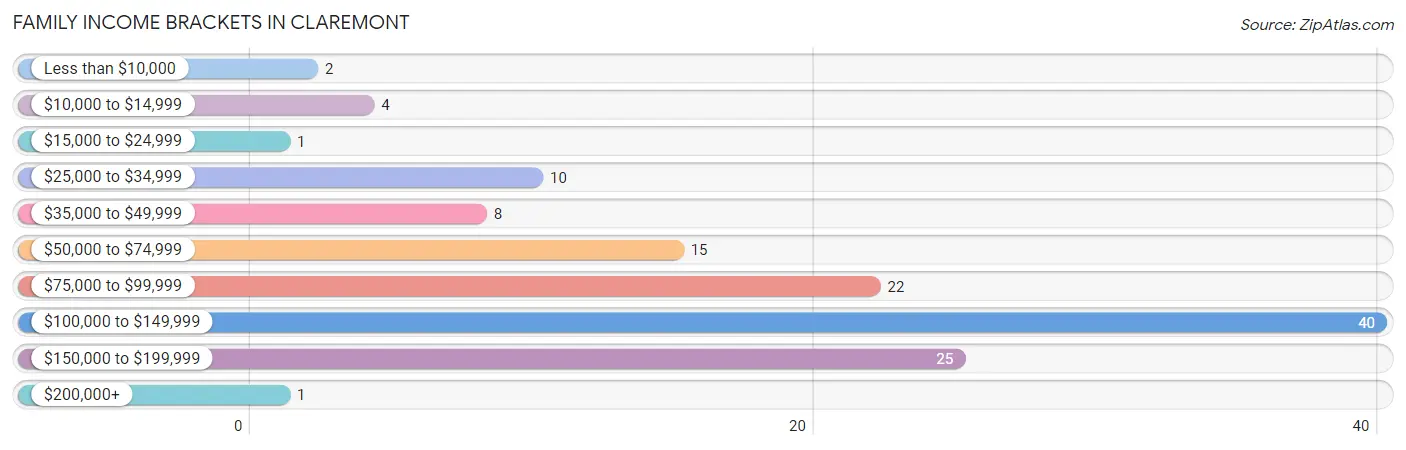
| Income Bracket | # Families | % Families |
| Less than $10,000 | 2 | 1.6% |
| $10,000 to $14,999 | 4 | 3.1% |
| $15,000 to $24,999 | 1 | 0.8% |
| $25,000 to $34,999 | 10 | 7.8% |
| $35,000 to $49,999 | 8 | 6.3% |
| $50,000 to $74,999 | 15 | 11.7% |
| $75,000 to $99,999 | 22 | 17.2% |
| $100,000 to $149,999 | 40 | 31.3% |
| $150,000 to $199,999 | 25 | 19.5% |
| $200,000+ | 1 | 0.8% |
Family Income by Famaliy Size in Claremont
3-person families (25 | 19.5%) account for the highest median family income in Claremont with $135,625 per family, while 3-person families (25 | 19.5%) have the highest median income of $45,208 per family member.
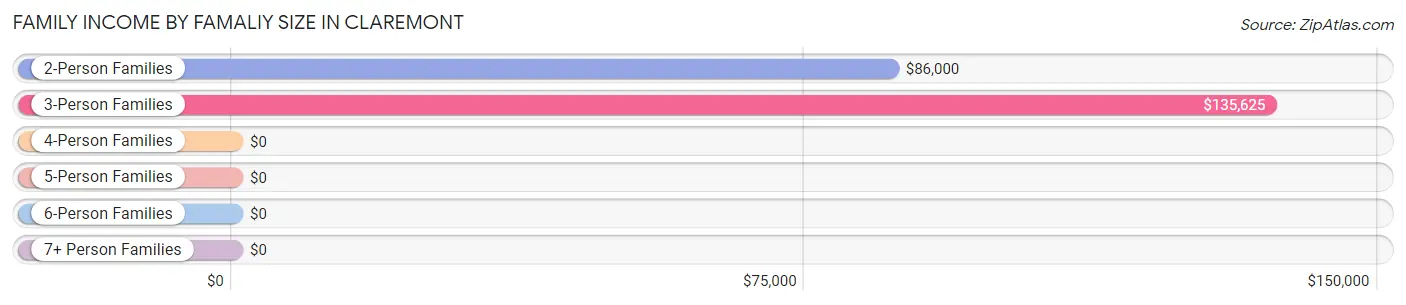
| Income Bracket | # Families | Median Income |
| 2-Person Families | 80 (62.5%) | $86,000 |
| 3-Person Families | 25 (19.5%) | $135,625 |
| 4-Person Families | 20 (15.6%) | $0 |
| 5-Person Families | 3 (2.3%) | $0 |
| 6-Person Families | 0 (0.0%) | $0 |
| 7+ Person Families | 0 (0.0%) | $0 |
| Total | 128 (100.0%) | $100,294 |
Family Income by Number of Earners in Claremont
The median family income in Claremont is $100,294, with families comprising 3+ earners (15) having the highest median family income of $136,875, while families with no earners (35) have the lowest median family income of $35,625, accounting for 11.7% and 27.3% of families, respectively.
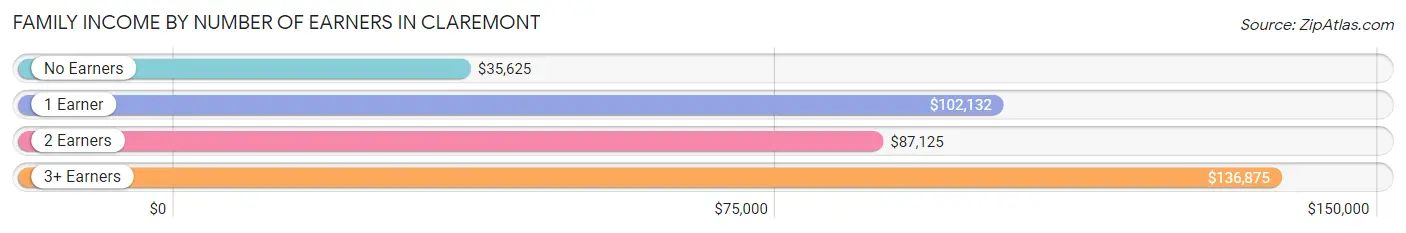
| Number of Earners | # Families | Median Income |
| No Earners | 35 (27.3%) | $35,625 |
| 1 Earner | 51 (39.8%) | $102,132 |
| 2 Earners | 27 (21.1%) | $87,125 |
| 3+ Earners | 15 (11.7%) | $136,875 |
| Total | 128 (100.0%) | $100,294 |
Household Income in Claremont
Household Income Brackets in Claremont
With 47 households falling in the category, the $15,000 to $24,999 income range is the most frequent in Claremont, accounting for 21.6% of all households. In contrast, only 1 households (0.5%) fall into the $200,000+ income bracket, making it the least populous group.
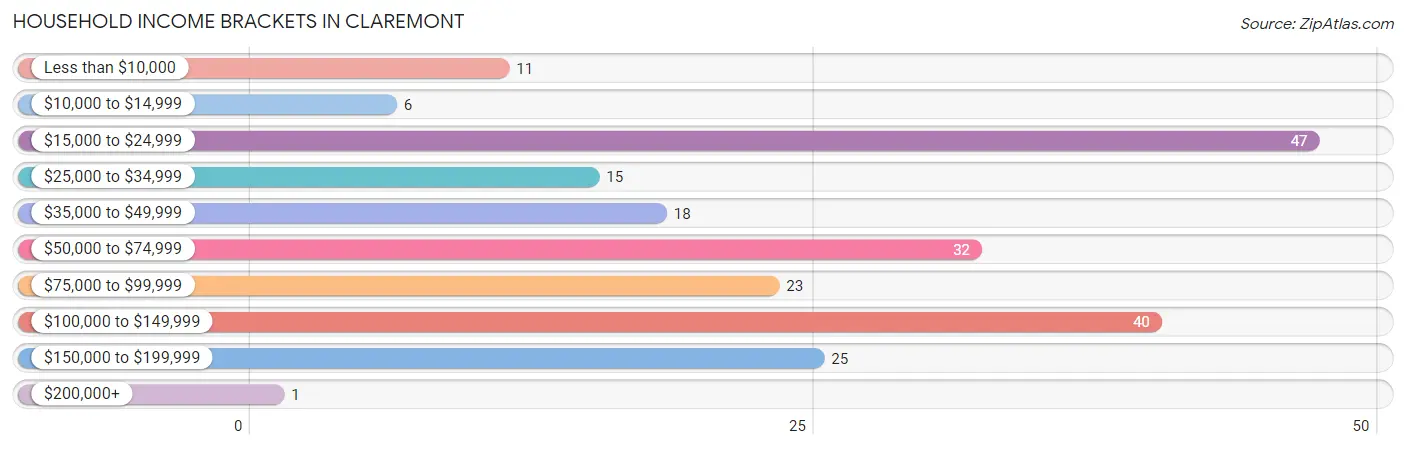
| Income Bracket | # Households | % Households |
| Less than $10,000 | 11 | 5.0% |
| $10,000 to $14,999 | 6 | 2.8% |
| $15,000 to $24,999 | 47 | 21.6% |
| $25,000 to $34,999 | 15 | 6.9% |
| $35,000 to $49,999 | 18 | 8.3% |
| $50,000 to $74,999 | 32 | 14.7% |
| $75,000 to $99,999 | 23 | 10.6% |
| $100,000 to $149,999 | 40 | 18.3% |
| $150,000 to $199,999 | 25 | 11.5% |
| $200,000+ | 1 | 0.5% |
Household Income by Householder Age in Claremont
The median household income in Claremont is $54,583, with the highest median household income of $101,029 found in the 25 to 44 years age bracket for the primary householder. A total of 24 households (11.0%) fall into this category. Meanwhile, the 15 to 24 years age bracket for the primary householder has the lowest median household income of $0, with 1 households (0.5%) in this group.
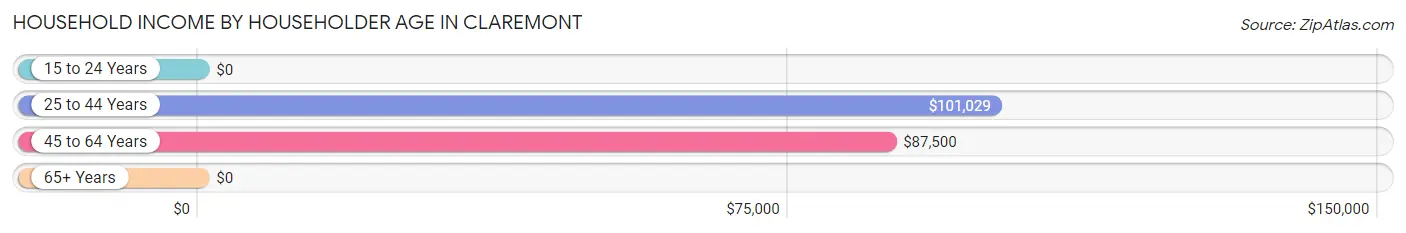
| Income Bracket | # Households | Median Income |
| 15 to 24 Years | 1 (0.5%) | $0 |
| 25 to 44 Years | 24 (11.0%) | $101,029 |
| 45 to 64 Years | 82 (37.6%) | $87,500 |
| 65+ Years | 111 (50.9%) | $0 |
| Total | 218 (100.0%) | $54,583 |
Poverty in Claremont
Income Below Poverty by Sex and Age in Claremont
With 9.1% poverty level for males and 13.6% for females among the residents of Claremont, 6 to 11 year old males and 35 to 44 year old females are the most vulnerable to poverty, with 10 males (71.4%) and 3 females (60.0%) in their respective age groups living below the poverty level.
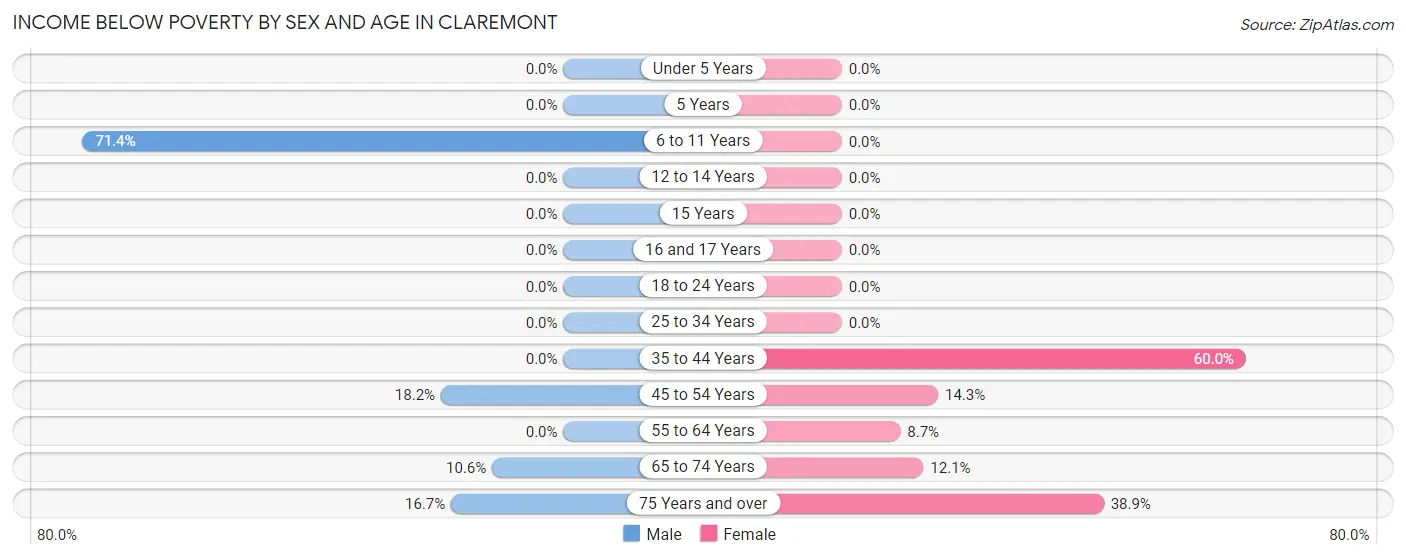
| Age Bracket | Male | Female |
| Under 5 Years | 0 (0.0%) | 0 (0.0%) |
| 5 Years | 0 (0.0%) | 0 (0.0%) |
| 6 to 11 Years | 10 (71.4%) | 0 (0.0%) |
| 12 to 14 Years | 0 (0.0%) | 0 (0.0%) |
| 15 Years | 0 (0.0%) | 0 (0.0%) |
| 16 and 17 Years | 0 (0.0%) | 0 (0.0%) |
| 18 to 24 Years | 0 (0.0%) | 0 (0.0%) |
| 25 to 34 Years | 0 (0.0%) | 0 (0.0%) |
| 35 to 44 Years | 0 (0.0%) | 3 (60.0%) |
| 45 to 54 Years | 2 (18.2%) | 3 (14.3%) |
| 55 to 64 Years | 0 (0.0%) | 6 (8.7%) |
| 65 to 74 Years | 9 (10.6%) | 4 (12.1%) |
| 75 Years and over | 2 (16.7%) | 7 (38.9%) |
| Total | 23 (9.1%) | 23 (13.6%) |
Income Above Poverty by Sex and Age in Claremont
According to the poverty statistics in Claremont, males aged 5 years and females aged under 5 years are the age groups that are most secure financially, with 100.0% of males and 100.0% of females in these age groups living above the poverty line.
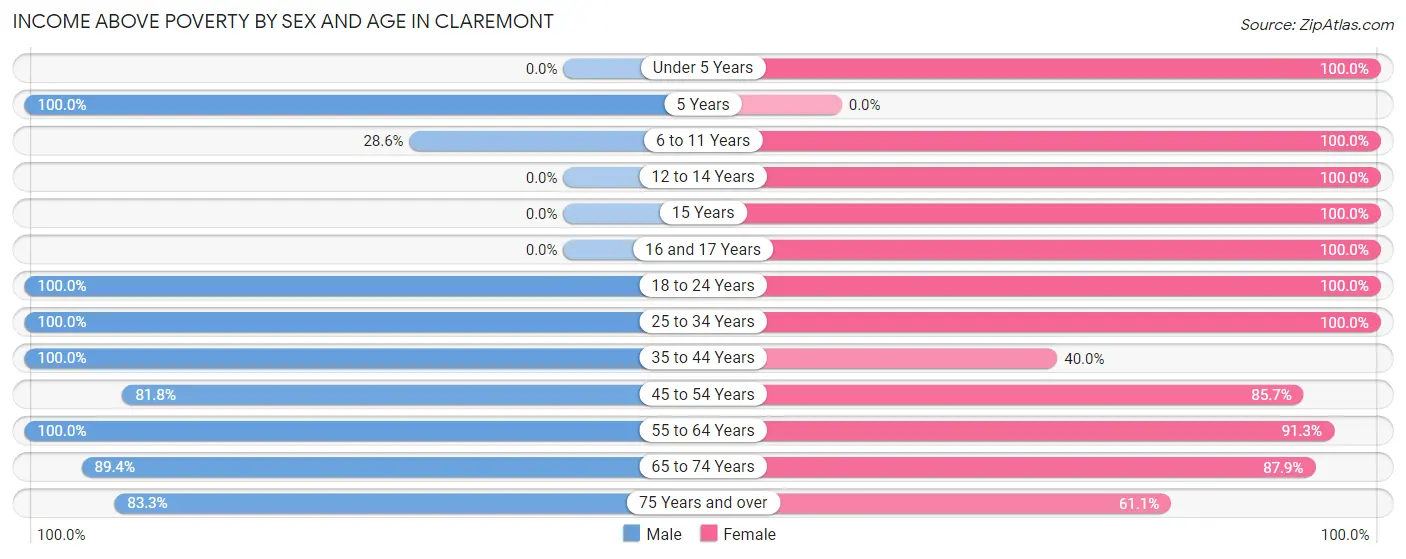
| Age Bracket | Male | Female |
| Under 5 Years | 0 (0.0%) | 2 (100.0%) |
| 5 Years | 2 (100.0%) | 0 (0.0%) |
| 6 to 11 Years | 4 (28.6%) | 2 (100.0%) |
| 12 to 14 Years | 0 (0.0%) | 2 (100.0%) |
| 15 Years | 0 (0.0%) | 2 (100.0%) |
| 16 and 17 Years | 0 (0.0%) | 4 (100.0%) |
| 18 to 24 Years | 12 (100.0%) | 2 (100.0%) |
| 25 to 34 Years | 24 (100.0%) | 9 (100.0%) |
| 35 to 44 Years | 27 (100.0%) | 2 (40.0%) |
| 45 to 54 Years | 9 (81.8%) | 18 (85.7%) |
| 55 to 64 Years | 65 (100.0%) | 63 (91.3%) |
| 65 to 74 Years | 76 (89.4%) | 29 (87.9%) |
| 75 Years and over | 10 (83.3%) | 11 (61.1%) |
| Total | 229 (90.9%) | 146 (86.4%) |
Income Below Poverty Among Married-Couple Families in Claremont
The poverty statistics for married-couple families in Claremont show that 2.8% or 3 of the total 108 families live below the poverty line. Families with no children have the highest poverty rate of 3.4%, comprising of 3 families. On the other hand, families with 1 or 2 children have the lowest poverty rate of 0.0%, which includes 0 families.
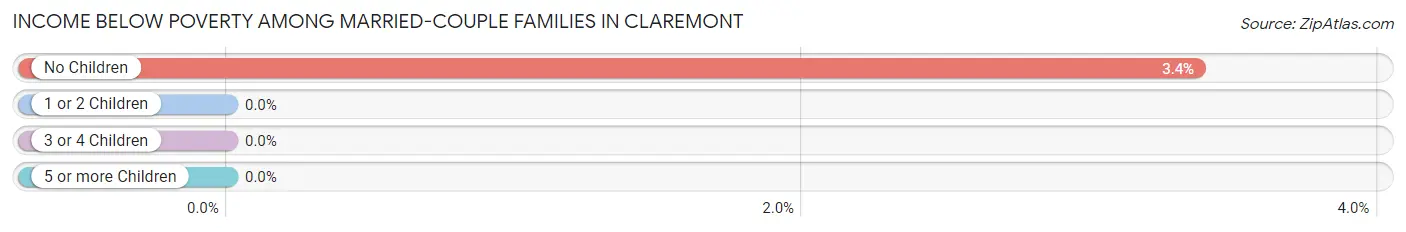
| Children | Above Poverty | Below Poverty |
| No Children | 86 (96.6%) | 3 (3.4%) |
| 1 or 2 Children | 18 (100.0%) | 0 (0.0%) |
| 3 or 4 Children | 1 (100.0%) | 0 (0.0%) |
| 5 or more Children | 0 (0.0%) | 0 (0.0%) |
| Total | 105 (97.2%) | 3 (2.8%) |
Income Below Poverty Among Single-Parent Households in Claremont
According to the poverty data in Claremont, 14.3% or 1 single-father households and 23.1% or 3 single-mother households are living below the poverty line. Among single-father households, those with no children have the highest poverty rate, with 1 households (33.3%) experiencing poverty. Likewise, among single-mother households, those with 1 or 2 children have the highest poverty rate, with 3 households (100.0%) falling below the poverty line.
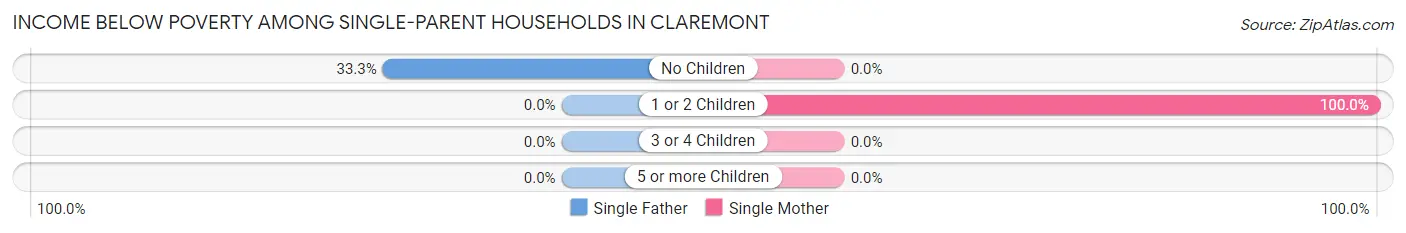
| Children | Single Father | Single Mother |
| No Children | 1 (33.3%) | 0 (0.0%) |
| 1 or 2 Children | 0 (0.0%) | 3 (100.0%) |
| 3 or 4 Children | 0 (0.0%) | 0 (0.0%) |
| 5 or more Children | 0 (0.0%) | 0 (0.0%) |
| Total | 1 (14.3%) | 3 (23.1%) |
Income Below Poverty Among Married-Couple vs Single-Parent Households in Claremont
The poverty data for Claremont shows that 3 of the married-couple family households (2.8%) and 4 of the single-parent households (20.0%) are living below the poverty level. Within the married-couple family households, those with no children have the highest poverty rate, with 3 households (3.4%) falling below the poverty line. Among the single-parent households, those with 1 or 2 children have the highest poverty rate, with 3 household (60.0%) living below poverty.
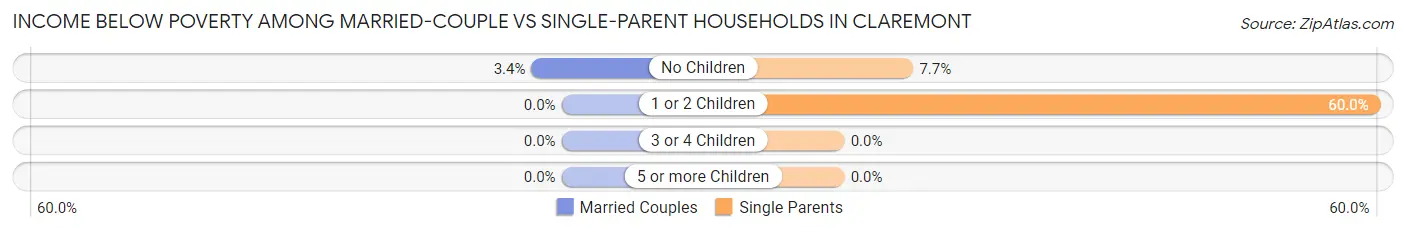
| Children | Married-Couple Families | Single-Parent Households |
| No Children | 3 (3.4%) | 1 (7.7%) |
| 1 or 2 Children | 0 (0.0%) | 3 (60.0%) |
| 3 or 4 Children | 0 (0.0%) | 0 (0.0%) |
| 5 or more Children | 0 (0.0%) | 0 (0.0%) |
| Total | 3 (2.8%) | 4 (20.0%) |
Race in Claremont
The most populous races in Claremont are White / Caucasian (343 | 81.5%), Black / African American (55 | 13.1%), and Hispanic or Latino (13 | 3.1%).
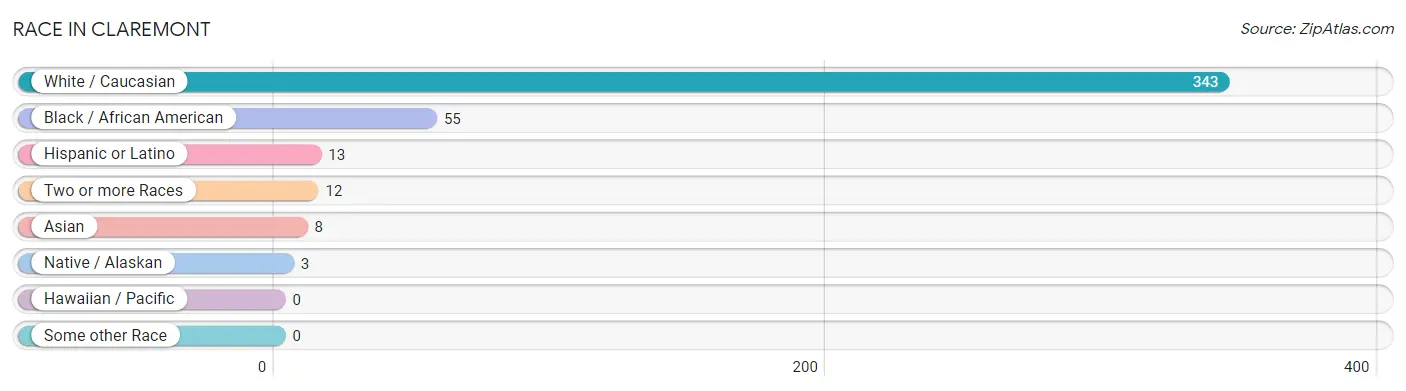
| Race | # Population | % Population |
| Asian | 8 | 1.9% |
| Black / African American | 55 | 13.1% |
| Hawaiian / Pacific | 0 | 0.0% |
| Hispanic or Latino | 13 | 3.1% |
| Native / Alaskan | 3 | 0.7% |
| White / Caucasian | 343 | 81.5% |
| Two or more Races | 12 | 2.9% |
| Some other Race | 0 | 0.0% |
| Total | 421 | 100.0% |
Ancestry in Claremont
The most populous ancestries reported in Claremont are English (135 | 32.1%), African (34 | 8.1%), Italian (34 | 8.1%), Subsaharan African (34 | 8.1%), and German (33 | 7.8%), together accounting for 64.1% of all Claremont residents.
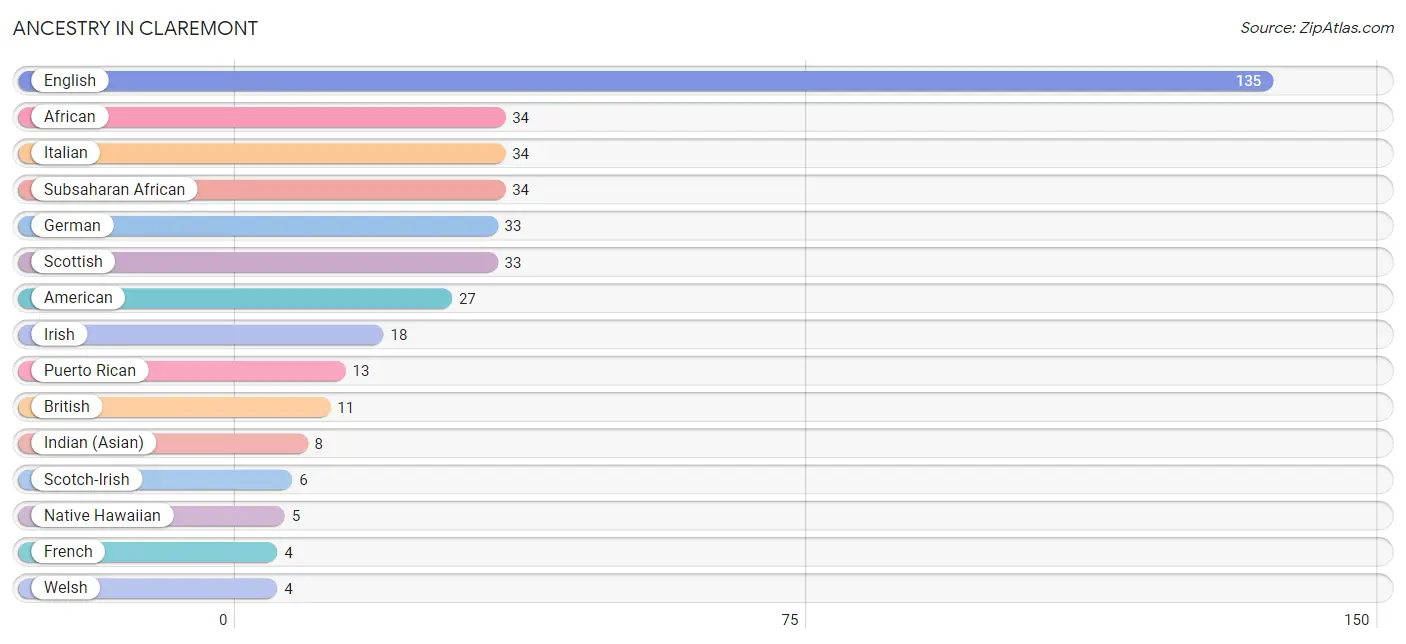
| Ancestry | # Population | % Population |
| African | 34 | 8.1% |
| American | 27 | 6.4% |
| British | 11 | 2.6% |
| Dutch | 1 | 0.2% |
| Eastern European | 2 | 0.5% |
| English | 135 | 32.1% |
| French | 4 | 0.9% |
| German | 33 | 7.8% |
| Indian (Asian) | 8 | 1.9% |
| Irish | 18 | 4.3% |
| Italian | 34 | 8.1% |
| Native Hawaiian | 5 | 1.2% |
| Puerto Rican | 13 | 3.1% |
| Scotch-Irish | 6 | 1.4% |
| Scottish | 33 | 7.8% |
| Subsaharan African | 34 | 8.1% |
| Welsh | 4 | 0.9% | View All 17 Rows |
Immigrants in Claremont
The most numerous immigrant groups reported in Claremont came from England (39 | 9.3%), Europe (39 | 9.3%), Northern Europe (39 | 9.3%), Asia (2 | 0.5%), and China (2 | 0.5%), together accounting for 28.7% of all Claremont residents.
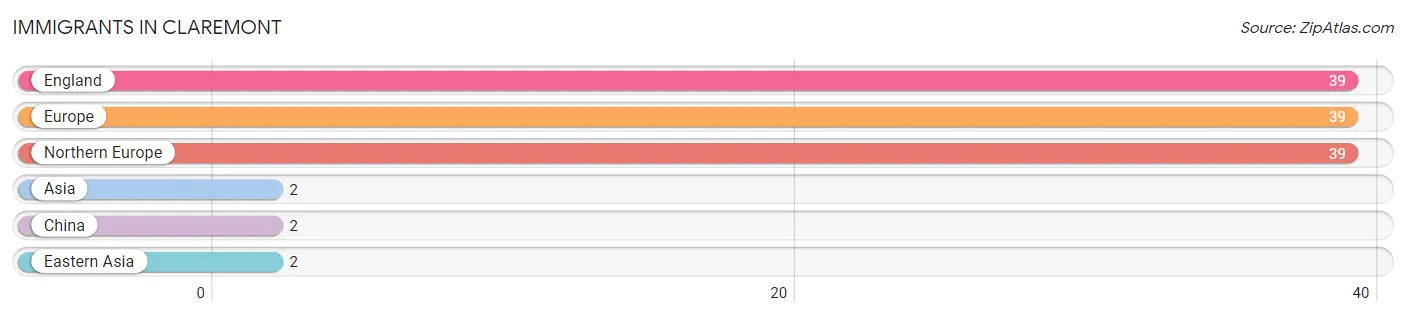
| Immigration Origin | # Population | % Population |
| Asia | 2 | 0.5% |
| China | 2 | 0.5% |
| Eastern Asia | 2 | 0.5% |
| England | 39 | 9.3% |
| Europe | 39 | 9.3% |
| Northern Europe | 39 | 9.3% | View All 6 Rows |
Sex and Age in Claremont
Sex and Age in Claremont
The most populous age groups in Claremont are 70 to 74 Years (49 | 19.4%) for men and 60 to 64 Years (50 | 29.6%) for women.
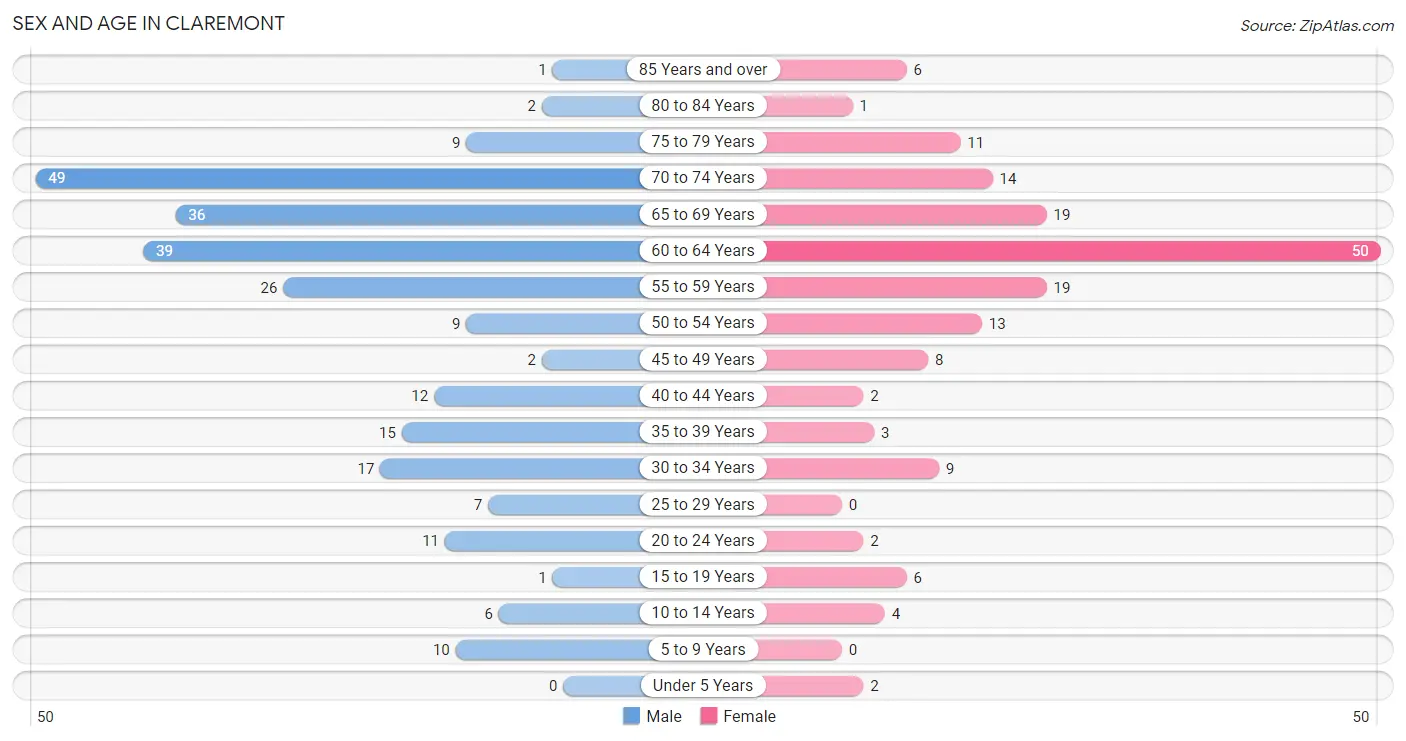
| Age Bracket | Male | Female |
| Under 5 Years | 0 (0.0%) | 2 (1.2%) |
| 5 to 9 Years | 10 (4.0%) | 0 (0.0%) |
| 10 to 14 Years | 6 (2.4%) | 4 (2.4%) |
| 15 to 19 Years | 1 (0.4%) | 6 (3.5%) |
| 20 to 24 Years | 11 (4.4%) | 2 (1.2%) |
| 25 to 29 Years | 7 (2.8%) | 0 (0.0%) |
| 30 to 34 Years | 17 (6.8%) | 9 (5.3%) |
| 35 to 39 Years | 15 (5.9%) | 3 (1.8%) |
| 40 to 44 Years | 12 (4.8%) | 2 (1.2%) |
| 45 to 49 Years | 2 (0.8%) | 8 (4.7%) |
| 50 to 54 Years | 9 (3.6%) | 13 (7.7%) |
| 55 to 59 Years | 26 (10.3%) | 19 (11.2%) |
| 60 to 64 Years | 39 (15.5%) | 50 (29.6%) |
| 65 to 69 Years | 36 (14.3%) | 19 (11.2%) |
| 70 to 74 Years | 49 (19.4%) | 14 (8.3%) |
| 75 to 79 Years | 9 (3.6%) | 11 (6.5%) |
| 80 to 84 Years | 2 (0.8%) | 1 (0.6%) |
| 85 Years and over | 1 (0.4%) | 6 (3.5%) |
| Total | 252 (100.0%) | 169 (100.0%) |
Families and Households in Claremont
Median Family Size in Claremont
The median family size in Claremont is 2.46 persons per family, with single female/mother families (13 | 10.2%) accounting for the largest median family size of 3.69 persons per family. On the other hand, married-couple families (108 | 84.4%) represent the smallest median family size with 2.28 persons per family.
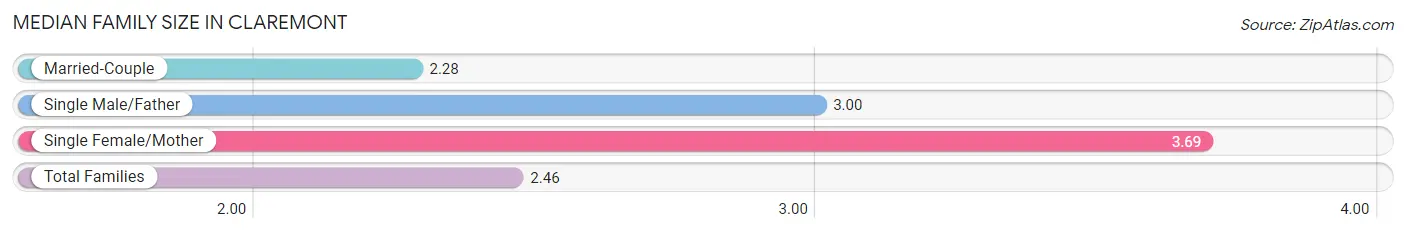
| Family Type | # Families | Family Size |
| Married-Couple | 108 (84.4%) | 2.28 |
| Single Male/Father | 7 (5.5%) | 3.00 |
| Single Female/Mother | 13 (10.2%) | 3.69 |
| Total Families | 128 (100.0%) | 2.46 |
Median Household Size in Claremont
The median household size in Claremont is 1.93 persons per household, with single female/mother households (13 | 6.0%) accounting for the largest median household size of 4.15 persons per household. non-family households (90 | 41.3%) represent the smallest median household size with 1.11 persons per household.
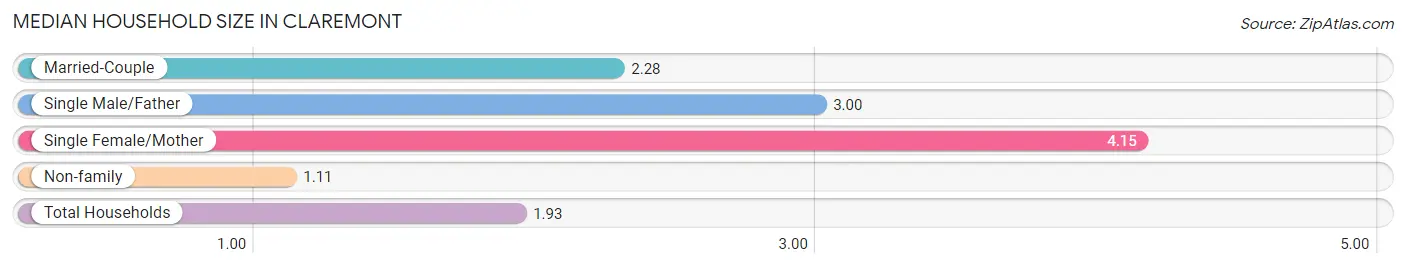
| Household Type | # Households | Household Size |
| Married-Couple | 108 (49.5%) | 2.28 |
| Single Male/Father | 7 (3.2%) | 3.00 |
| Single Female/Mother | 13 (6.0%) | 4.15 |
| Non-family | 90 (41.3%) | 1.11 |
| Total Households | 218 (100.0%) | 1.93 |
Household Size by Marriage Status in Claremont
Out of a total of 218 households in Claremont, 128 (58.7%) are family households, while 90 (41.3%) are nonfamily households. The most numerous type of family households are 2-person households, comprising 80, and the most common type of nonfamily households are 1-person households, comprising 84.
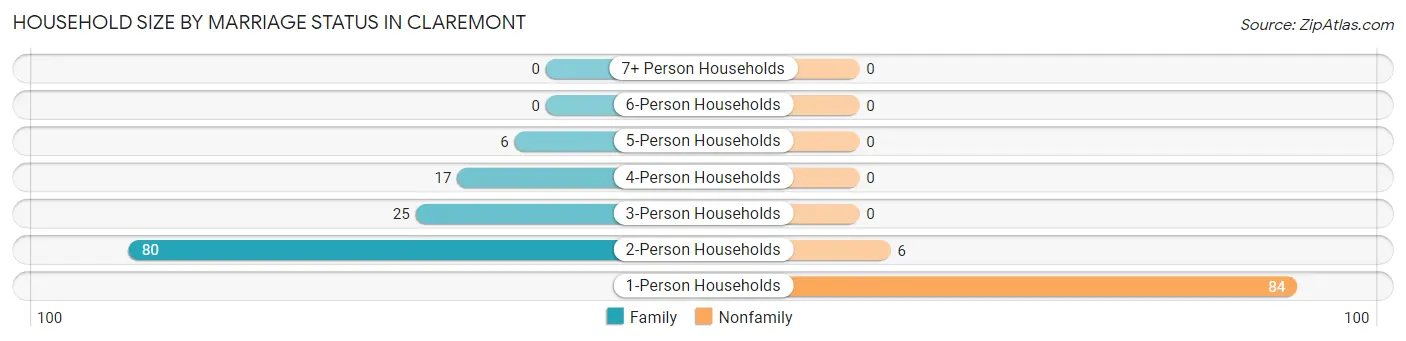
| Household Size | Family Households | Nonfamily Households |
| 1-Person Households | - | 84 (38.5%) |
| 2-Person Households | 80 (36.7%) | 6 (2.8%) |
| 3-Person Households | 25 (11.5%) | 0 (0.0%) |
| 4-Person Households | 17 (7.8%) | 0 (0.0%) |
| 5-Person Households | 6 (2.8%) | 0 (0.0%) |
| 6-Person Households | 0 (0.0%) | 0 (0.0%) |
| 7+ Person Households | 0 (0.0%) | 0 (0.0%) |
| Total | 128 (58.7%) | 90 (41.3%) |
Female Fertility in Claremont
Fertility by Age in Claremont
Average fertility rate in Claremont is 233.0 births per 1,000 women. Women in the age bracket of 20 to 34 years have the highest fertility rate with 636.0 births per 1,000 women. Women in the age bracket of 20 to 34 years acount for 100.0% of all women with births.
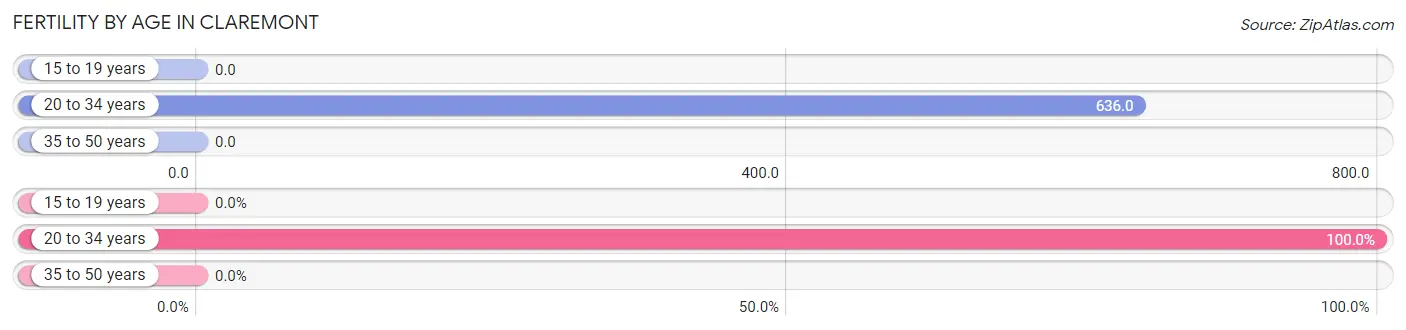
| Age Bracket | Women with Births | Births / 1,000 Women |
| 15 to 19 years | 0 (0.0%) | 0.0 |
| 20 to 34 years | 7 (100.0%) | 636.0 |
| 35 to 50 years | 0 (0.0%) | 0.0 |
| Total | 7 (100.0%) | 233.0 |
Fertility by Age by Marriage Status in Claremont
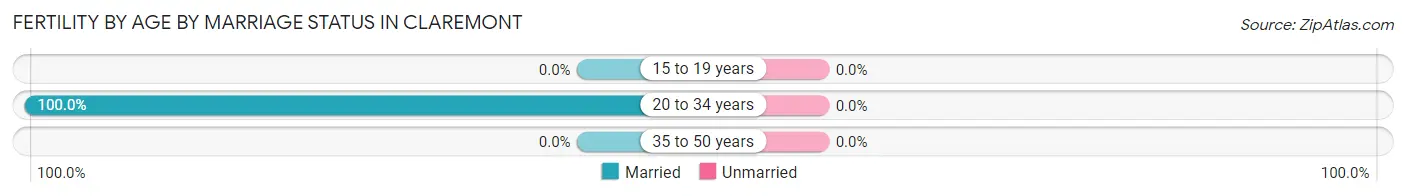
| Age Bracket | Married | Unmarried |
| 15 to 19 years | 0 (0.0%) | 0 (0.0%) |
| 20 to 34 years | 7 (100.0%) | 0 (0.0%) |
| 35 to 50 years | 0 (0.0%) | 0 (0.0%) |
| Total | 7 (100.0%) | 0 (0.0%) |
Fertility by Education in Claremont
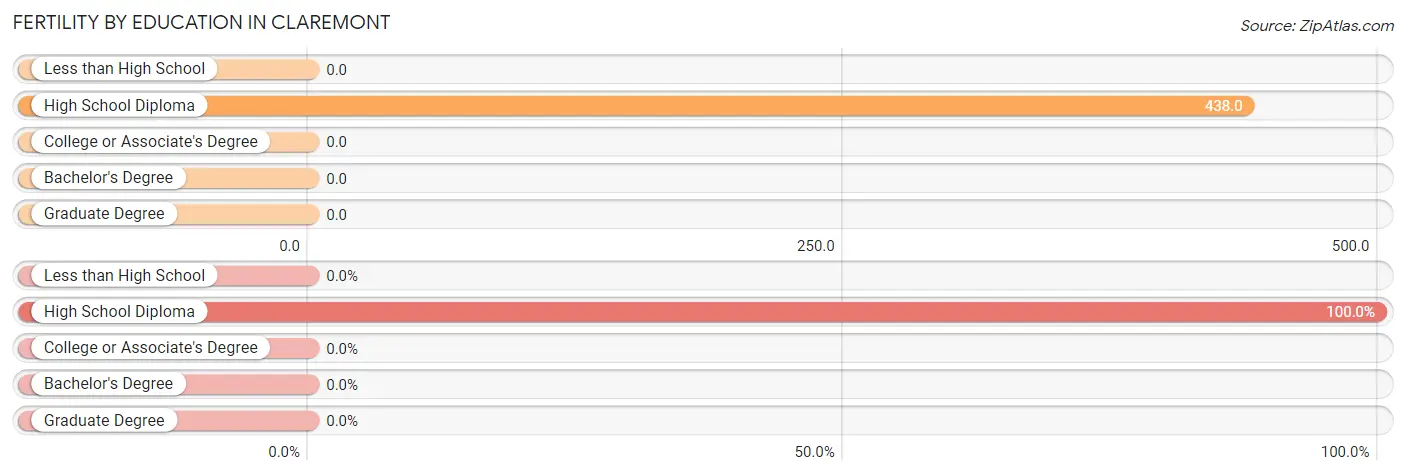
| Educational Attainment | Women with Births | Births / 1,000 Women |
| Less than High School | 0 (0.0%) | 0.0 |
| High School Diploma | 7 (100.0%) | 438.0 |
| College or Associate's Degree | 0 (0.0%) | 0.0 |
| Bachelor's Degree | 0 (0.0%) | 0.0 |
| Graduate Degree | 0 (0.0%) | 0.0 |
| Total | 7 (100.0%) | 233.0 |
Fertility by Education by Marriage Status in Claremont
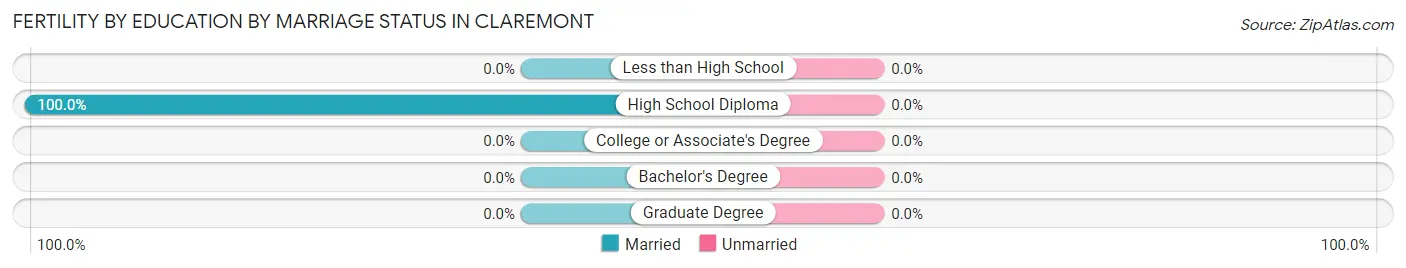
| Educational Attainment | Married | Unmarried |
| Less than High School | 0 (0.0%) | 0 (0.0%) |
| High School Diploma | 7 (100.0%) | 0 (0.0%) |
| College or Associate's Degree | 0 (0.0%) | 0 (0.0%) |
| Bachelor's Degree | 0 (0.0%) | 0 (0.0%) |
| Graduate Degree | 0 (0.0%) | 0 (0.0%) |
| Total | 7 (100.0%) | 0 (0.0%) |
Employment Characteristics in Claremont
Employment by Class of Employer in Claremont
Among the 182 employed individuals in Claremont, private company employees (84 | 46.2%), local government employees (64 | 35.2%), and not-for-profit organizations (12 | 6.6%) make up the most common classes of employment.
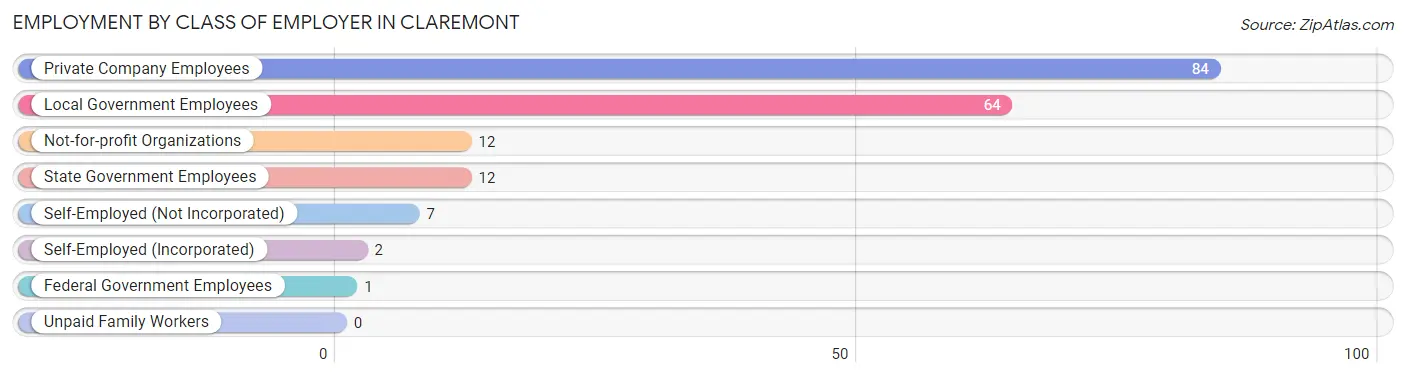
| Employer Class | # Employees | % Employees |
| Private Company Employees | 84 | 46.2% |
| Self-Employed (Incorporated) | 2 | 1.1% |
| Self-Employed (Not Incorporated) | 7 | 3.8% |
| Not-for-profit Organizations | 12 | 6.6% |
| Local Government Employees | 64 | 35.2% |
| State Government Employees | 12 | 6.6% |
| Federal Government Employees | 1 | 0.5% |
| Unpaid Family Workers | 0 | 0.0% |
| Total | 182 | 100.0% |
Employment Status by Age in Claremont
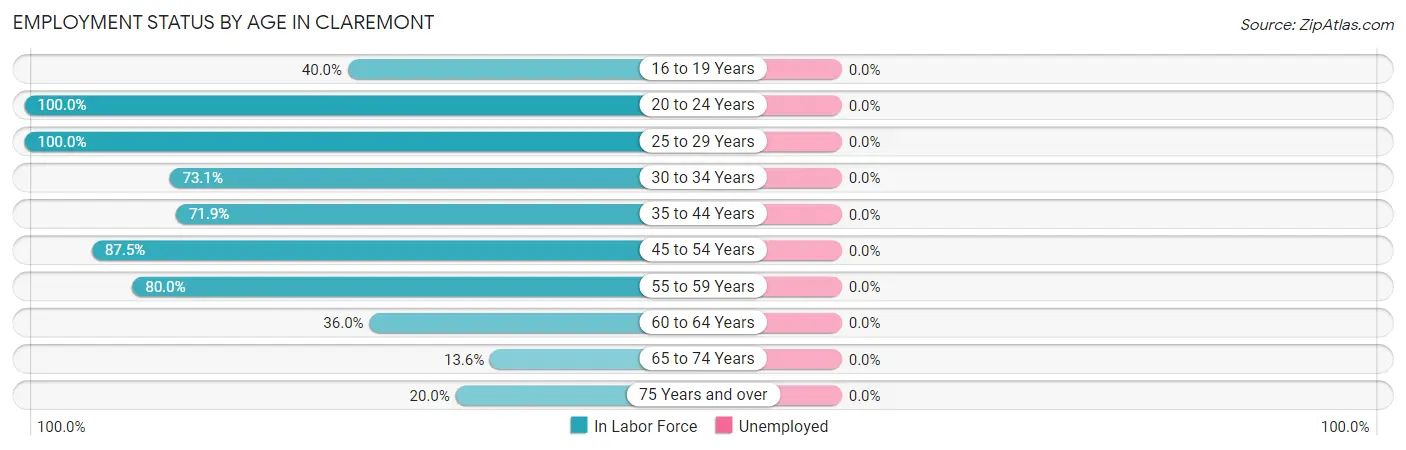
| Age Bracket | In Labor Force | Unemployed |
| 16 to 19 Years | 2 (40.0%) | 0 (0.0%) |
| 20 to 24 Years | 13 (100.0%) | 0 (0.0%) |
| 25 to 29 Years | 7 (100.0%) | 0 (0.0%) |
| 30 to 34 Years | 19 (73.1%) | 0 (0.0%) |
| 35 to 44 Years | 23 (71.9%) | 0 (0.0%) |
| 45 to 54 Years | 28 (87.5%) | 0 (0.0%) |
| 55 to 59 Years | 36 (80.0%) | 0 (0.0%) |
| 60 to 64 Years | 32 (36.0%) | 0 (0.0%) |
| 65 to 74 Years | 16 (13.6%) | 0 (0.0%) |
| 75 Years and over | 6 (20.0%) | 0 (0.0%) |
| Total | 182 (45.8%) | 0 (0.0%) |
Employment Status by Educational Attainment in Claremont
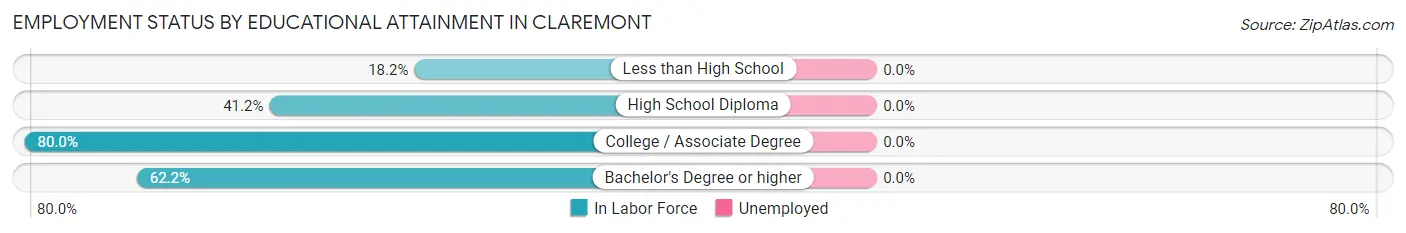
| Educational Attainment | In Labor Force | Unemployed |
| Less than High School | 2 (18.2%) | 0 (0.0%) |
| High School Diploma | 21 (41.2%) | 0 (0.0%) |
| College / Associate Degree | 76 (80.0%) | 0 (0.0%) |
| Bachelor's Degree or higher | 46 (62.2%) | 0 (0.0%) |
| Total | 145 (62.8%) | 0 (0.0%) |
Employment Occupations by Sex in Claremont
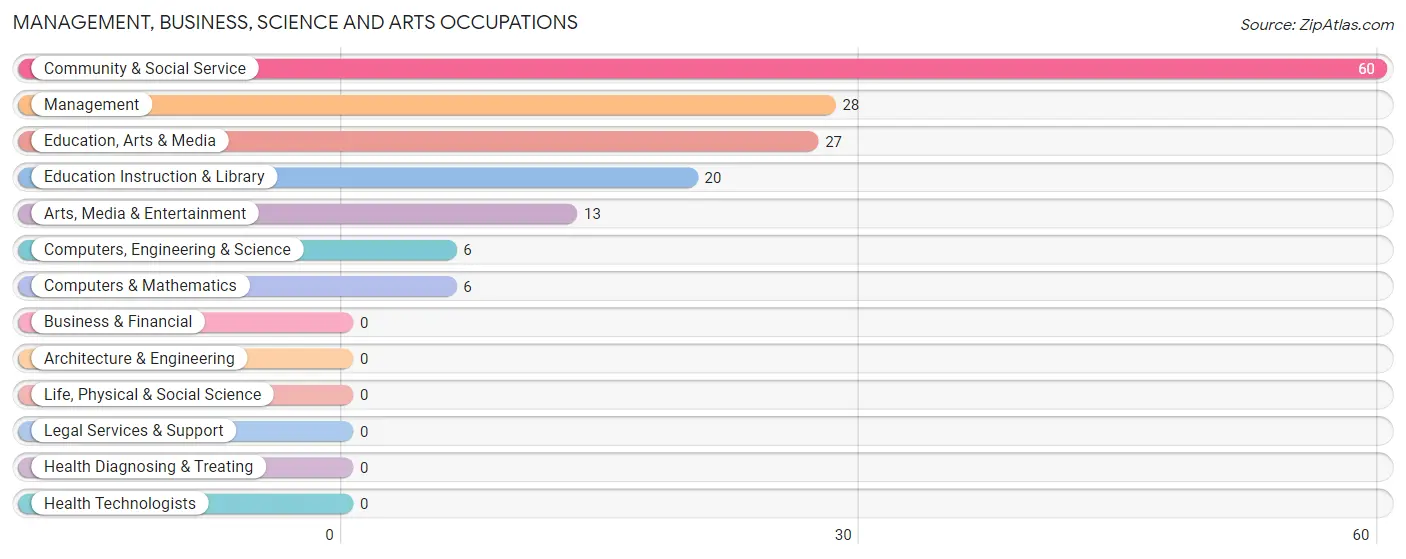
Management, Business, Science and Arts Occupations
The most common Management, Business, Science and Arts occupations in Claremont are Community & Social Service (60 | 33.0%), Management (28 | 15.4%), Education, Arts & Media (27 | 14.8%), Education Instruction & Library (20 | 11.0%), and Arts, Media & Entertainment (13 | 7.1%).
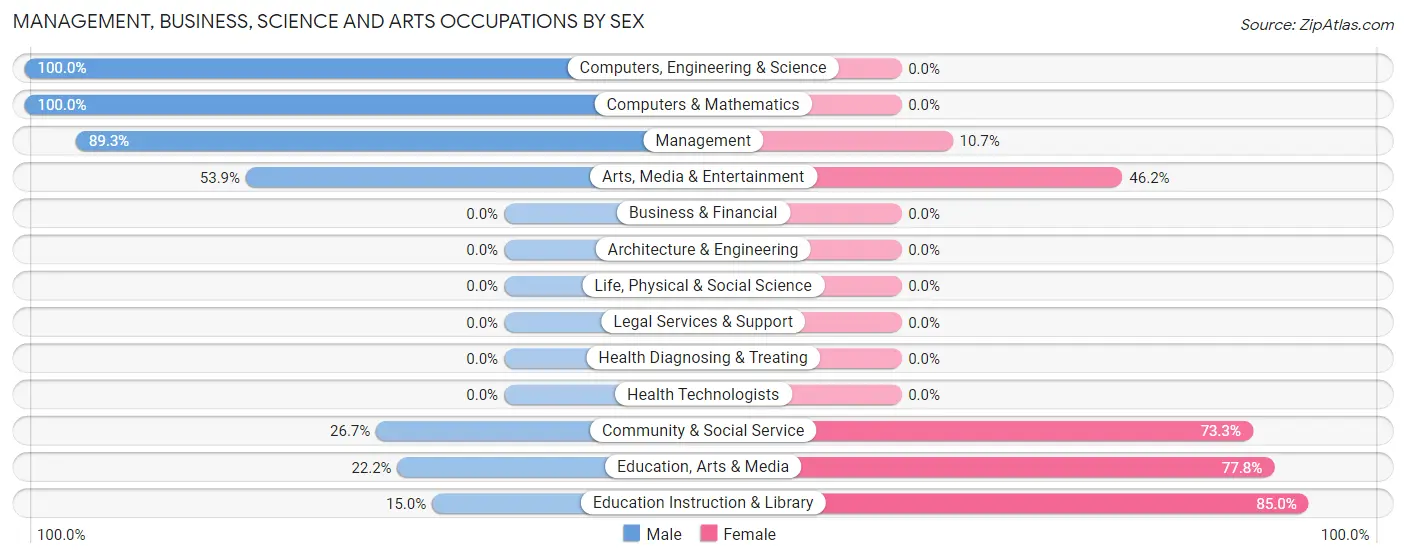
Management, Business, Science and Arts Occupations by Sex
Within the Management, Business, Science and Arts occupations in Claremont, the most male-oriented occupations are Computers, Engineering & Science (100.0%), Computers & Mathematics (100.0%), and Management (89.3%), while the most female-oriented occupations are Education Instruction & Library (85.0%), Education, Arts & Media (77.8%), and Community & Social Service (73.3%).
| Occupation | Male | Female |
| Management | 25 (89.3%) | 3 (10.7%) |
| Business & Financial | 0 (0.0%) | 0 (0.0%) |
| Computers, Engineering & Science | 6 (100.0%) | 0 (0.0%) |
| Computers & Mathematics | 6 (100.0%) | 0 (0.0%) |
| Architecture & Engineering | 0 (0.0%) | 0 (0.0%) |
| Life, Physical & Social Science | 0 (0.0%) | 0 (0.0%) |
| Community & Social Service | 16 (26.7%) | 44 (73.3%) |
| Education, Arts & Media | 6 (22.2%) | 21 (77.8%) |
| Legal Services & Support | 0 (0.0%) | 0 (0.0%) |
| Education Instruction & Library | 3 (15.0%) | 17 (85.0%) |
| Arts, Media & Entertainment | 7 (53.8%) | 6 (46.2%) |
| Health Diagnosing & Treating | 0 (0.0%) | 0 (0.0%) |
| Health Technologists | 0 (0.0%) | 0 (0.0%) |
| Total (Category) | 47 (50.0%) | 47 (50.0%) |
| Total (Overall) | 107 (58.8%) | 75 (41.2%) |
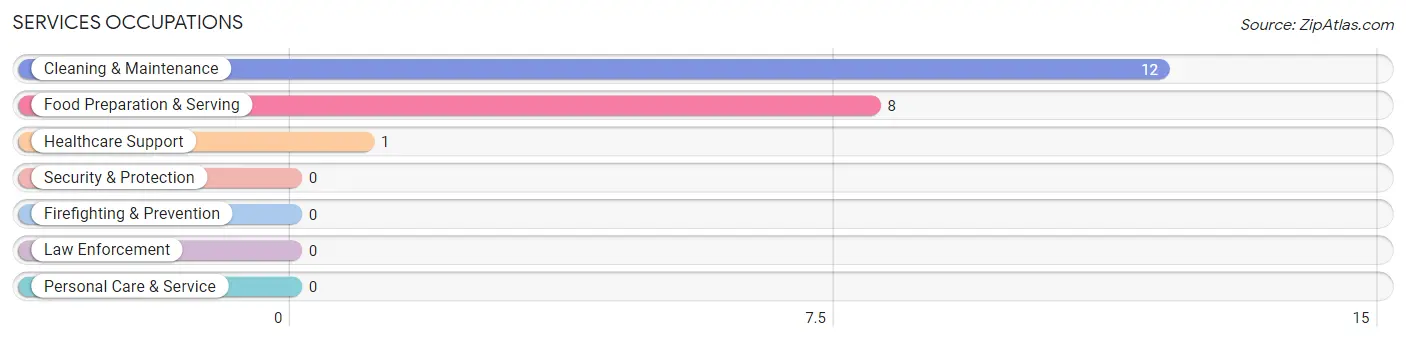
Services Occupations
The most common Services occupations in Claremont are Cleaning & Maintenance (12 | 6.6%), Food Preparation & Serving (8 | 4.4%), and Healthcare Support (1 | 0.5%).
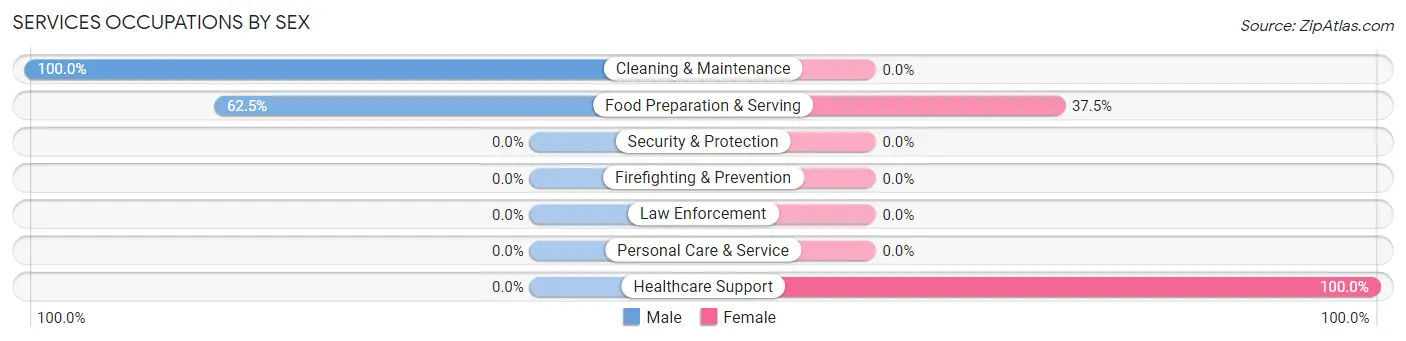
Services Occupations by Sex
Within the Services occupations in Claremont, the most male-oriented occupations are Cleaning & Maintenance (100.0%), and Food Preparation & Serving (62.5%), while the most female-oriented occupations are Healthcare Support (100.0%), and Food Preparation & Serving (37.5%).
| Occupation | Male | Female |
| Healthcare Support | 0 (0.0%) | 1 (100.0%) |
| Security & Protection | 0 (0.0%) | 0 (0.0%) |
| Firefighting & Prevention | 0 (0.0%) | 0 (0.0%) |
| Law Enforcement | 0 (0.0%) | 0 (0.0%) |
| Food Preparation & Serving | 5 (62.5%) | 3 (37.5%) |
| Cleaning & Maintenance | 12 (100.0%) | 0 (0.0%) |
| Personal Care & Service | 0 (0.0%) | 0 (0.0%) |
| Total (Category) | 17 (80.9%) | 4 (19.1%) |
| Total (Overall) | 107 (58.8%) | 75 (41.2%) |
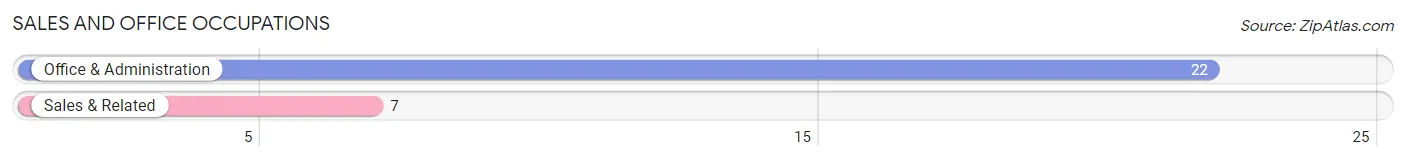
Sales and Office Occupations
The most common Sales and Office occupations in Claremont are Office & Administration (22 | 12.1%), and Sales & Related (7 | 3.8%).
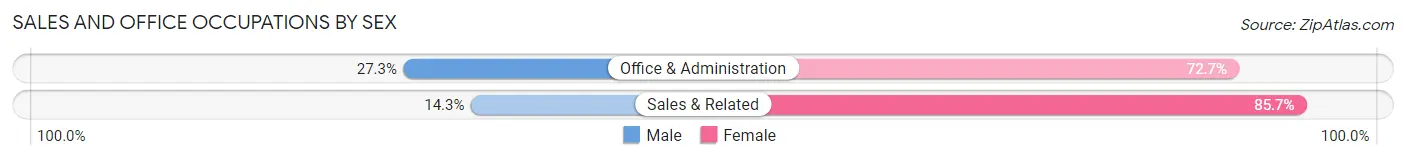
Sales and Office Occupations by Sex
| Occupation | Male | Female |
| Sales & Related | 1 (14.3%) | 6 (85.7%) |
| Office & Administration | 6 (27.3%) | 16 (72.7%) |
| Total (Category) | 7 (24.1%) | 22 (75.9%) |
| Total (Overall) | 107 (58.8%) | 75 (41.2%) |
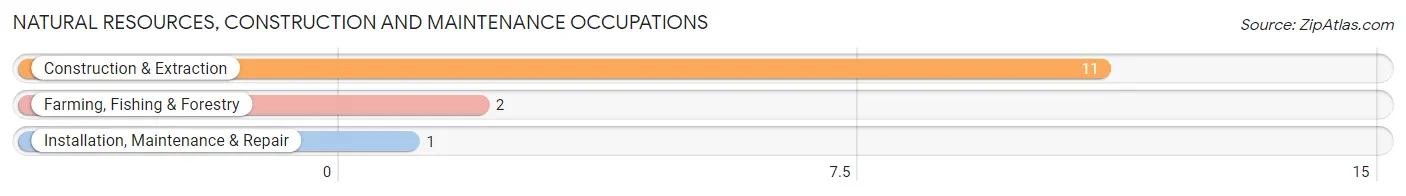
Natural Resources, Construction and Maintenance Occupations
The most common Natural Resources, Construction and Maintenance occupations in Claremont are Construction & Extraction (11 | 6.0%), Farming, Fishing & Forestry (2 | 1.1%), and Installation, Maintenance & Repair (1 | 0.5%).
Natural Resources, Construction and Maintenance Occupations by Sex

| Occupation | Male | Female |
| Farming, Fishing & Forestry | 2 (100.0%) | 0 (0.0%) |
| Construction & Extraction | 11 (100.0%) | 0 (0.0%) |
| Installation, Maintenance & Repair | 1 (100.0%) | 0 (0.0%) |
| Total (Category) | 14 (100.0%) | 0 (0.0%) |
| Total (Overall) | 107 (58.8%) | 75 (41.2%) |
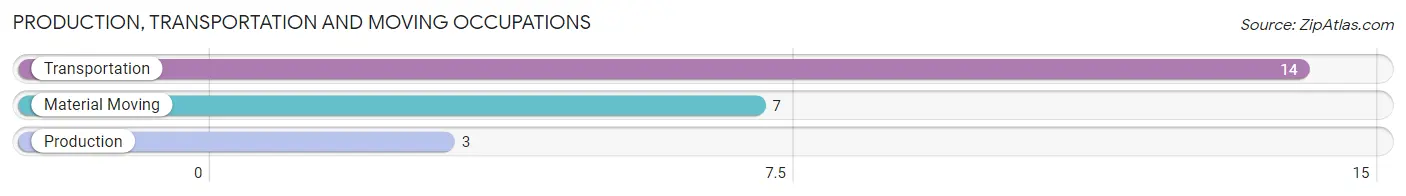
Production, Transportation and Moving Occupations
The most common Production, Transportation and Moving occupations in Claremont are Transportation (14 | 7.7%), Material Moving (7 | 3.8%), and Production (3 | 1.7%).
Production, Transportation and Moving Occupations by Sex
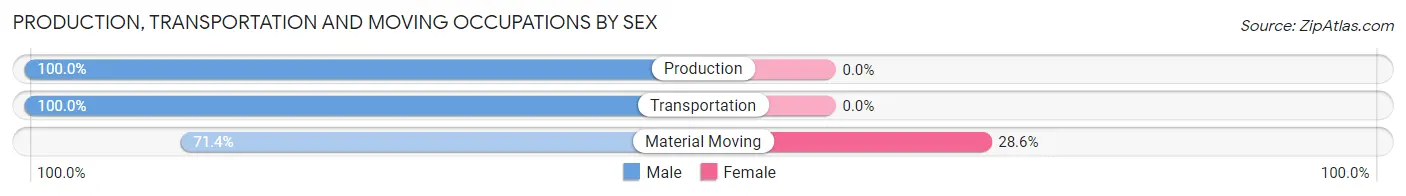
| Occupation | Male | Female |
| Production | 3 (100.0%) | 0 (0.0%) |
| Transportation | 14 (100.0%) | 0 (0.0%) |
| Material Moving | 5 (71.4%) | 2 (28.6%) |
| Total (Category) | 22 (91.7%) | 2 (8.3%) |
| Total (Overall) | 107 (58.8%) | 75 (41.2%) |
Employment Industries by Sex in Claremont
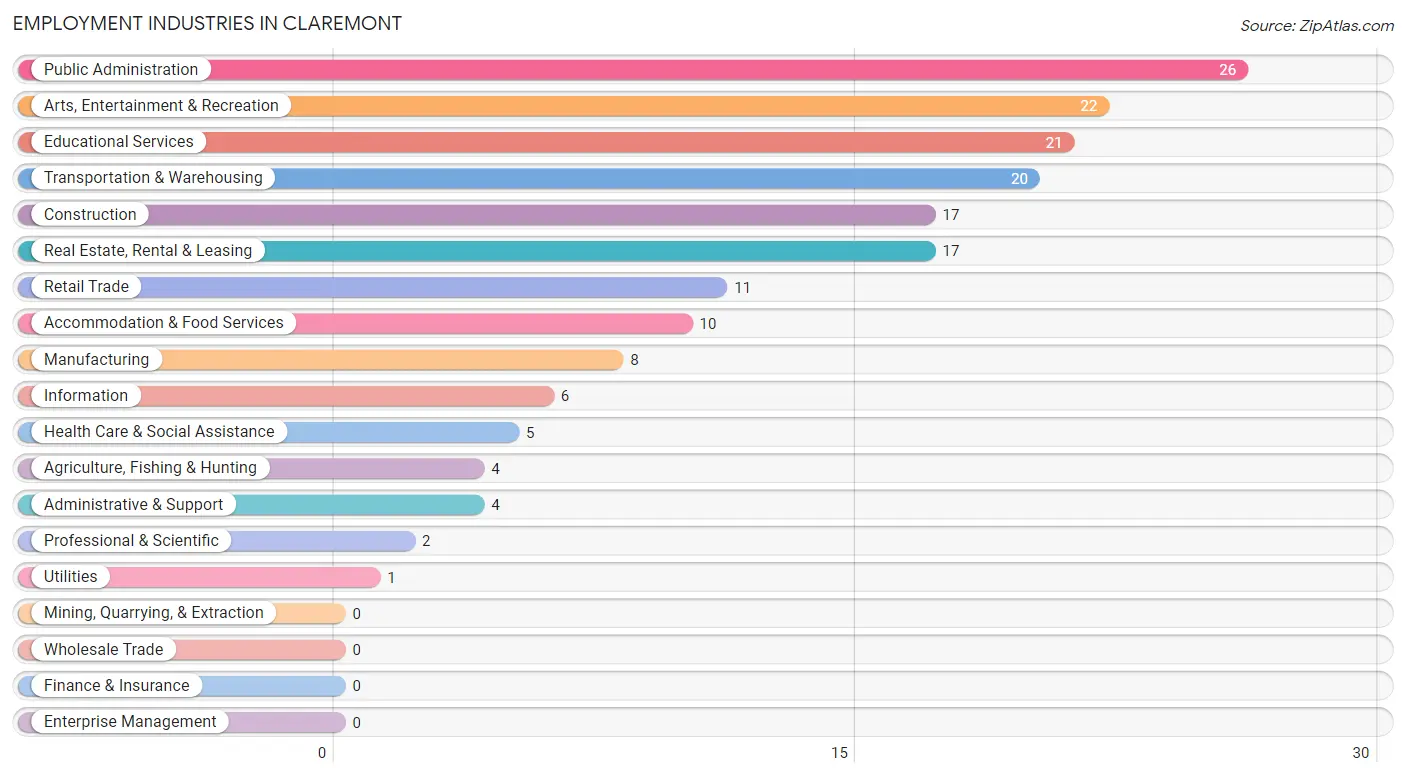
Employment Industries in Claremont
The major employment industries in Claremont include Public Administration (26 | 14.3%), Arts, Entertainment & Recreation (22 | 12.1%), Educational Services (21 | 11.5%), Transportation & Warehousing (20 | 11.0%), and Construction (17 | 9.3%).
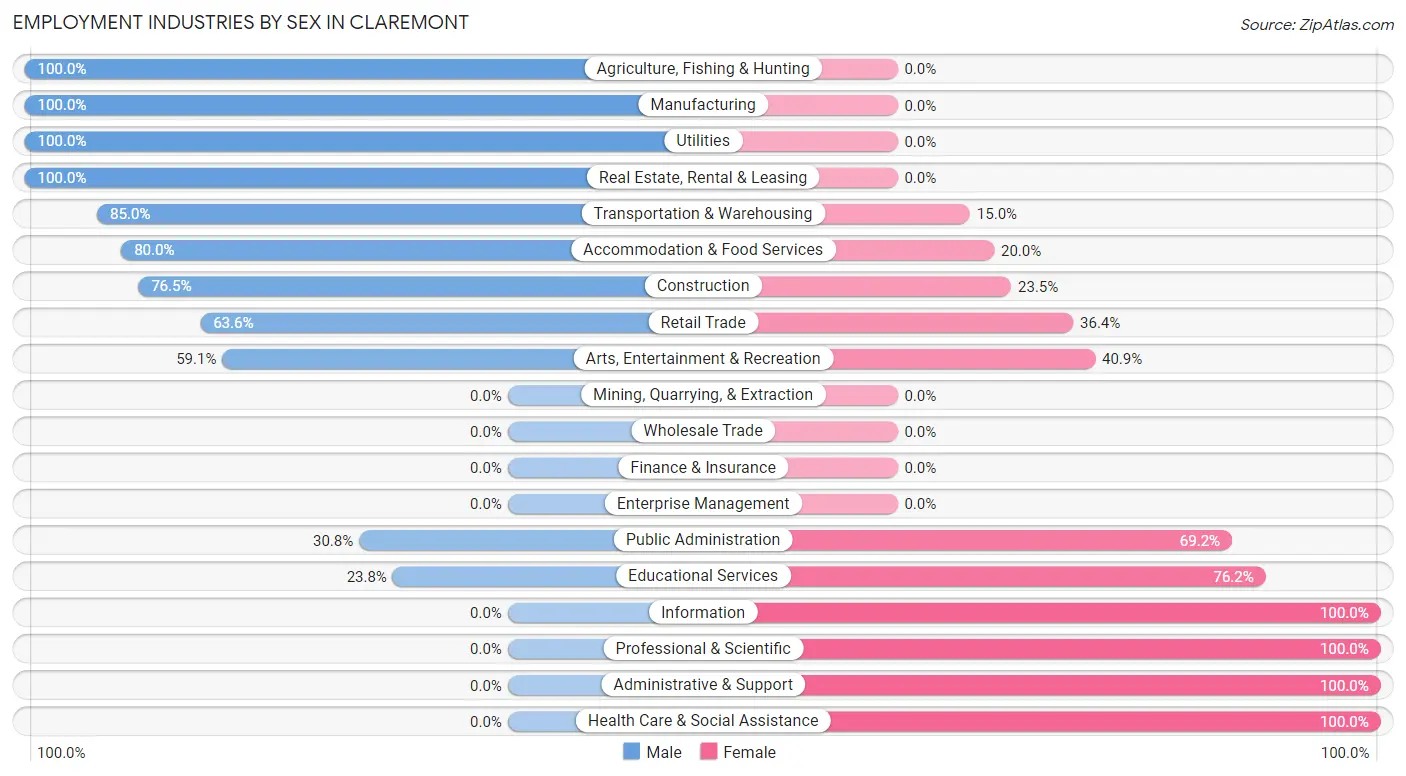
Employment Industries by Sex in Claremont
The Claremont industries that see more men than women are Agriculture, Fishing & Hunting (100.0%), Manufacturing (100.0%), and Utilities (100.0%), whereas the industries that tend to have a higher number of women are Information (100.0%), Professional & Scientific (100.0%), and Administrative & Support (100.0%).
| Industry | Male | Female |
| Agriculture, Fishing & Hunting | 4 (100.0%) | 0 (0.0%) |
| Mining, Quarrying, & Extraction | 0 (0.0%) | 0 (0.0%) |
| Construction | 13 (76.5%) | 4 (23.5%) |
| Manufacturing | 8 (100.0%) | 0 (0.0%) |
| Wholesale Trade | 0 (0.0%) | 0 (0.0%) |
| Retail Trade | 7 (63.6%) | 4 (36.4%) |
| Transportation & Warehousing | 17 (85.0%) | 3 (15.0%) |
| Utilities | 1 (100.0%) | 0 (0.0%) |
| Information | 0 (0.0%) | 6 (100.0%) |
| Finance & Insurance | 0 (0.0%) | 0 (0.0%) |
| Real Estate, Rental & Leasing | 17 (100.0%) | 0 (0.0%) |
| Professional & Scientific | 0 (0.0%) | 2 (100.0%) |
| Enterprise Management | 0 (0.0%) | 0 (0.0%) |
| Administrative & Support | 0 (0.0%) | 4 (100.0%) |
| Educational Services | 5 (23.8%) | 16 (76.2%) |
| Health Care & Social Assistance | 0 (0.0%) | 5 (100.0%) |
| Arts, Entertainment & Recreation | 13 (59.1%) | 9 (40.9%) |
| Accommodation & Food Services | 8 (80.0%) | 2 (20.0%) |
| Public Administration | 8 (30.8%) | 18 (69.2%) |
| Total | 107 (58.8%) | 75 (41.2%) |
Education in Claremont
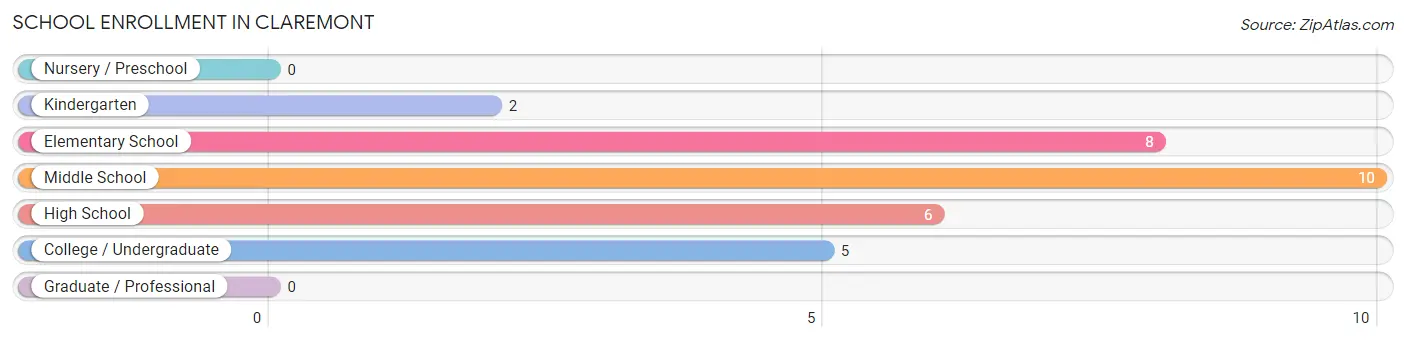
School Enrollment in Claremont
The most common levels of schooling among the 31 students in Claremont are middle school (10 | 32.3%), elementary school (8 | 25.8%), and high school (6 | 19.4%).
| School Level | # Students | % Students |
| Nursery / Preschool | 0 | 0.0% |
| Kindergarten | 2 | 6.5% |
| Elementary School | 8 | 25.8% |
| Middle School | 10 | 32.3% |
| High School | 6 | 19.4% |
| College / Undergraduate | 5 | 16.1% |
| Graduate / Professional | 0 | 0.0% |
| Total | 31 | 100.0% |
School Enrollment by Age by Funding Source in Claremont
Out of a total of 31 students who are enrolled in schools in Claremont, 7 (22.6%) attend a private institution, while the remaining 24 (77.4%) are enrolled in public schools. The age group of 35 years and over has the highest likelihood of being enrolled in private schools, with 1 (100.0% in the age bracket) enrolled. Conversely, the age group of 15 to 17 year olds has the lowest likelihood of being enrolled in a private school, with 6 (100.0% in the age bracket) attending a public institution.
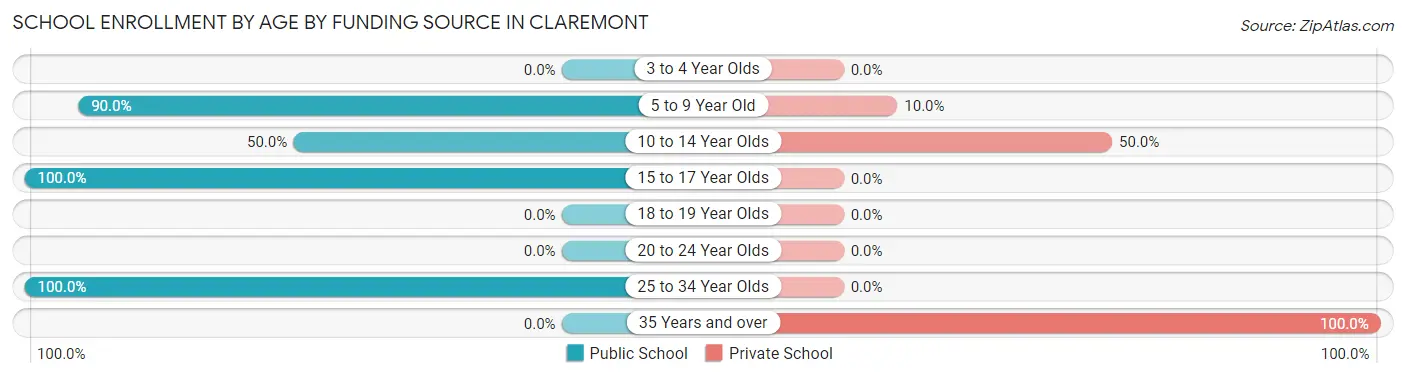
| Age Bracket | Public School | Private School |
| 3 to 4 Year Olds | 0 (0.0%) | 0 (0.0%) |
| 5 to 9 Year Old | 9 (90.0%) | 1 (10.0%) |
| 10 to 14 Year Olds | 5 (50.0%) | 5 (50.0%) |
| 15 to 17 Year Olds | 6 (100.0%) | 0 (0.0%) |
| 18 to 19 Year Olds | 0 (0.0%) | 0 (0.0%) |
| 20 to 24 Year Olds | 0 (0.0%) | 0 (0.0%) |
| 25 to 34 Year Olds | 4 (100.0%) | 0 (0.0%) |
| 35 Years and over | 0 (0.0%) | 1 (100.0%) |
| Total | 24 (77.4%) | 7 (22.6%) |
Educational Attainment by Field of Study in Claremont
Arts & humanities (19 | 19.8%), education (18 | 18.8%), liberal arts & history (16 | 16.7%), computers & mathematics (13 | 13.5%), and literature & languages (10 | 10.4%) are the most common fields of study among 96 individuals in Claremont who have obtained a bachelor's degree or higher.
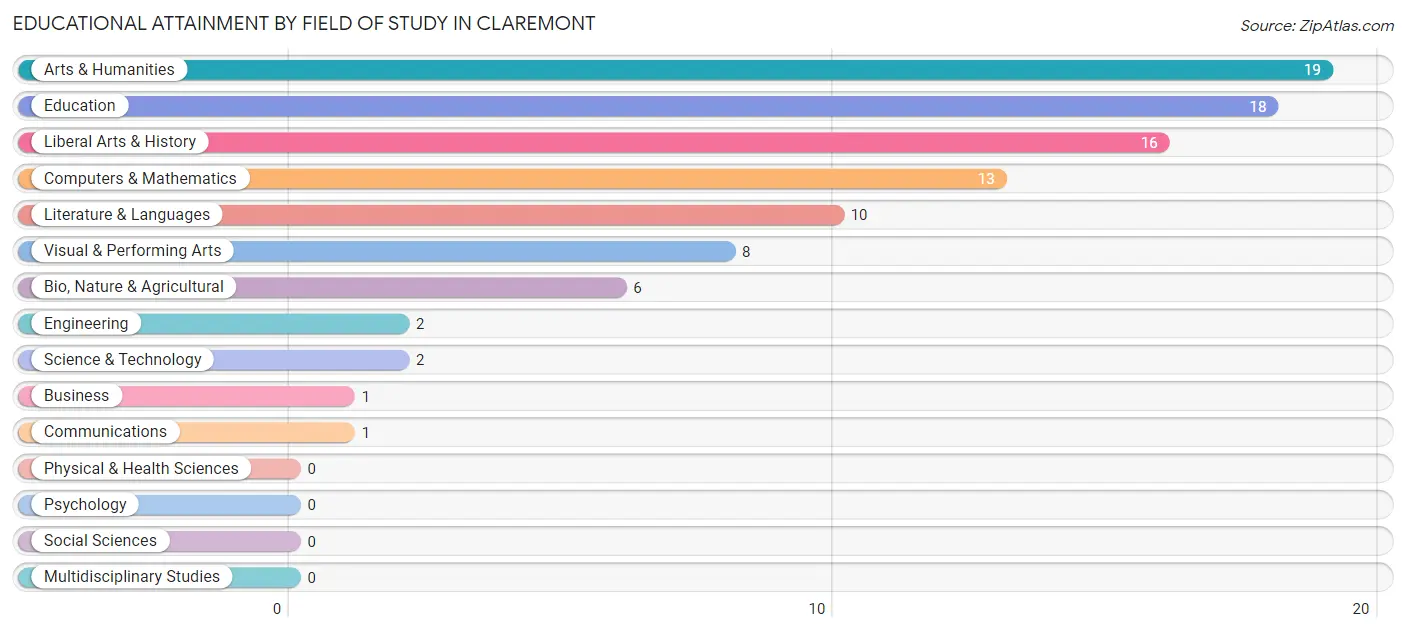
| Field of Study | # Graduates | % Graduates |
| Computers & Mathematics | 13 | 13.5% |
| Bio, Nature & Agricultural | 6 | 6.2% |
| Physical & Health Sciences | 0 | 0.0% |
| Psychology | 0 | 0.0% |
| Social Sciences | 0 | 0.0% |
| Engineering | 2 | 2.1% |
| Multidisciplinary Studies | 0 | 0.0% |
| Science & Technology | 2 | 2.1% |
| Business | 1 | 1.0% |
| Education | 18 | 18.8% |
| Literature & Languages | 10 | 10.4% |
| Liberal Arts & History | 16 | 16.7% |
| Visual & Performing Arts | 8 | 8.3% |
| Communications | 1 | 1.0% |
| Arts & Humanities | 19 | 19.8% |
| Total | 96 | 100.0% |
Transportation & Commute in Claremont
Vehicle Availability by Sex in Claremont
The most prevalent vehicle ownership categories in Claremont are males with 2 vehicles (55, accounting for 51.4%) and females with 2 vehicles (35, making up 73.3%).
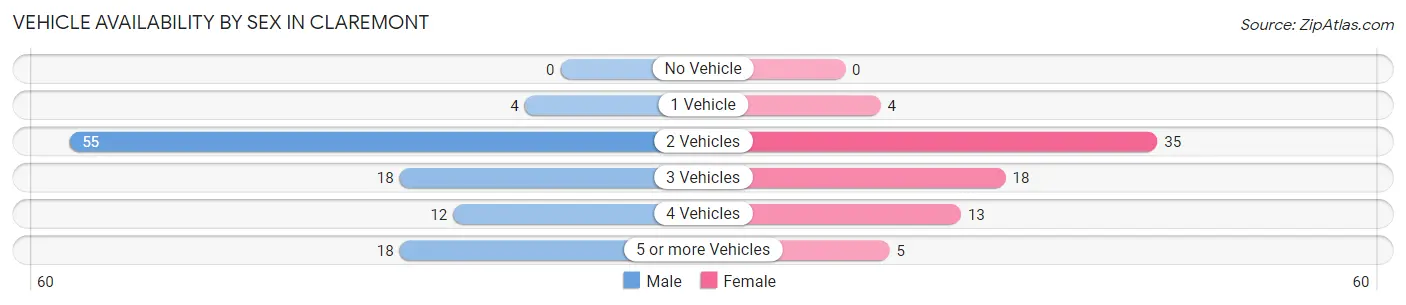
| Vehicles Available | Male | Female |
| No Vehicle | 0 (0.0%) | 0 (0.0%) |
| 1 Vehicle | 4 (3.7%) | 4 (5.3%) |
| 2 Vehicles | 55 (51.4%) | 35 (46.7%) |
| 3 Vehicles | 18 (16.8%) | 18 (24.0%) |
| 4 Vehicles | 12 (11.2%) | 13 (17.3%) |
| 5 or more Vehicles | 18 (16.8%) | 5 (6.7%) |
| Total | 107 (100.0%) | 75 (100.0%) |
Commute Time in Claremont
The most frequently occuring commute durations in Claremont are 15 to 19 minutes (27 commuters, 17.0%), 40 to 44 minutes (24 commuters, 15.1%), and 45 to 59 minutes (22 commuters, 13.8%).
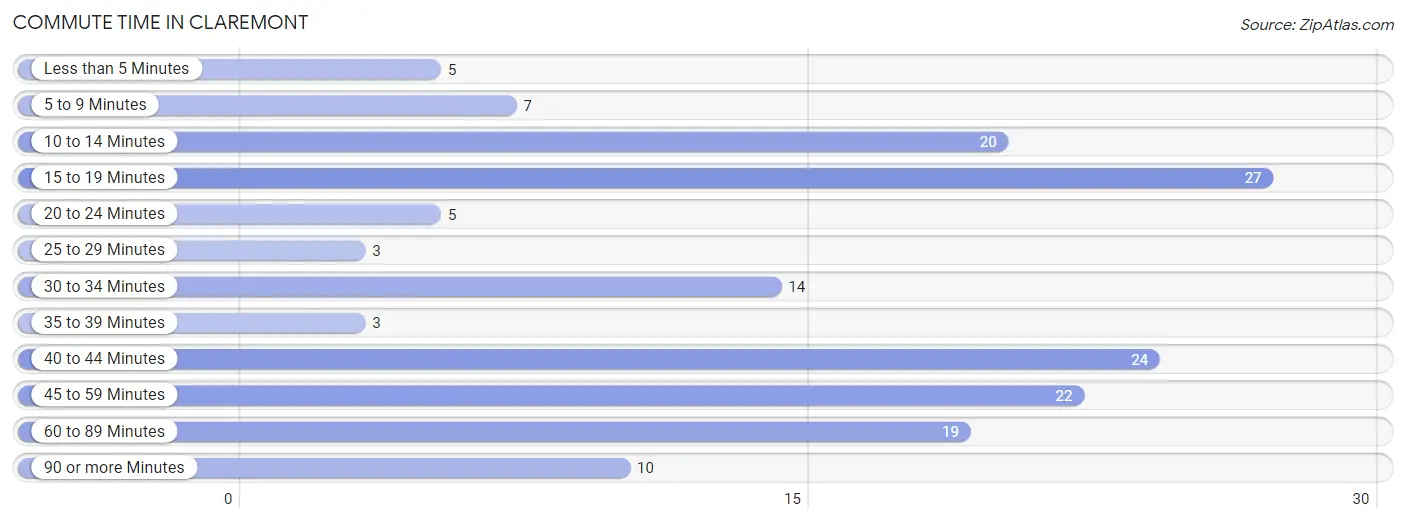
| Commute Time | # Commuters | % Commuters |
| Less than 5 Minutes | 5 | 3.1% |
| 5 to 9 Minutes | 7 | 4.4% |
| 10 to 14 Minutes | 20 | 12.6% |
| 15 to 19 Minutes | 27 | 17.0% |
| 20 to 24 Minutes | 5 | 3.1% |
| 25 to 29 Minutes | 3 | 1.9% |
| 30 to 34 Minutes | 14 | 8.8% |
| 35 to 39 Minutes | 3 | 1.9% |
| 40 to 44 Minutes | 24 | 15.1% |
| 45 to 59 Minutes | 22 | 13.8% |
| 60 to 89 Minutes | 19 | 11.9% |
| 90 or more Minutes | 10 | 6.3% |
Commute Time by Sex in Claremont
The most common commute times in Claremont are 15 to 19 minutes (27 commuters, 25.2%) for males and 40 to 44 minutes (17 commuters, 32.7%) for females.
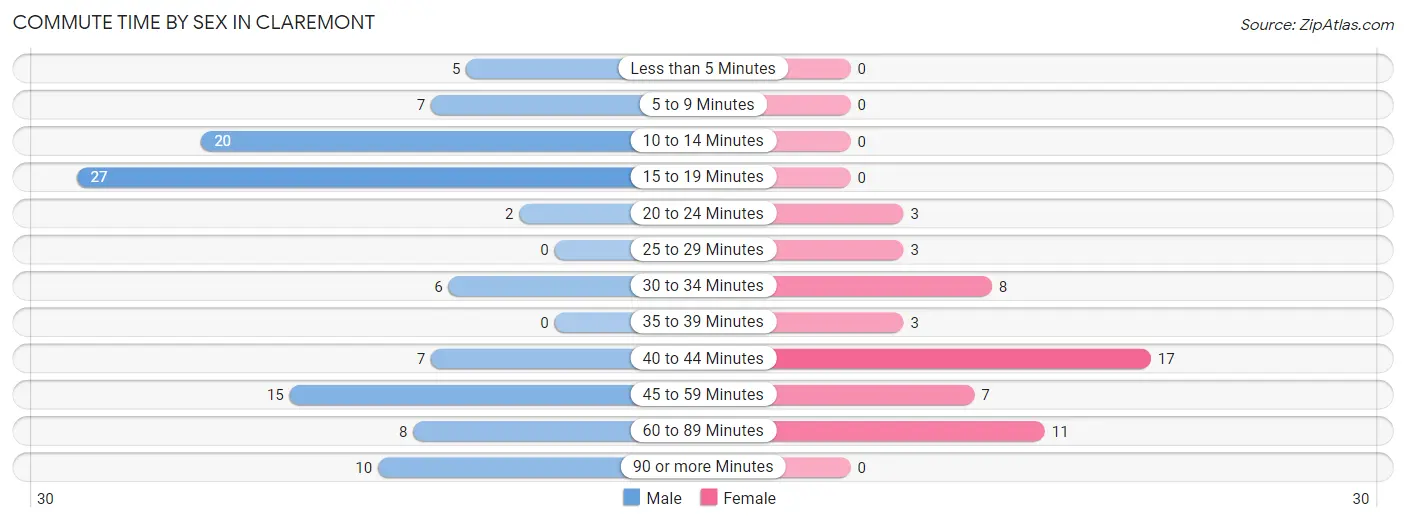
| Commute Time | Male | Female |
| Less than 5 Minutes | 5 (4.7%) | 0 (0.0%) |
| 5 to 9 Minutes | 7 (6.5%) | 0 (0.0%) |
| 10 to 14 Minutes | 20 (18.7%) | 0 (0.0%) |
| 15 to 19 Minutes | 27 (25.2%) | 0 (0.0%) |
| 20 to 24 Minutes | 2 (1.9%) | 3 (5.8%) |
| 25 to 29 Minutes | 0 (0.0%) | 3 (5.8%) |
| 30 to 34 Minutes | 6 (5.6%) | 8 (15.4%) |
| 35 to 39 Minutes | 0 (0.0%) | 3 (5.8%) |
| 40 to 44 Minutes | 7 (6.5%) | 17 (32.7%) |
| 45 to 59 Minutes | 15 (14.0%) | 7 (13.5%) |
| 60 to 89 Minutes | 8 (7.5%) | 11 (21.1%) |
| 90 or more Minutes | 10 (9.3%) | 0 (0.0%) |
Time of Departure to Work by Sex in Claremont
The most frequent times of departure to work in Claremont are 7:30 AM to 7:59 AM (28, 26.2%) for males and 7:30 AM to 7:59 AM (23, 44.2%) for females.
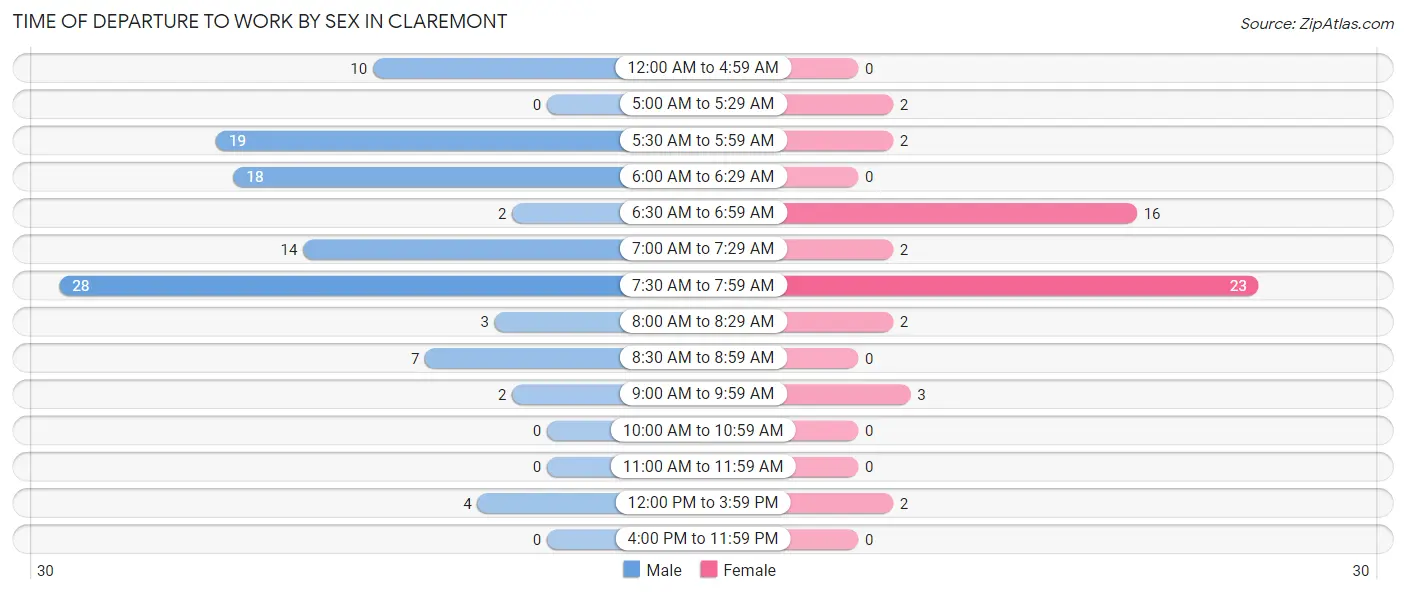
| Time of Departure | Male | Female |
| 12:00 AM to 4:59 AM | 10 (9.3%) | 0 (0.0%) |
| 5:00 AM to 5:29 AM | 0 (0.0%) | 2 (3.8%) |
| 5:30 AM to 5:59 AM | 19 (17.8%) | 2 (3.8%) |
| 6:00 AM to 6:29 AM | 18 (16.8%) | 0 (0.0%) |
| 6:30 AM to 6:59 AM | 2 (1.9%) | 16 (30.8%) |
| 7:00 AM to 7:29 AM | 14 (13.1%) | 2 (3.8%) |
| 7:30 AM to 7:59 AM | 28 (26.2%) | 23 (44.2%) |
| 8:00 AM to 8:29 AM | 3 (2.8%) | 2 (3.8%) |
| 8:30 AM to 8:59 AM | 7 (6.5%) | 0 (0.0%) |
| 9:00 AM to 9:59 AM | 2 (1.9%) | 3 (5.8%) |
| 10:00 AM to 10:59 AM | 0 (0.0%) | 0 (0.0%) |
| 11:00 AM to 11:59 AM | 0 (0.0%) | 0 (0.0%) |
| 12:00 PM to 3:59 PM | 4 (3.7%) | 2 (3.8%) |
| 4:00 PM to 11:59 PM | 0 (0.0%) | 0 (0.0%) |
| Total | 107 (100.0%) | 52 (100.0%) |
Housing Occupancy in Claremont
Occupancy by Ownership in Claremont
Of the total 218 dwellings in Claremont, owner-occupied units account for 190 (87.2%), while renter-occupied units make up 28 (12.8%).
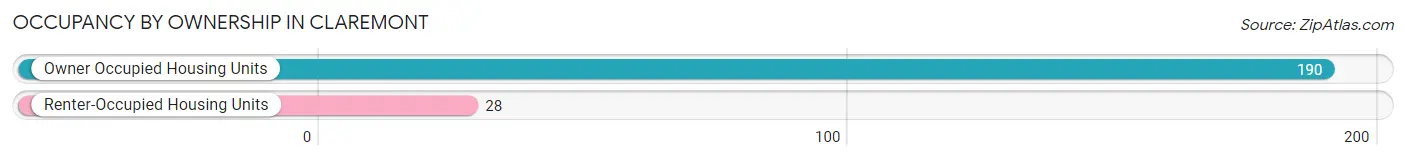
| Occupancy | # Housing Units | % Housing Units |
| Owner Occupied Housing Units | 190 | 87.2% |
| Renter-Occupied Housing Units | 28 | 12.8% |
| Total Occupied Housing Units | 218 | 100.0% |
Occupancy by Household Size in Claremont
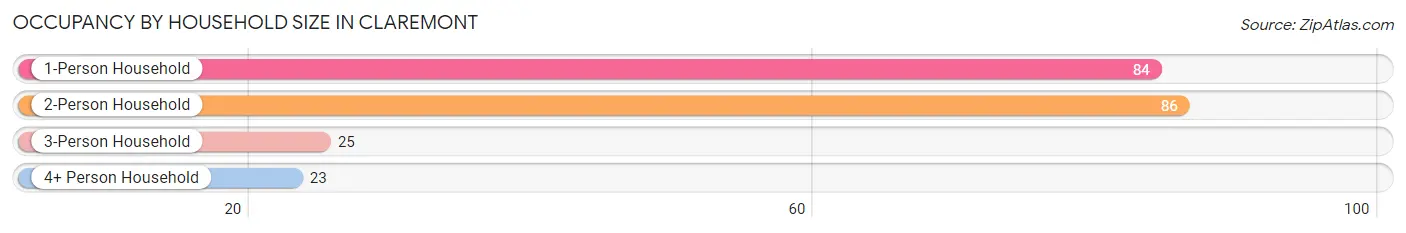
| Household Size | # Housing Units | % Housing Units |
| 1-Person Household | 84 | 38.5% |
| 2-Person Household | 86 | 39.5% |
| 3-Person Household | 25 | 11.5% |
| 4+ Person Household | 23 | 10.5% |
| Total Housing Units | 218 | 100.0% |
Occupancy by Ownership by Household Size in Claremont
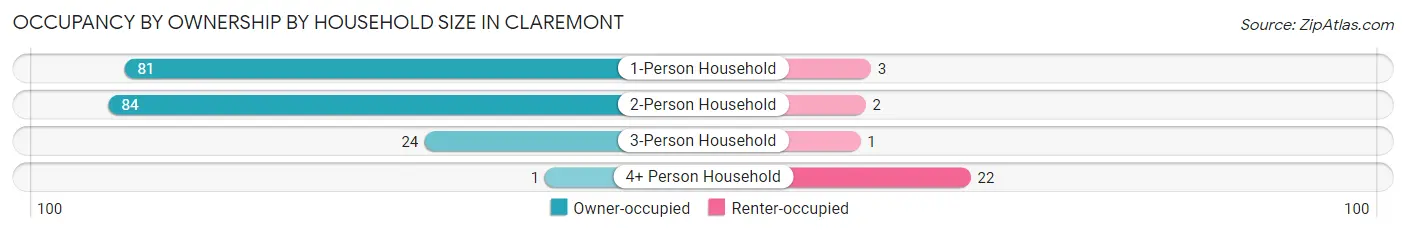
| Household Size | Owner-occupied | Renter-occupied |
| 1-Person Household | 81 (96.4%) | 3 (3.6%) |
| 2-Person Household | 84 (97.7%) | 2 (2.3%) |
| 3-Person Household | 24 (96.0%) | 1 (4.0%) |
| 4+ Person Household | 1 (4.3%) | 22 (95.7%) |
| Total Housing Units | 190 (87.2%) | 28 (12.8%) |
Occupancy by Educational Attainment in Claremont
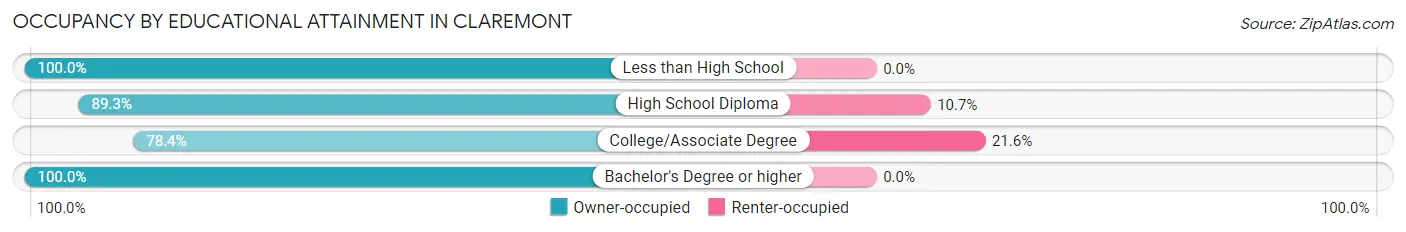
| Household Size | Owner-occupied | Renter-occupied |
| Less than High School | 13 (100.0%) | 0 (0.0%) |
| High School Diploma | 50 (89.3%) | 6 (10.7%) |
| College/Associate Degree | 80 (78.4%) | 22 (21.6%) |
| Bachelor's Degree or higher | 47 (100.0%) | 0 (0.0%) |
Occupancy by Age of Householder in Claremont
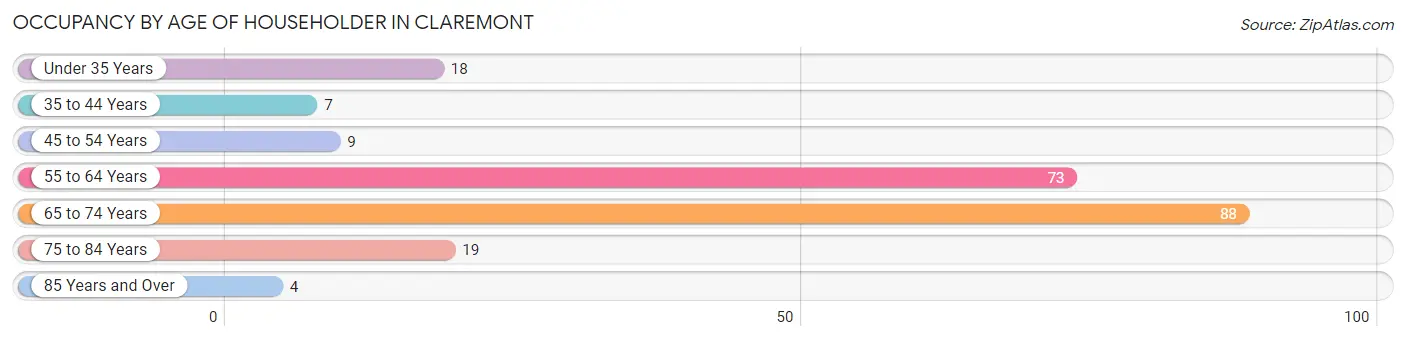
| Age Bracket | # Households | % Households |
| Under 35 Years | 18 | 8.3% |
| 35 to 44 Years | 7 | 3.2% |
| 45 to 54 Years | 9 | 4.1% |
| 55 to 64 Years | 73 | 33.5% |
| 65 to 74 Years | 88 | 40.4% |
| 75 to 84 Years | 19 | 8.7% |
| 85 Years and Over | 4 | 1.8% |
| Total | 218 | 100.0% |
Housing Finances in Claremont
Median Income by Occupancy in Claremont
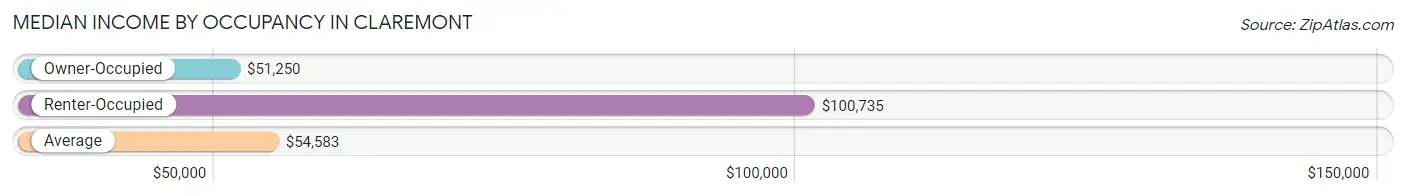
| Occupancy Type | # Households | Median Income |
| Owner-Occupied | 190 (87.2%) | $51,250 |
| Renter-Occupied | 28 (12.8%) | $100,735 |
| Average | 218 (100.0%) | $54,583 |
Occupancy by Householder Income Bracket in Claremont
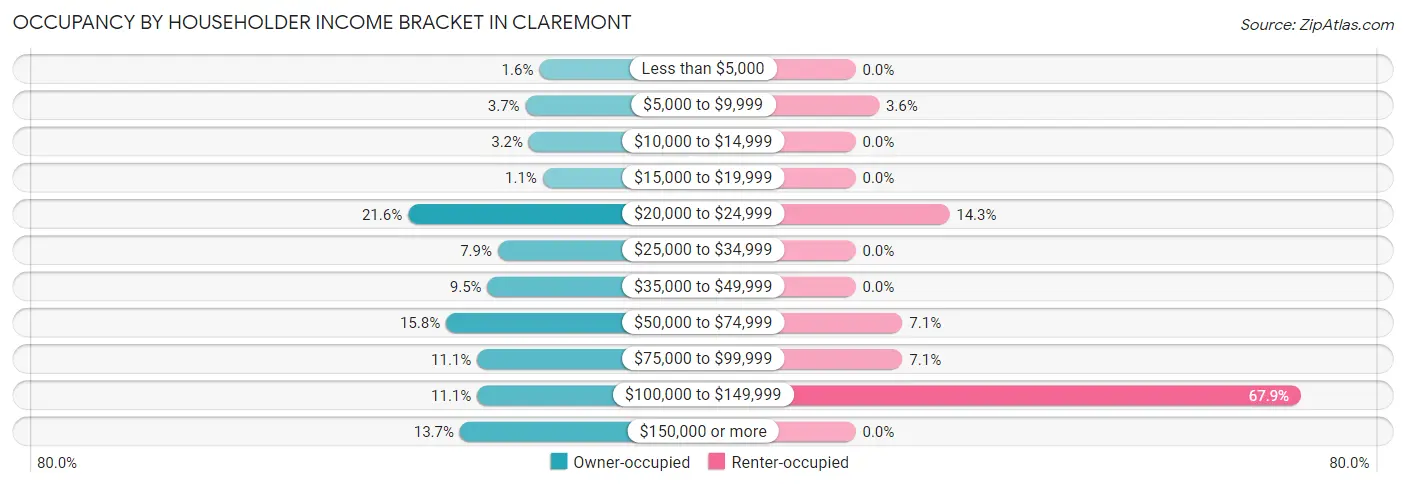
| Income Bracket | Owner-occupied | Renter-occupied |
| Less than $5,000 | 3 (1.6%) | 0 (0.0%) |
| $5,000 to $9,999 | 7 (3.7%) | 1 (3.6%) |
| $10,000 to $14,999 | 6 (3.2%) | 0 (0.0%) |
| $15,000 to $19,999 | 2 (1.1%) | 0 (0.0%) |
| $20,000 to $24,999 | 41 (21.6%) | 4 (14.3%) |
| $25,000 to $34,999 | 15 (7.9%) | 0 (0.0%) |
| $35,000 to $49,999 | 18 (9.5%) | 0 (0.0%) |
| $50,000 to $74,999 | 30 (15.8%) | 2 (7.1%) |
| $75,000 to $99,999 | 21 (11.1%) | 2 (7.1%) |
| $100,000 to $149,999 | 21 (11.1%) | 19 (67.9%) |
| $150,000 or more | 26 (13.7%) | 0 (0.0%) |
| Total | 190 (100.0%) | 28 (100.0%) |
Monthly Housing Cost Tiers in Claremont
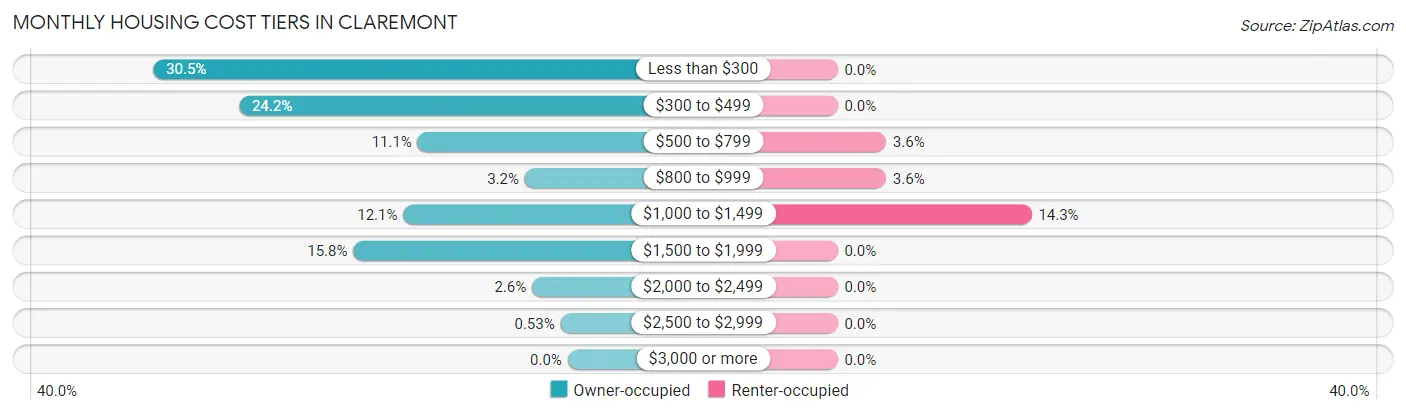
| Monthly Cost | Owner-occupied | Renter-occupied |
| Less than $300 | 58 (30.5%) | 0 (0.0%) |
| $300 to $499 | 46 (24.2%) | 0 (0.0%) |
| $500 to $799 | 21 (11.1%) | 1 (3.6%) |
| $800 to $999 | 6 (3.2%) | 1 (3.6%) |
| $1,000 to $1,499 | 23 (12.1%) | 4 (14.3%) |
| $1,500 to $1,999 | 30 (15.8%) | 0 (0.0%) |
| $2,000 to $2,499 | 5 (2.6%) | 0 (0.0%) |
| $2,500 to $2,999 | 1 (0.5%) | 0 (0.0%) |
| $3,000 or more | 0 (0.0%) | 0 (0.0%) |
| Total | 190 (100.0%) | 28 (100.0%) |
Physical Housing Characteristics in Claremont
Housing Structures in Claremont
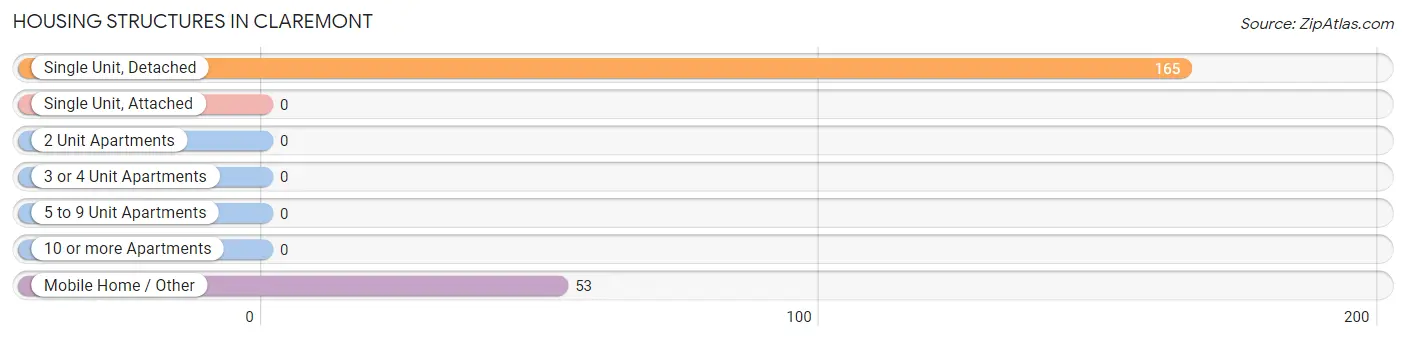
| Structure Type | # Housing Units | % Housing Units |
| Single Unit, Detached | 165 | 75.7% |
| Single Unit, Attached | 0 | 0.0% |
| 2 Unit Apartments | 0 | 0.0% |
| 3 or 4 Unit Apartments | 0 | 0.0% |
| 5 to 9 Unit Apartments | 0 | 0.0% |
| 10 or more Apartments | 0 | 0.0% |
| Mobile Home / Other | 53 | 24.3% |
| Total | 218 | 100.0% |
Housing Structures by Occupancy in Claremont
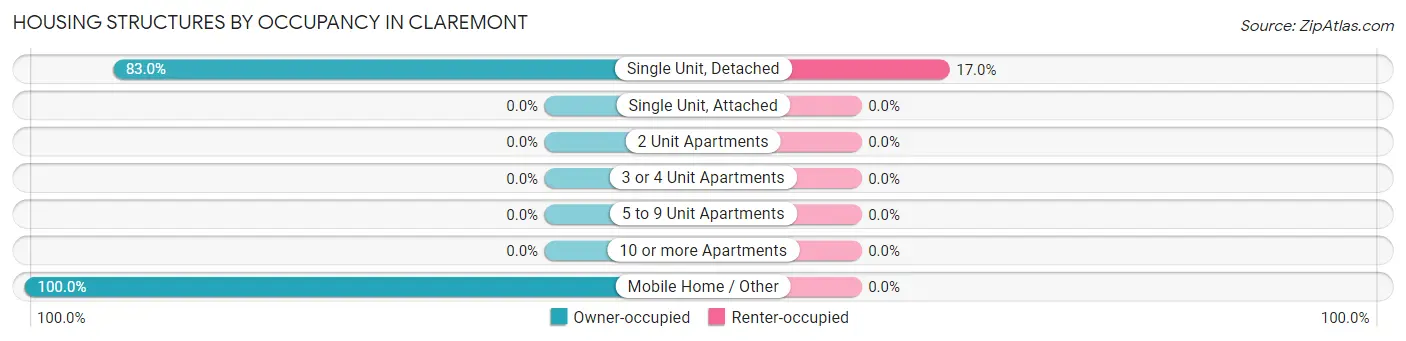
| Structure Type | Owner-occupied | Renter-occupied |
| Single Unit, Detached | 137 (83.0%) | 28 (17.0%) |
| Single Unit, Attached | 0 (0.0%) | 0 (0.0%) |
| 2 Unit Apartments | 0 (0.0%) | 0 (0.0%) |
| 3 or 4 Unit Apartments | 0 (0.0%) | 0 (0.0%) |
| 5 to 9 Unit Apartments | 0 (0.0%) | 0 (0.0%) |
| 10 or more Apartments | 0 (0.0%) | 0 (0.0%) |
| Mobile Home / Other | 53 (100.0%) | 0 (0.0%) |
| Total | 190 (87.2%) | 28 (12.8%) |
Housing Structures by Number of Rooms in Claremont
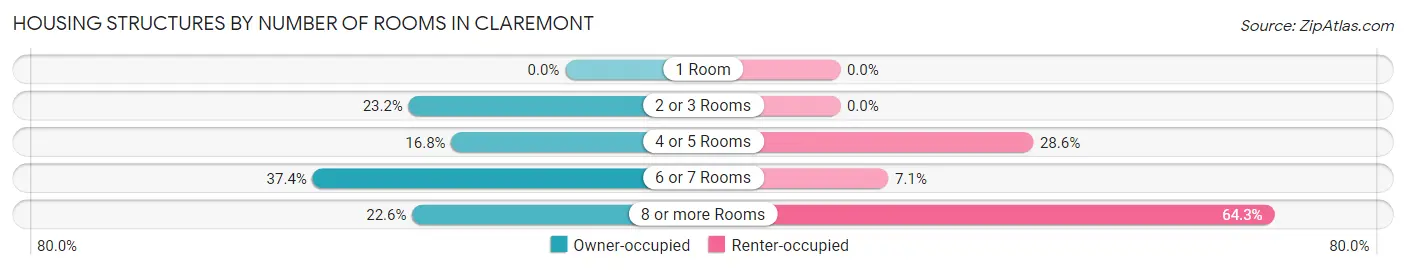
| Number of Rooms | Owner-occupied | Renter-occupied |
| 1 Room | 0 (0.0%) | 0 (0.0%) |
| 2 or 3 Rooms | 44 (23.2%) | 0 (0.0%) |
| 4 or 5 Rooms | 32 (16.8%) | 8 (28.6%) |
| 6 or 7 Rooms | 71 (37.4%) | 2 (7.1%) |
| 8 or more Rooms | 43 (22.6%) | 18 (64.3%) |
| Total | 190 (100.0%) | 28 (100.0%) |
Housing Structure by Heating Type in Claremont
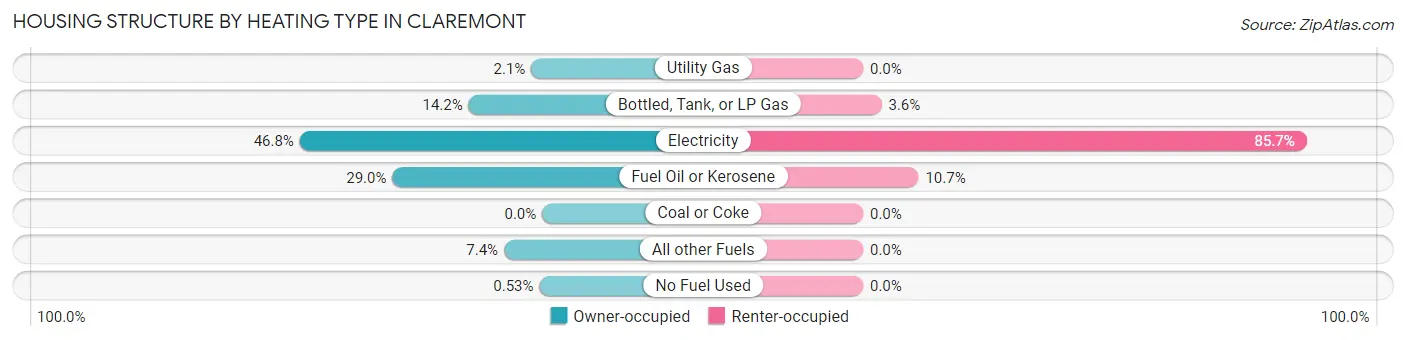
| Heating Type | Owner-occupied | Renter-occupied |
| Utility Gas | 4 (2.1%) | 0 (0.0%) |
| Bottled, Tank, or LP Gas | 27 (14.2%) | 1 (3.6%) |
| Electricity | 89 (46.8%) | 24 (85.7%) |
| Fuel Oil or Kerosene | 55 (28.9%) | 3 (10.7%) |
| Coal or Coke | 0 (0.0%) | 0 (0.0%) |
| All other Fuels | 14 (7.4%) | 0 (0.0%) |
| No Fuel Used | 1 (0.5%) | 0 (0.0%) |
| Total | 190 (100.0%) | 28 (100.0%) |
Household Vehicle Usage in Claremont
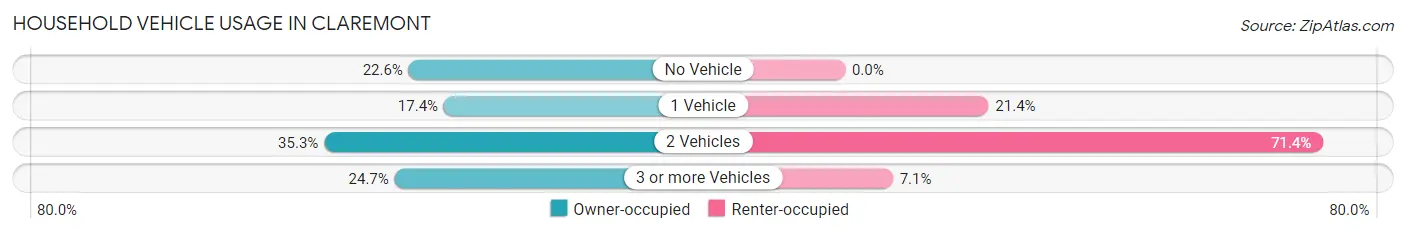
| Vehicles per Household | Owner-occupied | Renter-occupied |
| No Vehicle | 43 (22.6%) | 0 (0.0%) |
| 1 Vehicle | 33 (17.4%) | 6 (21.4%) |
| 2 Vehicles | 67 (35.3%) | 20 (71.4%) |
| 3 or more Vehicles | 47 (24.7%) | 2 (7.1%) |
| Total | 190 (100.0%) | 28 (100.0%) |
Real Estate & Mortgages in Claremont
Real Estate and Mortgage Overview in Claremont
| Characteristic | Without Mortgage | With Mortgage |
| Housing Units | 126 | 64 |
| Median Property Value | - | - |
| Median Household Income | $38,571 | $4 |
| Monthly Housing Costs | $317 | $0 |
| Real Estate Taxes | $633 | $4 |
Property Value by Mortgage Status in Claremont
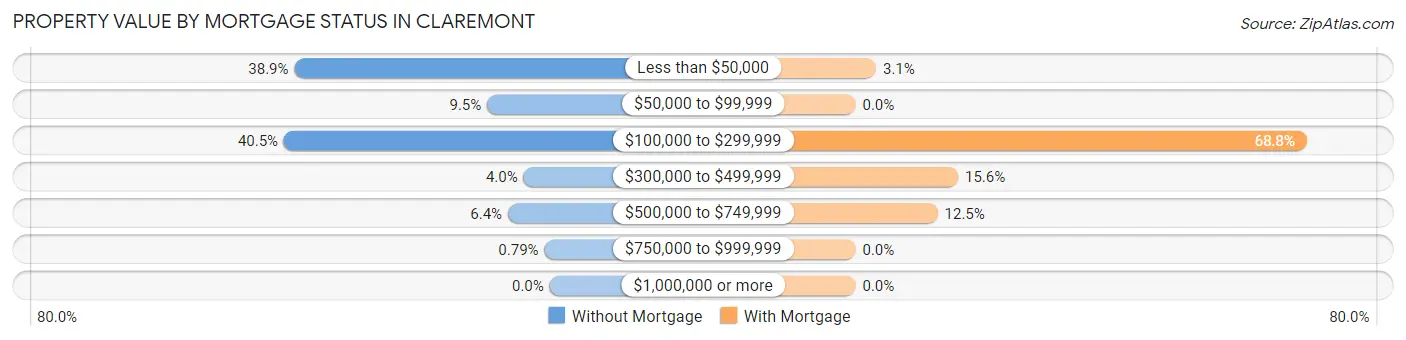
| Property Value | Without Mortgage | With Mortgage |
| Less than $50,000 | 49 (38.9%) | 2 (3.1%) |
| $50,000 to $99,999 | 12 (9.5%) | 0 (0.0%) |
| $100,000 to $299,999 | 51 (40.5%) | 44 (68.8%) |
| $300,000 to $499,999 | 5 (4.0%) | 10 (15.6%) |
| $500,000 to $749,999 | 8 (6.4%) | 8 (12.5%) |
| $750,000 to $999,999 | 1 (0.8%) | 0 (0.0%) |
| $1,000,000 or more | 0 (0.0%) | 0 (0.0%) |
| Total | 126 (100.0%) | 64 (100.0%) |
Household Income by Mortgage Status in Claremont
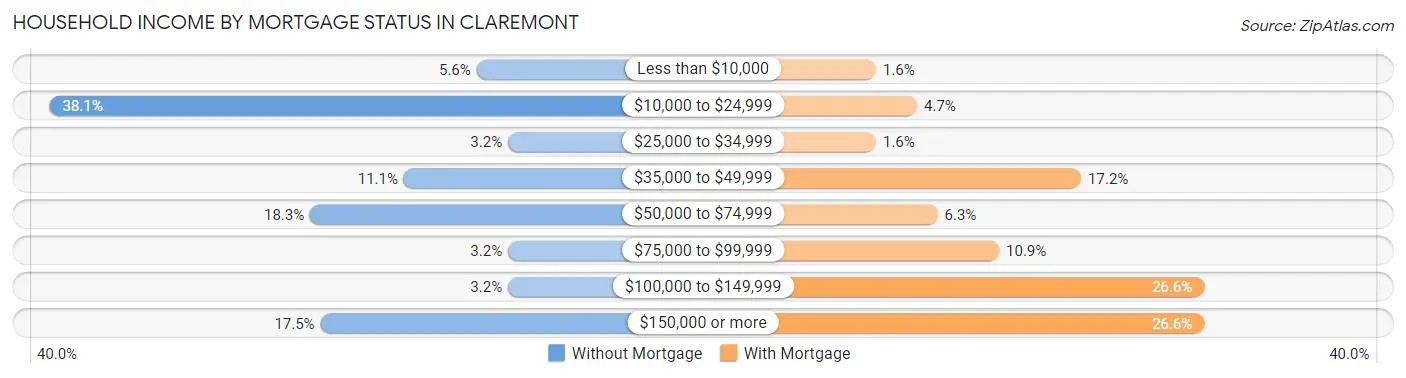
| Household Income | Without Mortgage | With Mortgage |
| Less than $10,000 | 7 (5.6%) | 1 (1.6%) |
| $10,000 to $24,999 | 48 (38.1%) | 3 (4.7%) |
| $25,000 to $34,999 | 4 (3.2%) | 1 (1.6%) |
| $35,000 to $49,999 | 14 (11.1%) | 11 (17.2%) |
| $50,000 to $74,999 | 23 (18.2%) | 4 (6.2%) |
| $75,000 to $99,999 | 4 (3.2%) | 7 (10.9%) |
| $100,000 to $149,999 | 4 (3.2%) | 17 (26.6%) |
| $150,000 or more | 22 (17.5%) | 17 (26.6%) |
| Total | 126 (100.0%) | 64 (100.0%) |
Property Value to Household Income Ratio in Claremont
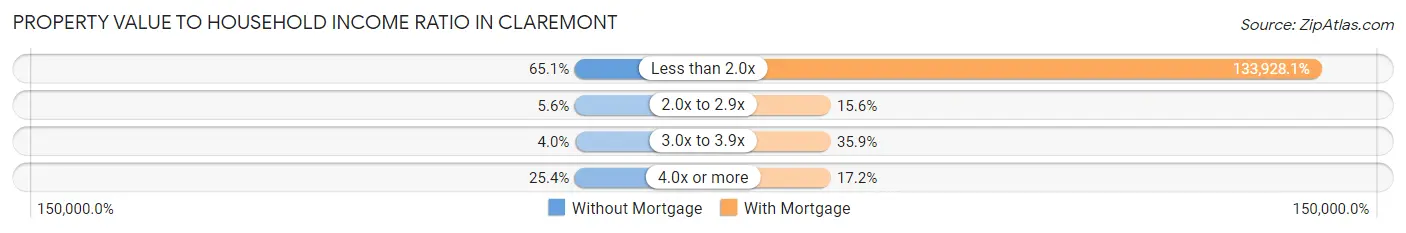
| Value-to-Income Ratio | Without Mortgage | With Mortgage |
| Less than 2.0x | 82 (65.1%) | 85,714 (133,928.1%) |
| 2.0x to 2.9x | 7 (5.6%) | 10 (15.6%) |
| 3.0x to 3.9x | 5 (4.0%) | 23 (35.9%) |
| 4.0x or more | 32 (25.4%) | 11 (17.2%) |
| Total | 126 (100.0%) | 64 (100.0%) |
Real Estate Taxes by Mortgage Status in Claremont
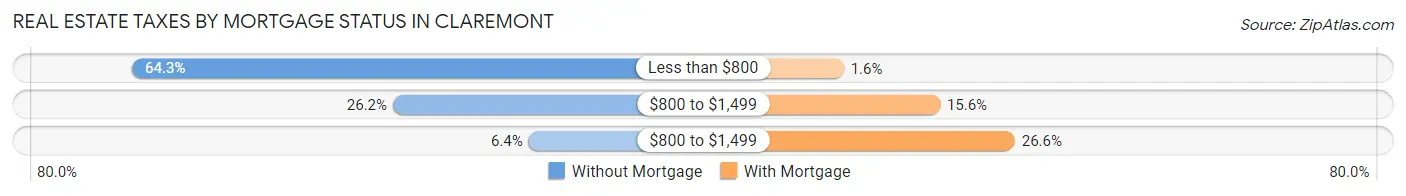
| Property Taxes | Without Mortgage | With Mortgage |
| Less than $800 | 81 (64.3%) | 1 (1.6%) |
| $800 to $1,499 | 33 (26.2%) | 10 (15.6%) |
| $800 to $1,499 | 8 (6.4%) | 17 (26.6%) |
| Total | 126 (100.0%) | 64 (100.0%) |
Health & Disability in Claremont
Health Insurance Coverage by Age in Claremont
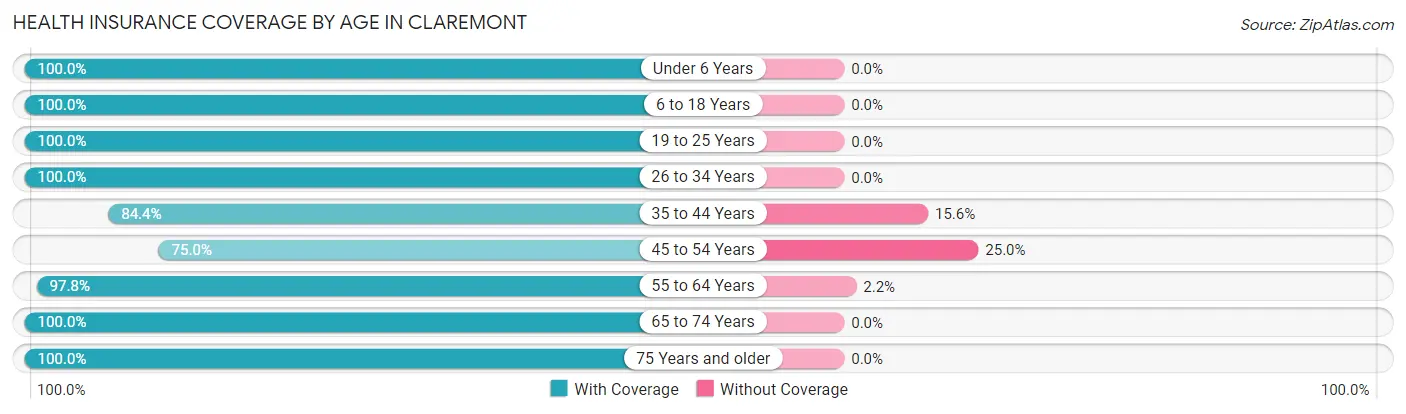
| Age Bracket | With Coverage | Without Coverage |
| Under 6 Years | 4 (100.0%) | 0 (0.0%) |
| 6 to 18 Years | 25 (100.0%) | 0 (0.0%) |
| 19 to 25 Years | 17 (100.0%) | 0 (0.0%) |
| 26 to 34 Years | 29 (100.0%) | 0 (0.0%) |
| 35 to 44 Years | 27 (84.4%) | 5 (15.6%) |
| 45 to 54 Years | 24 (75.0%) | 8 (25.0%) |
| 55 to 64 Years | 131 (97.8%) | 3 (2.2%) |
| 65 to 74 Years | 118 (100.0%) | 0 (0.0%) |
| 75 Years and older | 30 (100.0%) | 0 (0.0%) |
| Total | 405 (96.2%) | 16 (3.8%) |
Health Insurance Coverage by Citizenship Status in Claremont
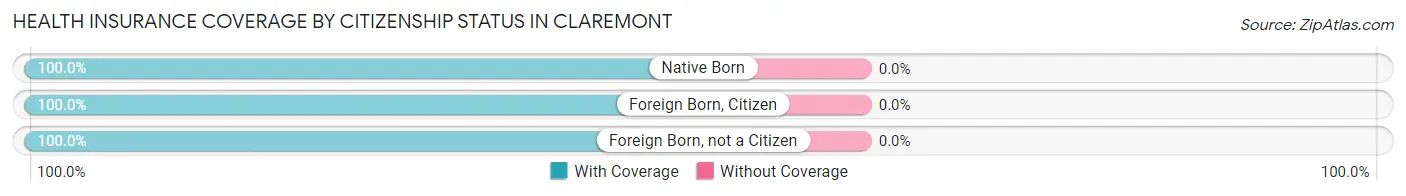
| Citizenship Status | With Coverage | Without Coverage |
| Native Born | 4 (100.0%) | 0 (0.0%) |
| Foreign Born, Citizen | 25 (100.0%) | 0 (0.0%) |
| Foreign Born, not a Citizen | 17 (100.0%) | 0 (0.0%) |
Health Insurance Coverage by Household Income in Claremont
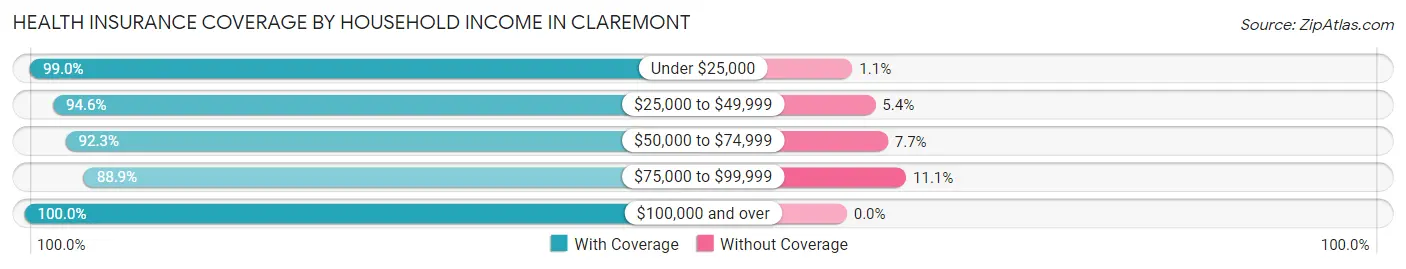
| Household Income | With Coverage | Without Coverage |
| Under $25,000 | 94 (99.0%) | 1 (1.1%) |
| $25,000 to $49,999 | 53 (94.6%) | 3 (5.4%) |
| $50,000 to $74,999 | 60 (92.3%) | 5 (7.7%) |
| $75,000 to $99,999 | 56 (88.9%) | 7 (11.1%) |
| $100,000 and over | 142 (100.0%) | 0 (0.0%) |
Public vs Private Health Insurance Coverage by Age in Claremont
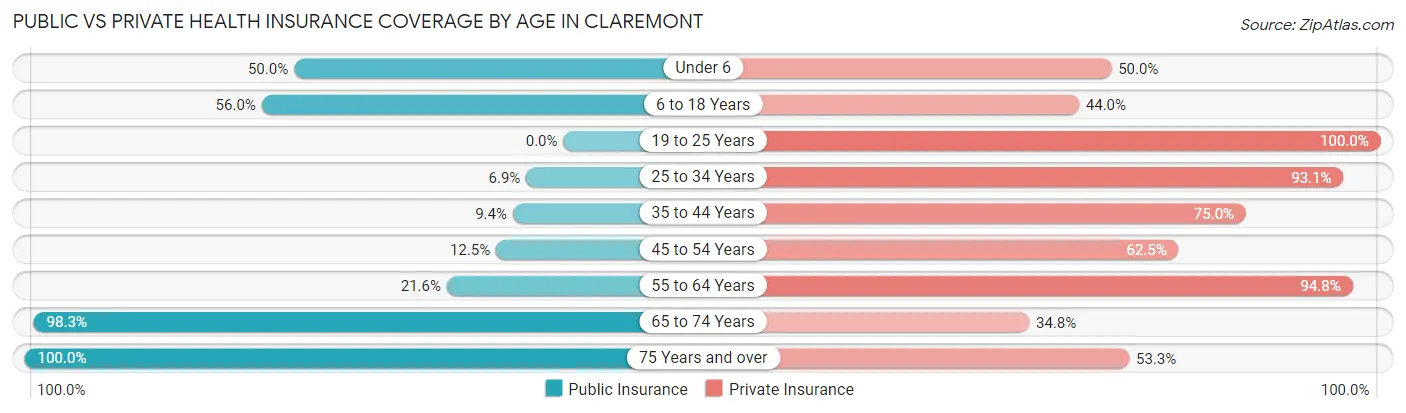
| Age Bracket | Public Insurance | Private Insurance |
| Under 6 | 2 (50.0%) | 2 (50.0%) |
| 6 to 18 Years | 14 (56.0%) | 11 (44.0%) |
| 19 to 25 Years | 0 (0.0%) | 17 (100.0%) |
| 25 to 34 Years | 2 (6.9%) | 27 (93.1%) |
| 35 to 44 Years | 3 (9.4%) | 24 (75.0%) |
| 45 to 54 Years | 4 (12.5%) | 20 (62.5%) |
| 55 to 64 Years | 29 (21.6%) | 127 (94.8%) |
| 65 to 74 Years | 116 (98.3%) | 41 (34.7%) |
| 75 Years and over | 30 (100.0%) | 16 (53.3%) |
| Total | 200 (47.5%) | 285 (67.7%) |
Disability Status by Sex by Age in Claremont
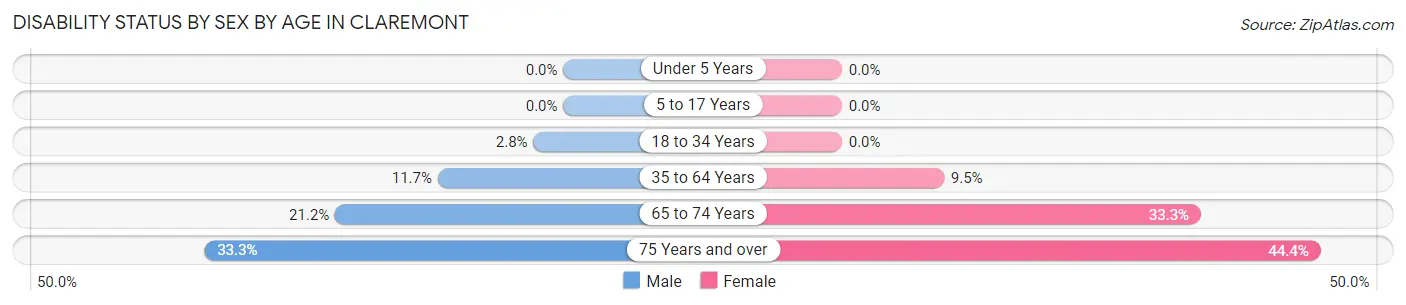
| Age Bracket | Male | Female |
| Under 5 Years | 0 (0.0%) | 0 (0.0%) |
| 5 to 17 Years | 0 (0.0%) | 0 (0.0%) |
| 18 to 34 Years | 1 (2.8%) | 0 (0.0%) |
| 35 to 64 Years | 12 (11.7%) | 9 (9.5%) |
| 65 to 74 Years | 18 (21.2%) | 11 (33.3%) |
| 75 Years and over | 4 (33.3%) | 8 (44.4%) |
Disability Class by Sex by Age in Claremont
Disability Class: Hearing Difficulty
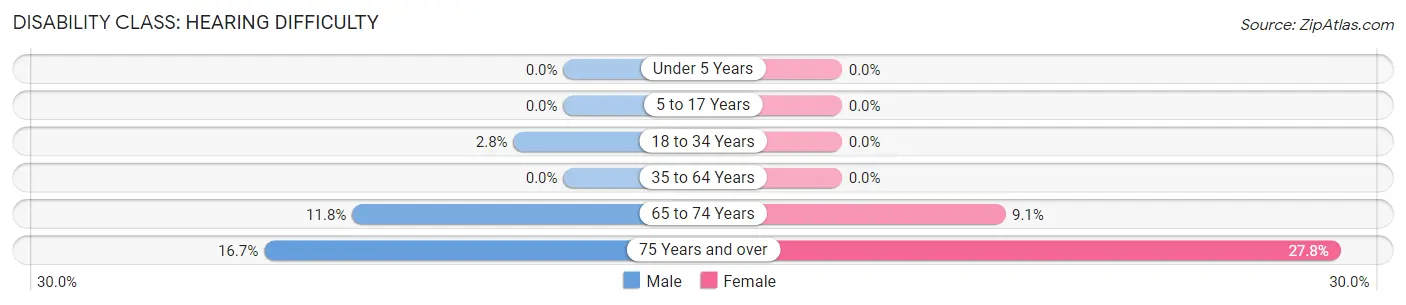
| Age Bracket | Male | Female |
| Under 5 Years | 0 (0.0%) | 0 (0.0%) |
| 5 to 17 Years | 0 (0.0%) | 0 (0.0%) |
| 18 to 34 Years | 1 (2.8%) | 0 (0.0%) |
| 35 to 64 Years | 0 (0.0%) | 0 (0.0%) |
| 65 to 74 Years | 10 (11.8%) | 3 (9.1%) |
| 75 Years and over | 2 (16.7%) | 5 (27.8%) |
Disability Class: Vision Difficulty
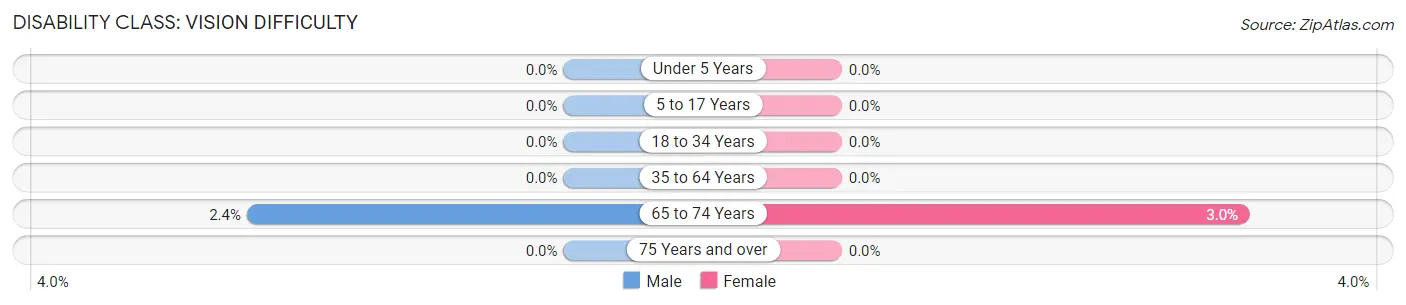
| Age Bracket | Male | Female |
| Under 5 Years | 0 (0.0%) | 0 (0.0%) |
| 5 to 17 Years | 0 (0.0%) | 0 (0.0%) |
| 18 to 34 Years | 0 (0.0%) | 0 (0.0%) |
| 35 to 64 Years | 0 (0.0%) | 0 (0.0%) |
| 65 to 74 Years | 2 (2.4%) | 1 (3.0%) |
| 75 Years and over | 0 (0.0%) | 0 (0.0%) |
Disability Class: Cognitive Difficulty
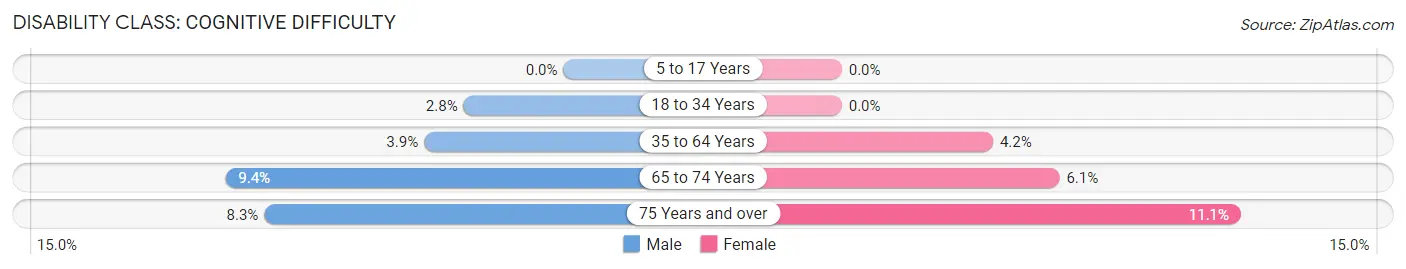
| Age Bracket | Male | Female |
| 5 to 17 Years | 0 (0.0%) | 0 (0.0%) |
| 18 to 34 Years | 1 (2.8%) | 0 (0.0%) |
| 35 to 64 Years | 4 (3.9%) | 4 (4.2%) |
| 65 to 74 Years | 8 (9.4%) | 2 (6.1%) |
| 75 Years and over | 1 (8.3%) | 2 (11.1%) |
Disability Class: Ambulatory Difficulty
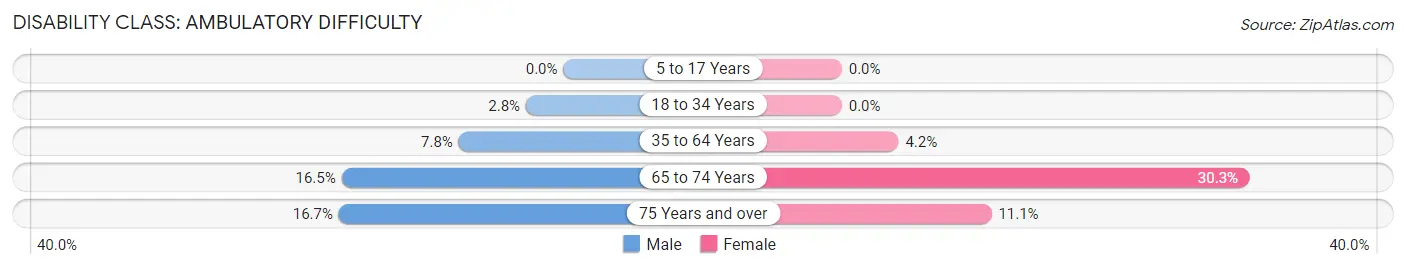
| Age Bracket | Male | Female |
| 5 to 17 Years | 0 (0.0%) | 0 (0.0%) |
| 18 to 34 Years | 1 (2.8%) | 0 (0.0%) |
| 35 to 64 Years | 8 (7.8%) | 4 (4.2%) |
| 65 to 74 Years | 14 (16.5%) | 10 (30.3%) |
| 75 Years and over | 2 (16.7%) | 2 (11.1%) |
Disability Class: Self-Care Difficulty
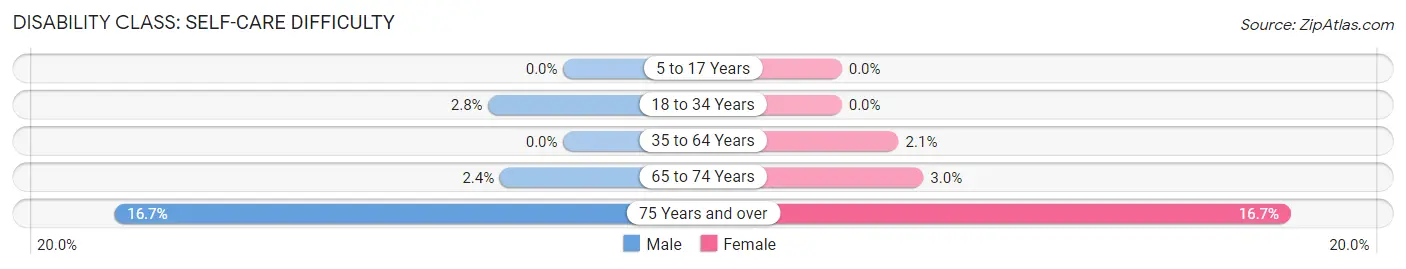
| Age Bracket | Male | Female |
| 5 to 17 Years | 0 (0.0%) | 0 (0.0%) |
| 18 to 34 Years | 1 (2.8%) | 0 (0.0%) |
| 35 to 64 Years | 0 (0.0%) | 2 (2.1%) |
| 65 to 74 Years | 2 (2.4%) | 1 (3.0%) |
| 75 Years and over | 2 (16.7%) | 3 (16.7%) |
Technology Access in Claremont
Computing Device Access in Claremont
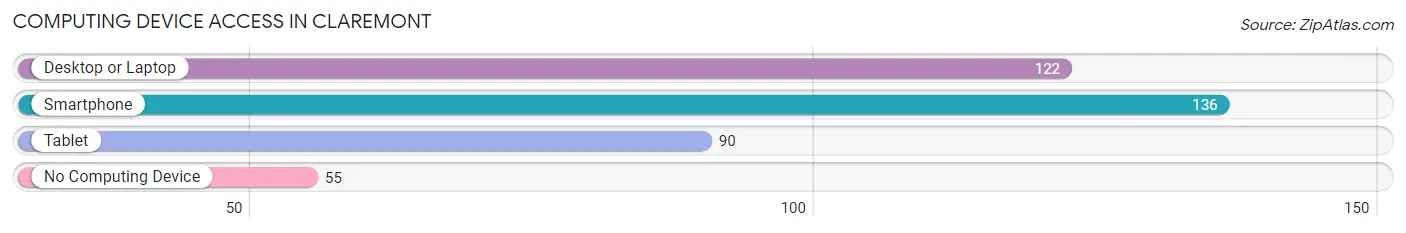
| Device Type | # Households | % Households |
| Desktop or Laptop | 122 | 56.0% |
| Smartphone | 136 | 62.4% |
| Tablet | 90 | 41.3% |
| No Computing Device | 55 | 25.2% |
| Total | 218 | 100.0% |
Internet Access in Claremont
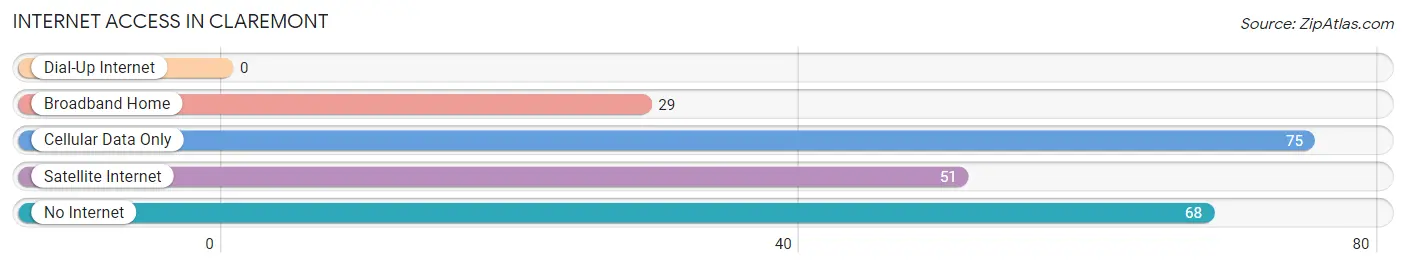
| Internet Type | # Households | % Households |
| Dial-Up Internet | 0 | 0.0% |
| Broadband Home | 29 | 13.3% |
| Cellular Data Only | 75 | 34.4% |
| Satellite Internet | 51 | 23.4% |
| No Internet | 68 | 31.2% |
| Total | 218 | 100.0% |
Claremont Summary
Claremont is a small town located in Surry County, Virginia, United States. The population was 1,845 at the 2010 census. It is located on the south bank of the James River, about 25 miles (40 km) southeast of Richmond.
History
Claremont was first settled in the early 1700s by English colonists. The town was originally known as “Claremont Landing” and was a port of entry for ships coming up the James River. The town was officially incorporated in 1786 and was named after the Earl of Claremont, a British nobleman.
During the American Civil War, Claremont was the site of a major battle between Union and Confederate forces in 1862. The Battle of Claremont was a decisive victory for the Union, and it helped to secure the James River for the Union Navy.
Geography
Claremont is located at 37°14′N 76°50′W (37.23, -76.83). According to the United States Census Bureau, the town has a total area of 1.2 square miles (3.2 km2), all of it land.
Economy
The economy of Claremont is largely based on agriculture and tourism. The town is home to several farms, including a large dairy farm. The town also has a number of small businesses, including a few restaurants, a grocery store, and a few antique shops.
Tourism is an important part of the local economy. The town is home to several historic sites, including the Claremont Manor House, which was built in 1790 and is listed on the National Register of Historic Places. The town also has a number of parks and recreational areas, including the James River Park System, which offers camping, fishing, and other outdoor activities.
Demographics
As of the census of 2010, there were 1,845 people, 745 households, and 486 families residing in the town. The population density was 1,527.5 people per square mile (589.3/km2). There were 817 housing units at an average density of 676.7 per square mile (261.3/km2). The racial makeup of the town was 73.2% White, 22.2% African American, 0.2% Native American, 0.7% Asian, 0.1% Pacific Islander, 1.2% from other races, and 2.6% from two or more races. Hispanic or Latino of any race were 3.2% of the population.
There were 745 households, out of which 28.2% had children under the age of 18 living with them, 43.2% were married couples living together, 16.2% had a female householder with no husband present, and 35.7% were non-families. 30.2% of all households were made up of individuals, and 13.2% had someone living alone who was 65 years of age or older. The average household size was 2.45 and the average family size was 3.03.
In the town, the population was spread out, with 24.2% under the age of 18, 8.2% from 18 to 24, 28.2% from 25 to 44, 24.2% from 45 to 64, and 15.2% who were 65 years of age or older. The median age was 38 years. For every 100 females, there were 91.2 males. For every 100 females age 18 and over, there were 87.2 males.
The median income for a household in the town was $35,000, and the median income for a family was $41,250. Males had a median income of $30,000 versus $21,250 for females. The per capita income for the town was $17,845. About 11.2% of families and 14.2% of the population were below the poverty line, including 19.2% of those under age 18 and 11.2% of those age 65 or over.
Common Questions
What is Per Capita Income in Claremont?
Per Capita income in Claremont is $37,889.
What is the Median Family Income in Claremont?
Median Family Income in Claremont is $100,294.
What is the Median Household income in Claremont?
Median Household Income in Claremont is $54,583.
What is Income or Wage Gap in Claremont?
Income or Wage Gap in Claremont is 10.2%.
Women in Claremont earn 89.8 cents for every dollar earned by a man.
What is Inequality or Gini Index in Claremont?
Inequality or Gini Index in Claremont is 0.40.
What is the Total Population of Claremont?
Total Population of Claremont is 421.
What is the Total Male Population of Claremont?
Total Male Population of Claremont is 252.
What is the Total Female Population of Claremont?
Total Female Population of Claremont is 169.
What is the Ratio of Males per 100 Females in Claremont?
There are 149.11 Males per 100 Females in Claremont.
What is the Ratio of Females per 100 Males in Claremont?
There are 67.06 Females per 100 Males in Claremont.
What is the Median Population Age in Claremont?
Median Population Age in Claremont is 60.9 Years.
What is the Average Family Size in Claremont
Average Family Size in Claremont is 2.5 People.
What is the Average Household Size in Claremont
Average Household Size in Claremont is 1.9 People.
How Large is the Labor Force in Claremont?
There are 182 People in the Labor Forcein in Claremont.
What is the Percentage of People in the Labor Force in Claremont?
45.8% of People are in the Labor Force in Claremont.