Skyland Estates, VA Map & Demographics
Skyland Estates Map
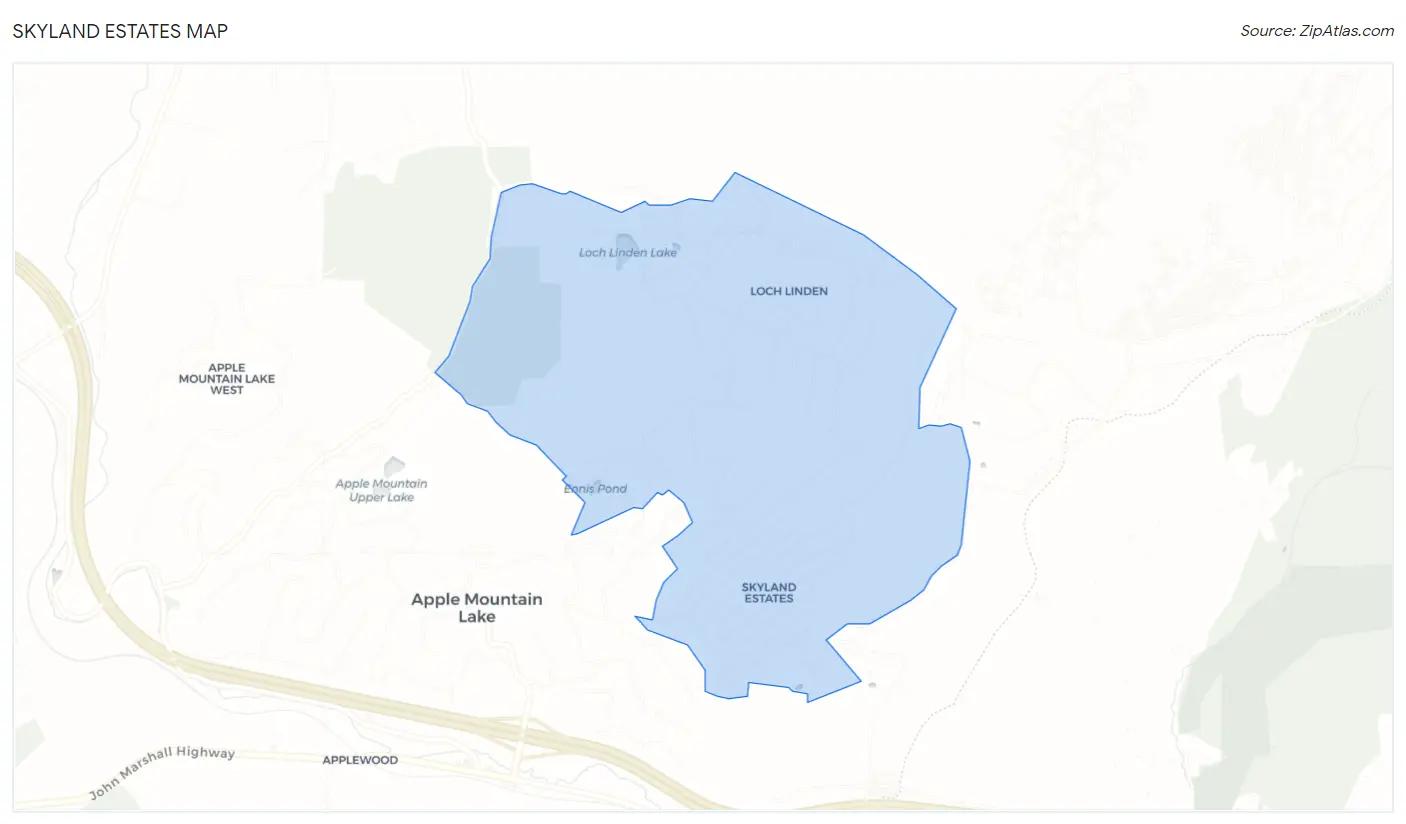
Skyland Estates Overview
$53,208
PER CAPITA INCOME
$105,304
AVG FAMILY INCOME
$106,824
AVG HOUSEHOLD INCOME
0.33
INEQUALITY / GINI INDEX
791
TOTAL POPULATION
457
MALE POPULATION
334
FEMALE POPULATION
136.83
MALES / 100 FEMALES
73.09
FEMALES / 100 MALES
45.6
MEDIAN AGE
2.6
AVG FAMILY SIZE
2.4
AVG HOUSEHOLD SIZE
473
LABOR FORCE [ PEOPLE ]
65.4%
PERCENT IN LABOR FORCE
Income in Skyland Estates
Income Overview in Skyland Estates
Per Capita Income in Skyland Estates is $53,208, while median incomes of families and households are $105,304 and $106,824 respectively.
| Characteristic | Number | Measure |
| Per Capita Income | 791 | $53,208 |
| Median Family Income | 181 | $105,304 |
| Mean Family Income | 181 | $95,305 |
| Median Household Income | 334 | $106,824 |
| Mean Household Income | 334 | $116,213 |
| Income Deficit | 181 | $0 |
| Wage / Income Gap (%) | 791 | 0.00% |
| Wage / Income Gap ($) | 791 | 100.00¢ per $1 |
| Gini / Inequality Index | 791 | 0.33 |
Earnings by Sex in Skyland Estates
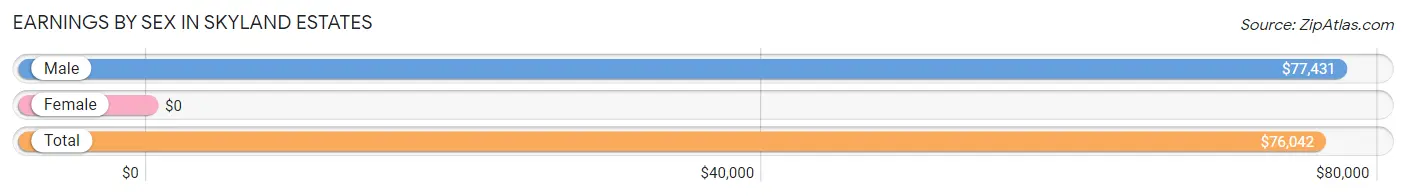
| Sex | Number | Average Earnings |
| Male | 233 (46.9%) | $77,431 |
| Female | 264 (53.1%) | $0 |
| Total | 497 (100.0%) | $76,042 |
Earnings by Sex by Income Bracket in Skyland Estates
The most common earnings brackets in Skyland Estates are $75,000 to $99,999 for men (86 | 36.9%) and $100,000+ for women (68 | 25.8%).
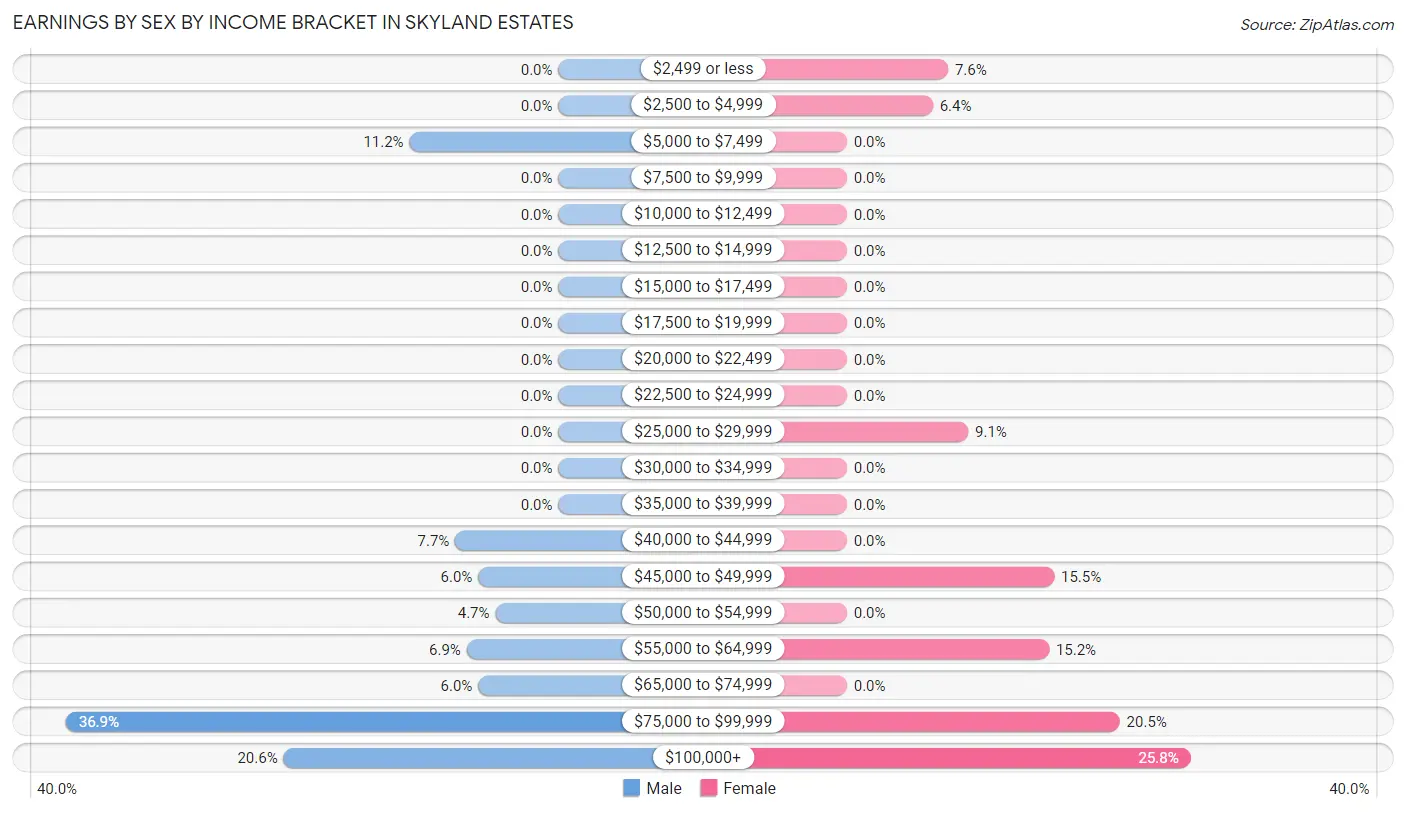
| Income | Male | Female |
| $2,499 or less | 0 (0.0%) | 20 (7.6%) |
| $2,500 to $4,999 | 0 (0.0%) | 17 (6.4%) |
| $5,000 to $7,499 | 26 (11.2%) | 0 (0.0%) |
| $7,500 to $9,999 | 0 (0.0%) | 0 (0.0%) |
| $10,000 to $12,499 | 0 (0.0%) | 0 (0.0%) |
| $12,500 to $14,999 | 0 (0.0%) | 0 (0.0%) |
| $15,000 to $17,499 | 0 (0.0%) | 0 (0.0%) |
| $17,500 to $19,999 | 0 (0.0%) | 0 (0.0%) |
| $20,000 to $22,499 | 0 (0.0%) | 0 (0.0%) |
| $22,500 to $24,999 | 0 (0.0%) | 0 (0.0%) |
| $25,000 to $29,999 | 0 (0.0%) | 24 (9.1%) |
| $30,000 to $34,999 | 0 (0.0%) | 0 (0.0%) |
| $35,000 to $39,999 | 0 (0.0%) | 0 (0.0%) |
| $40,000 to $44,999 | 18 (7.7%) | 0 (0.0%) |
| $45,000 to $49,999 | 14 (6.0%) | 41 (15.5%) |
| $50,000 to $54,999 | 11 (4.7%) | 0 (0.0%) |
| $55,000 to $64,999 | 16 (6.9%) | 40 (15.1%) |
| $65,000 to $74,999 | 14 (6.0%) | 0 (0.0%) |
| $75,000 to $99,999 | 86 (36.9%) | 54 (20.4%) |
| $100,000+ | 48 (20.6%) | 68 (25.8%) |
| Total | 233 (100.0%) | 264 (100.0%) |
Earnings by Sex by Educational Attainment in Skyland Estates
Average earnings in Skyland Estates are $77,431 for men and $88,194 for women, a difference of 12.2%. Men with an educational attainment of high school diploma enjoy the highest average annual earnings of $77,222, while those with college or associate's degree education earn the least with $71,786. Women with an educational attainment of college or associate's degree earn the most with the average annual earnings of $87,894, while those with college or associate's degree education have the smallest earnings of $87,894.
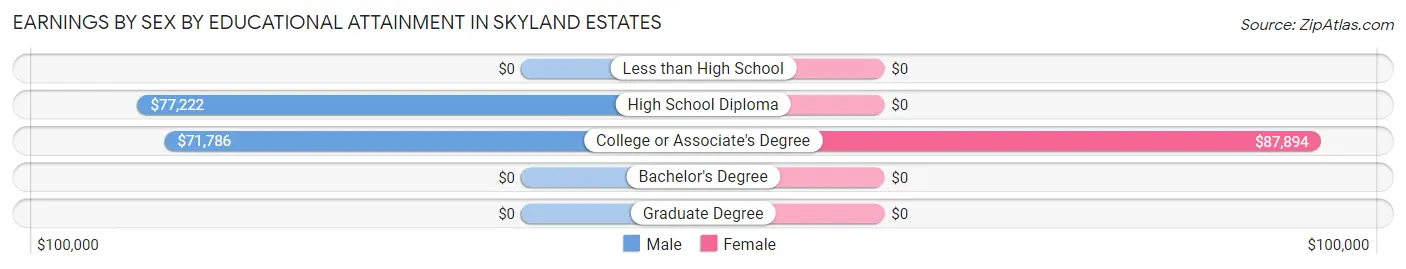
| Educational Attainment | Male Income | Female Income |
| Less than High School | - | - |
| High School Diploma | $77,222 | $0 |
| College or Associate's Degree | $71,786 | $87,894 |
| Bachelor's Degree | - | - |
| Graduate Degree | - | - |
| Total | $77,431 | $88,194 |
Family Income in Skyland Estates
Family Income Brackets in Skyland Estates
According to the Skyland Estates family income data, there are 74 families falling into the $100,000 to $149,999 income range, which is the most common income bracket and makes up 40.9% of all families.
| Income Bracket | # Families | % Families |
| Less than $10,000 | 0 | 0.0% |
| $10,000 to $14,999 | 0 | 0.0% |
| $15,000 to $24,999 | 0 | 0.0% |
| $25,000 to $34,999 | 0 | 0.0% |
| $35,000 to $49,999 | 19 | 10.5% |
| $50,000 to $74,999 | 53 | 29.3% |
| $75,000 to $99,999 | 14 | 7.7% |
| $100,000 to $149,999 | 74 | 40.9% |
| $150,000 to $199,999 | 21 | 11.6% |
| $200,000+ | 0 | 0.0% |
Family Income by Famaliy Size in Skyland Estates
2-person families (131 | 72.4%) account for the highest median family income in Skyland Estates with $106,520 per family, while 2-person families (131 | 72.4%) have the highest median income of $53,260 per family member.
| Income Bracket | # Families | Median Income |
| 2-Person Families | 131 (72.4%) | $106,520 |
| 3-Person Families | 26 (14.4%) | $0 |
| 4-Person Families | 14 (7.7%) | $0 |
| 5-Person Families | 10 (5.5%) | $0 |
| 6-Person Families | 0 (0.0%) | $0 |
| 7+ Person Families | 0 (0.0%) | $0 |
| Total | 181 (100.0%) | $105,304 |
Family Income by Number of Earners in Skyland Estates
| Number of Earners | # Families | Median Income |
| No Earners | 6 (3.3%) | $0 |
| 1 Earner | 99 (54.7%) | $105,764 |
| 2 Earners | 76 (42.0%) | $105,263 |
| 3+ Earners | 0 (0.0%) | $0 |
| Total | 181 (100.0%) | $105,304 |
Household Income in Skyland Estates
Household Income Brackets in Skyland Estates
With 110 households falling in the category, the $100,000 to $149,999 income range is the most frequent in Skyland Estates, accounting for 32.9% of all households.
| Income Bracket | # Households | % Households |
| Less than $10,000 | 7 | 2.1% |
| $10,000 to $14,999 | 0 | 0.0% |
| $15,000 to $24,999 | 0 | 0.0% |
| $25,000 to $34,999 | 0 | 0.0% |
| $35,000 to $49,999 | 33 | 9.9% |
| $50,000 to $74,999 | 86 | 25.7% |
| $75,000 to $99,999 | 14 | 4.2% |
| $100,000 to $149,999 | 110 | 32.9% |
| $150,000 to $199,999 | 61 | 18.3% |
| $200,000+ | 23 | 6.9% |
Household Income by Householder Age in Skyland Estates
The median household income in Skyland Estates is $106,824, with the highest median household income of $112,644 found in the 45 to 64 years age bracket for the primary householder. A total of 154 households (46.1%) fall into this category.
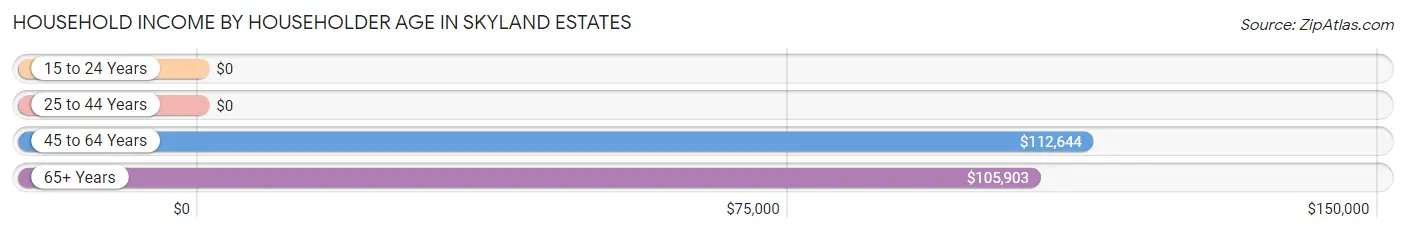
| Income Bracket | # Households | Median Income |
| 15 to 24 Years | 0 (0.0%) | $0 |
| 25 to 44 Years | 115 (34.4%) | $0 |
| 45 to 64 Years | 154 (46.1%) | $112,644 |
| 65+ Years | 65 (19.5%) | $105,903 |
| Total | 334 (100.0%) | $106,824 |
Poverty in Skyland Estates
Income Below Poverty by Sex and Age in Skyland Estates
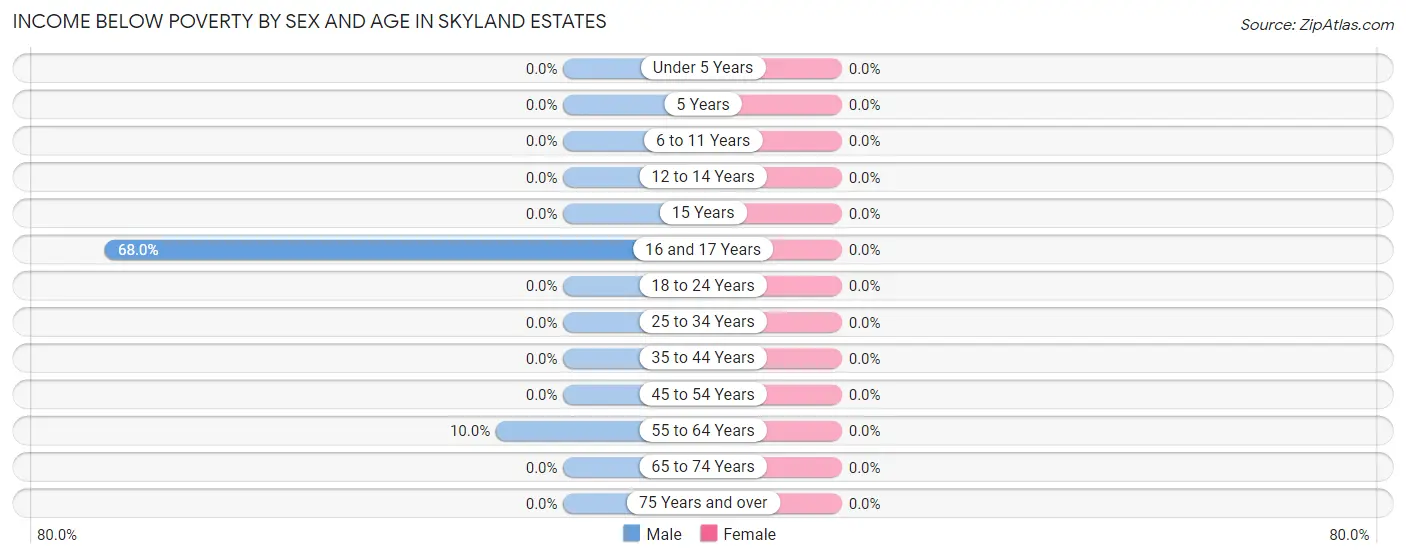
| Age Bracket | Male | Female |
| Under 5 Years | 0 (0.0%) | 0 (0.0%) |
| 5 Years | 0 (0.0%) | 0 (0.0%) |
| 6 to 11 Years | 0 (0.0%) | 0 (0.0%) |
| 12 to 14 Years | 0 (0.0%) | 0 (0.0%) |
| 15 Years | 0 (0.0%) | 0 (0.0%) |
| 16 and 17 Years | 66 (68.0%) | 0 (0.0%) |
| 18 to 24 Years | 0 (0.0%) | 0 (0.0%) |
| 25 to 34 Years | 0 (0.0%) | 0 (0.0%) |
| 35 to 44 Years | 0 (0.0%) | 0 (0.0%) |
| 45 to 54 Years | 0 (0.0%) | 0 (0.0%) |
| 55 to 64 Years | 7 (10.0%) | 0 (0.0%) |
| 65 to 74 Years | 0 (0.0%) | 0 (0.0%) |
| 75 Years and over | 0 (0.0%) | 0 (0.0%) |
| Total | 73 (16.0%) | 0 (0.0%) |
Income Above Poverty by Sex and Age in Skyland Estates
According to the poverty statistics in Skyland Estates, males aged under 5 years and females aged 12 to 14 years are the age groups that are most secure financially, with 100.0% of males and 100.0% of females in these age groups living above the poverty line.
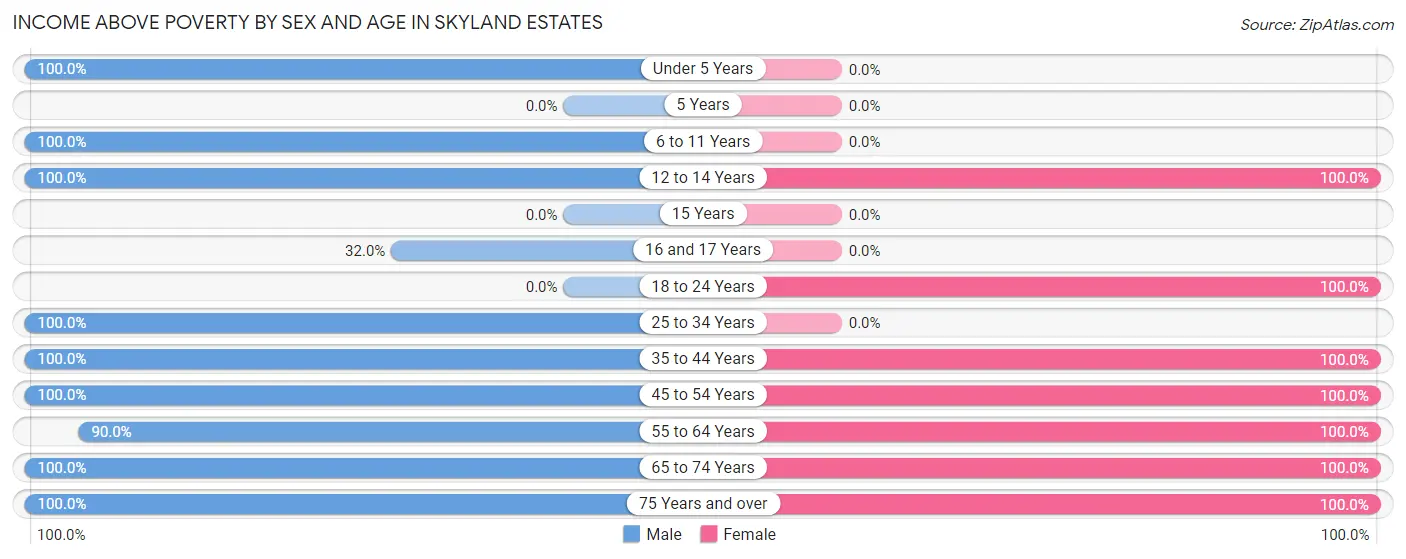
| Age Bracket | Male | Female |
| Under 5 Years | 17 (100.0%) | 0 (0.0%) |
| 5 Years | 0 (0.0%) | 0 (0.0%) |
| 6 to 11 Years | 26 (100.0%) | 0 (0.0%) |
| 12 to 14 Years | 11 (100.0%) | 14 (100.0%) |
| 15 Years | 0 (0.0%) | 0 (0.0%) |
| 16 and 17 Years | 31 (32.0%) | 0 (0.0%) |
| 18 to 24 Years | 0 (0.0%) | 50 (100.0%) |
| 25 to 34 Years | 49 (100.0%) | 0 (0.0%) |
| 35 to 44 Years | 75 (100.0%) | 48 (100.0%) |
| 45 to 54 Years | 47 (100.0%) | 68 (100.0%) |
| 55 to 64 Years | 63 (90.0%) | 121 (100.0%) |
| 65 to 74 Years | 45 (100.0%) | 26 (100.0%) |
| 75 Years and over | 20 (100.0%) | 7 (100.0%) |
| Total | 384 (84.0%) | 334 (100.0%) |
Income Below Poverty Among Married-Couple Families in Skyland Estates
| Children | Above Poverty | Below Poverty |
| No Children | 75 (100.0%) | 0 (0.0%) |
| 1 or 2 Children | 33 (100.0%) | 0 (0.0%) |
| 3 or 4 Children | 10 (100.0%) | 0 (0.0%) |
| 5 or more Children | 0 (0.0%) | 0 (0.0%) |
| Total | 118 (100.0%) | 0 (0.0%) |
Income Below Poverty Among Single-Parent Households in Skyland Estates
| Children | Single Father | Single Mother |
| No Children | 0 (0.0%) | 0 (0.0%) |
| 1 or 2 Children | 0 (0.0%) | 0 (0.0%) |
| 3 or 4 Children | 0 (0.0%) | 0 (0.0%) |
| 5 or more Children | 0 (0.0%) | 0 (0.0%) |
| Total | 0 (0.0%) | 0 (0.0%) |
Income Below Poverty Among Married-Couple vs Single-Parent Households in Skyland Estates
| Children | Married-Couple Families | Single-Parent Households |
| No Children | 0 (0.0%) | 0 (0.0%) |
| 1 or 2 Children | 0 (0.0%) | 0 (0.0%) |
| 3 or 4 Children | 0 (0.0%) | 0 (0.0%) |
| 5 or more Children | 0 (0.0%) | 0 (0.0%) |
| Total | 0 (0.0%) | 0 (0.0%) |
Race in Skyland Estates
The most populous races in Skyland Estates are White / Caucasian (661 | 83.6%), Black / African American (89 | 11.3%), and Two or more Races (41 | 5.2%).
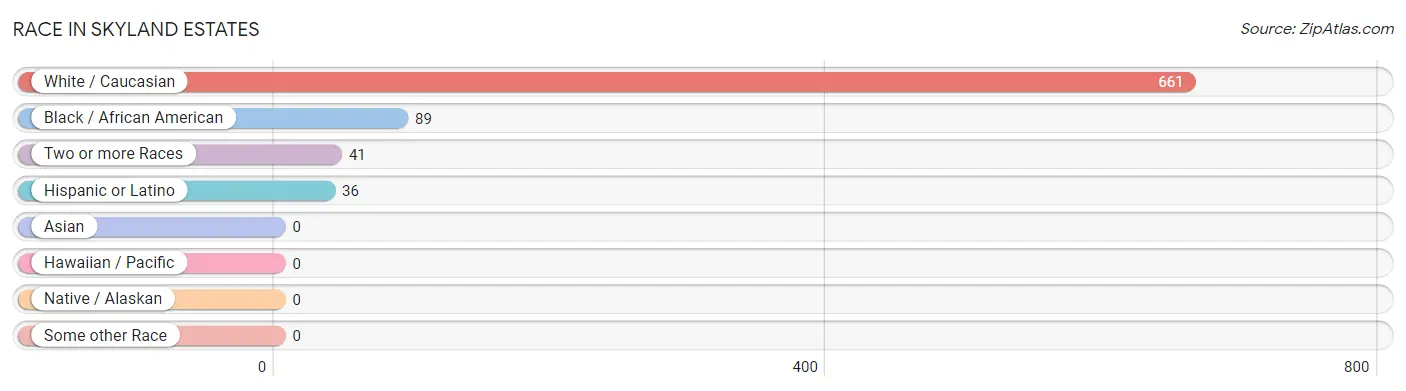
| Race | # Population | % Population |
| Asian | 0 | 0.0% |
| Black / African American | 89 | 11.3% |
| Hawaiian / Pacific | 0 | 0.0% |
| Hispanic or Latino | 36 | 4.5% |
| Native / Alaskan | 0 | 0.0% |
| White / Caucasian | 661 | 83.6% |
| Two or more Races | 41 | 5.2% |
| Some other Race | 0 | 0.0% |
| Total | 791 | 100.0% |
Ancestry in Skyland Estates
The most populous ancestries reported in Skyland Estates are Irish (188 | 23.8%), American (161 | 20.3%), French (114 | 14.4%), German (98 | 12.4%), and English (50 | 6.3%), together accounting for 77.2% of all Skyland Estates residents.
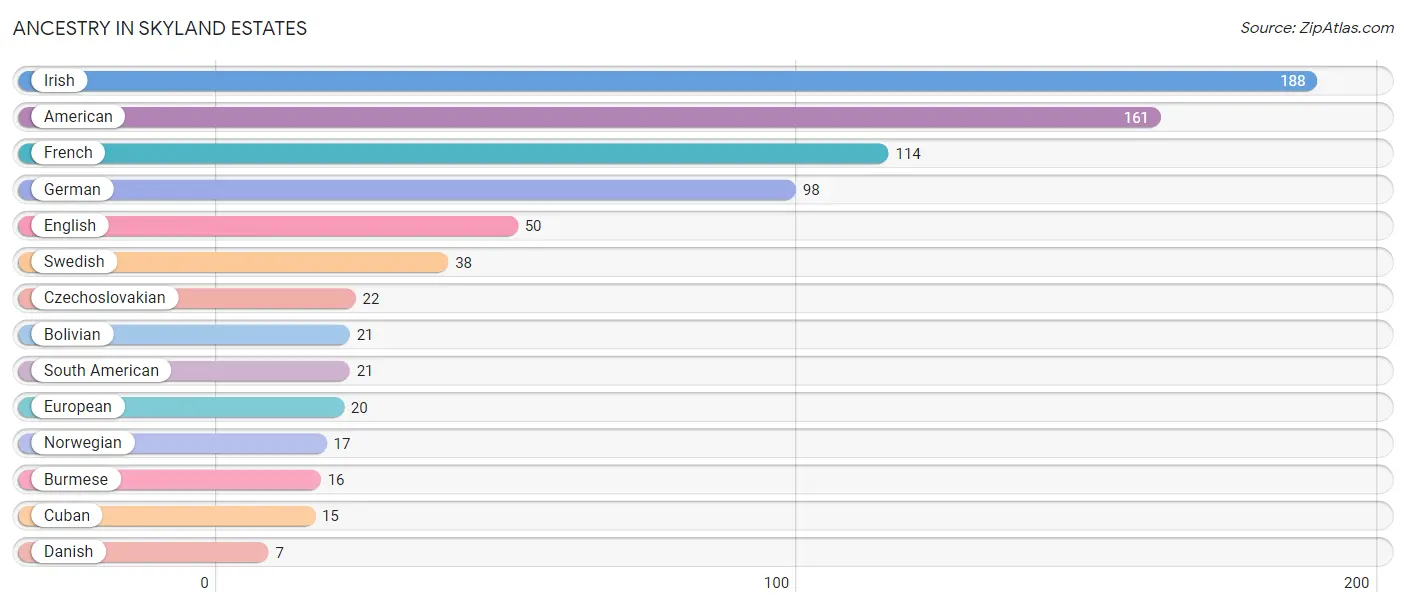
| Ancestry | # Population | % Population |
| American | 161 | 20.3% |
| Bolivian | 21 | 2.6% |
| Burmese | 16 | 2.0% |
| Cuban | 15 | 1.9% |
| Czechoslovakian | 22 | 2.8% |
| Danish | 7 | 0.9% |
| English | 50 | 6.3% |
| European | 20 | 2.5% |
| French | 114 | 14.4% |
| German | 98 | 12.4% |
| Irish | 188 | 23.8% |
| Norwegian | 17 | 2.1% |
| South American | 21 | 2.6% |
| Swedish | 38 | 4.8% | View All 14 Rows |
Immigrants in Skyland Estates
The most numerous immigrant groups reported in Skyland Estates came from Bolivia (21 | 2.6%), Latin America (21 | 2.6%), South America (21 | 2.6%), Europe (20 | 2.5%), and Germany (20 | 2.5%), together accounting for 13.0% of all Skyland Estates residents.
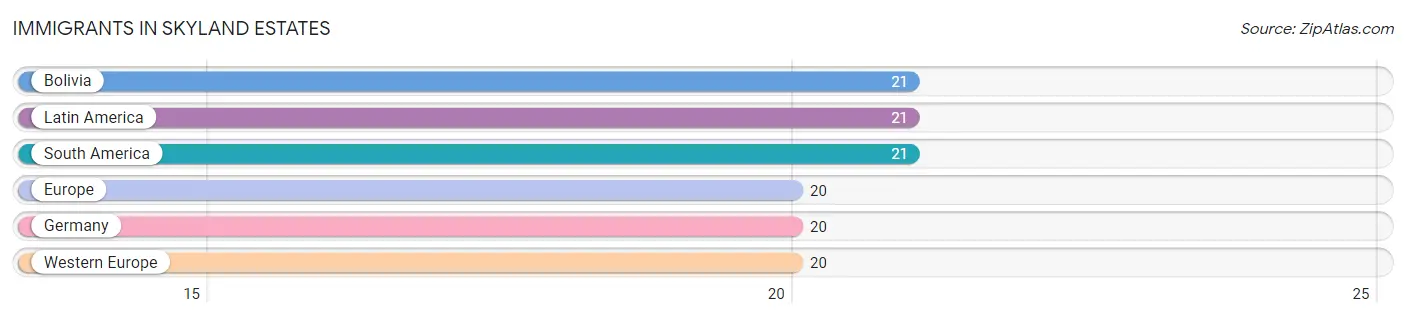
| Immigration Origin | # Population | % Population |
| Bolivia | 21 | 2.6% |
| Europe | 20 | 2.5% |
| Germany | 20 | 2.5% |
| Latin America | 21 | 2.6% |
| South America | 21 | 2.6% |
| Western Europe | 20 | 2.5% | View All 6 Rows |
Sex and Age in Skyland Estates
Sex and Age in Skyland Estates
The most populous age groups in Skyland Estates are 15 to 19 Years (97 | 21.2%) for men and 55 to 59 Years (71 | 21.3%) for women.
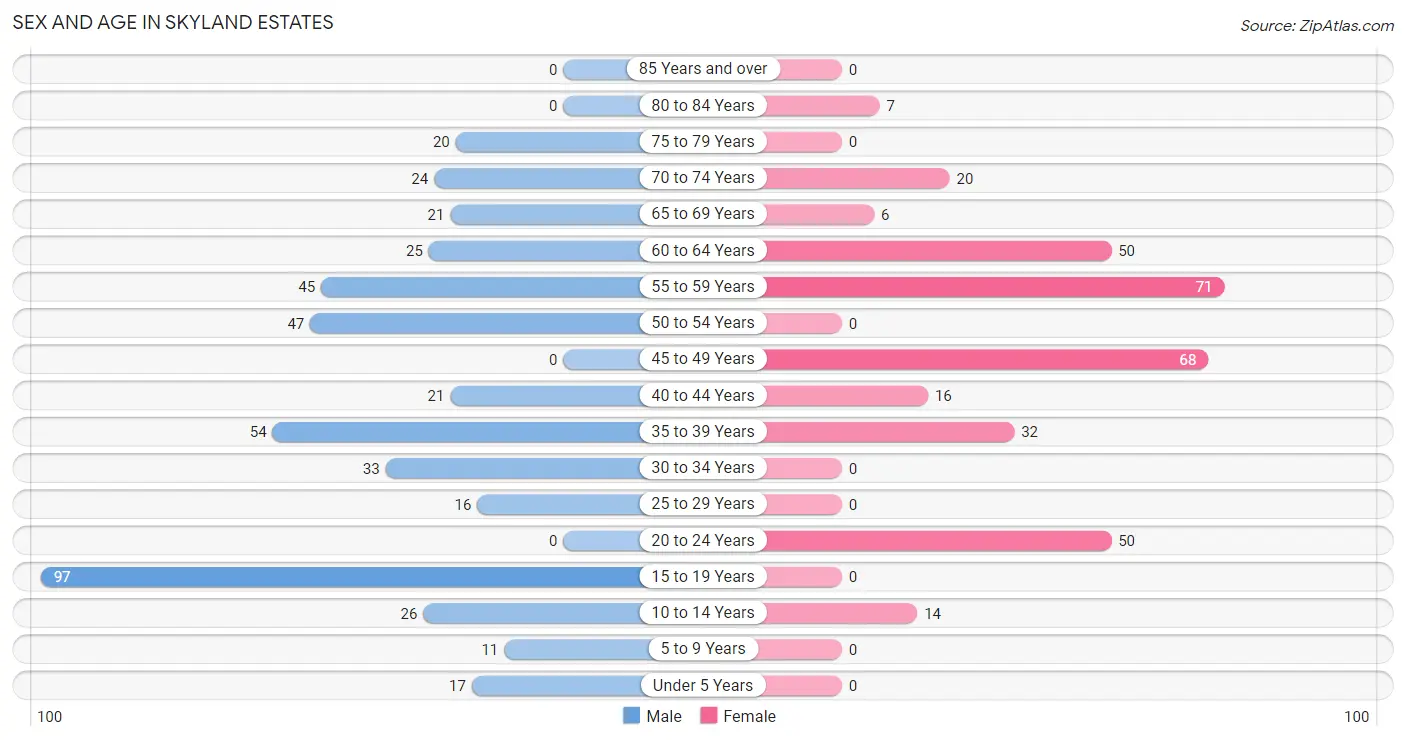
| Age Bracket | Male | Female |
| Under 5 Years | 17 (3.7%) | 0 (0.0%) |
| 5 to 9 Years | 11 (2.4%) | 0 (0.0%) |
| 10 to 14 Years | 26 (5.7%) | 14 (4.2%) |
| 15 to 19 Years | 97 (21.2%) | 0 (0.0%) |
| 20 to 24 Years | 0 (0.0%) | 50 (15.0%) |
| 25 to 29 Years | 16 (3.5%) | 0 (0.0%) |
| 30 to 34 Years | 33 (7.2%) | 0 (0.0%) |
| 35 to 39 Years | 54 (11.8%) | 32 (9.6%) |
| 40 to 44 Years | 21 (4.6%) | 16 (4.8%) |
| 45 to 49 Years | 0 (0.0%) | 68 (20.4%) |
| 50 to 54 Years | 47 (10.3%) | 0 (0.0%) |
| 55 to 59 Years | 45 (9.9%) | 71 (21.3%) |
| 60 to 64 Years | 25 (5.5%) | 50 (15.0%) |
| 65 to 69 Years | 21 (4.6%) | 6 (1.8%) |
| 70 to 74 Years | 24 (5.2%) | 20 (6.0%) |
| 75 to 79 Years | 20 (4.4%) | 0 (0.0%) |
| 80 to 84 Years | 0 (0.0%) | 7 (2.1%) |
| 85 Years and over | 0 (0.0%) | 0 (0.0%) |
| Total | 457 (100.0%) | 334 (100.0%) |
Families and Households in Skyland Estates
Median Family Size in Skyland Estates
The median family size in Skyland Estates is 2.64 persons per family, with married-couple families (118 | 65.2%) accounting for the largest median family size of 2.82 persons per family. On the other hand, single male/father families (21 | 11.6%) represent the smallest median family size with 2.05 persons per family.
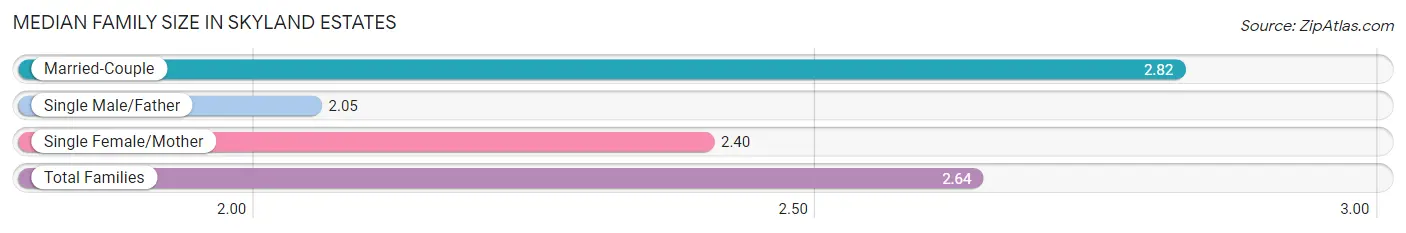
| Family Type | # Families | Family Size |
| Married-Couple | 118 (65.2%) | 2.82 |
| Single Male/Father | 21 (11.6%) | 2.05 |
| Single Female/Mother | 42 (23.2%) | 2.40 |
| Total Families | 181 (100.0%) | 2.64 |
Median Household Size in Skyland Estates
The median household size in Skyland Estates is 2.37 persons per household, with single female/mother households (42 | 12.6%) accounting for the largest median household size of 3.38 persons per household. non-family households (153 | 45.8%) represent the smallest median household size with 1.78 persons per household.
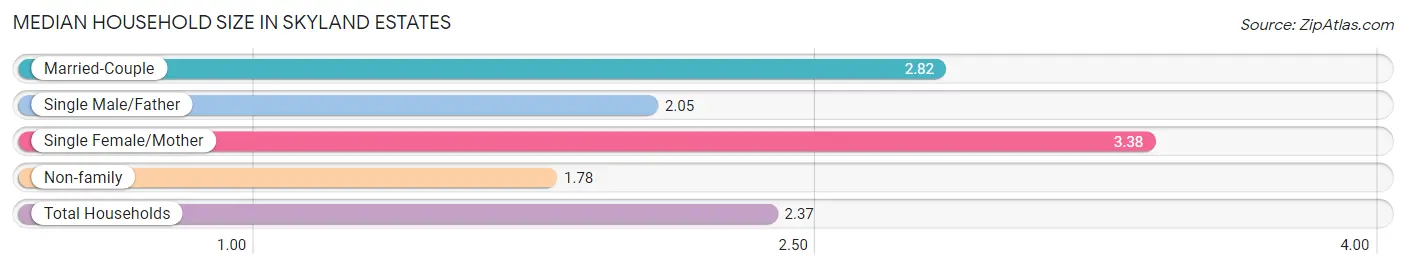
| Household Type | # Households | Household Size |
| Married-Couple | 118 (35.3%) | 2.82 |
| Single Male/Father | 21 (6.3%) | 2.05 |
| Single Female/Mother | 42 (12.6%) | 3.38 |
| Non-family | 153 (45.8%) | 1.78 |
| Total Households | 334 (100.0%) | 2.37 |
Household Size by Marriage Status in Skyland Estates
Out of a total of 334 households in Skyland Estates, 181 (54.2%) are family households, while 153 (45.8%) are nonfamily households. The most numerous type of family households are 2-person households, comprising 115, and the most common type of nonfamily households are 1-person households, comprising 113.
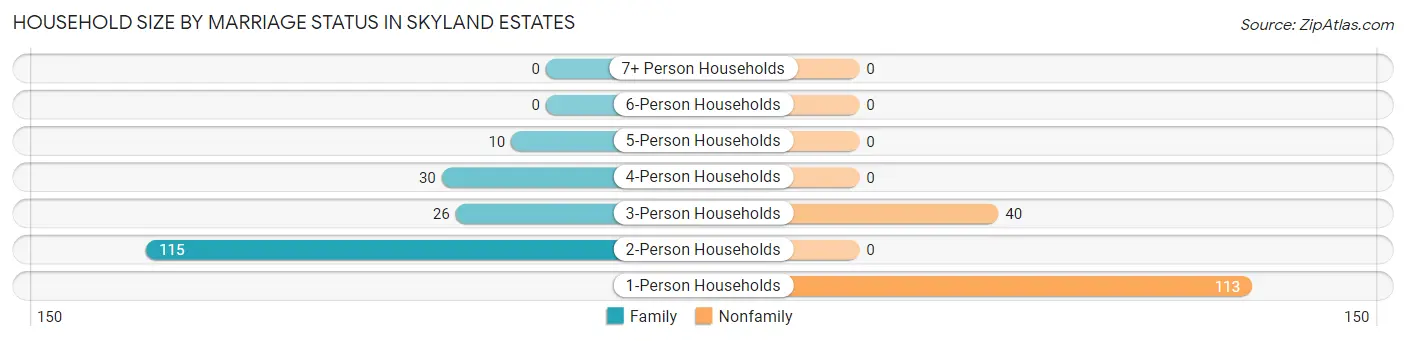
| Household Size | Family Households | Nonfamily Households |
| 1-Person Households | - | 113 (33.8%) |
| 2-Person Households | 115 (34.4%) | 0 (0.0%) |
| 3-Person Households | 26 (7.8%) | 40 (12.0%) |
| 4-Person Households | 30 (9.0%) | 0 (0.0%) |
| 5-Person Households | 10 (3.0%) | 0 (0.0%) |
| 6-Person Households | 0 (0.0%) | 0 (0.0%) |
| 7+ Person Households | 0 (0.0%) | 0 (0.0%) |
| Total | 181 (54.2%) | 153 (45.8%) |
Female Fertility in Skyland Estates
Fertility by Age in Skyland Estates
| Age Bracket | Women with Births | Births / 1,000 Women |
| 15 to 19 years | 0 (0.0%) | 0.0 |
| 20 to 34 years | 0 (0.0%) | 0.0 |
| 35 to 50 years | 0 (0.0%) | 0.0 |
| Total | 0 (0.0%) | 0.0 |
Fertility by Age by Marriage Status in Skyland Estates
| Age Bracket | Married | Unmarried |
| 15 to 19 years | 0 (0.0%) | 0 (0.0%) |
| 20 to 34 years | 0 (0.0%) | 0 (0.0%) |
| 35 to 50 years | 0 (0.0%) | 0 (0.0%) |
| Total | 0 (0.0%) | 0 (0.0%) |
Fertility by Education in Skyland Estates
| Educational Attainment | Women with Births | Births / 1,000 Women |
| Less than High School | 0 (0.0%) | 0.0 |
| High School Diploma | 0 (0.0%) | 0.0 |
| College or Associate's Degree | 0 (0.0%) | 0.0 |
| Bachelor's Degree | 0 (0.0%) | 0.0 |
| Graduate Degree | 0 (0.0%) | 0.0 |
| Total | 0 (0.0%) | 0.0 |
Fertility by Education by Marriage Status in Skyland Estates
| Educational Attainment | Married | Unmarried |
| Less than High School | 0 (0.0%) | 0 (0.0%) |
| High School Diploma | 0 (0.0%) | 0 (0.0%) |
| College or Associate's Degree | 0 (0.0%) | 0 (0.0%) |
| Bachelor's Degree | 0 (0.0%) | 0 (0.0%) |
| Graduate Degree | 0 (0.0%) | 0 (0.0%) |
| Total | 0 (0.0%) | 0 (0.0%) |
Employment Characteristics in Skyland Estates
Employment by Class of Employer in Skyland Estates
Among the 473 employed individuals in Skyland Estates, private company employees (303 | 64.1%), self-employed (not incorporated) (69 | 14.6%), and state government employees (40 | 8.5%) make up the most common classes of employment.
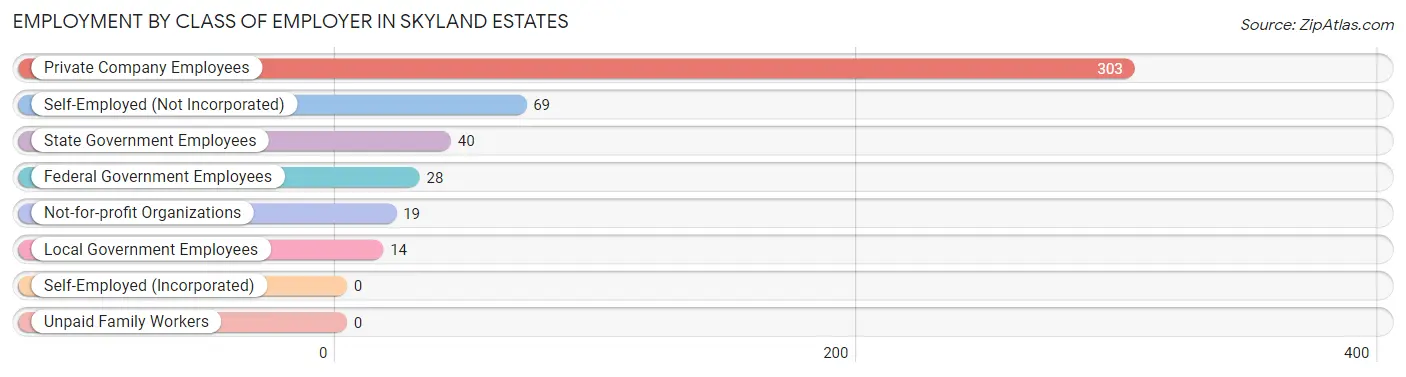
| Employer Class | # Employees | % Employees |
| Private Company Employees | 303 | 64.1% |
| Self-Employed (Incorporated) | 0 | 0.0% |
| Self-Employed (Not Incorporated) | 69 | 14.6% |
| Not-for-profit Organizations | 19 | 4.0% |
| Local Government Employees | 14 | 3.0% |
| State Government Employees | 40 | 8.5% |
| Federal Government Employees | 28 | 5.9% |
| Unpaid Family Workers | 0 | 0.0% |
| Total | 473 | 100.0% |
Employment Status by Age in Skyland Estates
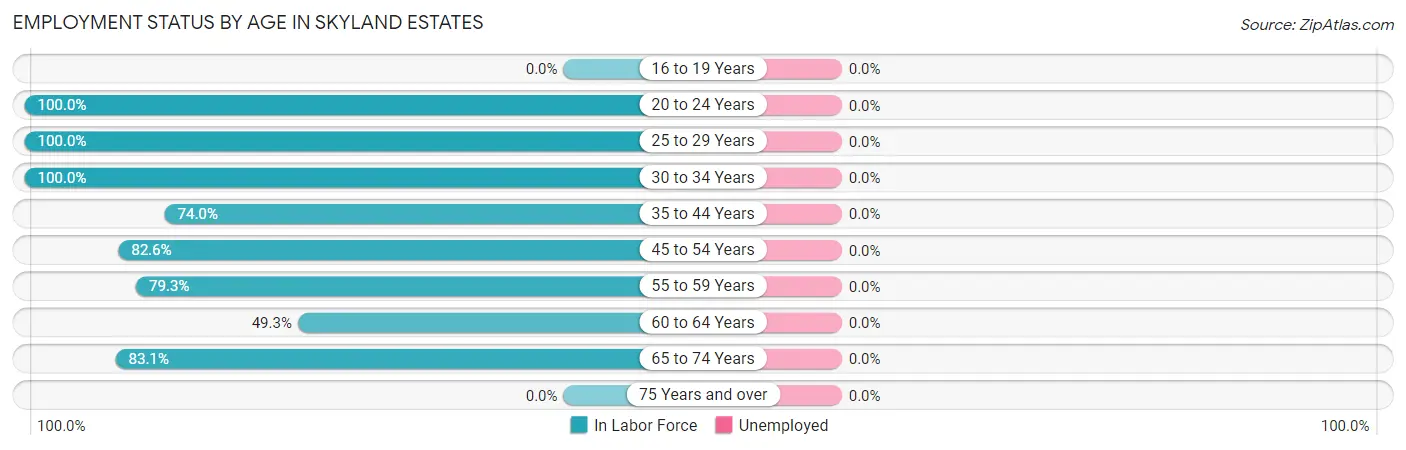
| Age Bracket | In Labor Force | Unemployed |
| 16 to 19 Years | 0 (0.0%) | 0 (0.0%) |
| 20 to 24 Years | 50 (100.0%) | 0 (0.0%) |
| 25 to 29 Years | 16 (100.0%) | 0 (0.0%) |
| 30 to 34 Years | 33 (100.0%) | 0 (0.0%) |
| 35 to 44 Years | 91 (74.0%) | 0 (0.0%) |
| 45 to 54 Years | 95 (82.6%) | 0 (0.0%) |
| 55 to 59 Years | 92 (79.3%) | 0 (0.0%) |
| 60 to 64 Years | 37 (49.3%) | 0 (0.0%) |
| 65 to 74 Years | 59 (83.1%) | 0 (0.0%) |
| 75 Years and over | 0 (0.0%) | 0 (0.0%) |
| Total | 473 (65.4%) | 0 (0.0%) |
Employment Status by Educational Attainment in Skyland Estates
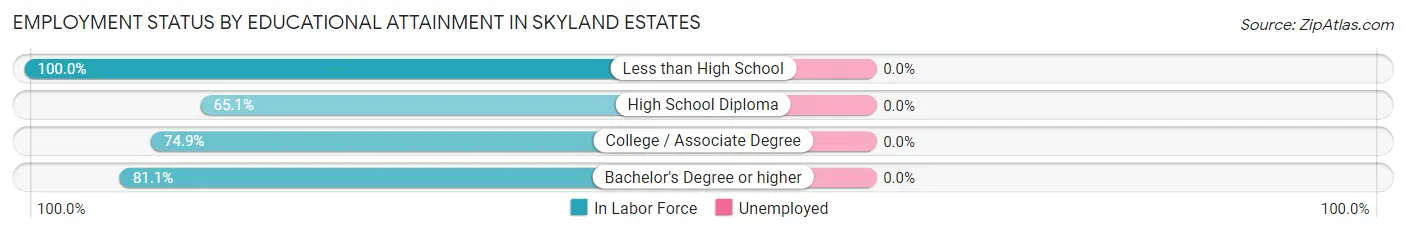
| Educational Attainment | In Labor Force | Unemployed |
| Less than High School | 30 (100.0%) | 0 (0.0%) |
| High School Diploma | 54 (65.1%) | 0 (0.0%) |
| College / Associate Degree | 194 (74.9%) | 0 (0.0%) |
| Bachelor's Degree or higher | 86 (81.1%) | 0 (0.0%) |
| Total | 364 (76.2%) | 0 (0.0%) |
Employment Occupations by Sex in Skyland Estates
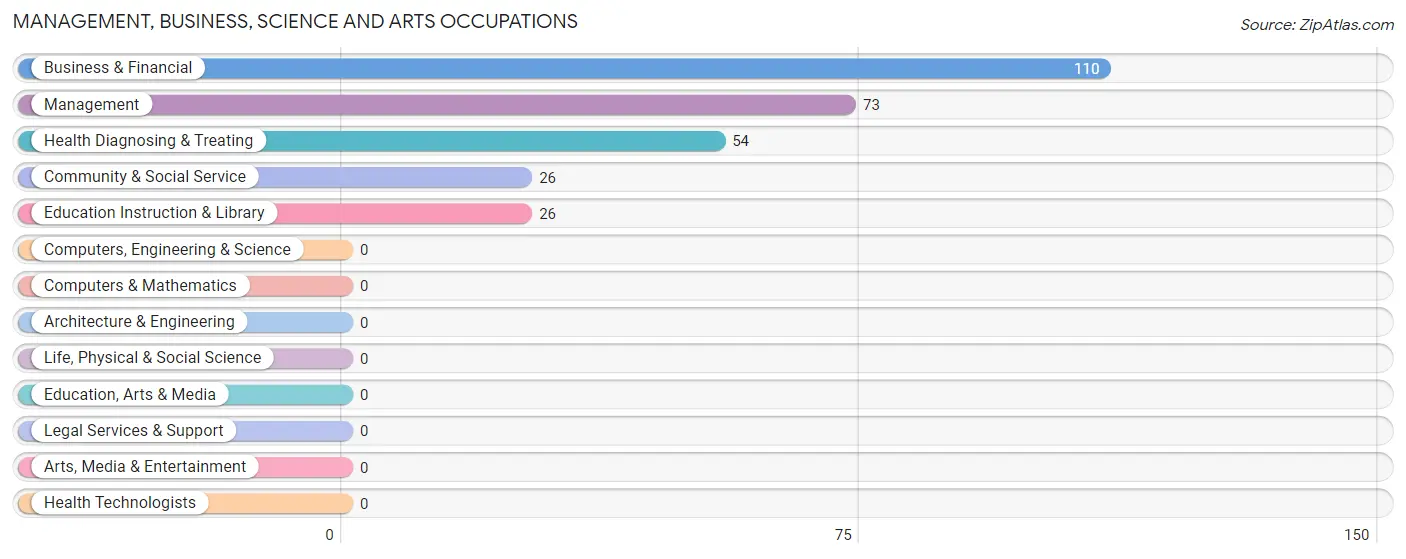
Management, Business, Science and Arts Occupations
The most common Management, Business, Science and Arts occupations in Skyland Estates are Business & Financial (110 | 23.3%), Management (73 | 15.4%), Health Diagnosing & Treating (54 | 11.4%), Community & Social Service (26 | 5.5%), and Education Instruction & Library (26 | 5.5%).
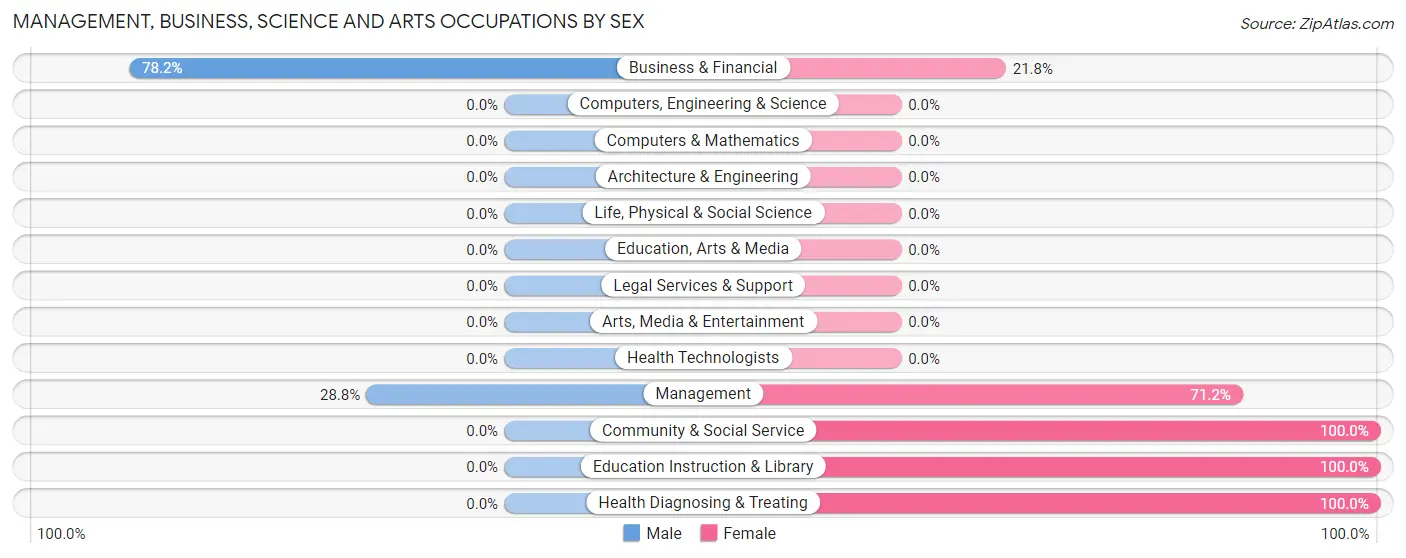
Management, Business, Science and Arts Occupations by Sex
Within the Management, Business, Science and Arts occupations in Skyland Estates, the most male-oriented occupations are Business & Financial (78.2%), and Management (28.8%), while the most female-oriented occupations are Community & Social Service (100.0%), Education Instruction & Library (100.0%), and Health Diagnosing & Treating (100.0%).
| Occupation | Male | Female |
| Management | 21 (28.8%) | 52 (71.2%) |
| Business & Financial | 86 (78.2%) | 24 (21.8%) |
| Computers, Engineering & Science | 0 (0.0%) | 0 (0.0%) |
| Computers & Mathematics | 0 (0.0%) | 0 (0.0%) |
| Architecture & Engineering | 0 (0.0%) | 0 (0.0%) |
| Life, Physical & Social Science | 0 (0.0%) | 0 (0.0%) |
| Community & Social Service | 0 (0.0%) | 26 (100.0%) |
| Education, Arts & Media | 0 (0.0%) | 0 (0.0%) |
| Legal Services & Support | 0 (0.0%) | 0 (0.0%) |
| Education Instruction & Library | 0 (0.0%) | 26 (100.0%) |
| Arts, Media & Entertainment | 0 (0.0%) | 0 (0.0%) |
| Health Diagnosing & Treating | 0 (0.0%) | 54 (100.0%) |
| Health Technologists | 0 (0.0%) | 0 (0.0%) |
| Total (Category) | 107 (40.7%) | 156 (59.3%) |
| Total (Overall) | 226 (47.8%) | 247 (52.2%) |
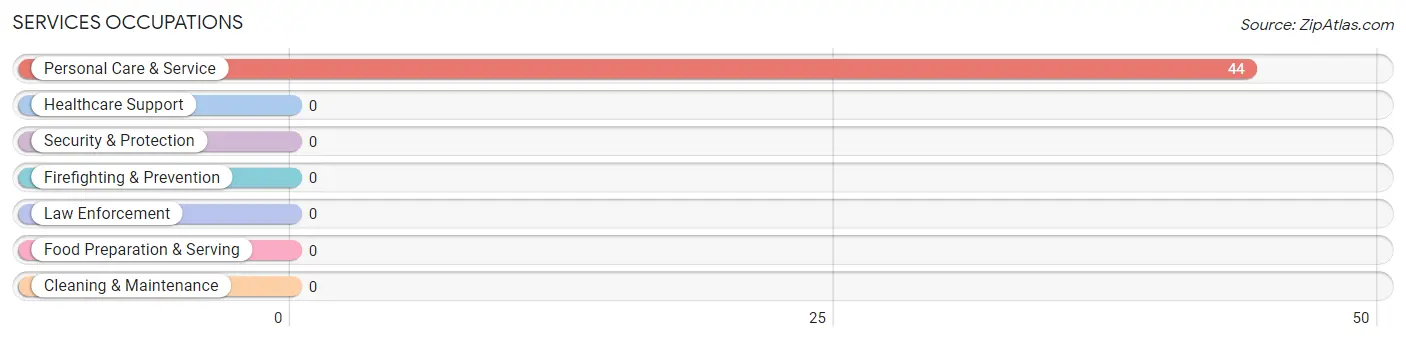
Services Occupations
The most common Services occupations in Skyland Estates are , and Personal Care & Service (44 | 9.3%).
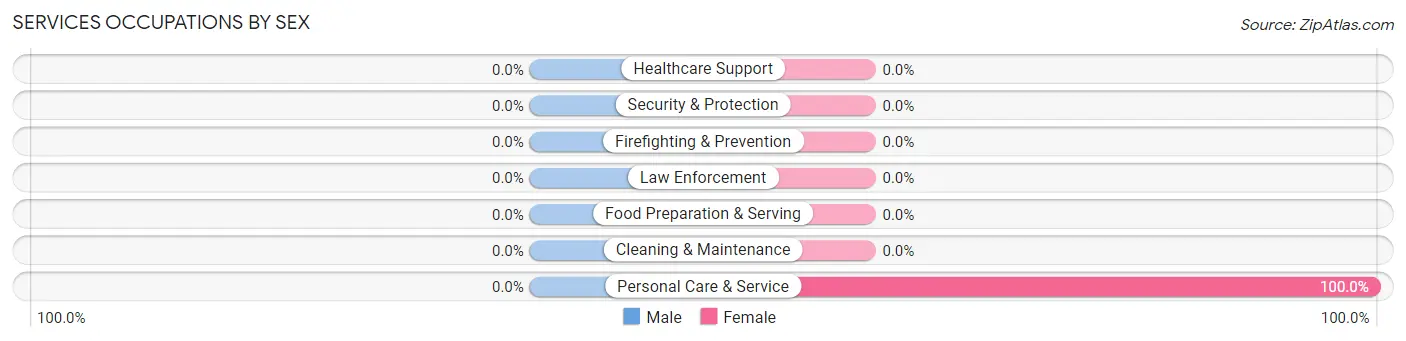
Services Occupations by Sex
| Occupation | Male | Female |
| Healthcare Support | 0 (0.0%) | 0 (0.0%) |
| Security & Protection | 0 (0.0%) | 0 (0.0%) |
| Firefighting & Prevention | 0 (0.0%) | 0 (0.0%) |
| Law Enforcement | 0 (0.0%) | 0 (0.0%) |
| Food Preparation & Serving | 0 (0.0%) | 0 (0.0%) |
| Cleaning & Maintenance | 0 (0.0%) | 0 (0.0%) |
| Personal Care & Service | 0 (0.0%) | 44 (100.0%) |
| Total (Category) | 0 (0.0%) | 44 (100.0%) |
| Total (Overall) | 226 (47.8%) | 247 (52.2%) |
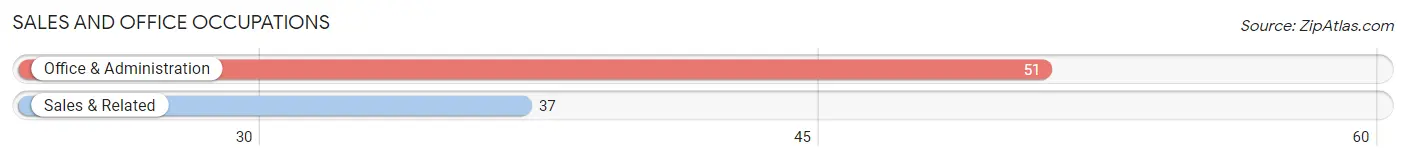
Sales and Office Occupations
The most common Sales and Office occupations in Skyland Estates are Office & Administration (51 | 10.8%), and Sales & Related (37 | 7.8%).
Sales and Office Occupations by Sex
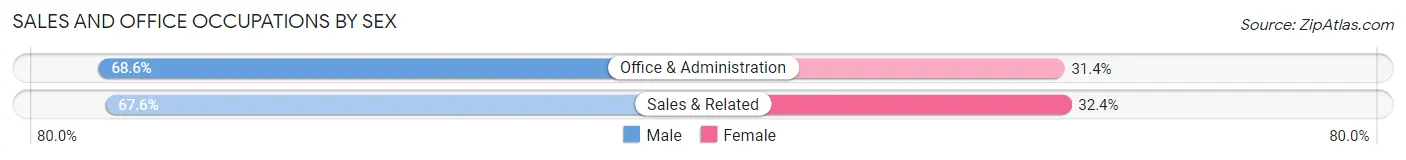
| Occupation | Male | Female |
| Sales & Related | 25 (67.6%) | 12 (32.4%) |
| Office & Administration | 35 (68.6%) | 16 (31.4%) |
| Total (Category) | 60 (68.2%) | 28 (31.8%) |
| Total (Overall) | 226 (47.8%) | 247 (52.2%) |
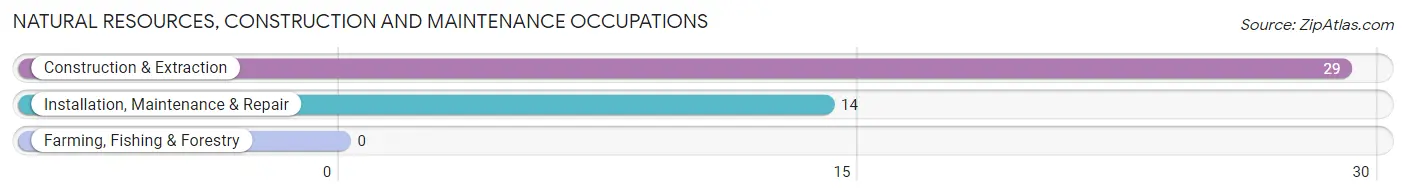
Natural Resources, Construction and Maintenance Occupations
The most common Natural Resources, Construction and Maintenance occupations in Skyland Estates are Construction & Extraction (29 | 6.1%), and Installation, Maintenance & Repair (14 | 3.0%).
Natural Resources, Construction and Maintenance Occupations by Sex
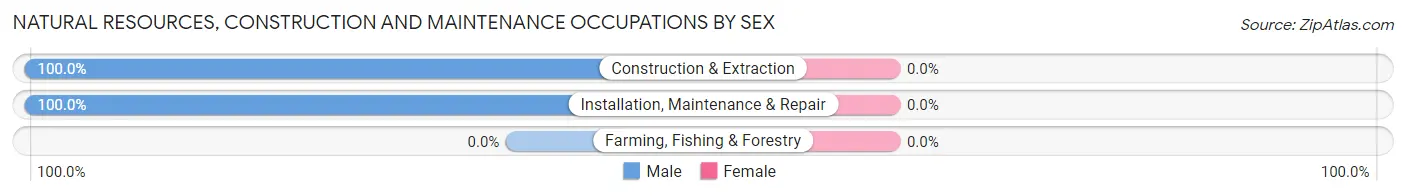
| Occupation | Male | Female |
| Farming, Fishing & Forestry | 0 (0.0%) | 0 (0.0%) |
| Construction & Extraction | 29 (100.0%) | 0 (0.0%) |
| Installation, Maintenance & Repair | 14 (100.0%) | 0 (0.0%) |
| Total (Category) | 43 (100.0%) | 0 (0.0%) |
| Total (Overall) | 226 (47.8%) | 247 (52.2%) |
Production, Transportation and Moving Occupations
The most common Production, Transportation and Moving occupations in Skyland Estates are Material Moving (19 | 4.0%), and Transportation (16 | 3.4%).
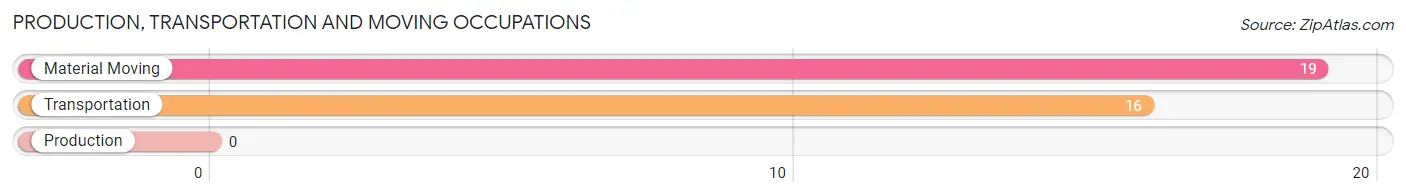
Production, Transportation and Moving Occupations by Sex
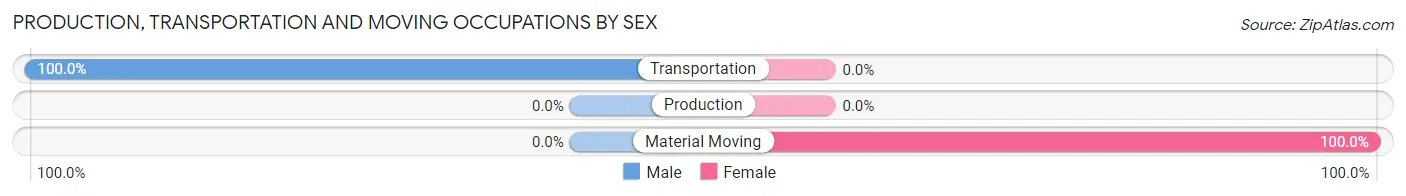
| Occupation | Male | Female |
| Production | 0 (0.0%) | 0 (0.0%) |
| Transportation | 16 (100.0%) | 0 (0.0%) |
| Material Moving | 0 (0.0%) | 19 (100.0%) |
| Total (Category) | 16 (45.7%) | 19 (54.3%) |
| Total (Overall) | 226 (47.8%) | 247 (52.2%) |
Employment Industries by Sex in Skyland Estates
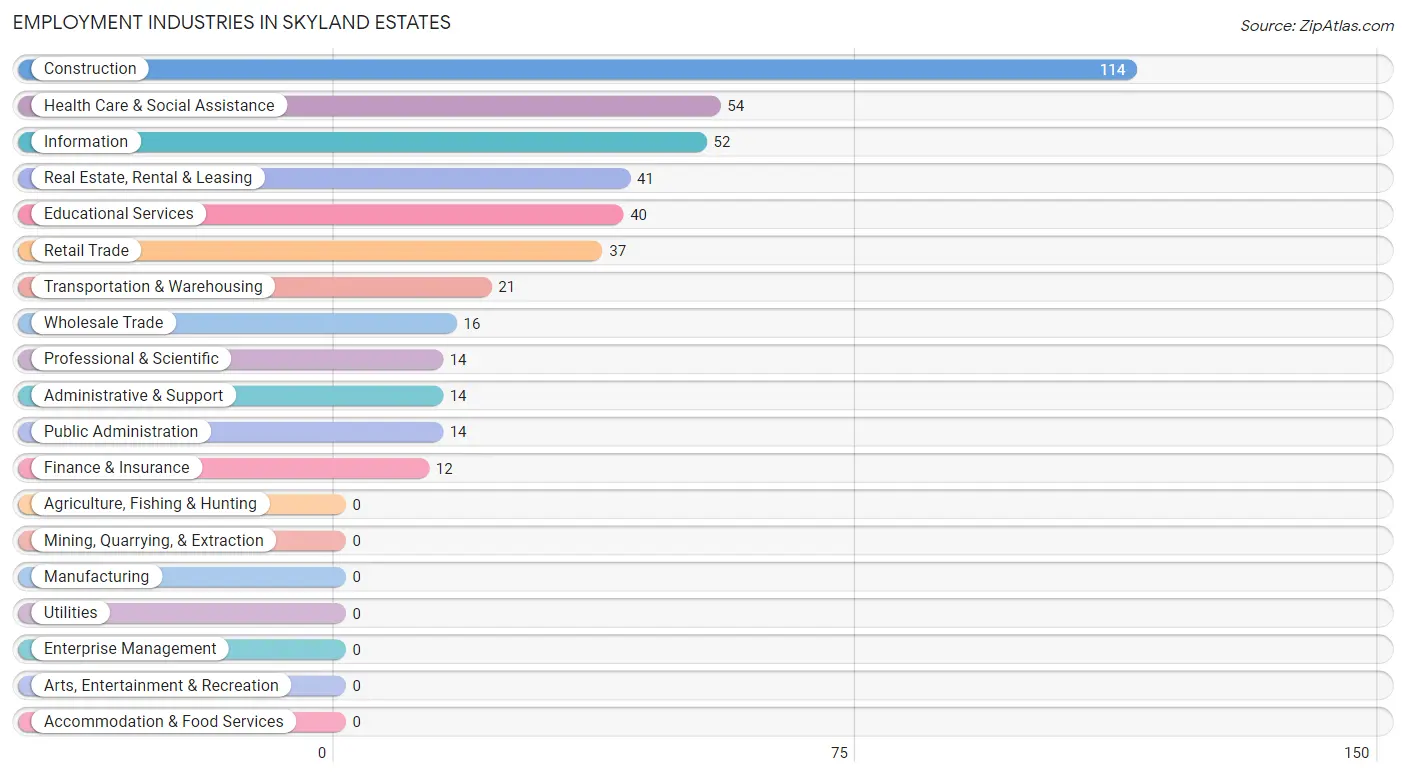
Employment Industries in Skyland Estates
The major employment industries in Skyland Estates include Construction (114 | 24.1%), Health Care & Social Assistance (54 | 11.4%), Information (52 | 11.0%), Real Estate, Rental & Leasing (41 | 8.7%), and Educational Services (40 | 8.5%).
Employment Industries by Sex in Skyland Estates
The Skyland Estates industries that see more men than women are Wholesale Trade (100.0%), Transportation & Warehousing (100.0%), and Real Estate, Rental & Leasing (100.0%), whereas the industries that tend to have a higher number of women are Information (100.0%), Finance & Insurance (100.0%), and Health Care & Social Assistance (100.0%).
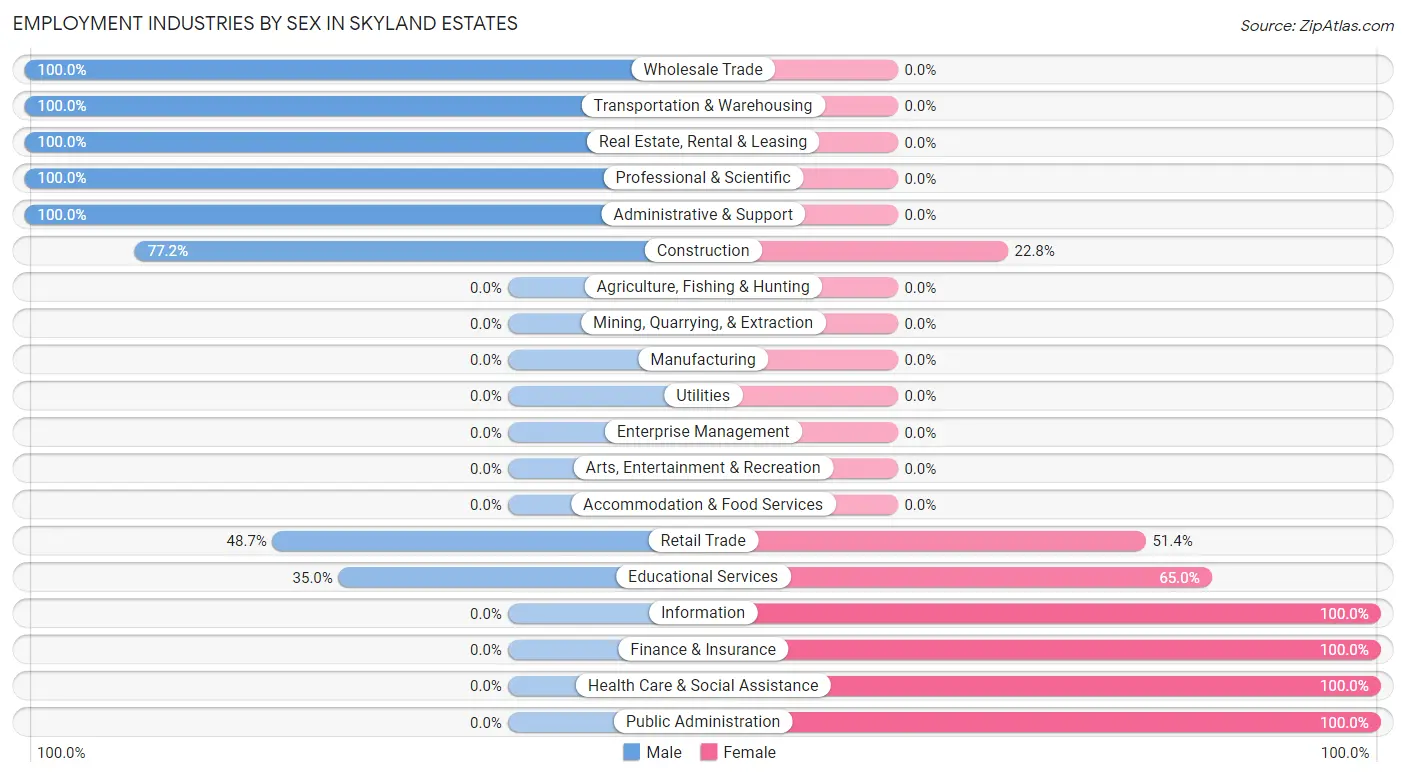
| Industry | Male | Female |
| Agriculture, Fishing & Hunting | 0 (0.0%) | 0 (0.0%) |
| Mining, Quarrying, & Extraction | 0 (0.0%) | 0 (0.0%) |
| Construction | 88 (77.2%) | 26 (22.8%) |
| Manufacturing | 0 (0.0%) | 0 (0.0%) |
| Wholesale Trade | 16 (100.0%) | 0 (0.0%) |
| Retail Trade | 18 (48.6%) | 19 (51.3%) |
| Transportation & Warehousing | 21 (100.0%) | 0 (0.0%) |
| Utilities | 0 (0.0%) | 0 (0.0%) |
| Information | 0 (0.0%) | 52 (100.0%) |
| Finance & Insurance | 0 (0.0%) | 12 (100.0%) |
| Real Estate, Rental & Leasing | 41 (100.0%) | 0 (0.0%) |
| Professional & Scientific | 14 (100.0%) | 0 (0.0%) |
| Enterprise Management | 0 (0.0%) | 0 (0.0%) |
| Administrative & Support | 14 (100.0%) | 0 (0.0%) |
| Educational Services | 14 (35.0%) | 26 (65.0%) |
| Health Care & Social Assistance | 0 (0.0%) | 54 (100.0%) |
| Arts, Entertainment & Recreation | 0 (0.0%) | 0 (0.0%) |
| Accommodation & Food Services | 0 (0.0%) | 0 (0.0%) |
| Public Administration | 0 (0.0%) | 14 (100.0%) |
| Total | 226 (47.8%) | 247 (52.2%) |
Education in Skyland Estates
School Enrollment in Skyland Estates
The most common levels of schooling among the 99 students in Skyland Estates are high school (56 | 56.6%), elementary school (26 | 26.3%), and nursery / preschool (17 | 17.2%).
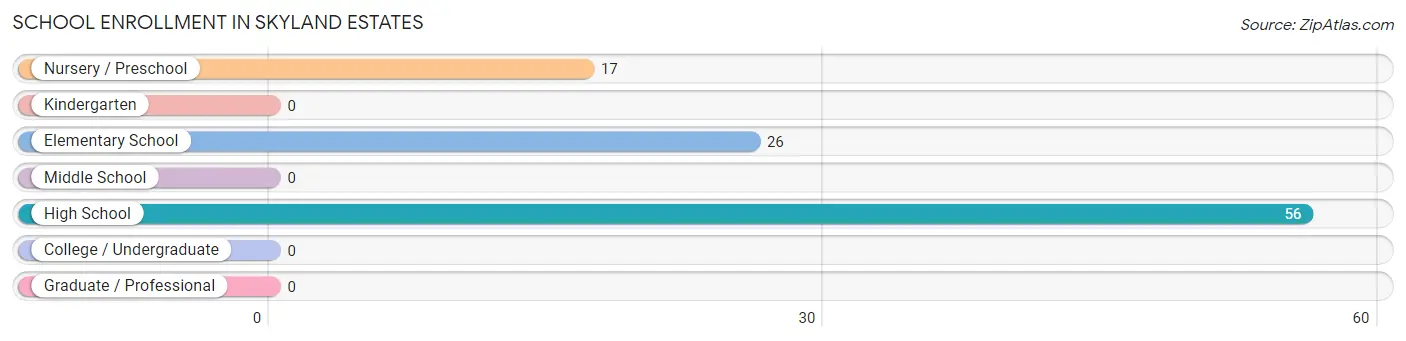
| School Level | # Students | % Students |
| Nursery / Preschool | 17 | 17.2% |
| Kindergarten | 0 | 0.0% |
| Elementary School | 26 | 26.3% |
| Middle School | 0 | 0.0% |
| High School | 56 | 56.6% |
| College / Undergraduate | 0 | 0.0% |
| Graduate / Professional | 0 | 0.0% |
| Total | 99 | 100.0% |
School Enrollment by Age by Funding Source in Skyland Estates
Out of a total of 99 students who are enrolled in schools in Skyland Estates, 17 (17.2%) attend a private institution, while the remaining 82 (82.8%) are enrolled in public schools. The age group of 3 to 4 year olds has the highest likelihood of being enrolled in private schools, with 17 (100.0% in the age bracket) enrolled. Conversely, the age group of 5 to 9 year old has the lowest likelihood of being enrolled in a private school, with 11 (100.0% in the age bracket) attending a public institution.
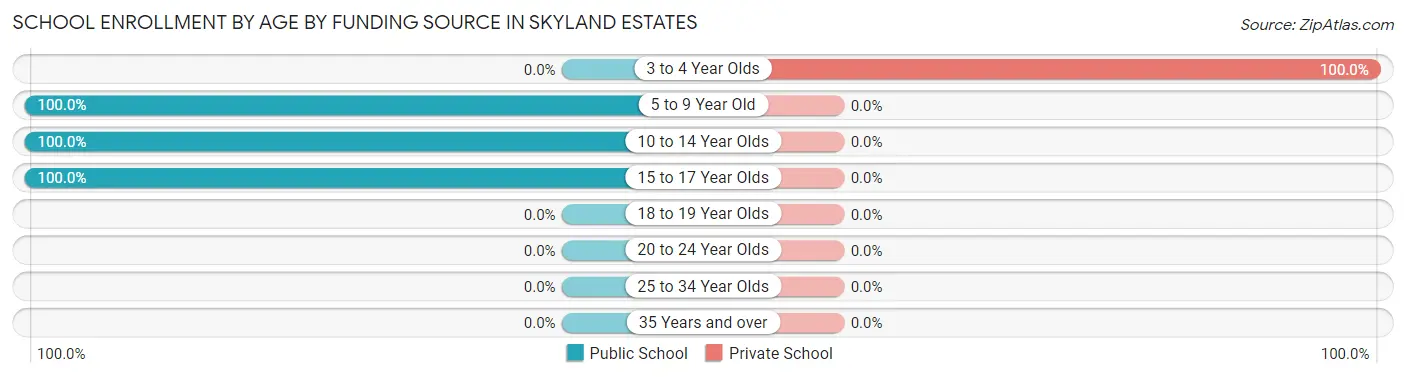
| Age Bracket | Public School | Private School |
| 3 to 4 Year Olds | 0 (0.0%) | 17 (100.0%) |
| 5 to 9 Year Old | 11 (100.0%) | 0 (0.0%) |
| 10 to 14 Year Olds | 40 (100.0%) | 0 (0.0%) |
| 15 to 17 Year Olds | 31 (100.0%) | 0 (0.0%) |
| 18 to 19 Year Olds | 0 (0.0%) | 0 (0.0%) |
| 20 to 24 Year Olds | 0 (0.0%) | 0 (0.0%) |
| 25 to 34 Year Olds | 0 (0.0%) | 0 (0.0%) |
| 35 Years and over | 0 (0.0%) | 0 (0.0%) |
| Total | 82 (82.8%) | 17 (17.2%) |
Educational Attainment by Field of Study in Skyland Estates
Business (79 | 69.9%), computers & mathematics (20 | 17.7%), social sciences (7 | 6.2%), and arts & humanities (7 | 6.2%) are the most common fields of study among 113 individuals in Skyland Estates who have obtained a bachelor's degree or higher.
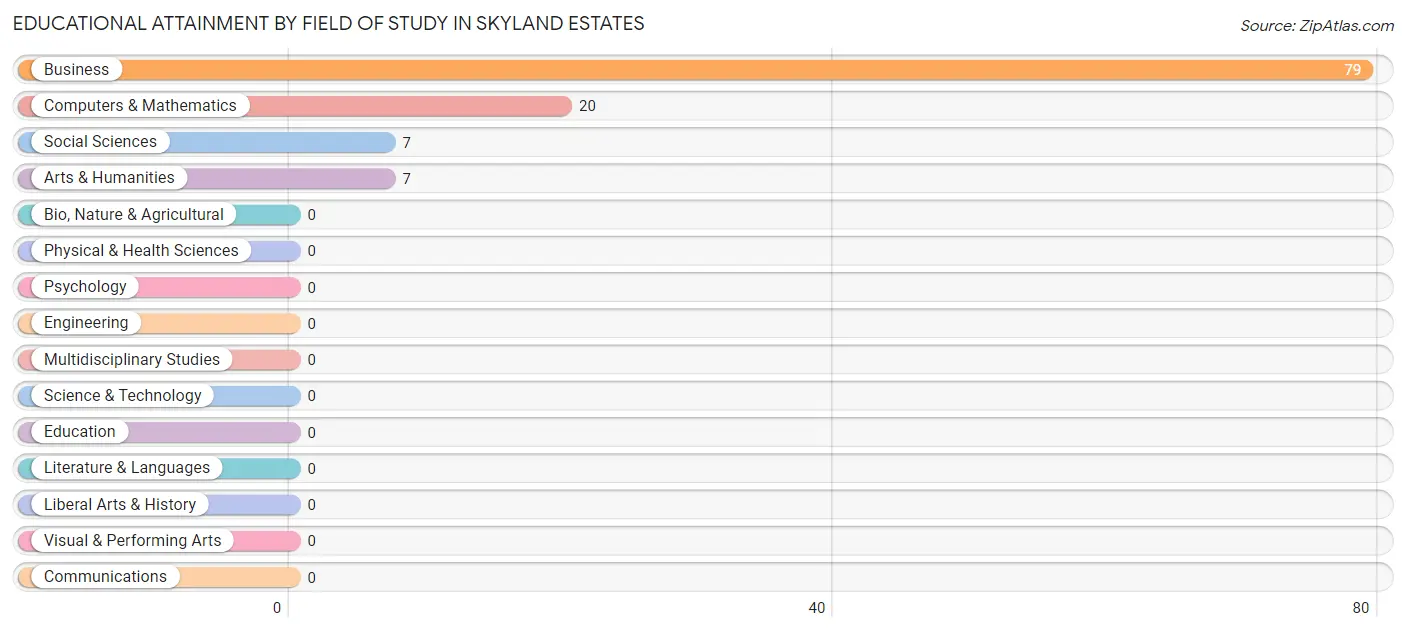
| Field of Study | # Graduates | % Graduates |
| Computers & Mathematics | 20 | 17.7% |
| Bio, Nature & Agricultural | 0 | 0.0% |
| Physical & Health Sciences | 0 | 0.0% |
| Psychology | 0 | 0.0% |
| Social Sciences | 7 | 6.2% |
| Engineering | 0 | 0.0% |
| Multidisciplinary Studies | 0 | 0.0% |
| Science & Technology | 0 | 0.0% |
| Business | 79 | 69.9% |
| Education | 0 | 0.0% |
| Literature & Languages | 0 | 0.0% |
| Liberal Arts & History | 0 | 0.0% |
| Visual & Performing Arts | 0 | 0.0% |
| Communications | 0 | 0.0% |
| Arts & Humanities | 7 | 6.2% |
| Total | 113 | 100.0% |
Transportation & Commute in Skyland Estates
Vehicle Availability by Sex in Skyland Estates
The most prevalent vehicle ownership categories in Skyland Estates are males with 3 vehicles (118, accounting for 52.2%) and females with 3 vehicles (94, making up 47.8%).
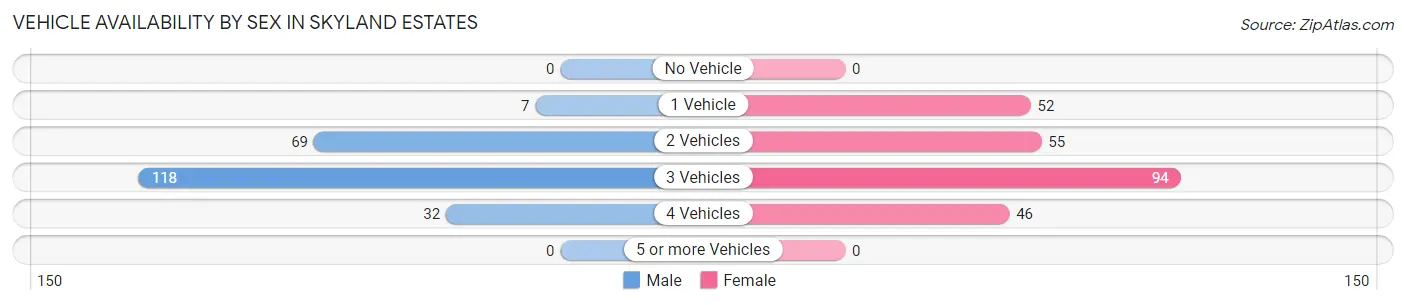
| Vehicles Available | Male | Female |
| No Vehicle | 0 (0.0%) | 0 (0.0%) |
| 1 Vehicle | 7 (3.1%) | 52 (21.0%) |
| 2 Vehicles | 69 (30.5%) | 55 (22.3%) |
| 3 Vehicles | 118 (52.2%) | 94 (38.1%) |
| 4 Vehicles | 32 (14.2%) | 46 (18.6%) |
| 5 or more Vehicles | 0 (0.0%) | 0 (0.0%) |
| Total | 226 (100.0%) | 247 (100.0%) |
Commute Time in Skyland Estates
The most frequently occuring commute durations in Skyland Estates are 60 to 89 minutes (147 commuters, 34.0%), 90 or more minutes (139 commuters, 32.1%), and 45 to 59 minutes (56 commuters, 12.9%).
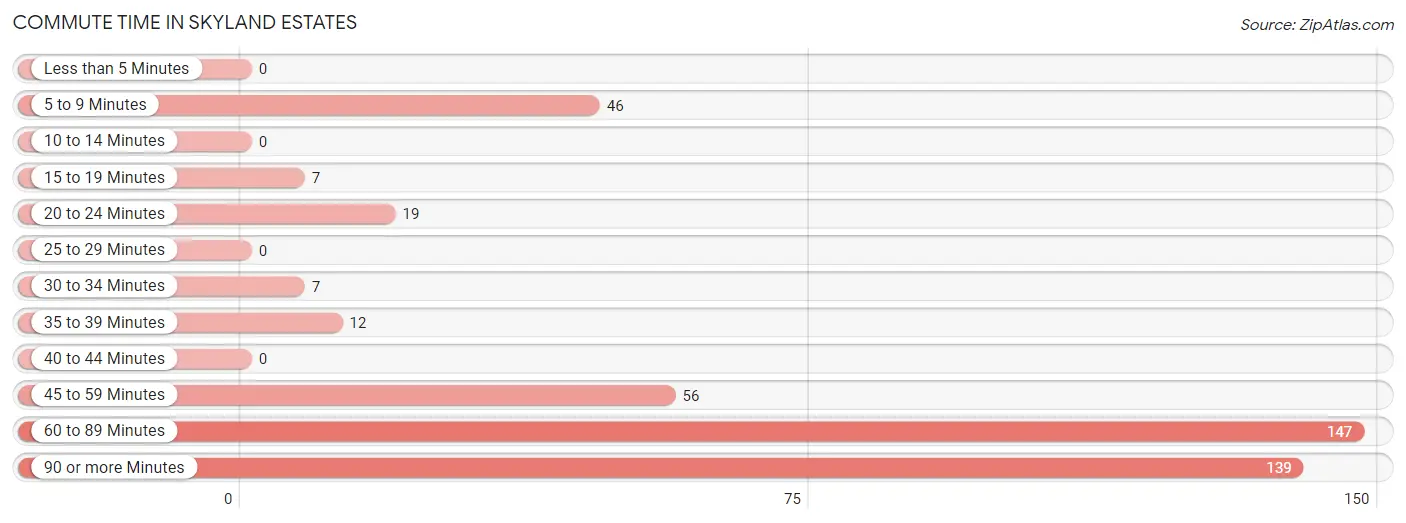
| Commute Time | # Commuters | % Commuters |
| Less than 5 Minutes | 0 | 0.0% |
| 5 to 9 Minutes | 46 | 10.6% |
| 10 to 14 Minutes | 0 | 0.0% |
| 15 to 19 Minutes | 7 | 1.6% |
| 20 to 24 Minutes | 19 | 4.4% |
| 25 to 29 Minutes | 0 | 0.0% |
| 30 to 34 Minutes | 7 | 1.6% |
| 35 to 39 Minutes | 12 | 2.8% |
| 40 to 44 Minutes | 0 | 0.0% |
| 45 to 59 Minutes | 56 | 12.9% |
| 60 to 89 Minutes | 147 | 34.0% |
| 90 or more Minutes | 139 | 32.1% |
Commute Time by Sex in Skyland Estates
The most common commute times in Skyland Estates are 60 to 89 minutes (71 commuters, 33.5%) for males and 60 to 89 minutes (76 commuters, 34.4%) for females.
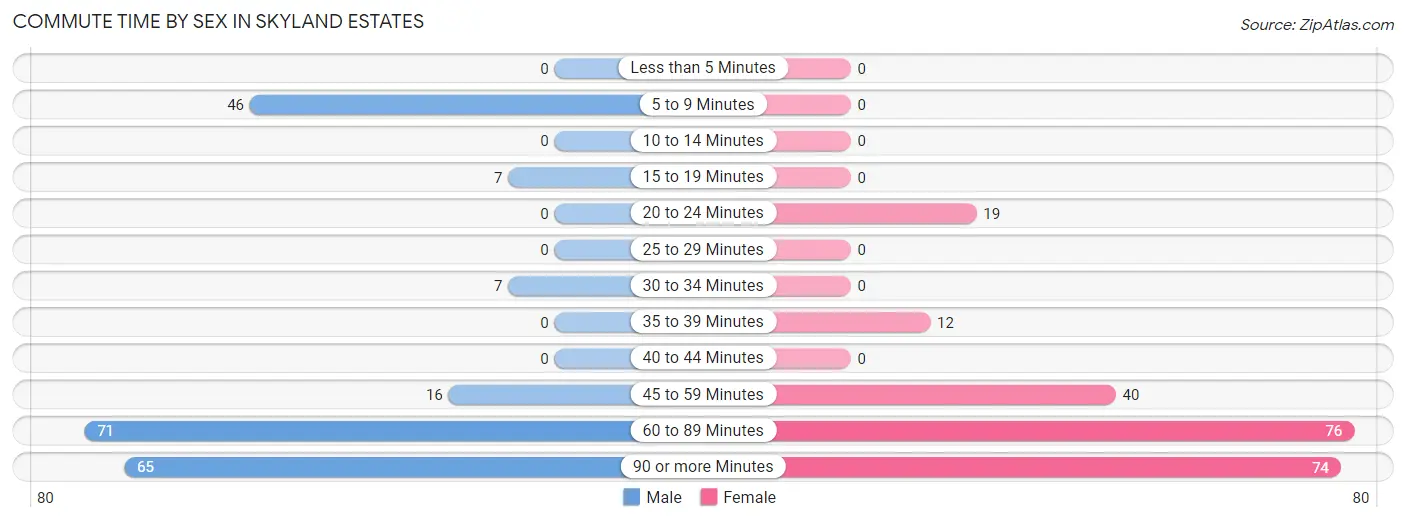
| Commute Time | Male | Female |
| Less than 5 Minutes | 0 (0.0%) | 0 (0.0%) |
| 5 to 9 Minutes | 46 (21.7%) | 0 (0.0%) |
| 10 to 14 Minutes | 0 (0.0%) | 0 (0.0%) |
| 15 to 19 Minutes | 7 (3.3%) | 0 (0.0%) |
| 20 to 24 Minutes | 0 (0.0%) | 19 (8.6%) |
| 25 to 29 Minutes | 0 (0.0%) | 0 (0.0%) |
| 30 to 34 Minutes | 7 (3.3%) | 0 (0.0%) |
| 35 to 39 Minutes | 0 (0.0%) | 12 (5.4%) |
| 40 to 44 Minutes | 0 (0.0%) | 0 (0.0%) |
| 45 to 59 Minutes | 16 (7.5%) | 40 (18.1%) |
| 60 to 89 Minutes | 71 (33.5%) | 76 (34.4%) |
| 90 or more Minutes | 65 (30.7%) | 74 (33.5%) |
Time of Departure to Work by Sex in Skyland Estates
The most frequent times of departure to work in Skyland Estates are 6:00 AM to 6:29 AM (108, 50.9%) for males and 4:00 PM to 11:59 PM (54, 24.4%) for females.
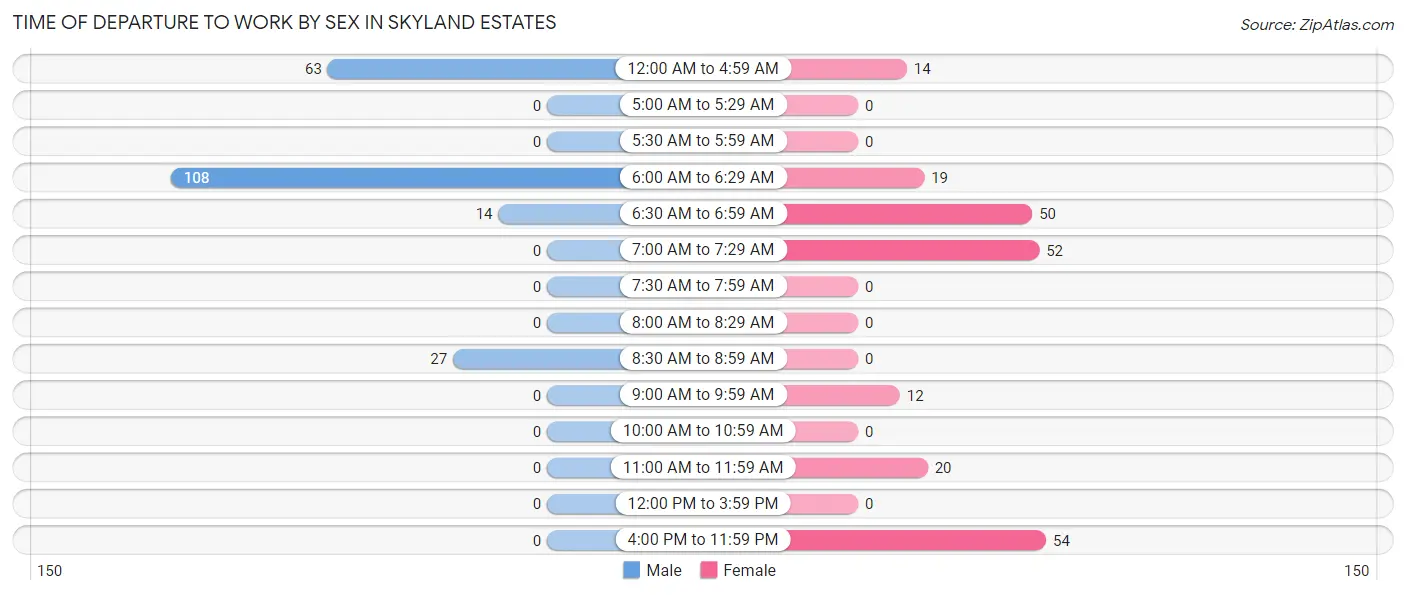
| Time of Departure | Male | Female |
| 12:00 AM to 4:59 AM | 63 (29.7%) | 14 (6.3%) |
| 5:00 AM to 5:29 AM | 0 (0.0%) | 0 (0.0%) |
| 5:30 AM to 5:59 AM | 0 (0.0%) | 0 (0.0%) |
| 6:00 AM to 6:29 AM | 108 (50.9%) | 19 (8.6%) |
| 6:30 AM to 6:59 AM | 14 (6.6%) | 50 (22.6%) |
| 7:00 AM to 7:29 AM | 0 (0.0%) | 52 (23.5%) |
| 7:30 AM to 7:59 AM | 0 (0.0%) | 0 (0.0%) |
| 8:00 AM to 8:29 AM | 0 (0.0%) | 0 (0.0%) |
| 8:30 AM to 8:59 AM | 27 (12.7%) | 0 (0.0%) |
| 9:00 AM to 9:59 AM | 0 (0.0%) | 12 (5.4%) |
| 10:00 AM to 10:59 AM | 0 (0.0%) | 0 (0.0%) |
| 11:00 AM to 11:59 AM | 0 (0.0%) | 20 (9.0%) |
| 12:00 PM to 3:59 PM | 0 (0.0%) | 0 (0.0%) |
| 4:00 PM to 11:59 PM | 0 (0.0%) | 54 (24.4%) |
| Total | 212 (100.0%) | 221 (100.0%) |
Housing Occupancy in Skyland Estates
Occupancy by Ownership in Skyland Estates
Of the total 334 dwellings in Skyland Estates, owner-occupied units account for 294 (88.0%), while renter-occupied units make up 40 (12.0%).
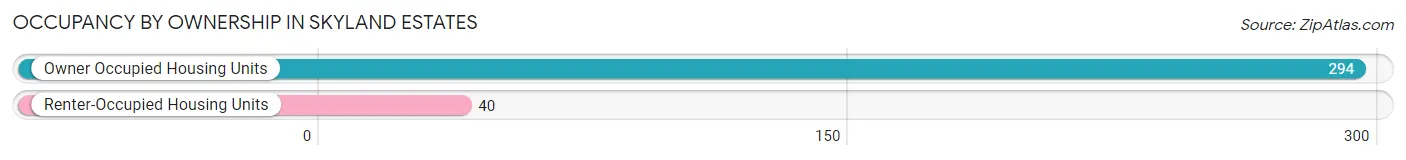
| Occupancy | # Housing Units | % Housing Units |
| Owner Occupied Housing Units | 294 | 88.0% |
| Renter-Occupied Housing Units | 40 | 12.0% |
| Total Occupied Housing Units | 334 | 100.0% |
Occupancy by Household Size in Skyland Estates
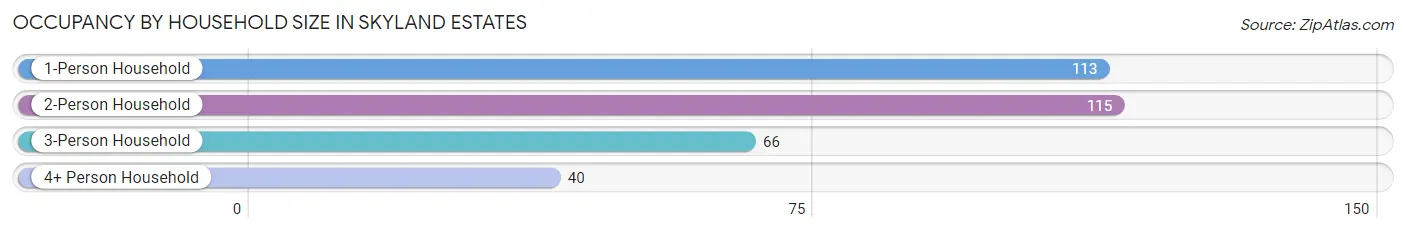
| Household Size | # Housing Units | % Housing Units |
| 1-Person Household | 113 | 33.8% |
| 2-Person Household | 115 | 34.4% |
| 3-Person Household | 66 | 19.8% |
| 4+ Person Household | 40 | 12.0% |
| Total Housing Units | 334 | 100.0% |
Occupancy by Ownership by Household Size in Skyland Estates
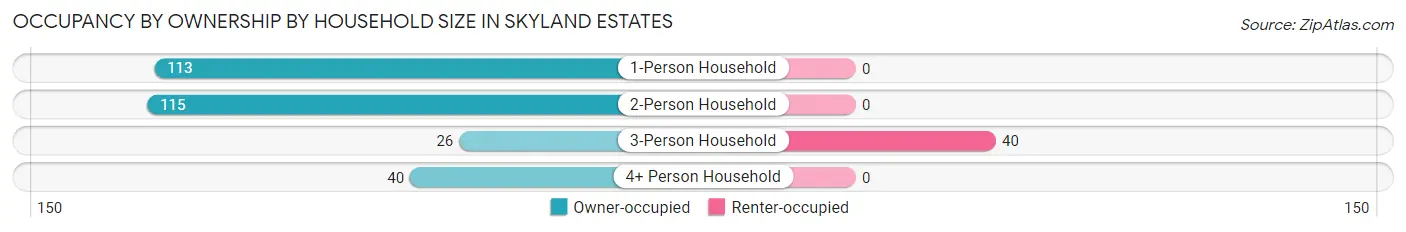
| Household Size | Owner-occupied | Renter-occupied |
| 1-Person Household | 113 (100.0%) | 0 (0.0%) |
| 2-Person Household | 115 (100.0%) | 0 (0.0%) |
| 3-Person Household | 26 (39.4%) | 40 (60.6%) |
| 4+ Person Household | 40 (100.0%) | 0 (0.0%) |
| Total Housing Units | 294 (88.0%) | 40 (12.0%) |
Occupancy by Educational Attainment in Skyland Estates
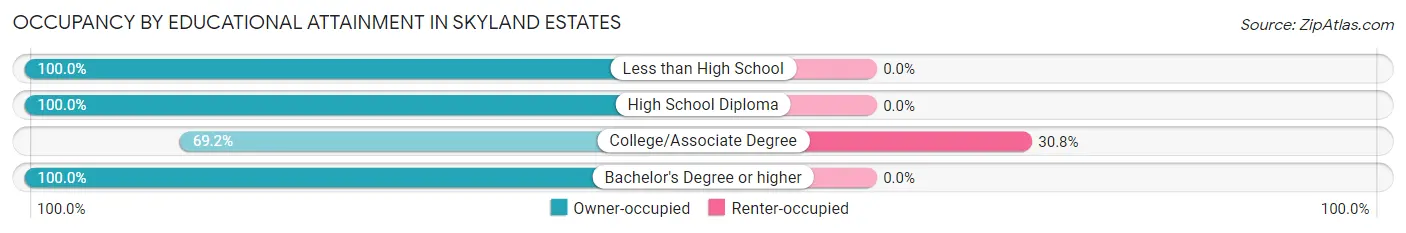
| Household Size | Owner-occupied | Renter-occupied |
| Less than High School | 25 (100.0%) | 0 (0.0%) |
| High School Diploma | 120 (100.0%) | 0 (0.0%) |
| College/Associate Degree | 90 (69.2%) | 40 (30.8%) |
| Bachelor's Degree or higher | 59 (100.0%) | 0 (0.0%) |
Occupancy by Age of Householder in Skyland Estates
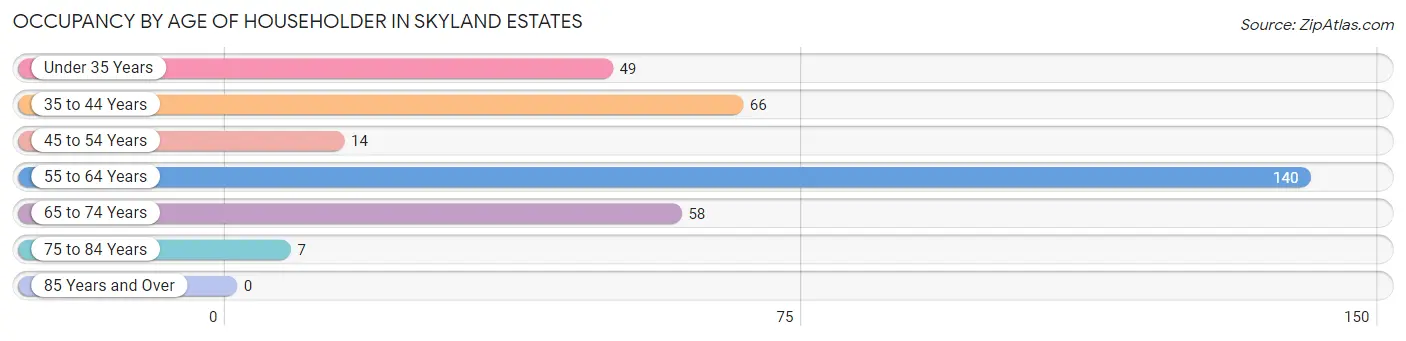
| Age Bracket | # Households | % Households |
| Under 35 Years | 49 | 14.7% |
| 35 to 44 Years | 66 | 19.8% |
| 45 to 54 Years | 14 | 4.2% |
| 55 to 64 Years | 140 | 41.9% |
| 65 to 74 Years | 58 | 17.4% |
| 75 to 84 Years | 7 | 2.1% |
| 85 Years and Over | 0 | 0.0% |
| Total | 334 | 100.0% |
Housing Finances in Skyland Estates
Median Income by Occupancy in Skyland Estates
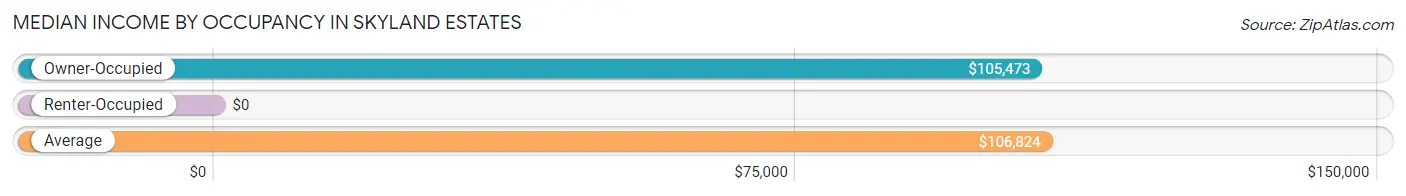
| Occupancy Type | # Households | Median Income |
| Owner-Occupied | 294 (88.0%) | $105,473 |
| Renter-Occupied | 40 (12.0%) | $0 |
| Average | 334 (100.0%) | $106,824 |
Occupancy by Householder Income Bracket in Skyland Estates
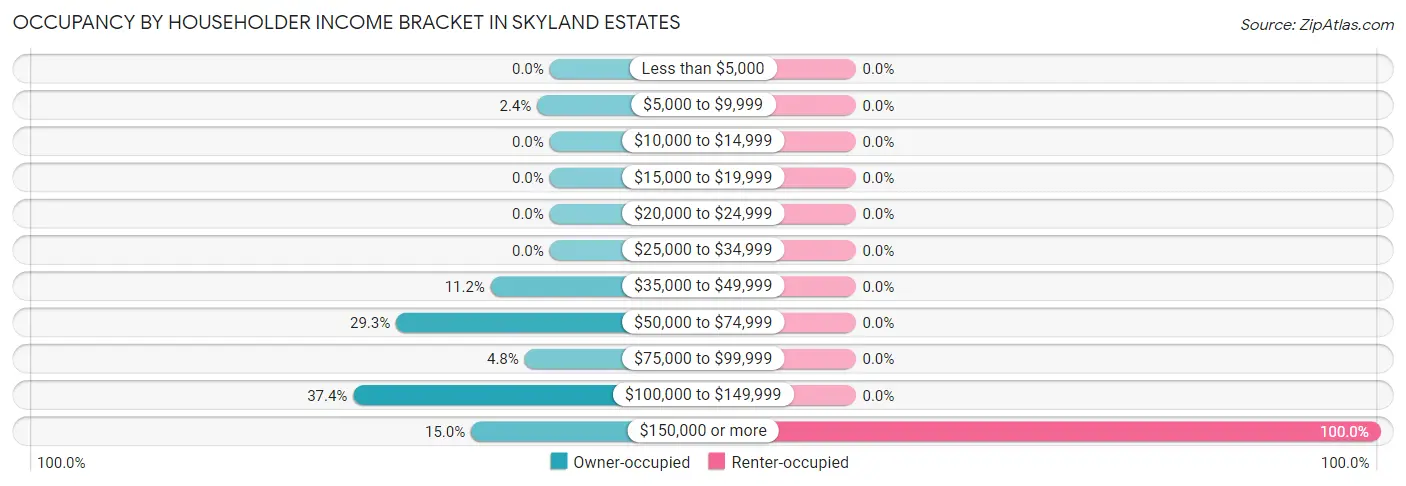
| Income Bracket | Owner-occupied | Renter-occupied |
| Less than $5,000 | 0 (0.0%) | 0 (0.0%) |
| $5,000 to $9,999 | 7 (2.4%) | 0 (0.0%) |
| $10,000 to $14,999 | 0 (0.0%) | 0 (0.0%) |
| $15,000 to $19,999 | 0 (0.0%) | 0 (0.0%) |
| $20,000 to $24,999 | 0 (0.0%) | 0 (0.0%) |
| $25,000 to $34,999 | 0 (0.0%) | 0 (0.0%) |
| $35,000 to $49,999 | 33 (11.2%) | 0 (0.0%) |
| $50,000 to $74,999 | 86 (29.2%) | 0 (0.0%) |
| $75,000 to $99,999 | 14 (4.8%) | 0 (0.0%) |
| $100,000 to $149,999 | 110 (37.4%) | 0 (0.0%) |
| $150,000 or more | 44 (15.0%) | 40 (100.0%) |
| Total | 294 (100.0%) | 40 (100.0%) |
Monthly Housing Cost Tiers in Skyland Estates
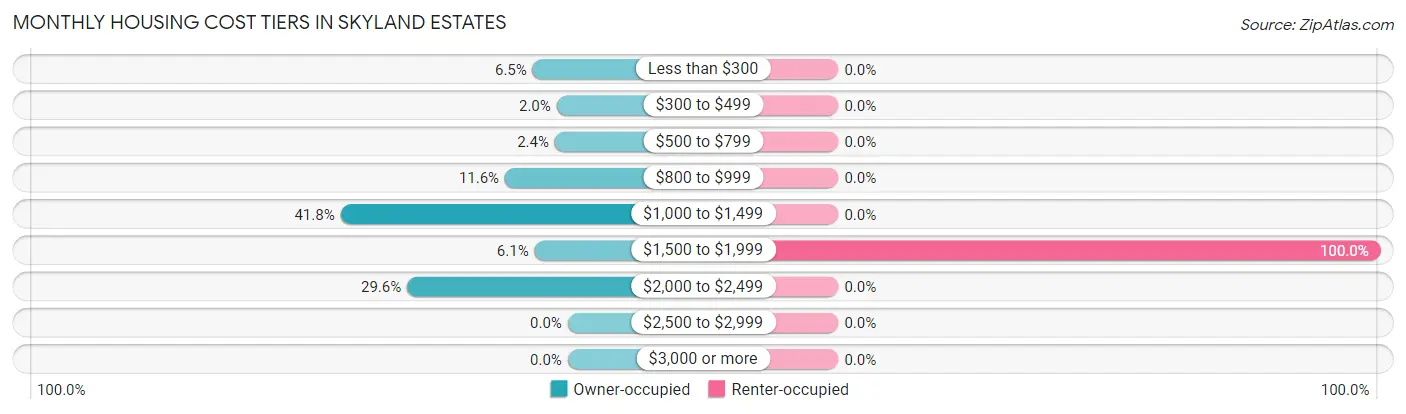
| Monthly Cost | Owner-occupied | Renter-occupied |
| Less than $300 | 19 (6.5%) | 0 (0.0%) |
| $300 to $499 | 6 (2.0%) | 0 (0.0%) |
| $500 to $799 | 7 (2.4%) | 0 (0.0%) |
| $800 to $999 | 34 (11.6%) | 0 (0.0%) |
| $1,000 to $1,499 | 123 (41.8%) | 0 (0.0%) |
| $1,500 to $1,999 | 18 (6.1%) | 40 (100.0%) |
| $2,000 to $2,499 | 87 (29.6%) | 0 (0.0%) |
| $2,500 to $2,999 | 0 (0.0%) | 0 (0.0%) |
| $3,000 or more | 0 (0.0%) | 0 (0.0%) |
| Total | 294 (100.0%) | 40 (100.0%) |
Physical Housing Characteristics in Skyland Estates
Housing Structures in Skyland Estates
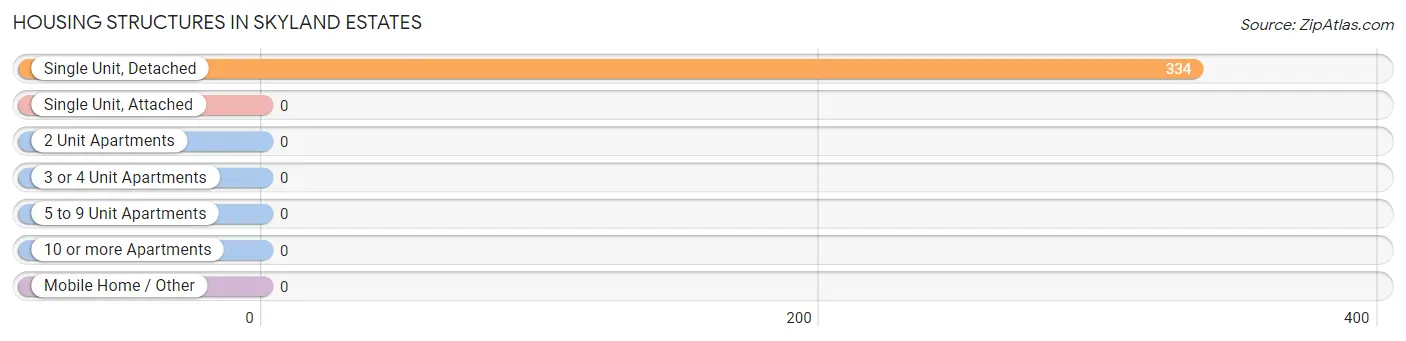
| Structure Type | # Housing Units | % Housing Units |
| Single Unit, Detached | 334 | 100.0% |
| Single Unit, Attached | 0 | 0.0% |
| 2 Unit Apartments | 0 | 0.0% |
| 3 or 4 Unit Apartments | 0 | 0.0% |
| 5 to 9 Unit Apartments | 0 | 0.0% |
| 10 or more Apartments | 0 | 0.0% |
| Mobile Home / Other | 0 | 0.0% |
| Total | 334 | 100.0% |
Housing Structures by Occupancy in Skyland Estates
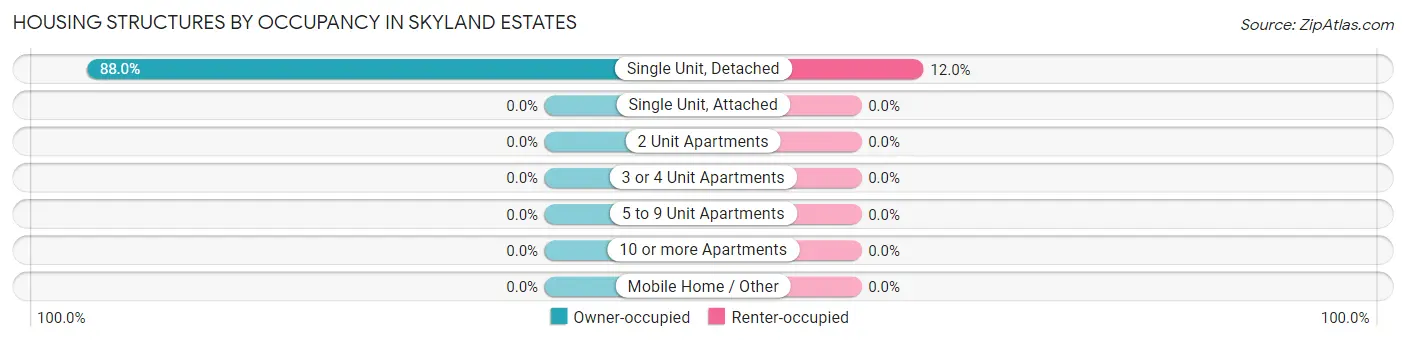
| Structure Type | Owner-occupied | Renter-occupied |
| Single Unit, Detached | 294 (88.0%) | 40 (12.0%) |
| Single Unit, Attached | 0 (0.0%) | 0 (0.0%) |
| 2 Unit Apartments | 0 (0.0%) | 0 (0.0%) |
| 3 or 4 Unit Apartments | 0 (0.0%) | 0 (0.0%) |
| 5 to 9 Unit Apartments | 0 (0.0%) | 0 (0.0%) |
| 10 or more Apartments | 0 (0.0%) | 0 (0.0%) |
| Mobile Home / Other | 0 (0.0%) | 0 (0.0%) |
| Total | 294 (88.0%) | 40 (12.0%) |
Housing Structures by Number of Rooms in Skyland Estates
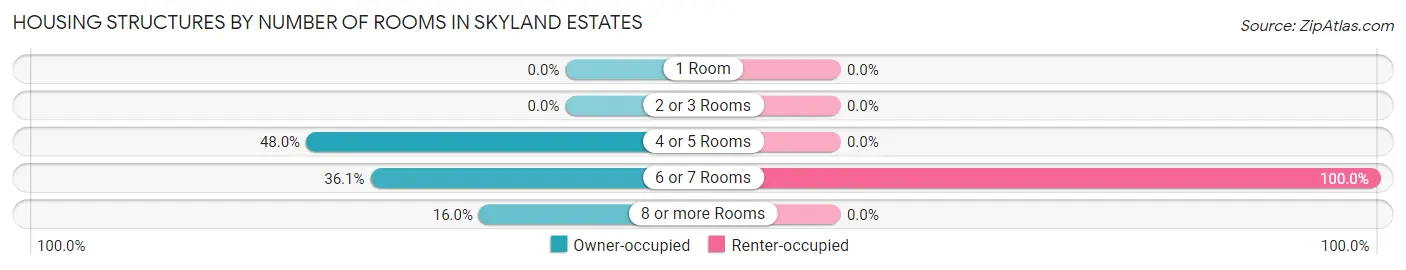
| Number of Rooms | Owner-occupied | Renter-occupied |
| 1 Room | 0 (0.0%) | 0 (0.0%) |
| 2 or 3 Rooms | 0 (0.0%) | 0 (0.0%) |
| 4 or 5 Rooms | 141 (48.0%) | 0 (0.0%) |
| 6 or 7 Rooms | 106 (36.0%) | 40 (100.0%) |
| 8 or more Rooms | 47 (16.0%) | 0 (0.0%) |
| Total | 294 (100.0%) | 40 (100.0%) |
Housing Structure by Heating Type in Skyland Estates
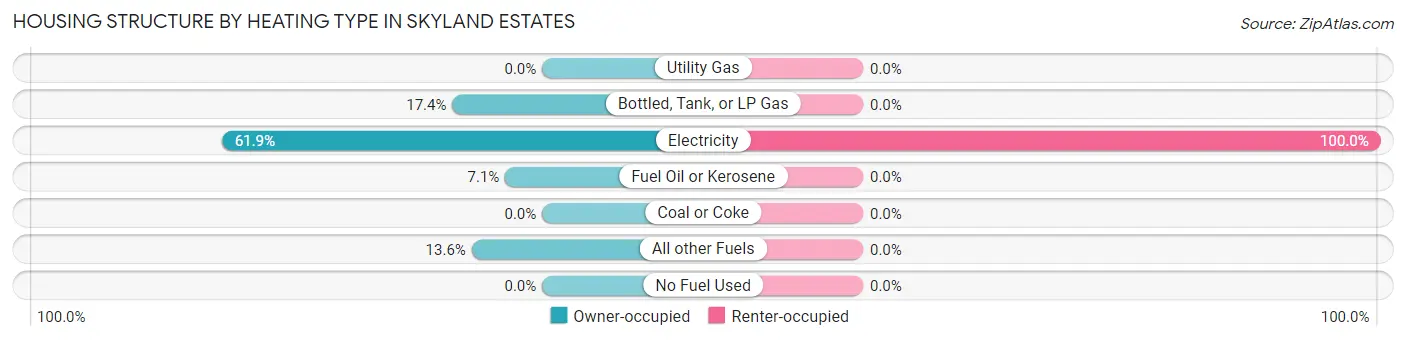
| Heating Type | Owner-occupied | Renter-occupied |
| Utility Gas | 0 (0.0%) | 0 (0.0%) |
| Bottled, Tank, or LP Gas | 51 (17.3%) | 0 (0.0%) |
| Electricity | 182 (61.9%) | 40 (100.0%) |
| Fuel Oil or Kerosene | 21 (7.1%) | 0 (0.0%) |
| Coal or Coke | 0 (0.0%) | 0 (0.0%) |
| All other Fuels | 40 (13.6%) | 0 (0.0%) |
| No Fuel Used | 0 (0.0%) | 0 (0.0%) |
| Total | 294 (100.0%) | 40 (100.0%) |
Household Vehicle Usage in Skyland Estates
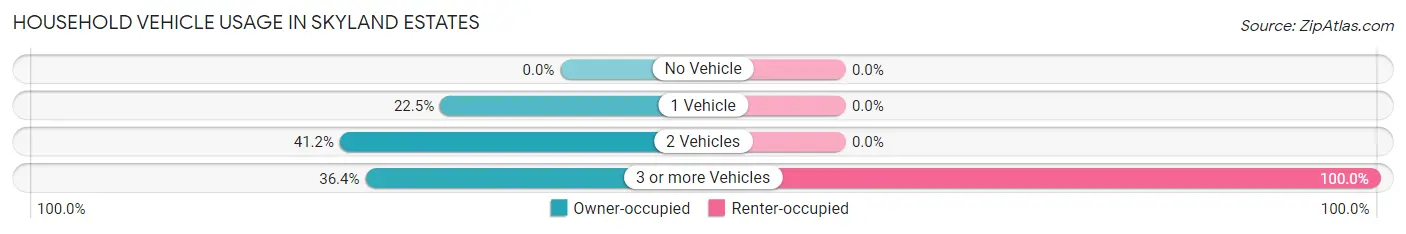
| Vehicles per Household | Owner-occupied | Renter-occupied |
| No Vehicle | 0 (0.0%) | 0 (0.0%) |
| 1 Vehicle | 66 (22.5%) | 0 (0.0%) |
| 2 Vehicles | 121 (41.2%) | 0 (0.0%) |
| 3 or more Vehicles | 107 (36.4%) | 40 (100.0%) |
| Total | 294 (100.0%) | 40 (100.0%) |
Real Estate & Mortgages in Skyland Estates
Real Estate and Mortgage Overview in Skyland Estates
| Characteristic | Without Mortgage | With Mortgage |
| Housing Units | 59 | 235 |
| Median Property Value | - | - |
| Median Household Income | - | - |
| Monthly Housing Costs | - | - |
| Real Estate Taxes | - | - |
Property Value by Mortgage Status in Skyland Estates
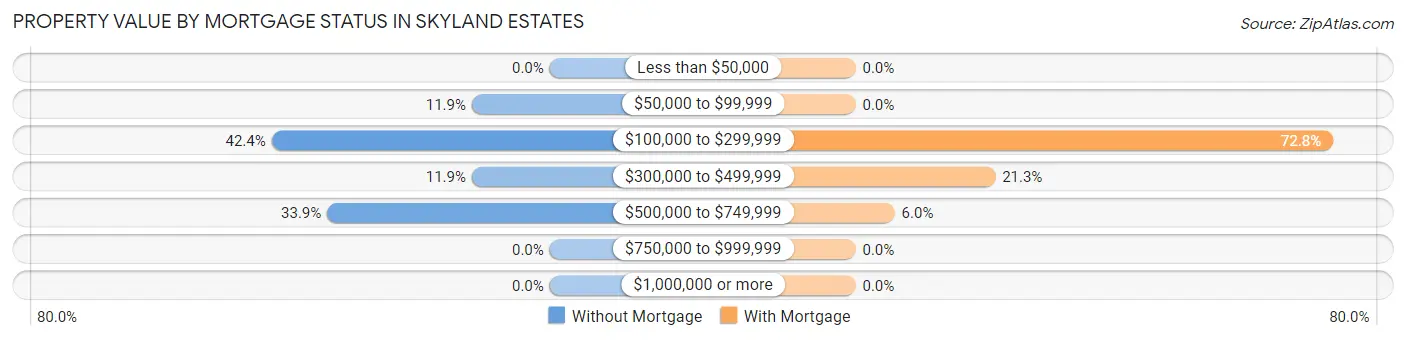
| Property Value | Without Mortgage | With Mortgage |
| Less than $50,000 | 0 (0.0%) | 0 (0.0%) |
| $50,000 to $99,999 | 7 (11.9%) | 0 (0.0%) |
| $100,000 to $299,999 | 25 (42.4%) | 171 (72.8%) |
| $300,000 to $499,999 | 7 (11.9%) | 50 (21.3%) |
| $500,000 to $749,999 | 20 (33.9%) | 14 (6.0%) |
| $750,000 to $999,999 | 0 (0.0%) | 0 (0.0%) |
| $1,000,000 or more | 0 (0.0%) | 0 (0.0%) |
| Total | 59 (100.0%) | 235 (100.0%) |
Household Income by Mortgage Status in Skyland Estates
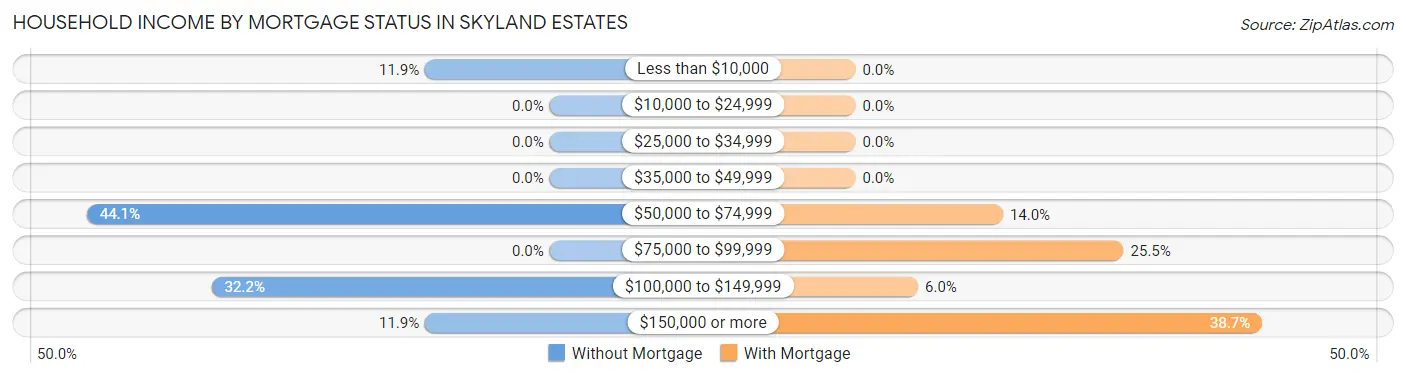
| Household Income | Without Mortgage | With Mortgage |
| Less than $10,000 | 7 (11.9%) | 0 (0.0%) |
| $10,000 to $24,999 | 0 (0.0%) | 0 (0.0%) |
| $25,000 to $34,999 | 0 (0.0%) | 0 (0.0%) |
| $35,000 to $49,999 | 0 (0.0%) | 0 (0.0%) |
| $50,000 to $74,999 | 26 (44.1%) | 33 (14.0%) |
| $75,000 to $99,999 | 0 (0.0%) | 60 (25.5%) |
| $100,000 to $149,999 | 19 (32.2%) | 14 (6.0%) |
| $150,000 or more | 7 (11.9%) | 91 (38.7%) |
| Total | 59 (100.0%) | 235 (100.0%) |
Property Value to Household Income Ratio in Skyland Estates
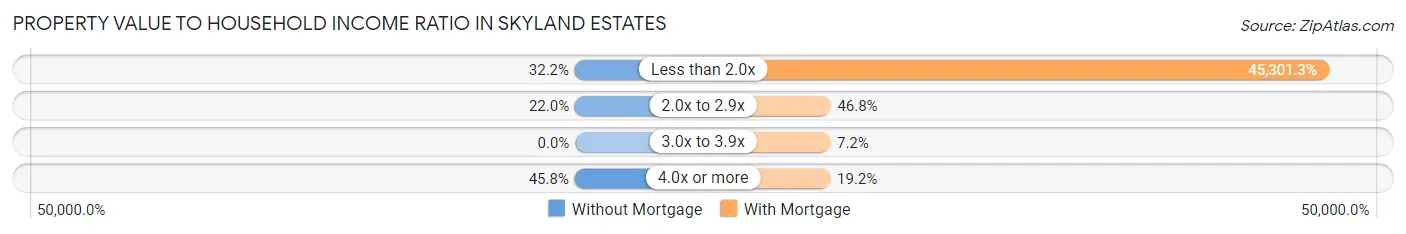
| Value-to-Income Ratio | Without Mortgage | With Mortgage |
| Less than 2.0x | 19 (32.2%) | 106,458 (45,301.3%) |
| 2.0x to 2.9x | 13 (22.0%) | 110 (46.8%) |
| 3.0x to 3.9x | 0 (0.0%) | 17 (7.2%) |
| 4.0x or more | 27 (45.8%) | 45 (19.2%) |
| Total | 59 (100.0%) | 235 (100.0%) |
Real Estate Taxes by Mortgage Status in Skyland Estates
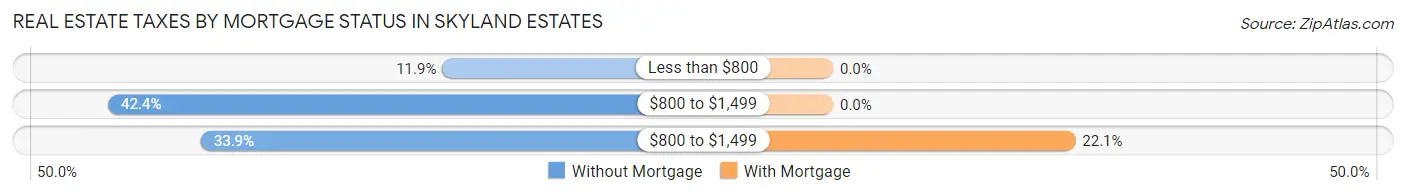
| Property Taxes | Without Mortgage | With Mortgage |
| Less than $800 | 7 (11.9%) | 0 (0.0%) |
| $800 to $1,499 | 25 (42.4%) | 0 (0.0%) |
| $800 to $1,499 | 20 (33.9%) | 52 (22.1%) |
| Total | 59 (100.0%) | 235 (100.0%) |
Health & Disability in Skyland Estates
Health Insurance Coverage by Age in Skyland Estates
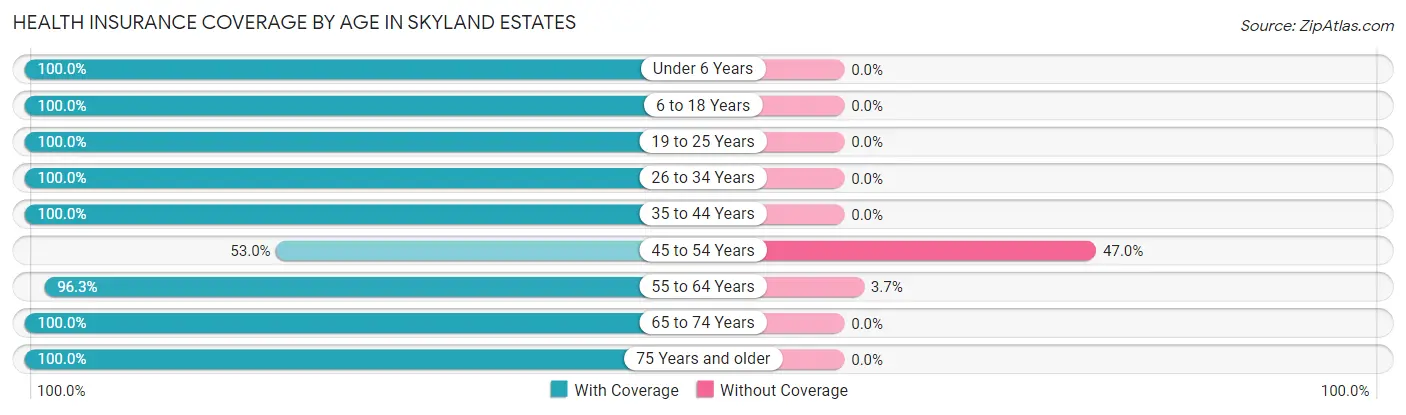
| Age Bracket | With Coverage | Without Coverage |
| Under 6 Years | 17 (100.0%) | 0 (0.0%) |
| 6 to 18 Years | 148 (100.0%) | 0 (0.0%) |
| 19 to 25 Years | 50 (100.0%) | 0 (0.0%) |
| 26 to 34 Years | 49 (100.0%) | 0 (0.0%) |
| 35 to 44 Years | 123 (100.0%) | 0 (0.0%) |
| 45 to 54 Years | 61 (53.0%) | 54 (47.0%) |
| 55 to 64 Years | 184 (96.3%) | 7 (3.7%) |
| 65 to 74 Years | 71 (100.0%) | 0 (0.0%) |
| 75 Years and older | 27 (100.0%) | 0 (0.0%) |
| Total | 730 (92.3%) | 61 (7.7%) |
Health Insurance Coverage by Citizenship Status in Skyland Estates
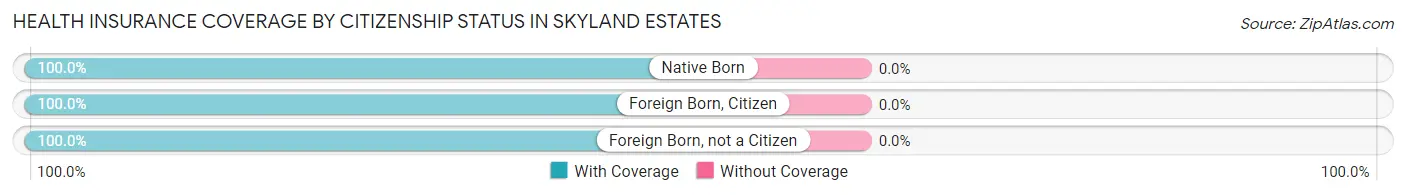
| Citizenship Status | With Coverage | Without Coverage |
| Native Born | 17 (100.0%) | 0 (0.0%) |
| Foreign Born, Citizen | 148 (100.0%) | 0 (0.0%) |
| Foreign Born, not a Citizen | 50 (100.0%) | 0 (0.0%) |
Health Insurance Coverage by Household Income in Skyland Estates
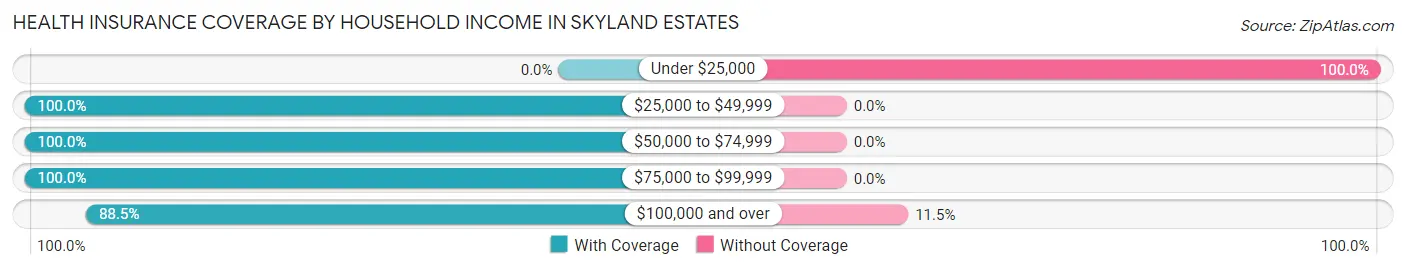
| Household Income | With Coverage | Without Coverage |
| Under $25,000 | 0 (0.0%) | 7 (100.0%) |
| $25,000 to $49,999 | 74 (100.0%) | 0 (0.0%) |
| $50,000 to $74,999 | 179 (100.0%) | 0 (0.0%) |
| $75,000 to $99,999 | 62 (100.0%) | 0 (0.0%) |
| $100,000 and over | 415 (88.5%) | 54 (11.5%) |
Public vs Private Health Insurance Coverage by Age in Skyland Estates
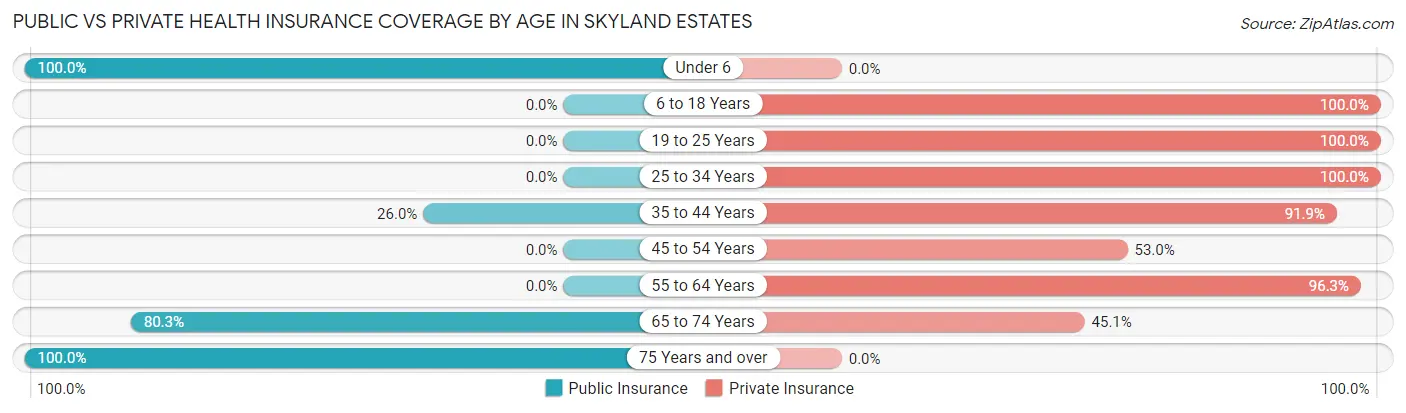
| Age Bracket | Public Insurance | Private Insurance |
| Under 6 | 17 (100.0%) | 0 (0.0%) |
| 6 to 18 Years | 0 (0.0%) | 148 (100.0%) |
| 19 to 25 Years | 0 (0.0%) | 50 (100.0%) |
| 25 to 34 Years | 0 (0.0%) | 49 (100.0%) |
| 35 to 44 Years | 32 (26.0%) | 113 (91.9%) |
| 45 to 54 Years | 0 (0.0%) | 61 (53.0%) |
| 55 to 64 Years | 0 (0.0%) | 184 (96.3%) |
| 65 to 74 Years | 57 (80.3%) | 32 (45.1%) |
| 75 Years and over | 27 (100.0%) | 0 (0.0%) |
| Total | 133 (16.8%) | 637 (80.5%) |
Disability Status by Sex by Age in Skyland Estates
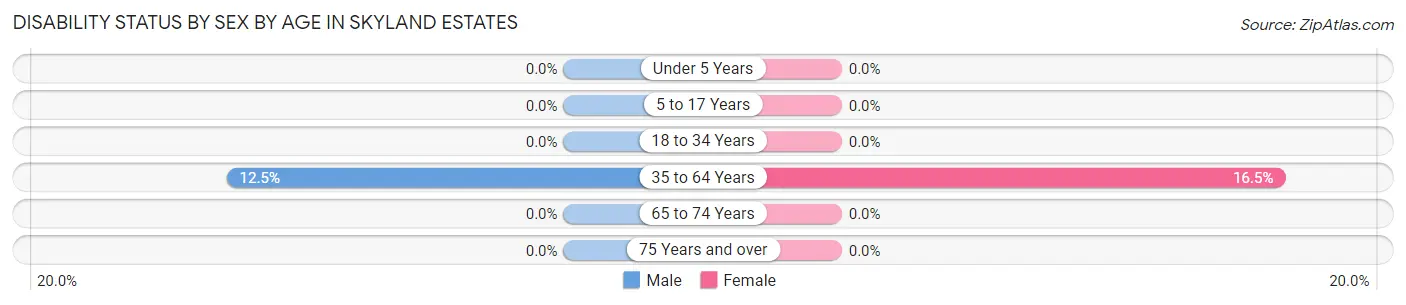
| Age Bracket | Male | Female |
| Under 5 Years | 0 (0.0%) | 0 (0.0%) |
| 5 to 17 Years | 0 (0.0%) | 0 (0.0%) |
| 18 to 34 Years | 0 (0.0%) | 0 (0.0%) |
| 35 to 64 Years | 24 (12.5%) | 39 (16.5%) |
| 65 to 74 Years | 0 (0.0%) | 0 (0.0%) |
| 75 Years and over | 0 (0.0%) | 0 (0.0%) |
Disability Class by Sex by Age in Skyland Estates
Disability Class: Hearing Difficulty
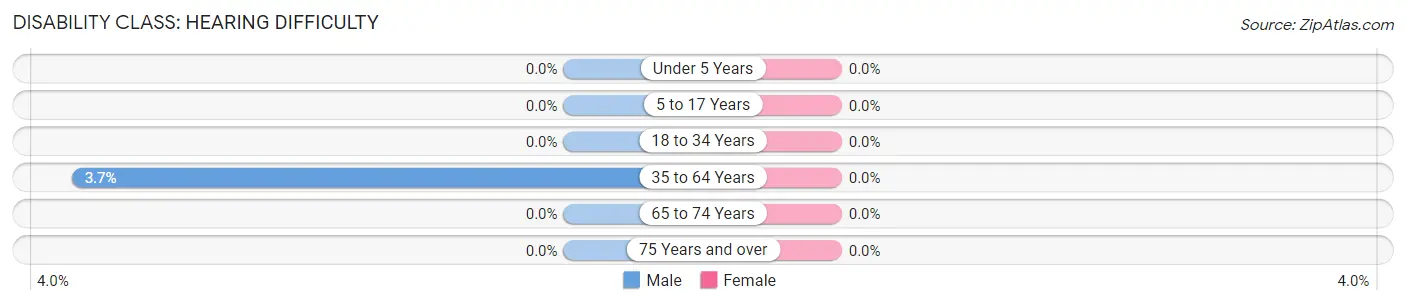
| Age Bracket | Male | Female |
| Under 5 Years | 0 (0.0%) | 0 (0.0%) |
| 5 to 17 Years | 0 (0.0%) | 0 (0.0%) |
| 18 to 34 Years | 0 (0.0%) | 0 (0.0%) |
| 35 to 64 Years | 7 (3.6%) | 0 (0.0%) |
| 65 to 74 Years | 0 (0.0%) | 0 (0.0%) |
| 75 Years and over | 0 (0.0%) | 0 (0.0%) |
Disability Class: Vision Difficulty

| Age Bracket | Male | Female |
| Under 5 Years | 0 (0.0%) | 0 (0.0%) |
| 5 to 17 Years | 0 (0.0%) | 0 (0.0%) |
| 18 to 34 Years | 0 (0.0%) | 0 (0.0%) |
| 35 to 64 Years | 7 (3.6%) | 0 (0.0%) |
| 65 to 74 Years | 0 (0.0%) | 0 (0.0%) |
| 75 Years and over | 0 (0.0%) | 0 (0.0%) |
Disability Class: Cognitive Difficulty
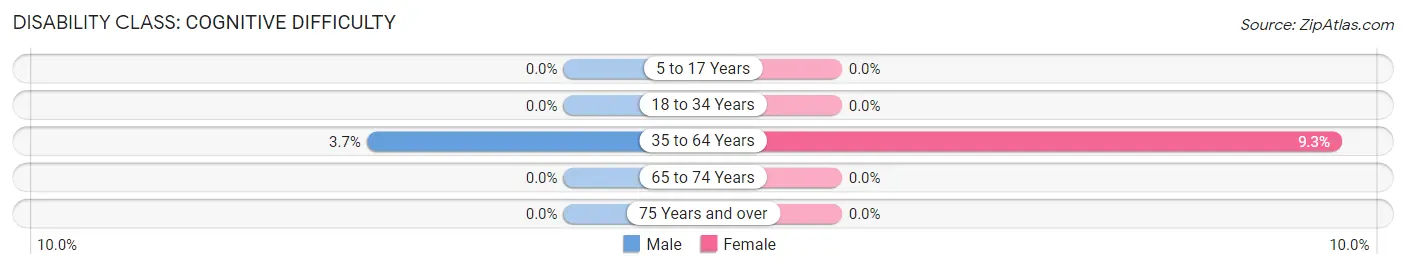
| Age Bracket | Male | Female |
| 5 to 17 Years | 0 (0.0%) | 0 (0.0%) |
| 18 to 34 Years | 0 (0.0%) | 0 (0.0%) |
| 35 to 64 Years | 7 (3.6%) | 22 (9.3%) |
| 65 to 74 Years | 0 (0.0%) | 0 (0.0%) |
| 75 Years and over | 0 (0.0%) | 0 (0.0%) |
Disability Class: Ambulatory Difficulty
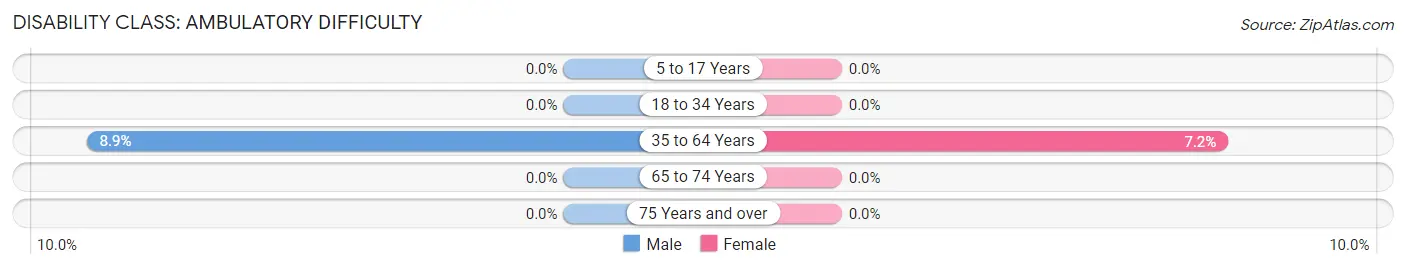
| Age Bracket | Male | Female |
| 5 to 17 Years | 0 (0.0%) | 0 (0.0%) |
| 18 to 34 Years | 0 (0.0%) | 0 (0.0%) |
| 35 to 64 Years | 17 (8.8%) | 17 (7.2%) |
| 65 to 74 Years | 0 (0.0%) | 0 (0.0%) |
| 75 Years and over | 0 (0.0%) | 0 (0.0%) |
Disability Class: Self-Care Difficulty
| Age Bracket | Male | Female |
| 5 to 17 Years | 0 (0.0%) | 0 (0.0%) |
| 18 to 34 Years | 0 (0.0%) | 0 (0.0%) |
| 35 to 64 Years | 17 (8.8%) | 0 (0.0%) |
| 65 to 74 Years | 0 (0.0%) | 0 (0.0%) |
| 75 Years and over | 0 (0.0%) | 0 (0.0%) |
Technology Access in Skyland Estates
Computing Device Access in Skyland Estates
| Device Type | # Households | % Households |
| Desktop or Laptop | 321 | 96.1% |
| Smartphone | 321 | 96.1% |
| Tablet | 237 | 71.0% |
| No Computing Device | 6 | 1.8% |
| Total | 334 | 100.0% |
Internet Access in Skyland Estates
| Internet Type | # Households | % Households |
| Dial-Up Internet | 0 | 0.0% |
| Broadband Home | 321 | 96.1% |
| Cellular Data Only | 7 | 2.1% |
| Satellite Internet | 0 | 0.0% |
| No Internet | 6 | 1.8% |
| Total | 334 | 100.0% |
Skyland Estates Summary
Skyland Estates is a census-designated place (CDP) located in Loudoun County, Virginia. It is situated in the foothills of the Blue Ridge Mountains, approximately 30 miles west of Washington, D.C. The population of Skyland Estates was 2,845 at the 2010 census.
History
Skyland Estates was first settled in the late 1700s by German and English immigrants. The area was originally known as “Skyland” and was part of the original land grant given to the settlers by Lord Fairfax. The area was primarily used for farming and the production of tobacco.
In the early 1900s, the area began to develop as a residential community. The first homes were built in the 1920s and 1930s. The area was officially incorporated as the Town of Skyland Estates in 1948.
Geography
Skyland Estates is located in the foothills of the Blue Ridge Mountains in Loudoun County, Virginia. It is situated approximately 30 miles west of Washington, D.C. The area is characterized by rolling hills and valleys, with elevations ranging from 500 to 1,000 feet above sea level.
The climate in Skyland Estates is temperate, with hot summers and cold winters. The average annual temperature is around 55 degrees Fahrenheit. The area receives an average of 40 inches of precipitation per year.
Economy
Skyland Estates is primarily a residential community, with most of the population employed in the service sector. The area is home to several small businesses, including restaurants, retail stores, and professional services.
The area is also home to several wineries and vineyards, which attract tourists from around the region. The area is also home to several horse farms, which provide employment for many of the local residents.
Demographics
As of the 2010 census, the population of Skyland Estates was 2,845. The racial makeup of the area was 87.3% White, 5.2% African American, 0.3% Native American, 2.2% Asian, 0.1% Pacific Islander, and 4.9% from other races.
The median household income in Skyland Estates was $90,945 in 2010. The median age of the population was 40.7 years. The area is home to a large number of families, with the majority of households having children under the age of 18.
Skyland Estates is a diverse community, with a variety of religious and cultural backgrounds. The area is home to a large number of churches, including Baptist, Methodist, and Catholic. The area is also home to a variety of ethnic restaurants, including Mexican, Chinese, and Italian.
Common Questions
What is Per Capita Income in Skyland Estates?
Per Capita income in Skyland Estates is $53,208.
What is the Median Family Income in Skyland Estates?
Median Family Income in Skyland Estates is $105,304.
What is the Median Household income in Skyland Estates?
Median Household Income in Skyland Estates is $106,824.
What is Inequality or Gini Index in Skyland Estates?
Inequality or Gini Index in Skyland Estates is 0.33.
What is the Total Population of Skyland Estates?
Total Population of Skyland Estates is 791.
What is the Total Male Population of Skyland Estates?
Total Male Population of Skyland Estates is 457.
What is the Total Female Population of Skyland Estates?
Total Female Population of Skyland Estates is 334.
What is the Ratio of Males per 100 Females in Skyland Estates?
There are 136.83 Males per 100 Females in Skyland Estates.
What is the Ratio of Females per 100 Males in Skyland Estates?
There are 73.09 Females per 100 Males in Skyland Estates.
What is the Median Population Age in Skyland Estates?
Median Population Age in Skyland Estates is 45.6 Years.
What is the Average Family Size in Skyland Estates
Average Family Size in Skyland Estates is 2.6 People.
What is the Average Household Size in Skyland Estates
Average Household Size in Skyland Estates is 2.4 People.
How Large is the Labor Force in Skyland Estates?
There are 473 People in the Labor Forcein in Skyland Estates.
What is the Percentage of People in the Labor Force in Skyland Estates?
65.4% of People are in the Labor Force in Skyland Estates.