Highland Springs, VA Map & Demographics
Highland Springs Map
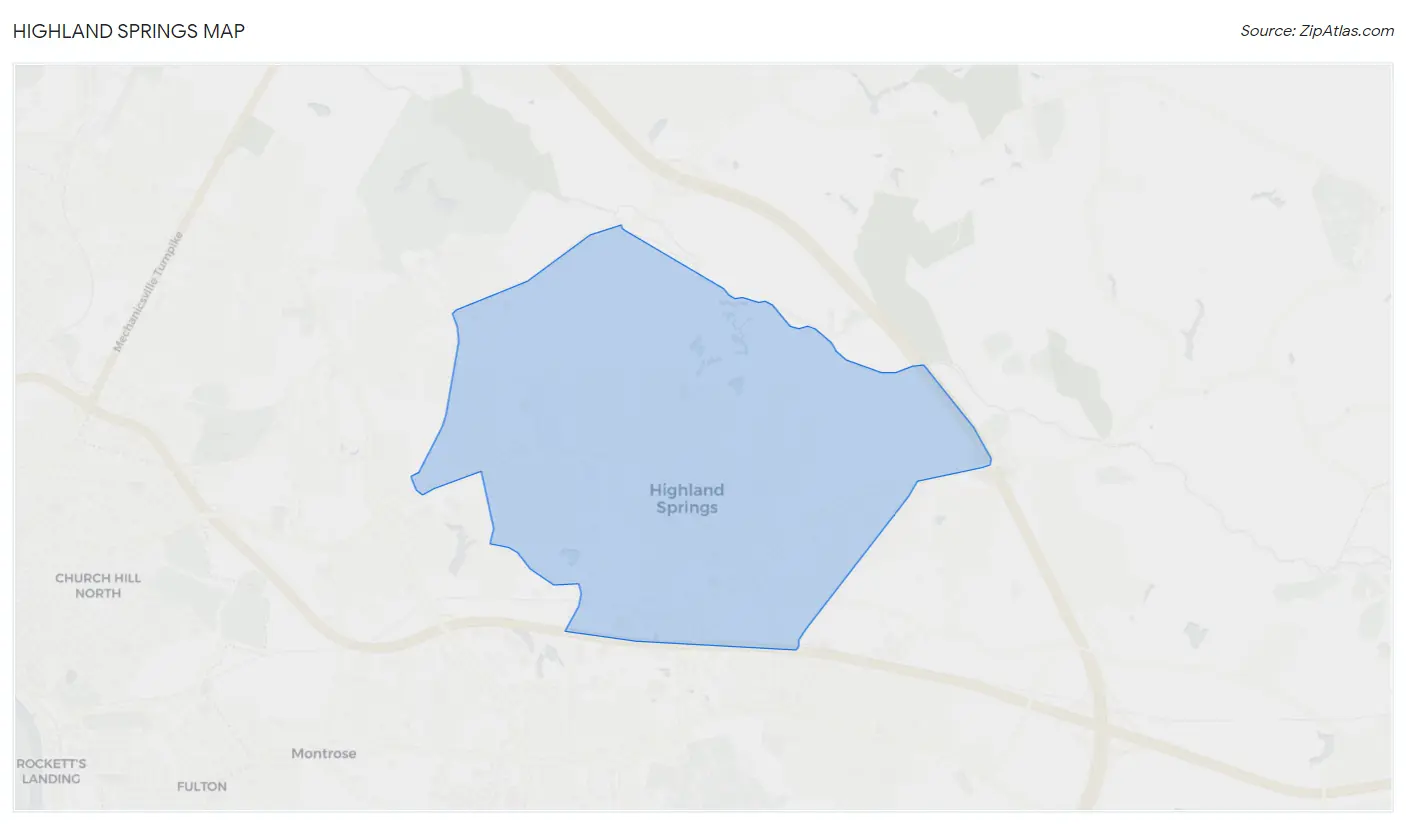
Highland Springs Overview
$26,176
PER CAPITA INCOME
$59,279
AVG FAMILY INCOME
$54,270
AVG HOUSEHOLD INCOME
7.6%
WAGE / INCOME GAP [ % ]
92.4¢/ $1
WAGE / INCOME GAP [ $ ]
0.40
INEQUALITY / GINI INDEX
14,881
TOTAL POPULATION
6,841
MALE POPULATION
8,040
FEMALE POPULATION
85.09
MALES / 100 FEMALES
117.53
FEMALES / 100 MALES
38.5
MEDIAN AGE
3.3
AVG FAMILY SIZE
2.5
AVG HOUSEHOLD SIZE
7,793
LABOR FORCE [ PEOPLE ]
67.0%
PERCENT IN LABOR FORCE
5.4%
UNEMPLOYMENT RATE
Highland Springs Area Codes
Income in Highland Springs
Income Overview in Highland Springs
Per Capita Income in Highland Springs is $26,176, while median incomes of families and households are $59,279 and $54,270 respectively.
| Characteristic | Number | Measure |
| Per Capita Income | 14,881 | $26,176 |
| Median Family Income | 3,469 | $59,279 |
| Mean Family Income | 3,469 | $71,477 |
| Median Household Income | 5,886 | $54,270 |
| Mean Household Income | 5,886 | $61,636 |
| Income Deficit | 3,469 | $0 |
| Wage / Income Gap (%) | 14,881 | 7.63% |
| Wage / Income Gap ($) | 14,881 | 92.37¢ per $1 |
| Gini / Inequality Index | 14,881 | 0.40 |
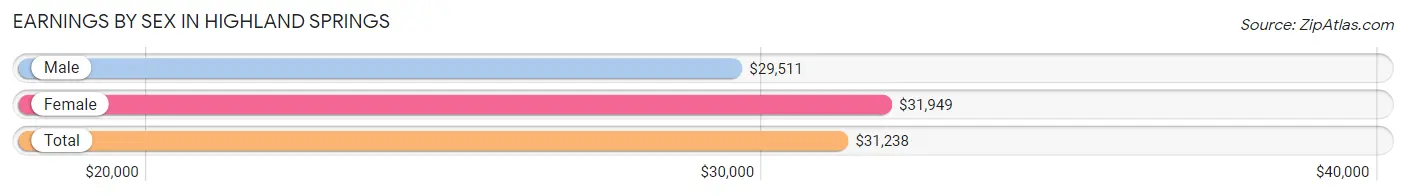
Earnings by Sex in Highland Springs
Average Earnings in Highland Springs are $31,238, $29,511 for men and $31,949 for women, a difference of 7.6%.
| Sex | Number | Average Earnings |
| Male | 3,649 (45.3%) | $29,511 |
| Female | 4,401 (54.7%) | $31,949 |
| Total | 8,050 (100.0%) | $31,238 |
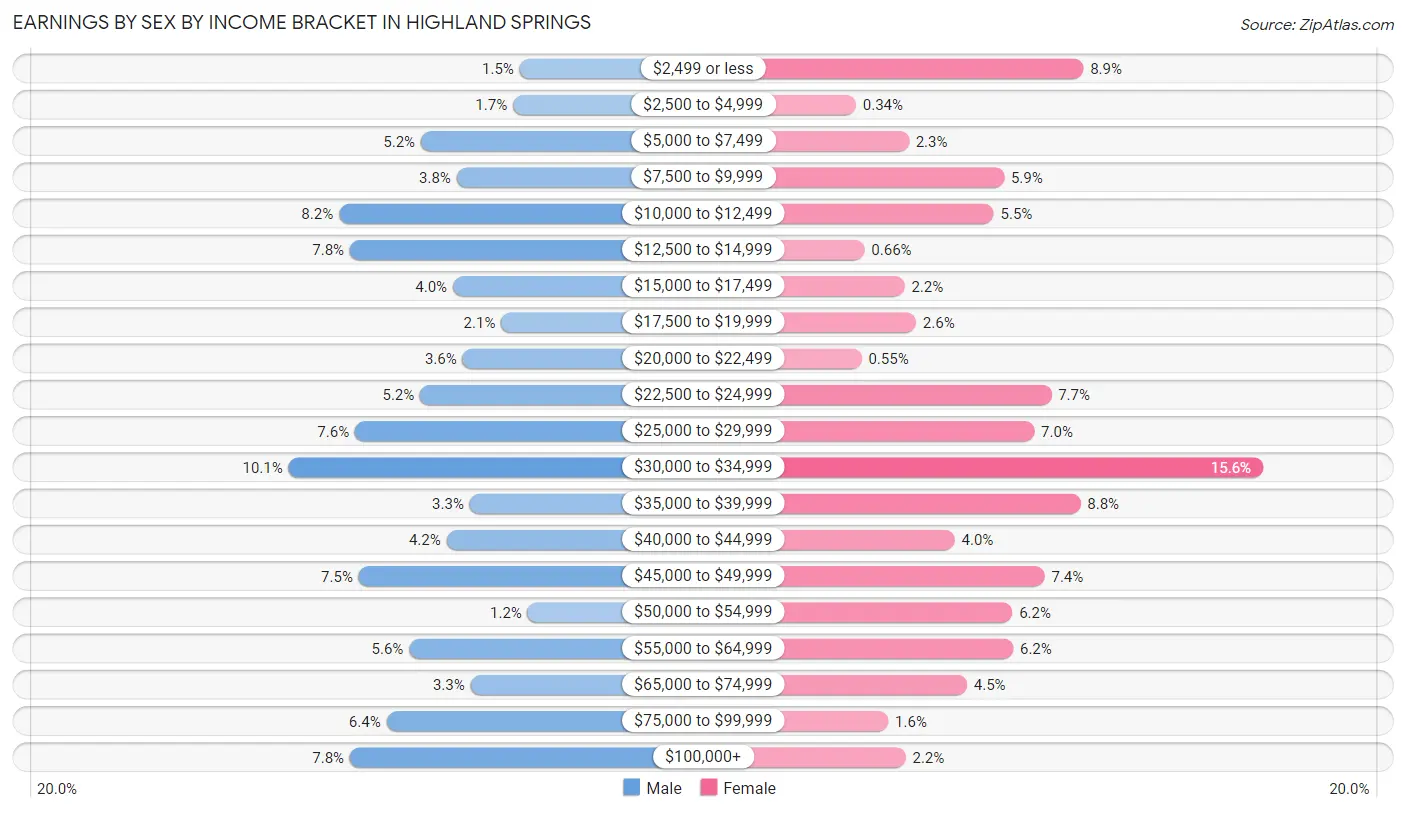
Earnings by Sex by Income Bracket in Highland Springs
The most common earnings brackets in Highland Springs are $30,000 to $34,999 for men (369 | 10.1%) and $30,000 to $34,999 for women (686 | 15.6%).
| Income | Male | Female |
| $2,499 or less | 53 (1.5%) | 390 (8.9%) |
| $2,500 to $4,999 | 62 (1.7%) | 15 (0.3%) |
| $5,000 to $7,499 | 188 (5.1%) | 102 (2.3%) |
| $7,500 to $9,999 | 139 (3.8%) | 259 (5.9%) |
| $10,000 to $12,499 | 300 (8.2%) | 242 (5.5%) |
| $12,500 to $14,999 | 285 (7.8%) | 29 (0.7%) |
| $15,000 to $17,499 | 144 (4.0%) | 95 (2.2%) |
| $17,500 to $19,999 | 78 (2.1%) | 114 (2.6%) |
| $20,000 to $22,499 | 131 (3.6%) | 24 (0.5%) |
| $22,500 to $24,999 | 189 (5.2%) | 337 (7.7%) |
| $25,000 to $29,999 | 278 (7.6%) | 309 (7.0%) |
| $30,000 to $34,999 | 369 (10.1%) | 686 (15.6%) |
| $35,000 to $39,999 | 121 (3.3%) | 385 (8.7%) |
| $40,000 to $44,999 | 153 (4.2%) | 178 (4.0%) |
| $45,000 to $49,999 | 273 (7.5%) | 326 (7.4%) |
| $50,000 to $54,999 | 42 (1.1%) | 273 (6.2%) |
| $55,000 to $64,999 | 204 (5.6%) | 274 (6.2%) |
| $65,000 to $74,999 | 120 (3.3%) | 198 (4.5%) |
| $75,000 to $99,999 | 235 (6.4%) | 68 (1.5%) |
| $100,000+ | 285 (7.8%) | 97 (2.2%) |
| Total | 3,649 (100.0%) | 4,401 (100.0%) |
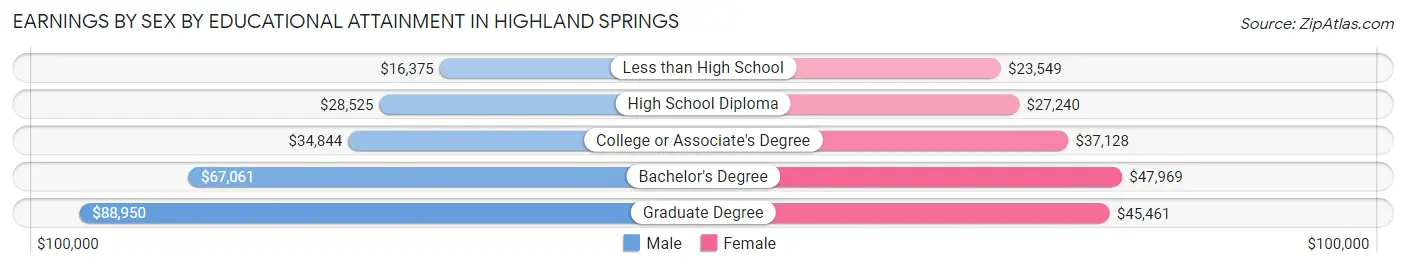
Earnings by Sex by Educational Attainment in Highland Springs
Average earnings in Highland Springs are $33,335 for men and $34,914 for women, a difference of 4.5%. Men with an educational attainment of graduate degree enjoy the highest average annual earnings of $88,950, while those with less than high school education earn the least with $16,375. Women with an educational attainment of bachelor's degree earn the most with the average annual earnings of $47,969, while those with less than high school education have the smallest earnings of $23,549.
| Educational Attainment | Male Income | Female Income |
| Less than High School | $16,375 | $23,549 |
| High School Diploma | $28,525 | $27,240 |
| College or Associate's Degree | $34,844 | $37,128 |
| Bachelor's Degree | $67,061 | $47,969 |
| Graduate Degree | $88,950 | $45,461 |
| Total | $33,335 | $34,914 |
Family Income in Highland Springs
Family Income Brackets in Highland Springs
According to the Highland Springs family income data, there are 1,062 families falling into the $50,000 to $74,999 income range, which is the most common income bracket and makes up 30.6% of all families. Conversely, the $10,000 to $14,999 income bracket is the least frequent group with only 49 families (1.4%) belonging to this category.
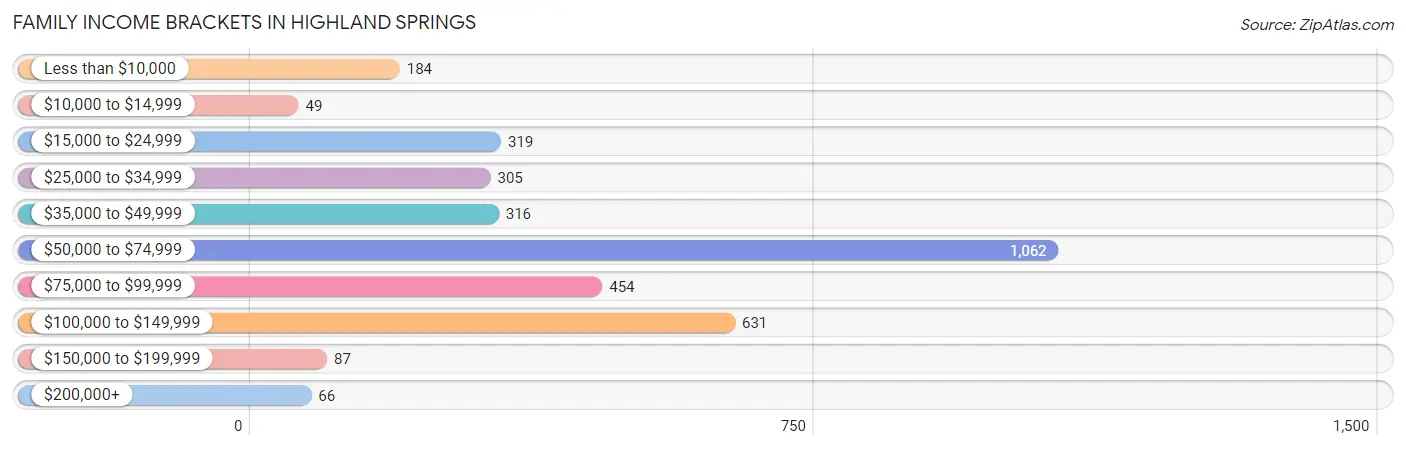
| Income Bracket | # Families | % Families |
| Less than $10,000 | 184 | 5.3% |
| $10,000 to $14,999 | 49 | 1.4% |
| $15,000 to $24,999 | 319 | 9.2% |
| $25,000 to $34,999 | 305 | 8.8% |
| $35,000 to $49,999 | 316 | 9.1% |
| $50,000 to $74,999 | 1,062 | 30.6% |
| $75,000 to $99,999 | 454 | 13.1% |
| $100,000 to $149,999 | 631 | 18.2% |
| $150,000 to $199,999 | 87 | 2.5% |
| $200,000+ | 66 | 1.9% |
Family Income by Famaliy Size in Highland Springs
4-person families (358 | 10.3%) account for the highest median family income in Highland Springs with $114,514 per family, while 2-person families (1,332 | 38.4%) have the highest median income of $30,268 per family member.
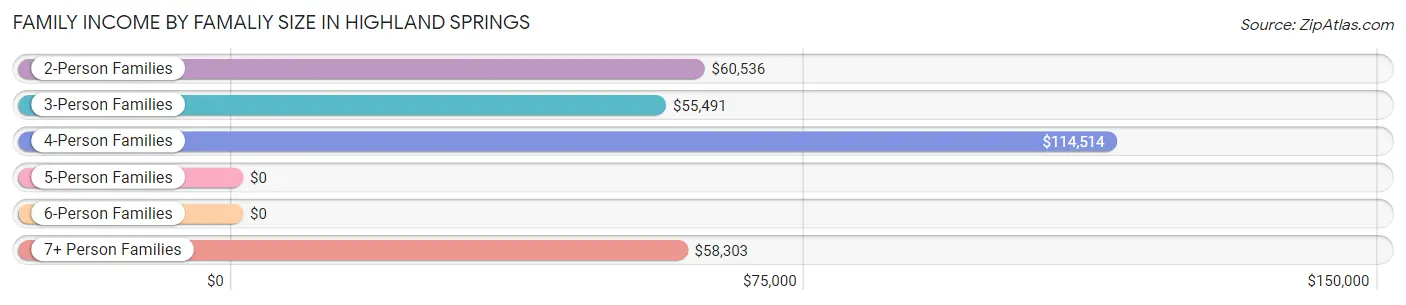
| Income Bracket | # Families | Median Income |
| 2-Person Families | 1,332 (38.4%) | $60,536 |
| 3-Person Families | 1,350 (38.9%) | $55,491 |
| 4-Person Families | 358 (10.3%) | $114,514 |
| 5-Person Families | 181 (5.2%) | $0 |
| 6-Person Families | 119 (3.4%) | $0 |
| 7+ Person Families | 129 (3.7%) | $58,303 |
| Total | 3,469 (100.0%) | $59,279 |
Family Income by Number of Earners in Highland Springs
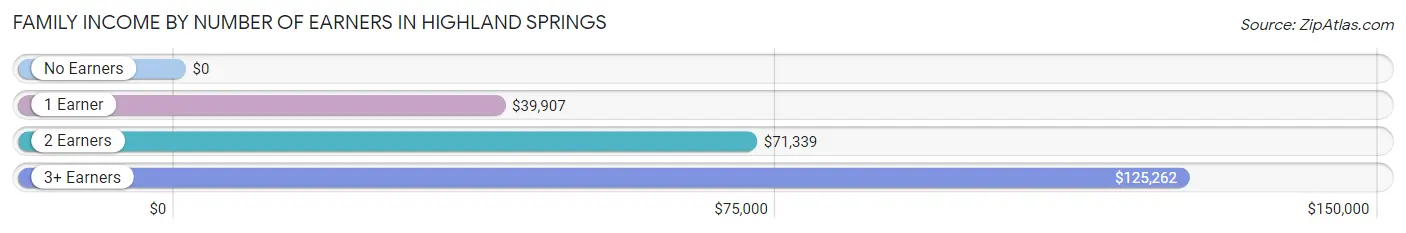
| Number of Earners | # Families | Median Income |
| No Earners | 435 (12.5%) | $0 |
| 1 Earner | 1,185 (34.2%) | $39,907 |
| 2 Earners | 1,304 (37.6%) | $71,339 |
| 3+ Earners | 545 (15.7%) | $125,262 |
| Total | 3,469 (100.0%) | $59,279 |
Household Income in Highland Springs
Household Income Brackets in Highland Springs
With 1,548 households falling in the category, the $50,000 to $74,999 income range is the most frequent in Highland Springs, accounting for 26.3% of all households. In contrast, only 88 households (1.5%) fall into the $200,000+ income bracket, making it the least populous group.
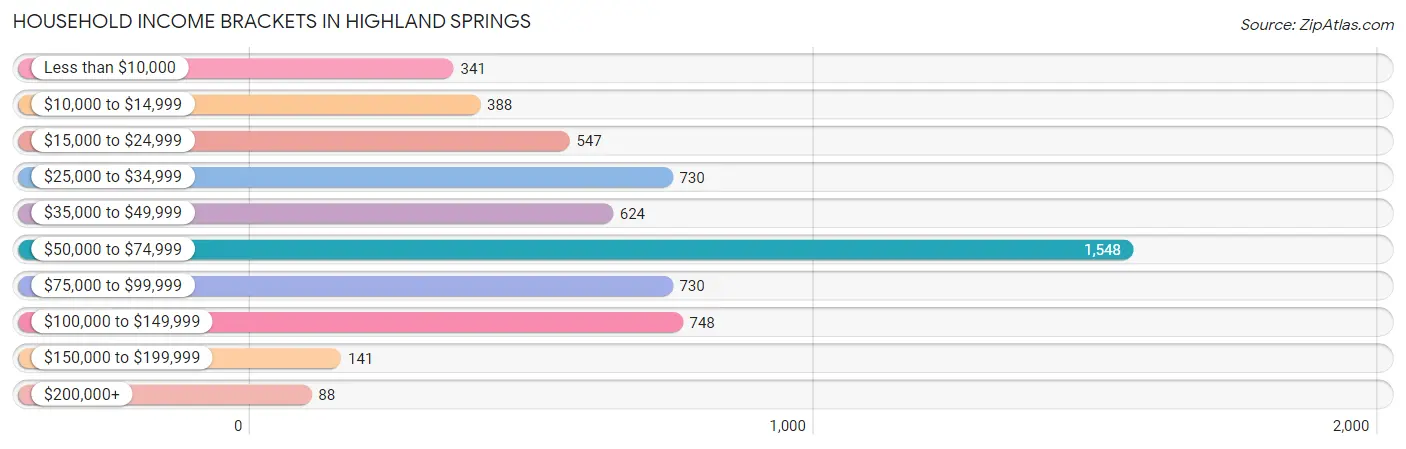
| Income Bracket | # Households | % Households |
| Less than $10,000 | 341 | 5.8% |
| $10,000 to $14,999 | 388 | 6.6% |
| $15,000 to $24,999 | 547 | 9.3% |
| $25,000 to $34,999 | 730 | 12.4% |
| $35,000 to $49,999 | 624 | 10.6% |
| $50,000 to $74,999 | 1,548 | 26.3% |
| $75,000 to $99,999 | 730 | 12.4% |
| $100,000 to $149,999 | 748 | 12.7% |
| $150,000 to $199,999 | 141 | 2.4% |
| $200,000+ | 88 | 1.5% |
Household Income by Householder Age in Highland Springs
The median household income in Highland Springs is $54,270, with the highest median household income of $60,530 found in the 45 to 64 years age bracket for the primary householder. A total of 2,197 households (37.3%) fall into this category. Meanwhile, the 15 to 24 years age bracket for the primary householder has the lowest median household income of $21,172, with 218 households (3.7%) in this group.
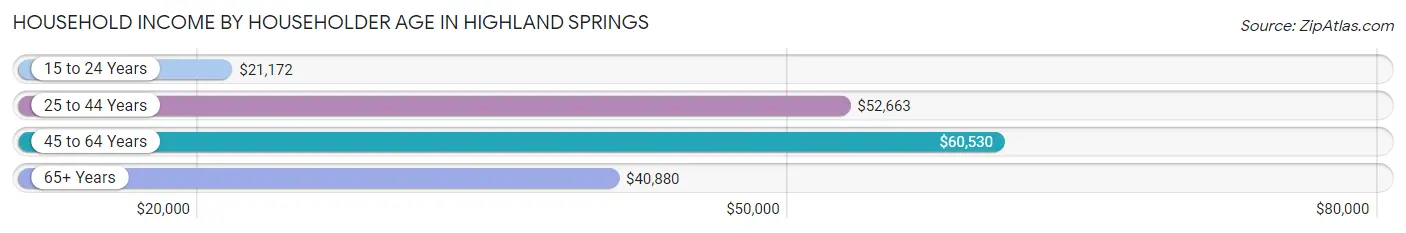
| Income Bracket | # Households | Median Income |
| 15 to 24 Years | 218 (3.7%) | $21,172 |
| 25 to 44 Years | 1,924 (32.7%) | $52,663 |
| 45 to 64 Years | 2,197 (37.3%) | $60,530 |
| 65+ Years | 1,547 (26.3%) | $40,880 |
| Total | 5,886 (100.0%) | $54,270 |
Poverty in Highland Springs
Income Below Poverty by Sex and Age in Highland Springs
With 18.2% poverty level for males and 19.9% for females among the residents of Highland Springs, 75 year old and over males and 16 and 17 year old females are the most vulnerable to poverty, with 228 males (59.7%) and 87 females (62.1%) in their respective age groups living below the poverty level.
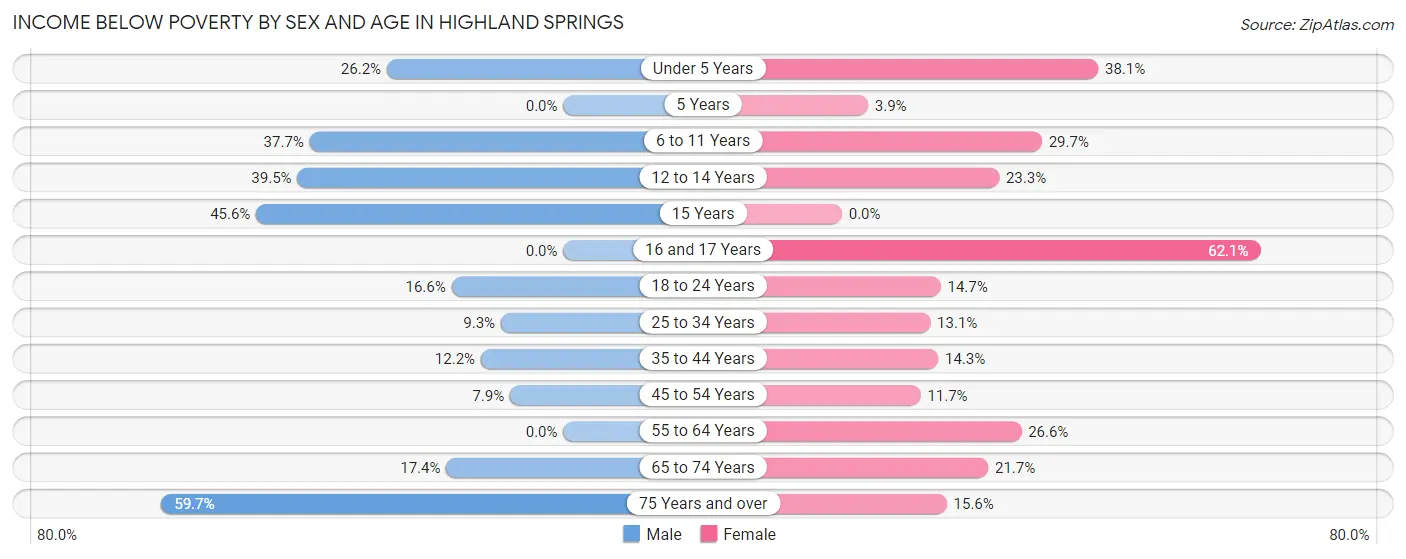
| Age Bracket | Male | Female |
| Under 5 Years | 131 (26.2%) | 129 (38.1%) |
| 5 Years | 0 (0.0%) | 6 (3.9%) |
| 6 to 11 Years | 165 (37.7%) | 198 (29.7%) |
| 12 to 14 Years | 154 (39.5%) | 102 (23.3%) |
| 15 Years | 52 (45.6%) | 0 (0.0%) |
| 16 and 17 Years | 0 (0.0%) | 87 (62.1%) |
| 18 to 24 Years | 117 (16.6%) | 135 (14.7%) |
| 25 to 34 Years | 72 (9.3%) | 117 (13.1%) |
| 35 to 44 Years | 89 (12.2%) | 153 (14.3%) |
| 45 to 54 Years | 72 (7.9%) | 111 (11.7%) |
| 55 to 64 Years | 0 (0.0%) | 317 (26.6%) |
| 65 to 74 Years | 158 (17.4%) | 167 (21.7%) |
| 75 Years and over | 228 (59.7%) | 42 (15.6%) |
| Total | 1,238 (18.2%) | 1,564 (19.9%) |
Income Above Poverty by Sex and Age in Highland Springs
According to the poverty statistics in Highland Springs, males aged 5 years and females aged 15 years are the age groups that are most secure financially, with 100.0% of males and 100.0% of females in these age groups living above the poverty line.
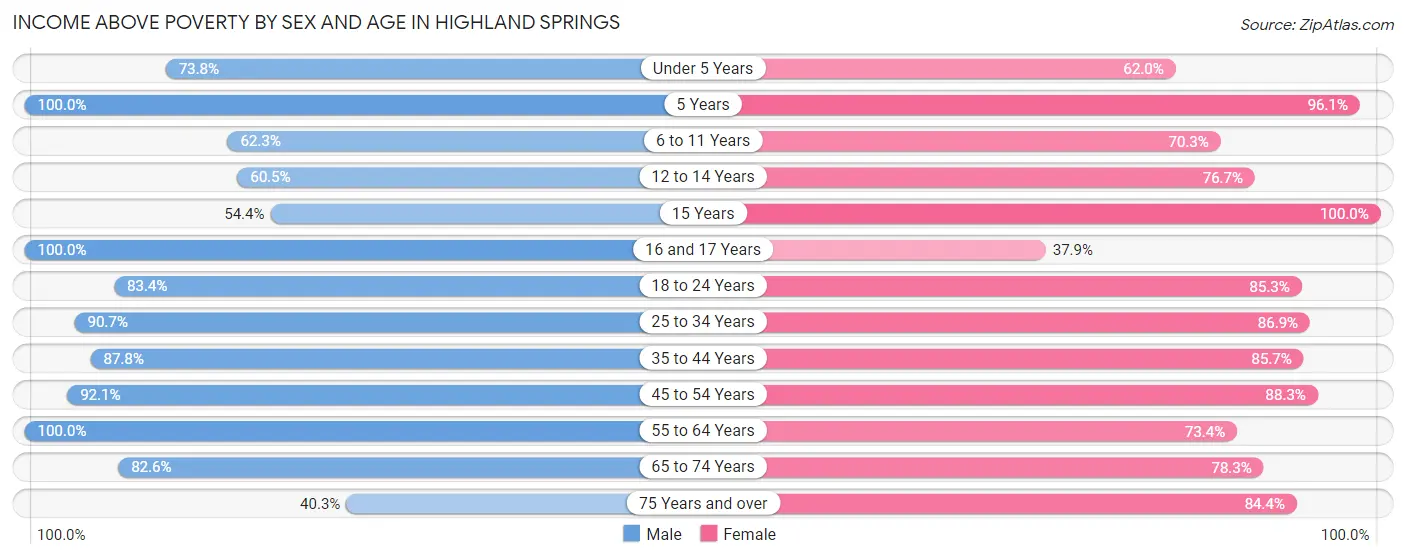
| Age Bracket | Male | Female |
| Under 5 Years | 369 (73.8%) | 210 (62.0%) |
| 5 Years | 60 (100.0%) | 149 (96.1%) |
| 6 to 11 Years | 273 (62.3%) | 469 (70.3%) |
| 12 to 14 Years | 236 (60.5%) | 335 (76.7%) |
| 15 Years | 62 (54.4%) | 64 (100.0%) |
| 16 and 17 Years | 94 (100.0%) | 53 (37.9%) |
| 18 to 24 Years | 588 (83.4%) | 786 (85.3%) |
| 25 to 34 Years | 705 (90.7%) | 775 (86.9%) |
| 35 to 44 Years | 638 (87.8%) | 918 (85.7%) |
| 45 to 54 Years | 837 (92.1%) | 839 (88.3%) |
| 55 to 64 Years | 802 (100.0%) | 873 (73.4%) |
| 65 to 74 Years | 751 (82.6%) | 602 (78.3%) |
| 75 Years and over | 154 (40.3%) | 228 (84.4%) |
| Total | 5,569 (81.8%) | 6,301 (80.1%) |
Income Below Poverty Among Married-Couple Families in Highland Springs
The poverty statistics for married-couple families in Highland Springs show that 9.9% or 165 of the total 1,669 families live below the poverty line. Families with 3 or 4 children have the highest poverty rate of 41.1%, comprising of 37 families. On the other hand, families with 5 or more children have the lowest poverty rate of 0.0%, which includes 0 families.
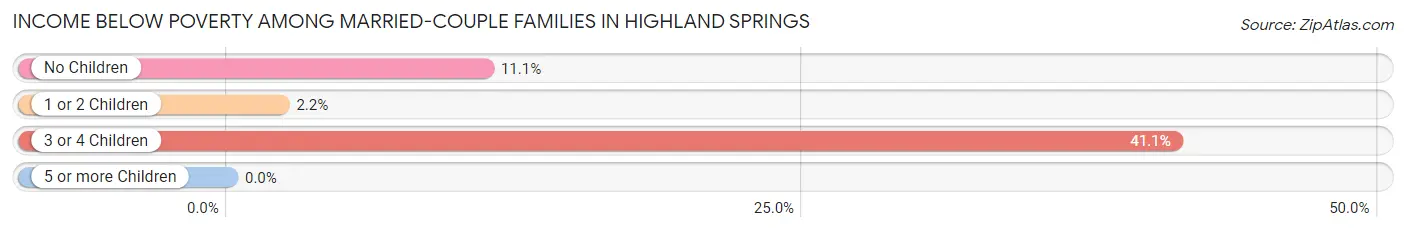
| Children | Above Poverty | Below Poverty |
| No Children | 933 (88.9%) | 117 (11.1%) |
| 1 or 2 Children | 481 (97.8%) | 11 (2.2%) |
| 3 or 4 Children | 53 (58.9%) | 37 (41.1%) |
| 5 or more Children | 37 (100.0%) | 0 (0.0%) |
| Total | 1,504 (90.1%) | 165 (9.9%) |
Income Below Poverty Among Single-Parent Households in Highland Springs
According to the poverty data in Highland Springs, 19.9% or 84 single-father households and 20.5% or 283 single-mother households are living below the poverty line. Among single-father households, those with 1 or 2 children have the highest poverty rate, with 84 households (39.3%) experiencing poverty. Likewise, among single-mother households, those with 5 or more children have the highest poverty rate, with 34 households (100.0%) falling below the poverty line.
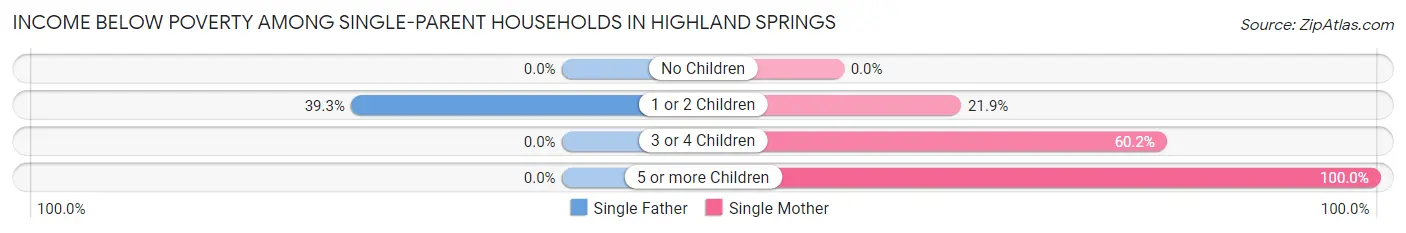
| Children | Single Father | Single Mother |
| No Children | 0 (0.0%) | 0 (0.0%) |
| 1 or 2 Children | 84 (39.3%) | 175 (21.9%) |
| 3 or 4 Children | 0 (0.0%) | 74 (60.2%) |
| 5 or more Children | 0 (0.0%) | 34 (100.0%) |
| Total | 84 (19.9%) | 283 (20.5%) |
Income Below Poverty Among Married-Couple vs Single-Parent Households in Highland Springs
The poverty data for Highland Springs shows that 165 of the married-couple family households (9.9%) and 367 of the single-parent households (20.4%) are living below the poverty level. Within the married-couple family households, those with 3 or 4 children have the highest poverty rate, with 37 households (41.1%) falling below the poverty line. Among the single-parent households, those with 5 or more children have the highest poverty rate, with 34 household (100.0%) living below poverty.
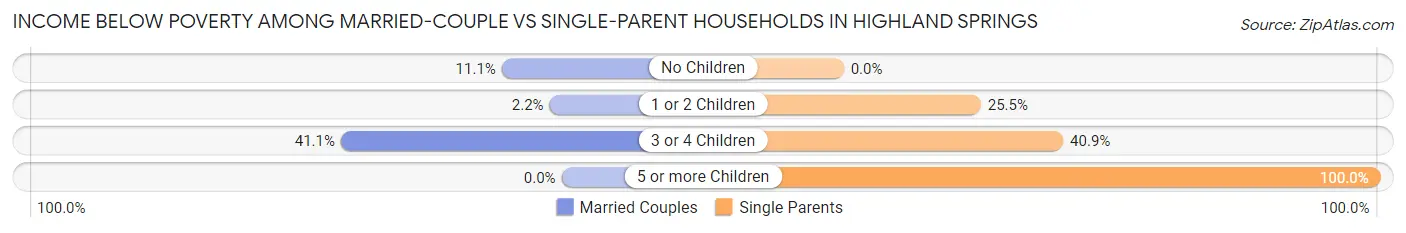
| Children | Married-Couple Families | Single-Parent Households |
| No Children | 117 (11.1%) | 0 (0.0%) |
| 1 or 2 Children | 11 (2.2%) | 259 (25.5%) |
| 3 or 4 Children | 37 (41.1%) | 74 (40.9%) |
| 5 or more Children | 0 (0.0%) | 34 (100.0%) |
| Total | 165 (9.9%) | 367 (20.4%) |
Race in Highland Springs
The most populous races in Highland Springs are Black / African American (10,990 | 73.9%), White / Caucasian (3,152 | 21.2%), and Two or more Races (518 | 3.5%).
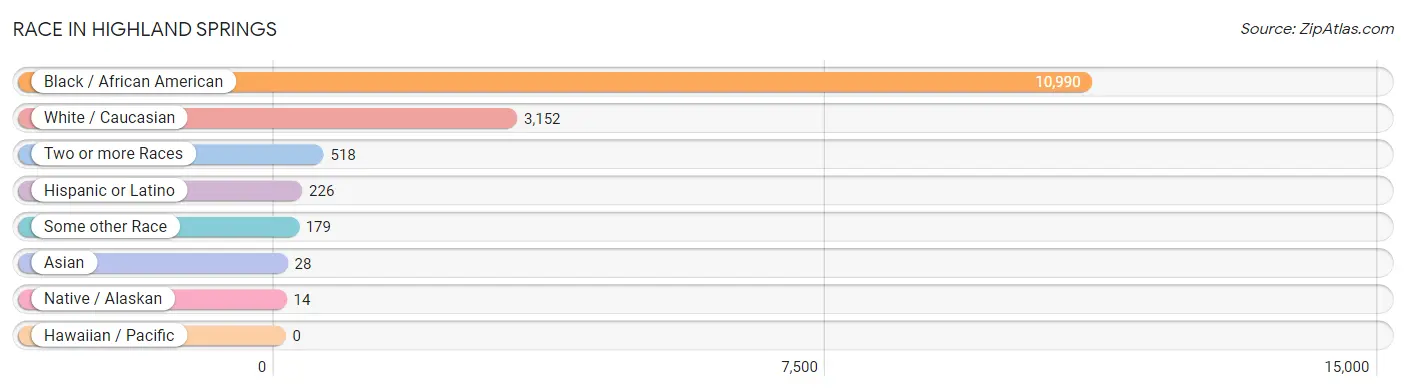
| Race | # Population | % Population |
| Asian | 28 | 0.2% |
| Black / African American | 10,990 | 73.9% |
| Hawaiian / Pacific | 0 | 0.0% |
| Hispanic or Latino | 226 | 1.5% |
| Native / Alaskan | 14 | 0.1% |
| White / Caucasian | 3,152 | 21.2% |
| Two or more Races | 518 | 3.5% |
| Some other Race | 179 | 1.2% |
| Total | 14,881 | 100.0% |
Ancestry in Highland Springs
The most populous ancestries reported in Highland Springs are American (1,022 | 6.9%), English (857 | 5.8%), Irish (699 | 4.7%), Subsaharan African (645 | 4.3%), and German (466 | 3.1%), together accounting for 24.8% of all Highland Springs residents.
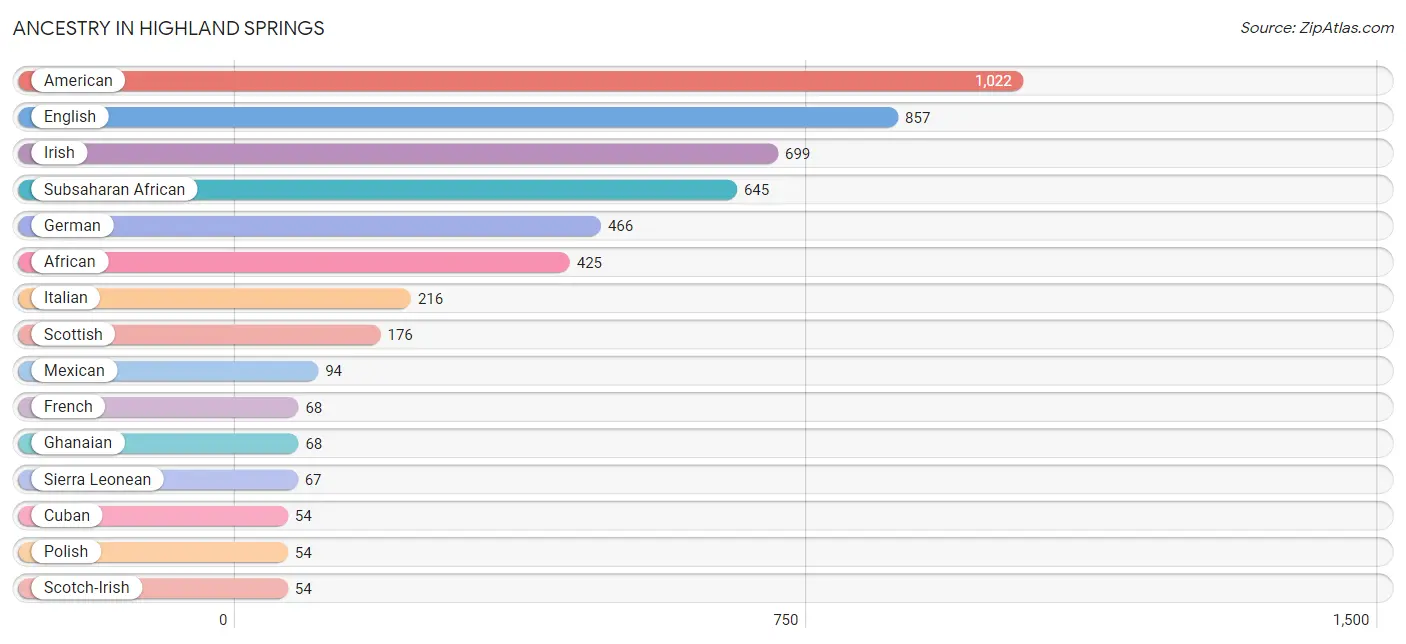
| Ancestry | # Population | % Population |
| African | 425 | 2.9% |
| American | 1,022 | 6.9% |
| Arab | 53 | 0.4% |
| Brazilian | 10 | 0.1% |
| British | 33 | 0.2% |
| British West Indian | 40 | 0.3% |
| Burmese | 18 | 0.1% |
| Cherokee | 26 | 0.2% |
| Cuban | 54 | 0.4% |
| Czech | 19 | 0.1% |
| Danish | 12 | 0.1% |
| Dutch | 39 | 0.3% |
| Egyptian | 15 | 0.1% |
| English | 857 | 5.8% |
| Ethiopian | 1 | 0.0% |
| European | 28 | 0.2% |
| French | 68 | 0.5% |
| German | 466 | 3.1% |
| Ghanaian | 68 | 0.5% |
| Greek | 12 | 0.1% |
| Haitian | 9 | 0.1% |
| Hungarian | 10 | 0.1% |
| Indian (Asian) | 28 | 0.2% |
| Irish | 699 | 4.7% |
| Italian | 216 | 1.5% |
| Jamaican | 24 | 0.2% |
| Japanese | 19 | 0.1% |
| Mexican | 94 | 0.6% |
| Moroccan | 38 | 0.3% |
| Nigerian | 24 | 0.2% |
| Polish | 54 | 0.4% |
| Portuguese | 24 | 0.2% |
| Puerto Rican | 46 | 0.3% |
| Scotch-Irish | 54 | 0.4% |
| Scottish | 176 | 1.2% |
| Sierra Leonean | 67 | 0.4% |
| Spaniard | 27 | 0.2% |
| Subsaharan African | 645 | 4.3% |
| Swedish | 9 | 0.1% |
| Welsh | 7 | 0.1% | View All 40 Rows |
Immigrants in Highland Springs
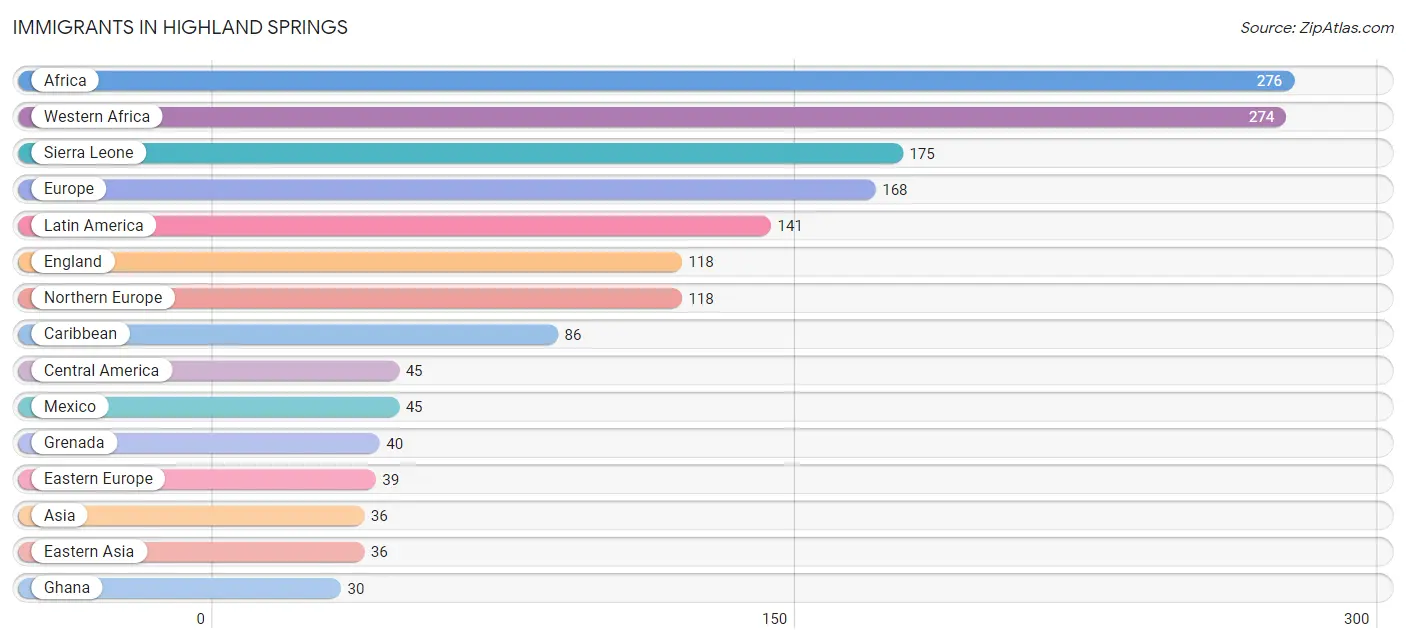
The most numerous immigrant groups reported in Highland Springs came from Africa (276 | 1.8%), Western Africa (274 | 1.8%), Sierra Leone (175 | 1.2%), Europe (168 | 1.1%), and Latin America (141 | 0.9%), together accounting for 6.9% of all Highland Springs residents.
| Immigration Origin | # Population | % Population |
| Africa | 276 | 1.8% |
| Asia | 36 | 0.2% |
| Belarus | 14 | 0.1% |
| Brazil | 10 | 0.1% |
| Caribbean | 86 | 0.6% |
| Central America | 45 | 0.3% |
| China | 18 | 0.1% |
| Eastern Africa | 2 | 0.0% |
| Eastern Asia | 36 | 0.2% |
| Eastern Europe | 39 | 0.3% |
| England | 118 | 0.8% |
| Ethiopia | 1 | 0.0% |
| Europe | 168 | 1.1% |
| Germany | 11 | 0.1% |
| Ghana | 30 | 0.2% |
| Grenada | 40 | 0.3% |
| Hungary | 10 | 0.1% |
| Korea | 18 | 0.1% |
| Latin America | 141 | 0.9% |
| Mexico | 45 | 0.3% |
| Northern Europe | 118 | 0.8% |
| Sierra Leone | 175 | 1.2% |
| South America | 10 | 0.1% |
| Ukraine | 15 | 0.1% |
| Western Africa | 274 | 1.8% |
| Western Europe | 11 | 0.1% | View All 26 Rows |
Sex and Age in Highland Springs
Sex and Age in Highland Springs
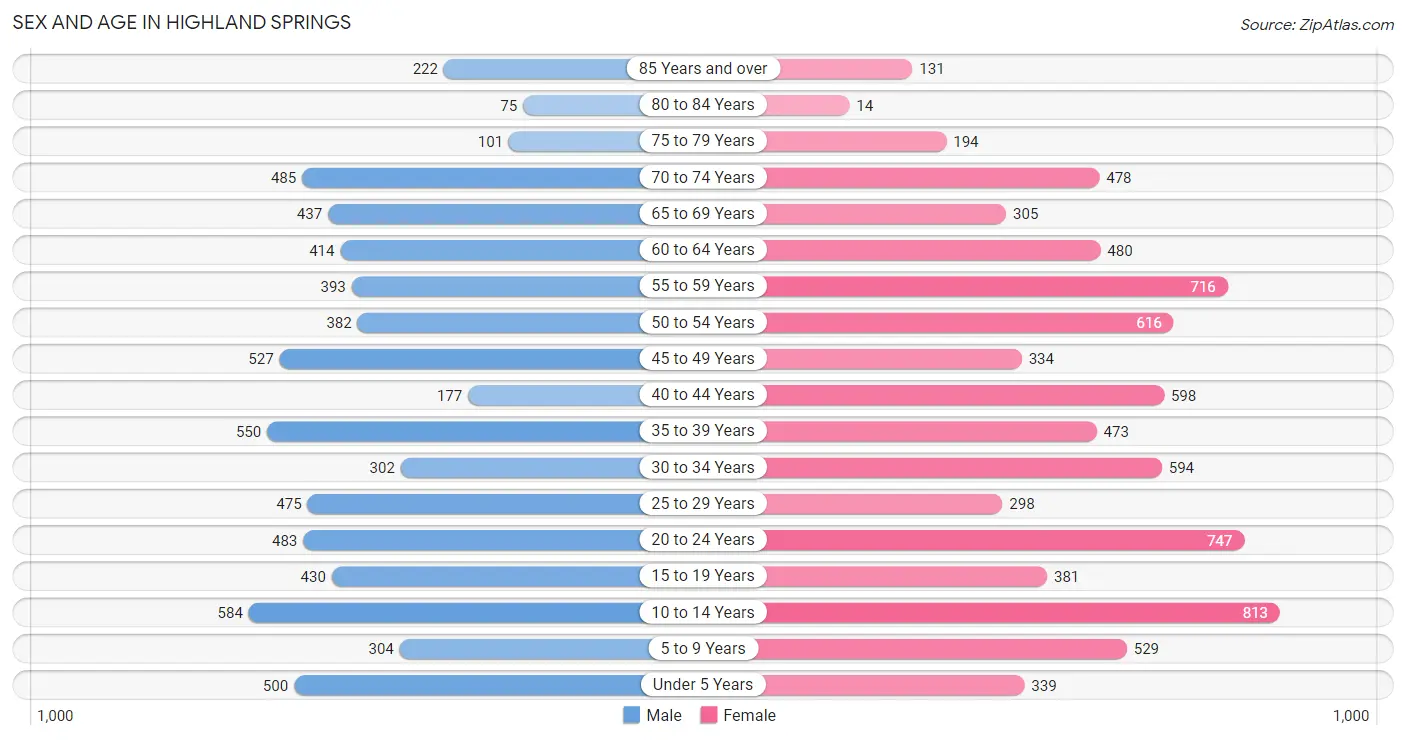
The most populous age groups in Highland Springs are 10 to 14 Years (584 | 8.5%) for men and 10 to 14 Years (813 | 10.1%) for women.
| Age Bracket | Male | Female |
| Under 5 Years | 500 (7.3%) | 339 (4.2%) |
| 5 to 9 Years | 304 (4.4%) | 529 (6.6%) |
| 10 to 14 Years | 584 (8.5%) | 813 (10.1%) |
| 15 to 19 Years | 430 (6.3%) | 381 (4.7%) |
| 20 to 24 Years | 483 (7.1%) | 747 (9.3%) |
| 25 to 29 Years | 475 (6.9%) | 298 (3.7%) |
| 30 to 34 Years | 302 (4.4%) | 594 (7.4%) |
| 35 to 39 Years | 550 (8.0%) | 473 (5.9%) |
| 40 to 44 Years | 177 (2.6%) | 598 (7.4%) |
| 45 to 49 Years | 527 (7.7%) | 334 (4.2%) |
| 50 to 54 Years | 382 (5.6%) | 616 (7.7%) |
| 55 to 59 Years | 393 (5.7%) | 716 (8.9%) |
| 60 to 64 Years | 414 (6.0%) | 480 (6.0%) |
| 65 to 69 Years | 437 (6.4%) | 305 (3.8%) |
| 70 to 74 Years | 485 (7.1%) | 478 (5.9%) |
| 75 to 79 Years | 101 (1.5%) | 194 (2.4%) |
| 80 to 84 Years | 75 (1.1%) | 14 (0.2%) |
| 85 Years and over | 222 (3.3%) | 131 (1.6%) |
| Total | 6,841 (100.0%) | 8,040 (100.0%) |
Families and Households in Highland Springs
Median Family Size in Highland Springs
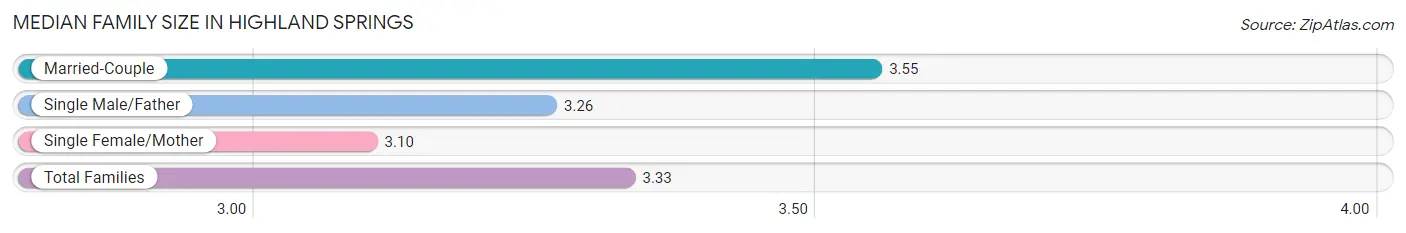
The median family size in Highland Springs is 3.33 persons per family, with married-couple families (1,669 | 48.1%) accounting for the largest median family size of 3.55 persons per family. On the other hand, single female/mother families (1,378 | 39.7%) represent the smallest median family size with 3.10 persons per family.
| Family Type | # Families | Family Size |
| Married-Couple | 1,669 (48.1%) | 3.55 |
| Single Male/Father | 422 (12.2%) | 3.26 |
| Single Female/Mother | 1,378 (39.7%) | 3.10 |
| Total Families | 3,469 (100.0%) | 3.33 |
Median Household Size in Highland Springs
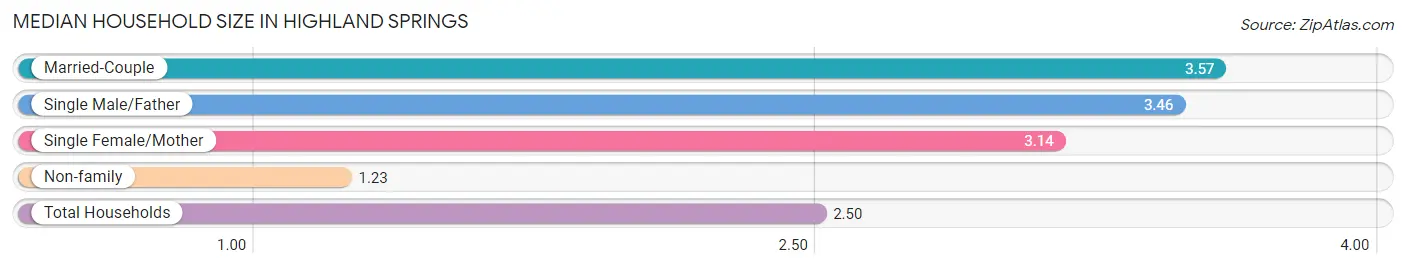
The median household size in Highland Springs is 2.50 persons per household, with married-couple households (1,669 | 28.4%) accounting for the largest median household size of 3.57 persons per household. non-family households (2,417 | 41.1%) represent the smallest median household size with 1.23 persons per household.
| Household Type | # Households | Household Size |
| Married-Couple | 1,669 (28.4%) | 3.57 |
| Single Male/Father | 422 (7.2%) | 3.46 |
| Single Female/Mother | 1,378 (23.4%) | 3.14 |
| Non-family | 2,417 (41.1%) | 1.23 |
| Total Households | 5,886 (100.0%) | 2.50 |
Household Size by Marriage Status in Highland Springs
Out of a total of 5,886 households in Highland Springs, 3,469 (58.9%) are family households, while 2,417 (41.1%) are nonfamily households. The most numerous type of family households are 2-person households, comprising 1,307, and the most common type of nonfamily households are 1-person households, comprising 2,041.
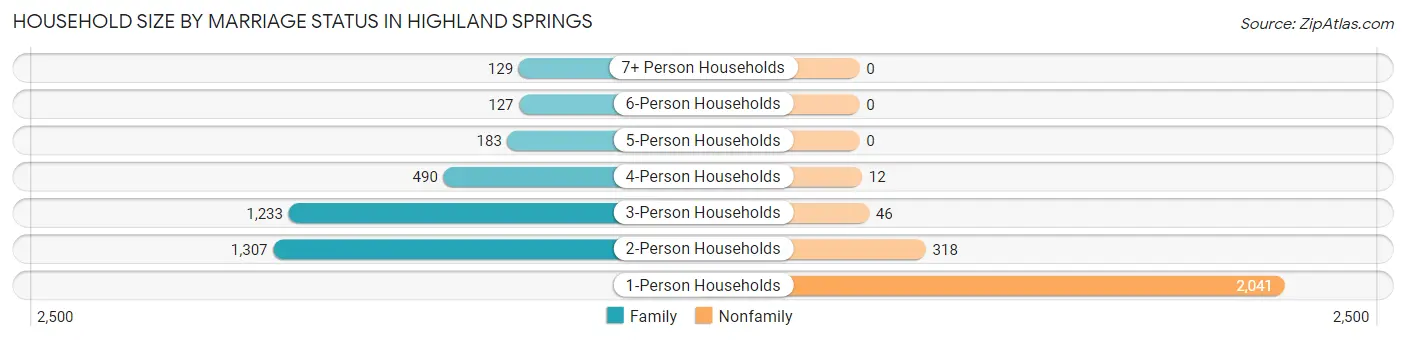
| Household Size | Family Households | Nonfamily Households |
| 1-Person Households | - | 2,041 (34.7%) |
| 2-Person Households | 1,307 (22.2%) | 318 (5.4%) |
| 3-Person Households | 1,233 (20.9%) | 46 (0.8%) |
| 4-Person Households | 490 (8.3%) | 12 (0.2%) |
| 5-Person Households | 183 (3.1%) | 0 (0.0%) |
| 6-Person Households | 127 (2.2%) | 0 (0.0%) |
| 7+ Person Households | 129 (2.2%) | 0 (0.0%) |
| Total | 3,469 (58.9%) | 2,417 (41.1%) |
Female Fertility in Highland Springs
Fertility by Age in Highland Springs
Average fertility rate in Highland Springs is 77.0 births per 1,000 women. Women in the age bracket of 20 to 34 years have the highest fertility rate with 165.0 births per 1,000 women. Women in the age bracket of 20 to 34 years acount for 100.0% of all women with births.
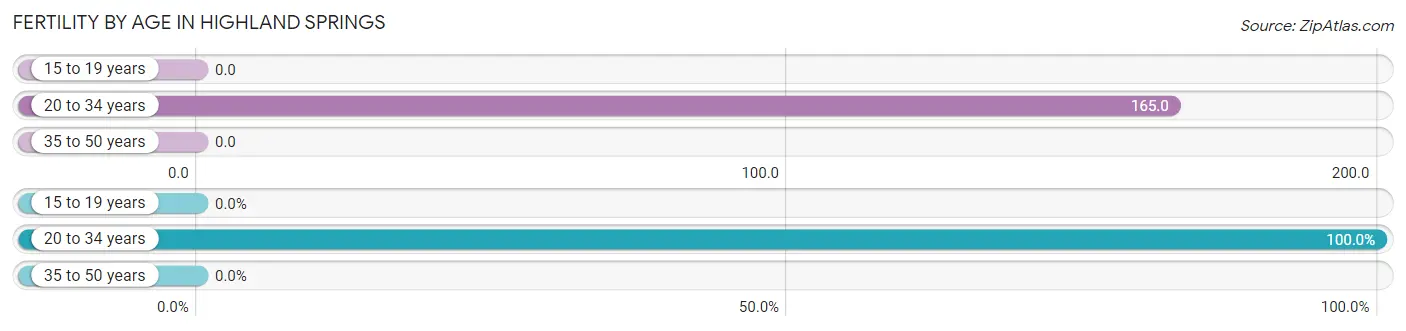
| Age Bracket | Women with Births | Births / 1,000 Women |
| 15 to 19 years | 0 (0.0%) | 0.0 |
| 20 to 34 years | 271 (100.0%) | 165.0 |
| 35 to 50 years | 0 (0.0%) | 0.0 |
| Total | 271 (100.0%) | 77.0 |
Fertility by Age by Marriage Status in Highland Springs
41.3% of women with births (271) in Highland Springs are married. The highest percentage of unmarried women with births falls into 20 to 34 years age bracket with 58.7% of them unmarried at the time of birth, while the lowest percentage of unmarried women with births belong to 20 to 34 years age bracket with 58.7% of them unmarried.
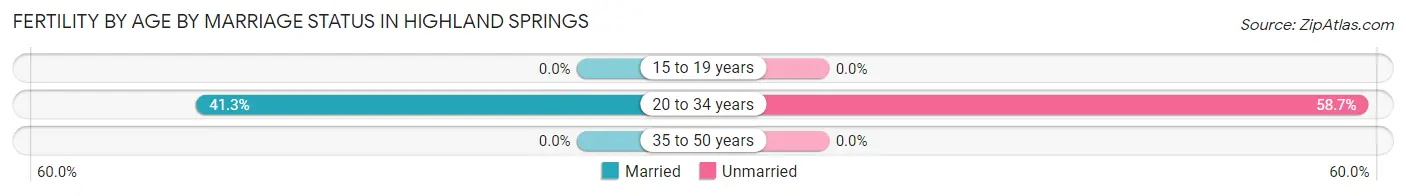
| Age Bracket | Married | Unmarried |
| 15 to 19 years | 0 (0.0%) | 0 (0.0%) |
| 20 to 34 years | 112 (41.3%) | 159 (58.7%) |
| 35 to 50 years | 0 (0.0%) | 0 (0.0%) |
| Total | 112 (41.3%) | 159 (58.7%) |
Fertility by Education in Highland Springs
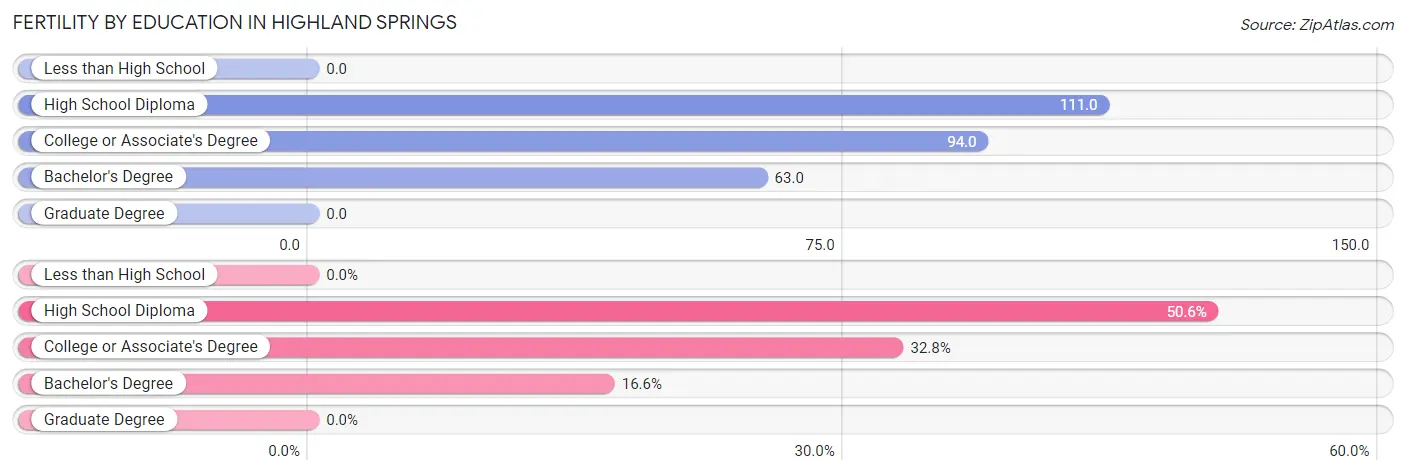
| Educational Attainment | Women with Births | Births / 1,000 Women |
| Less than High School | 0 (0.0%) | 0.0 |
| High School Diploma | 137 (50.5%) | 111.0 |
| College or Associate's Degree | 89 (32.8%) | 94.0 |
| Bachelor's Degree | 45 (16.6%) | 63.0 |
| Graduate Degree | 0 (0.0%) | 0.0 |
| Total | 271 (100.0%) | 77.0 |
Fertility by Education by Marriage Status in Highland Springs
58.7% of women with births in Highland Springs are unmarried. Women with the educational attainment of bachelor's degree are most likely to be married with 100.0% of them married at childbirth, while women with the educational attainment of college or associate's degree are least likely to be married with 71.9% of them unmarried at childbirth.
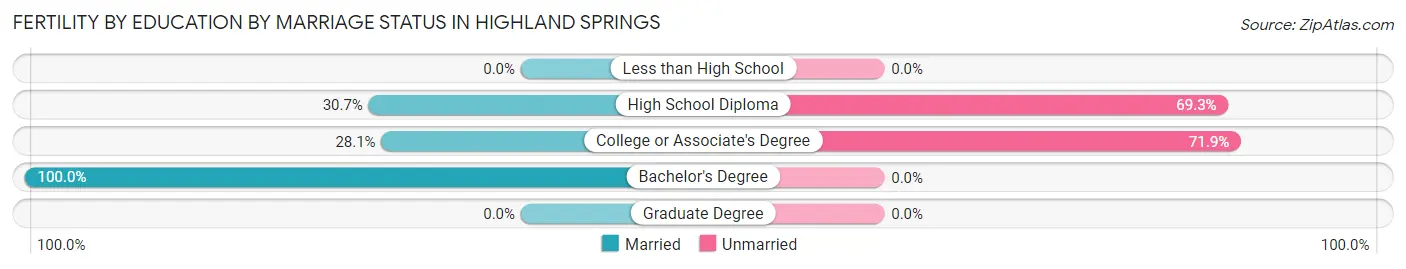
| Educational Attainment | Married | Unmarried |
| Less than High School | 0 (0.0%) | 0 (0.0%) |
| High School Diploma | 42 (30.7%) | 95 (69.3%) |
| College or Associate's Degree | 25 (28.1%) | 64 (71.9%) |
| Bachelor's Degree | 45 (100.0%) | 0 (0.0%) |
| Graduate Degree | 0 (0.0%) | 0 (0.0%) |
| Total | 112 (41.3%) | 159 (58.7%) |
Employment Characteristics in Highland Springs
Employment by Class of Employer in Highland Springs
Among the 7,270 employed individuals in Highland Springs, private company employees (5,261 | 72.4%), state government employees (618 | 8.5%), and local government employees (600 | 8.3%) make up the most common classes of employment.
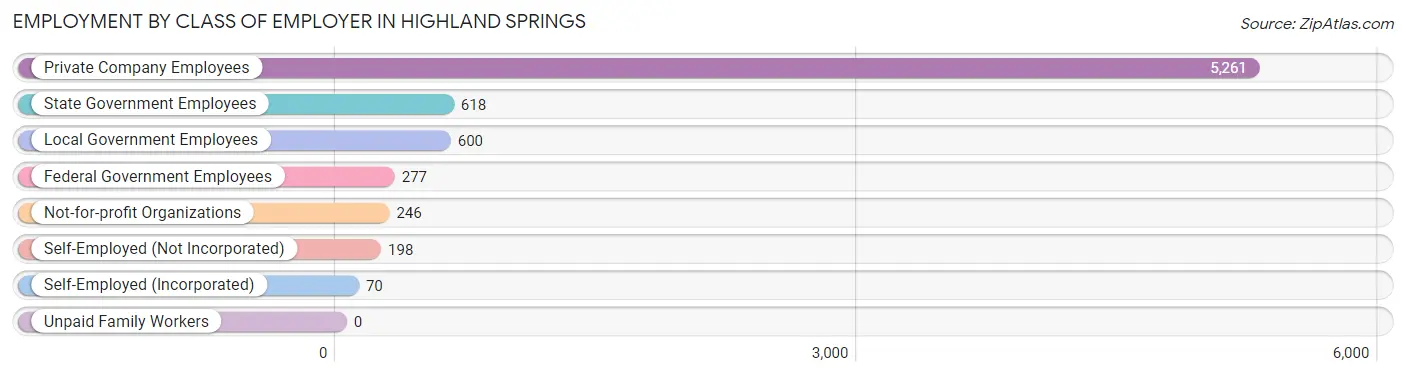
| Employer Class | # Employees | % Employees |
| Private Company Employees | 5,261 | 72.4% |
| Self-Employed (Incorporated) | 70 | 1.0% |
| Self-Employed (Not Incorporated) | 198 | 2.7% |
| Not-for-profit Organizations | 246 | 3.4% |
| Local Government Employees | 600 | 8.3% |
| State Government Employees | 618 | 8.5% |
| Federal Government Employees | 277 | 3.8% |
| Unpaid Family Workers | 0 | 0.0% |
| Total | 7,270 | 100.0% |
Employment Status by Age in Highland Springs
According to the labor force statistics for Highland Springs, out of the total population over 16 years of age (11,632), 67.0% or 7,793 individuals are in the labor force, with 5.4% or 421 of them unemployed. The age group with the highest labor force participation rate is 30 to 34 years, with 95.0% or 851 individuals in the labor force. Within the labor force, the 20 to 24 years age range has the highest percentage of unemployed individuals, with 10.8% or 111 of them being unemployed.
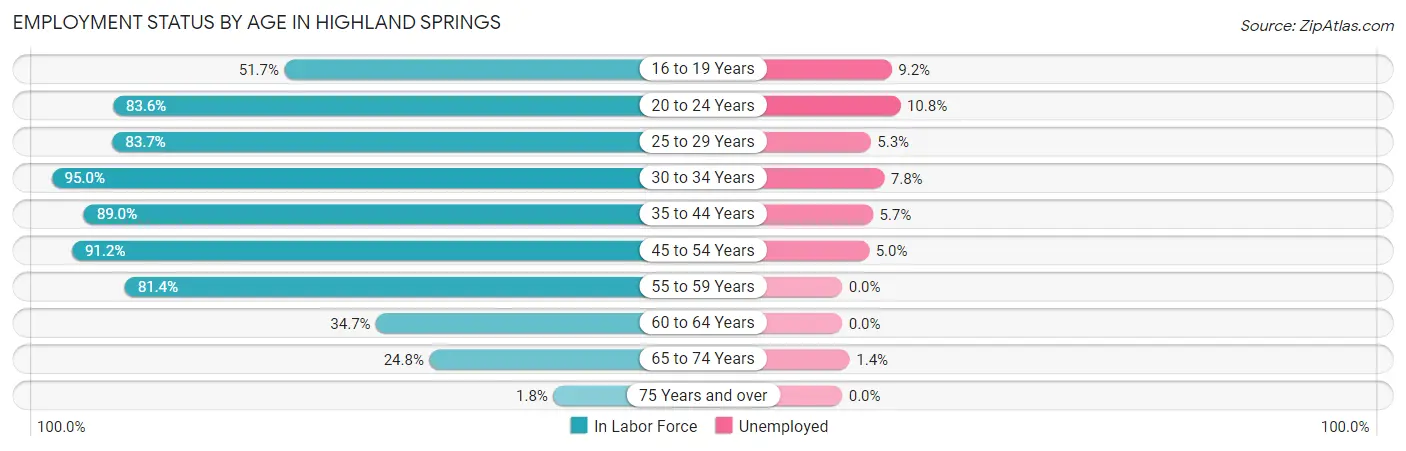
| Age Bracket | In Labor Force | Unemployed |
| 16 to 19 Years | 326 (51.7%) | 30 (9.2%) |
| 20 to 24 Years | 1,028 (83.6%) | 111 (10.8%) |
| 25 to 29 Years | 647 (83.7%) | 34 (5.3%) |
| 30 to 34 Years | 851 (95.0%) | 66 (7.8%) |
| 35 to 44 Years | 1,600 (89.0%) | 91 (5.7%) |
| 45 to 54 Years | 1,695 (91.2%) | 85 (5.0%) |
| 55 to 59 Years | 903 (81.4%) | 0 (0.0%) |
| 60 to 64 Years | 310 (34.7%) | 0 (0.0%) |
| 65 to 74 Years | 423 (24.8%) | 6 (1.4%) |
| 75 Years and over | 13 (1.8%) | 0 (0.0%) |
| Total | 7,793 (67.0%) | 421 (5.4%) |
Employment Status by Educational Attainment in Highland Springs
According to labor force statistics for Highland Springs, 82.0% of individuals (6,010) out of the total population between 25 and 64 years of age (7,329) are in the labor force, with 4.6% or 276 of them being unemployed. The group with the highest labor force participation rate are those with the educational attainment of bachelor's degree or higher, with 96.7% or 1,491 individuals in the labor force. Within the labor force, individuals with less than high school education have the highest percentage of unemployment, with 14.1% or 50 of them being unemployed.
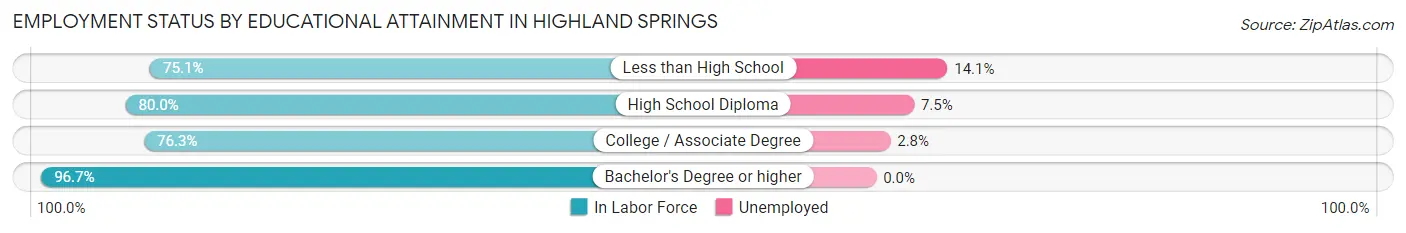
| Educational Attainment | In Labor Force | Unemployed |
| Less than High School | 355 (75.1%) | 67 (14.1%) |
| High School Diploma | 2,355 (80.0%) | 221 (7.5%) |
| College / Associate Degree | 1,808 (76.3%) | 66 (2.8%) |
| Bachelor's Degree or higher | 1,491 (96.7%) | 0 (0.0%) |
| Total | 6,010 (82.0%) | 337 (4.6%) |
Employment Occupations by Sex in Highland Springs
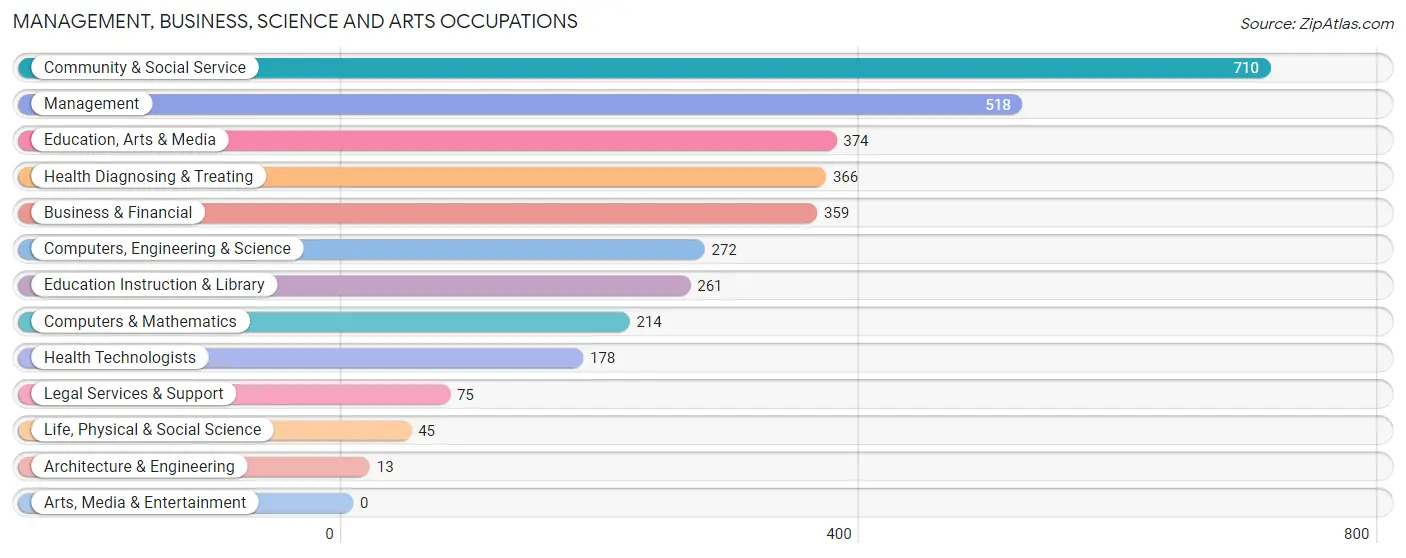
Management, Business, Science and Arts Occupations
The most common Management, Business, Science and Arts occupations in Highland Springs are Community & Social Service (710 | 9.6%), Management (518 | 7.0%), Education, Arts & Media (374 | 5.1%), Health Diagnosing & Treating (366 | 5.0%), and Business & Financial (359 | 4.9%).
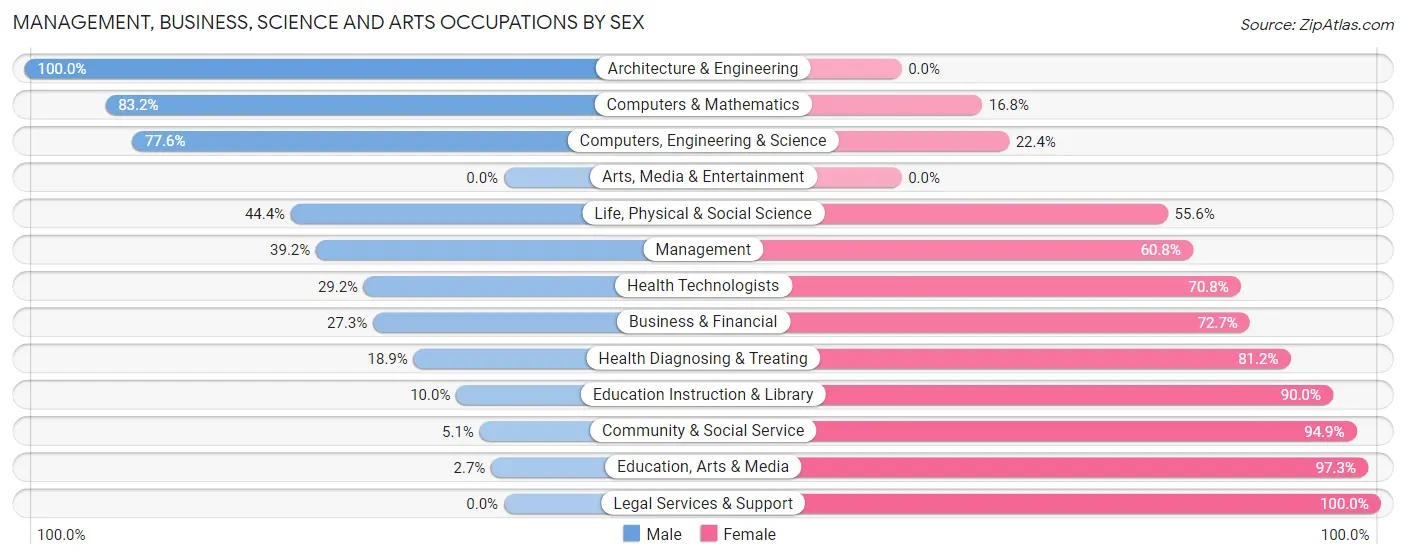
Management, Business, Science and Arts Occupations by Sex
Within the Management, Business, Science and Arts occupations in Highland Springs, the most male-oriented occupations are Architecture & Engineering (100.0%), Computers & Mathematics (83.2%), and Computers, Engineering & Science (77.6%), while the most female-oriented occupations are Legal Services & Support (100.0%), Education, Arts & Media (97.3%), and Community & Social Service (94.9%).
| Occupation | Male | Female |
| Management | 203 (39.2%) | 315 (60.8%) |
| Business & Financial | 98 (27.3%) | 261 (72.7%) |
| Computers, Engineering & Science | 211 (77.6%) | 61 (22.4%) |
| Computers & Mathematics | 178 (83.2%) | 36 (16.8%) |
| Architecture & Engineering | 13 (100.0%) | 0 (0.0%) |
| Life, Physical & Social Science | 20 (44.4%) | 25 (55.6%) |
| Community & Social Service | 36 (5.1%) | 674 (94.9%) |
| Education, Arts & Media | 10 (2.7%) | 364 (97.3%) |
| Legal Services & Support | 0 (0.0%) | 75 (100.0%) |
| Education Instruction & Library | 26 (10.0%) | 235 (90.0%) |
| Arts, Media & Entertainment | 0 (0.0%) | 0 (0.0%) |
| Health Diagnosing & Treating | 69 (18.9%) | 297 (81.1%) |
| Health Technologists | 52 (29.2%) | 126 (70.8%) |
| Total (Category) | 617 (27.7%) | 1,608 (72.3%) |
| Total (Overall) | 3,203 (43.4%) | 4,172 (56.6%) |
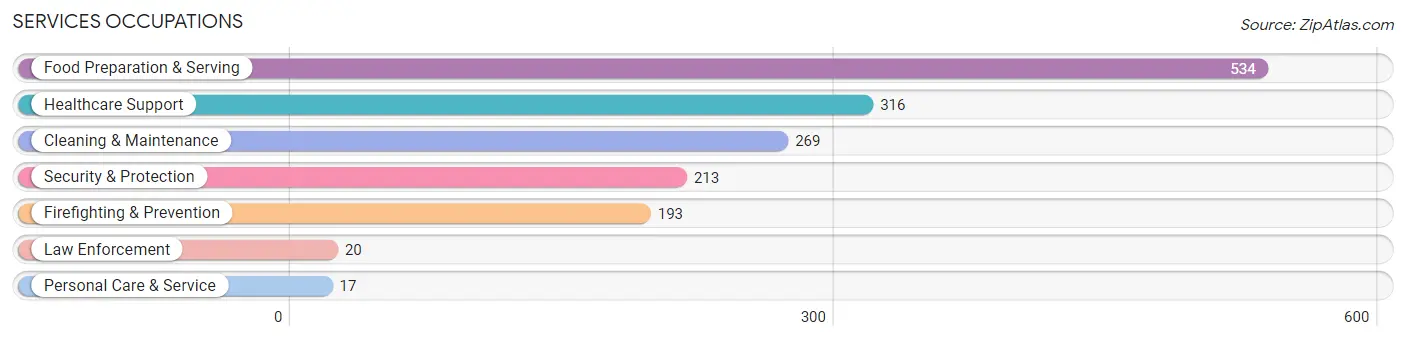
Services Occupations
The most common Services occupations in Highland Springs are Food Preparation & Serving (534 | 7.2%), Healthcare Support (316 | 4.3%), Cleaning & Maintenance (269 | 3.6%), Security & Protection (213 | 2.9%), and Firefighting & Prevention (193 | 2.6%).
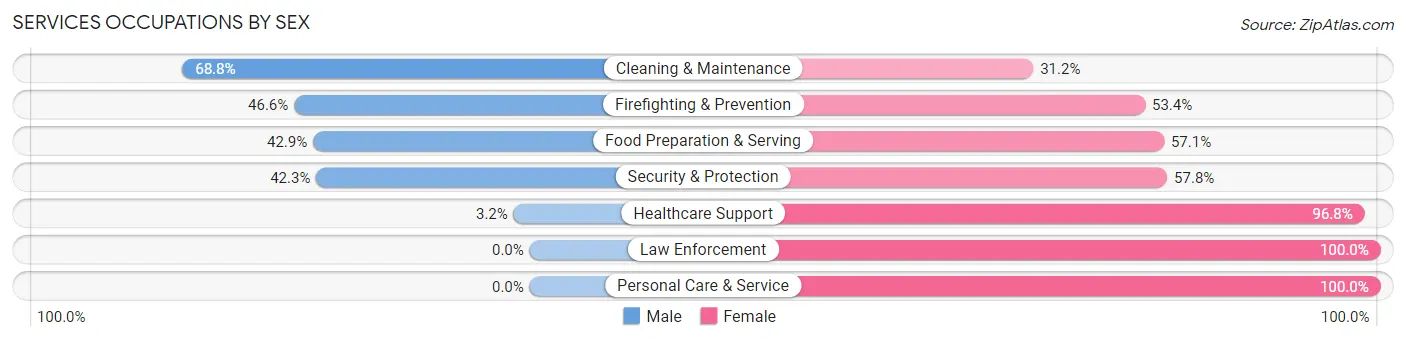
Services Occupations by Sex
Within the Services occupations in Highland Springs, the most male-oriented occupations are Cleaning & Maintenance (68.8%), Firefighting & Prevention (46.6%), and Food Preparation & Serving (42.9%), while the most female-oriented occupations are Law Enforcement (100.0%), Personal Care & Service (100.0%), and Healthcare Support (96.8%).
| Occupation | Male | Female |
| Healthcare Support | 10 (3.2%) | 306 (96.8%) |
| Security & Protection | 90 (42.2%) | 123 (57.8%) |
| Firefighting & Prevention | 90 (46.6%) | 103 (53.4%) |
| Law Enforcement | 0 (0.0%) | 20 (100.0%) |
| Food Preparation & Serving | 229 (42.9%) | 305 (57.1%) |
| Cleaning & Maintenance | 185 (68.8%) | 84 (31.2%) |
| Personal Care & Service | 0 (0.0%) | 17 (100.0%) |
| Total (Category) | 514 (38.1%) | 835 (61.9%) |
| Total (Overall) | 3,203 (43.4%) | 4,172 (56.6%) |
Sales and Office Occupations
The most common Sales and Office occupations in Highland Springs are Office & Administration (1,075 | 14.6%), and Sales & Related (944 | 12.8%).
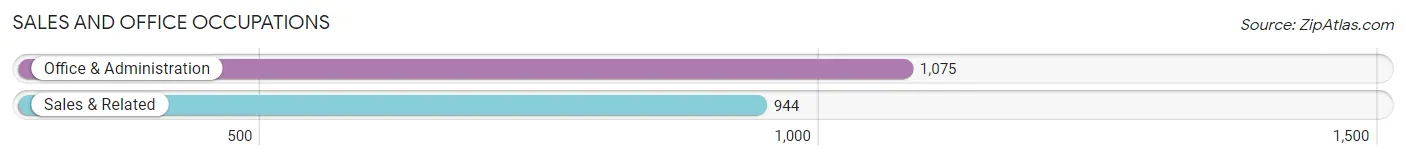
Sales and Office Occupations by Sex
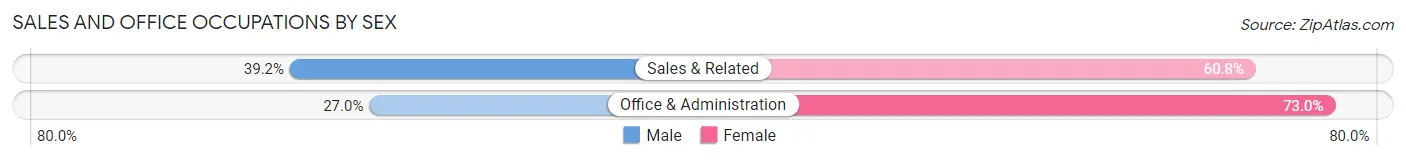
| Occupation | Male | Female |
| Sales & Related | 370 (39.2%) | 574 (60.8%) |
| Office & Administration | 290 (27.0%) | 785 (73.0%) |
| Total (Category) | 660 (32.7%) | 1,359 (67.3%) |
| Total (Overall) | 3,203 (43.4%) | 4,172 (56.6%) |
Natural Resources, Construction and Maintenance Occupations
The most common Natural Resources, Construction and Maintenance occupations in Highland Springs are Construction & Extraction (328 | 4.4%), Installation, Maintenance & Repair (181 | 2.5%), and Farming, Fishing & Forestry (11 | 0.2%).
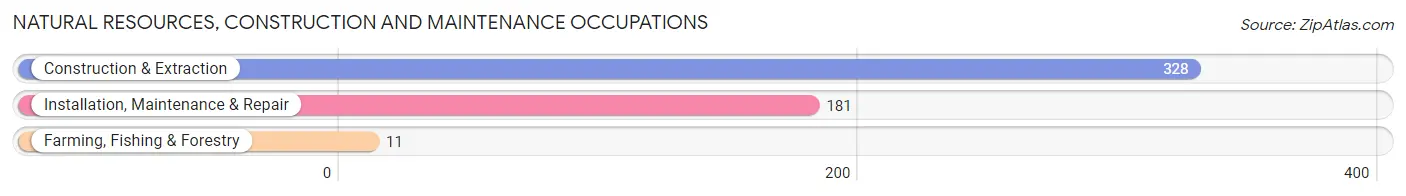
Natural Resources, Construction and Maintenance Occupations by Sex
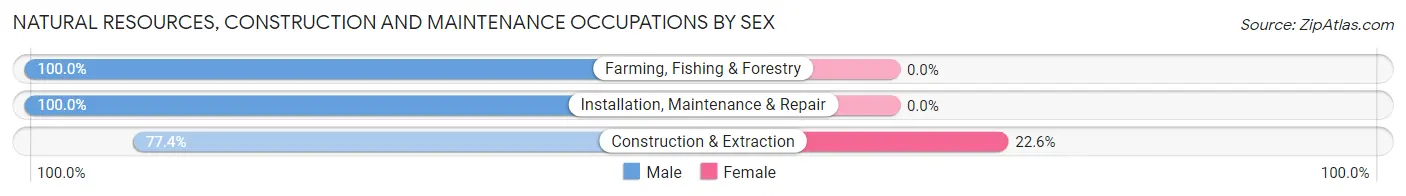
| Occupation | Male | Female |
| Farming, Fishing & Forestry | 11 (100.0%) | 0 (0.0%) |
| Construction & Extraction | 254 (77.4%) | 74 (22.6%) |
| Installation, Maintenance & Repair | 181 (100.0%) | 0 (0.0%) |
| Total (Category) | 446 (85.8%) | 74 (14.2%) |
| Total (Overall) | 3,203 (43.4%) | 4,172 (56.6%) |
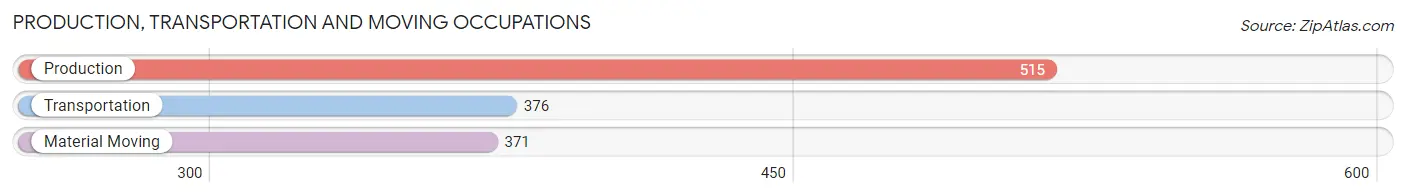
Production, Transportation and Moving Occupations
The most common Production, Transportation and Moving occupations in Highland Springs are Production (515 | 7.0%), Transportation (376 | 5.1%), and Material Moving (371 | 5.0%).
Production, Transportation and Moving Occupations by Sex
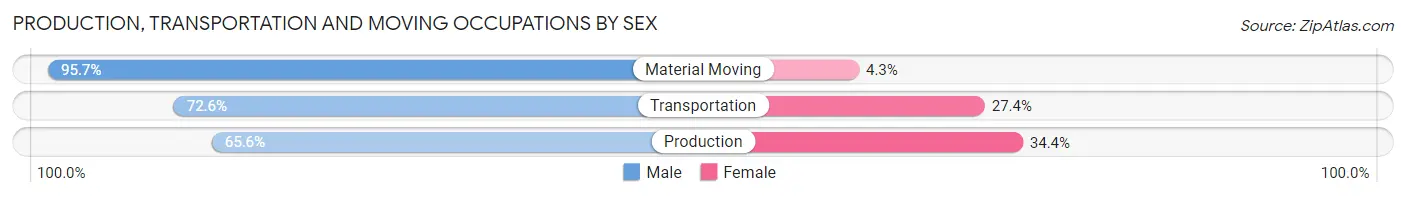
| Occupation | Male | Female |
| Production | 338 (65.6%) | 177 (34.4%) |
| Transportation | 273 (72.6%) | 103 (27.4%) |
| Material Moving | 355 (95.7%) | 16 (4.3%) |
| Total (Category) | 966 (76.5%) | 296 (23.4%) |
| Total (Overall) | 3,203 (43.4%) | 4,172 (56.6%) |
Employment Industries by Sex in Highland Springs
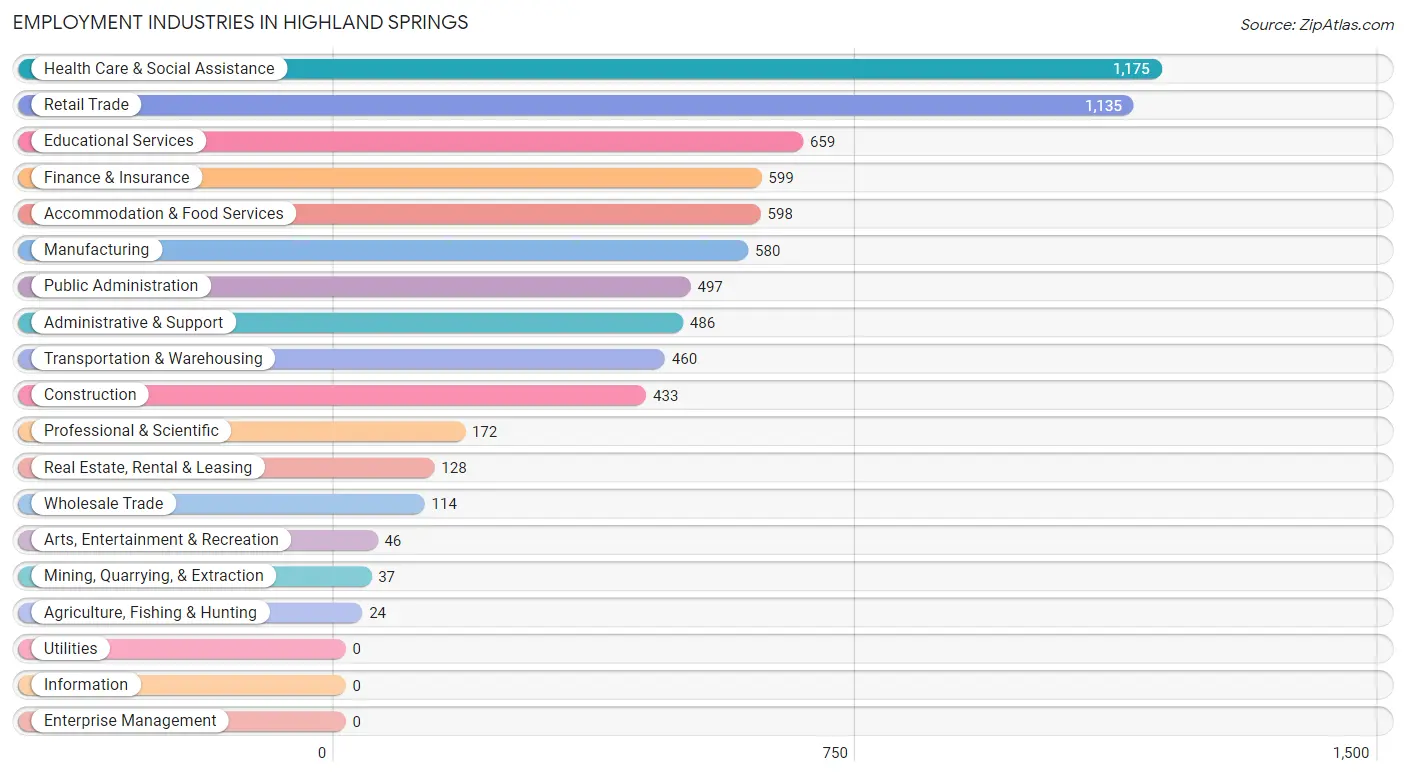
Employment Industries in Highland Springs
The major employment industries in Highland Springs include Health Care & Social Assistance (1,175 | 15.9%), Retail Trade (1,135 | 15.4%), Educational Services (659 | 8.9%), Finance & Insurance (599 | 8.1%), and Accommodation & Food Services (598 | 8.1%).
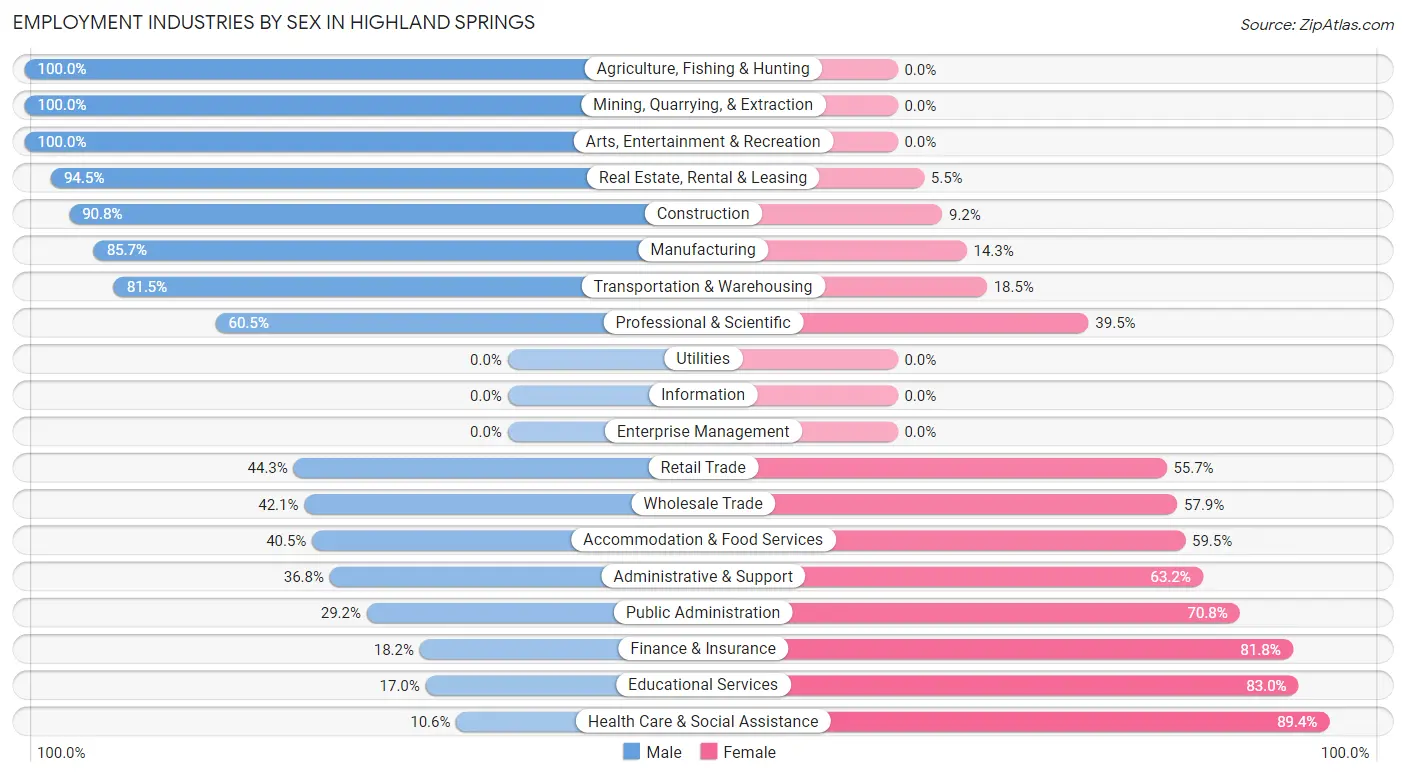
Employment Industries by Sex in Highland Springs
The Highland Springs industries that see more men than women are Agriculture, Fishing & Hunting (100.0%), Mining, Quarrying, & Extraction (100.0%), and Arts, Entertainment & Recreation (100.0%), whereas the industries that tend to have a higher number of women are Health Care & Social Assistance (89.4%), Educational Services (83.0%), and Finance & Insurance (81.8%).
| Industry | Male | Female |
| Agriculture, Fishing & Hunting | 24 (100.0%) | 0 (0.0%) |
| Mining, Quarrying, & Extraction | 37 (100.0%) | 0 (0.0%) |
| Construction | 393 (90.8%) | 40 (9.2%) |
| Manufacturing | 497 (85.7%) | 83 (14.3%) |
| Wholesale Trade | 48 (42.1%) | 66 (57.9%) |
| Retail Trade | 503 (44.3%) | 632 (55.7%) |
| Transportation & Warehousing | 375 (81.5%) | 85 (18.5%) |
| Utilities | 0 (0.0%) | 0 (0.0%) |
| Information | 0 (0.0%) | 0 (0.0%) |
| Finance & Insurance | 109 (18.2%) | 490 (81.8%) |
| Real Estate, Rental & Leasing | 121 (94.5%) | 7 (5.5%) |
| Professional & Scientific | 104 (60.5%) | 68 (39.5%) |
| Enterprise Management | 0 (0.0%) | 0 (0.0%) |
| Administrative & Support | 179 (36.8%) | 307 (63.2%) |
| Educational Services | 112 (17.0%) | 547 (83.0%) |
| Health Care & Social Assistance | 125 (10.6%) | 1,050 (89.4%) |
| Arts, Entertainment & Recreation | 46 (100.0%) | 0 (0.0%) |
| Accommodation & Food Services | 242 (40.5%) | 356 (59.5%) |
| Public Administration | 145 (29.2%) | 352 (70.8%) |
| Total | 3,203 (43.4%) | 4,172 (56.6%) |
Education in Highland Springs
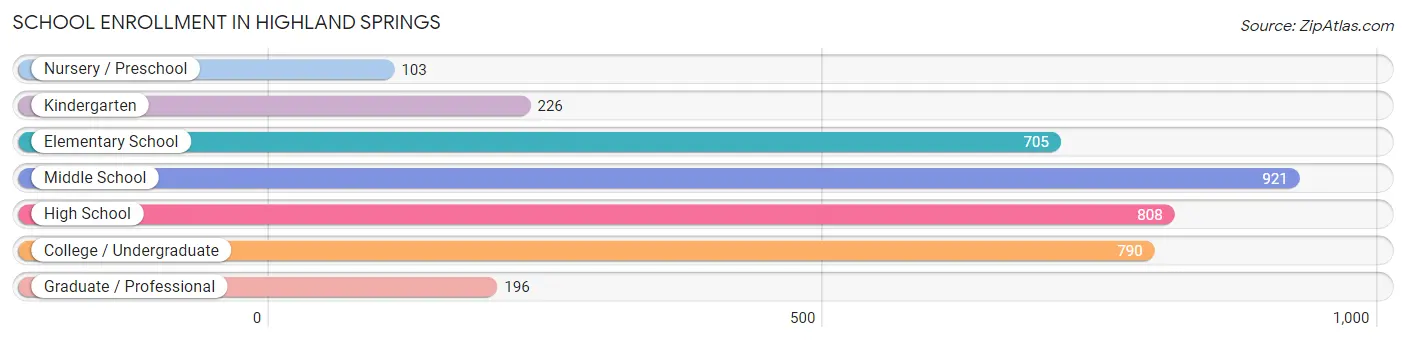
School Enrollment in Highland Springs
The most common levels of schooling among the 3,749 students in Highland Springs are middle school (921 | 24.6%), high school (808 | 21.5%), and college / undergraduate (790 | 21.1%).
| School Level | # Students | % Students |
| Nursery / Preschool | 103 | 2.8% |
| Kindergarten | 226 | 6.0% |
| Elementary School | 705 | 18.8% |
| Middle School | 921 | 24.6% |
| High School | 808 | 21.5% |
| College / Undergraduate | 790 | 21.1% |
| Graduate / Professional | 196 | 5.2% |
| Total | 3,749 | 100.0% |
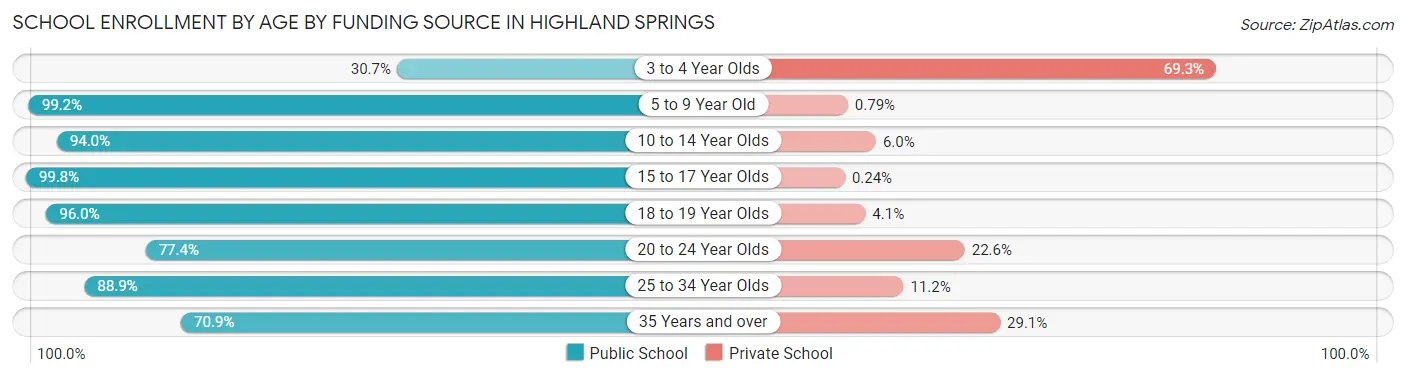
School Enrollment by Age by Funding Source in Highland Springs
Out of a total of 3,749 students who are enrolled in schools in Highland Springs, 330 (8.8%) attend a private institution, while the remaining 3,419 (91.2%) are enrolled in public schools. The age group of 3 to 4 year olds has the highest likelihood of being enrolled in private schools, with 52 (69.3% in the age bracket) enrolled. Conversely, the age group of 15 to 17 year olds has the lowest likelihood of being enrolled in a private school, with 413 (99.8% in the age bracket) attending a public institution.
| Age Bracket | Public School | Private School |
| 3 to 4 Year Olds | 23 (30.7%) | 52 (69.3%) |
| 5 to 9 Year Old | 753 (99.2%) | 6 (0.8%) |
| 10 to 14 Year Olds | 1,312 (94.0%) | 84 (6.0%) |
| 15 to 17 Year Olds | 413 (99.8%) | 1 (0.2%) |
| 18 to 19 Year Olds | 213 (96.0%) | 9 (4.1%) |
| 20 to 24 Year Olds | 333 (77.4%) | 97 (22.6%) |
| 25 to 34 Year Olds | 247 (88.8%) | 31 (11.2%) |
| 35 Years and over | 124 (70.9%) | 51 (29.1%) |
| Total | 3,419 (91.2%) | 330 (8.8%) |
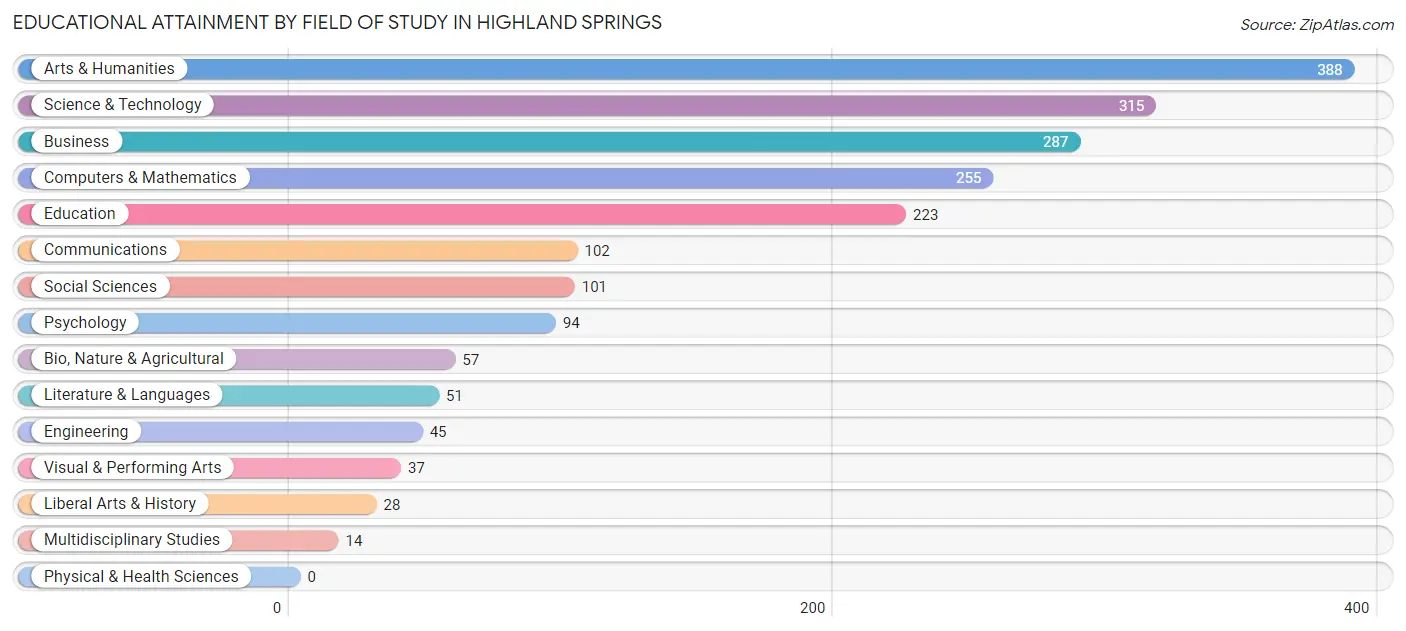
Educational Attainment by Field of Study in Highland Springs
Arts & humanities (388 | 19.4%), science & technology (315 | 15.8%), business (287 | 14.4%), computers & mathematics (255 | 12.8%), and education (223 | 11.2%) are the most common fields of study among 1,997 individuals in Highland Springs who have obtained a bachelor's degree or higher.
| Field of Study | # Graduates | % Graduates |
| Computers & Mathematics | 255 | 12.8% |
| Bio, Nature & Agricultural | 57 | 2.9% |
| Physical & Health Sciences | 0 | 0.0% |
| Psychology | 94 | 4.7% |
| Social Sciences | 101 | 5.1% |
| Engineering | 45 | 2.2% |
| Multidisciplinary Studies | 14 | 0.7% |
| Science & Technology | 315 | 15.8% |
| Business | 287 | 14.4% |
| Education | 223 | 11.2% |
| Literature & Languages | 51 | 2.5% |
| Liberal Arts & History | 28 | 1.4% |
| Visual & Performing Arts | 37 | 1.8% |
| Communications | 102 | 5.1% |
| Arts & Humanities | 388 | 19.4% |
| Total | 1,997 | 100.0% |
Transportation & Commute in Highland Springs
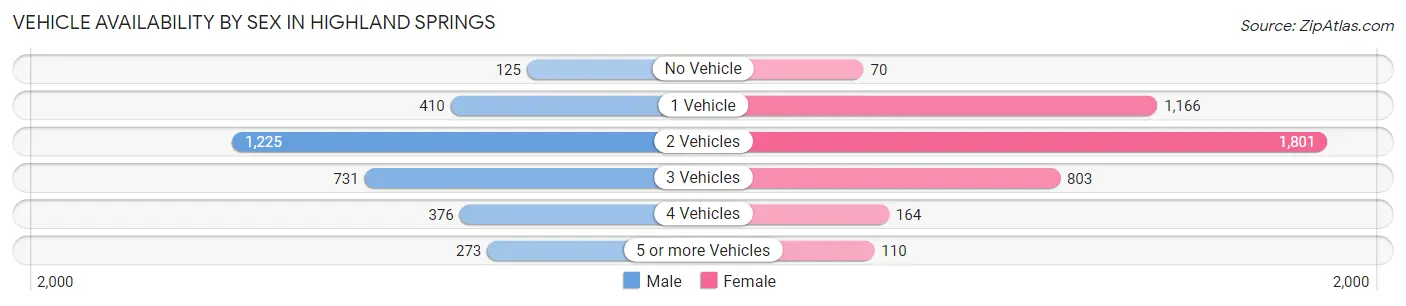
Vehicle Availability by Sex in Highland Springs
The most prevalent vehicle ownership categories in Highland Springs are males with 2 vehicles (1,225, accounting for 39.0%) and females with 2 vehicles (1,801, making up 29.8%).
| Vehicles Available | Male | Female |
| No Vehicle | 125 (4.0%) | 70 (1.7%) |
| 1 Vehicle | 410 (13.1%) | 1,166 (28.3%) |
| 2 Vehicles | 1,225 (39.0%) | 1,801 (43.8%) |
| 3 Vehicles | 731 (23.3%) | 803 (19.5%) |
| 4 Vehicles | 376 (12.0%) | 164 (4.0%) |
| 5 or more Vehicles | 273 (8.7%) | 110 (2.7%) |
| Total | 3,140 (100.0%) | 4,114 (100.0%) |
Commute Time in Highland Springs
The most frequently occuring commute durations in Highland Springs are 30 to 34 minutes (1,416 commuters, 21.5%), 20 to 24 minutes (1,320 commuters, 20.1%), and 15 to 19 minutes (963 commuters, 14.6%).
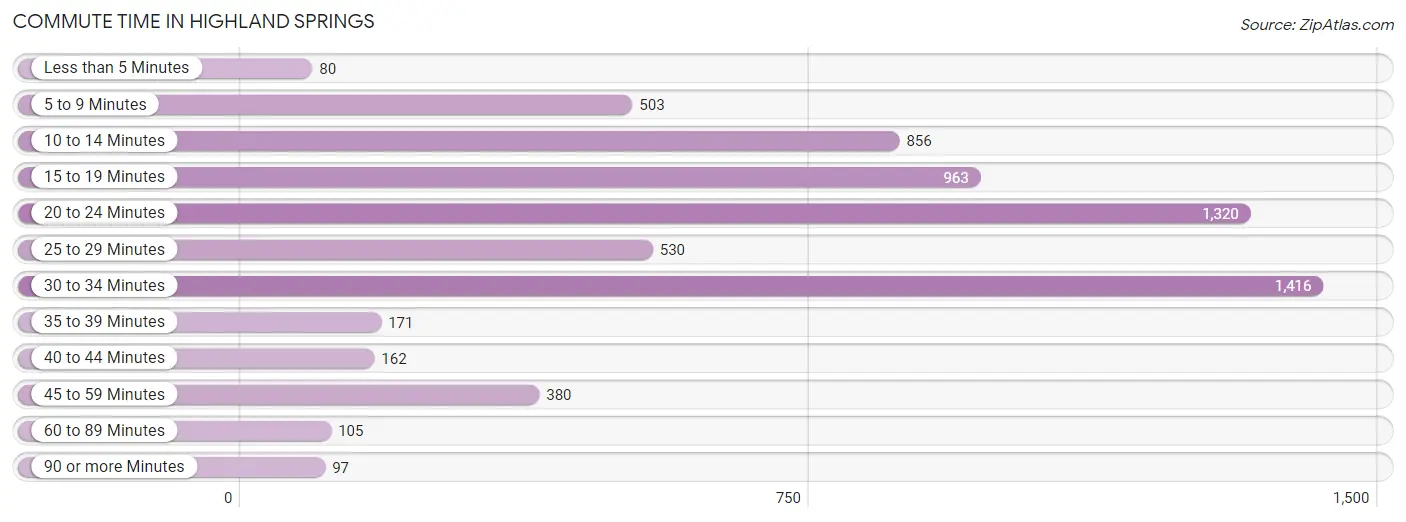
| Commute Time | # Commuters | % Commuters |
| Less than 5 Minutes | 80 | 1.2% |
| 5 to 9 Minutes | 503 | 7.6% |
| 10 to 14 Minutes | 856 | 13.0% |
| 15 to 19 Minutes | 963 | 14.6% |
| 20 to 24 Minutes | 1,320 | 20.1% |
| 25 to 29 Minutes | 530 | 8.1% |
| 30 to 34 Minutes | 1,416 | 21.5% |
| 35 to 39 Minutes | 171 | 2.6% |
| 40 to 44 Minutes | 162 | 2.5% |
| 45 to 59 Minutes | 380 | 5.8% |
| 60 to 89 Minutes | 105 | 1.6% |
| 90 or more Minutes | 97 | 1.5% |
Commute Time by Sex in Highland Springs
The most common commute times in Highland Springs are 20 to 24 minutes (623 commuters, 20.6%) for males and 30 to 34 minutes (802 commuters, 22.6%) for females.
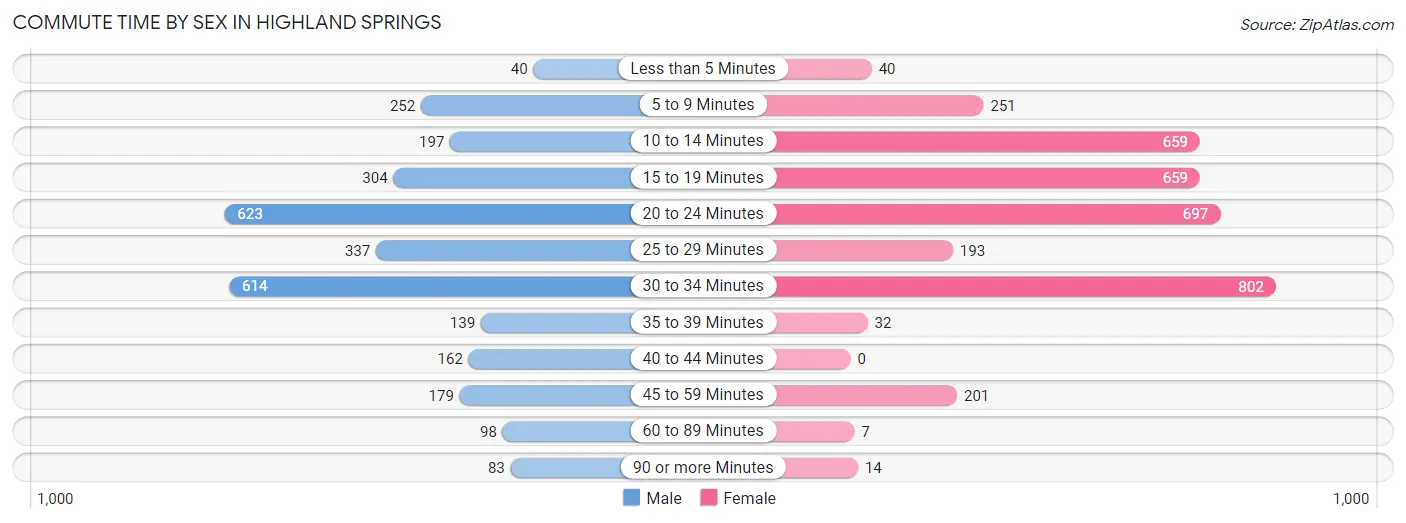
| Commute Time | Male | Female |
| Less than 5 Minutes | 40 (1.3%) | 40 (1.1%) |
| 5 to 9 Minutes | 252 (8.3%) | 251 (7.1%) |
| 10 to 14 Minutes | 197 (6.5%) | 659 (18.5%) |
| 15 to 19 Minutes | 304 (10.0%) | 659 (18.5%) |
| 20 to 24 Minutes | 623 (20.6%) | 697 (19.6%) |
| 25 to 29 Minutes | 337 (11.1%) | 193 (5.4%) |
| 30 to 34 Minutes | 614 (20.3%) | 802 (22.6%) |
| 35 to 39 Minutes | 139 (4.6%) | 32 (0.9%) |
| 40 to 44 Minutes | 162 (5.3%) | 0 (0.0%) |
| 45 to 59 Minutes | 179 (5.9%) | 201 (5.7%) |
| 60 to 89 Minutes | 98 (3.2%) | 7 (0.2%) |
| 90 or more Minutes | 83 (2.7%) | 14 (0.4%) |
Time of Departure to Work by Sex in Highland Springs
The most frequent times of departure to work in Highland Springs are 12:00 PM to 3:59 PM (526, 17.4%) for males and 7:00 AM to 7:29 AM (877, 24.7%) for females.
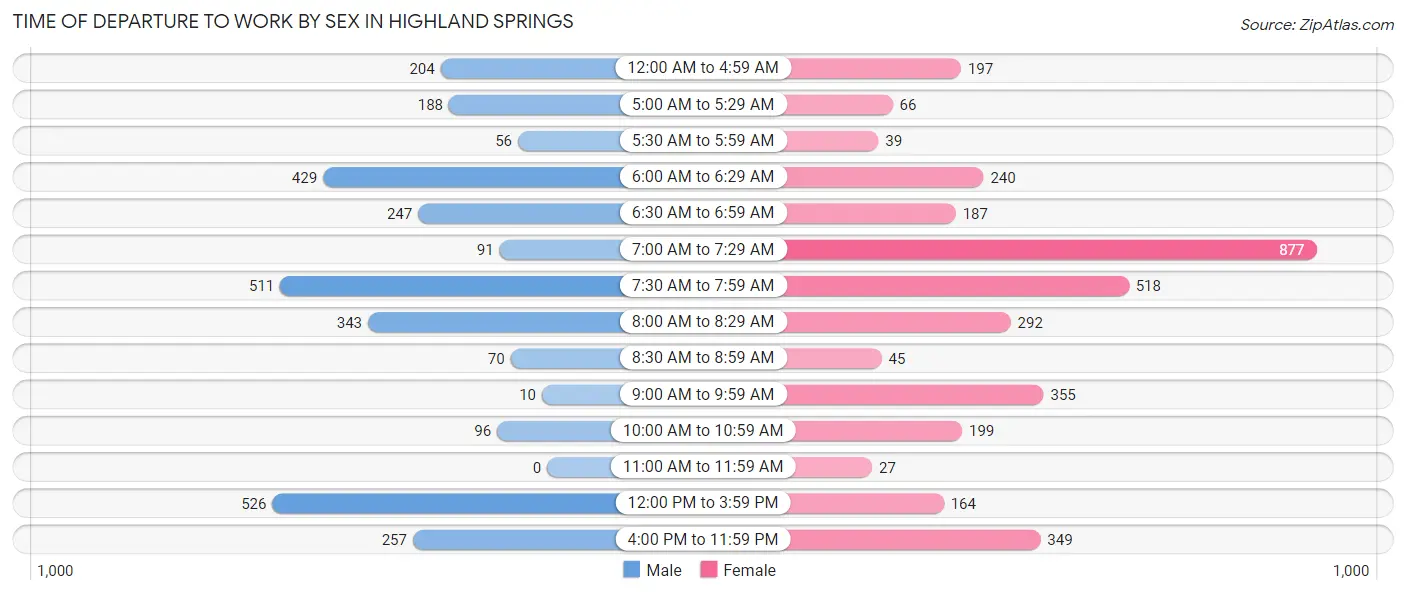
| Time of Departure | Male | Female |
| 12:00 AM to 4:59 AM | 204 (6.7%) | 197 (5.5%) |
| 5:00 AM to 5:29 AM | 188 (6.2%) | 66 (1.9%) |
| 5:30 AM to 5:59 AM | 56 (1.8%) | 39 (1.1%) |
| 6:00 AM to 6:29 AM | 429 (14.2%) | 240 (6.8%) |
| 6:30 AM to 6:59 AM | 247 (8.2%) | 187 (5.3%) |
| 7:00 AM to 7:29 AM | 91 (3.0%) | 877 (24.7%) |
| 7:30 AM to 7:59 AM | 511 (16.9%) | 518 (14.6%) |
| 8:00 AM to 8:29 AM | 343 (11.3%) | 292 (8.2%) |
| 8:30 AM to 8:59 AM | 70 (2.3%) | 45 (1.3%) |
| 9:00 AM to 9:59 AM | 10 (0.3%) | 355 (10.0%) |
| 10:00 AM to 10:59 AM | 96 (3.2%) | 199 (5.6%) |
| 11:00 AM to 11:59 AM | 0 (0.0%) | 27 (0.8%) |
| 12:00 PM to 3:59 PM | 526 (17.4%) | 164 (4.6%) |
| 4:00 PM to 11:59 PM | 257 (8.5%) | 349 (9.8%) |
| Total | 3,028 (100.0%) | 3,555 (100.0%) |
Housing Occupancy in Highland Springs
Occupancy by Ownership in Highland Springs
Of the total 5,886 dwellings in Highland Springs, owner-occupied units account for 3,728 (63.3%), while renter-occupied units make up 2,158 (36.7%).
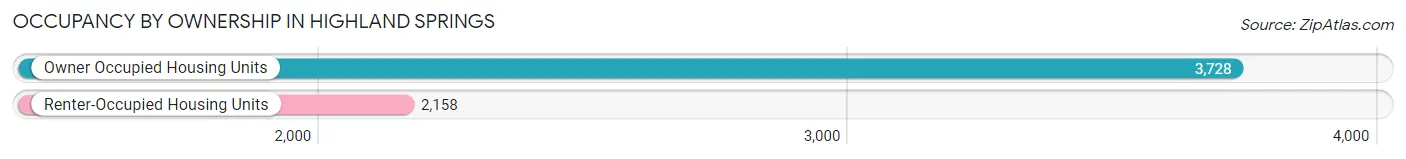
| Occupancy | # Housing Units | % Housing Units |
| Owner Occupied Housing Units | 3,728 | 63.3% |
| Renter-Occupied Housing Units | 2,158 | 36.7% |
| Total Occupied Housing Units | 5,886 | 100.0% |
Occupancy by Household Size in Highland Springs
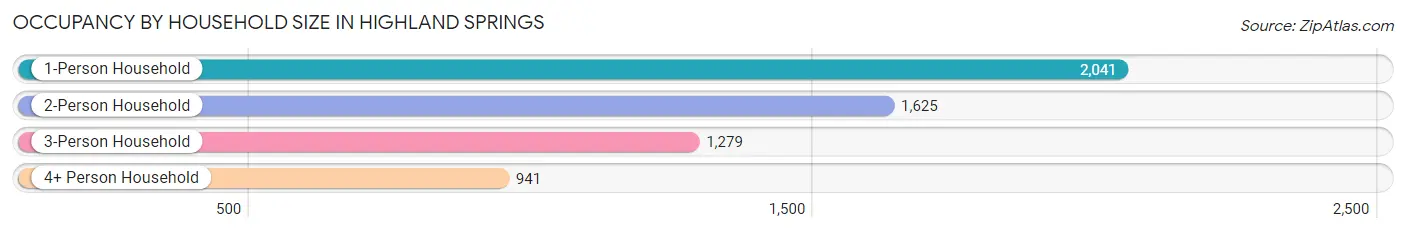
| Household Size | # Housing Units | % Housing Units |
| 1-Person Household | 2,041 | 34.7% |
| 2-Person Household | 1,625 | 27.6% |
| 3-Person Household | 1,279 | 21.7% |
| 4+ Person Household | 941 | 16.0% |
| Total Housing Units | 5,886 | 100.0% |
Occupancy by Ownership by Household Size in Highland Springs
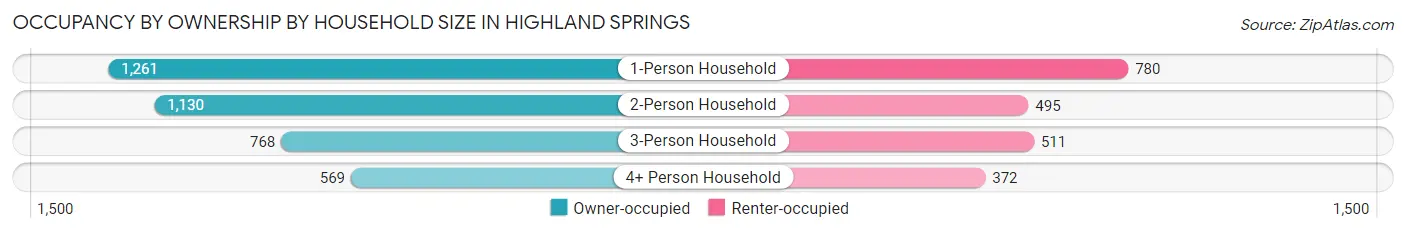
| Household Size | Owner-occupied | Renter-occupied |
| 1-Person Household | 1,261 (61.8%) | 780 (38.2%) |
| 2-Person Household | 1,130 (69.5%) | 495 (30.5%) |
| 3-Person Household | 768 (60.1%) | 511 (40.0%) |
| 4+ Person Household | 569 (60.5%) | 372 (39.5%) |
| Total Housing Units | 3,728 (63.3%) | 2,158 (36.7%) |
Occupancy by Educational Attainment in Highland Springs
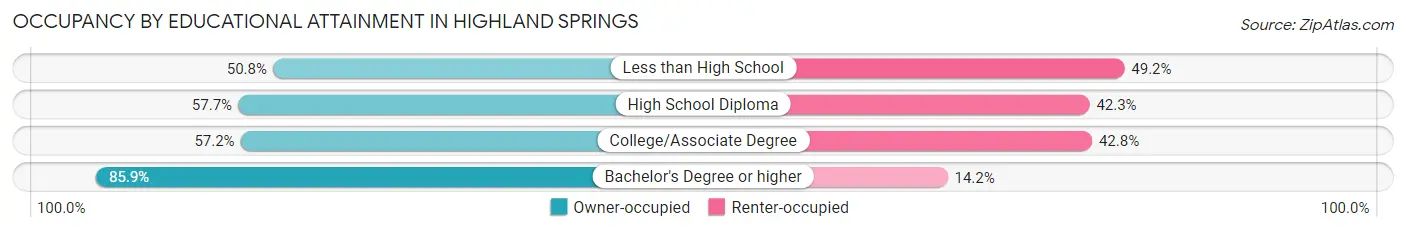
| Household Size | Owner-occupied | Renter-occupied |
| Less than High School | 160 (50.8%) | 155 (49.2%) |
| High School Diploma | 1,209 (57.7%) | 886 (42.3%) |
| College/Associate Degree | 1,249 (57.2%) | 934 (42.8%) |
| Bachelor's Degree or higher | 1,110 (85.9%) | 183 (14.1%) |
Occupancy by Age of Householder in Highland Springs
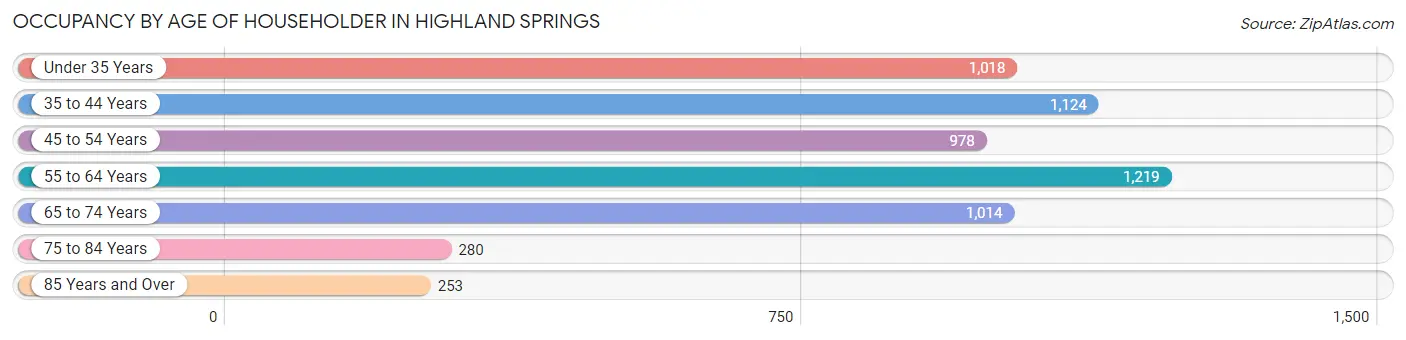
| Age Bracket | # Households | % Households |
| Under 35 Years | 1,018 | 17.3% |
| 35 to 44 Years | 1,124 | 19.1% |
| 45 to 54 Years | 978 | 16.6% |
| 55 to 64 Years | 1,219 | 20.7% |
| 65 to 74 Years | 1,014 | 17.2% |
| 75 to 84 Years | 280 | 4.8% |
| 85 Years and Over | 253 | 4.3% |
| Total | 5,886 | 100.0% |
Housing Finances in Highland Springs
Median Income by Occupancy in Highland Springs
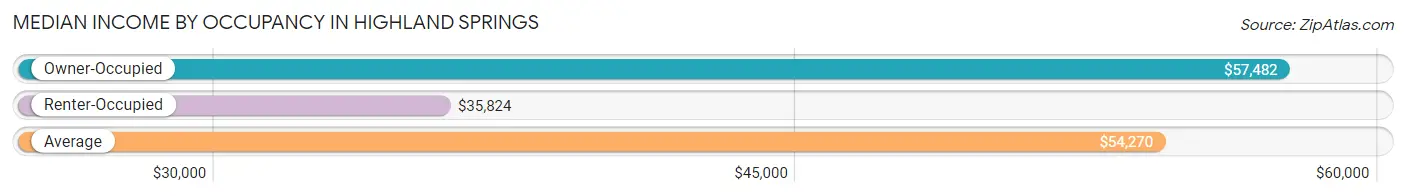
| Occupancy Type | # Households | Median Income |
| Owner-Occupied | 3,728 (63.3%) | $57,482 |
| Renter-Occupied | 2,158 (36.7%) | $35,824 |
| Average | 5,886 (100.0%) | $54,270 |
Occupancy by Householder Income Bracket in Highland Springs
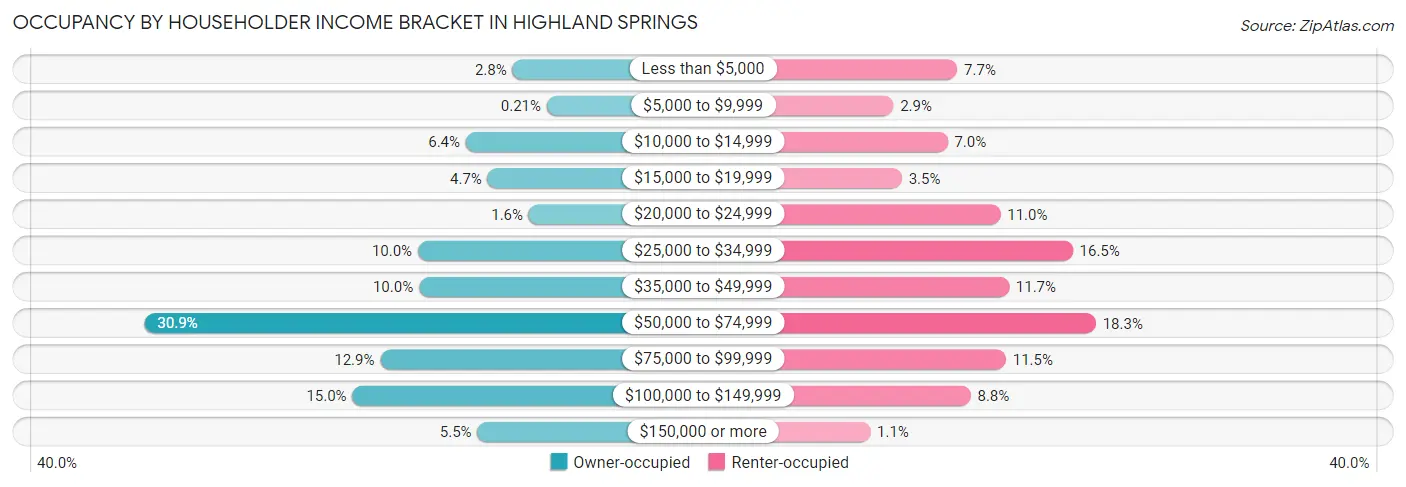
| Income Bracket | Owner-occupied | Renter-occupied |
| Less than $5,000 | 105 (2.8%) | 167 (7.7%) |
| $5,000 to $9,999 | 8 (0.2%) | 62 (2.9%) |
| $10,000 to $14,999 | 238 (6.4%) | 151 (7.0%) |
| $15,000 to $19,999 | 176 (4.7%) | 76 (3.5%) |
| $20,000 to $24,999 | 59 (1.6%) | 238 (11.0%) |
| $25,000 to $34,999 | 374 (10.0%) | 357 (16.5%) |
| $35,000 to $49,999 | 371 (10.0%) | 252 (11.7%) |
| $50,000 to $74,999 | 1,151 (30.9%) | 395 (18.3%) |
| $75,000 to $99,999 | 481 (12.9%) | 247 (11.5%) |
| $100,000 to $149,999 | 560 (15.0%) | 189 (8.8%) |
| $150,000 or more | 205 (5.5%) | 24 (1.1%) |
| Total | 3,728 (100.0%) | 2,158 (100.0%) |
Monthly Housing Cost Tiers in Highland Springs
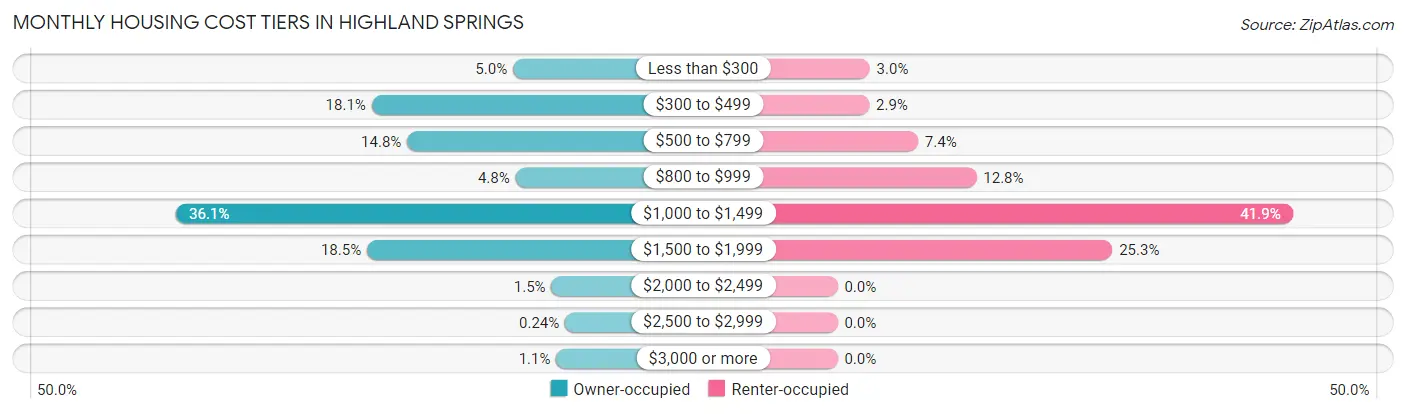
| Monthly Cost | Owner-occupied | Renter-occupied |
| Less than $300 | 188 (5.0%) | 64 (3.0%) |
| $300 to $499 | 673 (18.0%) | 63 (2.9%) |
| $500 to $799 | 551 (14.8%) | 160 (7.4%) |
| $800 to $999 | 179 (4.8%) | 276 (12.8%) |
| $1,000 to $1,499 | 1,344 (36.0%) | 904 (41.9%) |
| $1,500 to $1,999 | 689 (18.5%) | 546 (25.3%) |
| $2,000 to $2,499 | 56 (1.5%) | 0 (0.0%) |
| $2,500 to $2,999 | 9 (0.2%) | 0 (0.0%) |
| $3,000 or more | 39 (1.1%) | 0 (0.0%) |
| Total | 3,728 (100.0%) | 2,158 (100.0%) |
Physical Housing Characteristics in Highland Springs
Housing Structures in Highland Springs
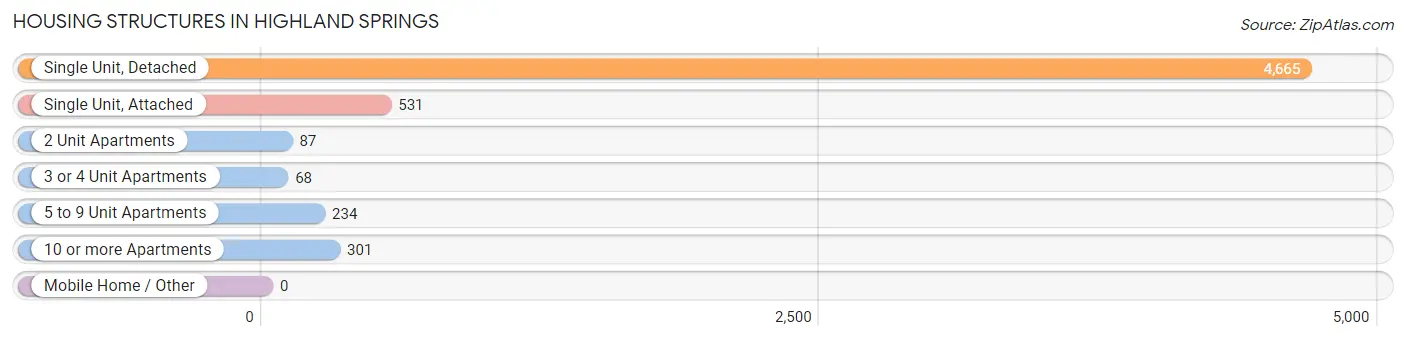
| Structure Type | # Housing Units | % Housing Units |
| Single Unit, Detached | 4,665 | 79.3% |
| Single Unit, Attached | 531 | 9.0% |
| 2 Unit Apartments | 87 | 1.5% |
| 3 or 4 Unit Apartments | 68 | 1.2% |
| 5 to 9 Unit Apartments | 234 | 4.0% |
| 10 or more Apartments | 301 | 5.1% |
| Mobile Home / Other | 0 | 0.0% |
| Total | 5,886 | 100.0% |
Housing Structures by Occupancy in Highland Springs
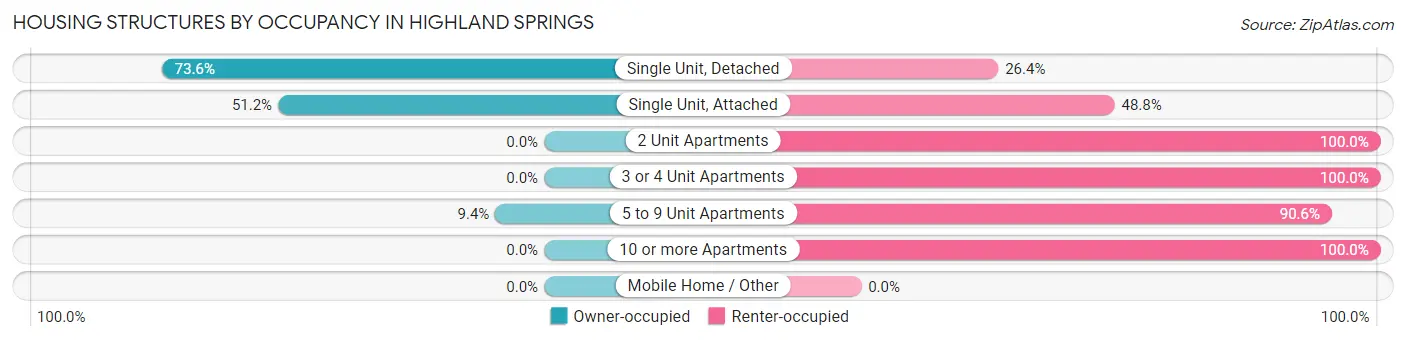
| Structure Type | Owner-occupied | Renter-occupied |
| Single Unit, Detached | 3,434 (73.6%) | 1,231 (26.4%) |
| Single Unit, Attached | 272 (51.2%) | 259 (48.8%) |
| 2 Unit Apartments | 0 (0.0%) | 87 (100.0%) |
| 3 or 4 Unit Apartments | 0 (0.0%) | 68 (100.0%) |
| 5 to 9 Unit Apartments | 22 (9.4%) | 212 (90.6%) |
| 10 or more Apartments | 0 (0.0%) | 301 (100.0%) |
| Mobile Home / Other | 0 (0.0%) | 0 (0.0%) |
| Total | 3,728 (63.3%) | 2,158 (36.7%) |
Housing Structures by Number of Rooms in Highland Springs
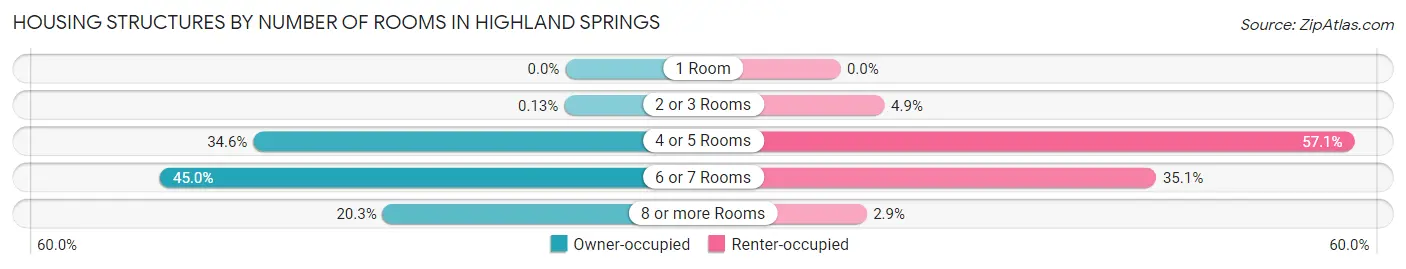
| Number of Rooms | Owner-occupied | Renter-occupied |
| 1 Room | 0 (0.0%) | 0 (0.0%) |
| 2 or 3 Rooms | 5 (0.1%) | 106 (4.9%) |
| 4 or 5 Rooms | 1,291 (34.6%) | 1,232 (57.1%) |
| 6 or 7 Rooms | 1,676 (45.0%) | 757 (35.1%) |
| 8 or more Rooms | 756 (20.3%) | 63 (2.9%) |
| Total | 3,728 (100.0%) | 2,158 (100.0%) |
Housing Structure by Heating Type in Highland Springs
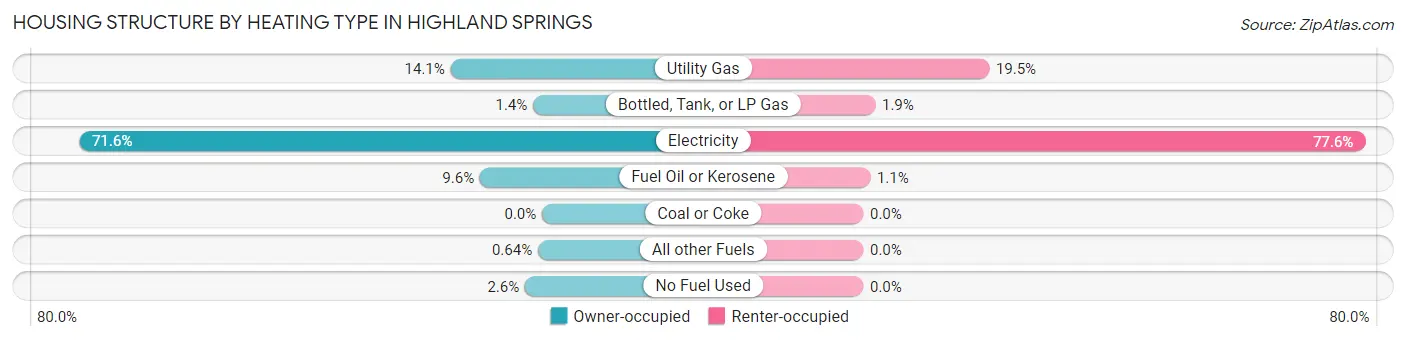
| Heating Type | Owner-occupied | Renter-occupied |
| Utility Gas | 527 (14.1%) | 420 (19.5%) |
| Bottled, Tank, or LP Gas | 52 (1.4%) | 40 (1.8%) |
| Electricity | 2,669 (71.6%) | 1,675 (77.6%) |
| Fuel Oil or Kerosene | 358 (9.6%) | 23 (1.1%) |
| Coal or Coke | 0 (0.0%) | 0 (0.0%) |
| All other Fuels | 24 (0.6%) | 0 (0.0%) |
| No Fuel Used | 98 (2.6%) | 0 (0.0%) |
| Total | 3,728 (100.0%) | 2,158 (100.0%) |
Household Vehicle Usage in Highland Springs
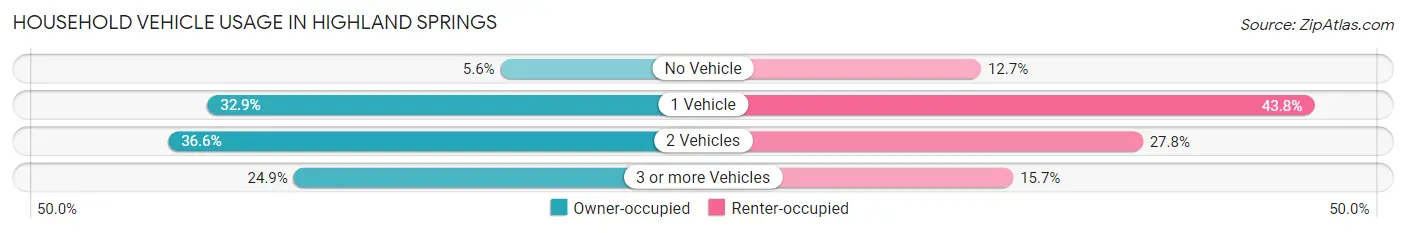
| Vehicles per Household | Owner-occupied | Renter-occupied |
| No Vehicle | 208 (5.6%) | 274 (12.7%) |
| 1 Vehicle | 1,228 (32.9%) | 945 (43.8%) |
| 2 Vehicles | 1,364 (36.6%) | 600 (27.8%) |
| 3 or more Vehicles | 928 (24.9%) | 339 (15.7%) |
| Total | 3,728 (100.0%) | 2,158 (100.0%) |
Real Estate & Mortgages in Highland Springs
Real Estate and Mortgage Overview in Highland Springs
| Characteristic | Without Mortgage | With Mortgage |
| Housing Units | 1,088 | 2,640 |
| Median Property Value | $172,100 | $199,300 |
| Median Household Income | $45,643 | $144 |
| Monthly Housing Costs | $436 | $39 |
| Real Estate Taxes | $1,198 | $138 |
Property Value by Mortgage Status in Highland Springs
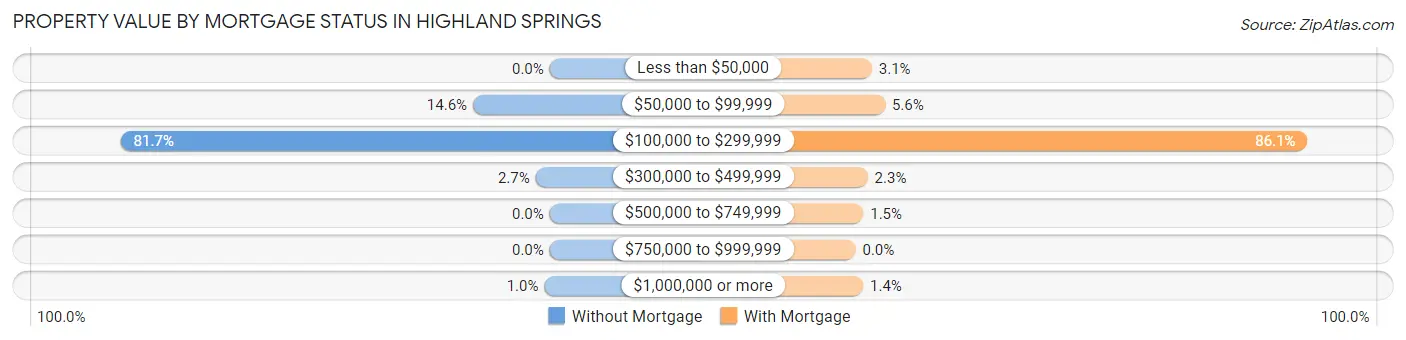
| Property Value | Without Mortgage | With Mortgage |
| Less than $50,000 | 0 (0.0%) | 82 (3.1%) |
| $50,000 to $99,999 | 159 (14.6%) | 148 (5.6%) |
| $100,000 to $299,999 | 889 (81.7%) | 2,272 (86.1%) |
| $300,000 to $499,999 | 29 (2.7%) | 61 (2.3%) |
| $500,000 to $749,999 | 0 (0.0%) | 39 (1.5%) |
| $750,000 to $999,999 | 0 (0.0%) | 0 (0.0%) |
| $1,000,000 or more | 11 (1.0%) | 38 (1.4%) |
| Total | 1,088 (100.0%) | 2,640 (100.0%) |
Household Income by Mortgage Status in Highland Springs
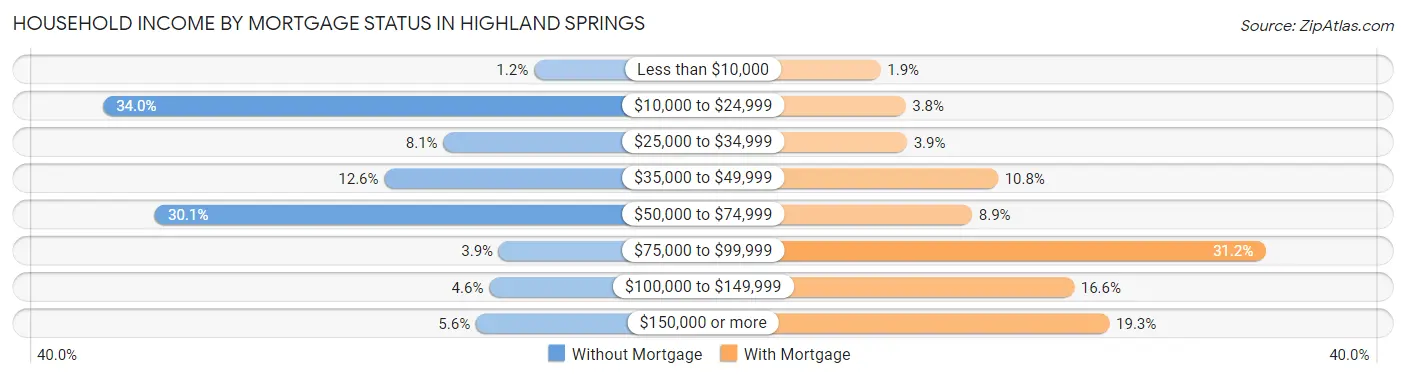
| Household Income | Without Mortgage | With Mortgage |
| Less than $10,000 | 13 (1.2%) | 50 (1.9%) |
| $10,000 to $24,999 | 370 (34.0%) | 100 (3.8%) |
| $25,000 to $34,999 | 88 (8.1%) | 103 (3.9%) |
| $35,000 to $49,999 | 137 (12.6%) | 286 (10.8%) |
| $50,000 to $74,999 | 327 (30.1%) | 234 (8.9%) |
| $75,000 to $99,999 | 42 (3.9%) | 824 (31.2%) |
| $100,000 to $149,999 | 50 (4.6%) | 439 (16.6%) |
| $150,000 or more | 61 (5.6%) | 510 (19.3%) |
| Total | 1,088 (100.0%) | 2,640 (100.0%) |
Property Value to Household Income Ratio in Highland Springs
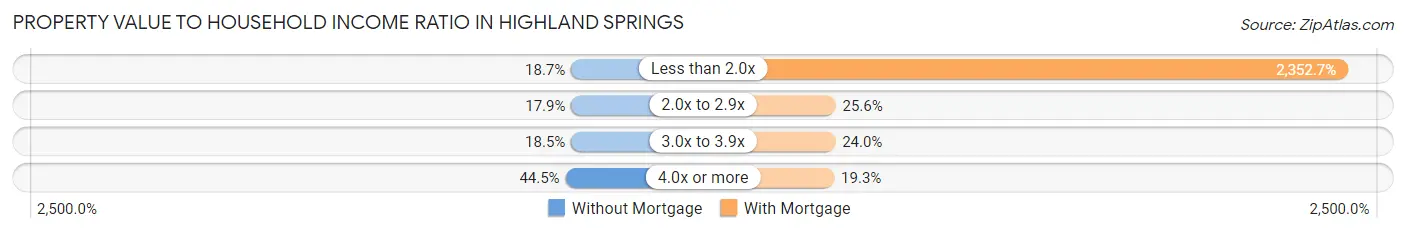
| Value-to-Income Ratio | Without Mortgage | With Mortgage |
| Less than 2.0x | 203 (18.7%) | 62,111 (2,352.7%) |
| 2.0x to 2.9x | 195 (17.9%) | 677 (25.6%) |
| 3.0x to 3.9x | 201 (18.5%) | 634 (24.0%) |
| 4.0x or more | 484 (44.5%) | 509 (19.3%) |
| Total | 1,088 (100.0%) | 2,640 (100.0%) |
Real Estate Taxes by Mortgage Status in Highland Springs
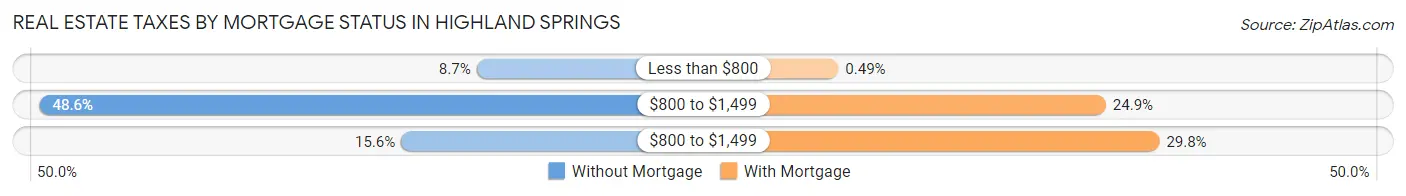
| Property Taxes | Without Mortgage | With Mortgage |
| Less than $800 | 95 (8.7%) | 13 (0.5%) |
| $800 to $1,499 | 529 (48.6%) | 658 (24.9%) |
| $800 to $1,499 | 170 (15.6%) | 787 (29.8%) |
| Total | 1,088 (100.0%) | 2,640 (100.0%) |
Health & Disability in Highland Springs
Health Insurance Coverage by Age in Highland Springs
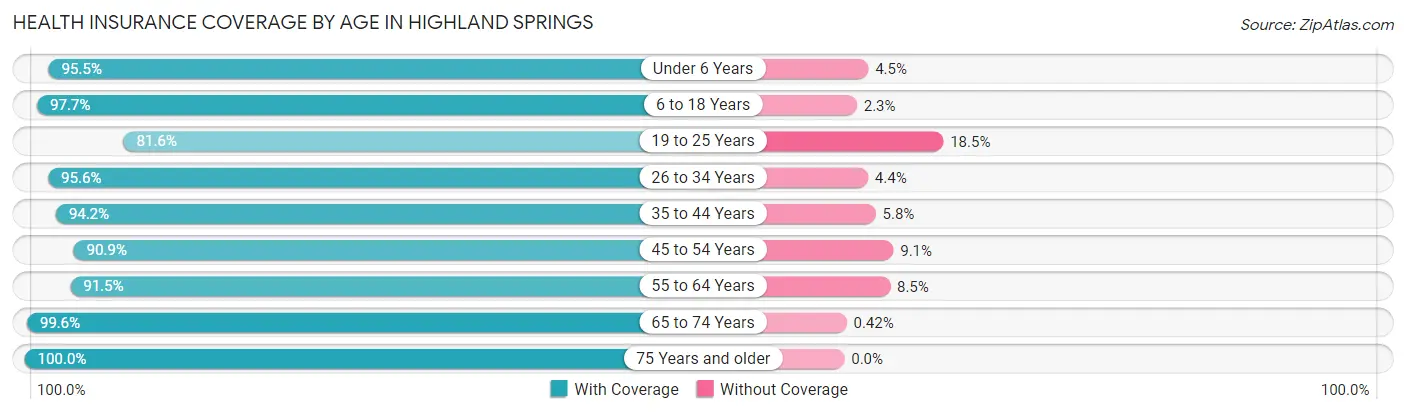
| Age Bracket | With Coverage | Without Coverage |
| Under 6 Years | 1,007 (95.5%) | 47 (4.5%) |
| 6 to 18 Years | 2,640 (97.7%) | 63 (2.3%) |
| 19 to 25 Years | 1,238 (81.6%) | 280 (18.4%) |
| 26 to 34 Years | 1,434 (95.6%) | 66 (4.4%) |
| 35 to 44 Years | 1,693 (94.2%) | 105 (5.8%) |
| 45 to 54 Years | 1,689 (90.9%) | 170 (9.1%) |
| 55 to 64 Years | 1,822 (91.5%) | 170 (8.5%) |
| 65 to 74 Years | 1,671 (99.6%) | 7 (0.4%) |
| 75 Years and older | 652 (100.0%) | 0 (0.0%) |
| Total | 13,846 (93.9%) | 908 (6.1%) |
Health Insurance Coverage by Citizenship Status in Highland Springs
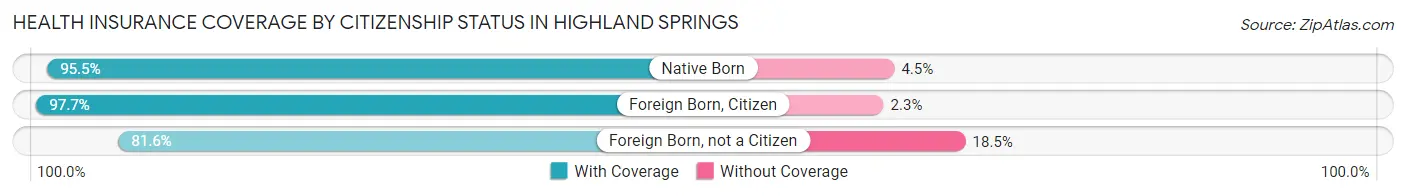
| Citizenship Status | With Coverage | Without Coverage |
| Native Born | 1,007 (95.5%) | 47 (4.5%) |
| Foreign Born, Citizen | 2,640 (97.7%) | 63 (2.3%) |
| Foreign Born, not a Citizen | 1,238 (81.6%) | 280 (18.4%) |
Health Insurance Coverage by Household Income in Highland Springs
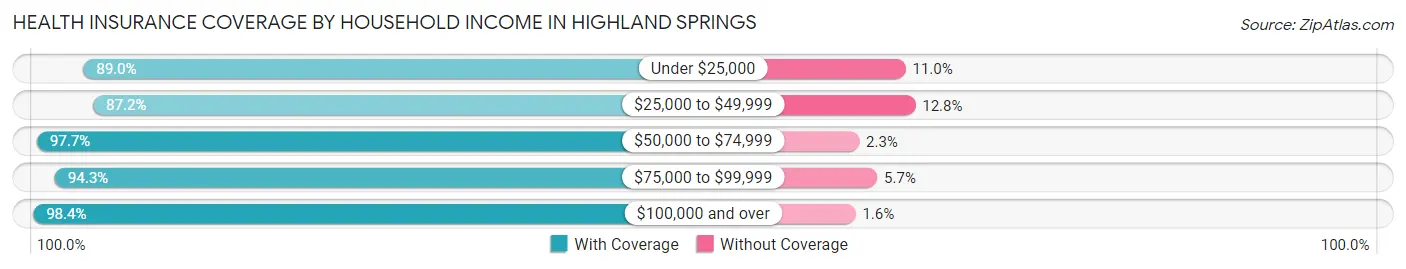
| Household Income | With Coverage | Without Coverage |
| Under $25,000 | 2,565 (89.0%) | 317 (11.0%) |
| $25,000 to $49,999 | 2,172 (87.2%) | 320 (12.8%) |
| $50,000 to $74,999 | 3,808 (97.7%) | 90 (2.3%) |
| $75,000 to $99,999 | 1,941 (94.3%) | 117 (5.7%) |
| $100,000 and over | 3,335 (98.4%) | 55 (1.6%) |
Public vs Private Health Insurance Coverage by Age in Highland Springs
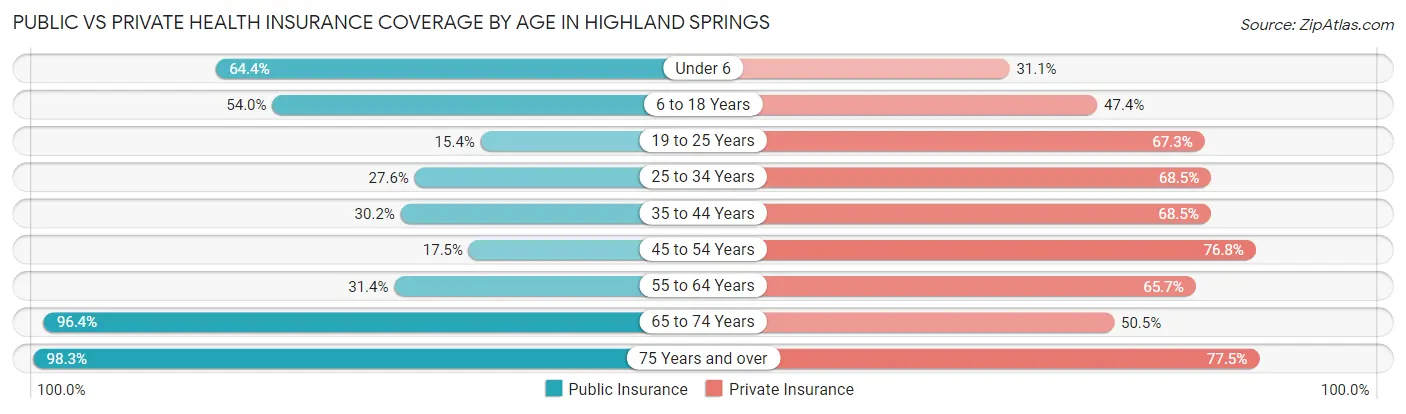
| Age Bracket | Public Insurance | Private Insurance |
| Under 6 | 679 (64.4%) | 328 (31.1%) |
| 6 to 18 Years | 1,460 (54.0%) | 1,281 (47.4%) |
| 19 to 25 Years | 233 (15.3%) | 1,022 (67.3%) |
| 25 to 34 Years | 414 (27.6%) | 1,028 (68.5%) |
| 35 to 44 Years | 543 (30.2%) | 1,231 (68.5%) |
| 45 to 54 Years | 326 (17.5%) | 1,428 (76.8%) |
| 55 to 64 Years | 625 (31.4%) | 1,308 (65.7%) |
| 65 to 74 Years | 1,618 (96.4%) | 848 (50.5%) |
| 75 Years and over | 641 (98.3%) | 505 (77.4%) |
| Total | 6,539 (44.3%) | 8,979 (60.9%) |
Disability Status by Sex by Age in Highland Springs
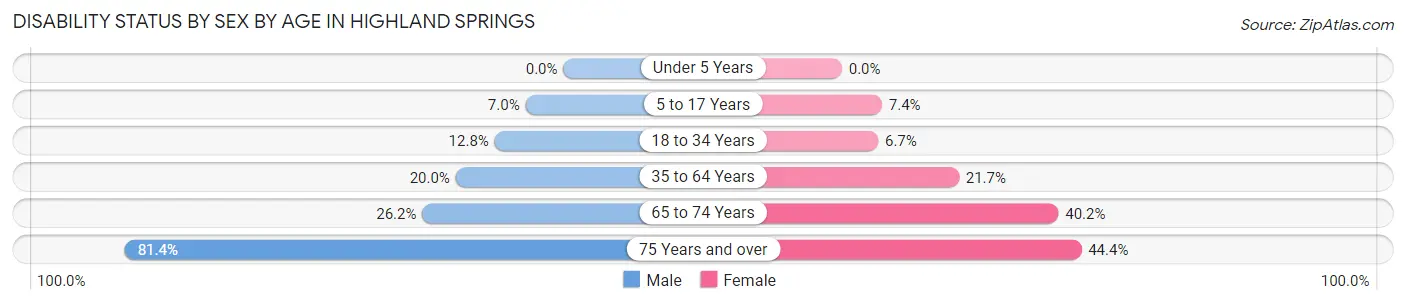
| Age Bracket | Male | Female |
| Under 5 Years | 0 (0.0%) | 0 (0.0%) |
| 5 to 17 Years | 77 (7.0%) | 115 (7.4%) |
| 18 to 34 Years | 189 (12.8%) | 122 (6.7%) |
| 35 to 64 Years | 487 (20.0%) | 697 (21.7%) |
| 65 to 74 Years | 238 (26.2%) | 309 (40.2%) |
| 75 Years and over | 311 (81.4%) | 120 (44.4%) |
Disability Class by Sex by Age in Highland Springs
Disability Class: Hearing Difficulty
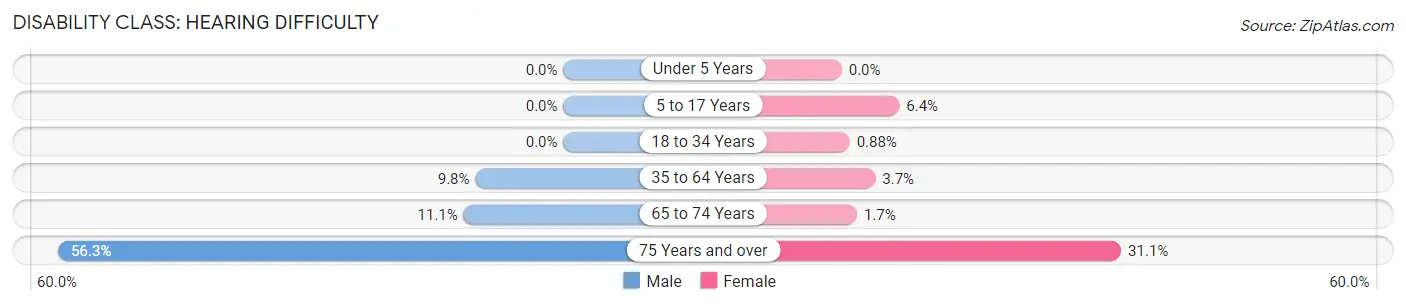
| Age Bracket | Male | Female |
| Under 5 Years | 0 (0.0%) | 0 (0.0%) |
| 5 to 17 Years | 0 (0.0%) | 99 (6.4%) |
| 18 to 34 Years | 0 (0.0%) | 16 (0.9%) |
| 35 to 64 Years | 239 (9.8%) | 120 (3.7%) |
| 65 to 74 Years | 101 (11.1%) | 13 (1.7%) |
| 75 Years and over | 215 (56.3%) | 84 (31.1%) |
Disability Class: Vision Difficulty
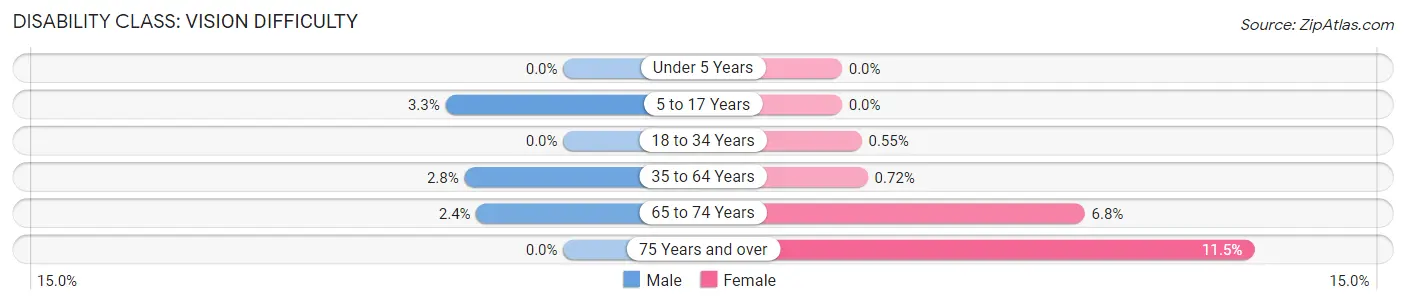
| Age Bracket | Male | Female |
| Under 5 Years | 0 (0.0%) | 0 (0.0%) |
| 5 to 17 Years | 36 (3.3%) | 0 (0.0%) |
| 18 to 34 Years | 0 (0.0%) | 10 (0.5%) |
| 35 to 64 Years | 67 (2.8%) | 23 (0.7%) |
| 65 to 74 Years | 22 (2.4%) | 52 (6.8%) |
| 75 Years and over | 0 (0.0%) | 31 (11.5%) |
Disability Class: Cognitive Difficulty
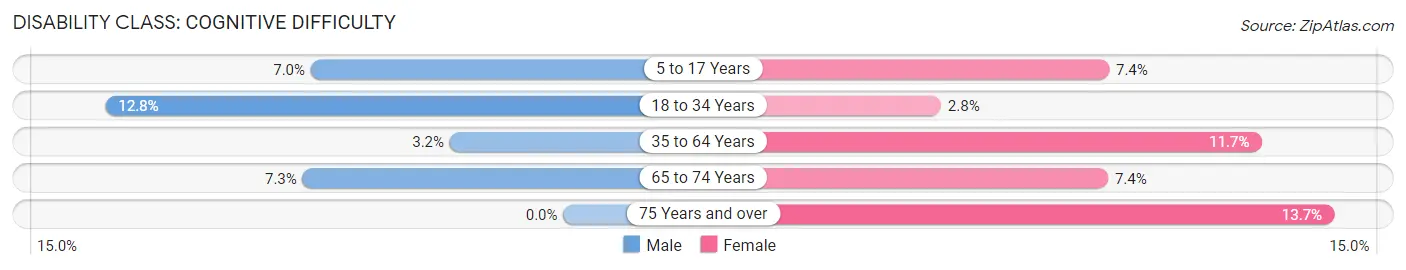
| Age Bracket | Male | Female |
| 5 to 17 Years | 77 (7.0%) | 115 (7.4%) |
| 18 to 34 Years | 189 (12.8%) | 50 (2.8%) |
| 35 to 64 Years | 77 (3.2%) | 375 (11.7%) |
| 65 to 74 Years | 66 (7.3%) | 57 (7.4%) |
| 75 Years and over | 0 (0.0%) | 37 (13.7%) |
Disability Class: Ambulatory Difficulty
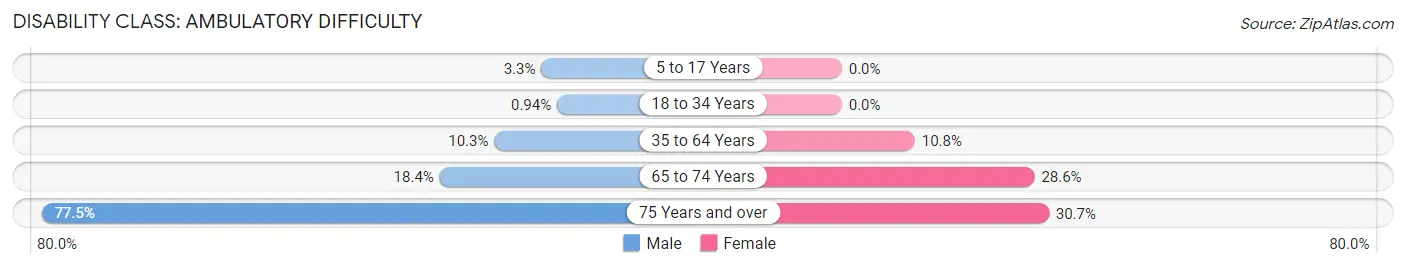
| Age Bracket | Male | Female |
| 5 to 17 Years | 36 (3.3%) | 0 (0.0%) |
| 18 to 34 Years | 14 (0.9%) | 0 (0.0%) |
| 35 to 64 Years | 250 (10.2%) | 348 (10.8%) |
| 65 to 74 Years | 167 (18.4%) | 220 (28.6%) |
| 75 Years and over | 296 (77.5%) | 83 (30.7%) |
Disability Class: Self-Care Difficulty
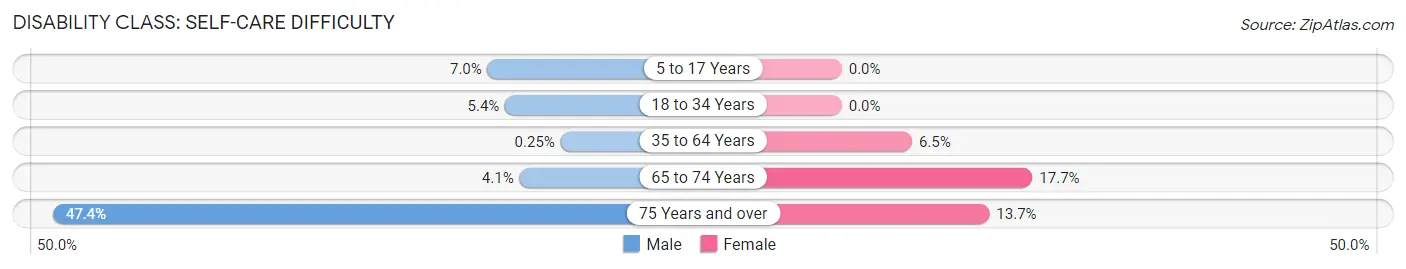
| Age Bracket | Male | Female |
| 5 to 17 Years | 77 (7.0%) | 0 (0.0%) |
| 18 to 34 Years | 80 (5.4%) | 0 (0.0%) |
| 35 to 64 Years | 6 (0.3%) | 209 (6.5%) |
| 65 to 74 Years | 37 (4.1%) | 136 (17.7%) |
| 75 Years and over | 181 (47.4%) | 37 (13.7%) |
Technology Access in Highland Springs
Computing Device Access in Highland Springs
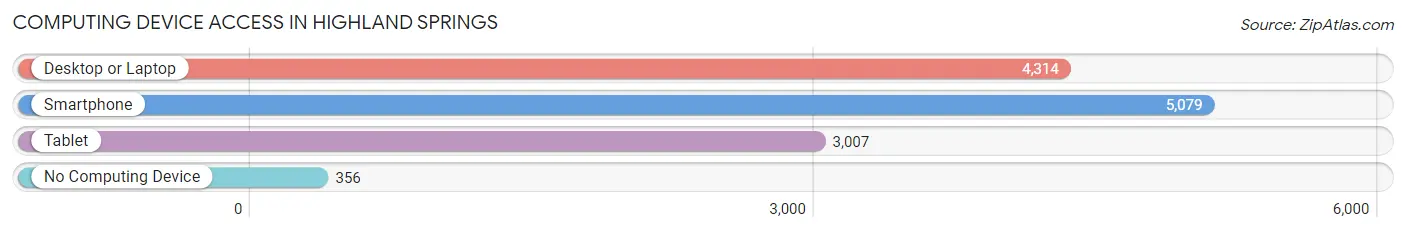
| Device Type | # Households | % Households |
| Desktop or Laptop | 4,314 | 73.3% |
| Smartphone | 5,079 | 86.3% |
| Tablet | 3,007 | 51.1% |
| No Computing Device | 356 | 6.0% |
| Total | 5,886 | 100.0% |
Internet Access in Highland Springs
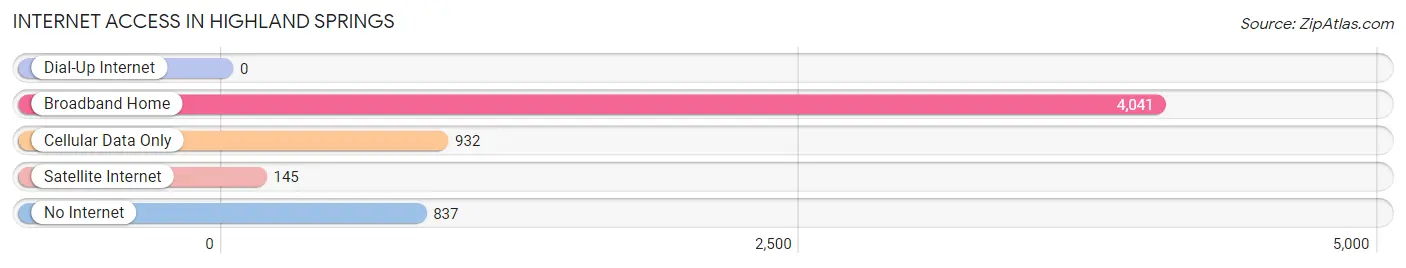
| Internet Type | # Households | % Households |
| Dial-Up Internet | 0 | 0.0% |
| Broadband Home | 4,041 | 68.6% |
| Cellular Data Only | 932 | 15.8% |
| Satellite Internet | 145 | 2.5% |
| No Internet | 837 | 14.2% |
| Total | 5,886 | 100.0% |
Highland Springs Summary
Highland Springs is a census-designated place (CDP) located in Henrico County, Virginia, United States. The population was 8,717 at the 2010 census. It is located approximately 10 miles east of downtown Richmond.
Geography
Highland Springs is located at 37 30 25 North 77 25 17 West 37 506944 77 421389
According to the United States Census Bureau, the CDP has a total area of 4.2 square miles (10.8 km2), all of it land.
History
Highland Springs was first settled in the early 1700s by English settlers. The area was originally known as "Springfield" and was part of Henrico County. In 1891, the name was changed to "Highland Springs" to reflect the area's many natural springs.
The area was home to a number of prominent families, including the Bollings, the Carters, the Dabneys, and the Randolphs. The Bolling family owned a large plantation in the area, and the Carters owned a large brick house that still stands today.
The area was also home to a number of businesses, including a grist mill, a saw mill, a blacksmith shop, and a general store.
In the late 19th century, the area began to develop as a resort town. The Highland Springs Hotel was built in 1891 and was a popular destination for visitors from Richmond and other nearby cities. The hotel was destroyed by fire in the early 20th century, but the area continued to attract visitors.
Economy
Highland Springs is primarily a residential community, but it does have a few businesses. The largest employer in the area is the Henrico County Public Schools, which employs over 1,000 people. Other employers include the Henrico County government, the U.S. Postal Service, and a number of small businesses.
Demographics
As of the census of 2000, there were 8,717 people, 3,541 households, and 2,521 families residing in the CDP. The population density was 2,093.3 people per square mile (807.7/km2). There were 3,717 housing units at an average density of 886.3/sq mi (342.2/km2). The racial makeup of the CDP was 68.45% White, 28.45% African American, 0.25% Native American, 0.90% Asian, 0.02% Pacific Islander, 0.45% from other races, and 1.48% from two or more races. Hispanic or Latino of any race were 1.45% of the population.
There were 3,541 households, out of which 28.7% had children under the age of 18 living with them, 51.2% were married couples living together, 14.2% had a female householder with no husband present, and 30.3% were non-families. 25.2% of all households were made up of individuals, and 10.2% had someone living alone who was 65 years of age or older. The average household size was 2.45 and the average family size was 2.93.
In the CDP, the population was spread out, with 22.7% under the age of 18, 6.7% from 18 to 24, 28.2% from 25 to 44, 25.2% from 45 to 64, and 17.2% who were 65 years of age or older. The median age was 40 years. For every 100 females, there were 87.3 males. For every 100 females age 18 and over, there were 82.3 males.
The median income for a household in the CDP was $45,945, and the median income for a family was $54,945. Males had a median income of $37,945 versus $30,945 for females. The per capita income for the CDP was $21,945. About 4.2% of families and 6.2% of the population were below the poverty line, including 8.2% of those under age 18 and 5.2% of those age 65 or over.
Common Questions
What is Per Capita Income in Highland Springs?
Per Capita income in Highland Springs is $26,176.
What is the Median Family Income in Highland Springs?
Median Family Income in Highland Springs is $59,279.
What is the Median Household income in Highland Springs?
Median Household Income in Highland Springs is $54,270.
What is Income or Wage Gap in Highland Springs?
Income or Wage Gap in Highland Springs is 7.6%.
Women in Highland Springs earn 92.4 cents for every dollar earned by a man.
What is Inequality or Gini Index in Highland Springs?
Inequality or Gini Index in Highland Springs is 0.40.
What is the Total Population of Highland Springs?
Total Population of Highland Springs is 14,881.
What is the Total Male Population of Highland Springs?
Total Male Population of Highland Springs is 6,841.
What is the Total Female Population of Highland Springs?
Total Female Population of Highland Springs is 8,040.
What is the Ratio of Males per 100 Females in Highland Springs?
There are 85.09 Males per 100 Females in Highland Springs.
What is the Ratio of Females per 100 Males in Highland Springs?
There are 117.53 Females per 100 Males in Highland Springs.
What is the Median Population Age in Highland Springs?
Median Population Age in Highland Springs is 38.5 Years.
What is the Average Family Size in Highland Springs
Average Family Size in Highland Springs is 3.3 People.
What is the Average Household Size in Highland Springs
Average Household Size in Highland Springs is 2.5 People.
How Large is the Labor Force in Highland Springs?
There are 7,793 People in the Labor Forcein in Highland Springs.
What is the Percentage of People in the Labor Force in Highland Springs?
67.0% of People are in the Labor Force in Highland Springs.
What is the Unemployment Rate in Highland Springs?
Unemployment Rate in Highland Springs is 5.4%.