Bracey, VA Map & Demographics
Bracey Map
Bracey Overview
$46,905
PER CAPITA INCOME
$77,115
AVG FAMILY INCOME
$71,500
AVG HOUSEHOLD INCOME
31.0%
WAGE / INCOME GAP [ % ]
69.0¢/ $1
WAGE / INCOME GAP [ $ ]
0.39
INEQUALITY / GINI INDEX
1,417
TOTAL POPULATION
746
MALE POPULATION
671
FEMALE POPULATION
111.18
MALES / 100 FEMALES
89.95
FEMALES / 100 MALES
62.3
MEDIAN AGE
2.3
AVG FAMILY SIZE
2.0
AVG HOUSEHOLD SIZE
677
LABOR FORCE [ PEOPLE ]
49.2%
PERCENT IN LABOR FORCE
10.6%
UNEMPLOYMENT RATE
Bracey Zip Codes
Bracey Area Codes
Income in Bracey
Income Overview in Bracey
Per Capita Income in Bracey is $46,905, while median incomes of families and households are $77,115 and $71,500 respectively.
| Characteristic | Number | Measure |
| Per Capita Income | 1,417 | $46,905 |
| Median Family Income | 522 | $77,115 |
| Mean Family Income | 522 | $104,548 |
| Median Household Income | 694 | $71,500 |
| Mean Household Income | 694 | $94,045 |
| Income Deficit | 522 | $0 |
| Wage / Income Gap (%) | 1,417 | 31.01% |
| Wage / Income Gap ($) | 1,417 | 68.99¢ per $1 |
| Gini / Inequality Index | 1,417 | 0.39 |
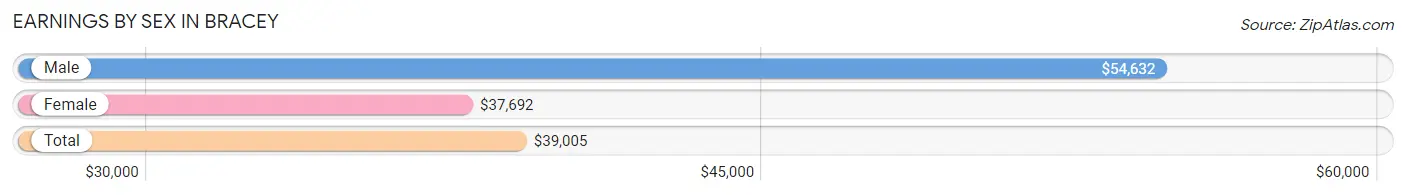
Earnings by Sex in Bracey
Average Earnings in Bracey are $39,005, $54,632 for men and $37,692 for women, a difference of 31.0%.
| Sex | Number | Average Earnings |
| Male | 347 (52.5%) | $54,632 |
| Female | 314 (47.5%) | $37,692 |
| Total | 661 (100.0%) | $39,005 |
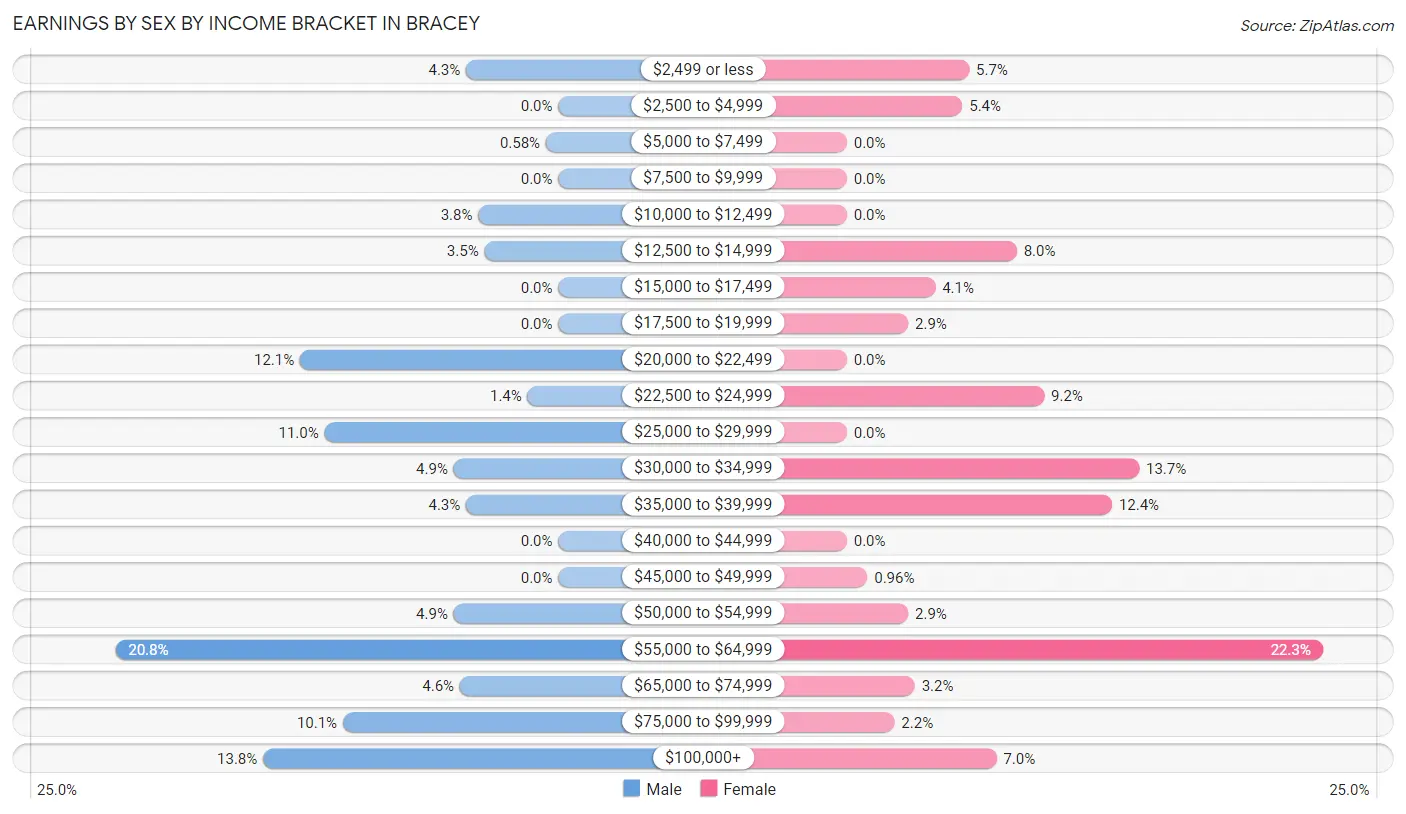
Earnings by Sex by Income Bracket in Bracey
The most common earnings brackets in Bracey are $55,000 to $64,999 for men (72 | 20.7%) and $55,000 to $64,999 for women (70 | 22.3%).
| Income | Male | Female |
| $2,499 or less | 15 (4.3%) | 18 (5.7%) |
| $2,500 to $4,999 | 0 (0.0%) | 17 (5.4%) |
| $5,000 to $7,499 | 2 (0.6%) | 0 (0.0%) |
| $7,500 to $9,999 | 0 (0.0%) | 0 (0.0%) |
| $10,000 to $12,499 | 13 (3.7%) | 0 (0.0%) |
| $12,500 to $14,999 | 12 (3.5%) | 25 (8.0%) |
| $15,000 to $17,499 | 0 (0.0%) | 13 (4.1%) |
| $17,500 to $19,999 | 0 (0.0%) | 9 (2.9%) |
| $20,000 to $22,499 | 42 (12.1%) | 0 (0.0%) |
| $22,500 to $24,999 | 5 (1.4%) | 29 (9.2%) |
| $25,000 to $29,999 | 38 (11.0%) | 0 (0.0%) |
| $30,000 to $34,999 | 17 (4.9%) | 43 (13.7%) |
| $35,000 to $39,999 | 15 (4.3%) | 39 (12.4%) |
| $40,000 to $44,999 | 0 (0.0%) | 0 (0.0%) |
| $45,000 to $49,999 | 0 (0.0%) | 3 (1.0%) |
| $50,000 to $54,999 | 17 (4.9%) | 9 (2.9%) |
| $55,000 to $64,999 | 72 (20.7%) | 70 (22.3%) |
| $65,000 to $74,999 | 16 (4.6%) | 10 (3.2%) |
| $75,000 to $99,999 | 35 (10.1%) | 7 (2.2%) |
| $100,000+ | 48 (13.8%) | 22 (7.0%) |
| Total | 347 (100.0%) | 314 (100.0%) |
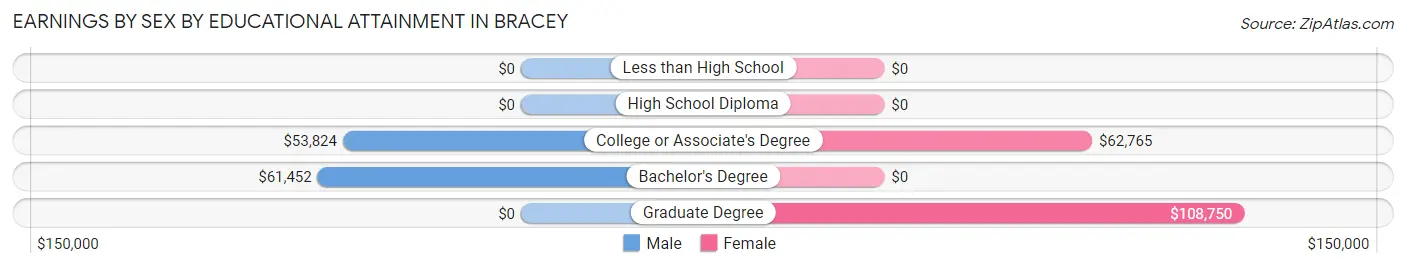
Earnings by Sex by Educational Attainment in Bracey
Average earnings in Bracey are $60,806 for men and $39,135 for women, a difference of 35.6%. Men with an educational attainment of bachelor's degree enjoy the highest average annual earnings of $61,452, while those with college or associate's degree education earn the least with $53,824. Women with an educational attainment of graduate degree earn the most with the average annual earnings of $108,750, while those with college or associate's degree education have the smallest earnings of $62,765.
| Educational Attainment | Male Income | Female Income |
| Less than High School | - | - |
| High School Diploma | - | - |
| College or Associate's Degree | $53,824 | $62,765 |
| Bachelor's Degree | $61,452 | $0 |
| Graduate Degree | - | - |
| Total | $60,806 | $39,135 |
Family Income in Bracey
Family Income Brackets in Bracey
According to the Bracey family income data, there are 137 families falling into the $150,000 to $199,999 income range, which is the most common income bracket and makes up 26.3% of all families.
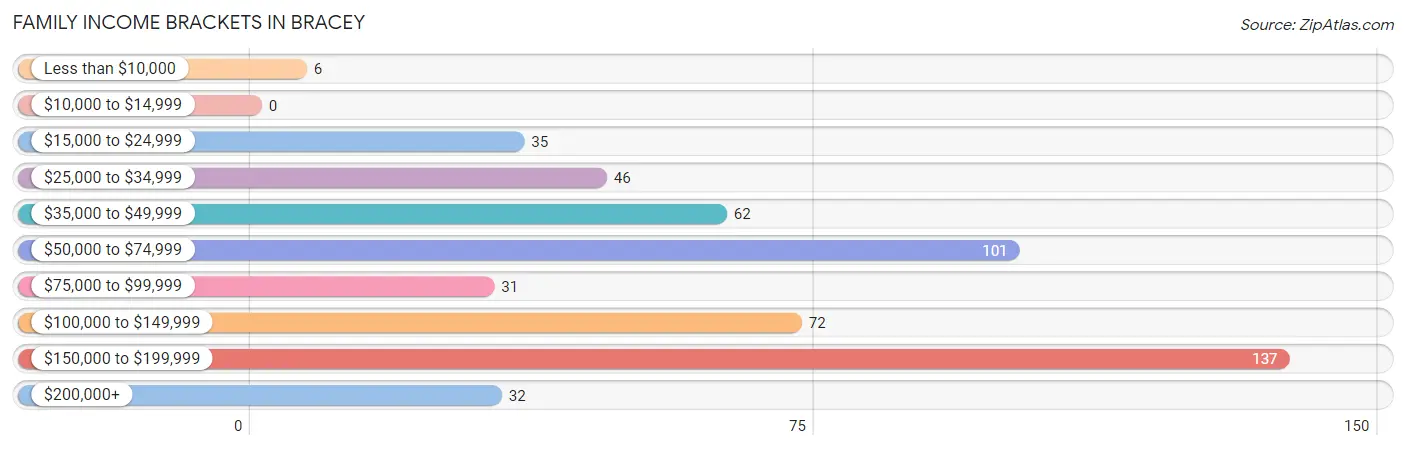
| Income Bracket | # Families | % Families |
| Less than $10,000 | 6 | 1.1% |
| $10,000 to $14,999 | 0 | 0.0% |
| $15,000 to $24,999 | 35 | 6.7% |
| $25,000 to $34,999 | 46 | 8.8% |
| $35,000 to $49,999 | 62 | 11.9% |
| $50,000 to $74,999 | 101 | 19.3% |
| $75,000 to $99,999 | 31 | 5.9% |
| $100,000 to $149,999 | 72 | 13.8% |
| $150,000 to $199,999 | 137 | 26.2% |
| $200,000+ | 32 | 6.1% |
Family Income by Famaliy Size in Bracey
4-person families (16 | 3.1%) account for the highest median family income in Bracey with $199,375 per family, while 3-person families (111 | 21.3%) have the highest median income of $54,254 per family member.
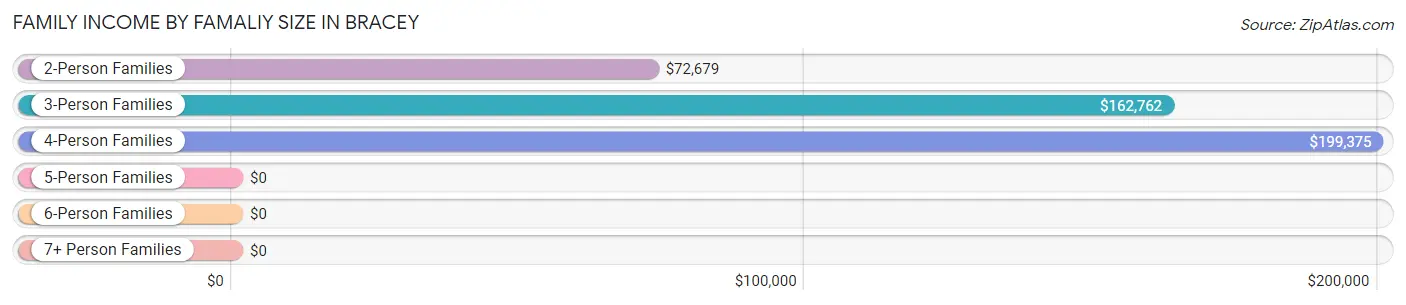
| Income Bracket | # Families | Median Income |
| 2-Person Families | 395 (75.7%) | $72,679 |
| 3-Person Families | 111 (21.3%) | $162,762 |
| 4-Person Families | 16 (3.1%) | $199,375 |
| 5-Person Families | 0 (0.0%) | $0 |
| 6-Person Families | 0 (0.0%) | $0 |
| 7+ Person Families | 0 (0.0%) | $0 |
| Total | 522 (100.0%) | $77,115 |
Family Income by Number of Earners in Bracey
The median family income in Bracey is $77,115, with families comprising 3+ earners (83) having the highest median family income of $163,609, while families with 1 earner (170) have the lowest median family income of $63,000, accounting for 15.9% and 32.6% of families, respectively.
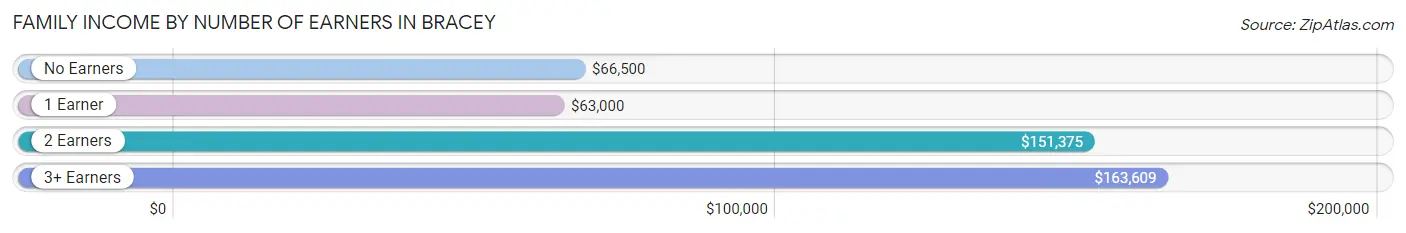
| Number of Earners | # Families | Median Income |
| No Earners | 190 (36.4%) | $66,500 |
| 1 Earner | 170 (32.6%) | $63,000 |
| 2 Earners | 79 (15.1%) | $151,375 |
| 3+ Earners | 83 (15.9%) | $163,609 |
| Total | 522 (100.0%) | $77,115 |
Household Income in Bracey
Household Income Brackets in Bracey
With 209 households falling in the category, the $50,000 to $74,999 income range is the most frequent in Bracey, accounting for 30.1% of all households.
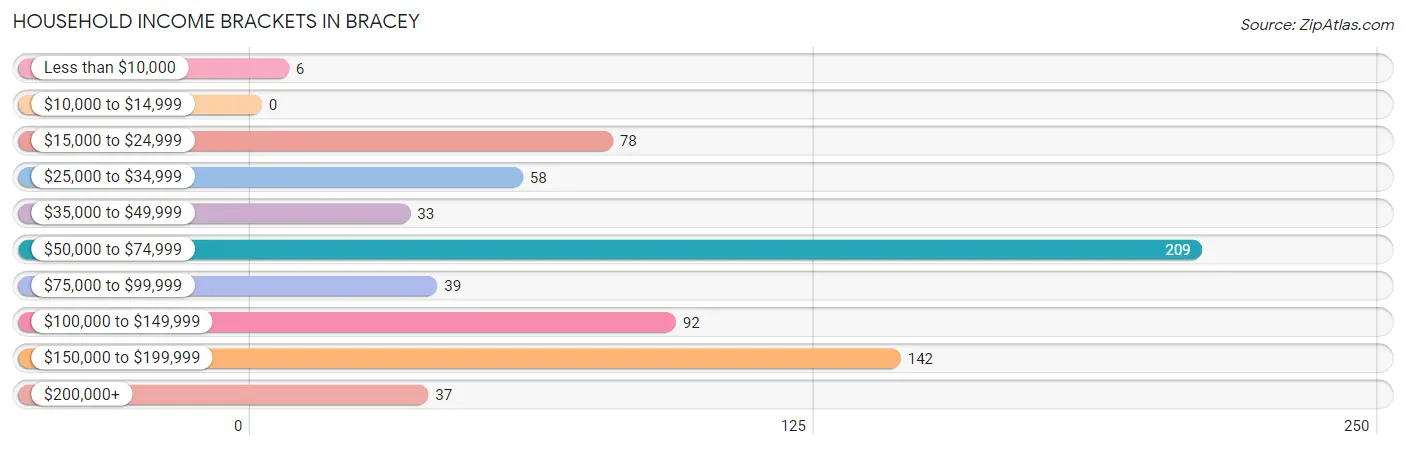
| Income Bracket | # Households | % Households |
| Less than $10,000 | 6 | 0.9% |
| $10,000 to $14,999 | 0 | 0.0% |
| $15,000 to $24,999 | 78 | 11.2% |
| $25,000 to $34,999 | 58 | 8.4% |
| $35,000 to $49,999 | 33 | 4.8% |
| $50,000 to $74,999 | 209 | 30.1% |
| $75,000 to $99,999 | 39 | 5.6% |
| $100,000 to $149,999 | 92 | 13.3% |
| $150,000 to $199,999 | 142 | 20.5% |
| $200,000+ | 37 | 5.3% |
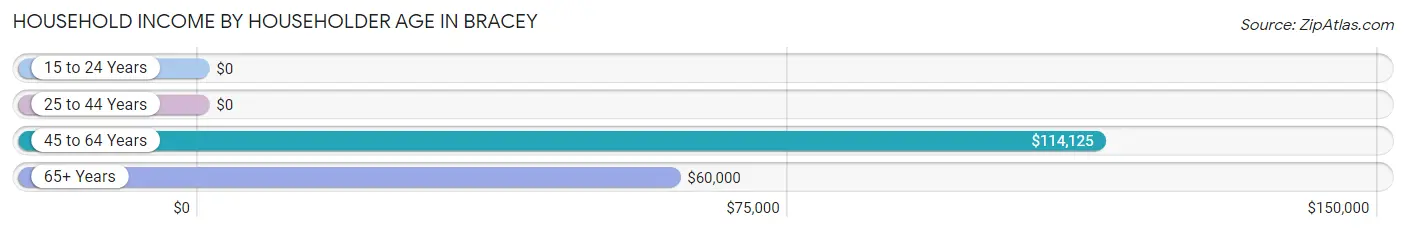
Household Income by Householder Age in Bracey
The median household income in Bracey is $71,500, with the highest median household income of $114,125 found in the 45 to 64 years age bracket for the primary householder. A total of 283 households (40.8%) fall into this category. Meanwhile, the 15 to 24 years age bracket for the primary householder has the lowest median household income of $0, with 27 households (3.9%) in this group.
| Income Bracket | # Households | Median Income |
| 15 to 24 Years | 27 (3.9%) | $0 |
| 25 to 44 Years | 36 (5.2%) | $0 |
| 45 to 64 Years | 283 (40.8%) | $114,125 |
| 65+ Years | 348 (50.1%) | $60,000 |
| Total | 694 (100.0%) | $71,500 |
Poverty in Bracey
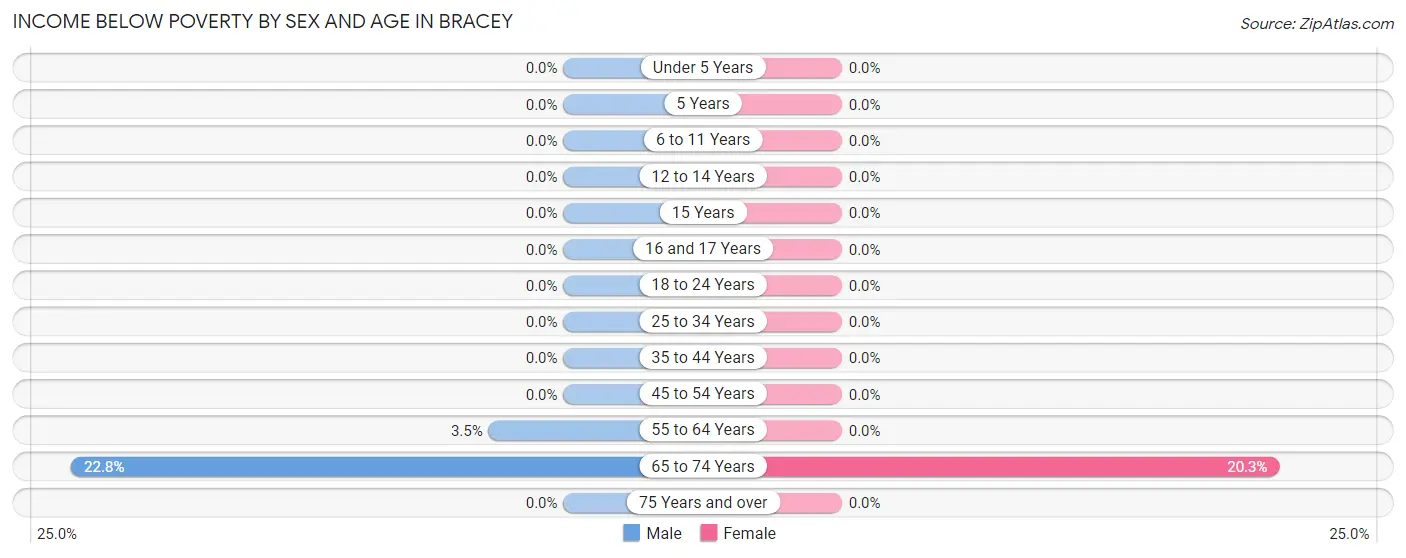
Income Below Poverty by Sex and Age in Bracey
With 6.8% poverty level for males and 6.1% for females among the residents of Bracey, 65 to 74 year old males and 65 to 74 year old females are the most vulnerable to poverty, with 45 males (22.8%) and 41 females (20.3%) in their respective age groups living below the poverty level.
| Age Bracket | Male | Female |
| Under 5 Years | 0 (0.0%) | 0 (0.0%) |
| 5 Years | 0 (0.0%) | 0 (0.0%) |
| 6 to 11 Years | 0 (0.0%) | 0 (0.0%) |
| 12 to 14 Years | 0 (0.0%) | 0 (0.0%) |
| 15 Years | 0 (0.0%) | 0 (0.0%) |
| 16 and 17 Years | 0 (0.0%) | 0 (0.0%) |
| 18 to 24 Years | 0 (0.0%) | 0 (0.0%) |
| 25 to 34 Years | 0 (0.0%) | 0 (0.0%) |
| 35 to 44 Years | 0 (0.0%) | 0 (0.0%) |
| 45 to 54 Years | 0 (0.0%) | 0 (0.0%) |
| 55 to 64 Years | 6 (3.5%) | 0 (0.0%) |
| 65 to 74 Years | 45 (22.8%) | 41 (20.3%) |
| 75 Years and over | 0 (0.0%) | 0 (0.0%) |
| Total | 51 (6.8%) | 41 (6.1%) |
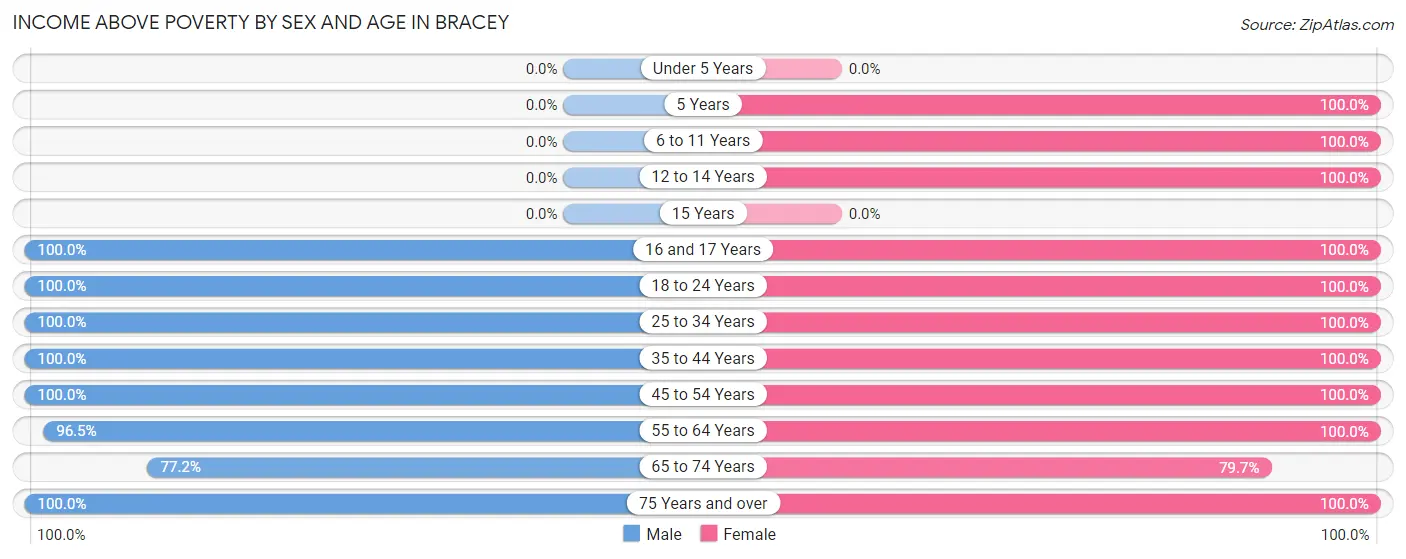
Income Above Poverty by Sex and Age in Bracey
According to the poverty statistics in Bracey, males aged 16 and 17 years and females aged 5 years are the age groups that are most secure financially, with 100.0% of males and 100.0% of females in these age groups living above the poverty line.
| Age Bracket | Male | Female |
| Under 5 Years | 0 (0.0%) | 0 (0.0%) |
| 5 Years | 0 (0.0%) | 5 (100.0%) |
| 6 to 11 Years | 0 (0.0%) | 17 (100.0%) |
| 12 to 14 Years | 0 (0.0%) | 18 (100.0%) |
| 15 Years | 0 (0.0%) | 0 (0.0%) |
| 16 and 17 Years | 25 (100.0%) | 18 (100.0%) |
| 18 to 24 Years | 79 (100.0%) | 27 (100.0%) |
| 25 to 34 Years | 21 (100.0%) | 7 (100.0%) |
| 35 to 44 Years | 16 (100.0%) | 23 (100.0%) |
| 45 to 54 Years | 72 (100.0%) | 178 (100.0%) |
| 55 to 64 Years | 167 (96.5%) | 104 (100.0%) |
| 65 to 74 Years | 152 (77.2%) | 161 (79.7%) |
| 75 Years and over | 163 (100.0%) | 72 (100.0%) |
| Total | 695 (93.2%) | 630 (93.9%) |
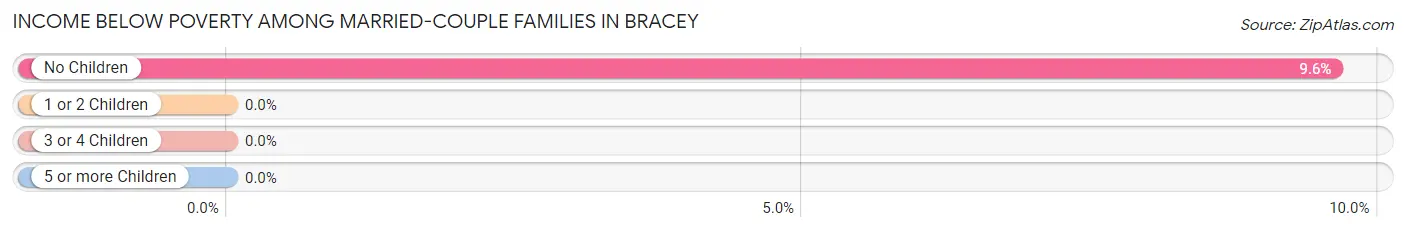
Income Below Poverty Among Married-Couple Families in Bracey
The poverty statistics for married-couple families in Bracey show that 9.0% or 41 of the total 457 families live below the poverty line. Families with no children have the highest poverty rate of 9.6%, comprising of 41 families. On the other hand, families with 1 or 2 children have the lowest poverty rate of 0.0%, which includes 0 families.
| Children | Above Poverty | Below Poverty |
| No Children | 385 (90.4%) | 41 (9.6%) |
| 1 or 2 Children | 31 (100.0%) | 0 (0.0%) |
| 3 or 4 Children | 0 (0.0%) | 0 (0.0%) |
| 5 or more Children | 0 (0.0%) | 0 (0.0%) |
| Total | 416 (91.0%) | 41 (9.0%) |
Income Below Poverty Among Single-Parent Households in Bracey
| Children | Single Father | Single Mother |
| No Children | 0 (0.0%) | 0 (0.0%) |
| 1 or 2 Children | 0 (0.0%) | 0 (0.0%) |
| 3 or 4 Children | 0 (0.0%) | 0 (0.0%) |
| 5 or more Children | 0 (0.0%) | 0 (0.0%) |
| Total | 0 (0.0%) | 0 (0.0%) |
Income Below Poverty Among Married-Couple vs Single-Parent Households in Bracey
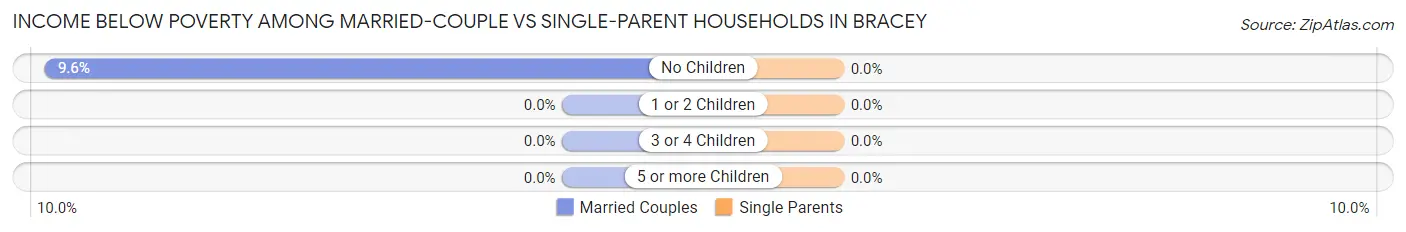
| Children | Married-Couple Families | Single-Parent Households |
| No Children | 41 (9.6%) | 0 (0.0%) |
| 1 or 2 Children | 0 (0.0%) | 0 (0.0%) |
| 3 or 4 Children | 0 (0.0%) | 0 (0.0%) |
| 5 or more Children | 0 (0.0%) | 0 (0.0%) |
| Total | 41 (9.0%) | 0 (0.0%) |
Race in Bracey
The most populous races in Bracey are White / Caucasian (1,226 | 86.5%), Black / African American (142 | 10.0%), and Native / Alaskan (25 | 1.8%).
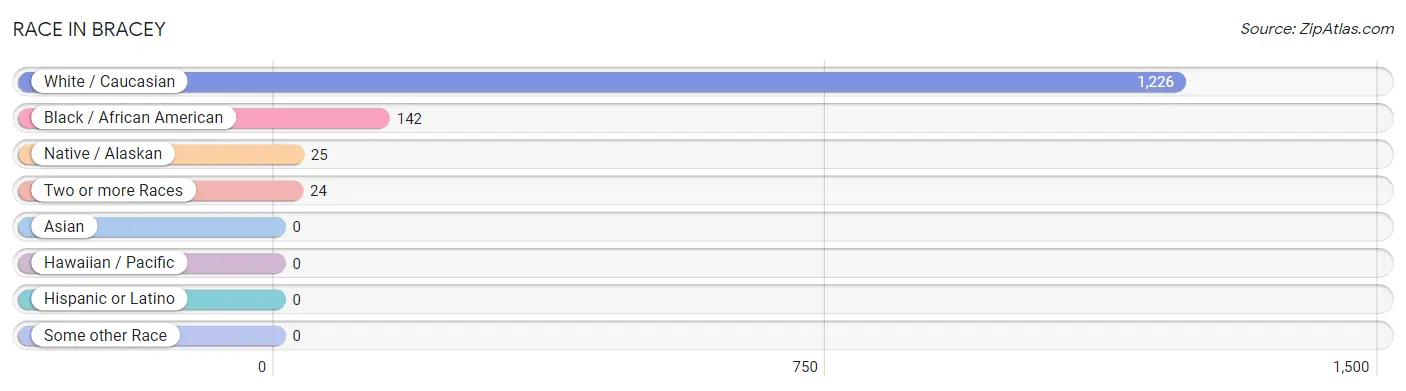
| Race | # Population | % Population |
| Asian | 0 | 0.0% |
| Black / African American | 142 | 10.0% |
| Hawaiian / Pacific | 0 | 0.0% |
| Hispanic or Latino | 0 | 0.0% |
| Native / Alaskan | 25 | 1.8% |
| White / Caucasian | 1,226 | 86.5% |
| Two or more Races | 24 | 1.7% |
| Some other Race | 0 | 0.0% |
| Total | 1,417 | 100.0% |
Ancestry in Bracey
The most populous ancestries reported in Bracey are English (281 | 19.8%), Italian (208 | 14.7%), Irish (169 | 11.9%), German (127 | 9.0%), and American (113 | 8.0%), together accounting for 63.4% of all Bracey residents.
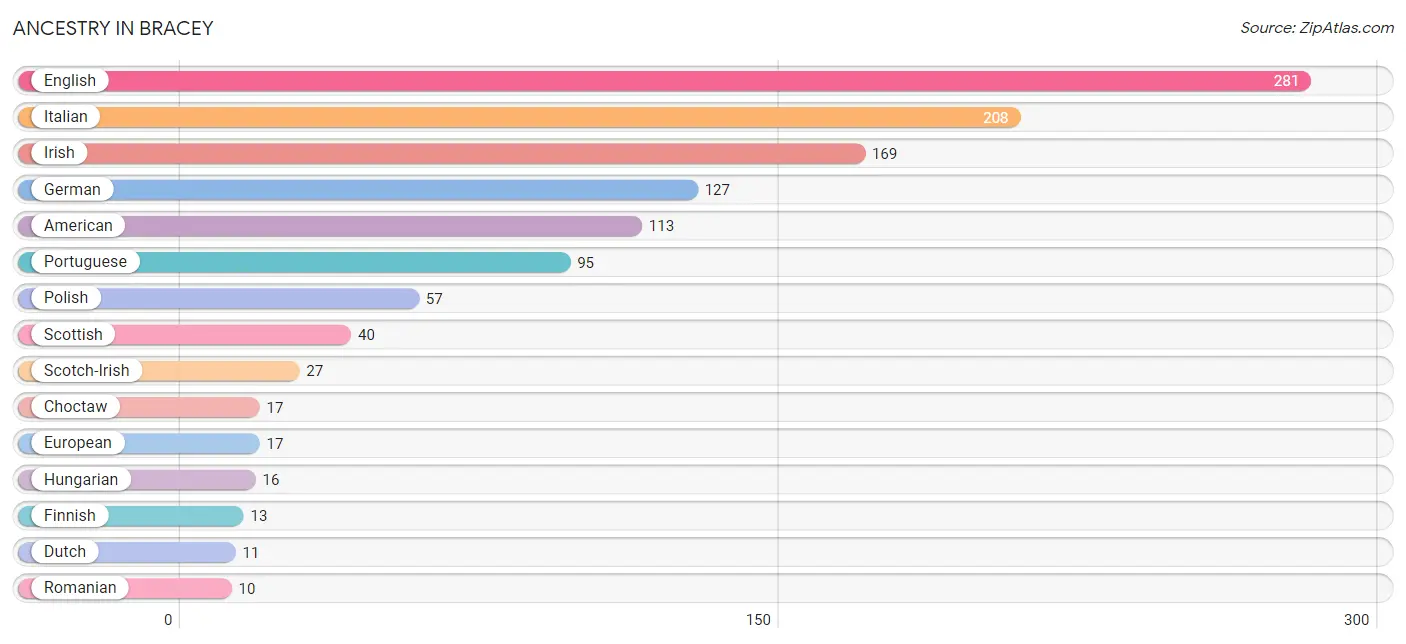
| Ancestry | # Population | % Population |
| American | 113 | 8.0% |
| Choctaw | 17 | 1.2% |
| Dutch | 11 | 0.8% |
| English | 281 | 19.8% |
| European | 17 | 1.2% |
| Finnish | 13 | 0.9% |
| French | 9 | 0.6% |
| German | 127 | 9.0% |
| Hungarian | 16 | 1.1% |
| Irish | 169 | 11.9% |
| Italian | 208 | 14.7% |
| Norwegian | 6 | 0.4% |
| Polish | 57 | 4.0% |
| Portuguese | 95 | 6.7% |
| Romanian | 10 | 0.7% |
| Scandinavian | 8 | 0.6% |
| Scotch-Irish | 27 | 1.9% |
| Scottish | 40 | 2.8% |
| Yup'ik | 8 | 0.6% | View All 19 Rows |
Immigrants in Bracey
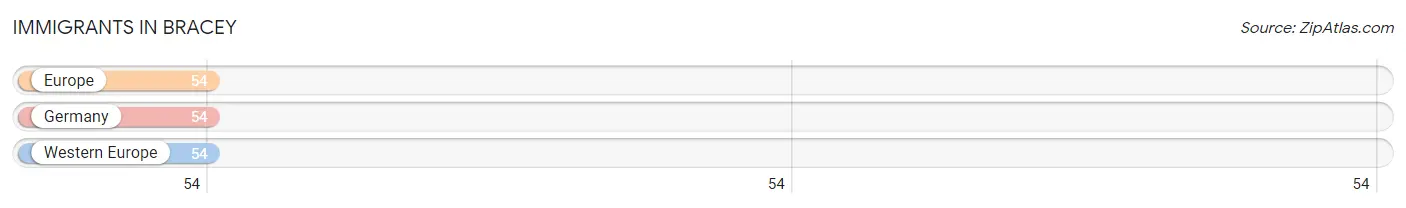
The most numerous immigrant groups reported in Bracey came from Europe (54 | 3.8%), Germany (54 | 3.8%), and Western Europe (54 | 3.8%), together accounting for 11.4% of all Bracey residents.
| Immigration Origin | # Population | % Population |
| Europe | 54 | 3.8% |
| Germany | 54 | 3.8% |
| Western Europe | 54 | 3.8% | View All 3 Rows |
Sex and Age in Bracey
Sex and Age in Bracey
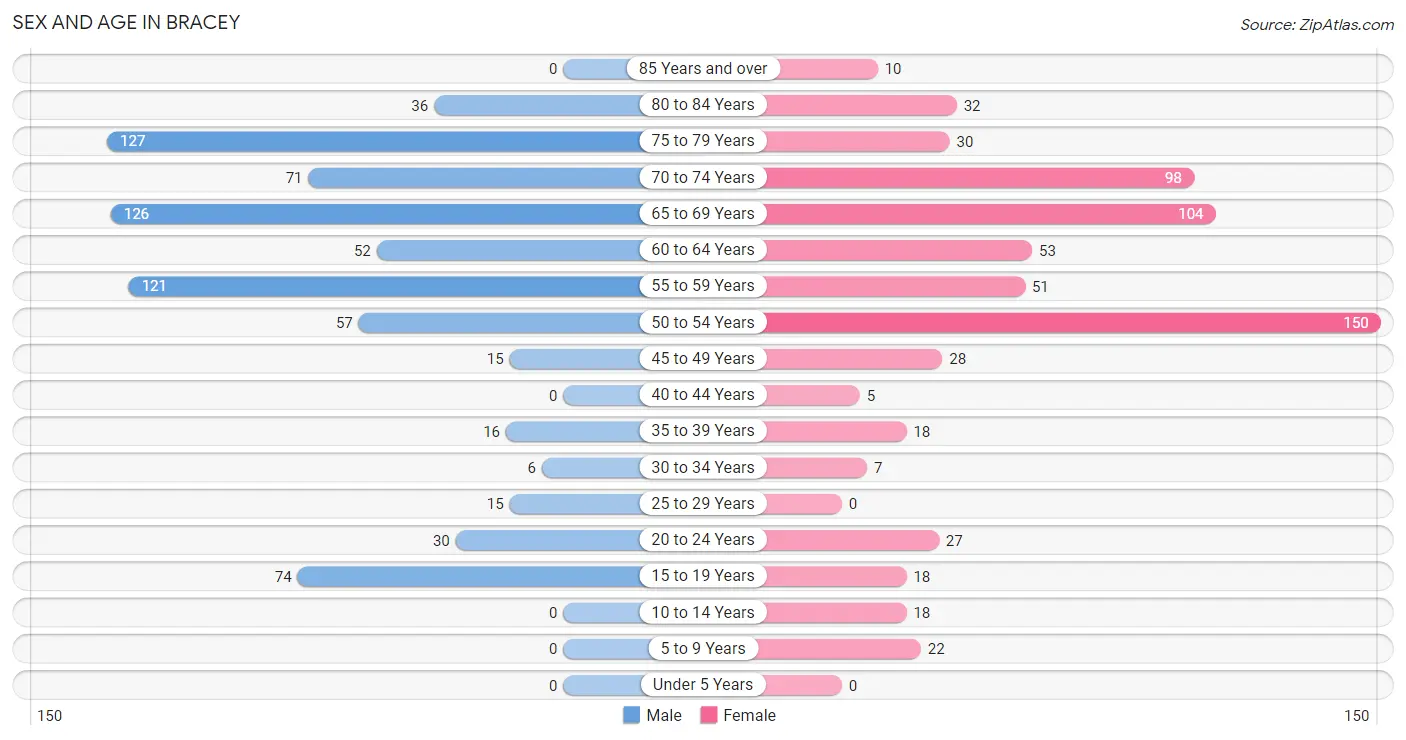
The most populous age groups in Bracey are 75 to 79 Years (127 | 17.0%) for men and 50 to 54 Years (150 | 22.4%) for women.
| Age Bracket | Male | Female |
| Under 5 Years | 0 (0.0%) | 0 (0.0%) |
| 5 to 9 Years | 0 (0.0%) | 22 (3.3%) |
| 10 to 14 Years | 0 (0.0%) | 18 (2.7%) |
| 15 to 19 Years | 74 (9.9%) | 18 (2.7%) |
| 20 to 24 Years | 30 (4.0%) | 27 (4.0%) |
| 25 to 29 Years | 15 (2.0%) | 0 (0.0%) |
| 30 to 34 Years | 6 (0.8%) | 7 (1.0%) |
| 35 to 39 Years | 16 (2.1%) | 18 (2.7%) |
| 40 to 44 Years | 0 (0.0%) | 5 (0.7%) |
| 45 to 49 Years | 15 (2.0%) | 28 (4.2%) |
| 50 to 54 Years | 57 (7.6%) | 150 (22.4%) |
| 55 to 59 Years | 121 (16.2%) | 51 (7.6%) |
| 60 to 64 Years | 52 (7.0%) | 53 (7.9%) |
| 65 to 69 Years | 126 (16.9%) | 104 (15.5%) |
| 70 to 74 Years | 71 (9.5%) | 98 (14.6%) |
| 75 to 79 Years | 127 (17.0%) | 30 (4.5%) |
| 80 to 84 Years | 36 (4.8%) | 32 (4.8%) |
| 85 Years and over | 0 (0.0%) | 10 (1.5%) |
| Total | 746 (100.0%) | 671 (100.0%) |
Families and Households in Bracey
Median Family Size in Bracey
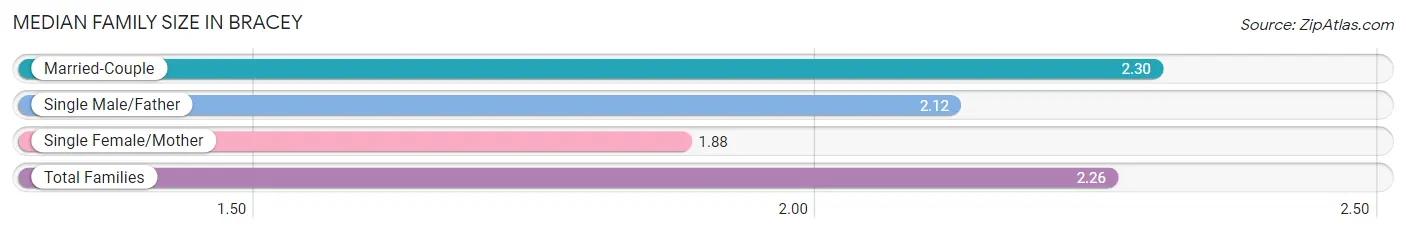
The median family size in Bracey is 2.26 persons per family, with married-couple families (457 | 87.5%) accounting for the largest median family size of 2.3 persons per family. On the other hand, single female/mother families (48 | 9.2%) represent the smallest median family size with 1.88 persons per family.
| Family Type | # Families | Family Size |
| Married-Couple | 457 (87.5%) | 2.30 |
| Single Male/Father | 17 (3.3%) | 2.12 |
| Single Female/Mother | 48 (9.2%) | 1.88 |
| Total Families | 522 (100.0%) | 2.26 |
Median Household Size in Bracey
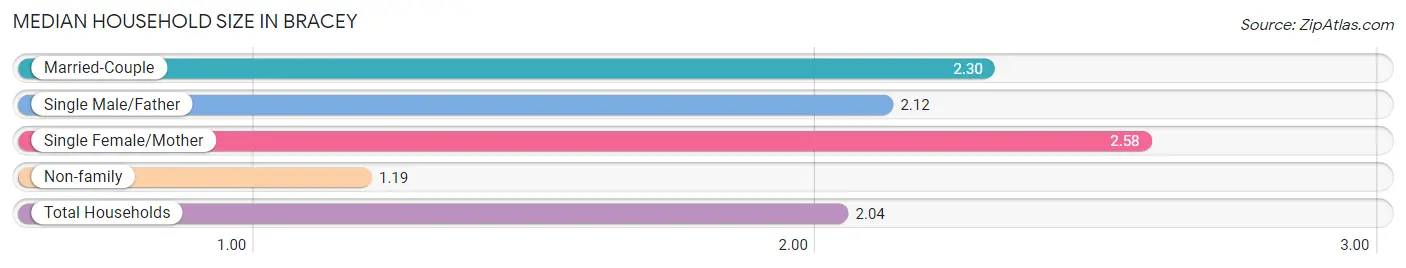
The median household size in Bracey is 2.04 persons per household, with single female/mother households (48 | 6.9%) accounting for the largest median household size of 2.58 persons per household. non-family households (172 | 24.8%) represent the smallest median household size with 1.19 persons per household.
| Household Type | # Households | Household Size |
| Married-Couple | 457 (65.8%) | 2.30 |
| Single Male/Father | 17 (2.5%) | 2.12 |
| Single Female/Mother | 48 (6.9%) | 2.58 |
| Non-family | 172 (24.8%) | 1.19 |
| Total Households | 694 (100.0%) | 2.04 |
Household Size by Marriage Status in Bracey
Out of a total of 694 households in Bracey, 522 (75.2%) are family households, while 172 (24.8%) are nonfamily households. The most numerous type of family households are 2-person households, comprising 366, and the most common type of nonfamily households are 1-person households, comprising 134.
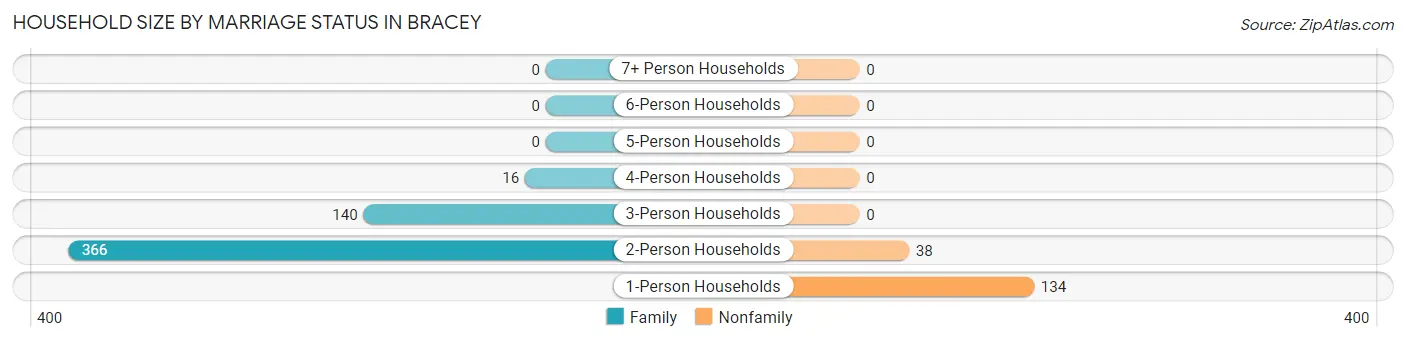
| Household Size | Family Households | Nonfamily Households |
| 1-Person Households | - | 134 (19.3%) |
| 2-Person Households | 366 (52.7%) | 38 (5.5%) |
| 3-Person Households | 140 (20.2%) | 0 (0.0%) |
| 4-Person Households | 16 (2.3%) | 0 (0.0%) |
| 5-Person Households | 0 (0.0%) | 0 (0.0%) |
| 6-Person Households | 0 (0.0%) | 0 (0.0%) |
| 7+ Person Households | 0 (0.0%) | 0 (0.0%) |
| Total | 522 (75.2%) | 172 (24.8%) |
Female Fertility in Bracey
Fertility by Age in Bracey
Average fertility rate in Bracey is 103.0 births per 1,000 women. Women in the age bracket of 35 to 50 years have the highest fertility rate with 150.0 births per 1,000 women. Women in the age bracket of 35 to 50 years acount for 100.0% of all women with births.
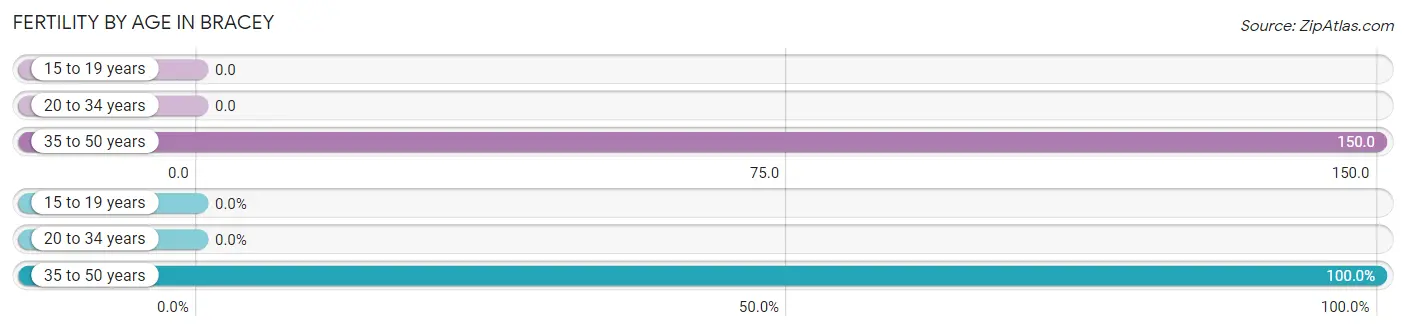
| Age Bracket | Women with Births | Births / 1,000 Women |
| 15 to 19 years | 0 (0.0%) | 0.0 |
| 20 to 34 years | 0 (0.0%) | 0.0 |
| 35 to 50 years | 17 (100.0%) | 150.0 |
| Total | 17 (100.0%) | 103.0 |
Fertility by Age by Marriage Status in Bracey
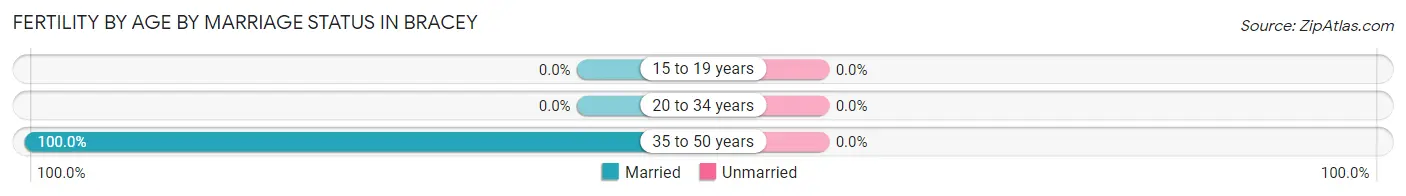
| Age Bracket | Married | Unmarried |
| 15 to 19 years | 0 (0.0%) | 0 (0.0%) |
| 20 to 34 years | 0 (0.0%) | 0 (0.0%) |
| 35 to 50 years | 17 (100.0%) | 0 (0.0%) |
| Total | 17 (100.0%) | 0 (0.0%) |
Fertility by Education in Bracey
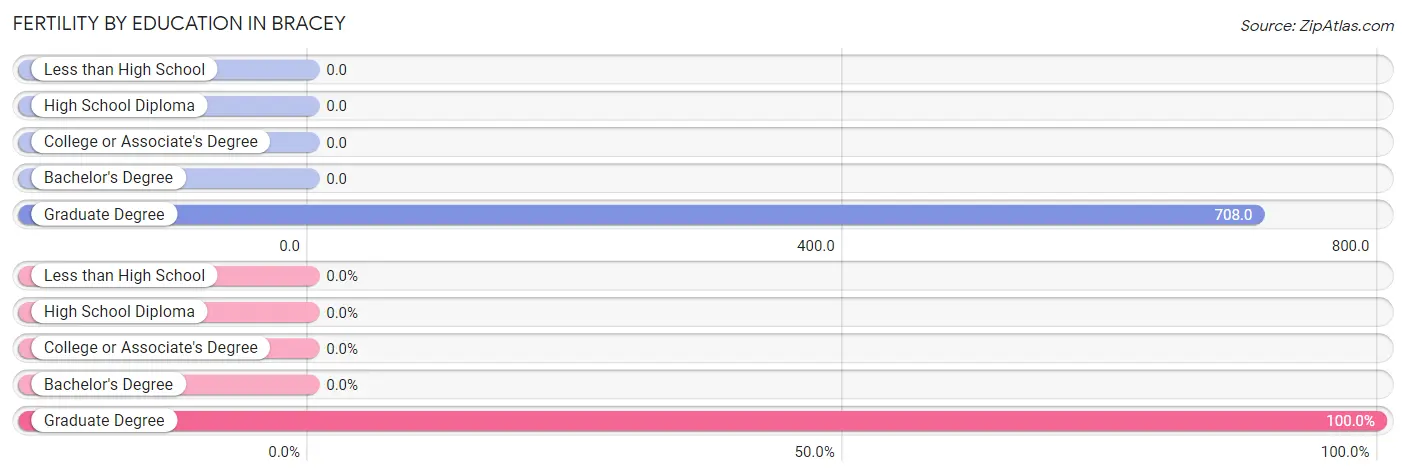
| Educational Attainment | Women with Births | Births / 1,000 Women |
| Less than High School | 0 (0.0%) | 0.0 |
| High School Diploma | 0 (0.0%) | 0.0 |
| College or Associate's Degree | 0 (0.0%) | 0.0 |
| Bachelor's Degree | 0 (0.0%) | 0.0 |
| Graduate Degree | 17 (100.0%) | 708.0 |
| Total | 17 (100.0%) | 103.0 |
Fertility by Education by Marriage Status in Bracey
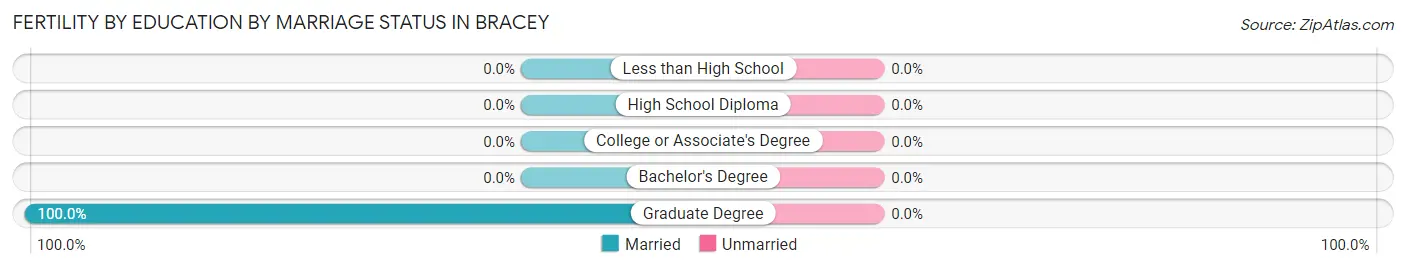
| Educational Attainment | Married | Unmarried |
| Less than High School | 0 (0.0%) | 0 (0.0%) |
| High School Diploma | 0 (0.0%) | 0 (0.0%) |
| College or Associate's Degree | 0 (0.0%) | 0 (0.0%) |
| Bachelor's Degree | 0 (0.0%) | 0 (0.0%) |
| Graduate Degree | 17 (100.0%) | 0 (0.0%) |
| Total | 17 (100.0%) | 0 (0.0%) |
Employment Characteristics in Bracey
Employment by Class of Employer in Bracey
Among the 606 employed individuals in Bracey, private company employees (475 | 78.4%), self-employed (incorporated) (43 | 7.1%), and not-for-profit organizations (33 | 5.4%) make up the most common classes of employment.
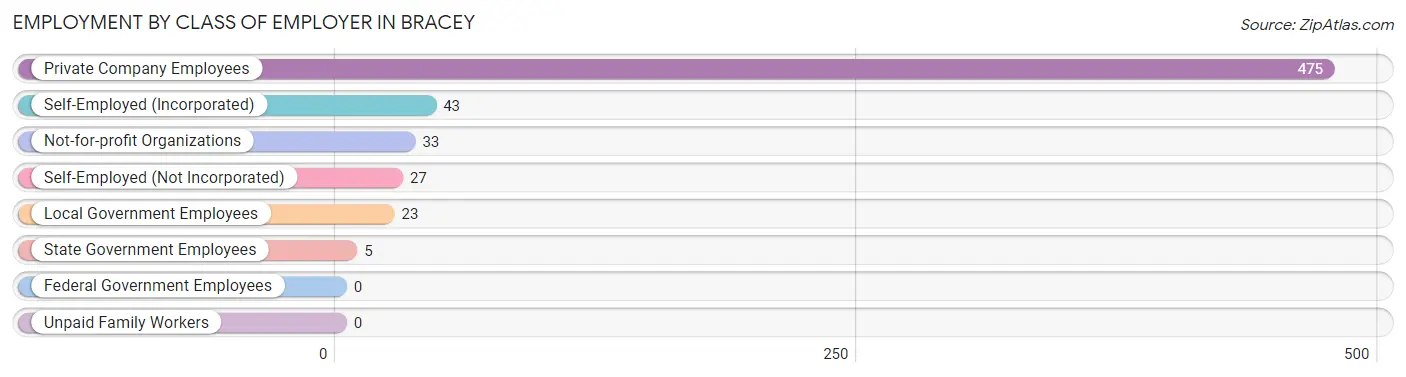
| Employer Class | # Employees | % Employees |
| Private Company Employees | 475 | 78.4% |
| Self-Employed (Incorporated) | 43 | 7.1% |
| Self-Employed (Not Incorporated) | 27 | 4.5% |
| Not-for-profit Organizations | 33 | 5.4% |
| Local Government Employees | 23 | 3.8% |
| State Government Employees | 5 | 0.8% |
| Federal Government Employees | 0 | 0.0% |
| Unpaid Family Workers | 0 | 0.0% |
| Total | 606 | 100.0% |
Employment Status by Age in Bracey
According to the labor force statistics for Bracey, out of the total population over 16 years of age (1,377), 49.2% or 677 individuals are in the labor force, with 10.6% or 72 of them unemployed. The age group with the highest labor force participation rate is 20 to 24 years, with 100.0% or 57 individuals in the labor force. Within the labor force, the 25 to 29 years age range has the highest percentage of unemployed individuals, with 100.0% or 15 of them being unemployed.
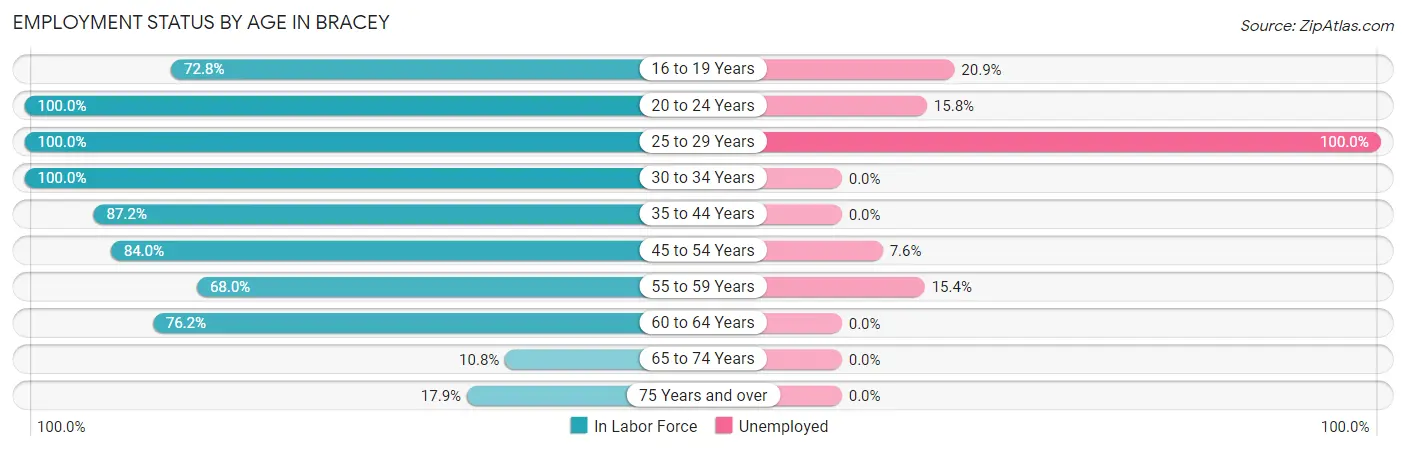
| Age Bracket | In Labor Force | Unemployed |
| 16 to 19 Years | 67 (72.8%) | 14 (20.9%) |
| 20 to 24 Years | 57 (100.0%) | 9 (15.8%) |
| 25 to 29 Years | 15 (100.0%) | 15 (100.0%) |
| 30 to 34 Years | 13 (100.0%) | 0 (0.0%) |
| 35 to 44 Years | 34 (87.2%) | 0 (0.0%) |
| 45 to 54 Years | 210 (84.0%) | 16 (7.6%) |
| 55 to 59 Years | 117 (68.0%) | 18 (15.4%) |
| 60 to 64 Years | 80 (76.2%) | 0 (0.0%) |
| 65 to 74 Years | 43 (10.8%) | 0 (0.0%) |
| 75 Years and over | 42 (17.9%) | 0 (0.0%) |
| Total | 677 (49.2%) | 72 (10.6%) |
Employment Status by Educational Attainment in Bracey
According to labor force statistics for Bracey, 79.0% of individuals (469) out of the total population between 25 and 64 years of age (594) are in the labor force, with 10.4% or 49 of them being unemployed. The group with the highest labor force participation rate are those with the educational attainment of high school diploma, with 100.0% or 73 individuals in the labor force. Within the labor force, individuals with bachelor's degree or higher education have the highest percentage of unemployment, with 17.9% or 49 of them being unemployed.
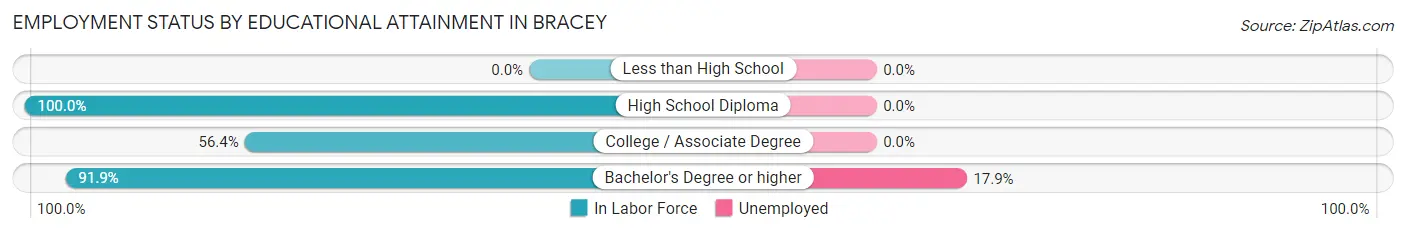
| Educational Attainment | In Labor Force | Unemployed |
| Less than High School | 0 (0.0%) | 0 (0.0%) |
| High School Diploma | 73 (100.0%) | 0 (0.0%) |
| College / Associate Degree | 123 (56.4%) | 0 (0.0%) |
| Bachelor's Degree or higher | 273 (91.9%) | 53 (17.9%) |
| Total | 469 (79.0%) | 62 (10.4%) |
Employment Occupations by Sex in Bracey
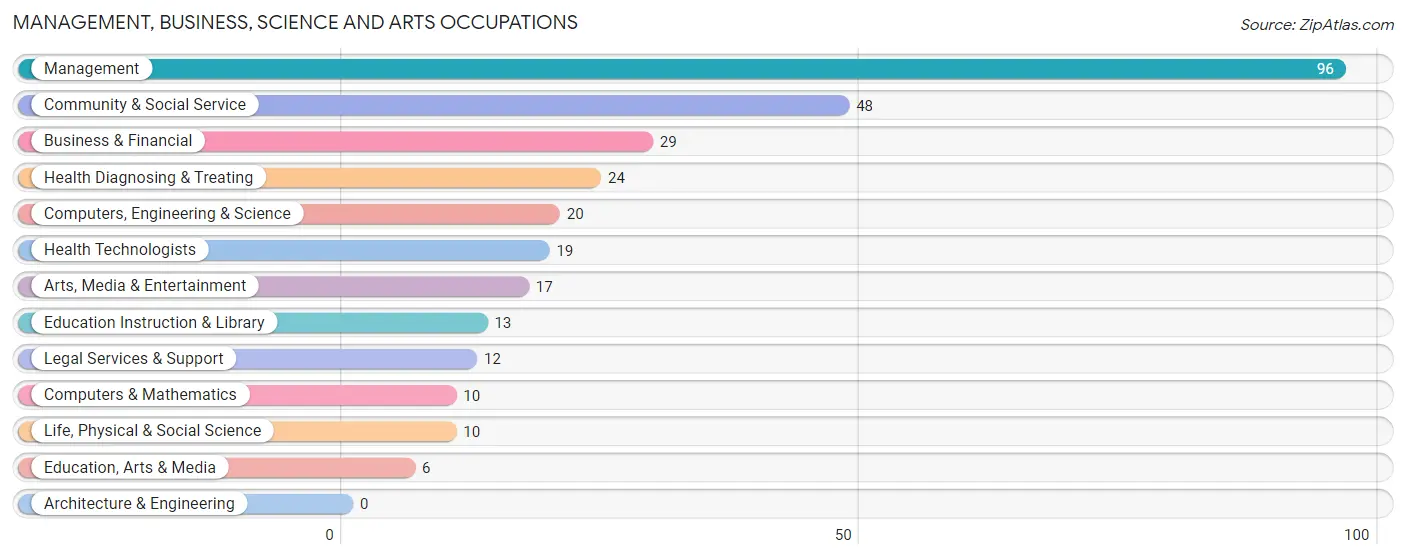
Management, Business, Science and Arts Occupations
The most common Management, Business, Science and Arts occupations in Bracey are Management (96 | 15.8%), Community & Social Service (48 | 7.9%), Business & Financial (29 | 4.8%), Health Diagnosing & Treating (24 | 4.0%), and Computers, Engineering & Science (20 | 3.3%).
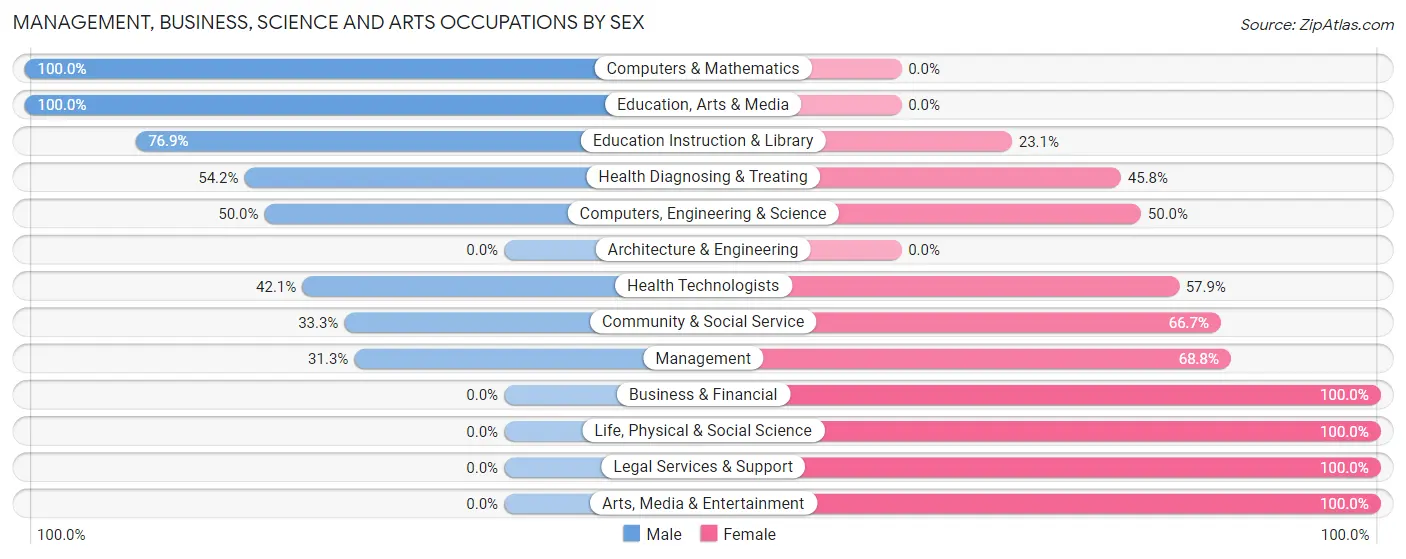
Management, Business, Science and Arts Occupations by Sex
Within the Management, Business, Science and Arts occupations in Bracey, the most male-oriented occupations are Computers & Mathematics (100.0%), Education, Arts & Media (100.0%), and Education Instruction & Library (76.9%), while the most female-oriented occupations are Business & Financial (100.0%), Life, Physical & Social Science (100.0%), and Legal Services & Support (100.0%).
| Occupation | Male | Female |
| Management | 30 (31.2%) | 66 (68.8%) |
| Business & Financial | 0 (0.0%) | 29 (100.0%) |
| Computers, Engineering & Science | 10 (50.0%) | 10 (50.0%) |
| Computers & Mathematics | 10 (100.0%) | 0 (0.0%) |
| Architecture & Engineering | 0 (0.0%) | 0 (0.0%) |
| Life, Physical & Social Science | 0 (0.0%) | 10 (100.0%) |
| Community & Social Service | 16 (33.3%) | 32 (66.7%) |
| Education, Arts & Media | 6 (100.0%) | 0 (0.0%) |
| Legal Services & Support | 0 (0.0%) | 12 (100.0%) |
| Education Instruction & Library | 10 (76.9%) | 3 (23.1%) |
| Arts, Media & Entertainment | 0 (0.0%) | 17 (100.0%) |
| Health Diagnosing & Treating | 13 (54.2%) | 11 (45.8%) |
| Health Technologists | 8 (42.1%) | 11 (57.9%) |
| Total (Category) | 69 (31.8%) | 148 (68.2%) |
| Total (Overall) | 323 (53.3%) | 283 (46.7%) |
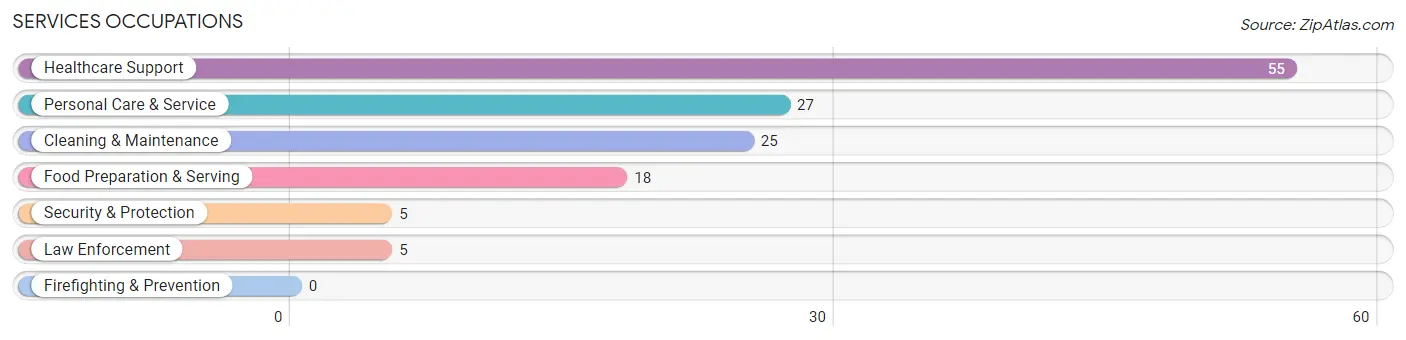
Services Occupations
The most common Services occupations in Bracey are Healthcare Support (55 | 9.1%), Personal Care & Service (27 | 4.5%), Cleaning & Maintenance (25 | 4.1%), Food Preparation & Serving (18 | 3.0%), and Security & Protection (5 | 0.8%).
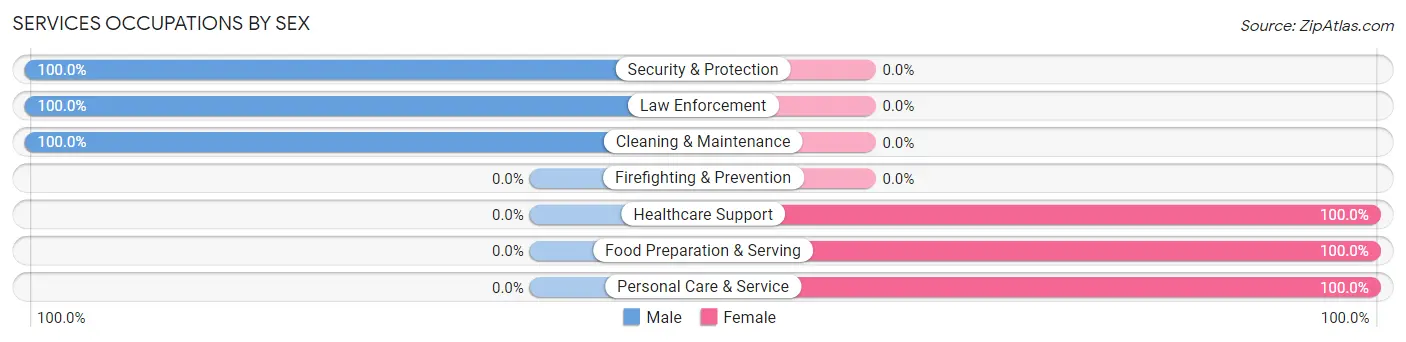
Services Occupations by Sex
Within the Services occupations in Bracey, the most male-oriented occupations are Security & Protection (100.0%), Law Enforcement (100.0%), and Cleaning & Maintenance (100.0%), while the most female-oriented occupations are Healthcare Support (100.0%), Food Preparation & Serving (100.0%), and Personal Care & Service (100.0%).
| Occupation | Male | Female |
| Healthcare Support | 0 (0.0%) | 55 (100.0%) |
| Security & Protection | 5 (100.0%) | 0 (0.0%) |
| Firefighting & Prevention | 0 (0.0%) | 0 (0.0%) |
| Law Enforcement | 5 (100.0%) | 0 (0.0%) |
| Food Preparation & Serving | 0 (0.0%) | 18 (100.0%) |
| Cleaning & Maintenance | 25 (100.0%) | 0 (0.0%) |
| Personal Care & Service | 0 (0.0%) | 27 (100.0%) |
| Total (Category) | 30 (23.1%) | 100 (76.9%) |
| Total (Overall) | 323 (53.3%) | 283 (46.7%) |
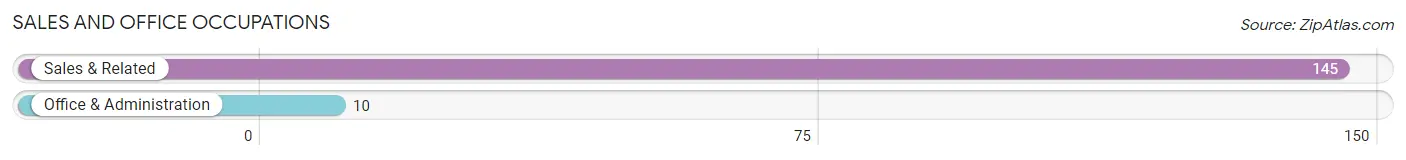
Sales and Office Occupations
The most common Sales and Office occupations in Bracey are Sales & Related (145 | 23.9%), and Office & Administration (10 | 1.7%).
Sales and Office Occupations by Sex
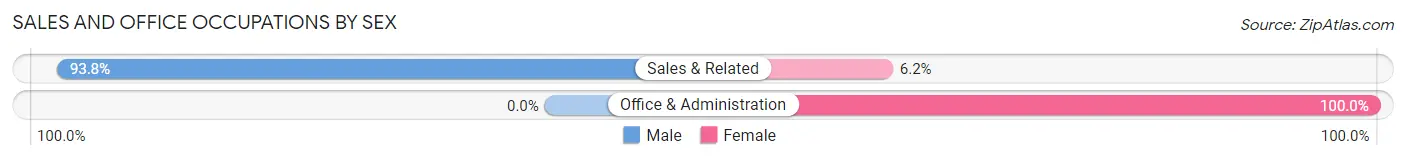
| Occupation | Male | Female |
| Sales & Related | 136 (93.8%) | 9 (6.2%) |
| Office & Administration | 0 (0.0%) | 10 (100.0%) |
| Total (Category) | 136 (87.7%) | 19 (12.3%) |
| Total (Overall) | 323 (53.3%) | 283 (46.7%) |
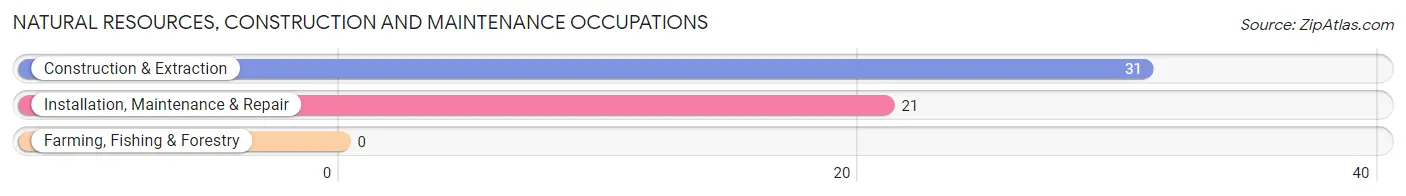
Natural Resources, Construction and Maintenance Occupations
The most common Natural Resources, Construction and Maintenance occupations in Bracey are Construction & Extraction (31 | 5.1%), and Installation, Maintenance & Repair (21 | 3.5%).
Natural Resources, Construction and Maintenance Occupations by Sex
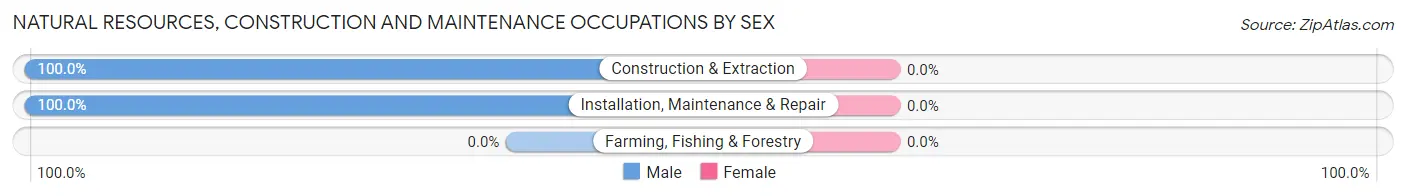
| Occupation | Male | Female |
| Farming, Fishing & Forestry | 0 (0.0%) | 0 (0.0%) |
| Construction & Extraction | 31 (100.0%) | 0 (0.0%) |
| Installation, Maintenance & Repair | 21 (100.0%) | 0 (0.0%) |
| Total (Category) | 52 (100.0%) | 0 (0.0%) |
| Total (Overall) | 323 (53.3%) | 283 (46.7%) |
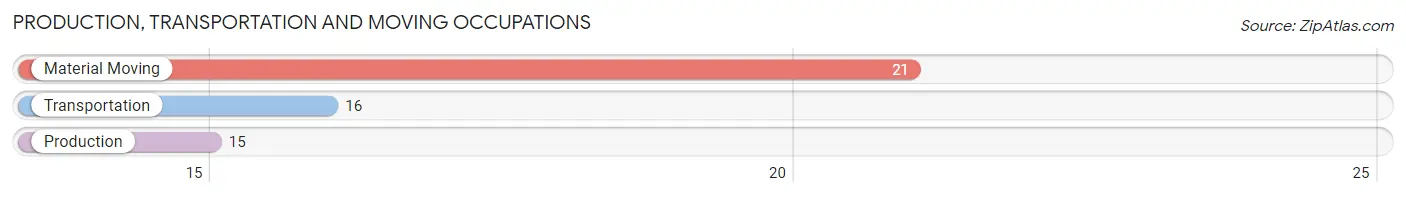
Production, Transportation and Moving Occupations
The most common Production, Transportation and Moving occupations in Bracey are Material Moving (21 | 3.5%), Transportation (16 | 2.6%), and Production (15 | 2.5%).
Production, Transportation and Moving Occupations by Sex
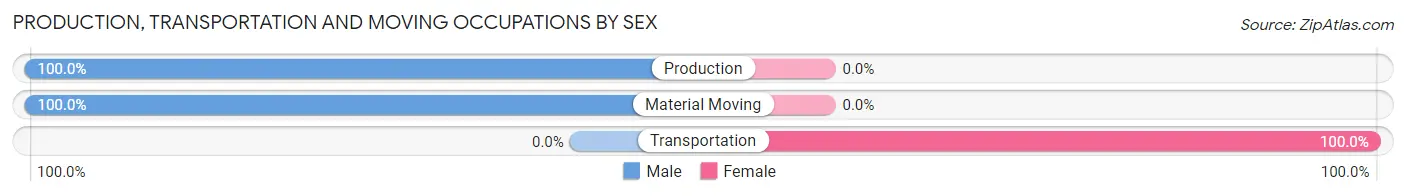
| Occupation | Male | Female |
| Production | 15 (100.0%) | 0 (0.0%) |
| Transportation | 0 (0.0%) | 16 (100.0%) |
| Material Moving | 21 (100.0%) | 0 (0.0%) |
| Total (Category) | 36 (69.2%) | 16 (30.8%) |
| Total (Overall) | 323 (53.3%) | 283 (46.7%) |
Employment Industries by Sex in Bracey
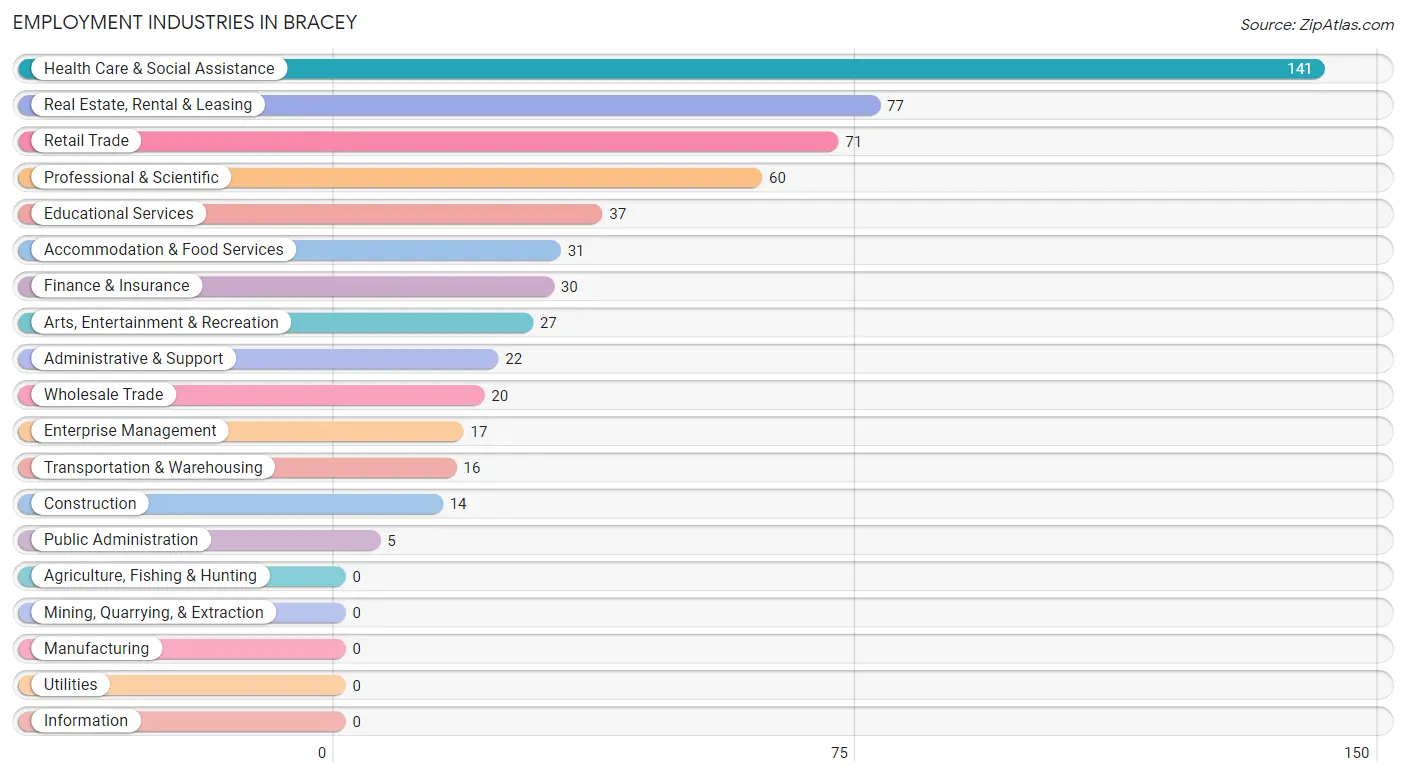
Employment Industries in Bracey
The major employment industries in Bracey include Health Care & Social Assistance (141 | 23.3%), Real Estate, Rental & Leasing (77 | 12.7%), Retail Trade (71 | 11.7%), Professional & Scientific (60 | 9.9%), and Educational Services (37 | 6.1%).
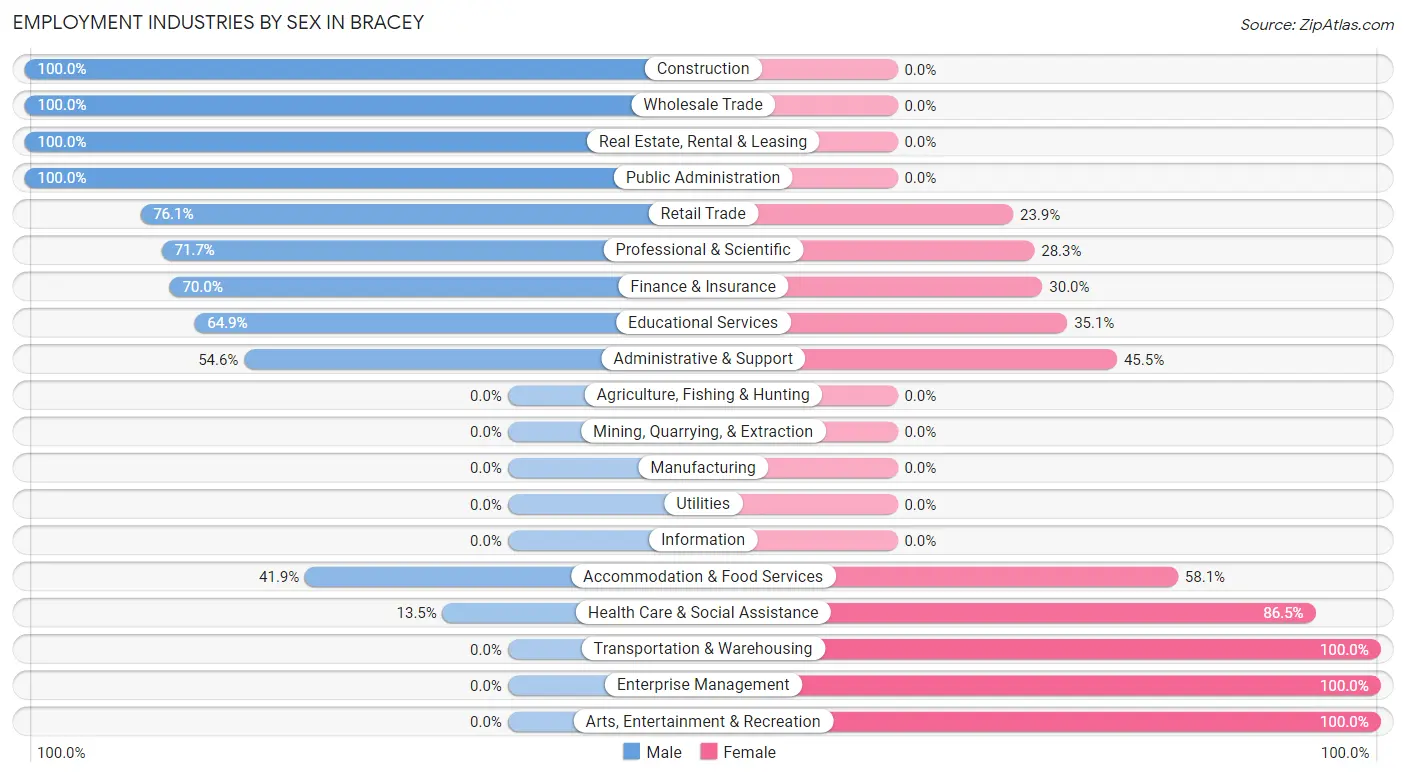
Employment Industries by Sex in Bracey
The Bracey industries that see more men than women are Construction (100.0%), Wholesale Trade (100.0%), and Real Estate, Rental & Leasing (100.0%), whereas the industries that tend to have a higher number of women are Transportation & Warehousing (100.0%), Enterprise Management (100.0%), and Arts, Entertainment & Recreation (100.0%).
| Industry | Male | Female |
| Agriculture, Fishing & Hunting | 0 (0.0%) | 0 (0.0%) |
| Mining, Quarrying, & Extraction | 0 (0.0%) | 0 (0.0%) |
| Construction | 14 (100.0%) | 0 (0.0%) |
| Manufacturing | 0 (0.0%) | 0 (0.0%) |
| Wholesale Trade | 20 (100.0%) | 0 (0.0%) |
| Retail Trade | 54 (76.1%) | 17 (23.9%) |
| Transportation & Warehousing | 0 (0.0%) | 16 (100.0%) |
| Utilities | 0 (0.0%) | 0 (0.0%) |
| Information | 0 (0.0%) | 0 (0.0%) |
| Finance & Insurance | 21 (70.0%) | 9 (30.0%) |
| Real Estate, Rental & Leasing | 77 (100.0%) | 0 (0.0%) |
| Professional & Scientific | 43 (71.7%) | 17 (28.3%) |
| Enterprise Management | 0 (0.0%) | 17 (100.0%) |
| Administrative & Support | 12 (54.5%) | 10 (45.5%) |
| Educational Services | 24 (64.9%) | 13 (35.1%) |
| Health Care & Social Assistance | 19 (13.5%) | 122 (86.5%) |
| Arts, Entertainment & Recreation | 0 (0.0%) | 27 (100.0%) |
| Accommodation & Food Services | 13 (41.9%) | 18 (58.1%) |
| Public Administration | 5 (100.0%) | 0 (0.0%) |
| Total | 323 (53.3%) | 283 (46.7%) |
Education in Bracey
School Enrollment in Bracey
The most common levels of schooling among the 85 students in Bracey are high school (61 | 71.8%), elementary school (17 | 20.0%), and nursery / preschool (5 | 5.9%).
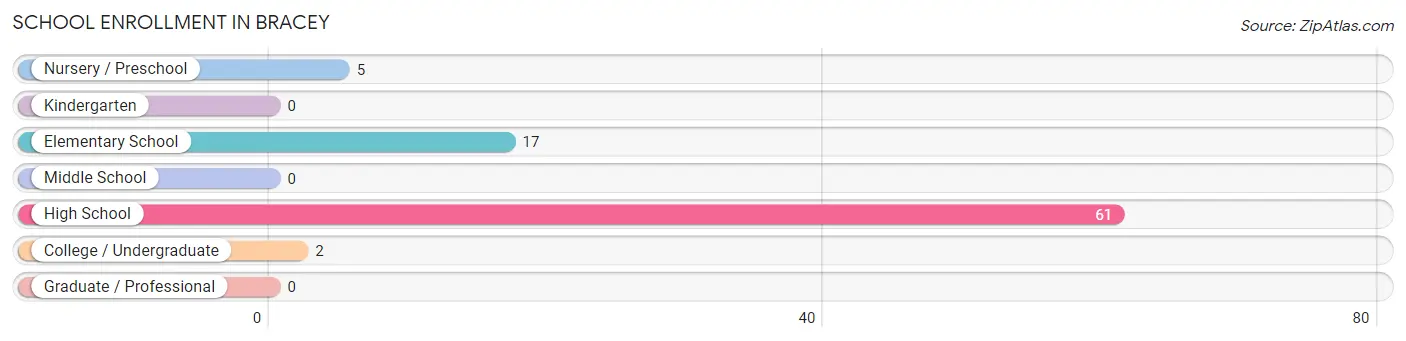
| School Level | # Students | % Students |
| Nursery / Preschool | 5 | 5.9% |
| Kindergarten | 0 | 0.0% |
| Elementary School | 17 | 20.0% |
| Middle School | 0 | 0.0% |
| High School | 61 | 71.8% |
| College / Undergraduate | 2 | 2.4% |
| Graduate / Professional | 0 | 0.0% |
| Total | 85 | 100.0% |
School Enrollment by Age by Funding Source in Bracey
Out of a total of 85 students who are enrolled in schools in Bracey, 24 (28.2%) attend a private institution, while the remaining 61 (71.8%) are enrolled in public schools. The age group of 10 to 14 year olds has the highest likelihood of being enrolled in private schools, with 18 (100.0% in the age bracket) enrolled. Conversely, the age group of 5 to 9 year old has the lowest likelihood of being enrolled in a private school, with 22 (100.0% in the age bracket) attending a public institution.
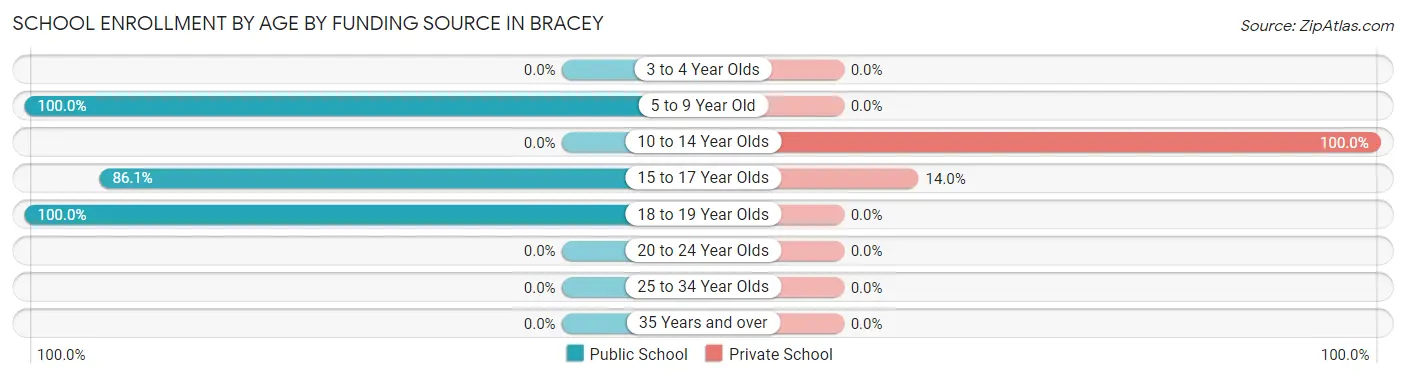
| Age Bracket | Public School | Private School |
| 3 to 4 Year Olds | 0 (0.0%) | 0 (0.0%) |
| 5 to 9 Year Old | 22 (100.0%) | 0 (0.0%) |
| 10 to 14 Year Olds | 0 (0.0%) | 18 (100.0%) |
| 15 to 17 Year Olds | 37 (86.1%) | 6 (14.0%) |
| 18 to 19 Year Olds | 2 (100.0%) | 0 (0.0%) |
| 20 to 24 Year Olds | 0 (0.0%) | 0 (0.0%) |
| 25 to 34 Year Olds | 0 (0.0%) | 0 (0.0%) |
| 35 Years and over | 0 (0.0%) | 0 (0.0%) |
| Total | 61 (71.8%) | 24 (28.2%) |
Educational Attainment by Field of Study in Bracey
Engineering (95 | 20.6%), business (70 | 15.2%), education (60 | 13.0%), computers & mathematics (58 | 12.6%), and science & technology (49 | 10.6%) are the most common fields of study among 460 individuals in Bracey who have obtained a bachelor's degree or higher.
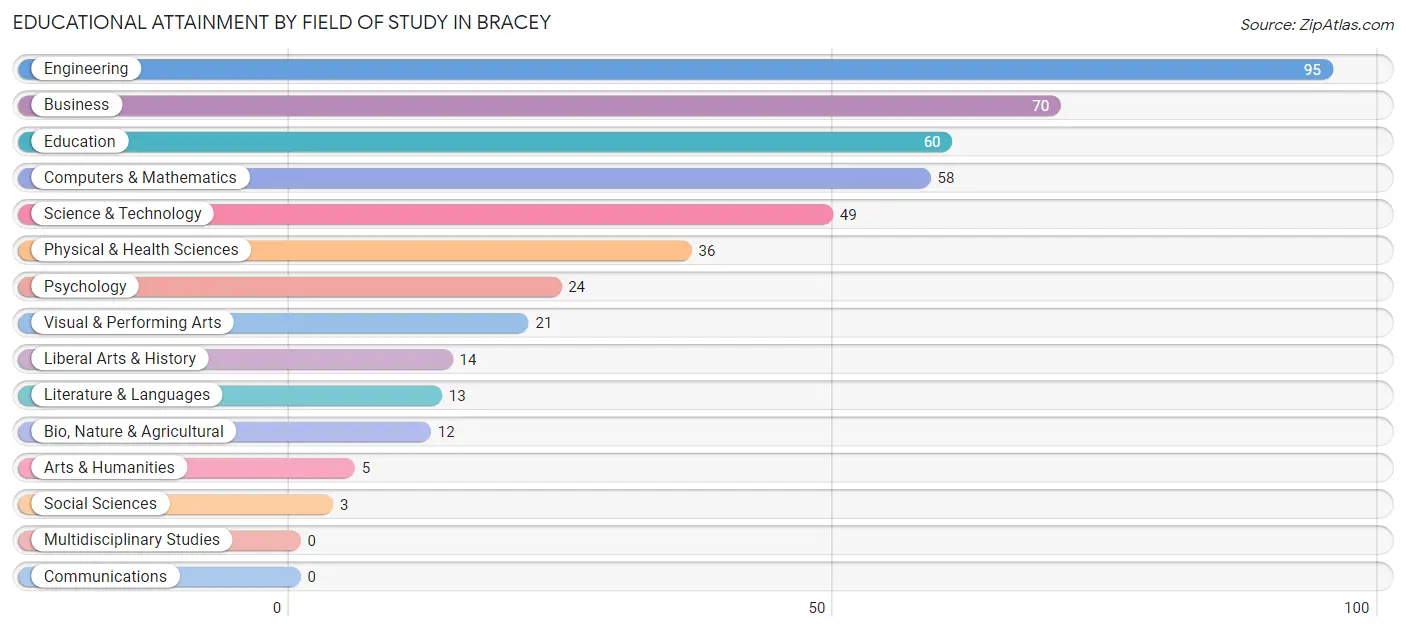
| Field of Study | # Graduates | % Graduates |
| Computers & Mathematics | 58 | 12.6% |
| Bio, Nature & Agricultural | 12 | 2.6% |
| Physical & Health Sciences | 36 | 7.8% |
| Psychology | 24 | 5.2% |
| Social Sciences | 3 | 0.6% |
| Engineering | 95 | 20.6% |
| Multidisciplinary Studies | 0 | 0.0% |
| Science & Technology | 49 | 10.6% |
| Business | 70 | 15.2% |
| Education | 60 | 13.0% |
| Literature & Languages | 13 | 2.8% |
| Liberal Arts & History | 14 | 3.0% |
| Visual & Performing Arts | 21 | 4.6% |
| Communications | 0 | 0.0% |
| Arts & Humanities | 5 | 1.1% |
| Total | 460 | 100.0% |
Transportation & Commute in Bracey
Vehicle Availability by Sex in Bracey
The most prevalent vehicle ownership categories in Bracey are males with 2 vehicles (154, accounting for 47.7%) and females with 2 vehicles (126, making up 54.4%).
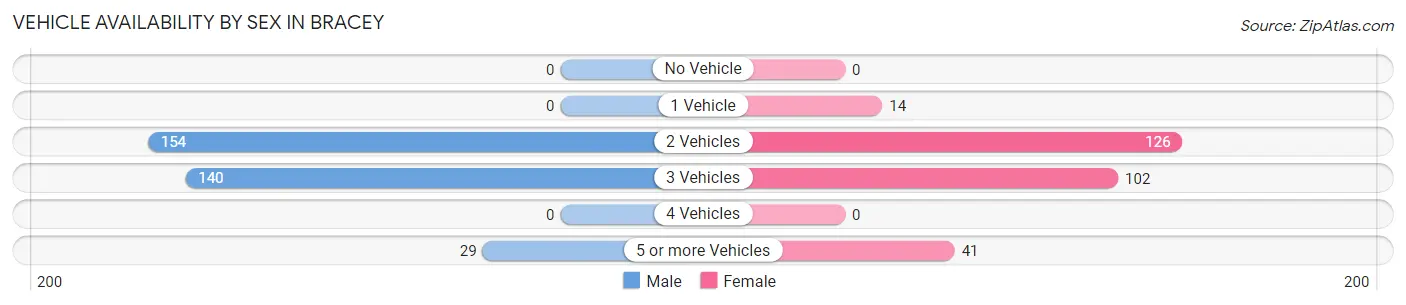
| Vehicles Available | Male | Female |
| No Vehicle | 0 (0.0%) | 0 (0.0%) |
| 1 Vehicle | 0 (0.0%) | 14 (5.0%) |
| 2 Vehicles | 154 (47.7%) | 126 (44.5%) |
| 3 Vehicles | 140 (43.3%) | 102 (36.0%) |
| 4 Vehicles | 0 (0.0%) | 0 (0.0%) |
| 5 or more Vehicles | 29 (9.0%) | 41 (14.5%) |
| Total | 323 (100.0%) | 283 (100.0%) |
Commute Time in Bracey
The most frequently occuring commute durations in Bracey are 15 to 19 minutes (118 commuters, 29.2%), 5 to 9 minutes (50 commuters, 12.4%), and 60 to 89 minutes (48 commuters, 11.9%).
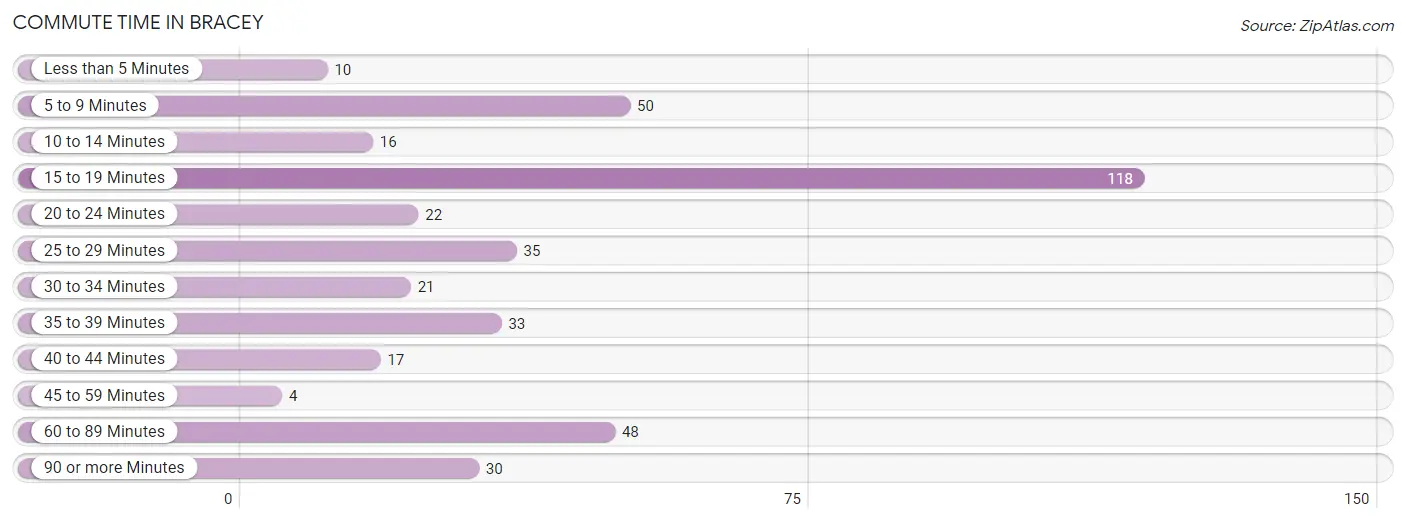
| Commute Time | # Commuters | % Commuters |
| Less than 5 Minutes | 10 | 2.5% |
| 5 to 9 Minutes | 50 | 12.4% |
| 10 to 14 Minutes | 16 | 4.0% |
| 15 to 19 Minutes | 118 | 29.2% |
| 20 to 24 Minutes | 22 | 5.4% |
| 25 to 29 Minutes | 35 | 8.7% |
| 30 to 34 Minutes | 21 | 5.2% |
| 35 to 39 Minutes | 33 | 8.2% |
| 40 to 44 Minutes | 17 | 4.2% |
| 45 to 59 Minutes | 4 | 1.0% |
| 60 to 89 Minutes | 48 | 11.9% |
| 90 or more Minutes | 30 | 7.4% |
Commute Time by Sex in Bracey
The most common commute times in Bracey are 5 to 9 minutes (50 commuters, 23.9%) for males and 15 to 19 minutes (93 commuters, 47.7%) for females.
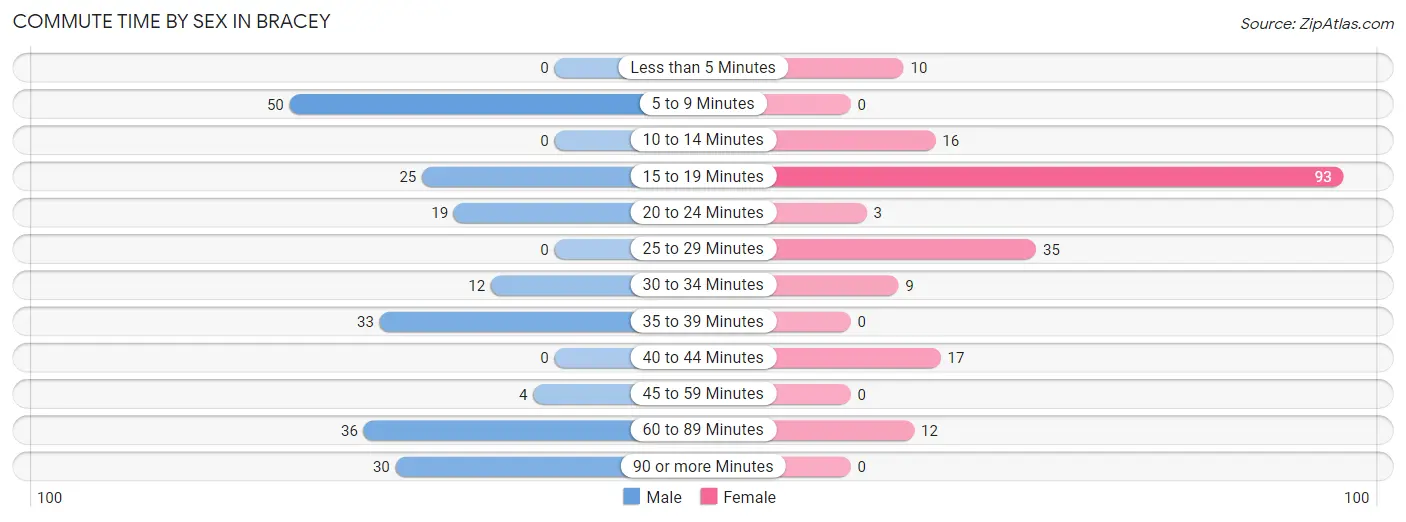
| Commute Time | Male | Female |
| Less than 5 Minutes | 0 (0.0%) | 10 (5.1%) |
| 5 to 9 Minutes | 50 (23.9%) | 0 (0.0%) |
| 10 to 14 Minutes | 0 (0.0%) | 16 (8.2%) |
| 15 to 19 Minutes | 25 (12.0%) | 93 (47.7%) |
| 20 to 24 Minutes | 19 (9.1%) | 3 (1.5%) |
| 25 to 29 Minutes | 0 (0.0%) | 35 (17.9%) |
| 30 to 34 Minutes | 12 (5.7%) | 9 (4.6%) |
| 35 to 39 Minutes | 33 (15.8%) | 0 (0.0%) |
| 40 to 44 Minutes | 0 (0.0%) | 17 (8.7%) |
| 45 to 59 Minutes | 4 (1.9%) | 0 (0.0%) |
| 60 to 89 Minutes | 36 (17.2%) | 12 (6.1%) |
| 90 or more Minutes | 30 (14.3%) | 0 (0.0%) |
Time of Departure to Work by Sex in Bracey
The most frequent times of departure to work in Bracey are 7:30 AM to 7:59 AM (54, 25.8%) for males and 8:00 AM to 8:29 AM (75, 38.5%) for females.
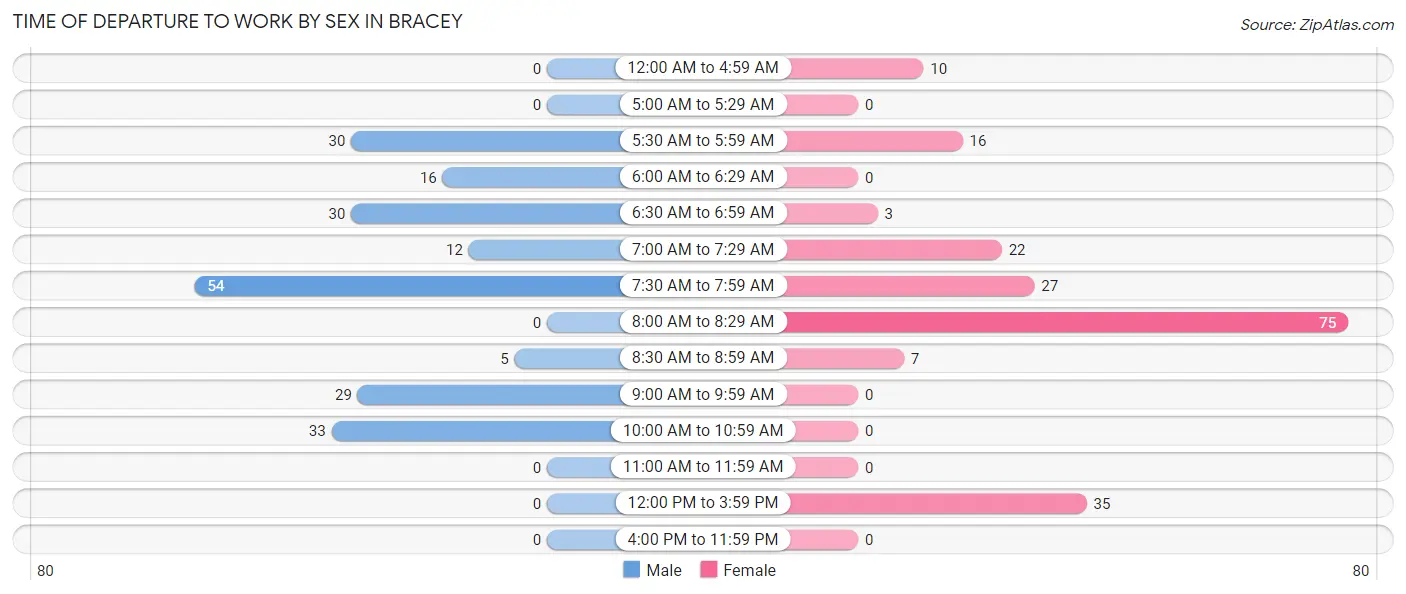
| Time of Departure | Male | Female |
| 12:00 AM to 4:59 AM | 0 (0.0%) | 10 (5.1%) |
| 5:00 AM to 5:29 AM | 0 (0.0%) | 0 (0.0%) |
| 5:30 AM to 5:59 AM | 30 (14.3%) | 16 (8.2%) |
| 6:00 AM to 6:29 AM | 16 (7.7%) | 0 (0.0%) |
| 6:30 AM to 6:59 AM | 30 (14.3%) | 3 (1.5%) |
| 7:00 AM to 7:29 AM | 12 (5.7%) | 22 (11.3%) |
| 7:30 AM to 7:59 AM | 54 (25.8%) | 27 (13.9%) |
| 8:00 AM to 8:29 AM | 0 (0.0%) | 75 (38.5%) |
| 8:30 AM to 8:59 AM | 5 (2.4%) | 7 (3.6%) |
| 9:00 AM to 9:59 AM | 29 (13.9%) | 0 (0.0%) |
| 10:00 AM to 10:59 AM | 33 (15.8%) | 0 (0.0%) |
| 11:00 AM to 11:59 AM | 0 (0.0%) | 0 (0.0%) |
| 12:00 PM to 3:59 PM | 0 (0.0%) | 35 (17.9%) |
| 4:00 PM to 11:59 PM | 0 (0.0%) | 0 (0.0%) |
| Total | 209 (100.0%) | 195 (100.0%) |
Housing Occupancy in Bracey
Occupancy by Ownership in Bracey
Of the total 694 dwellings in Bracey, owner-occupied units account for 601 (86.6%), while renter-occupied units make up 93 (13.4%).
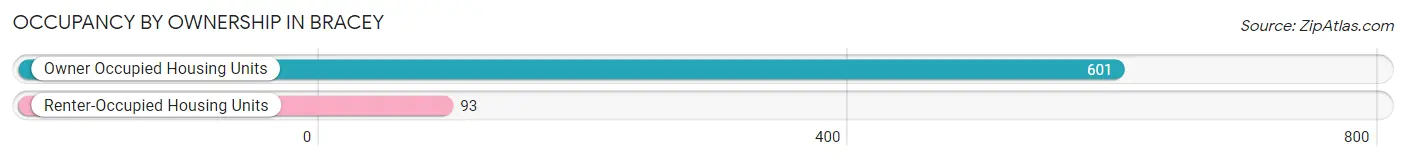
| Occupancy | # Housing Units | % Housing Units |
| Owner Occupied Housing Units | 601 | 86.6% |
| Renter-Occupied Housing Units | 93 | 13.4% |
| Total Occupied Housing Units | 694 | 100.0% |
Occupancy by Household Size in Bracey
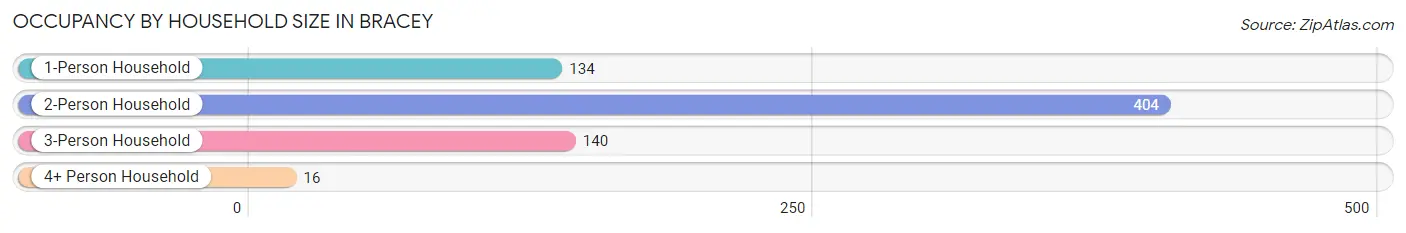
| Household Size | # Housing Units | % Housing Units |
| 1-Person Household | 134 | 19.3% |
| 2-Person Household | 404 | 58.2% |
| 3-Person Household | 140 | 20.2% |
| 4+ Person Household | 16 | 2.3% |
| Total Housing Units | 694 | 100.0% |
Occupancy by Ownership by Household Size in Bracey
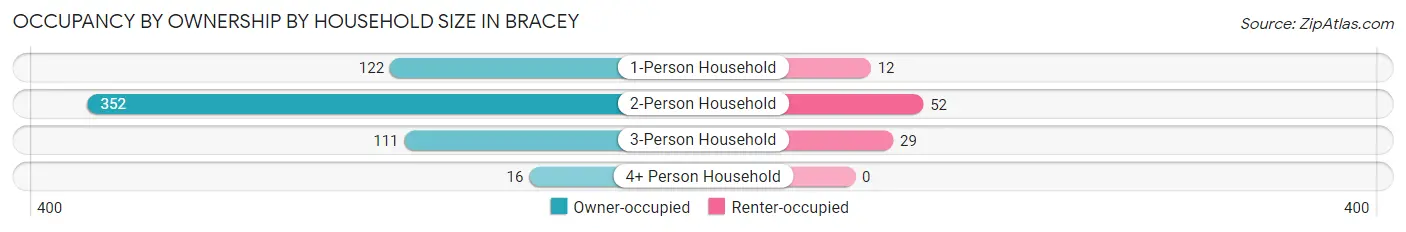
| Household Size | Owner-occupied | Renter-occupied |
| 1-Person Household | 122 (91.0%) | 12 (9.0%) |
| 2-Person Household | 352 (87.1%) | 52 (12.9%) |
| 3-Person Household | 111 (79.3%) | 29 (20.7%) |
| 4+ Person Household | 16 (100.0%) | 0 (0.0%) |
| Total Housing Units | 601 (86.6%) | 93 (13.4%) |
Occupancy by Educational Attainment in Bracey
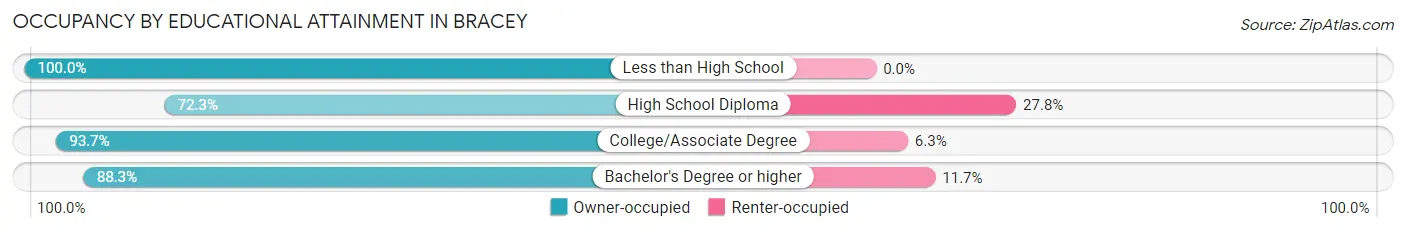
| Household Size | Owner-occupied | Renter-occupied |
| Less than High School | 64 (100.0%) | 0 (0.0%) |
| High School Diploma | 125 (72.3%) | 48 (27.8%) |
| College/Associate Degree | 149 (93.7%) | 10 (6.3%) |
| Bachelor's Degree or higher | 263 (88.3%) | 35 (11.7%) |
Occupancy by Age of Householder in Bracey
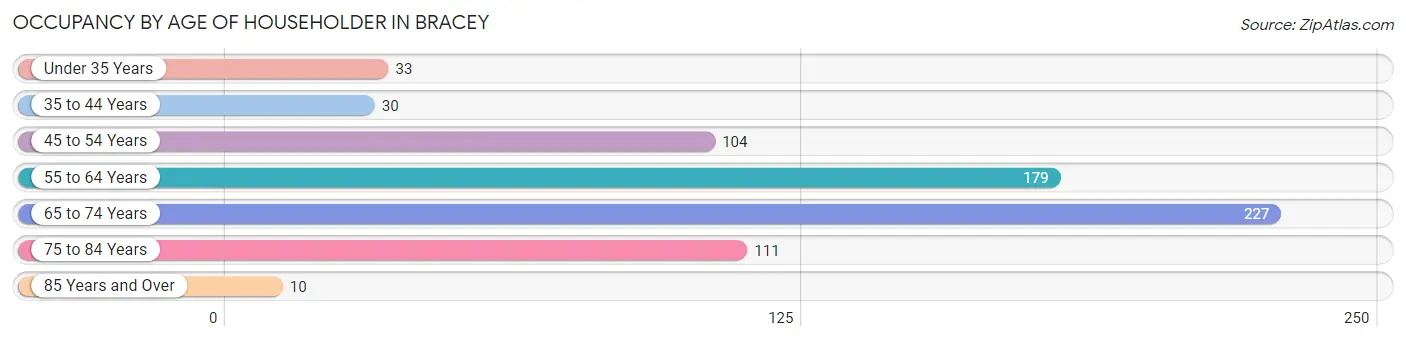
| Age Bracket | # Households | % Households |
| Under 35 Years | 33 | 4.8% |
| 35 to 44 Years | 30 | 4.3% |
| 45 to 54 Years | 104 | 15.0% |
| 55 to 64 Years | 179 | 25.8% |
| 65 to 74 Years | 227 | 32.7% |
| 75 to 84 Years | 111 | 16.0% |
| 85 Years and Over | 10 | 1.4% |
| Total | 694 | 100.0% |
Housing Finances in Bracey
Median Income by Occupancy in Bracey
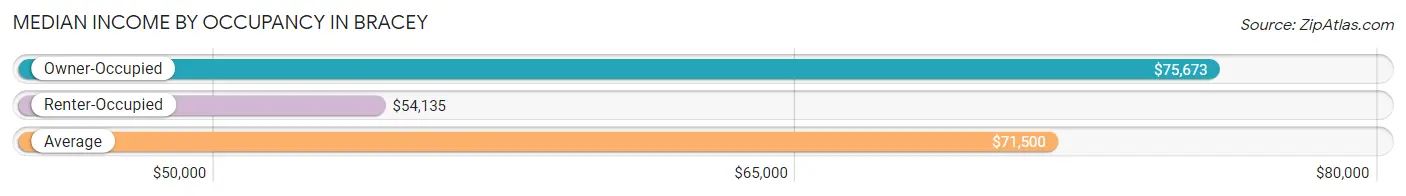
| Occupancy Type | # Households | Median Income |
| Owner-Occupied | 601 (86.6%) | $75,673 |
| Renter-Occupied | 93 (13.4%) | $54,135 |
| Average | 694 (100.0%) | $71,500 |
Occupancy by Householder Income Bracket in Bracey
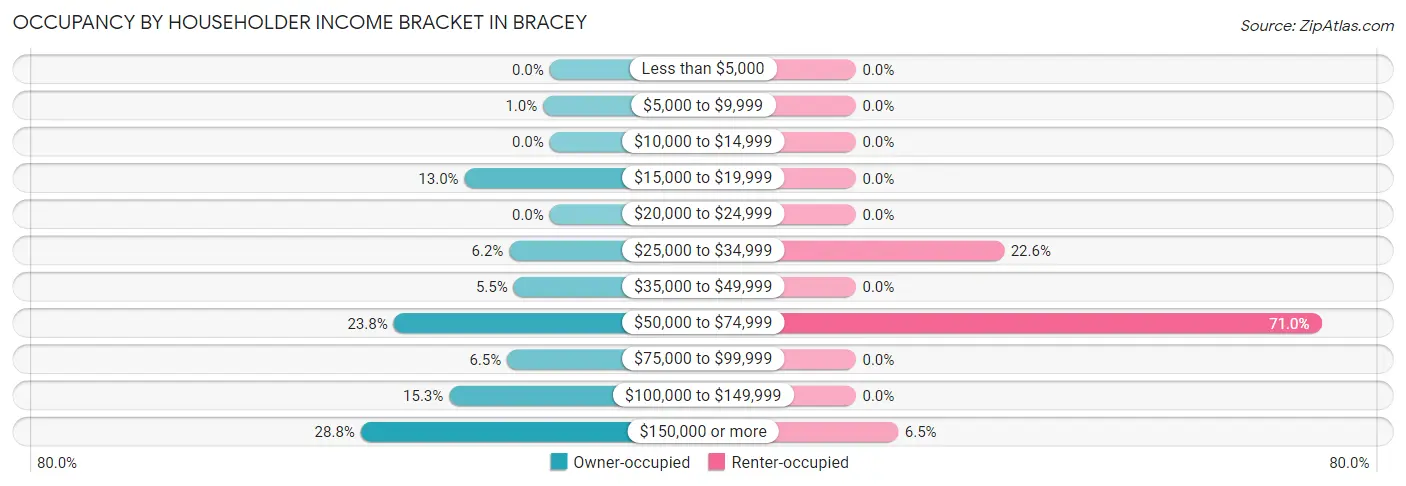
| Income Bracket | Owner-occupied | Renter-occupied |
| Less than $5,000 | 0 (0.0%) | 0 (0.0%) |
| $5,000 to $9,999 | 6 (1.0%) | 0 (0.0%) |
| $10,000 to $14,999 | 0 (0.0%) | 0 (0.0%) |
| $15,000 to $19,999 | 78 (13.0%) | 0 (0.0%) |
| $20,000 to $24,999 | 0 (0.0%) | 0 (0.0%) |
| $25,000 to $34,999 | 37 (6.2%) | 21 (22.6%) |
| $35,000 to $49,999 | 33 (5.5%) | 0 (0.0%) |
| $50,000 to $74,999 | 143 (23.8%) | 66 (71.0%) |
| $75,000 to $99,999 | 39 (6.5%) | 0 (0.0%) |
| $100,000 to $149,999 | 92 (15.3%) | 0 (0.0%) |
| $150,000 or more | 173 (28.8%) | 6 (6.5%) |
| Total | 601 (100.0%) | 93 (100.0%) |
Monthly Housing Cost Tiers in Bracey
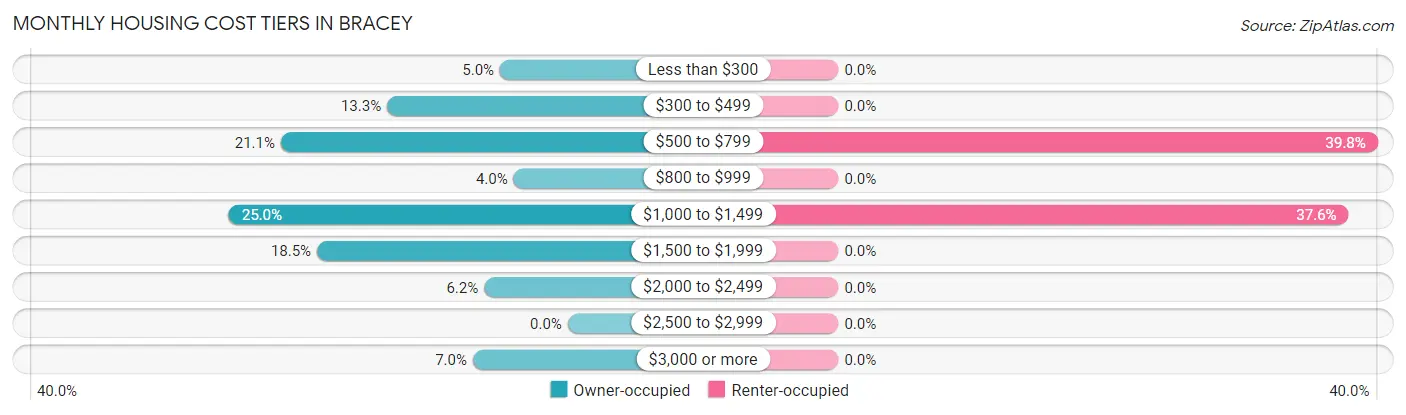
| Monthly Cost | Owner-occupied | Renter-occupied |
| Less than $300 | 30 (5.0%) | 0 (0.0%) |
| $300 to $499 | 80 (13.3%) | 0 (0.0%) |
| $500 to $799 | 127 (21.1%) | 37 (39.8%) |
| $800 to $999 | 24 (4.0%) | 0 (0.0%) |
| $1,000 to $1,499 | 150 (25.0%) | 35 (37.6%) |
| $1,500 to $1,999 | 111 (18.5%) | 0 (0.0%) |
| $2,000 to $2,499 | 37 (6.2%) | 0 (0.0%) |
| $2,500 to $2,999 | 0 (0.0%) | 0 (0.0%) |
| $3,000 or more | 42 (7.0%) | 0 (0.0%) |
| Total | 601 (100.0%) | 93 (100.0%) |
Physical Housing Characteristics in Bracey
Housing Structures in Bracey
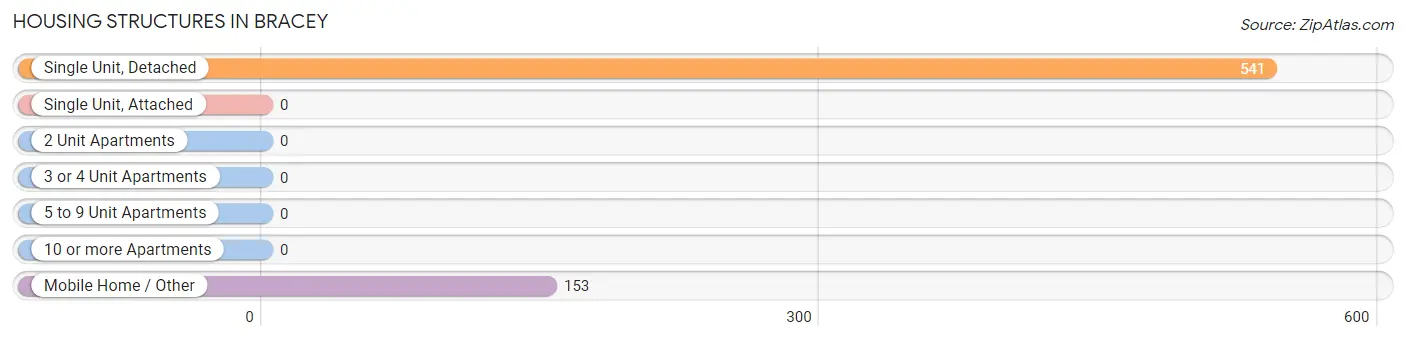
| Structure Type | # Housing Units | % Housing Units |
| Single Unit, Detached | 541 | 77.9% |
| Single Unit, Attached | 0 | 0.0% |
| 2 Unit Apartments | 0 | 0.0% |
| 3 or 4 Unit Apartments | 0 | 0.0% |
| 5 to 9 Unit Apartments | 0 | 0.0% |
| 10 or more Apartments | 0 | 0.0% |
| Mobile Home / Other | 153 | 22.1% |
| Total | 694 | 100.0% |
Housing Structures by Occupancy in Bracey
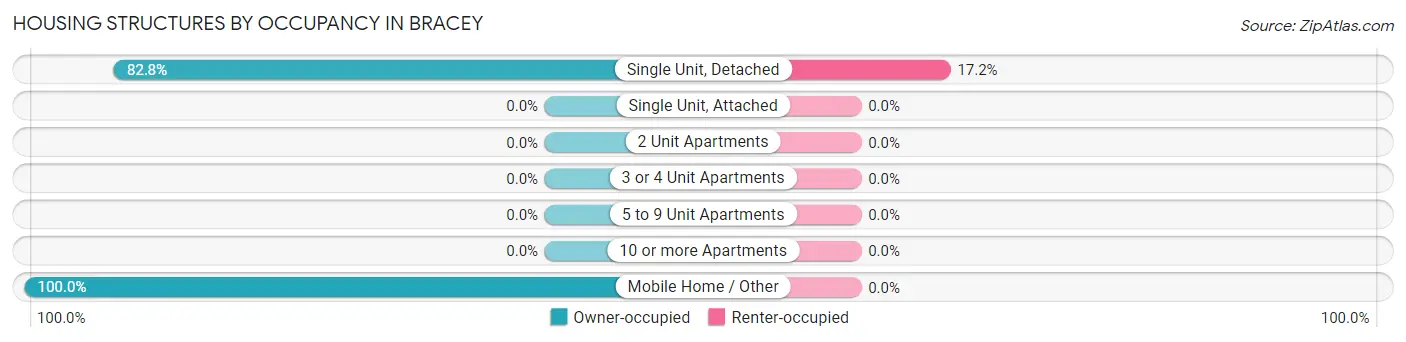
| Structure Type | Owner-occupied | Renter-occupied |
| Single Unit, Detached | 448 (82.8%) | 93 (17.2%) |
| Single Unit, Attached | 0 (0.0%) | 0 (0.0%) |
| 2 Unit Apartments | 0 (0.0%) | 0 (0.0%) |
| 3 or 4 Unit Apartments | 0 (0.0%) | 0 (0.0%) |
| 5 to 9 Unit Apartments | 0 (0.0%) | 0 (0.0%) |
| 10 or more Apartments | 0 (0.0%) | 0 (0.0%) |
| Mobile Home / Other | 153 (100.0%) | 0 (0.0%) |
| Total | 601 (86.6%) | 93 (13.4%) |
Housing Structures by Number of Rooms in Bracey
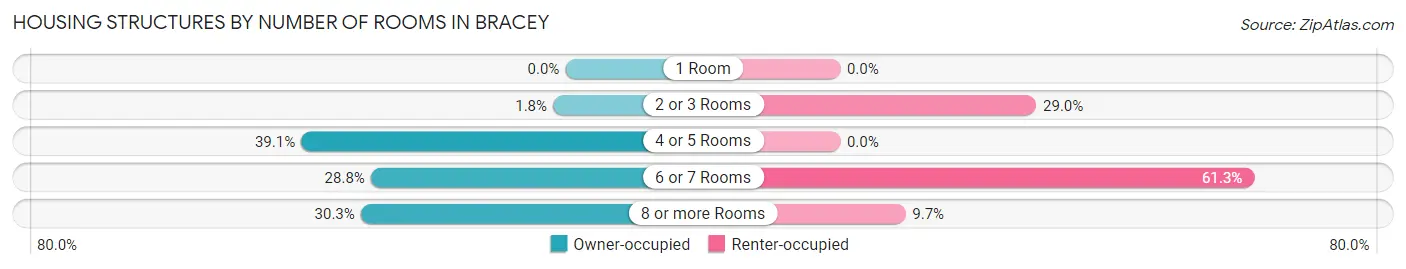
| Number of Rooms | Owner-occupied | Renter-occupied |
| 1 Room | 0 (0.0%) | 0 (0.0%) |
| 2 or 3 Rooms | 11 (1.8%) | 27 (29.0%) |
| 4 or 5 Rooms | 235 (39.1%) | 0 (0.0%) |
| 6 or 7 Rooms | 173 (28.8%) | 57 (61.3%) |
| 8 or more Rooms | 182 (30.3%) | 9 (9.7%) |
| Total | 601 (100.0%) | 93 (100.0%) |
Housing Structure by Heating Type in Bracey
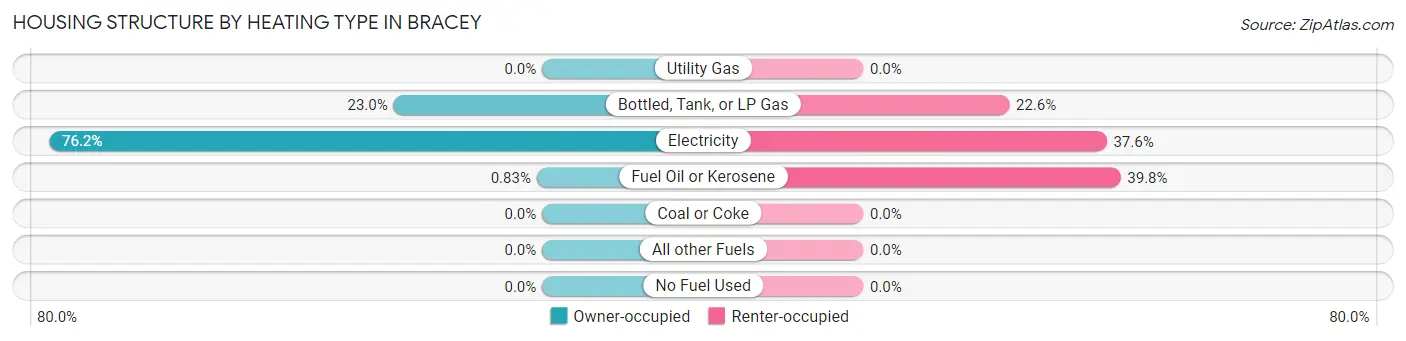
| Heating Type | Owner-occupied | Renter-occupied |
| Utility Gas | 0 (0.0%) | 0 (0.0%) |
| Bottled, Tank, or LP Gas | 138 (23.0%) | 21 (22.6%) |
| Electricity | 458 (76.2%) | 35 (37.6%) |
| Fuel Oil or Kerosene | 5 (0.8%) | 37 (39.8%) |
| Coal or Coke | 0 (0.0%) | 0 (0.0%) |
| All other Fuels | 0 (0.0%) | 0 (0.0%) |
| No Fuel Used | 0 (0.0%) | 0 (0.0%) |
| Total | 601 (100.0%) | 93 (100.0%) |
Household Vehicle Usage in Bracey
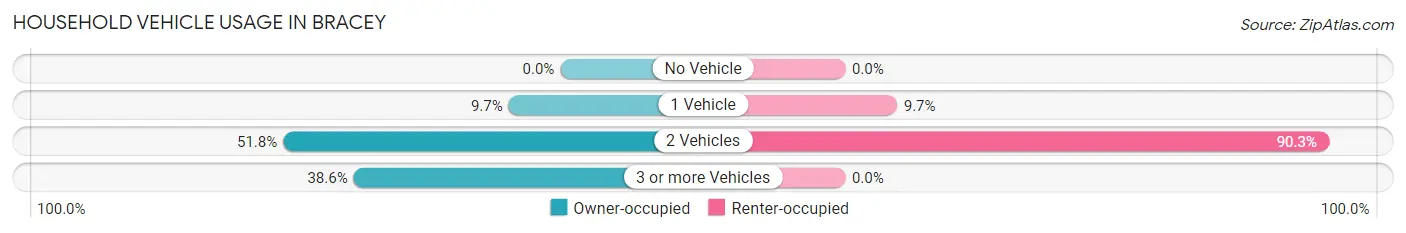
| Vehicles per Household | Owner-occupied | Renter-occupied |
| No Vehicle | 0 (0.0%) | 0 (0.0%) |
| 1 Vehicle | 58 (9.7%) | 9 (9.7%) |
| 2 Vehicles | 311 (51.7%) | 84 (90.3%) |
| 3 or more Vehicles | 232 (38.6%) | 0 (0.0%) |
| Total | 601 (100.0%) | 93 (100.0%) |
Real Estate & Mortgages in Bracey
Real Estate and Mortgage Overview in Bracey
| Characteristic | Without Mortgage | With Mortgage |
| Housing Units | 242 | 359 |
| Median Property Value | $185,500 | $261,400 |
| Median Household Income | $74,737 | $144 |
| Monthly Housing Costs | $529 | $42 |
| Real Estate Taxes | $960 | $0 |
Property Value by Mortgage Status in Bracey
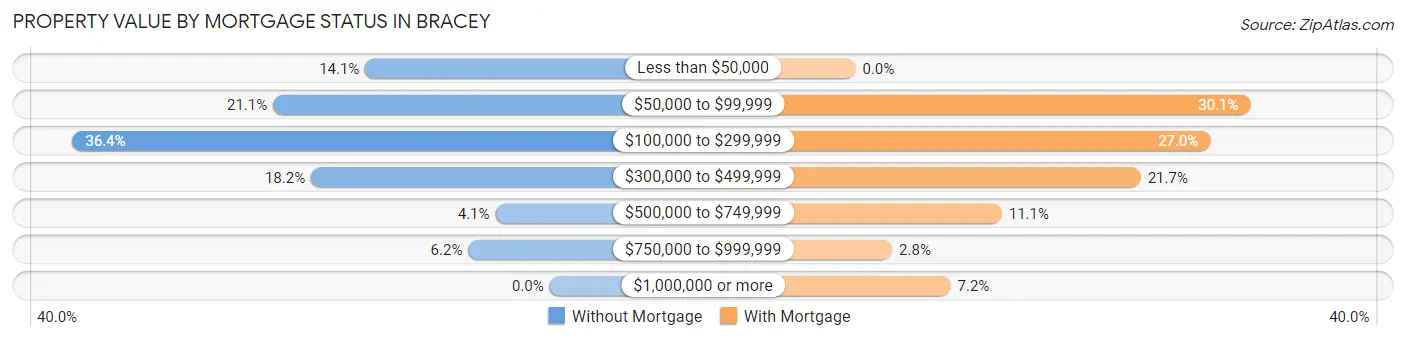
| Property Value | Without Mortgage | With Mortgage |
| Less than $50,000 | 34 (14.1%) | 0 (0.0%) |
| $50,000 to $99,999 | 51 (21.1%) | 108 (30.1%) |
| $100,000 to $299,999 | 88 (36.4%) | 97 (27.0%) |
| $300,000 to $499,999 | 44 (18.2%) | 78 (21.7%) |
| $500,000 to $749,999 | 10 (4.1%) | 40 (11.1%) |
| $750,000 to $999,999 | 15 (6.2%) | 10 (2.8%) |
| $1,000,000 or more | 0 (0.0%) | 26 (7.2%) |
| Total | 242 (100.0%) | 359 (100.0%) |
Household Income by Mortgage Status in Bracey
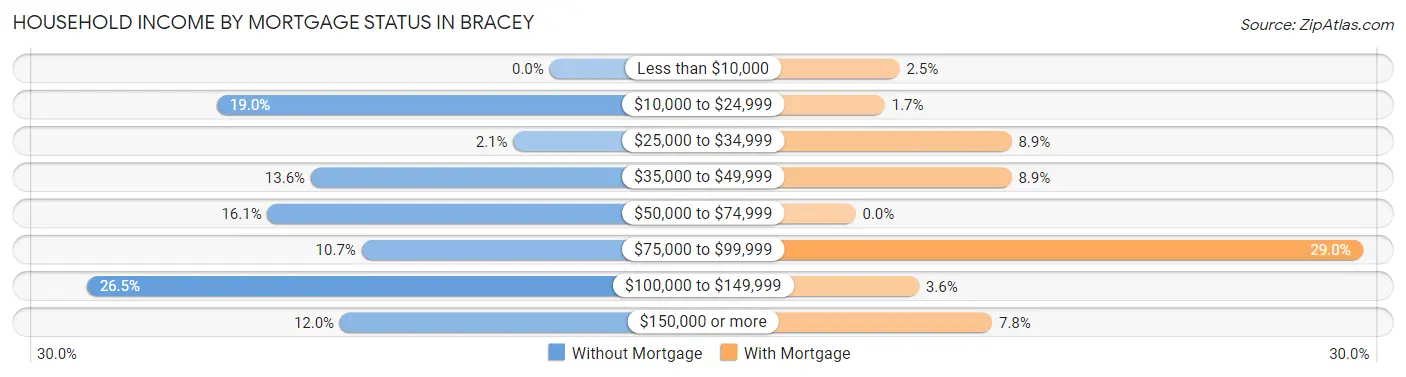
| Household Income | Without Mortgage | With Mortgage |
| Less than $10,000 | 0 (0.0%) | 9 (2.5%) |
| $10,000 to $24,999 | 46 (19.0%) | 6 (1.7%) |
| $25,000 to $34,999 | 5 (2.1%) | 32 (8.9%) |
| $35,000 to $49,999 | 33 (13.6%) | 32 (8.9%) |
| $50,000 to $74,999 | 39 (16.1%) | 0 (0.0%) |
| $75,000 to $99,999 | 26 (10.7%) | 104 (29.0%) |
| $100,000 to $149,999 | 64 (26.5%) | 13 (3.6%) |
| $150,000 or more | 29 (12.0%) | 28 (7.8%) |
| Total | 242 (100.0%) | 359 (100.0%) |
Property Value to Household Income Ratio in Bracey
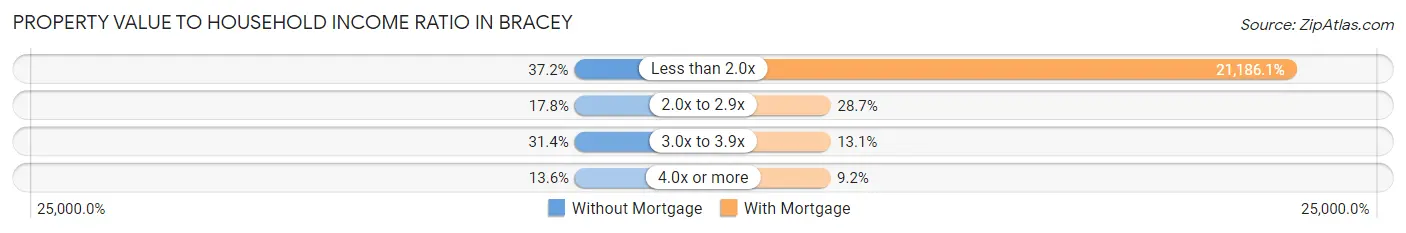
| Value-to-Income Ratio | Without Mortgage | With Mortgage |
| Less than 2.0x | 90 (37.2%) | 76,058 (21,186.1%) |
| 2.0x to 2.9x | 43 (17.8%) | 103 (28.7%) |
| 3.0x to 3.9x | 76 (31.4%) | 47 (13.1%) |
| 4.0x or more | 33 (13.6%) | 33 (9.2%) |
| Total | 242 (100.0%) | 359 (100.0%) |
Real Estate Taxes by Mortgage Status in Bracey
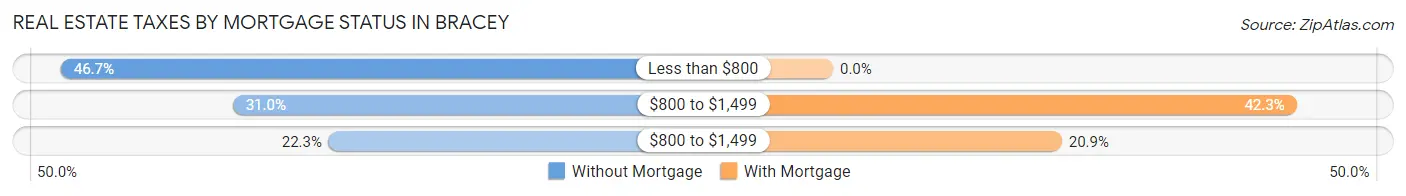
| Property Taxes | Without Mortgage | With Mortgage |
| Less than $800 | 113 (46.7%) | 0 (0.0%) |
| $800 to $1,499 | 75 (31.0%) | 152 (42.3%) |
| $800 to $1,499 | 54 (22.3%) | 75 (20.9%) |
| Total | 242 (100.0%) | 359 (100.0%) |
Health & Disability in Bracey
Health Insurance Coverage by Age in Bracey
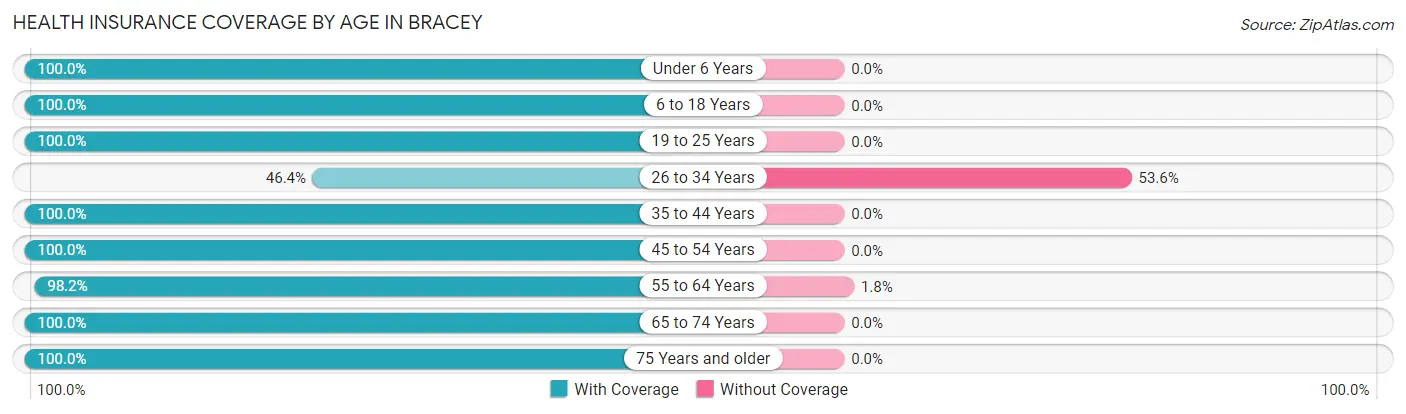
| Age Bracket | With Coverage | Without Coverage |
| Under 6 Years | 5 (100.0%) | 0 (0.0%) |
| 6 to 18 Years | 125 (100.0%) | 0 (0.0%) |
| 19 to 25 Years | 59 (100.0%) | 0 (0.0%) |
| 26 to 34 Years | 13 (46.4%) | 15 (53.6%) |
| 35 to 44 Years | 39 (100.0%) | 0 (0.0%) |
| 45 to 54 Years | 250 (100.0%) | 0 (0.0%) |
| 55 to 64 Years | 272 (98.2%) | 5 (1.8%) |
| 65 to 74 Years | 399 (100.0%) | 0 (0.0%) |
| 75 Years and older | 235 (100.0%) | 0 (0.0%) |
| Total | 1,397 (98.6%) | 20 (1.4%) |
Health Insurance Coverage by Citizenship Status in Bracey
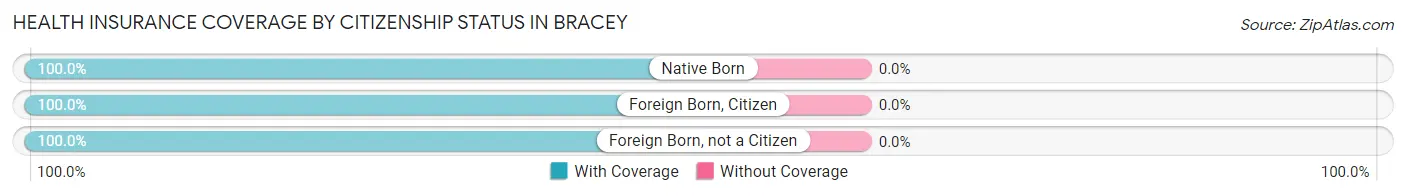
| Citizenship Status | With Coverage | Without Coverage |
| Native Born | 5 (100.0%) | 0 (0.0%) |
| Foreign Born, Citizen | 125 (100.0%) | 0 (0.0%) |
| Foreign Born, not a Citizen | 59 (100.0%) | 0 (0.0%) |
Health Insurance Coverage by Household Income in Bracey
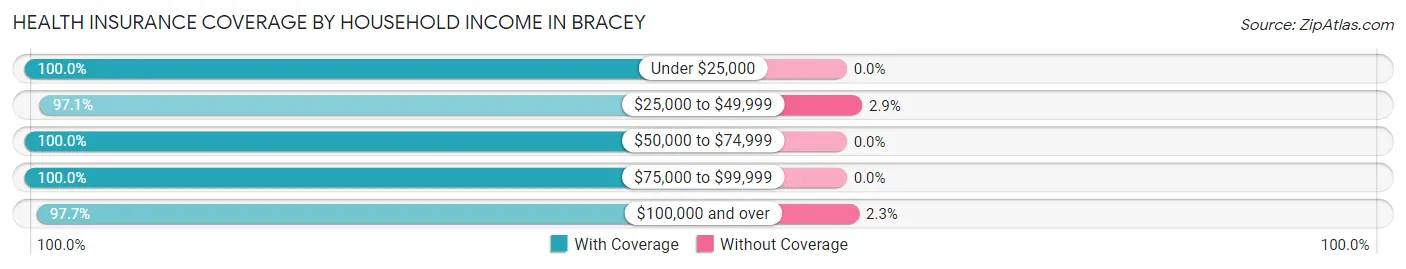
| Household Income | With Coverage | Without Coverage |
| Under $25,000 | 135 (100.0%) | 0 (0.0%) |
| $25,000 to $49,999 | 170 (97.1%) | 5 (2.9%) |
| $50,000 to $74,999 | 389 (100.0%) | 0 (0.0%) |
| $75,000 to $99,999 | 70 (100.0%) | 0 (0.0%) |
| $100,000 and over | 633 (97.7%) | 15 (2.3%) |
Public vs Private Health Insurance Coverage by Age in Bracey
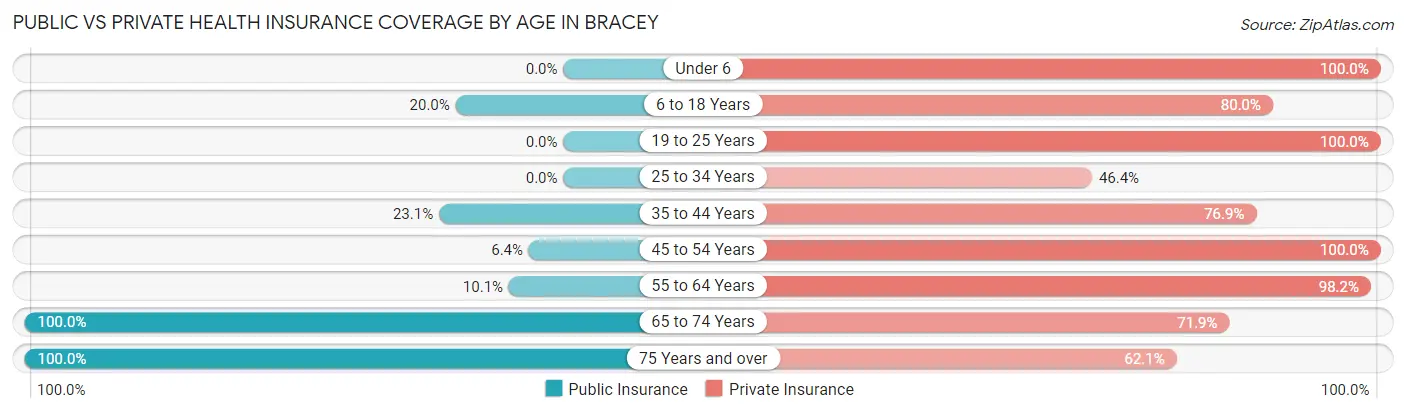
| Age Bracket | Public Insurance | Private Insurance |
| Under 6 | 0 (0.0%) | 5 (100.0%) |
| 6 to 18 Years | 25 (20.0%) | 100 (80.0%) |
| 19 to 25 Years | 0 (0.0%) | 59 (100.0%) |
| 25 to 34 Years | 0 (0.0%) | 13 (46.4%) |
| 35 to 44 Years | 9 (23.1%) | 30 (76.9%) |
| 45 to 54 Years | 16 (6.4%) | 250 (100.0%) |
| 55 to 64 Years | 28 (10.1%) | 272 (98.2%) |
| 65 to 74 Years | 399 (100.0%) | 287 (71.9%) |
| 75 Years and over | 235 (100.0%) | 146 (62.1%) |
| Total | 712 (50.2%) | 1,162 (82.0%) |
Disability Status by Sex by Age in Bracey
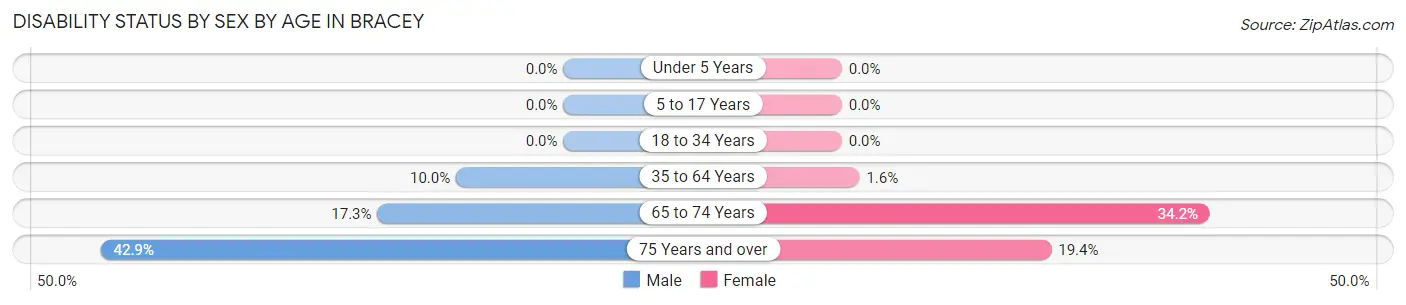
| Age Bracket | Male | Female |
| Under 5 Years | 0 (0.0%) | 0 (0.0%) |
| 5 to 17 Years | 0 (0.0%) | 0 (0.0%) |
| 18 to 34 Years | 0 (0.0%) | 0 (0.0%) |
| 35 to 64 Years | 26 (10.0%) | 5 (1.6%) |
| 65 to 74 Years | 34 (17.3%) | 69 (34.2%) |
| 75 Years and over | 70 (42.9%) | 14 (19.4%) |
Disability Class by Sex by Age in Bracey
Disability Class: Hearing Difficulty
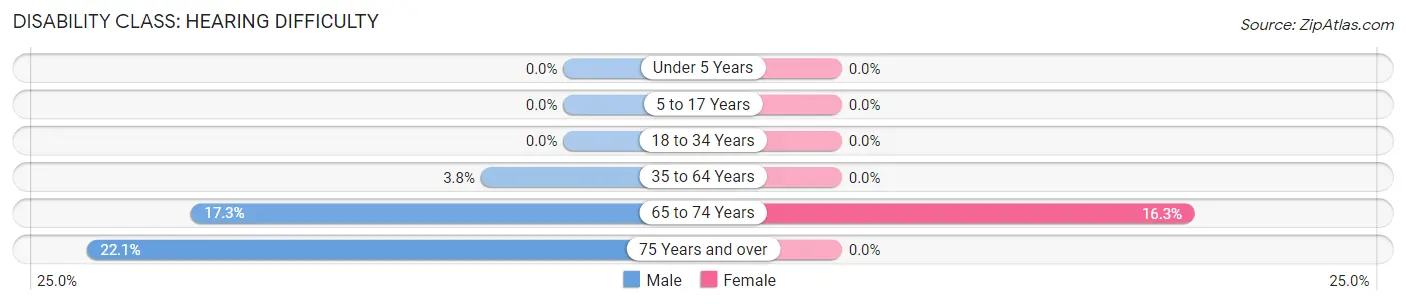
| Age Bracket | Male | Female |
| Under 5 Years | 0 (0.0%) | 0 (0.0%) |
| 5 to 17 Years | 0 (0.0%) | 0 (0.0%) |
| 18 to 34 Years | 0 (0.0%) | 0 (0.0%) |
| 35 to 64 Years | 10 (3.8%) | 0 (0.0%) |
| 65 to 74 Years | 34 (17.3%) | 33 (16.3%) |
| 75 Years and over | 36 (22.1%) | 0 (0.0%) |
Disability Class: Vision Difficulty
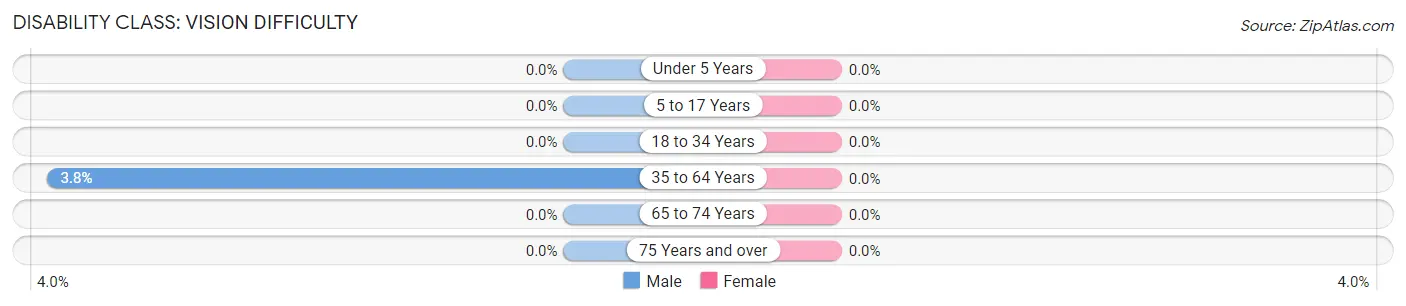
| Age Bracket | Male | Female |
| Under 5 Years | 0 (0.0%) | 0 (0.0%) |
| 5 to 17 Years | 0 (0.0%) | 0 (0.0%) |
| 18 to 34 Years | 0 (0.0%) | 0 (0.0%) |
| 35 to 64 Years | 10 (3.8%) | 0 (0.0%) |
| 65 to 74 Years | 0 (0.0%) | 0 (0.0%) |
| 75 Years and over | 0 (0.0%) | 0 (0.0%) |
Disability Class: Cognitive Difficulty
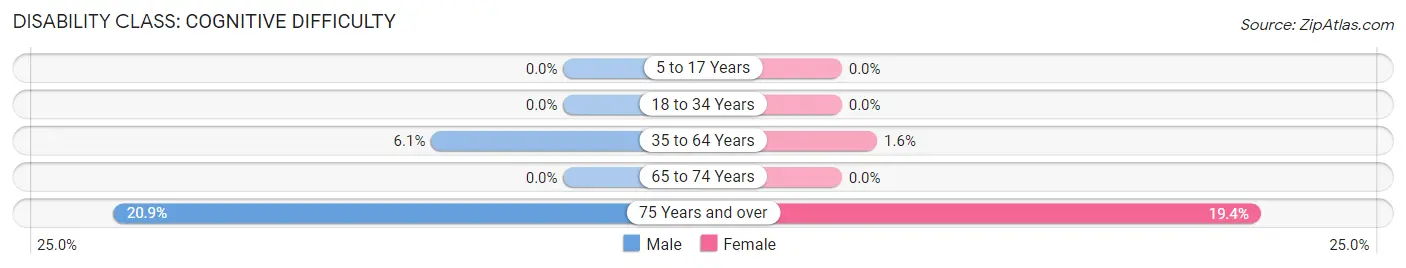
| Age Bracket | Male | Female |
| 5 to 17 Years | 0 (0.0%) | 0 (0.0%) |
| 18 to 34 Years | 0 (0.0%) | 0 (0.0%) |
| 35 to 64 Years | 16 (6.1%) | 5 (1.6%) |
| 65 to 74 Years | 0 (0.0%) | 0 (0.0%) |
| 75 Years and over | 34 (20.9%) | 14 (19.4%) |
Disability Class: Ambulatory Difficulty
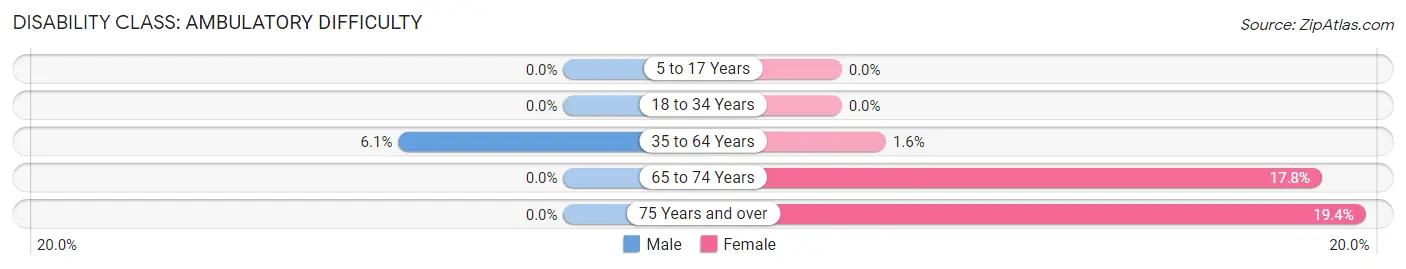
| Age Bracket | Male | Female |
| 5 to 17 Years | 0 (0.0%) | 0 (0.0%) |
| 18 to 34 Years | 0 (0.0%) | 0 (0.0%) |
| 35 to 64 Years | 16 (6.1%) | 5 (1.6%) |
| 65 to 74 Years | 0 (0.0%) | 36 (17.8%) |
| 75 Years and over | 0 (0.0%) | 14 (19.4%) |
Disability Class: Self-Care Difficulty
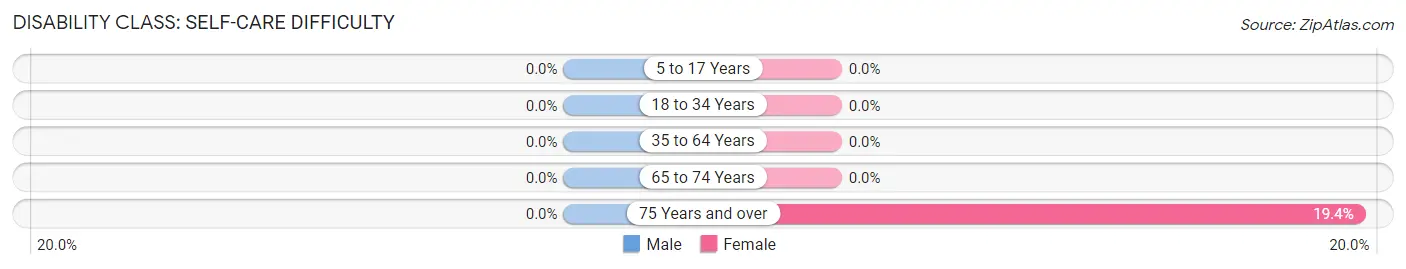
| Age Bracket | Male | Female |
| 5 to 17 Years | 0 (0.0%) | 0 (0.0%) |
| 18 to 34 Years | 0 (0.0%) | 0 (0.0%) |
| 35 to 64 Years | 0 (0.0%) | 0 (0.0%) |
| 65 to 74 Years | 0 (0.0%) | 0 (0.0%) |
| 75 Years and over | 0 (0.0%) | 14 (19.4%) |
Technology Access in Bracey
Computing Device Access in Bracey
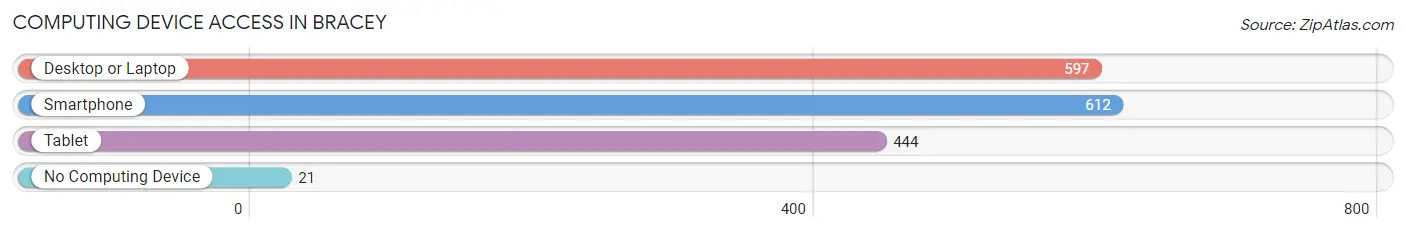
| Device Type | # Households | % Households |
| Desktop or Laptop | 597 | 86.0% |
| Smartphone | 612 | 88.2% |
| Tablet | 444 | 64.0% |
| No Computing Device | 21 | 3.0% |
| Total | 694 | 100.0% |
Internet Access in Bracey
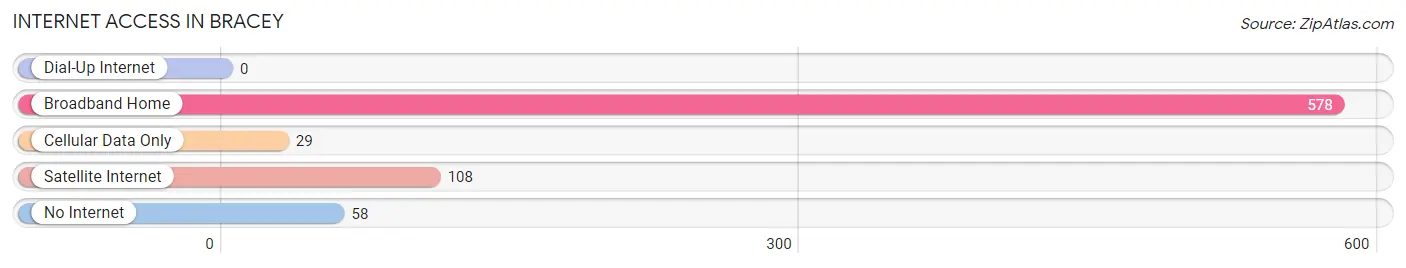
| Internet Type | # Households | % Households |
| Dial-Up Internet | 0 | 0.0% |
| Broadband Home | 578 | 83.3% |
| Cellular Data Only | 29 | 4.2% |
| Satellite Internet | 108 | 15.6% |
| No Internet | 58 | 8.4% |
| Total | 694 | 100.0% |
Bracey Summary
Bracey is a small town located in Mecklenburg County, Virginia. It is situated on the banks of the Roanoke River, approximately 30 miles south of the state capital, Richmond. The town has a population of approximately 1,000 people and is part of the Southside Virginia region.
History
The town of Bracey was founded in 1790 by William Bracey, a Revolutionary War veteran. He purchased the land from the local Native American tribes and established a trading post. The town was originally known as Bracey’s Landing, but was later changed to Bracey.
The town grew slowly over the years, but it was not until the late 19th century that it began to experience significant growth. This was due to the construction of the Norfolk and Western Railroad, which ran through the town. The railroad brought new businesses and industries to the area, and the population began to increase.
In the early 20th century, Bracey was a thriving agricultural community. The town was home to several large farms, and the surrounding area was known for its tobacco production. The town also had a thriving lumber industry, and the local sawmill was one of the largest in the state.
Geography
Bracey is located in the southeastern corner of Mecklenburg County, Virginia. It is situated on the banks of the Roanoke River, approximately 30 miles south of the state capital, Richmond. The town is surrounded by rolling hills and forests, and is located in the Piedmont region of the state.
The climate in Bracey is humid subtropical, with hot, humid summers and mild winters. The average annual temperature is around 60 degrees Fahrenheit, and the average annual precipitation is around 40 inches.
Economy
The economy of Bracey is largely based on agriculture and tourism. The town is home to several large farms, and the surrounding area is known for its tobacco production. The town also has a thriving lumber industry, and the local sawmill is one of the largest in the state.
In addition to agriculture and lumber, Bracey is also home to several small businesses. These include restaurants, retail stores, and other services. The town also has a small airport, which serves as a hub for private and commercial flights.
Demographics
As of the 2010 census, the population of Bracey was 1,000 people. The racial makeup of the town was 95.2% White, 2.2% African American, 0.2% Native American, 0.2% Asian, 0.2% from other races, and 1.9% from two or more races. Hispanic or Latino of any race were 1.2% of the population.
The median household income in Bracey was $37,500, and the median family income was $41,250. The per capita income was $17,500. About 11.2% of families and 13.2% of the population were below the poverty line, including 17.2% of those under age 18 and 8.2% of those age 65 or over.
Bracey is a small town with a rich history and a vibrant economy. It is home to several large farms and a thriving lumber industry, and the town is also a popular tourist destination. The town has a diverse population, and the people of Bracey are proud of their heritage and their community.
Common Questions
What is Per Capita Income in Bracey?
Per Capita income in Bracey is $46,905.
What is the Median Family Income in Bracey?
Median Family Income in Bracey is $77,115.
What is the Median Household income in Bracey?
Median Household Income in Bracey is $71,500.
What is Income or Wage Gap in Bracey?
Income or Wage Gap in Bracey is 31.0%.
Women in Bracey earn 69.0 cents for every dollar earned by a man.
What is Inequality or Gini Index in Bracey?
Inequality or Gini Index in Bracey is 0.39.
What is the Total Population of Bracey?
Total Population of Bracey is 1,417.
What is the Total Male Population of Bracey?
Total Male Population of Bracey is 746.
What is the Total Female Population of Bracey?
Total Female Population of Bracey is 671.
What is the Ratio of Males per 100 Females in Bracey?
There are 111.18 Males per 100 Females in Bracey.
What is the Ratio of Females per 100 Males in Bracey?
There are 89.95 Females per 100 Males in Bracey.
What is the Median Population Age in Bracey?
Median Population Age in Bracey is 62.3 Years.
What is the Average Family Size in Bracey
Average Family Size in Bracey is 2.3 People.
What is the Average Household Size in Bracey
Average Household Size in Bracey is 2.0 People.
How Large is the Labor Force in Bracey?
There are 677 People in the Labor Forcein in Bracey.
What is the Percentage of People in the Labor Force in Bracey?
49.2% of People are in the Labor Force in Bracey.
What is the Unemployment Rate in Bracey?
Unemployment Rate in Bracey is 10.6%.