Gloucester Point, VA Map & Demographics
Gloucester Point Map
Gloucester Point Overview
$34,391
PER CAPITA INCOME
$91,640
AVG FAMILY INCOME
$73,356
AVG HOUSEHOLD INCOME
34.8%
WAGE / INCOME GAP [ % ]
65.2¢/ $1
WAGE / INCOME GAP [ $ ]
0.40
INEQUALITY / GINI INDEX
11,016
TOTAL POPULATION
4,981
MALE POPULATION
6,035
FEMALE POPULATION
82.54
MALES / 100 FEMALES
121.16
FEMALES / 100 MALES
40.4
MEDIAN AGE
3.2
AVG FAMILY SIZE
2.6
AVG HOUSEHOLD SIZE
5,319
LABOR FORCE [ PEOPLE ]
60.4%
PERCENT IN LABOR FORCE
4.5%
UNEMPLOYMENT RATE
Gloucester Point Zip Codes
Gloucester Point Area Codes
Income in Gloucester Point
Income Overview in Gloucester Point
Per Capita Income in Gloucester Point is $34,391, while median incomes of families and households are $91,640 and $73,356 respectively.
| Characteristic | Number | Measure |
| Per Capita Income | 11,016 | $34,391 |
| Median Family Income | 2,820 | $91,640 |
| Mean Family Income | 2,820 | $107,448 |
| Median Household Income | 4,288 | $73,356 |
| Mean Household Income | 4,288 | $87,199 |
| Income Deficit | 2,820 | $0 |
| Wage / Income Gap (%) | 11,016 | 34.77% |
| Wage / Income Gap ($) | 11,016 | 65.23¢ per $1 |
| Gini / Inequality Index | 11,016 | 0.40 |
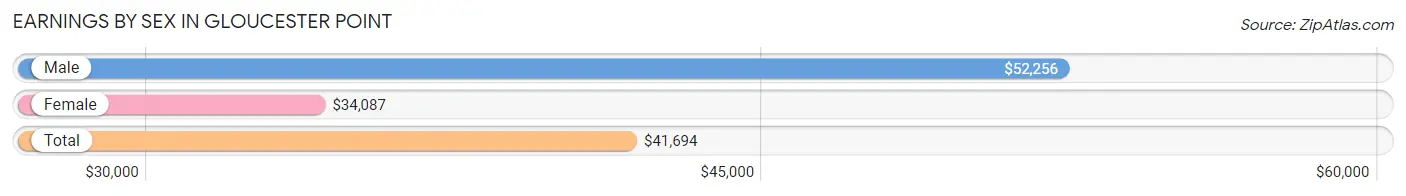
Earnings by Sex in Gloucester Point
Average Earnings in Gloucester Point are $41,694, $52,256 for men and $34,087 for women, a difference of 34.8%.
| Sex | Number | Average Earnings |
| Male | 2,750 (50.6%) | $52,256 |
| Female | 2,679 (49.3%) | $34,087 |
| Total | 5,429 (100.0%) | $41,694 |
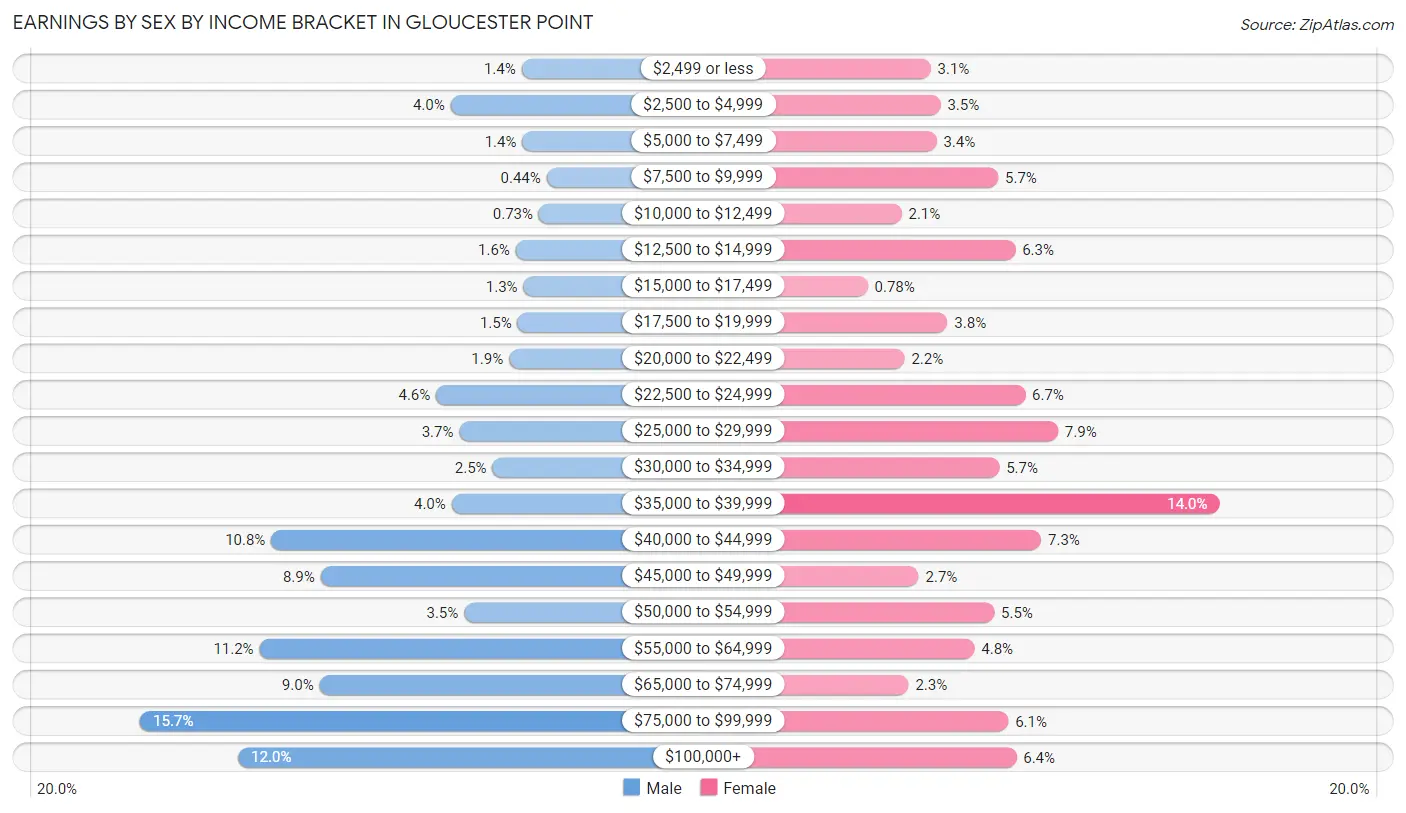
Earnings by Sex by Income Bracket in Gloucester Point
The most common earnings brackets in Gloucester Point are $75,000 to $99,999 for men (431 | 15.7%) and $35,000 to $39,999 for women (374 | 14.0%).
| Income | Male | Female |
| $2,499 or less | 38 (1.4%) | 84 (3.1%) |
| $2,500 to $4,999 | 111 (4.0%) | 94 (3.5%) |
| $5,000 to $7,499 | 37 (1.3%) | 90 (3.4%) |
| $7,500 to $9,999 | 12 (0.4%) | 152 (5.7%) |
| $10,000 to $12,499 | 20 (0.7%) | 55 (2.1%) |
| $12,500 to $14,999 | 44 (1.6%) | 169 (6.3%) |
| $15,000 to $17,499 | 36 (1.3%) | 21 (0.8%) |
| $17,500 to $19,999 | 42 (1.5%) | 101 (3.8%) |
| $20,000 to $22,499 | 51 (1.8%) | 58 (2.2%) |
| $22,500 to $24,999 | 126 (4.6%) | 179 (6.7%) |
| $25,000 to $29,999 | 102 (3.7%) | 212 (7.9%) |
| $30,000 to $34,999 | 68 (2.5%) | 153 (5.7%) |
| $35,000 to $39,999 | 110 (4.0%) | 374 (14.0%) |
| $40,000 to $44,999 | 296 (10.8%) | 195 (7.3%) |
| $45,000 to $49,999 | 245 (8.9%) | 72 (2.7%) |
| $50,000 to $54,999 | 97 (3.5%) | 148 (5.5%) |
| $55,000 to $64,999 | 308 (11.2%) | 128 (4.8%) |
| $65,000 to $74,999 | 246 (8.9%) | 62 (2.3%) |
| $75,000 to $99,999 | 431 (15.7%) | 162 (6.0%) |
| $100,000+ | 330 (12.0%) | 170 (6.4%) |
| Total | 2,750 (100.0%) | 2,679 (100.0%) |
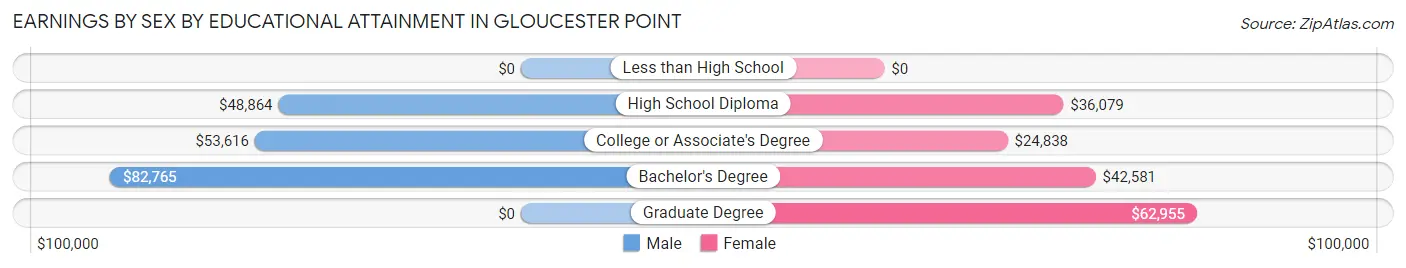
Earnings by Sex by Educational Attainment in Gloucester Point
Average earnings in Gloucester Point are $58,218 for men and $36,798 for women, a difference of 36.8%. Men with an educational attainment of bachelor's degree enjoy the highest average annual earnings of $82,765, while those with high school diploma education earn the least with $48,864. Women with an educational attainment of graduate degree earn the most with the average annual earnings of $62,955, while those with college or associate's degree education have the smallest earnings of $24,838.
| Educational Attainment | Male Income | Female Income |
| Less than High School | - | - |
| High School Diploma | $48,864 | $36,079 |
| College or Associate's Degree | $53,616 | $24,838 |
| Bachelor's Degree | $82,765 | $42,581 |
| Graduate Degree | - | - |
| Total | $58,218 | $36,798 |
Family Income in Gloucester Point
Family Income Brackets in Gloucester Point
According to the Gloucester Point family income data, there are 691 families falling into the $100,000 to $149,999 income range, which is the most common income bracket and makes up 24.5% of all families. Conversely, the $25,000 to $34,999 income bracket is the least frequent group with only 28 families (1.0%) belonging to this category.
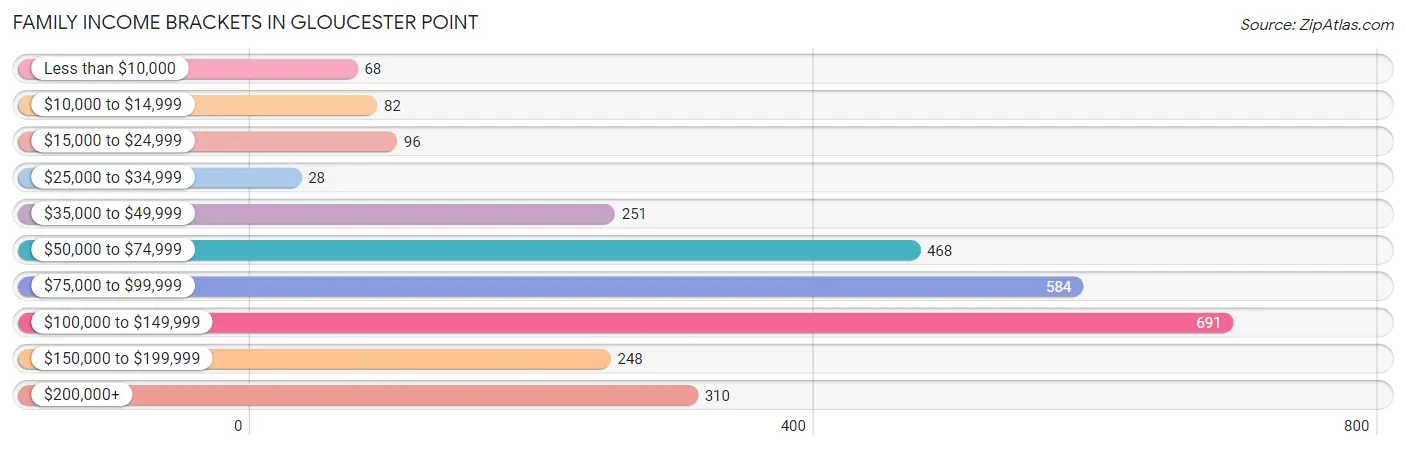
| Income Bracket | # Families | % Families |
| Less than $10,000 | 68 | 2.4% |
| $10,000 to $14,999 | 82 | 2.9% |
| $15,000 to $24,999 | 96 | 3.4% |
| $25,000 to $34,999 | 28 | 1.0% |
| $35,000 to $49,999 | 251 | 8.9% |
| $50,000 to $74,999 | 468 | 16.6% |
| $75,000 to $99,999 | 584 | 20.7% |
| $100,000 to $149,999 | 691 | 24.5% |
| $150,000 to $199,999 | 248 | 8.8% |
| $200,000+ | 310 | 11.0% |
Family Income by Famaliy Size in Gloucester Point
5-person families (245 | 8.7%) account for the highest median family income in Gloucester Point with $142,083 per family, while 2-person families (1,582 | 56.1%) have the highest median income of $40,416 per family member.
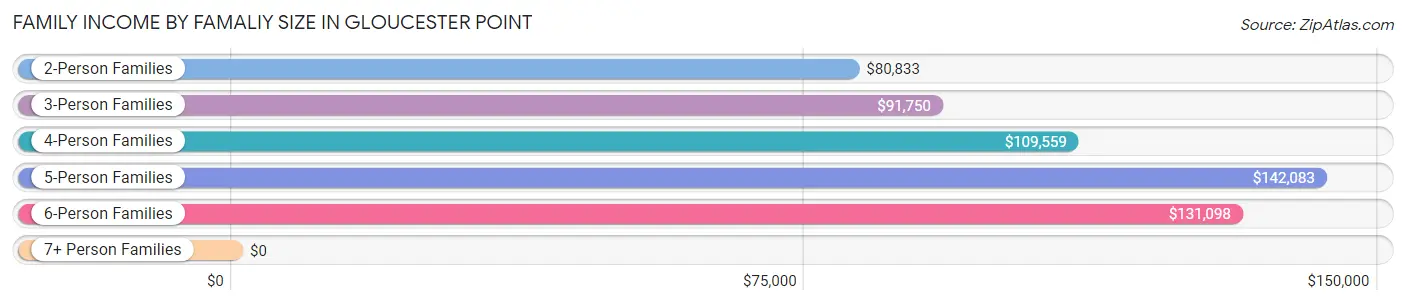
| Income Bracket | # Families | Median Income |
| 2-Person Families | 1,582 (56.1%) | $80,833 |
| 3-Person Families | 517 (18.3%) | $91,750 |
| 4-Person Families | 382 (13.6%) | $109,559 |
| 5-Person Families | 245 (8.7%) | $142,083 |
| 6-Person Families | 59 (2.1%) | $131,098 |
| 7+ Person Families | 35 (1.2%) | $0 |
| Total | 2,820 (100.0%) | $91,640 |
Family Income by Number of Earners in Gloucester Point
The median family income in Gloucester Point is $91,640, with families comprising 3+ earners (279) having the highest median family income of $205,536, while families with 1 earner (924) have the lowest median family income of $68,523, accounting for 9.9% and 32.8% of families, respectively.
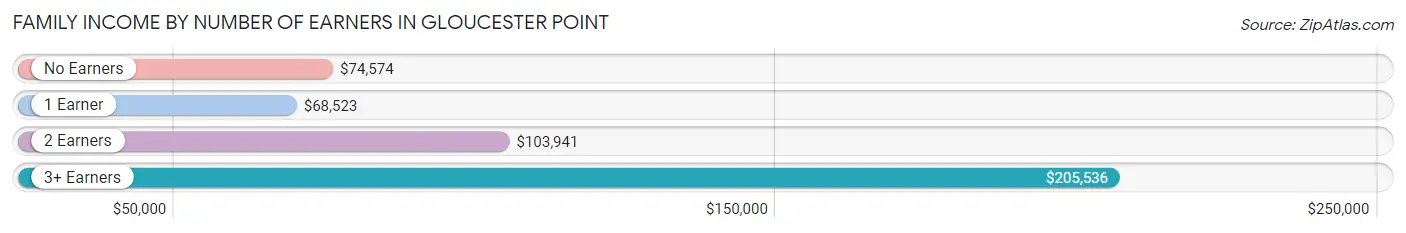
| Number of Earners | # Families | Median Income |
| No Earners | 547 (19.4%) | $74,574 |
| 1 Earner | 924 (32.8%) | $68,523 |
| 2 Earners | 1,070 (37.9%) | $103,941 |
| 3+ Earners | 279 (9.9%) | $205,536 |
| Total | 2,820 (100.0%) | $91,640 |
Household Income in Gloucester Point
Household Income Brackets in Gloucester Point
With 896 households falling in the category, the $35,000 to $49,999 income range is the most frequent in Gloucester Point, accounting for 20.9% of all households. In contrast, only 64 households (1.5%) fall into the $25,000 to $34,999 income bracket, making it the least populous group.
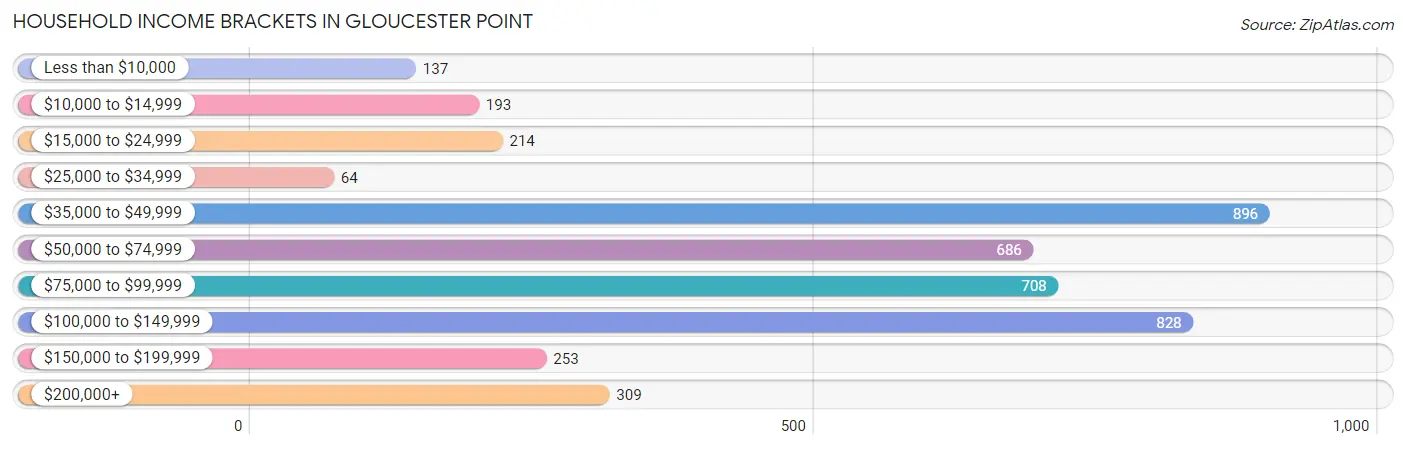
| Income Bracket | # Households | % Households |
| Less than $10,000 | 137 | 3.2% |
| $10,000 to $14,999 | 193 | 4.5% |
| $15,000 to $24,999 | 214 | 5.0% |
| $25,000 to $34,999 | 64 | 1.5% |
| $35,000 to $49,999 | 896 | 20.9% |
| $50,000 to $74,999 | 686 | 16.0% |
| $75,000 to $99,999 | 708 | 16.5% |
| $100,000 to $149,999 | 828 | 19.3% |
| $150,000 to $199,999 | 253 | 5.9% |
| $200,000+ | 309 | 7.2% |
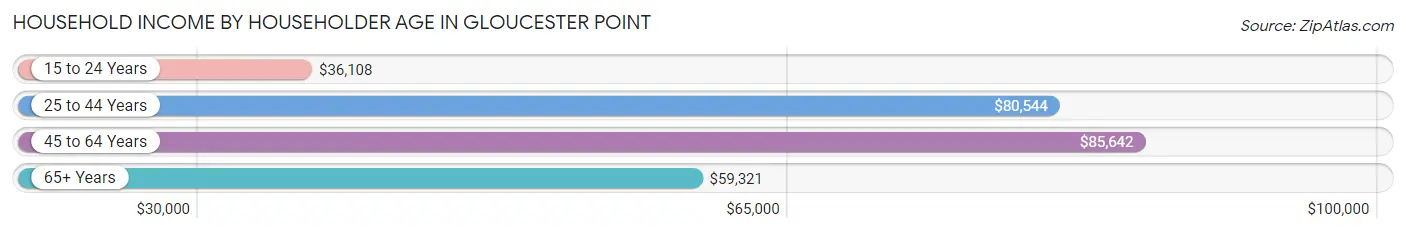
Household Income by Householder Age in Gloucester Point
The median household income in Gloucester Point is $73,356, with the highest median household income of $85,642 found in the 45 to 64 years age bracket for the primary householder. A total of 1,583 households (36.9%) fall into this category. Meanwhile, the 15 to 24 years age bracket for the primary householder has the lowest median household income of $36,108, with 115 households (2.7%) in this group.
| Income Bracket | # Households | Median Income |
| 15 to 24 Years | 115 (2.7%) | $36,108 |
| 25 to 44 Years | 1,215 (28.3%) | $80,544 |
| 45 to 64 Years | 1,583 (36.9%) | $85,642 |
| 65+ Years | 1,375 (32.1%) | $59,321 |
| Total | 4,288 (100.0%) | $73,356 |
Poverty in Gloucester Point
Income Below Poverty by Sex and Age in Gloucester Point
With 6.9% poverty level for males and 13.1% for females among the residents of Gloucester Point, 55 to 64 year old males and under 5 year old females are the most vulnerable to poverty, with 92 males (14.1%) and 104 females (30.8%) in their respective age groups living below the poverty level.
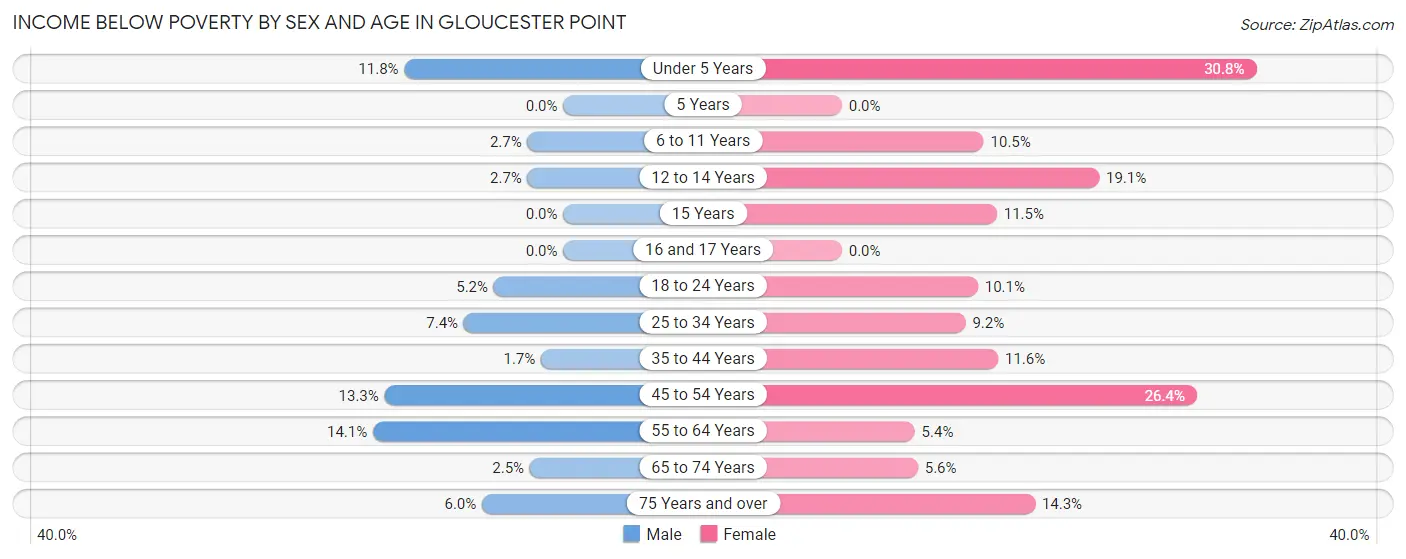
| Age Bracket | Male | Female |
| Under 5 Years | 19 (11.8%) | 104 (30.8%) |
| 5 Years | 0 (0.0%) | 0 (0.0%) |
| 6 to 11 Years | 10 (2.7%) | 50 (10.5%) |
| 12 to 14 Years | 10 (2.6%) | 34 (19.1%) |
| 15 Years | 0 (0.0%) | 16 (11.5%) |
| 16 and 17 Years | 0 (0.0%) | 0 (0.0%) |
| 18 to 24 Years | 24 (5.2%) | 53 (10.1%) |
| 25 to 34 Years | 53 (7.4%) | 54 (9.2%) |
| 35 to 44 Years | 9 (1.7%) | 79 (11.6%) |
| 45 to 54 Years | 97 (13.3%) | 235 (26.4%) |
| 55 to 64 Years | 92 (14.1%) | 44 (5.4%) |
| 65 to 74 Years | 14 (2.5%) | 43 (5.6%) |
| 75 Years and over | 14 (6.0%) | 79 (14.3%) |
| Total | 342 (6.9%) | 791 (13.1%) |
Income Above Poverty by Sex and Age in Gloucester Point
According to the poverty statistics in Gloucester Point, males aged 5 years and females aged 5 years are the age groups that are most secure financially, with 100.0% of males and 100.0% of females in these age groups living above the poverty line.
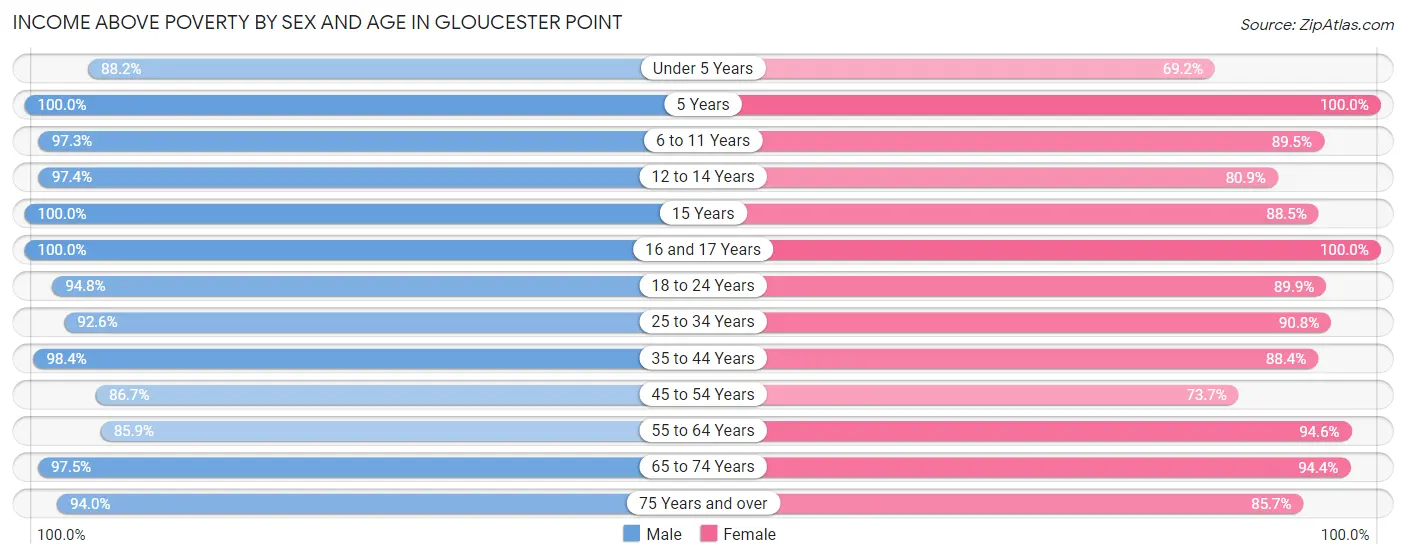
| Age Bracket | Male | Female |
| Under 5 Years | 142 (88.2%) | 234 (69.2%) |
| 5 Years | 64 (100.0%) | 17 (100.0%) |
| 6 to 11 Years | 366 (97.3%) | 425 (89.5%) |
| 12 to 14 Years | 367 (97.4%) | 144 (80.9%) |
| 15 Years | 56 (100.0%) | 123 (88.5%) |
| 16 and 17 Years | 25 (100.0%) | 61 (100.0%) |
| 18 to 24 Years | 441 (94.8%) | 472 (89.9%) |
| 25 to 34 Years | 665 (92.6%) | 534 (90.8%) |
| 35 to 44 Years | 538 (98.4%) | 602 (88.4%) |
| 45 to 54 Years | 634 (86.7%) | 657 (73.7%) |
| 55 to 64 Years | 559 (85.9%) | 769 (94.6%) |
| 65 to 74 Years | 550 (97.5%) | 720 (94.4%) |
| 75 Years and over | 218 (94.0%) | 472 (85.7%) |
| Total | 4,625 (93.1%) | 5,230 (86.9%) |
Income Below Poverty Among Married-Couple Families in Gloucester Point
The poverty statistics for married-couple families in Gloucester Point show that 3.7% or 82 of the total 2,212 families live below the poverty line. Families with 1 or 2 children have the highest poverty rate of 6.7%, comprising of 37 families. On the other hand, families with 3 or 4 children have the lowest poverty rate of 0.0%, which includes 0 families.
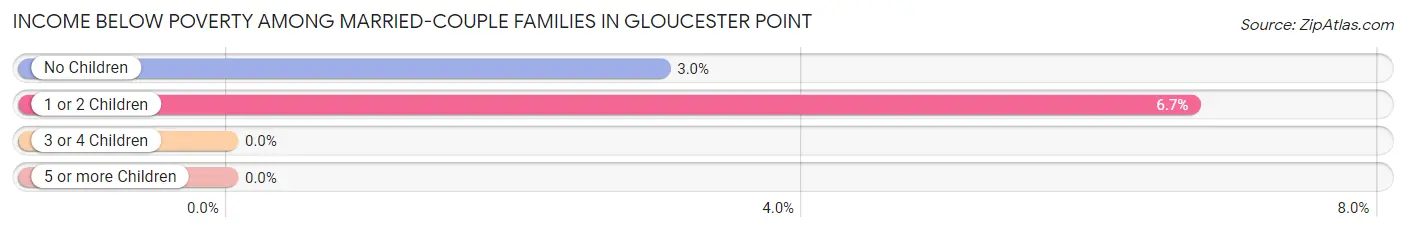
| Children | Above Poverty | Below Poverty |
| No Children | 1,450 (97.0%) | 45 (3.0%) |
| 1 or 2 Children | 515 (93.3%) | 37 (6.7%) |
| 3 or 4 Children | 137 (100.0%) | 0 (0.0%) |
| 5 or more Children | 28 (100.0%) | 0 (0.0%) |
| Total | 2,130 (96.3%) | 82 (3.7%) |
Income Below Poverty Among Single-Parent Households in Gloucester Point
According to the poverty data in Gloucester Point, 21.6% or 21 single-father households and 17.4% or 89 single-mother households are living below the poverty line. Among single-father households, those with no children have the highest poverty rate, with 21 households (53.8%) experiencing poverty. Likewise, among single-mother households, those with 3 or 4 children have the highest poverty rate, with 23 households (100.0%) falling below the poverty line.
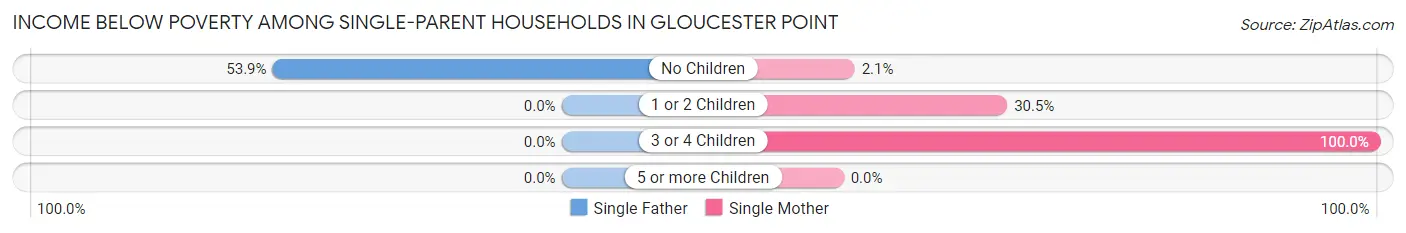
| Children | Single Father | Single Mother |
| No Children | 21 (53.8%) | 6 (2.1%) |
| 1 or 2 Children | 0 (0.0%) | 60 (30.5%) |
| 3 or 4 Children | 0 (0.0%) | 23 (100.0%) |
| 5 or more Children | 0 (0.0%) | 0 (0.0%) |
| Total | 21 (21.6%) | 89 (17.4%) |
Income Below Poverty Among Married-Couple vs Single-Parent Households in Gloucester Point
The poverty data for Gloucester Point shows that 82 of the married-couple family households (3.7%) and 110 of the single-parent households (18.1%) are living below the poverty level. Within the married-couple family households, those with 1 or 2 children have the highest poverty rate, with 37 households (6.7%) falling below the poverty line. Among the single-parent households, those with 3 or 4 children have the highest poverty rate, with 23 household (100.0%) living below poverty.
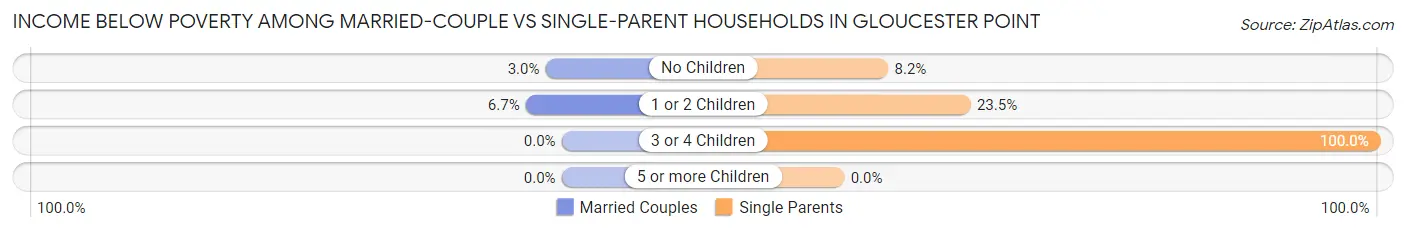
| Children | Married-Couple Families | Single-Parent Households |
| No Children | 45 (3.0%) | 27 (8.2%) |
| 1 or 2 Children | 37 (6.7%) | 60 (23.5%) |
| 3 or 4 Children | 0 (0.0%) | 23 (100.0%) |
| 5 or more Children | 0 (0.0%) | 0 (0.0%) |
| Total | 82 (3.7%) | 110 (18.1%) |
Race in Gloucester Point
The most populous races in Gloucester Point are White / Caucasian (9,060 | 82.2%), Black / African American (863 | 7.8%), and Two or more Races (812 | 7.4%).
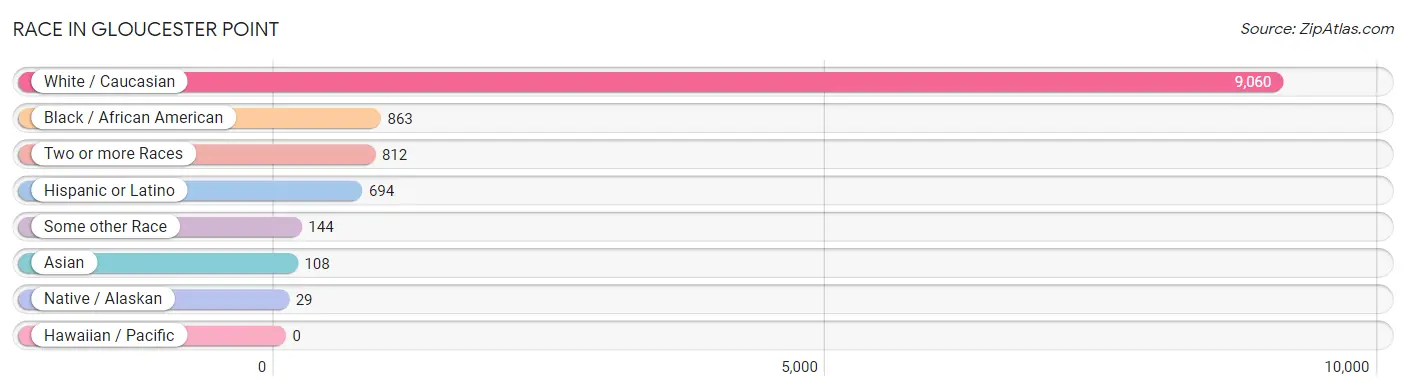
| Race | # Population | % Population |
| Asian | 108 | 1.0% |
| Black / African American | 863 | 7.8% |
| Hawaiian / Pacific | 0 | 0.0% |
| Hispanic or Latino | 694 | 6.3% |
| Native / Alaskan | 29 | 0.3% |
| White / Caucasian | 9,060 | 82.2% |
| Two or more Races | 812 | 7.4% |
| Some other Race | 144 | 1.3% |
| Total | 11,016 | 100.0% |
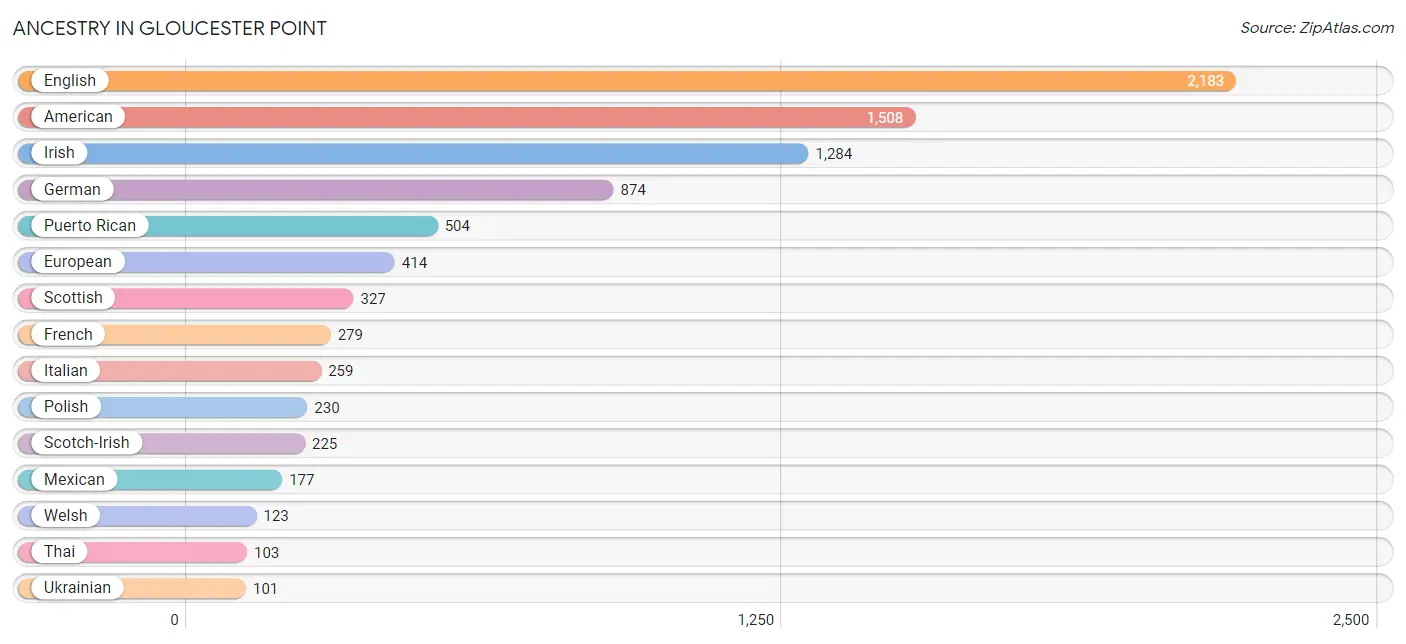
Ancestry in Gloucester Point
The most populous ancestries reported in Gloucester Point are English (2,183 | 19.8%), American (1,508 | 13.7%), Irish (1,284 | 11.7%), German (874 | 7.9%), and Puerto Rican (504 | 4.6%), together accounting for 57.7% of all Gloucester Point residents.
| Ancestry | # Population | % Population |
| African | 31 | 0.3% |
| American | 1,508 | 13.7% |
| Arab | 8 | 0.1% |
| Austrian | 8 | 0.1% |
| Belgian | 14 | 0.1% |
| Bhutanese | 12 | 0.1% |
| Blackfeet | 14 | 0.1% |
| British | 57 | 0.5% |
| Canadian | 34 | 0.3% |
| Cherokee | 65 | 0.6% |
| Czech | 14 | 0.1% |
| Danish | 61 | 0.5% |
| Dutch | 25 | 0.2% |
| Eastern European | 100 | 0.9% |
| English | 2,183 | 19.8% |
| European | 414 | 3.8% |
| Filipino | 15 | 0.1% |
| French | 279 | 2.5% |
| French Canadian | 15 | 0.1% |
| German | 874 | 7.9% |
| Greek | 35 | 0.3% |
| Indian (Asian) | 13 | 0.1% |
| Irish | 1,284 | 11.7% |
| Italian | 259 | 2.4% |
| Lebanese | 8 | 0.1% |
| Lithuanian | 26 | 0.2% |
| Mexican | 177 | 1.6% |
| Norwegian | 62 | 0.6% |
| Pakistani | 11 | 0.1% |
| Pennsylvania German | 14 | 0.1% |
| Polish | 230 | 2.1% |
| Portuguese | 13 | 0.1% |
| Puerto Rican | 504 | 4.6% |
| Scandinavian | 38 | 0.3% |
| Scotch-Irish | 225 | 2.0% |
| Scottish | 327 | 3.0% |
| Slovene | 14 | 0.1% |
| Spanish | 13 | 0.1% |
| Subsaharan African | 31 | 0.3% |
| Swedish | 56 | 0.5% |
| Swiss | 39 | 0.4% |
| Thai | 103 | 0.9% |
| Ukrainian | 101 | 0.9% |
| Welsh | 123 | 1.1% |
| Yaqui | 29 | 0.3% | View All 45 Rows |
Immigrants in Gloucester Point
The most numerous immigrant groups reported in Gloucester Point came from Latin America (94 | 0.9%), Europe (85 | 0.8%), Central America (81 | 0.7%), Mexico (81 | 0.7%), and Western Europe (42 | 0.4%), together accounting for 3.5% of all Gloucester Point residents.
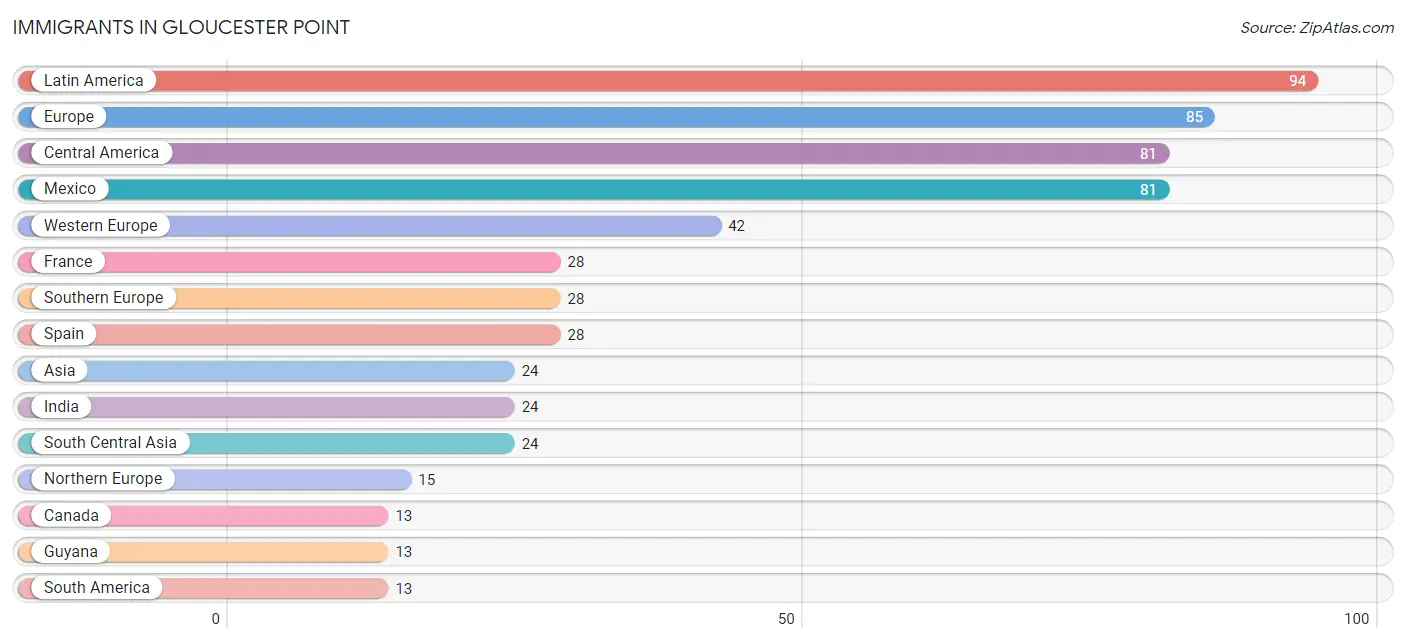
| Immigration Origin | # Population | % Population |
| Asia | 24 | 0.2% |
| Canada | 13 | 0.1% |
| Central America | 81 | 0.7% |
| Europe | 85 | 0.8% |
| France | 28 | 0.3% |
| Germany | 6 | 0.1% |
| Guyana | 13 | 0.1% |
| India | 24 | 0.2% |
| Latin America | 94 | 0.9% |
| Mexico | 81 | 0.7% |
| Northern Europe | 15 | 0.1% |
| South America | 13 | 0.1% |
| South Central Asia | 24 | 0.2% |
| Southern Europe | 28 | 0.3% |
| Spain | 28 | 0.3% |
| Switzerland | 8 | 0.1% |
| Western Europe | 42 | 0.4% | View All 17 Rows |
Sex and Age in Gloucester Point
Sex and Age in Gloucester Point
The most populous age groups in Gloucester Point are 10 to 14 Years (479 | 9.6%) for men and 35 to 39 Years (523 | 8.7%) for women.
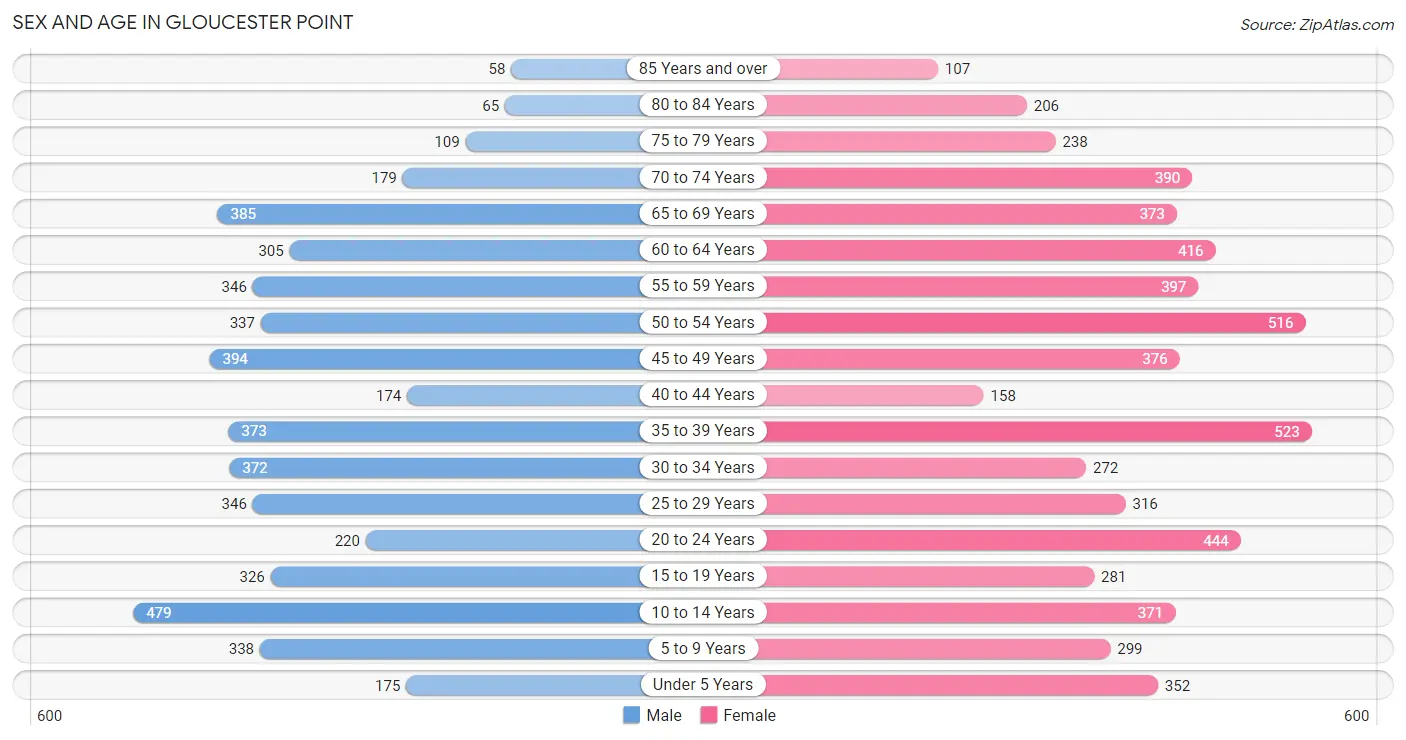
| Age Bracket | Male | Female |
| Under 5 Years | 175 (3.5%) | 352 (5.8%) |
| 5 to 9 Years | 338 (6.8%) | 299 (5.0%) |
| 10 to 14 Years | 479 (9.6%) | 371 (6.1%) |
| 15 to 19 Years | 326 (6.5%) | 281 (4.7%) |
| 20 to 24 Years | 220 (4.4%) | 444 (7.4%) |
| 25 to 29 Years | 346 (7.0%) | 316 (5.2%) |
| 30 to 34 Years | 372 (7.5%) | 272 (4.5%) |
| 35 to 39 Years | 373 (7.5%) | 523 (8.7%) |
| 40 to 44 Years | 174 (3.5%) | 158 (2.6%) |
| 45 to 49 Years | 394 (7.9%) | 376 (6.2%) |
| 50 to 54 Years | 337 (6.8%) | 516 (8.6%) |
| 55 to 59 Years | 346 (7.0%) | 397 (6.6%) |
| 60 to 64 Years | 305 (6.1%) | 416 (6.9%) |
| 65 to 69 Years | 385 (7.7%) | 373 (6.2%) |
| 70 to 74 Years | 179 (3.6%) | 390 (6.5%) |
| 75 to 79 Years | 109 (2.2%) | 238 (3.9%) |
| 80 to 84 Years | 65 (1.3%) | 206 (3.4%) |
| 85 Years and over | 58 (1.2%) | 107 (1.8%) |
| Total | 4,981 (100.0%) | 6,035 (100.0%) |
Families and Households in Gloucester Point
Median Family Size in Gloucester Point
The median family size in Gloucester Point is 3.22 persons per family, with single female/mother families (511 | 18.1%) accounting for the largest median family size of 3.35 persons per family. On the other hand, single male/father families (97 | 3.4%) represent the smallest median family size with 2.25 persons per family.
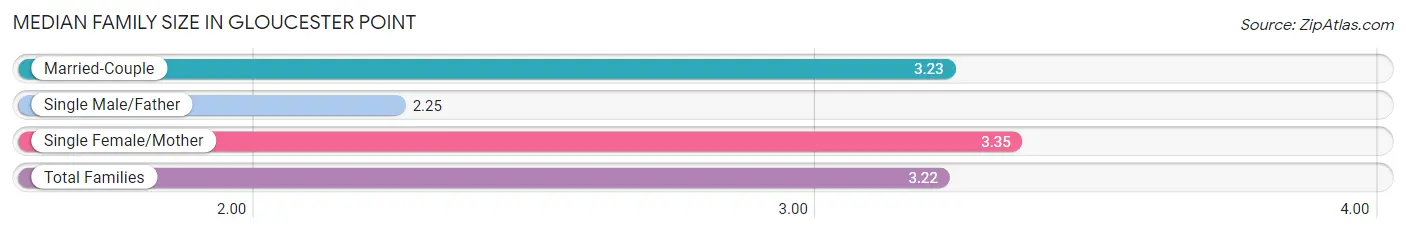
| Family Type | # Families | Family Size |
| Married-Couple | 2,212 (78.4%) | 3.23 |
| Single Male/Father | 97 (3.4%) | 2.25 |
| Single Female/Mother | 511 (18.1%) | 3.35 |
| Total Families | 2,820 (100.0%) | 3.22 |
Median Household Size in Gloucester Point
The median household size in Gloucester Point is 2.57 persons per household, with single female/mother households (511 | 11.9%) accounting for the largest median household size of 3.51 persons per household. non-family households (1,468 | 34.2%) represent the smallest median household size with 1.18 persons per household.
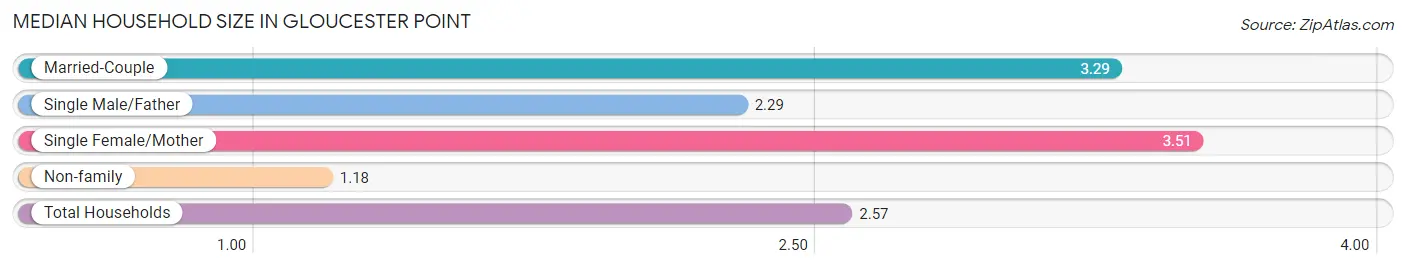
| Household Type | # Households | Household Size |
| Married-Couple | 2,212 (51.6%) | 3.29 |
| Single Male/Father | 97 (2.3%) | 2.29 |
| Single Female/Mother | 511 (11.9%) | 3.51 |
| Non-family | 1,468 (34.2%) | 1.18 |
| Total Households | 4,288 (100.0%) | 2.57 |
Household Size by Marriage Status in Gloucester Point
Out of a total of 4,288 households in Gloucester Point, 2,820 (65.8%) are family households, while 1,468 (34.2%) are nonfamily households. The most numerous type of family households are 2-person households, comprising 1,511, and the most common type of nonfamily households are 1-person households, comprising 1,213.
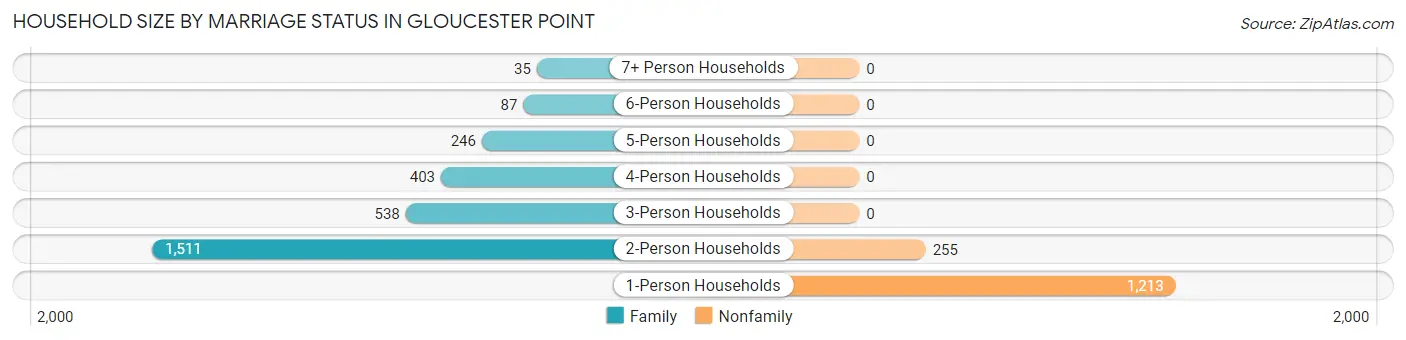
| Household Size | Family Households | Nonfamily Households |
| 1-Person Households | - | 1,213 (28.3%) |
| 2-Person Households | 1,511 (35.2%) | 255 (5.9%) |
| 3-Person Households | 538 (12.6%) | 0 (0.0%) |
| 4-Person Households | 403 (9.4%) | 0 (0.0%) |
| 5-Person Households | 246 (5.7%) | 0 (0.0%) |
| 6-Person Households | 87 (2.0%) | 0 (0.0%) |
| 7+ Person Households | 35 (0.8%) | 0 (0.0%) |
| Total | 2,820 (65.8%) | 1,468 (34.2%) |
Female Fertility in Gloucester Point
Fertility by Age in Gloucester Point
Average fertility rate in Gloucester Point is 39.0 births per 1,000 women. Women in the age bracket of 20 to 34 years have the highest fertility rate with 56.0 births per 1,000 women. Women in the age bracket of 20 to 34 years acount for 60.4% of all women with births.
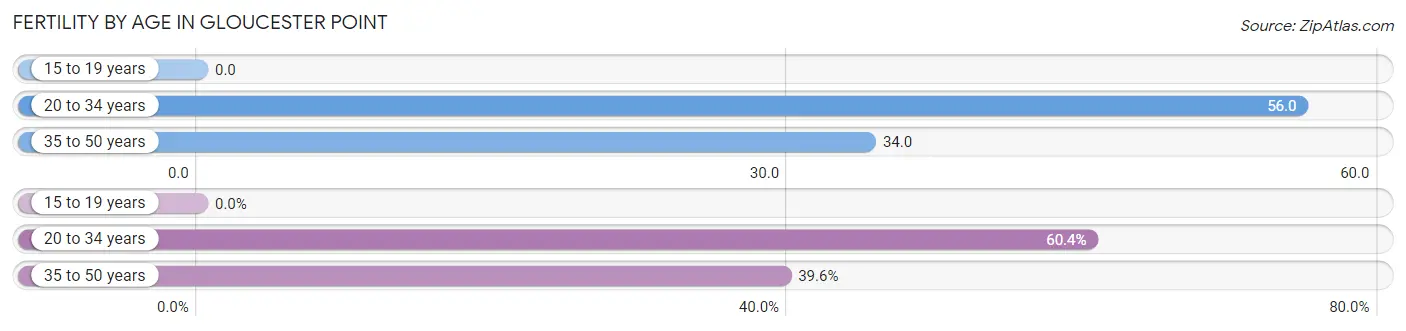
| Age Bracket | Women with Births | Births / 1,000 Women |
| 15 to 19 years | 0 (0.0%) | 0.0 |
| 20 to 34 years | 58 (60.4%) | 56.0 |
| 35 to 50 years | 38 (39.6%) | 34.0 |
| Total | 96 (100.0%) | 39.0 |
Fertility by Age by Marriage Status in Gloucester Point
76.0% of women with births (96) in Gloucester Point are married. The highest percentage of unmarried women with births falls into 20 to 34 years age bracket with 39.7% of them unmarried at the time of birth, while the lowest percentage of unmarried women with births belong to 35 to 50 years age bracket with 0.0% of them unmarried.
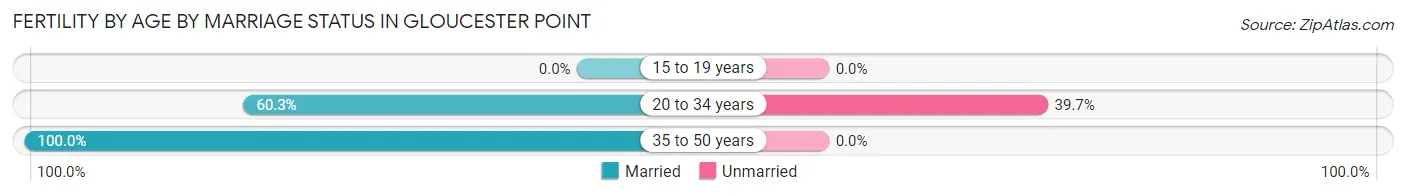
| Age Bracket | Married | Unmarried |
| 15 to 19 years | 0 (0.0%) | 0 (0.0%) |
| 20 to 34 years | 35 (60.3%) | 23 (39.7%) |
| 35 to 50 years | 38 (100.0%) | 0 (0.0%) |
| Total | 73 (76.0%) | 23 (24.0%) |
Fertility by Education in Gloucester Point
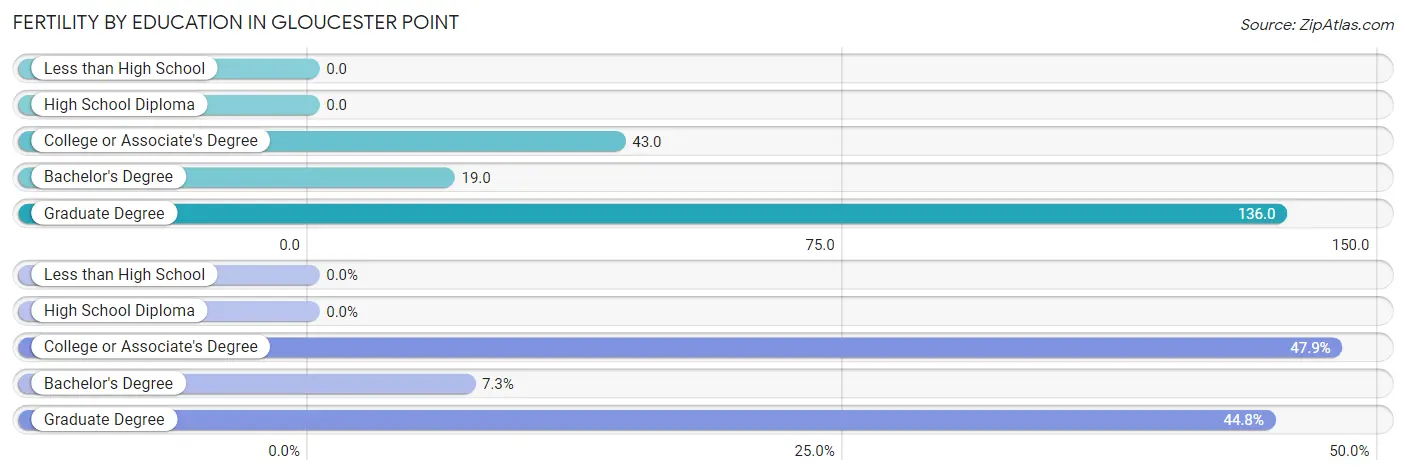
| Educational Attainment | Women with Births | Births / 1,000 Women |
| Less than High School | 0 (0.0%) | 0.0 |
| High School Diploma | 0 (0.0%) | 0.0 |
| College or Associate's Degree | 46 (47.9%) | 43.0 |
| Bachelor's Degree | 7 (7.3%) | 19.0 |
| Graduate Degree | 43 (44.8%) | 136.0 |
| Total | 96 (100.0%) | 39.0 |
Fertility by Education by Marriage Status in Gloucester Point
24.0% of women with births in Gloucester Point are unmarried. Women with the educational attainment of bachelor's degree are most likely to be married with 100.0% of them married at childbirth, while women with the educational attainment of college or associate's degree are least likely to be married with 50.0% of them unmarried at childbirth.
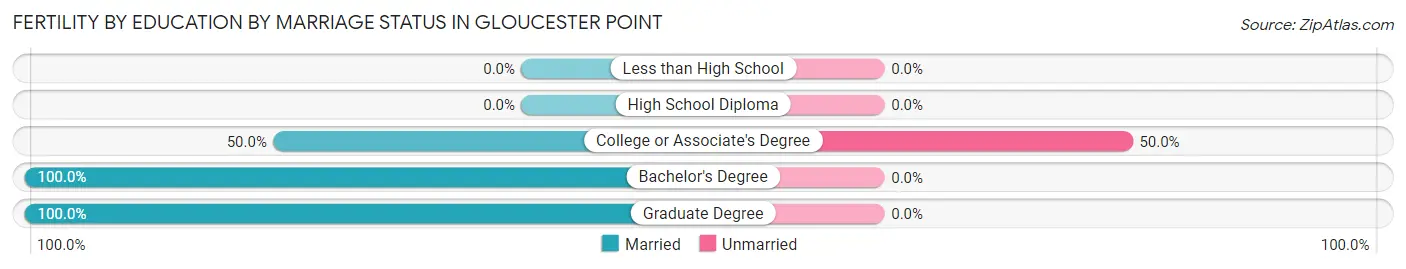
| Educational Attainment | Married | Unmarried |
| Less than High School | 0 (0.0%) | 0 (0.0%) |
| High School Diploma | 0 (0.0%) | 0 (0.0%) |
| College or Associate's Degree | 23 (50.0%) | 23 (50.0%) |
| Bachelor's Degree | 7 (100.0%) | 0 (0.0%) |
| Graduate Degree | 43 (100.0%) | 0 (0.0%) |
| Total | 73 (76.0%) | 23 (24.0%) |
Employment Characteristics in Gloucester Point
Employment by Class of Employer in Gloucester Point
Among the 5,089 employed individuals in Gloucester Point, private company employees (3,382 | 66.5%), local government employees (498 | 9.8%), and federal government employees (418 | 8.2%) make up the most common classes of employment.
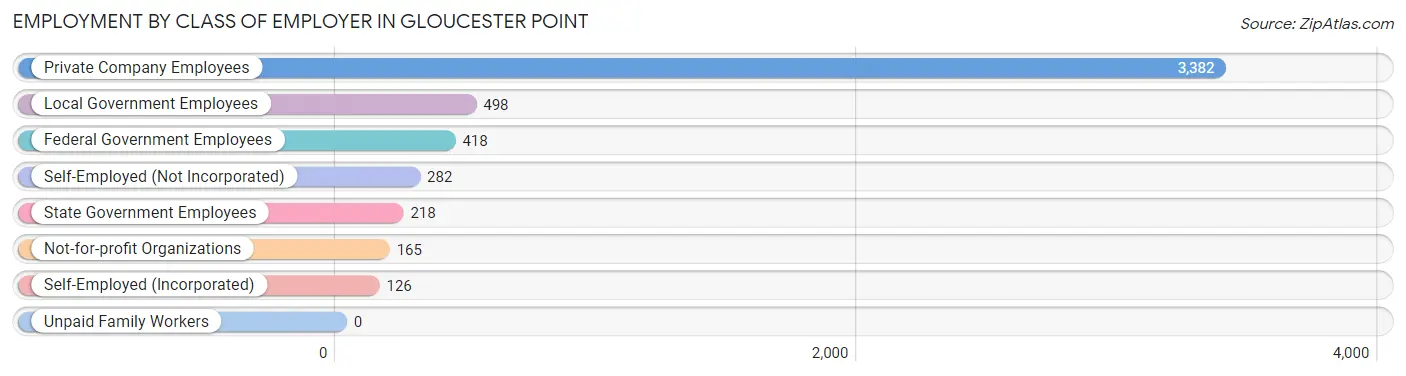
| Employer Class | # Employees | % Employees |
| Private Company Employees | 3,382 | 66.5% |
| Self-Employed (Incorporated) | 126 | 2.5% |
| Self-Employed (Not Incorporated) | 282 | 5.5% |
| Not-for-profit Organizations | 165 | 3.2% |
| Local Government Employees | 498 | 9.8% |
| State Government Employees | 218 | 4.3% |
| Federal Government Employees | 418 | 8.2% |
| Unpaid Family Workers | 0 | 0.0% |
| Total | 5,089 | 100.0% |
Employment Status by Age in Gloucester Point
According to the labor force statistics for Gloucester Point, out of the total population over 16 years of age (8,807), 60.4% or 5,319 individuals are in the labor force, with 4.5% or 239 of them unemployed. The age group with the highest labor force participation rate is 25 to 29 years, with 97.4% or 645 individuals in the labor force. Within the labor force, the 16 to 19 years age range has the highest percentage of unemployed individuals, with 13.4% or 39 of them being unemployed.
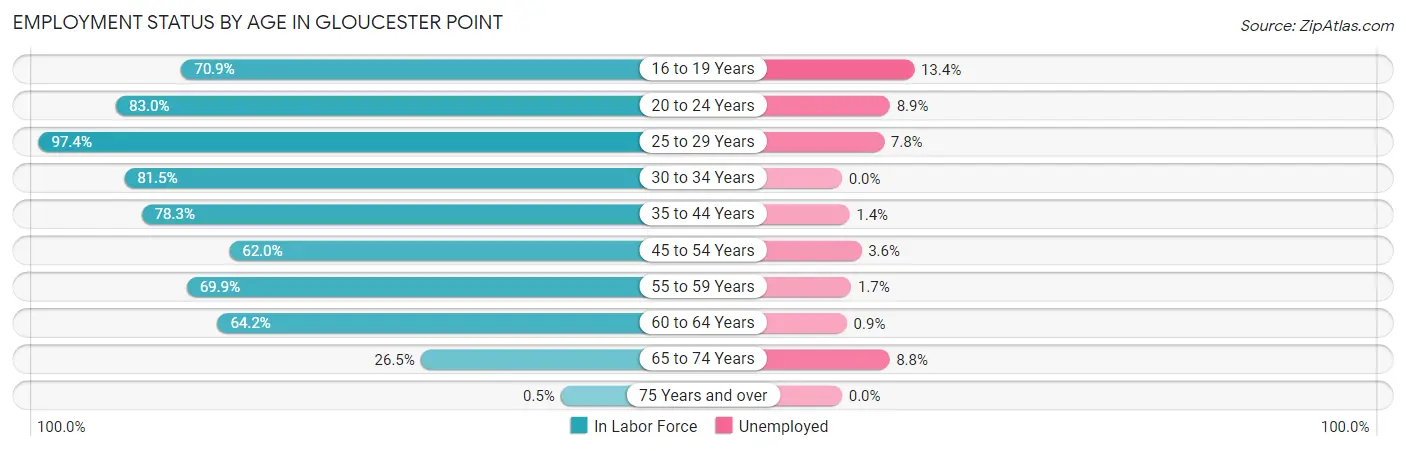
| Age Bracket | In Labor Force | Unemployed |
| 16 to 19 Years | 292 (70.9%) | 39 (13.4%) |
| 20 to 24 Years | 551 (83.0%) | 49 (8.9%) |
| 25 to 29 Years | 645 (97.4%) | 50 (7.8%) |
| 30 to 34 Years | 525 (81.5%) | 0 (0.0%) |
| 35 to 44 Years | 962 (78.3%) | 13 (1.4%) |
| 45 to 54 Years | 1,006 (62.0%) | 36 (3.6%) |
| 55 to 59 Years | 519 (69.9%) | 9 (1.7%) |
| 60 to 64 Years | 463 (64.2%) | 4 (0.9%) |
| 65 to 74 Years | 352 (26.5%) | 31 (8.8%) |
| 75 Years and over | 4 (0.5%) | 0 (0.0%) |
| Total | 5,319 (60.4%) | 239 (4.5%) |
Employment Status by Educational Attainment in Gloucester Point
According to labor force statistics for Gloucester Point, 73.3% of individuals (4,120) out of the total population between 25 and 64 years of age (5,621) are in the labor force, with 2.8% or 115 of them being unemployed. The group with the highest labor force participation rate are those with the educational attainment of college / associate degree, with 75.3% or 1,637 individuals in the labor force. Within the labor force, individuals with college / associate degree education have the highest percentage of unemployment, with 4.2% or 69 of them being unemployed.
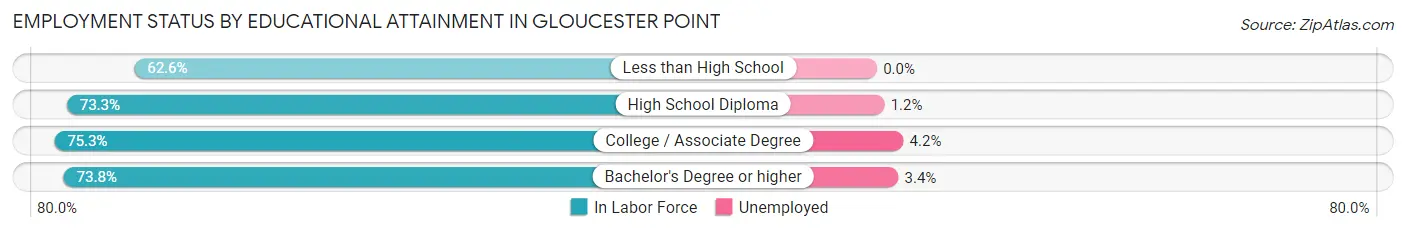
| Educational Attainment | In Labor Force | Unemployed |
| Less than High School | 294 (62.6%) | 0 (0.0%) |
| High School Diploma | 1,106 (73.3%) | 18 (1.2%) |
| College / Associate Degree | 1,637 (75.3%) | 91 (4.2%) |
| Bachelor's Degree or higher | 1,083 (73.8%) | 50 (3.4%) |
| Total | 4,120 (73.3%) | 157 (2.8%) |
Employment Occupations by Sex in Gloucester Point
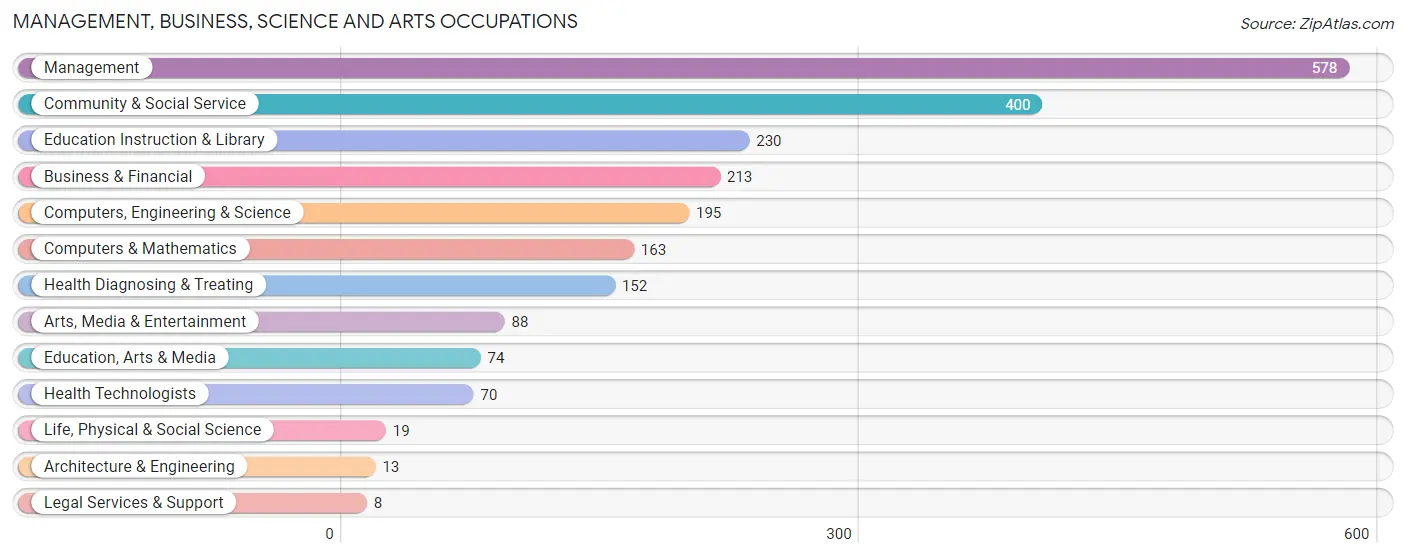
Management, Business, Science and Arts Occupations
The most common Management, Business, Science and Arts occupations in Gloucester Point are Management (578 | 11.8%), Community & Social Service (400 | 8.2%), Education Instruction & Library (230 | 4.7%), Business & Financial (213 | 4.3%), and Computers, Engineering & Science (195 | 4.0%).
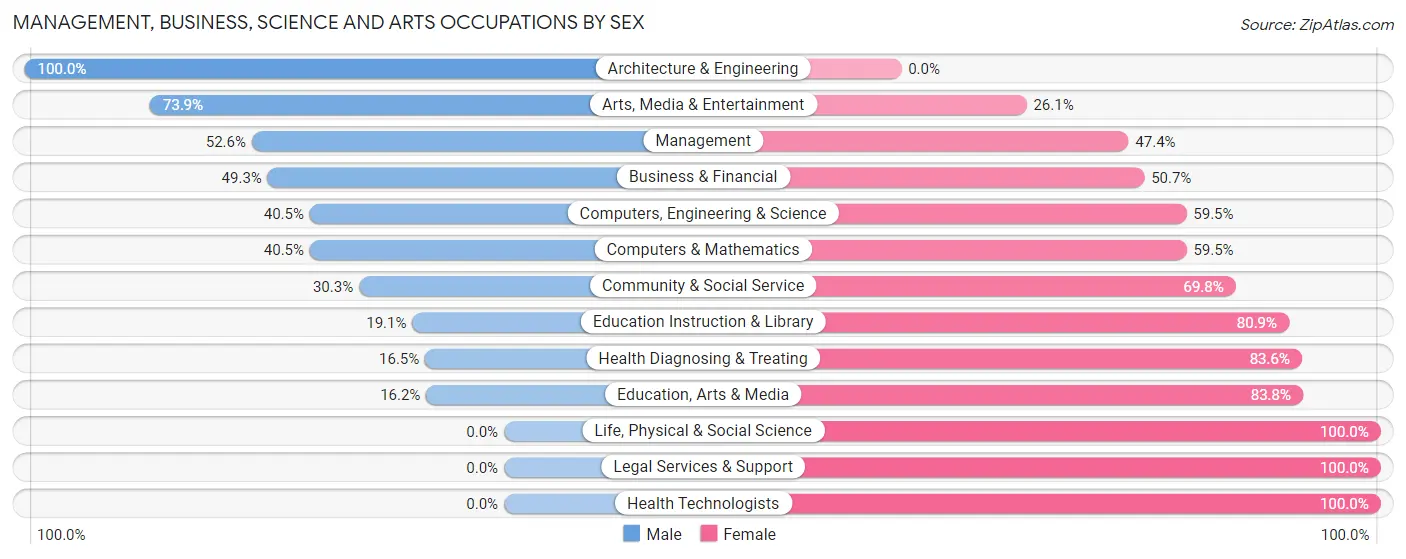
Management, Business, Science and Arts Occupations by Sex
Within the Management, Business, Science and Arts occupations in Gloucester Point, the most male-oriented occupations are Architecture & Engineering (100.0%), Arts, Media & Entertainment (73.9%), and Management (52.6%), while the most female-oriented occupations are Life, Physical & Social Science (100.0%), Legal Services & Support (100.0%), and Health Technologists (100.0%).
| Occupation | Male | Female |
| Management | 304 (52.6%) | 274 (47.4%) |
| Business & Financial | 105 (49.3%) | 108 (50.7%) |
| Computers, Engineering & Science | 79 (40.5%) | 116 (59.5%) |
| Computers & Mathematics | 66 (40.5%) | 97 (59.5%) |
| Architecture & Engineering | 13 (100.0%) | 0 (0.0%) |
| Life, Physical & Social Science | 0 (0.0%) | 19 (100.0%) |
| Community & Social Service | 121 (30.2%) | 279 (69.8%) |
| Education, Arts & Media | 12 (16.2%) | 62 (83.8%) |
| Legal Services & Support | 0 (0.0%) | 8 (100.0%) |
| Education Instruction & Library | 44 (19.1%) | 186 (80.9%) |
| Arts, Media & Entertainment | 65 (73.9%) | 23 (26.1%) |
| Health Diagnosing & Treating | 25 (16.5%) | 127 (83.6%) |
| Health Technologists | 0 (0.0%) | 70 (100.0%) |
| Total (Category) | 634 (41.2%) | 904 (58.8%) |
| Total (Overall) | 2,494 (50.9%) | 2,407 (49.1%) |
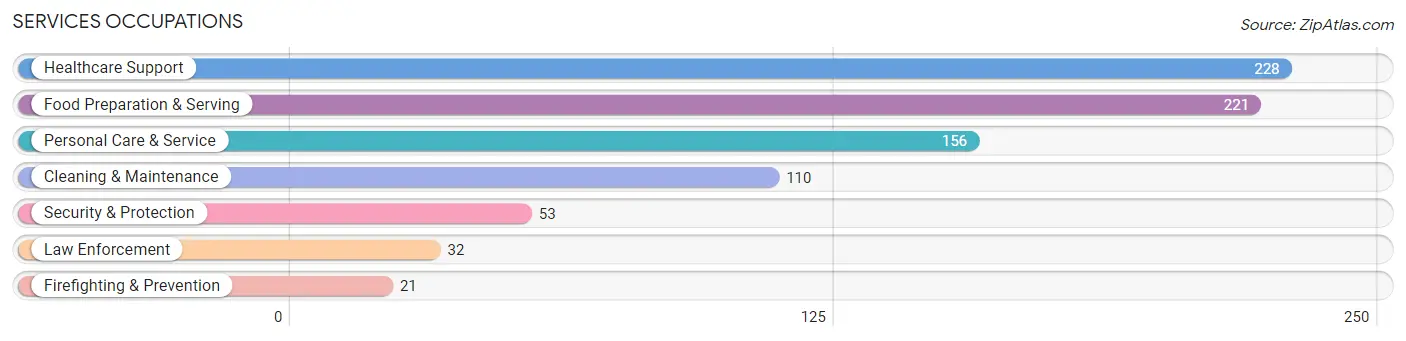
Services Occupations
The most common Services occupations in Gloucester Point are Healthcare Support (228 | 4.6%), Food Preparation & Serving (221 | 4.5%), Personal Care & Service (156 | 3.2%), Cleaning & Maintenance (110 | 2.2%), and Security & Protection (53 | 1.1%).
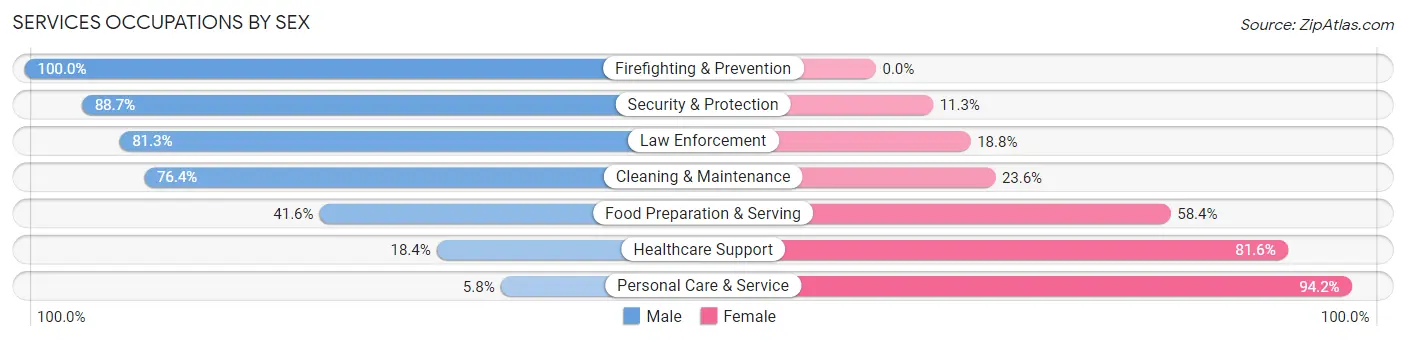
Services Occupations by Sex
Within the Services occupations in Gloucester Point, the most male-oriented occupations are Firefighting & Prevention (100.0%), Security & Protection (88.7%), and Law Enforcement (81.2%), while the most female-oriented occupations are Personal Care & Service (94.2%), Healthcare Support (81.6%), and Food Preparation & Serving (58.4%).
| Occupation | Male | Female |
| Healthcare Support | 42 (18.4%) | 186 (81.6%) |
| Security & Protection | 47 (88.7%) | 6 (11.3%) |
| Firefighting & Prevention | 21 (100.0%) | 0 (0.0%) |
| Law Enforcement | 26 (81.2%) | 6 (18.8%) |
| Food Preparation & Serving | 92 (41.6%) | 129 (58.4%) |
| Cleaning & Maintenance | 84 (76.4%) | 26 (23.6%) |
| Personal Care & Service | 9 (5.8%) | 147 (94.2%) |
| Total (Category) | 274 (35.7%) | 494 (64.3%) |
| Total (Overall) | 2,494 (50.9%) | 2,407 (49.1%) |
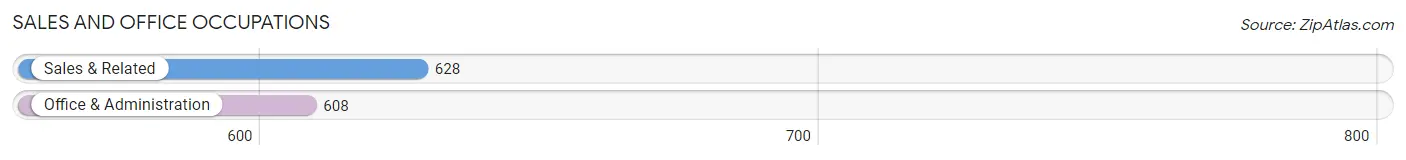
Sales and Office Occupations
The most common Sales and Office occupations in Gloucester Point are Sales & Related (628 | 12.8%), and Office & Administration (608 | 12.4%).
Sales and Office Occupations by Sex
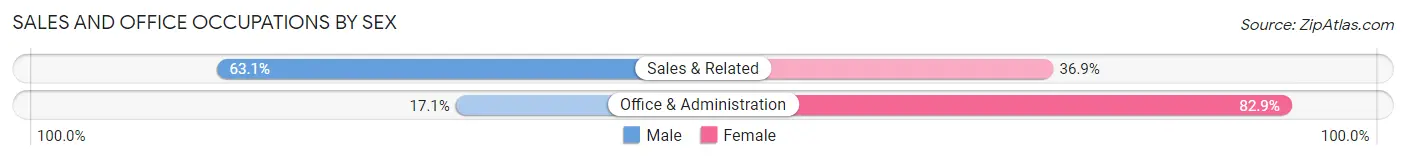
| Occupation | Male | Female |
| Sales & Related | 396 (63.1%) | 232 (36.9%) |
| Office & Administration | 104 (17.1%) | 504 (82.9%) |
| Total (Category) | 500 (40.5%) | 736 (59.6%) |
| Total (Overall) | 2,494 (50.9%) | 2,407 (49.1%) |
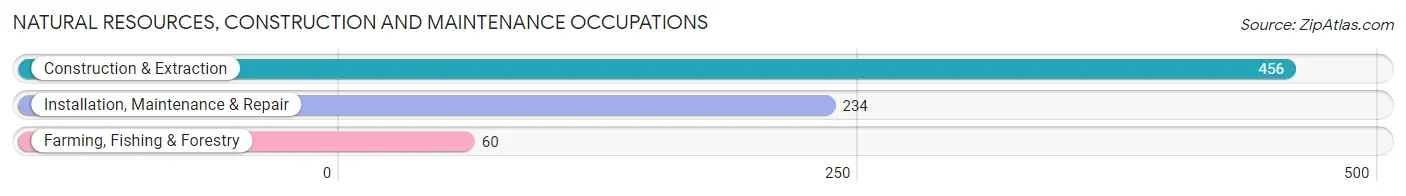
Natural Resources, Construction and Maintenance Occupations
The most common Natural Resources, Construction and Maintenance occupations in Gloucester Point are Construction & Extraction (456 | 9.3%), Installation, Maintenance & Repair (234 | 4.8%), and Farming, Fishing & Forestry (60 | 1.2%).
Natural Resources, Construction and Maintenance Occupations by Sex
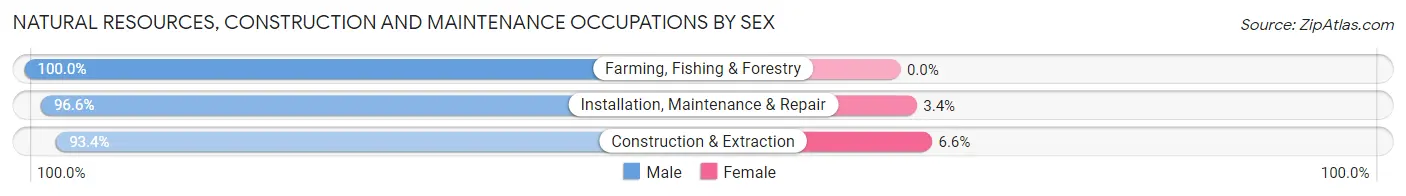
| Occupation | Male | Female |
| Farming, Fishing & Forestry | 60 (100.0%) | 0 (0.0%) |
| Construction & Extraction | 426 (93.4%) | 30 (6.6%) |
| Installation, Maintenance & Repair | 226 (96.6%) | 8 (3.4%) |
| Total (Category) | 712 (94.9%) | 38 (5.1%) |
| Total (Overall) | 2,494 (50.9%) | 2,407 (49.1%) |
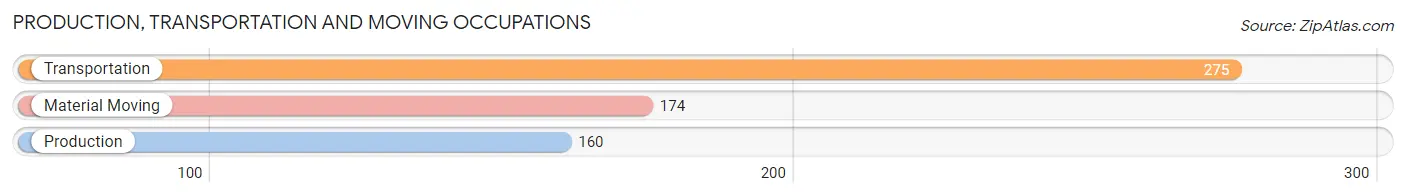
Production, Transportation and Moving Occupations
The most common Production, Transportation and Moving occupations in Gloucester Point are Transportation (275 | 5.6%), Material Moving (174 | 3.5%), and Production (160 | 3.3%).
Production, Transportation and Moving Occupations by Sex
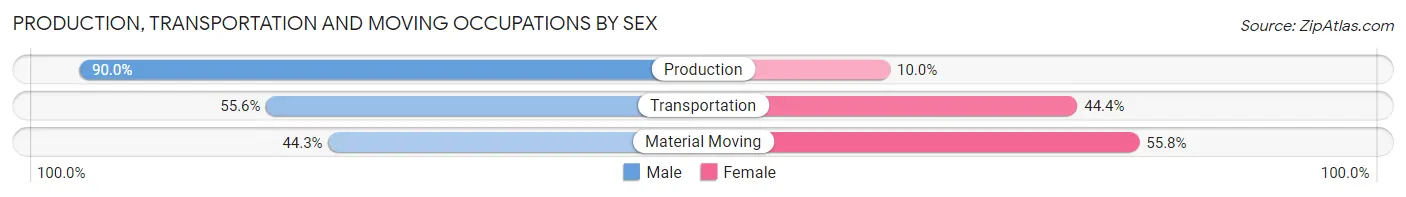
| Occupation | Male | Female |
| Production | 144 (90.0%) | 16 (10.0%) |
| Transportation | 153 (55.6%) | 122 (44.4%) |
| Material Moving | 77 (44.3%) | 97 (55.7%) |
| Total (Category) | 374 (61.4%) | 235 (38.6%) |
| Total (Overall) | 2,494 (50.9%) | 2,407 (49.1%) |
Employment Industries by Sex in Gloucester Point
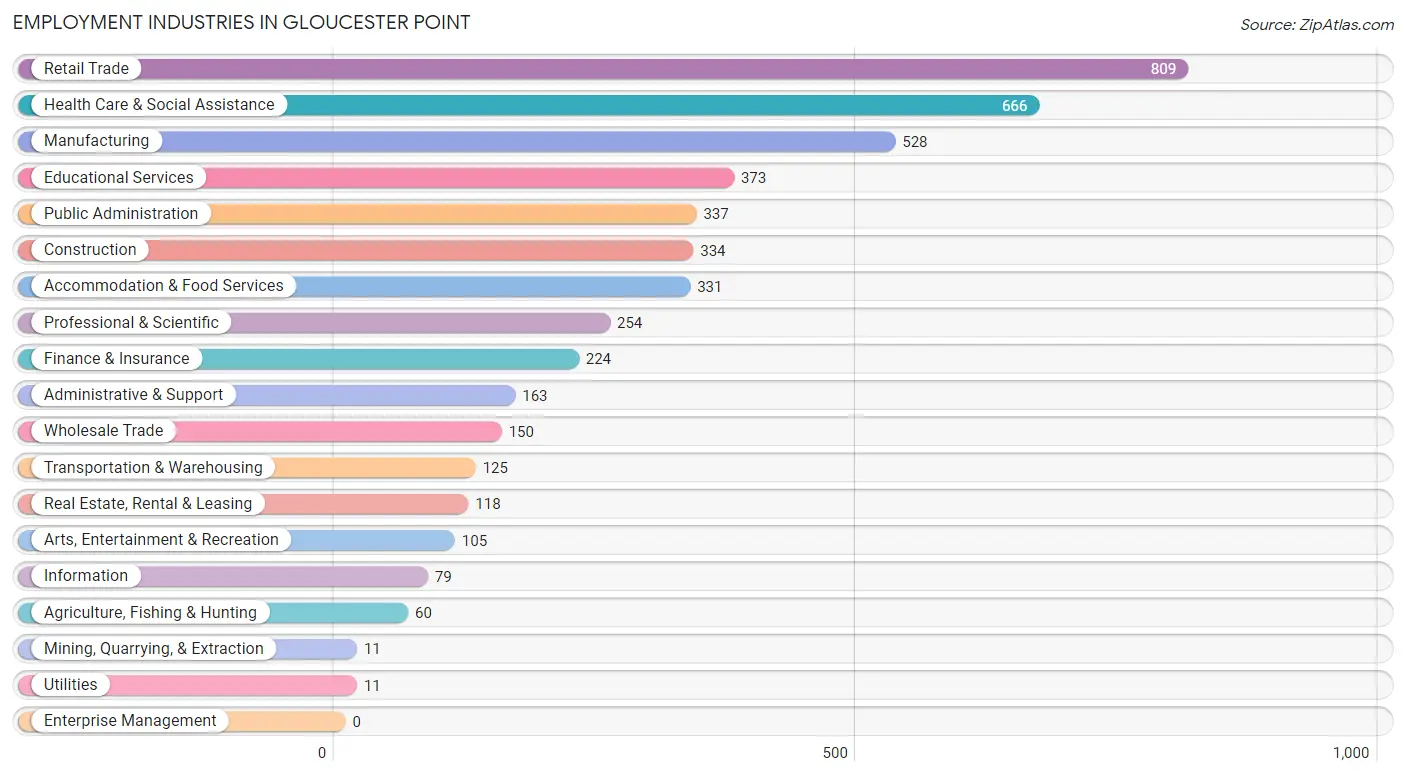
Employment Industries in Gloucester Point
The major employment industries in Gloucester Point include Retail Trade (809 | 16.5%), Health Care & Social Assistance (666 | 13.6%), Manufacturing (528 | 10.8%), Educational Services (373 | 7.6%), and Public Administration (337 | 6.9%).
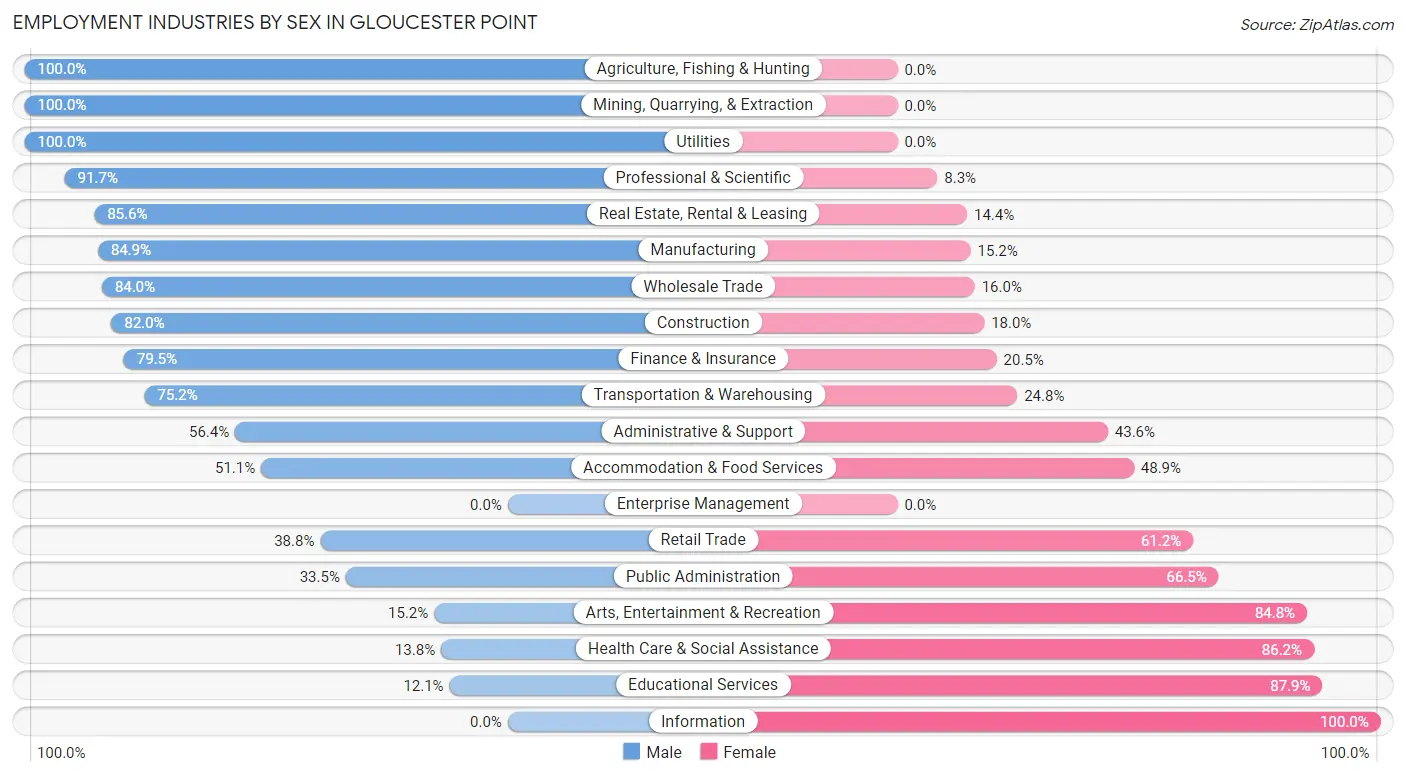
Employment Industries by Sex in Gloucester Point
The Gloucester Point industries that see more men than women are Agriculture, Fishing & Hunting (100.0%), Mining, Quarrying, & Extraction (100.0%), and Utilities (100.0%), whereas the industries that tend to have a higher number of women are Information (100.0%), Educational Services (87.9%), and Health Care & Social Assistance (86.2%).
| Industry | Male | Female |
| Agriculture, Fishing & Hunting | 60 (100.0%) | 0 (0.0%) |
| Mining, Quarrying, & Extraction | 11 (100.0%) | 0 (0.0%) |
| Construction | 274 (82.0%) | 60 (18.0%) |
| Manufacturing | 448 (84.9%) | 80 (15.1%) |
| Wholesale Trade | 126 (84.0%) | 24 (16.0%) |
| Retail Trade | 314 (38.8%) | 495 (61.2%) |
| Transportation & Warehousing | 94 (75.2%) | 31 (24.8%) |
| Utilities | 11 (100.0%) | 0 (0.0%) |
| Information | 0 (0.0%) | 79 (100.0%) |
| Finance & Insurance | 178 (79.5%) | 46 (20.5%) |
| Real Estate, Rental & Leasing | 101 (85.6%) | 17 (14.4%) |
| Professional & Scientific | 233 (91.7%) | 21 (8.3%) |
| Enterprise Management | 0 (0.0%) | 0 (0.0%) |
| Administrative & Support | 92 (56.4%) | 71 (43.6%) |
| Educational Services | 45 (12.1%) | 328 (87.9%) |
| Health Care & Social Assistance | 92 (13.8%) | 574 (86.2%) |
| Arts, Entertainment & Recreation | 16 (15.2%) | 89 (84.8%) |
| Accommodation & Food Services | 169 (51.1%) | 162 (48.9%) |
| Public Administration | 113 (33.5%) | 224 (66.5%) |
| Total | 2,494 (50.9%) | 2,407 (49.1%) |
Education in Gloucester Point
School Enrollment in Gloucester Point
The most common levels of schooling among the 2,391 students in Gloucester Point are middle school (741 | 31.0%), elementary school (518 | 21.7%), and college / undergraduate (423 | 17.7%).
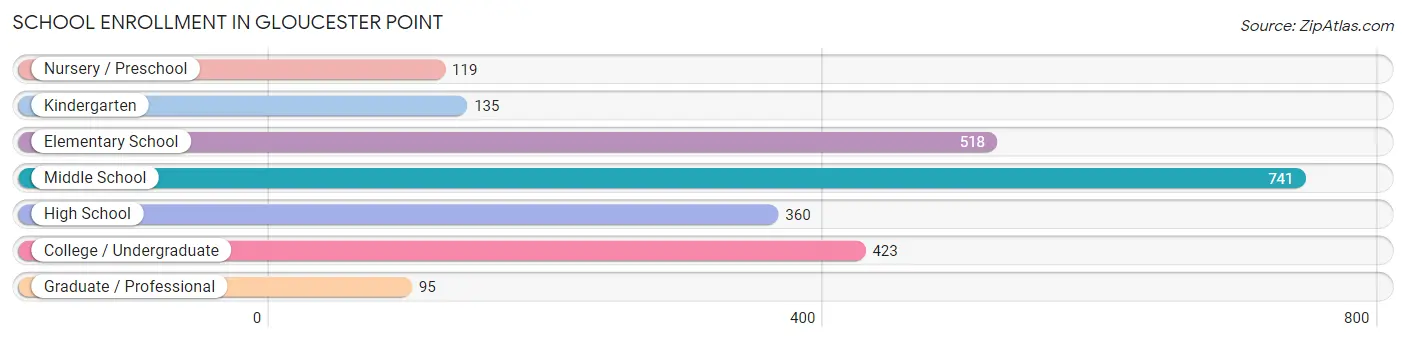
| School Level | # Students | % Students |
| Nursery / Preschool | 119 | 5.0% |
| Kindergarten | 135 | 5.7% |
| Elementary School | 518 | 21.7% |
| Middle School | 741 | 31.0% |
| High School | 360 | 15.1% |
| College / Undergraduate | 423 | 17.7% |
| Graduate / Professional | 95 | 4.0% |
| Total | 2,391 | 100.0% |
School Enrollment by Age by Funding Source in Gloucester Point
Out of a total of 2,391 students who are enrolled in schools in Gloucester Point, 366 (15.3%) attend a private institution, while the remaining 2,025 (84.7%) are enrolled in public schools. The age group of 35 years and over has the highest likelihood of being enrolled in private schools, with 34 (35.4% in the age bracket) enrolled. Conversely, the age group of 18 to 19 year olds has the lowest likelihood of being enrolled in a private school, with 160 (100.0% in the age bracket) attending a public institution.
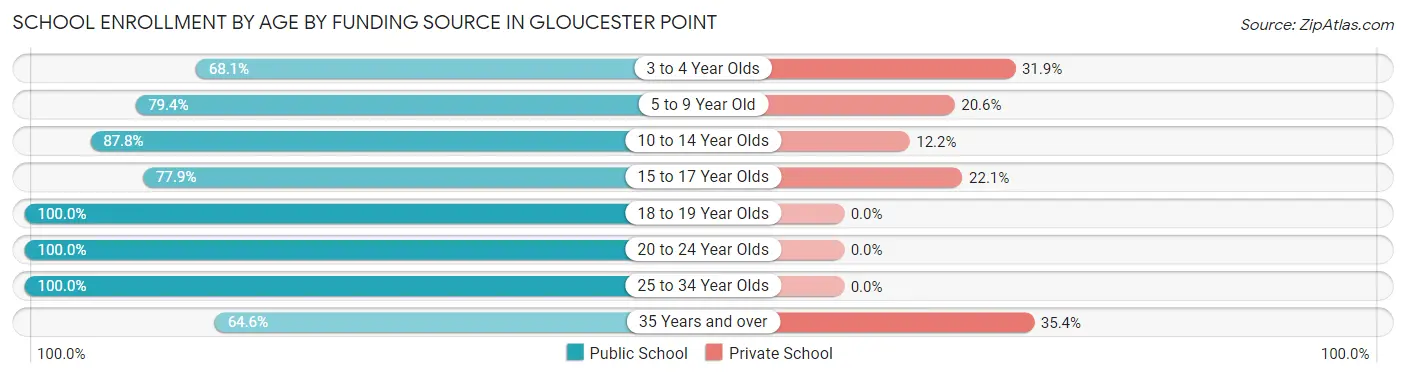
| Age Bracket | Public School | Private School |
| 3 to 4 Year Olds | 96 (68.1%) | 45 (31.9%) |
| 5 to 9 Year Old | 470 (79.4%) | 122 (20.6%) |
| 10 to 14 Year Olds | 733 (87.8%) | 102 (12.2%) |
| 15 to 17 Year Olds | 219 (77.9%) | 62 (22.1%) |
| 18 to 19 Year Olds | 160 (100.0%) | 0 (0.0%) |
| 20 to 24 Year Olds | 224 (100.0%) | 0 (0.0%) |
| 25 to 34 Year Olds | 62 (100.0%) | 0 (0.0%) |
| 35 Years and over | 62 (64.6%) | 34 (35.4%) |
| Total | 2,025 (84.7%) | 366 (15.3%) |
Educational Attainment by Field of Study in Gloucester Point
Business (480 | 20.8%), arts & humanities (297 | 12.9%), computers & mathematics (245 | 10.6%), education (206 | 8.9%), and liberal arts & history (185 | 8.0%) are the most common fields of study among 2,309 individuals in Gloucester Point who have obtained a bachelor's degree or higher.
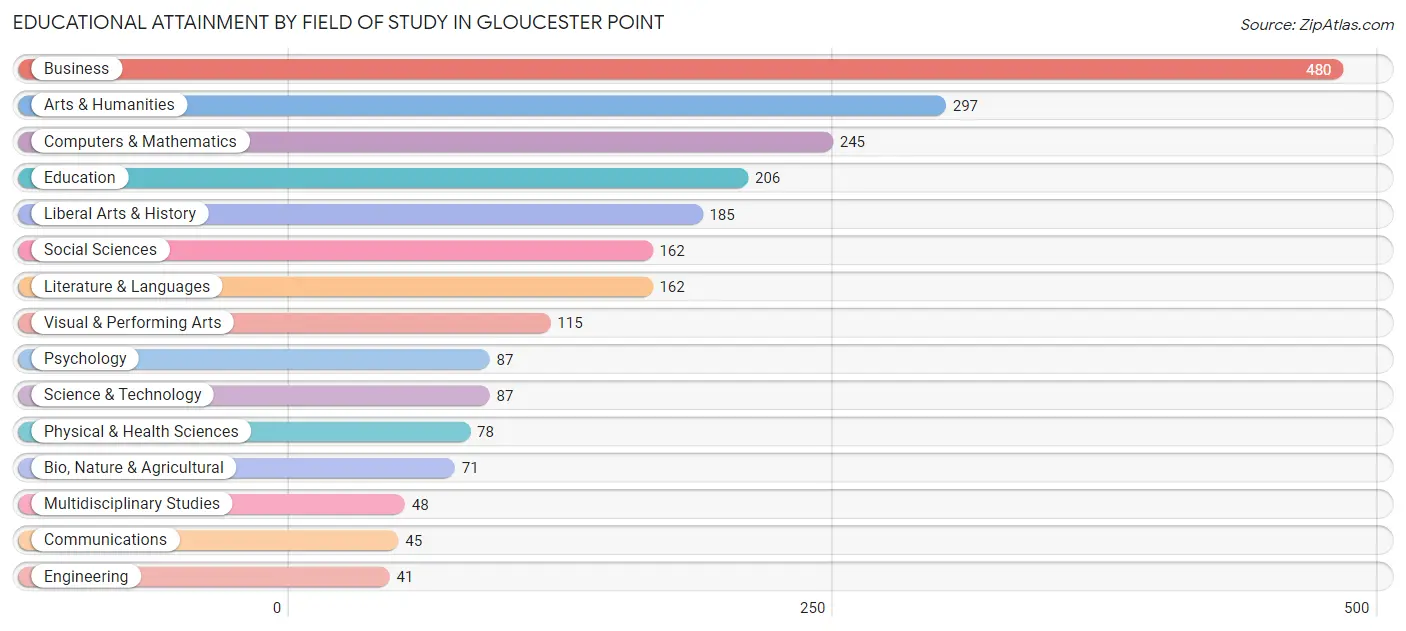
| Field of Study | # Graduates | % Graduates |
| Computers & Mathematics | 245 | 10.6% |
| Bio, Nature & Agricultural | 71 | 3.1% |
| Physical & Health Sciences | 78 | 3.4% |
| Psychology | 87 | 3.8% |
| Social Sciences | 162 | 7.0% |
| Engineering | 41 | 1.8% |
| Multidisciplinary Studies | 48 | 2.1% |
| Science & Technology | 87 | 3.8% |
| Business | 480 | 20.8% |
| Education | 206 | 8.9% |
| Literature & Languages | 162 | 7.0% |
| Liberal Arts & History | 185 | 8.0% |
| Visual & Performing Arts | 115 | 5.0% |
| Communications | 45 | 1.9% |
| Arts & Humanities | 297 | 12.9% |
| Total | 2,309 | 100.0% |
Transportation & Commute in Gloucester Point
Vehicle Availability by Sex in Gloucester Point
The most prevalent vehicle ownership categories in Gloucester Point are males with 2 vehicles (1,036, accounting for 38.6%) and females with 2 vehicles (1,125, making up 43.0%).
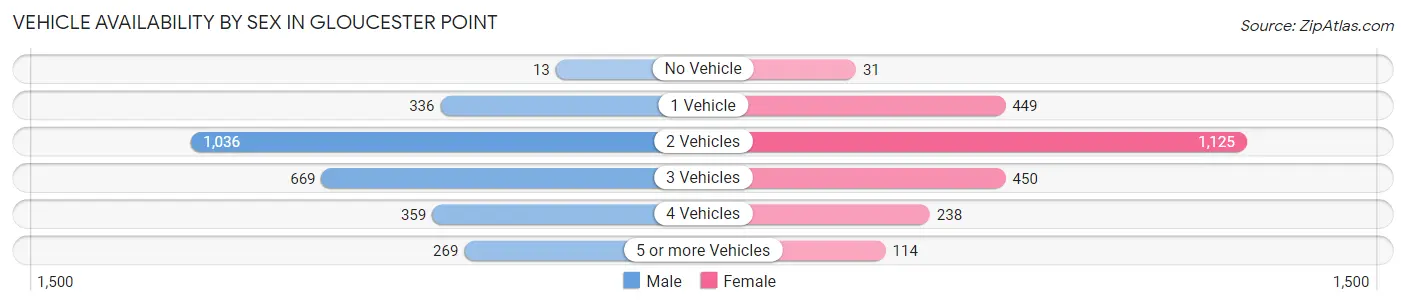
| Vehicles Available | Male | Female |
| No Vehicle | 13 (0.5%) | 31 (1.3%) |
| 1 Vehicle | 336 (12.5%) | 449 (18.6%) |
| 2 Vehicles | 1,036 (38.6%) | 1,125 (46.7%) |
| 3 Vehicles | 669 (24.9%) | 450 (18.7%) |
| 4 Vehicles | 359 (13.4%) | 238 (9.9%) |
| 5 or more Vehicles | 269 (10.0%) | 114 (4.7%) |
| Total | 2,682 (100.0%) | 2,407 (100.0%) |
Commute Time in Gloucester Point
The most frequently occuring commute durations in Gloucester Point are 30 to 34 minutes (1,103 commuters, 23.0%), 10 to 14 minutes (636 commuters, 13.3%), and 60 to 89 minutes (556 commuters, 11.6%).
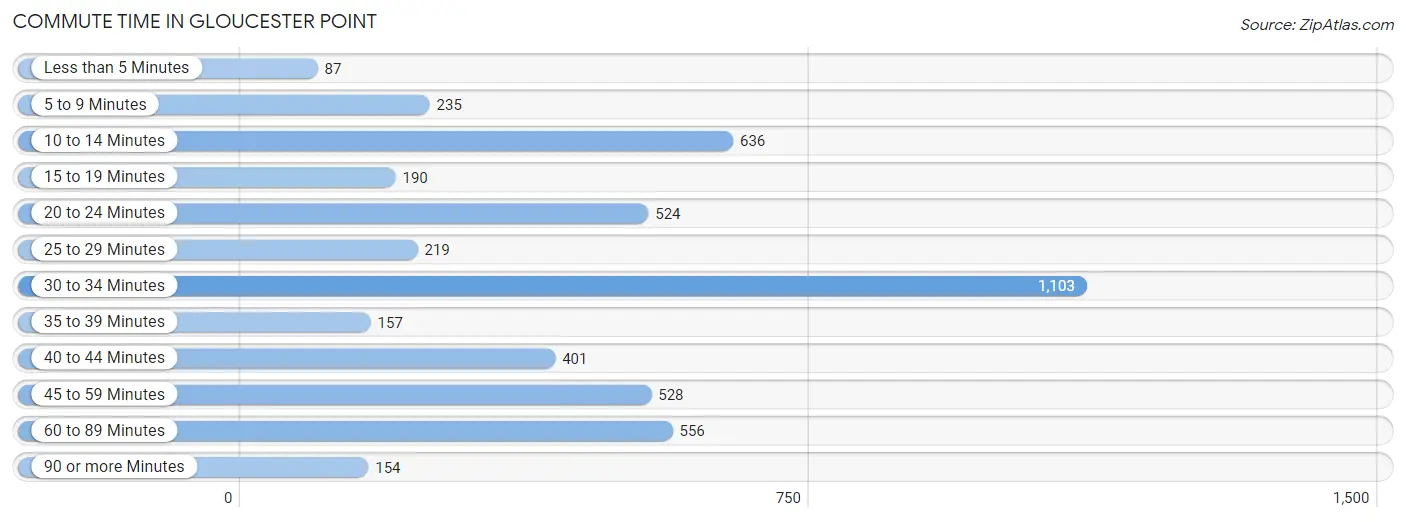
| Commute Time | # Commuters | % Commuters |
| Less than 5 Minutes | 87 | 1.8% |
| 5 to 9 Minutes | 235 | 4.9% |
| 10 to 14 Minutes | 636 | 13.3% |
| 15 to 19 Minutes | 190 | 4.0% |
| 20 to 24 Minutes | 524 | 10.9% |
| 25 to 29 Minutes | 219 | 4.6% |
| 30 to 34 Minutes | 1,103 | 23.0% |
| 35 to 39 Minutes | 157 | 3.3% |
| 40 to 44 Minutes | 401 | 8.4% |
| 45 to 59 Minutes | 528 | 11.0% |
| 60 to 89 Minutes | 556 | 11.6% |
| 90 or more Minutes | 154 | 3.2% |
Commute Time by Sex in Gloucester Point
The most common commute times in Gloucester Point are 60 to 89 minutes (508 commuters, 20.4%) for males and 30 to 34 minutes (618 commuters, 26.9%) for females.
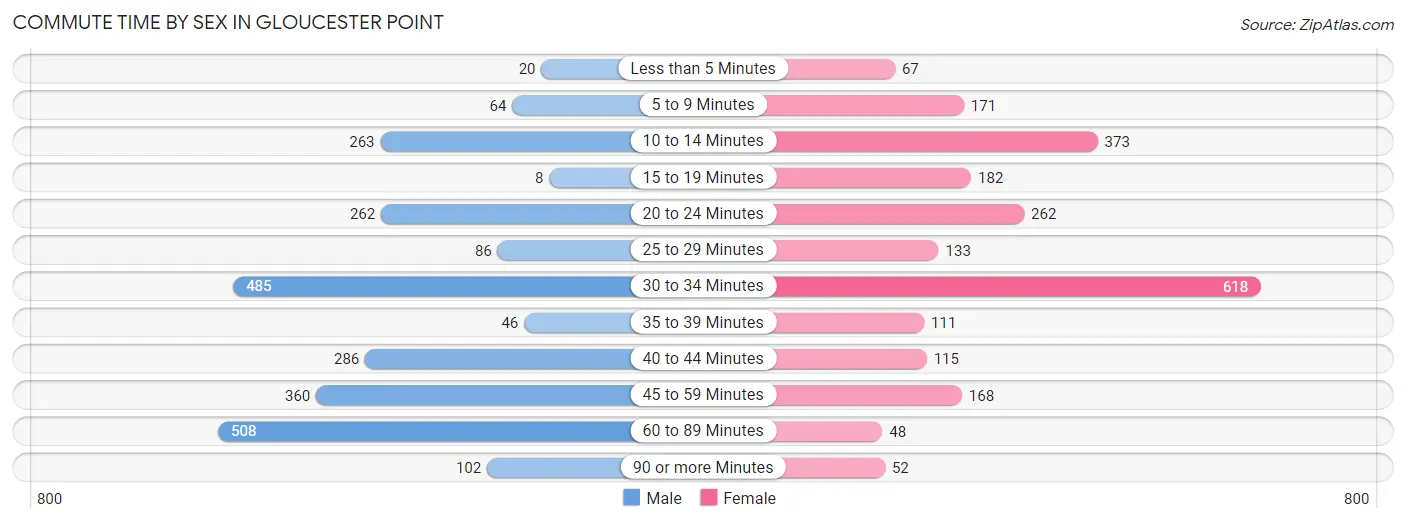
| Commute Time | Male | Female |
| Less than 5 Minutes | 20 (0.8%) | 67 (2.9%) |
| 5 to 9 Minutes | 64 (2.6%) | 171 (7.4%) |
| 10 to 14 Minutes | 263 (10.6%) | 373 (16.2%) |
| 15 to 19 Minutes | 8 (0.3%) | 182 (7.9%) |
| 20 to 24 Minutes | 262 (10.5%) | 262 (11.4%) |
| 25 to 29 Minutes | 86 (3.5%) | 133 (5.8%) |
| 30 to 34 Minutes | 485 (19.5%) | 618 (26.9%) |
| 35 to 39 Minutes | 46 (1.8%) | 111 (4.8%) |
| 40 to 44 Minutes | 286 (11.5%) | 115 (5.0%) |
| 45 to 59 Minutes | 360 (14.5%) | 168 (7.3%) |
| 60 to 89 Minutes | 508 (20.4%) | 48 (2.1%) |
| 90 or more Minutes | 102 (4.1%) | 52 (2.3%) |
Time of Departure to Work by Sex in Gloucester Point
The most frequent times of departure to work in Gloucester Point are 6:00 AM to 6:29 AM (402, 16.1%) for males and 7:00 AM to 7:29 AM (468, 20.3%) for females.
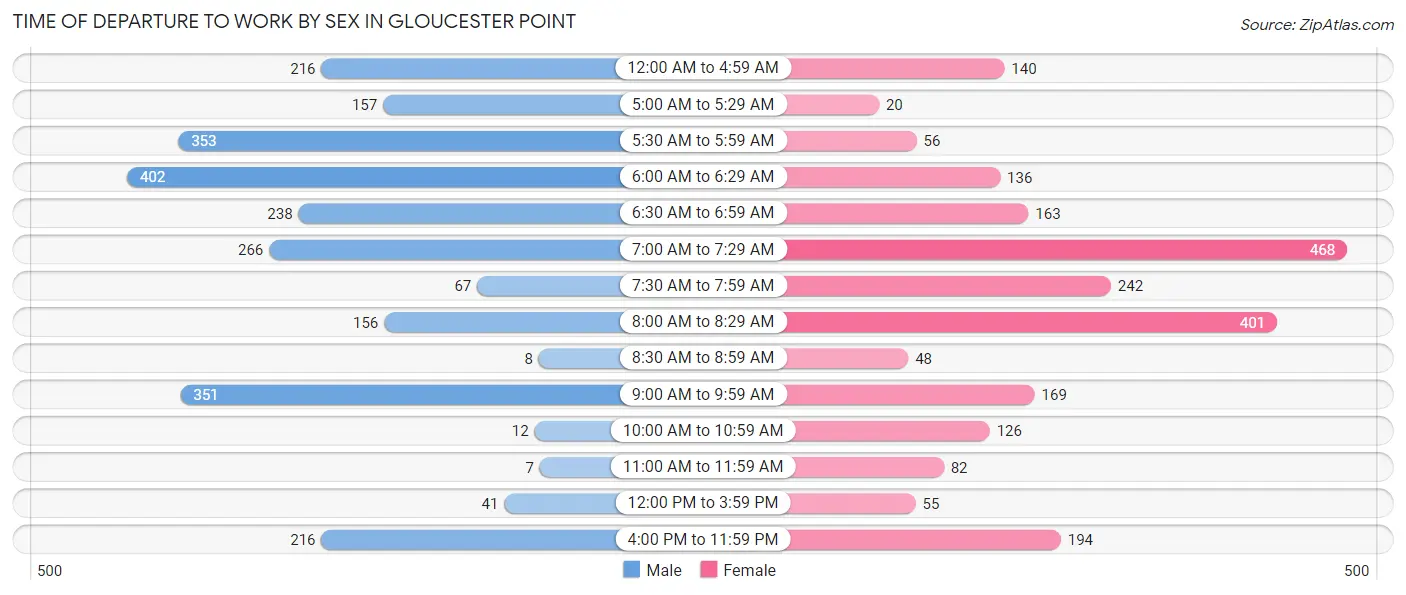
| Time of Departure | Male | Female |
| 12:00 AM to 4:59 AM | 216 (8.7%) | 140 (6.1%) |
| 5:00 AM to 5:29 AM | 157 (6.3%) | 20 (0.9%) |
| 5:30 AM to 5:59 AM | 353 (14.2%) | 56 (2.4%) |
| 6:00 AM to 6:29 AM | 402 (16.1%) | 136 (5.9%) |
| 6:30 AM to 6:59 AM | 238 (9.6%) | 163 (7.1%) |
| 7:00 AM to 7:29 AM | 266 (10.7%) | 468 (20.3%) |
| 7:30 AM to 7:59 AM | 67 (2.7%) | 242 (10.5%) |
| 8:00 AM to 8:29 AM | 156 (6.3%) | 401 (17.4%) |
| 8:30 AM to 8:59 AM | 8 (0.3%) | 48 (2.1%) |
| 9:00 AM to 9:59 AM | 351 (14.1%) | 169 (7.3%) |
| 10:00 AM to 10:59 AM | 12 (0.5%) | 126 (5.5%) |
| 11:00 AM to 11:59 AM | 7 (0.3%) | 82 (3.6%) |
| 12:00 PM to 3:59 PM | 41 (1.7%) | 55 (2.4%) |
| 4:00 PM to 11:59 PM | 216 (8.7%) | 194 (8.4%) |
| Total | 2,490 (100.0%) | 2,300 (100.0%) |
Housing Occupancy in Gloucester Point
Occupancy by Ownership in Gloucester Point
Of the total 4,288 dwellings in Gloucester Point, owner-occupied units account for 2,970 (69.3%), while renter-occupied units make up 1,318 (30.7%).
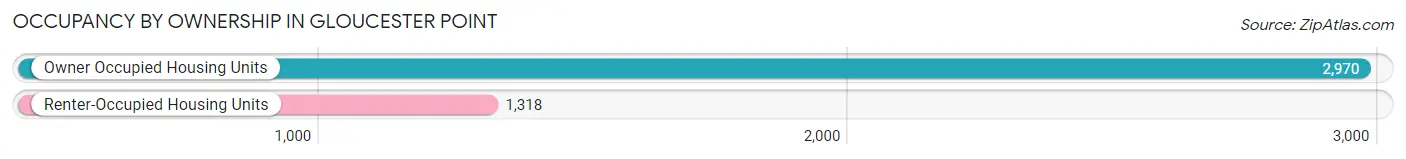
| Occupancy | # Housing Units | % Housing Units |
| Owner Occupied Housing Units | 2,970 | 69.3% |
| Renter-Occupied Housing Units | 1,318 | 30.7% |
| Total Occupied Housing Units | 4,288 | 100.0% |
Occupancy by Household Size in Gloucester Point
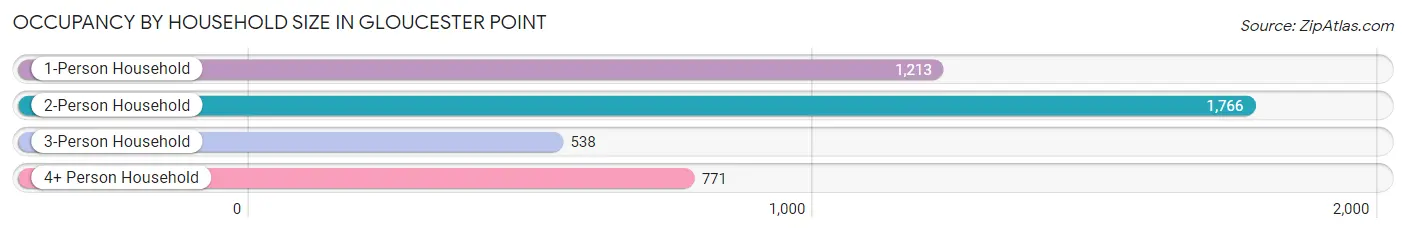
| Household Size | # Housing Units | % Housing Units |
| 1-Person Household | 1,213 | 28.3% |
| 2-Person Household | 1,766 | 41.2% |
| 3-Person Household | 538 | 12.6% |
| 4+ Person Household | 771 | 18.0% |
| Total Housing Units | 4,288 | 100.0% |
Occupancy by Ownership by Household Size in Gloucester Point
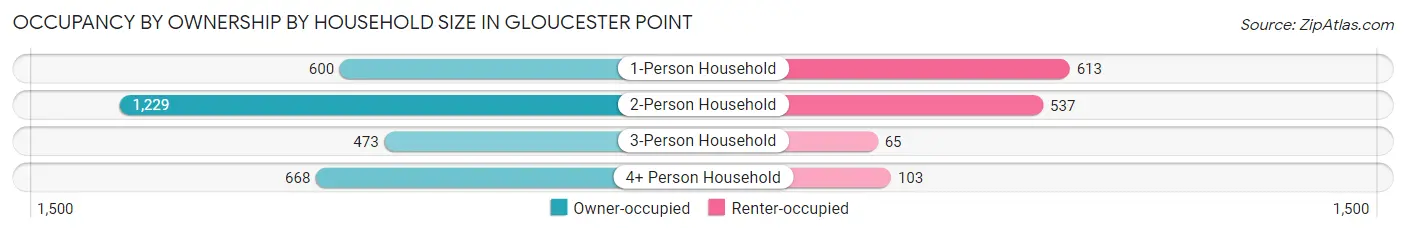
| Household Size | Owner-occupied | Renter-occupied |
| 1-Person Household | 600 (49.5%) | 613 (50.5%) |
| 2-Person Household | 1,229 (69.6%) | 537 (30.4%) |
| 3-Person Household | 473 (87.9%) | 65 (12.1%) |
| 4+ Person Household | 668 (86.6%) | 103 (13.4%) |
| Total Housing Units | 2,970 (69.3%) | 1,318 (30.7%) |
Occupancy by Educational Attainment in Gloucester Point
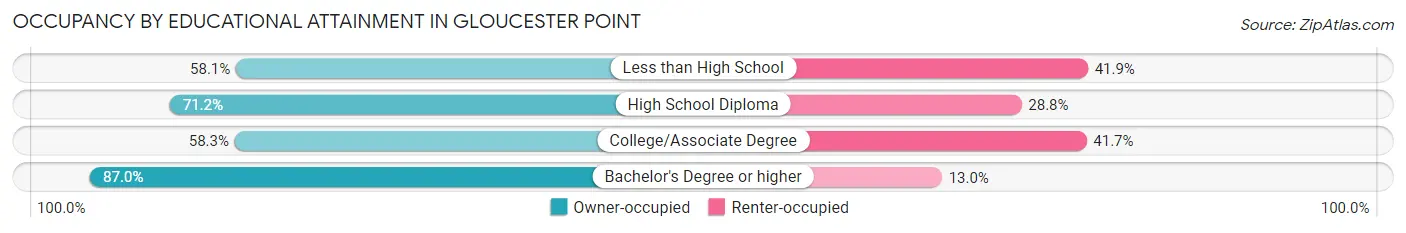
| Household Size | Owner-occupied | Renter-occupied |
| Less than High School | 252 (58.1%) | 182 (41.9%) |
| High School Diploma | 925 (71.2%) | 374 (28.8%) |
| College/Associate Degree | 875 (58.3%) | 625 (41.7%) |
| Bachelor's Degree or higher | 918 (87.0%) | 137 (13.0%) |
Occupancy by Age of Householder in Gloucester Point
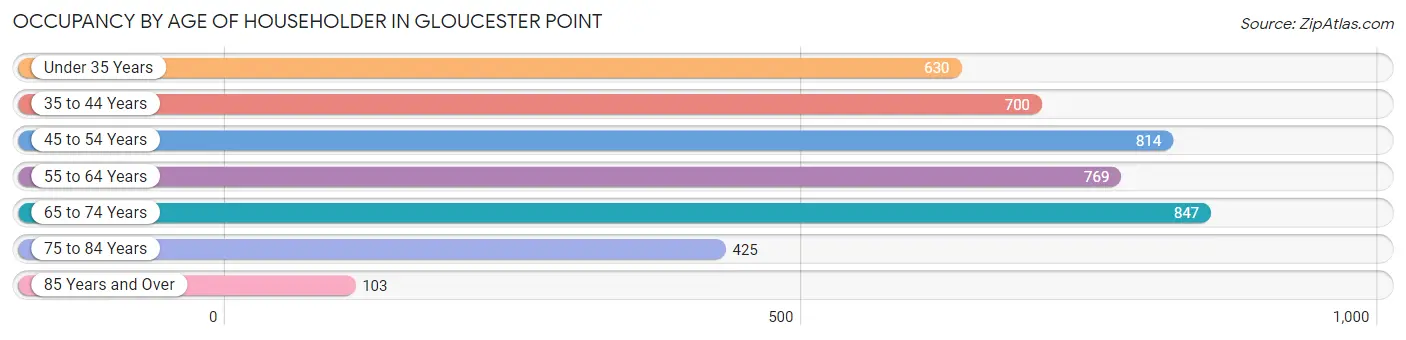
| Age Bracket | # Households | % Households |
| Under 35 Years | 630 | 14.7% |
| 35 to 44 Years | 700 | 16.3% |
| 45 to 54 Years | 814 | 19.0% |
| 55 to 64 Years | 769 | 17.9% |
| 65 to 74 Years | 847 | 19.8% |
| 75 to 84 Years | 425 | 9.9% |
| 85 Years and Over | 103 | 2.4% |
| Total | 4,288 | 100.0% |
Housing Finances in Gloucester Point
Median Income by Occupancy in Gloucester Point
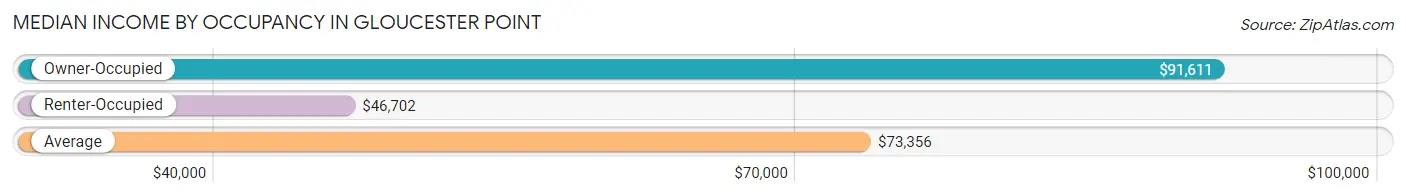
| Occupancy Type | # Households | Median Income |
| Owner-Occupied | 2,970 (69.3%) | $91,611 |
| Renter-Occupied | 1,318 (30.7%) | $46,702 |
| Average | 4,288 (100.0%) | $73,356 |
Occupancy by Householder Income Bracket in Gloucester Point
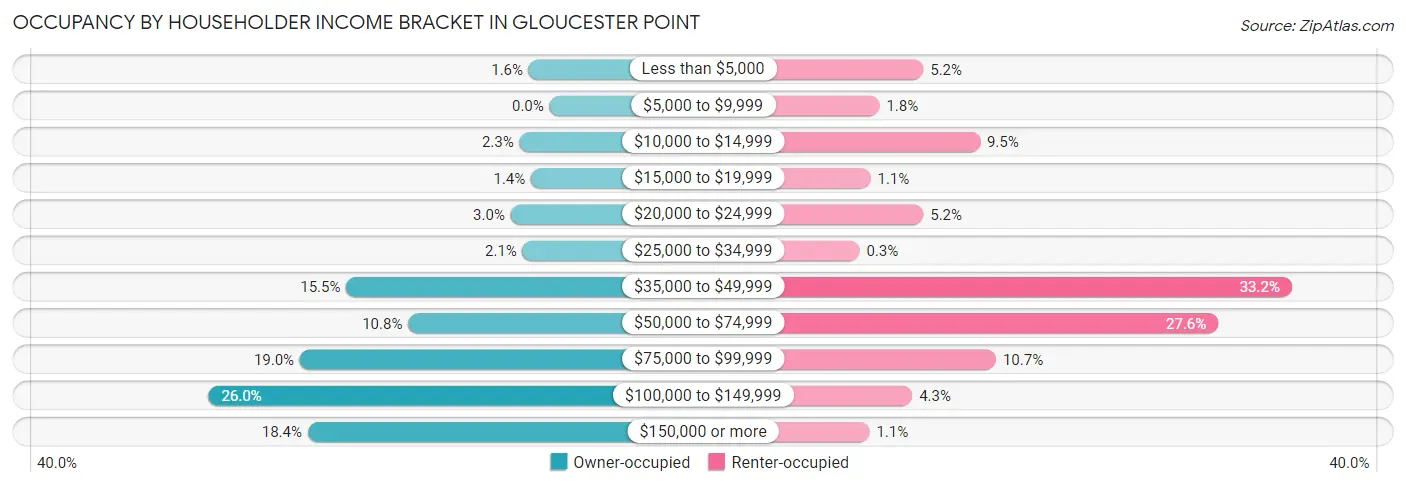
| Income Bracket | Owner-occupied | Renter-occupied |
| Less than $5,000 | 47 (1.6%) | 68 (5.2%) |
| $5,000 to $9,999 | 0 (0.0%) | 24 (1.8%) |
| $10,000 to $14,999 | 68 (2.3%) | 125 (9.5%) |
| $15,000 to $19,999 | 42 (1.4%) | 15 (1.1%) |
| $20,000 to $24,999 | 88 (3.0%) | 68 (5.2%) |
| $25,000 to $34,999 | 61 (2.1%) | 4 (0.3%) |
| $35,000 to $49,999 | 460 (15.5%) | 438 (33.2%) |
| $50,000 to $74,999 | 320 (10.8%) | 364 (27.6%) |
| $75,000 to $99,999 | 565 (19.0%) | 141 (10.7%) |
| $100,000 to $149,999 | 772 (26.0%) | 57 (4.3%) |
| $150,000 or more | 547 (18.4%) | 14 (1.1%) |
| Total | 2,970 (100.0%) | 1,318 (100.0%) |
Monthly Housing Cost Tiers in Gloucester Point
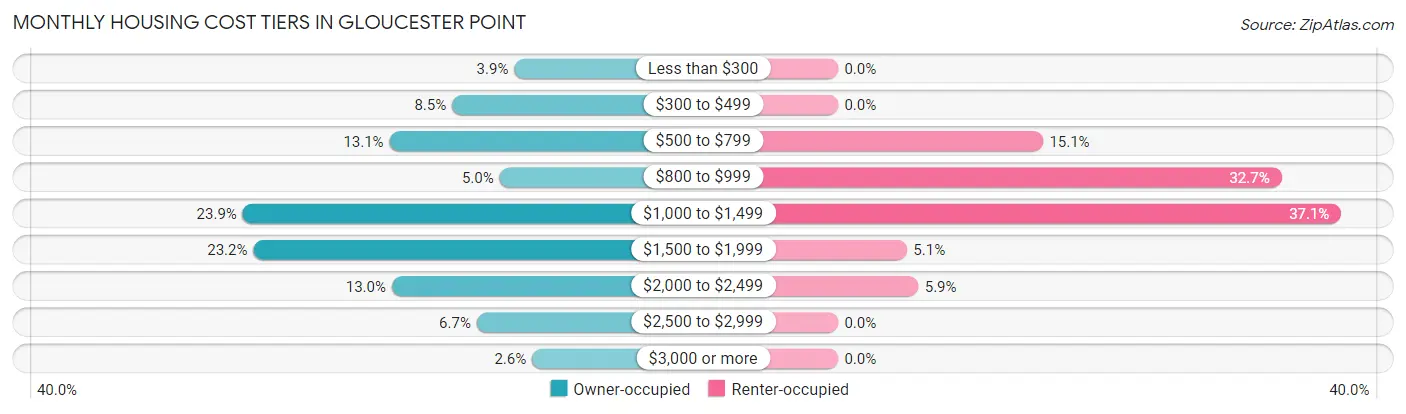
| Monthly Cost | Owner-occupied | Renter-occupied |
| Less than $300 | 117 (3.9%) | 0 (0.0%) |
| $300 to $499 | 253 (8.5%) | 0 (0.0%) |
| $500 to $799 | 390 (13.1%) | 199 (15.1%) |
| $800 to $999 | 149 (5.0%) | 431 (32.7%) |
| $1,000 to $1,499 | 711 (23.9%) | 489 (37.1%) |
| $1,500 to $1,999 | 688 (23.2%) | 67 (5.1%) |
| $2,000 to $2,499 | 385 (13.0%) | 78 (5.9%) |
| $2,500 to $2,999 | 199 (6.7%) | 0 (0.0%) |
| $3,000 or more | 78 (2.6%) | 0 (0.0%) |
| Total | 2,970 (100.0%) | 1,318 (100.0%) |
Physical Housing Characteristics in Gloucester Point
Housing Structures in Gloucester Point
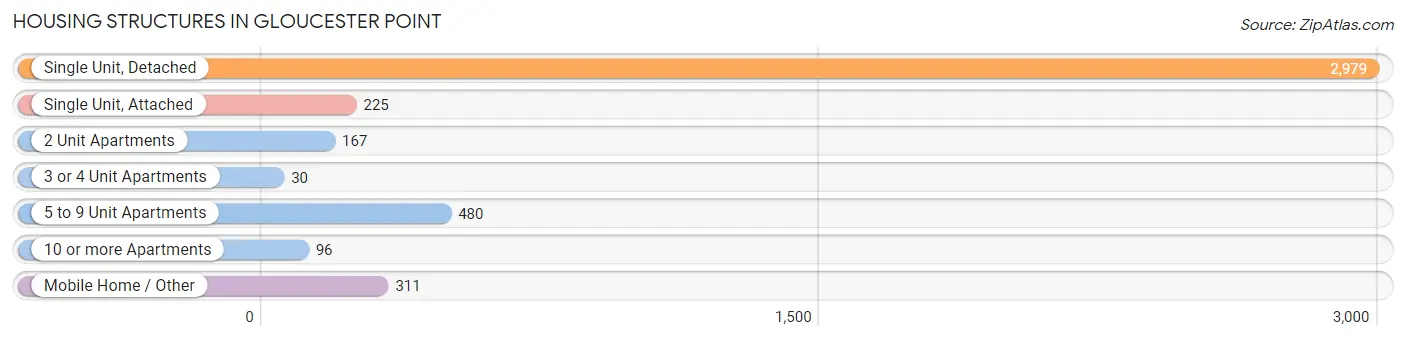
| Structure Type | # Housing Units | % Housing Units |
| Single Unit, Detached | 2,979 | 69.5% |
| Single Unit, Attached | 225 | 5.2% |
| 2 Unit Apartments | 167 | 3.9% |
| 3 or 4 Unit Apartments | 30 | 0.7% |
| 5 to 9 Unit Apartments | 480 | 11.2% |
| 10 or more Apartments | 96 | 2.2% |
| Mobile Home / Other | 311 | 7.2% |
| Total | 4,288 | 100.0% |
Housing Structures by Occupancy in Gloucester Point
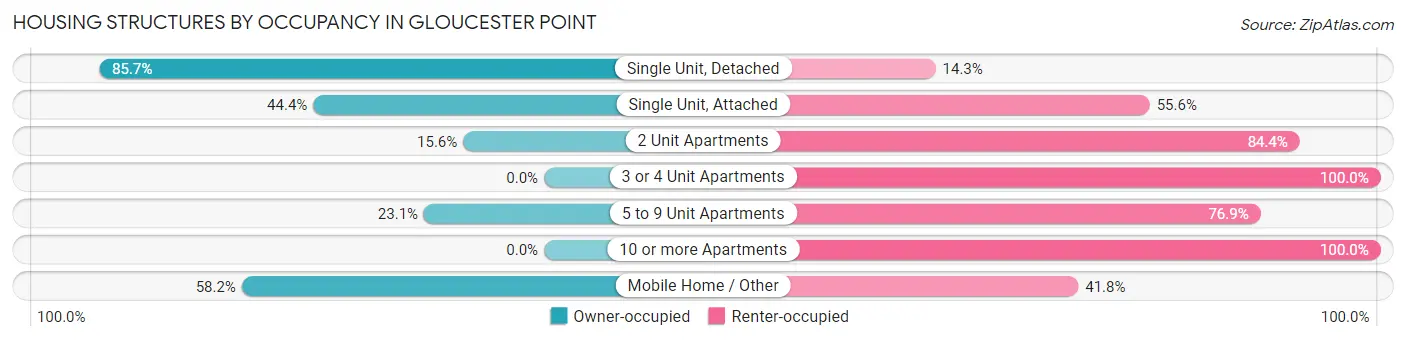
| Structure Type | Owner-occupied | Renter-occupied |
| Single Unit, Detached | 2,552 (85.7%) | 427 (14.3%) |
| Single Unit, Attached | 100 (44.4%) | 125 (55.6%) |
| 2 Unit Apartments | 26 (15.6%) | 141 (84.4%) |
| 3 or 4 Unit Apartments | 0 (0.0%) | 30 (100.0%) |
| 5 to 9 Unit Apartments | 111 (23.1%) | 369 (76.9%) |
| 10 or more Apartments | 0 (0.0%) | 96 (100.0%) |
| Mobile Home / Other | 181 (58.2%) | 130 (41.8%) |
| Total | 2,970 (69.3%) | 1,318 (30.7%) |
Housing Structures by Number of Rooms in Gloucester Point
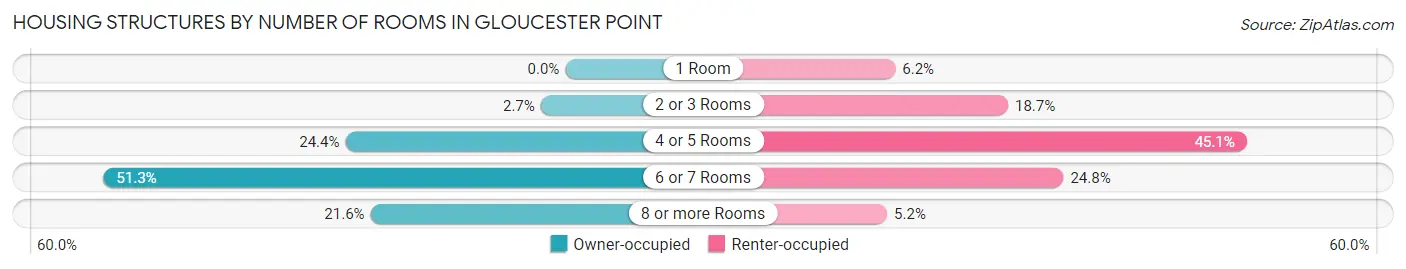
| Number of Rooms | Owner-occupied | Renter-occupied |
| 1 Room | 0 (0.0%) | 81 (6.1%) |
| 2 or 3 Rooms | 81 (2.7%) | 246 (18.7%) |
| 4 or 5 Rooms | 725 (24.4%) | 595 (45.1%) |
| 6 or 7 Rooms | 1,522 (51.2%) | 327 (24.8%) |
| 8 or more Rooms | 642 (21.6%) | 69 (5.2%) |
| Total | 2,970 (100.0%) | 1,318 (100.0%) |
Housing Structure by Heating Type in Gloucester Point
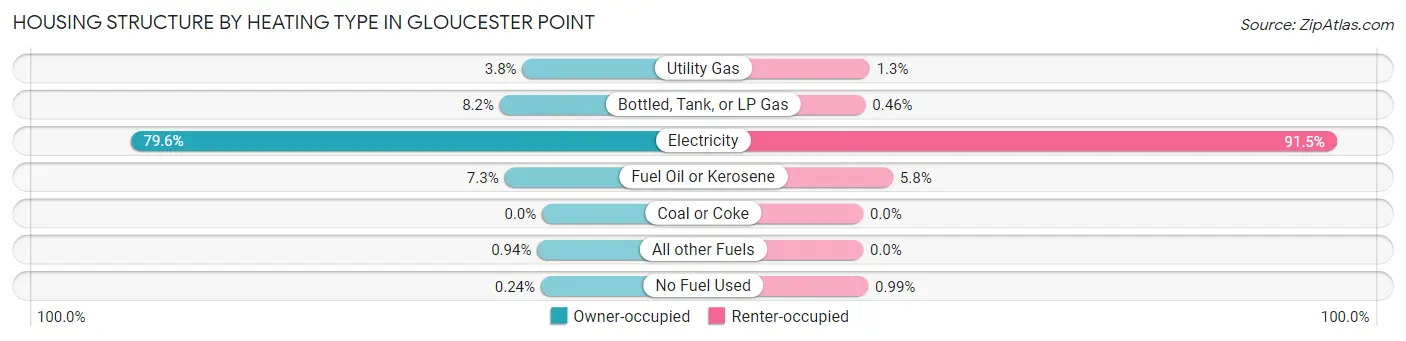
| Heating Type | Owner-occupied | Renter-occupied |
| Utility Gas | 113 (3.8%) | 17 (1.3%) |
| Bottled, Tank, or LP Gas | 243 (8.2%) | 6 (0.5%) |
| Electricity | 2,363 (79.6%) | 1,206 (91.5%) |
| Fuel Oil or Kerosene | 216 (7.3%) | 76 (5.8%) |
| Coal or Coke | 0 (0.0%) | 0 (0.0%) |
| All other Fuels | 28 (0.9%) | 0 (0.0%) |
| No Fuel Used | 7 (0.2%) | 13 (1.0%) |
| Total | 2,970 (100.0%) | 1,318 (100.0%) |
Household Vehicle Usage in Gloucester Point
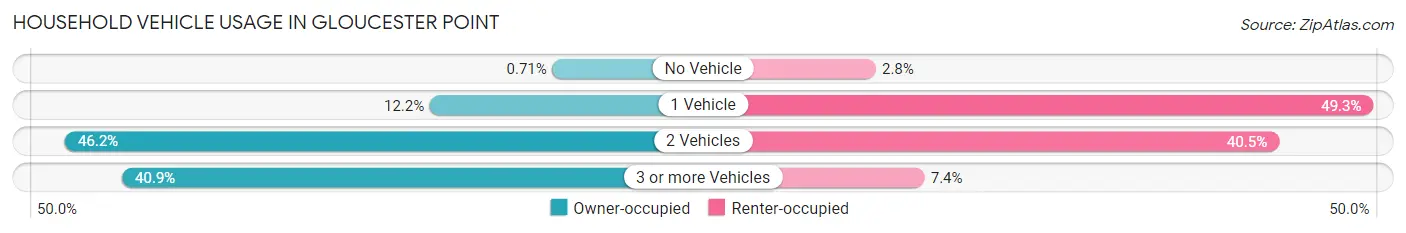
| Vehicles per Household | Owner-occupied | Renter-occupied |
| No Vehicle | 21 (0.7%) | 37 (2.8%) |
| 1 Vehicle | 361 (12.1%) | 650 (49.3%) |
| 2 Vehicles | 1,373 (46.2%) | 534 (40.5%) |
| 3 or more Vehicles | 1,215 (40.9%) | 97 (7.4%) |
| Total | 2,970 (100.0%) | 1,318 (100.0%) |
Real Estate & Mortgages in Gloucester Point
Real Estate and Mortgage Overview in Gloucester Point
| Characteristic | Without Mortgage | With Mortgage |
| Housing Units | 813 | 2,157 |
| Median Property Value | $276,200 | $279,100 |
| Median Household Income | $80,096 | $456 |
| Monthly Housing Costs | $524 | $78 |
| Real Estate Taxes | $1,816 | $88 |
Property Value by Mortgage Status in Gloucester Point
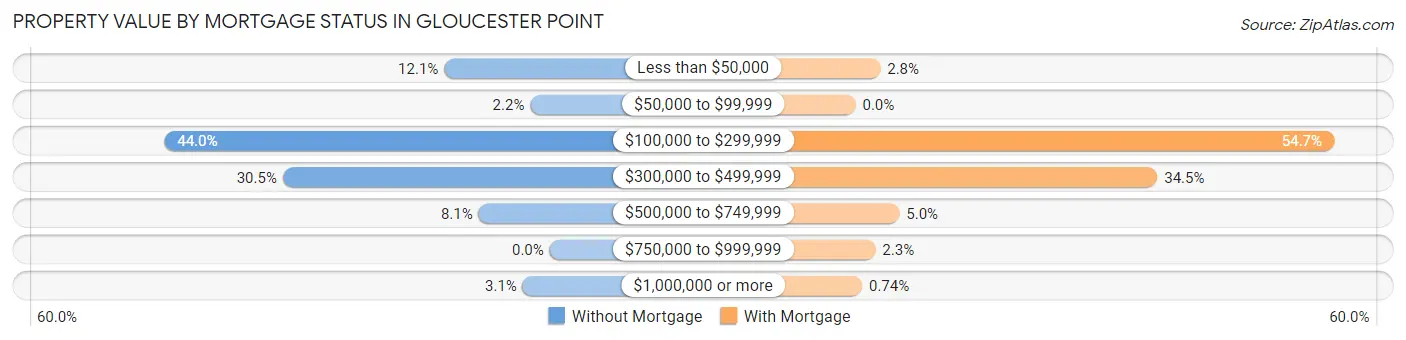
| Property Value | Without Mortgage | With Mortgage |
| Less than $50,000 | 98 (12.0%) | 61 (2.8%) |
| $50,000 to $99,999 | 18 (2.2%) | 0 (0.0%) |
| $100,000 to $299,999 | 358 (44.0%) | 1,179 (54.7%) |
| $300,000 to $499,999 | 248 (30.5%) | 744 (34.5%) |
| $500,000 to $749,999 | 66 (8.1%) | 108 (5.0%) |
| $750,000 to $999,999 | 0 (0.0%) | 49 (2.3%) |
| $1,000,000 or more | 25 (3.1%) | 16 (0.7%) |
| Total | 813 (100.0%) | 2,157 (100.0%) |
Household Income by Mortgage Status in Gloucester Point
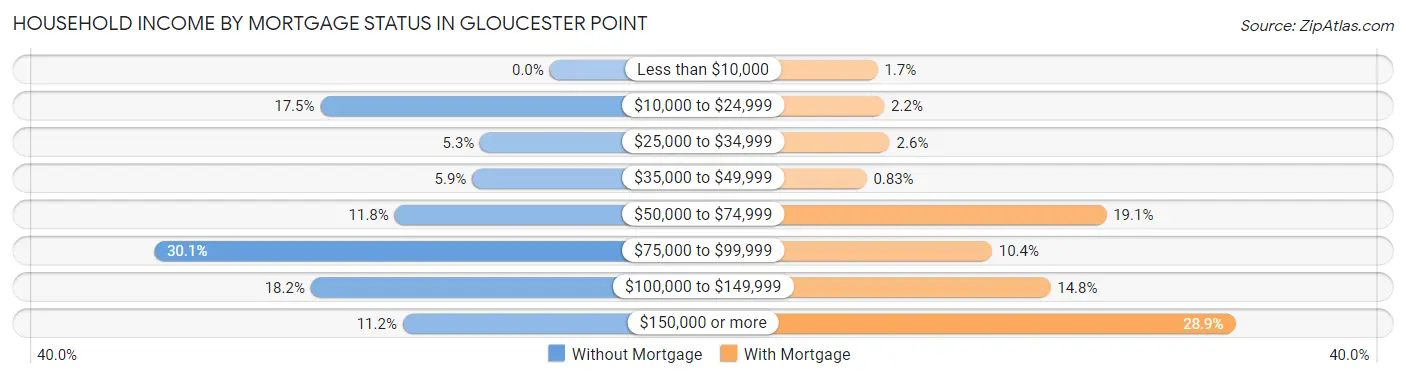
| Household Income | Without Mortgage | With Mortgage |
| Less than $10,000 | 0 (0.0%) | 36 (1.7%) |
| $10,000 to $24,999 | 142 (17.5%) | 47 (2.2%) |
| $25,000 to $34,999 | 43 (5.3%) | 56 (2.6%) |
| $35,000 to $49,999 | 48 (5.9%) | 18 (0.8%) |
| $50,000 to $74,999 | 96 (11.8%) | 412 (19.1%) |
| $75,000 to $99,999 | 245 (30.1%) | 224 (10.4%) |
| $100,000 to $149,999 | 148 (18.2%) | 320 (14.8%) |
| $150,000 or more | 91 (11.2%) | 624 (28.9%) |
| Total | 813 (100.0%) | 2,157 (100.0%) |
Property Value to Household Income Ratio in Gloucester Point
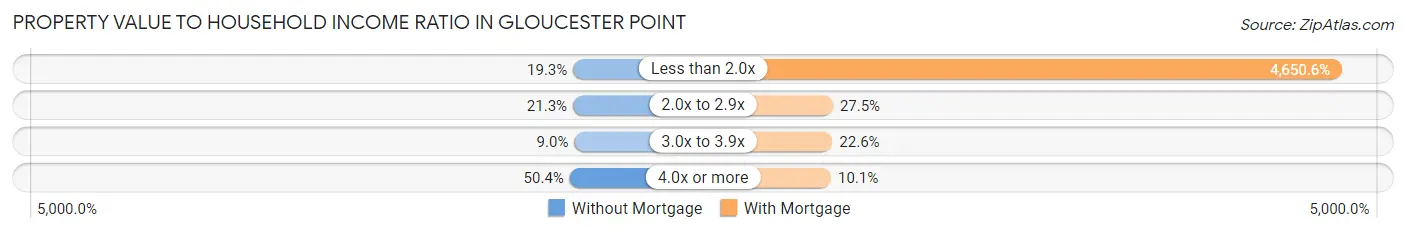
| Value-to-Income Ratio | Without Mortgage | With Mortgage |
| Less than 2.0x | 157 (19.3%) | 100,313 (4,650.6%) |
| 2.0x to 2.9x | 173 (21.3%) | 594 (27.5%) |
| 3.0x to 3.9x | 73 (9.0%) | 488 (22.6%) |
| 4.0x or more | 410 (50.4%) | 217 (10.1%) |
| Total | 813 (100.0%) | 2,157 (100.0%) |
Real Estate Taxes by Mortgage Status in Gloucester Point
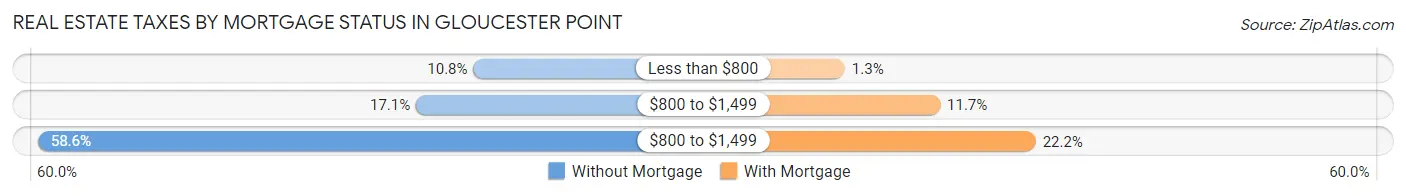
| Property Taxes | Without Mortgage | With Mortgage |
| Less than $800 | 88 (10.8%) | 28 (1.3%) |
| $800 to $1,499 | 139 (17.1%) | 253 (11.7%) |
| $800 to $1,499 | 476 (58.6%) | 479 (22.2%) |
| Total | 813 (100.0%) | 2,157 (100.0%) |
Health & Disability in Gloucester Point
Health Insurance Coverage by Age in Gloucester Point
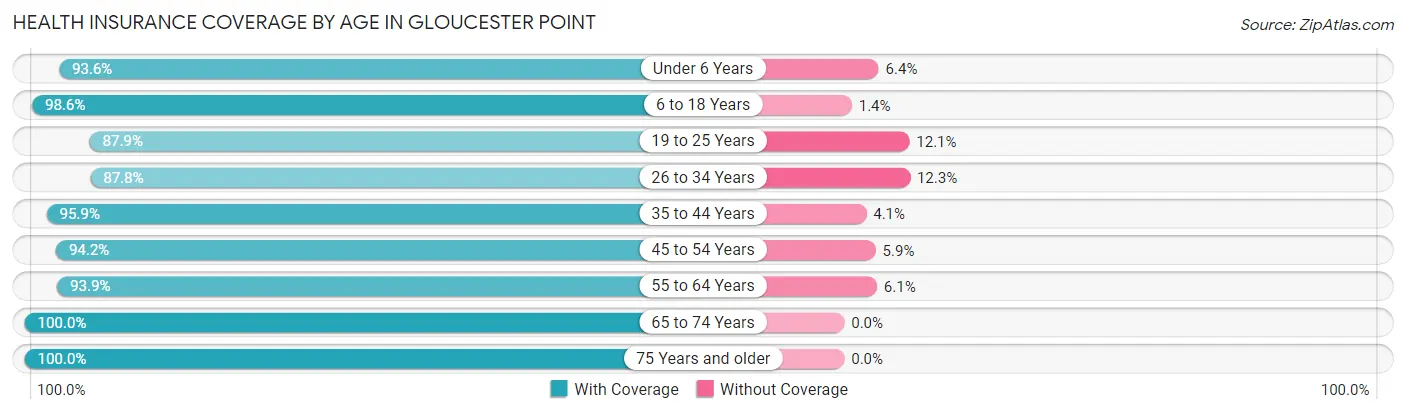
| Age Bracket | With Coverage | Without Coverage |
| Under 6 Years | 569 (93.6%) | 39 (6.4%) |
| 6 to 18 Years | 1,834 (98.6%) | 26 (1.4%) |
| 19 to 25 Years | 768 (87.9%) | 106 (12.1%) |
| 26 to 34 Years | 1,046 (87.7%) | 146 (12.2%) |
| 35 to 44 Years | 1,052 (95.9%) | 45 (4.1%) |
| 45 to 54 Years | 1,528 (94.2%) | 95 (5.9%) |
| 55 to 64 Years | 1,375 (93.9%) | 89 (6.1%) |
| 65 to 74 Years | 1,327 (100.0%) | 0 (0.0%) |
| 75 Years and older | 783 (100.0%) | 0 (0.0%) |
| Total | 10,282 (95.0%) | 546 (5.0%) |
Health Insurance Coverage by Citizenship Status in Gloucester Point
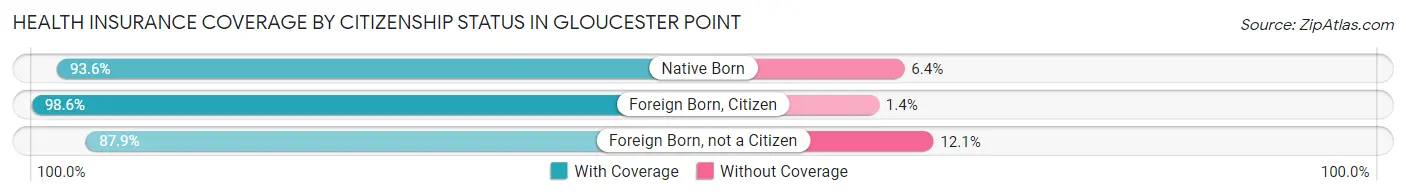
| Citizenship Status | With Coverage | Without Coverage |
| Native Born | 569 (93.6%) | 39 (6.4%) |
| Foreign Born, Citizen | 1,834 (98.6%) | 26 (1.4%) |
| Foreign Born, not a Citizen | 768 (87.9%) | 106 (12.1%) |
Health Insurance Coverage by Household Income in Gloucester Point
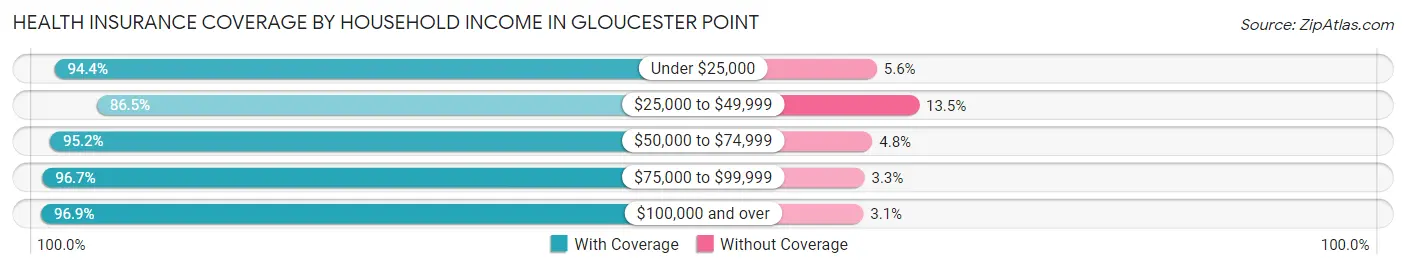
| Household Income | With Coverage | Without Coverage |
| Under $25,000 | 1,039 (94.4%) | 62 (5.6%) |
| $25,000 to $49,999 | 1,227 (86.5%) | 192 (13.5%) |
| $50,000 to $74,999 | 1,731 (95.2%) | 87 (4.8%) |
| $75,000 to $99,999 | 1,600 (96.7%) | 55 (3.3%) |
| $100,000 and over | 4,685 (96.9%) | 150 (3.1%) |
Public vs Private Health Insurance Coverage by Age in Gloucester Point
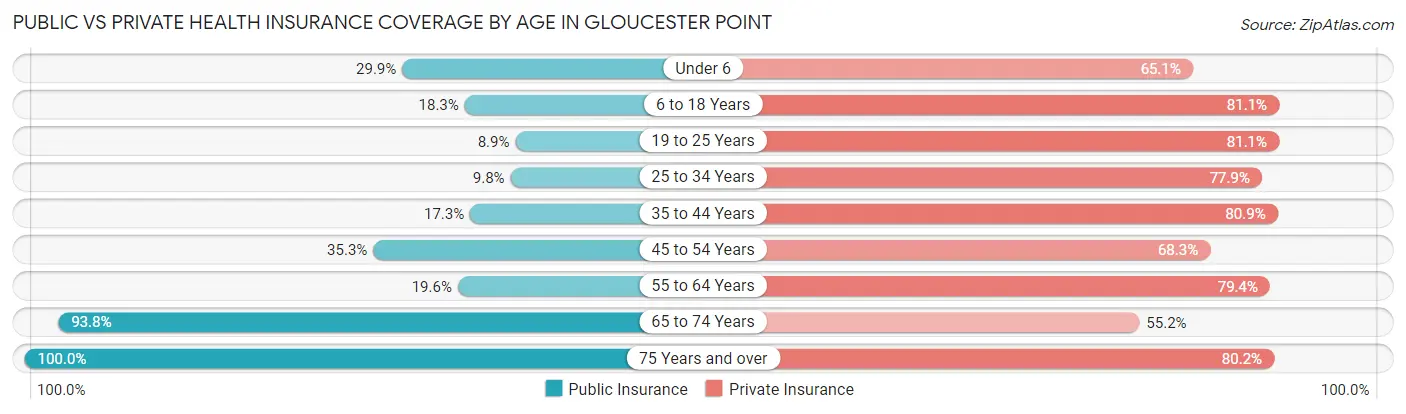
| Age Bracket | Public Insurance | Private Insurance |
| Under 6 | 182 (29.9%) | 396 (65.1%) |
| 6 to 18 Years | 341 (18.3%) | 1,509 (81.1%) |
| 19 to 25 Years | 78 (8.9%) | 709 (81.1%) |
| 25 to 34 Years | 117 (9.8%) | 929 (77.9%) |
| 35 to 44 Years | 190 (17.3%) | 887 (80.9%) |
| 45 to 54 Years | 573 (35.3%) | 1,109 (68.3%) |
| 55 to 64 Years | 287 (19.6%) | 1,163 (79.4%) |
| 65 to 74 Years | 1,244 (93.8%) | 733 (55.2%) |
| 75 Years and over | 783 (100.0%) | 628 (80.2%) |
| Total | 3,795 (35.0%) | 8,063 (74.5%) |
Disability Status by Sex by Age in Gloucester Point
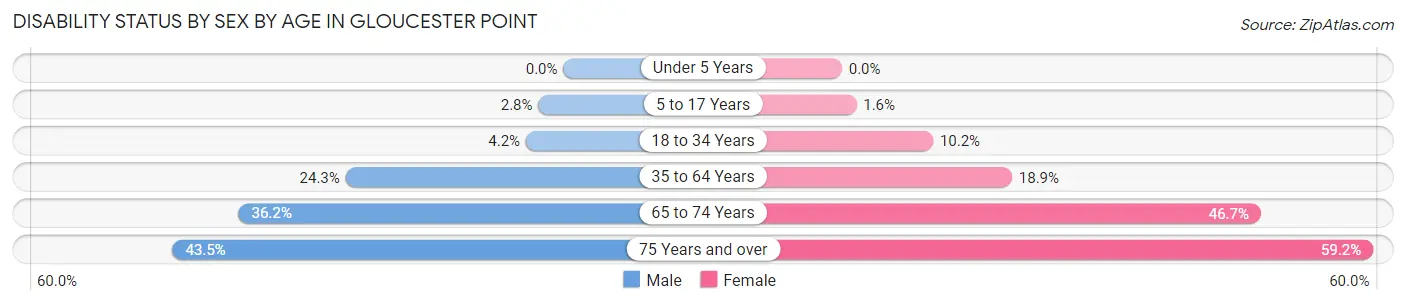
| Age Bracket | Male | Female |
| Under 5 Years | 0 (0.0%) | 0 (0.0%) |
| 5 to 17 Years | 25 (2.8%) | 14 (1.6%) |
| 18 to 34 Years | 47 (4.2%) | 113 (10.2%) |
| 35 to 64 Years | 436 (24.2%) | 452 (18.9%) |
| 65 to 74 Years | 204 (36.2%) | 356 (46.7%) |
| 75 Years and over | 101 (43.5%) | 326 (59.2%) |
Disability Class by Sex by Age in Gloucester Point
Disability Class: Hearing Difficulty
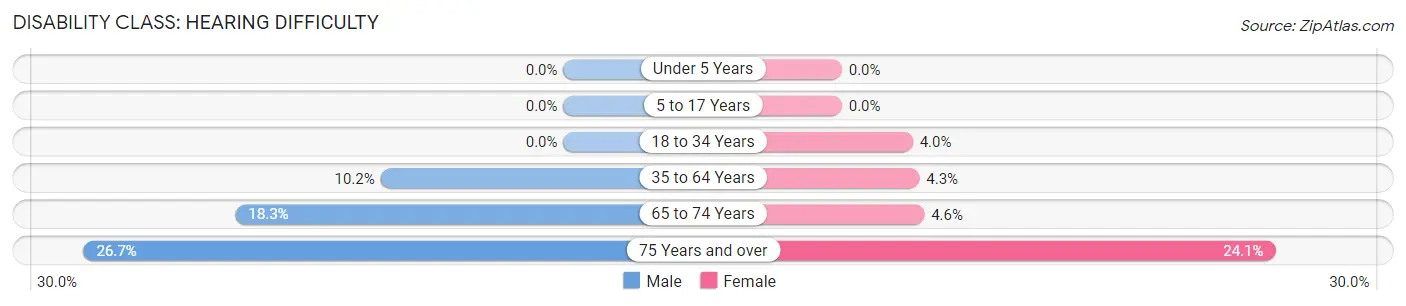
| Age Bracket | Male | Female |
| Under 5 Years | 0 (0.0%) | 0 (0.0%) |
| 5 to 17 Years | 0 (0.0%) | 0 (0.0%) |
| 18 to 34 Years | 0 (0.0%) | 44 (4.0%) |
| 35 to 64 Years | 183 (10.2%) | 103 (4.3%) |
| 65 to 74 Years | 103 (18.3%) | 35 (4.6%) |
| 75 Years and over | 62 (26.7%) | 133 (24.1%) |
Disability Class: Vision Difficulty
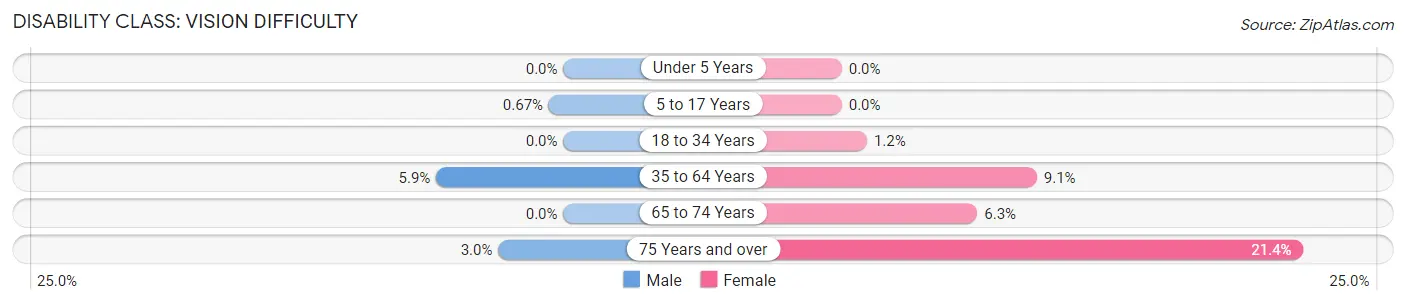
| Age Bracket | Male | Female |
| Under 5 Years | 0 (0.0%) | 0 (0.0%) |
| 5 to 17 Years | 6 (0.7%) | 0 (0.0%) |
| 18 to 34 Years | 0 (0.0%) | 13 (1.2%) |
| 35 to 64 Years | 106 (5.9%) | 216 (9.0%) |
| 65 to 74 Years | 0 (0.0%) | 48 (6.3%) |
| 75 Years and over | 7 (3.0%) | 118 (21.4%) |
Disability Class: Cognitive Difficulty
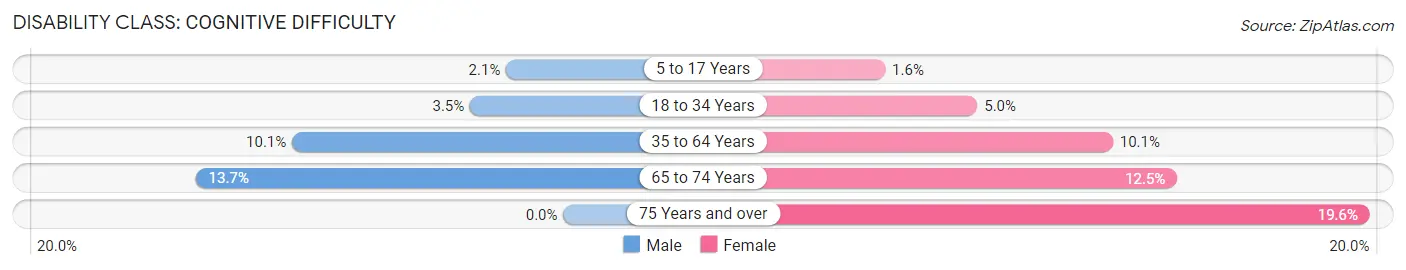
| Age Bracket | Male | Female |
| 5 to 17 Years | 19 (2.1%) | 14 (1.6%) |
| 18 to 34 Years | 39 (3.5%) | 56 (5.0%) |
| 35 to 64 Years | 181 (10.1%) | 240 (10.1%) |
| 65 to 74 Years | 77 (13.7%) | 95 (12.4%) |
| 75 Years and over | 0 (0.0%) | 108 (19.6%) |
Disability Class: Ambulatory Difficulty
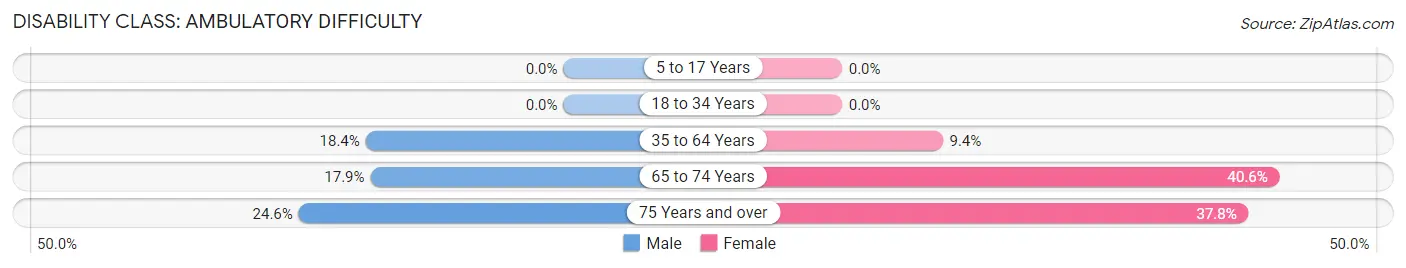
| Age Bracket | Male | Female |
| 5 to 17 Years | 0 (0.0%) | 0 (0.0%) |
| 18 to 34 Years | 0 (0.0%) | 0 (0.0%) |
| 35 to 64 Years | 330 (18.3%) | 223 (9.3%) |
| 65 to 74 Years | 101 (17.9%) | 310 (40.6%) |
| 75 Years and over | 57 (24.6%) | 208 (37.8%) |
Disability Class: Self-Care Difficulty
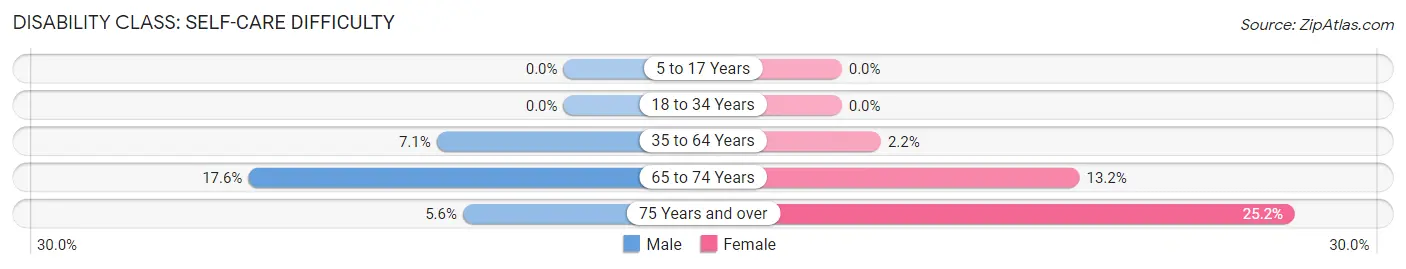
| Age Bracket | Male | Female |
| 5 to 17 Years | 0 (0.0%) | 0 (0.0%) |
| 18 to 34 Years | 0 (0.0%) | 0 (0.0%) |
| 35 to 64 Years | 127 (7.1%) | 52 (2.2%) |
| 65 to 74 Years | 99 (17.5%) | 101 (13.2%) |
| 75 Years and over | 13 (5.6%) | 139 (25.2%) |
Technology Access in Gloucester Point
Computing Device Access in Gloucester Point
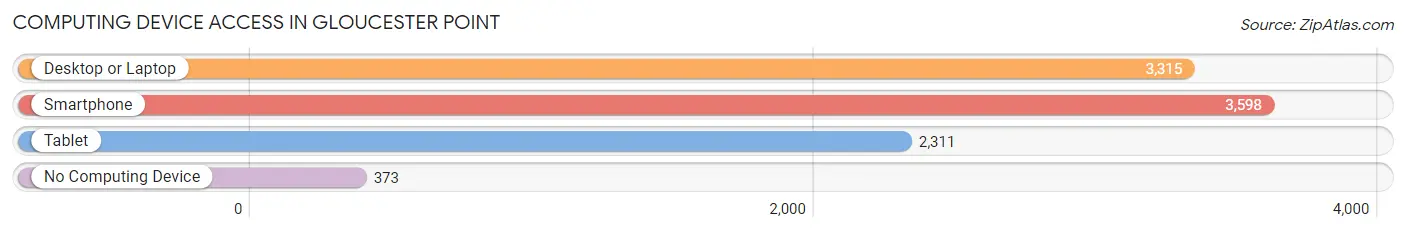
| Device Type | # Households | % Households |
| Desktop or Laptop | 3,315 | 77.3% |
| Smartphone | 3,598 | 83.9% |
| Tablet | 2,311 | 53.9% |
| No Computing Device | 373 | 8.7% |
| Total | 4,288 | 100.0% |
Internet Access in Gloucester Point

| Internet Type | # Households | % Households |
| Dial-Up Internet | 29 | 0.7% |
| Broadband Home | 3,349 | 78.1% |
| Cellular Data Only | 301 | 7.0% |
| Satellite Internet | 164 | 3.8% |
| No Internet | 543 | 12.7% |
| Total | 4,288 | 100.0% |
Gloucester Point Summary
Gloucester Point is a small unincorporated community located in Gloucester County, Virginia. It is situated on the north bank of the York River, across from the city of Yorktown. The community is part of the Hampton Roads metropolitan area and is located approximately 20 miles east of Williamsburg and 30 miles north of Norfolk.
History
Gloucester Point has a long and storied history. The area was first settled by English colonists in the early 1600s. The area was originally known as “Cockletown” and was part of the larger Gloucester County. In 1781, during the American Revolutionary War, the area was the site of a major battle between the British and American forces. The British were ultimately defeated and the area was renamed “Gloucester Point” in honor of the victory.
In the 19th century, Gloucester Point became a popular summer resort destination for wealthy Virginians. The area was known for its beautiful scenery and its proximity to the York River. In the late 19th century, the area was home to a number of large estates, including the estate of Confederate General Robert E. Lee.
In the early 20th century, Gloucester Point became a popular destination for fishing and crabbing. The area was also home to a number of oyster beds, which were harvested for their pearls.
Geography
Gloucester Point is located in the southeastern corner of Gloucester County, Virginia. It is situated on the north bank of the York River, across from the city of Yorktown. The community is part of the Hampton Roads metropolitan area and is located approximately 20 miles east of Williamsburg and 30 miles north of Norfolk.
The area is characterized by flat terrain and is located in the Coastal Plain physiographic region. The climate is humid subtropical, with hot, humid summers and mild winters. The average annual temperature is around 60 degrees Fahrenheit.
Economy
The economy of Gloucester Point is largely based on tourism and fishing. The area is home to a number of popular tourist attractions, including the Yorktown Battlefield, the Yorktown Victory Monument, and the Gloucester Point Beach Park. The area is also home to a number of marinas and boat ramps, which attract visitors from all over the region.
The area is also home to a number of commercial fishing operations. The York River is home to a variety of fish species, including striped bass, bluefish, and flounder. The area is also home to a number of oyster beds, which are harvested for their pearls.
Demographics
As of the 2010 census, the population of Gloucester Point was 1,845. The racial makeup of the community was 94.3% White, 2.7% African American, 0.7% Native American, 0.5% Asian, 0.2% Pacific Islander, and 1.6% from other races. The median household income was $50,938, and the median family income was $60,938. The per capita income was $25,938.
Conclusion
Gloucester Point is a small unincorporated community located in Gloucester County, Virginia. It is situated on the north bank of the York River, across from the city of Yorktown. The community is part of the Hampton Roads metropolitan area and is located approximately 20 miles east of Williamsburg and 30 miles north of Norfolk. The area has a long and storied history and is characterized by flat terrain and a humid subtropical climate. The economy of Gloucester Point is largely based on tourism and fishing, and the population of the community was 1,845 as of the 2010 census.
Common Questions
What is Per Capita Income in Gloucester Point?
Per Capita income in Gloucester Point is $34,391.
What is the Median Family Income in Gloucester Point?
Median Family Income in Gloucester Point is $91,640.
What is the Median Household income in Gloucester Point?
Median Household Income in Gloucester Point is $73,356.
What is Income or Wage Gap in Gloucester Point?
Income or Wage Gap in Gloucester Point is 34.8%.
Women in Gloucester Point earn 65.2 cents for every dollar earned by a man.
What is Inequality or Gini Index in Gloucester Point?
Inequality or Gini Index in Gloucester Point is 0.40.
What is the Total Population of Gloucester Point?
Total Population of Gloucester Point is 11,016.
What is the Total Male Population of Gloucester Point?
Total Male Population of Gloucester Point is 4,981.
What is the Total Female Population of Gloucester Point?
Total Female Population of Gloucester Point is 6,035.
What is the Ratio of Males per 100 Females in Gloucester Point?
There are 82.54 Males per 100 Females in Gloucester Point.
What is the Ratio of Females per 100 Males in Gloucester Point?
There are 121.16 Females per 100 Males in Gloucester Point.
What is the Median Population Age in Gloucester Point?
Median Population Age in Gloucester Point is 40.4 Years.
What is the Average Family Size in Gloucester Point
Average Family Size in Gloucester Point is 3.2 People.
What is the Average Household Size in Gloucester Point
Average Household Size in Gloucester Point is 2.6 People.
How Large is the Labor Force in Gloucester Point?
There are 5,319 People in the Labor Forcein in Gloucester Point.
What is the Percentage of People in the Labor Force in Gloucester Point?
60.4% of People are in the Labor Force in Gloucester Point.
What is the Unemployment Rate in Gloucester Point?
Unemployment Rate in Gloucester Point is 4.5%.