Southampton Meadows, VA Map & Demographics
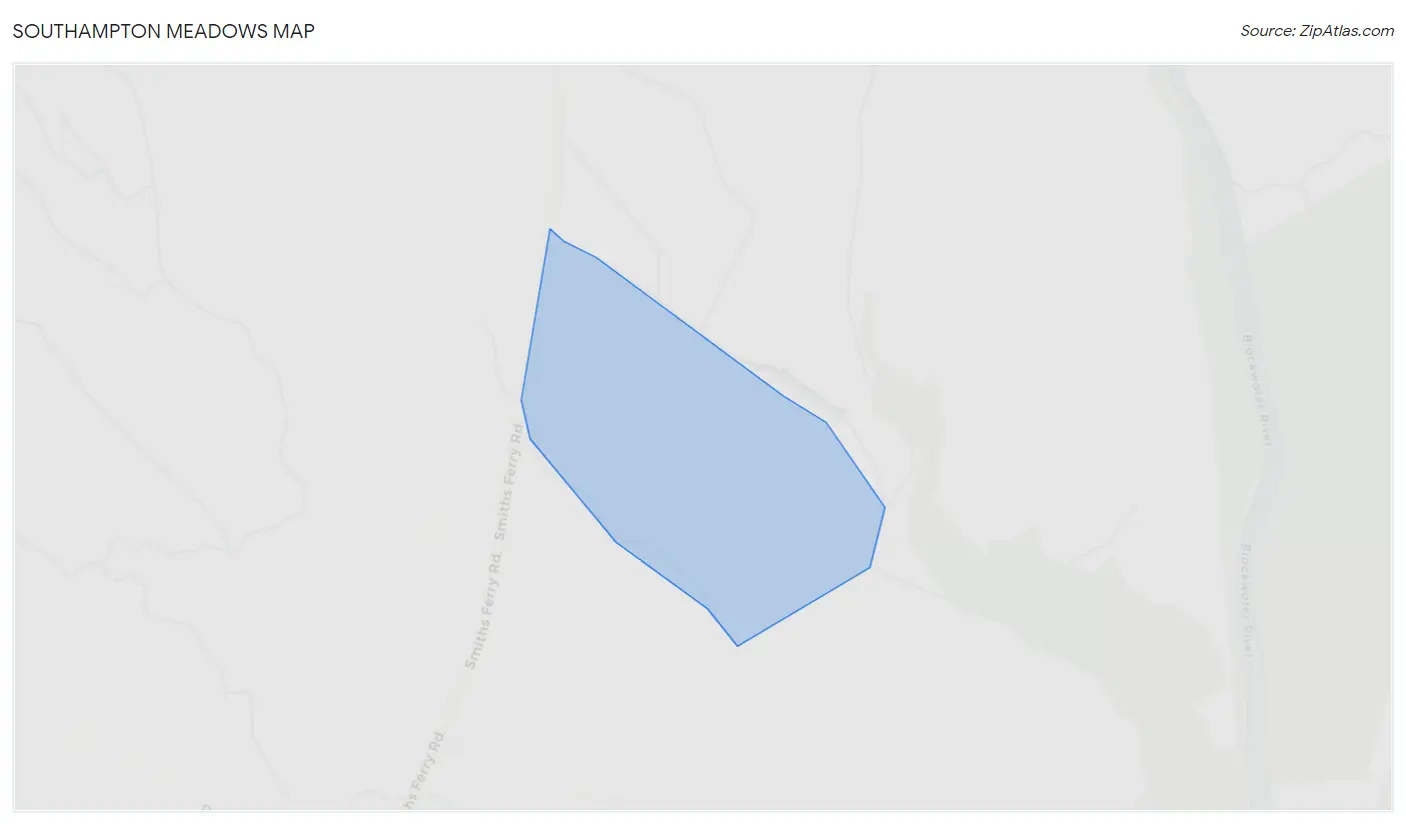
Southampton Meadows Map
Southampton Meadows Overview
$12,128
PER CAPITA INCOME
$50,102
AVG FAMILY INCOME
$43,882
AVG HOUSEHOLD INCOME
0.11
INEQUALITY / GINI INDEX
479
TOTAL POPULATION
182
MALE POPULATION
297
FEMALE POPULATION
61.28
MALES / 100 FEMALES
163.19
FEMALES / 100 MALES
34.4
MEDIAN AGE
3.4
AVG FAMILY SIZE
3.6
AVG HOUSEHOLD SIZE
133
LABOR FORCE [ PEOPLE ]
40.3%
PERCENT IN LABOR FORCE
64.7%
UNEMPLOYMENT RATE
Income in Southampton Meadows
Income Overview in Southampton Meadows
Per Capita Income in Southampton Meadows is $12,128, while median incomes of families and households are $50,102 and $43,882 respectively.
| Characteristic | Number | Measure |
| Per Capita Income | 479 | $12,128 |
| Median Family Income | 94 | $50,102 |
| Mean Family Income | 94 | $40,861 |
| Median Household Income | 132 | $43,882 |
| Mean Household Income | 132 | $42,147 |
| Income Deficit | 94 | $0 |
| Wage / Income Gap (%) | 479 | 0.00% |
| Wage / Income Gap ($) | 479 | 100.00¢ per $1 |
| Gini / Inequality Index | 479 | 0.11 |
Earnings by Sex in Southampton Meadows
| Sex | Number | Average Earnings |
| Male | 64 (40.5%) | $0 |
| Female | 94 (59.5%) | $0 |
| Total | 158 (100.0%) | $0 |
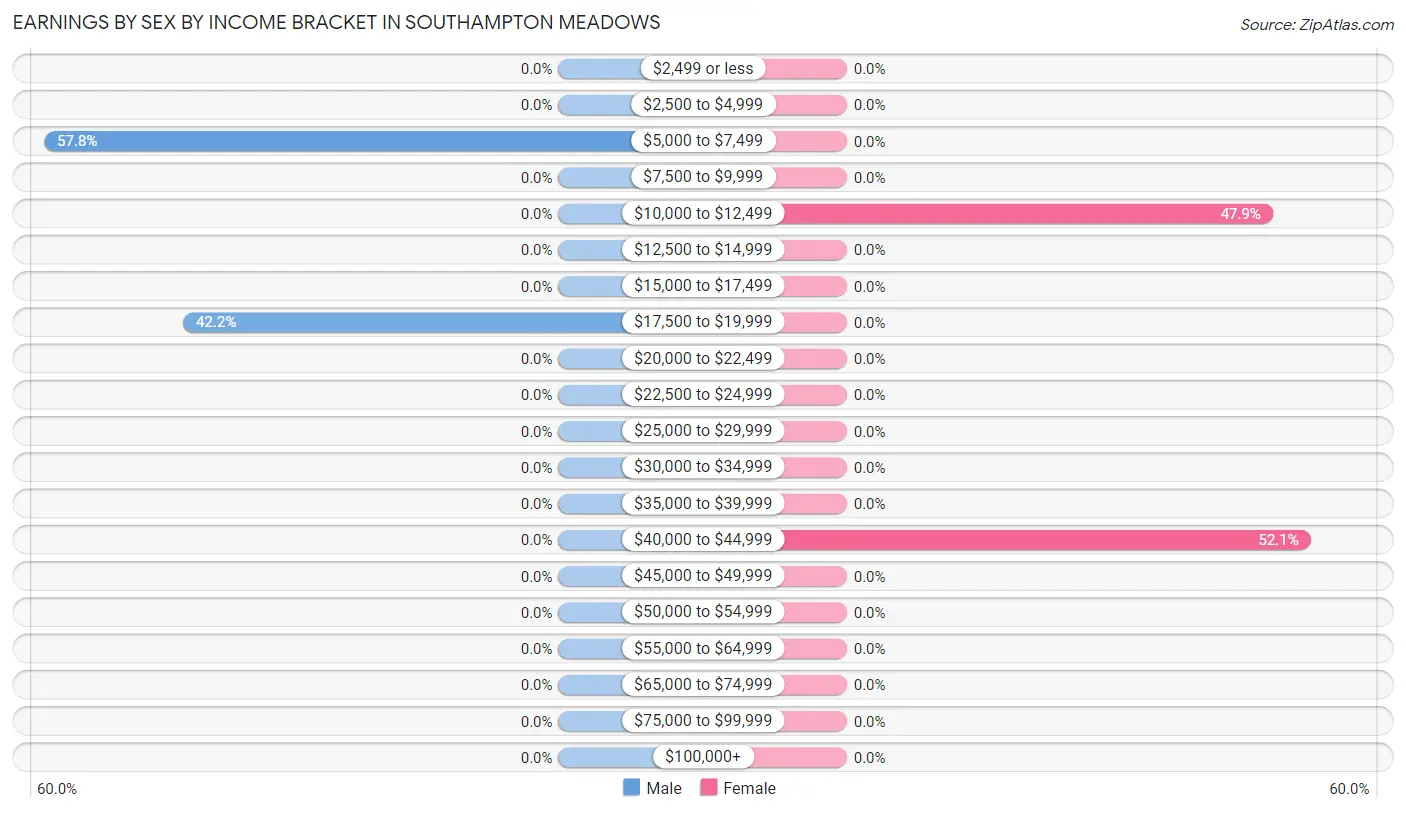
Earnings by Sex by Income Bracket in Southampton Meadows
The most common earnings brackets in Southampton Meadows are $5,000 to $7,499 for men (37 | 57.8%) and $40,000 to $44,999 for women (49 | 52.1%).
| Income | Male | Female |
| $2,499 or less | 0 (0.0%) | 0 (0.0%) |
| $2,500 to $4,999 | 0 (0.0%) | 0 (0.0%) |
| $5,000 to $7,499 | 37 (57.8%) | 0 (0.0%) |
| $7,500 to $9,999 | 0 (0.0%) | 0 (0.0%) |
| $10,000 to $12,499 | 0 (0.0%) | 45 (47.9%) |
| $12,500 to $14,999 | 0 (0.0%) | 0 (0.0%) |
| $15,000 to $17,499 | 0 (0.0%) | 0 (0.0%) |
| $17,500 to $19,999 | 27 (42.2%) | 0 (0.0%) |
| $20,000 to $22,499 | 0 (0.0%) | 0 (0.0%) |
| $22,500 to $24,999 | 0 (0.0%) | 0 (0.0%) |
| $25,000 to $29,999 | 0 (0.0%) | 0 (0.0%) |
| $30,000 to $34,999 | 0 (0.0%) | 0 (0.0%) |
| $35,000 to $39,999 | 0 (0.0%) | 0 (0.0%) |
| $40,000 to $44,999 | 0 (0.0%) | 49 (52.1%) |
| $45,000 to $49,999 | 0 (0.0%) | 0 (0.0%) |
| $50,000 to $54,999 | 0 (0.0%) | 0 (0.0%) |
| $55,000 to $64,999 | 0 (0.0%) | 0 (0.0%) |
| $65,000 to $74,999 | 0 (0.0%) | 0 (0.0%) |
| $75,000 to $99,999 | 0 (0.0%) | 0 (0.0%) |
| $100,000+ | 0 (0.0%) | 0 (0.0%) |
| Total | 64 (100.0%) | 94 (100.0%) |
Earnings by Sex by Educational Attainment in Southampton Meadows
| Educational Attainment | Male Income | Female Income |
| Less than High School | - | - |
| High School Diploma | - | - |
| College or Associate's Degree | - | - |
| Bachelor's Degree | - | - |
| Graduate Degree | - | - |
| Total | - | - |
Family Income in Southampton Meadows
Family Income Brackets in Southampton Meadows
According to the Southampton Meadows family income data, there are 49 families falling into the $50,000 to $74,999 income range, which is the most common income bracket and makes up 52.1% of all families.
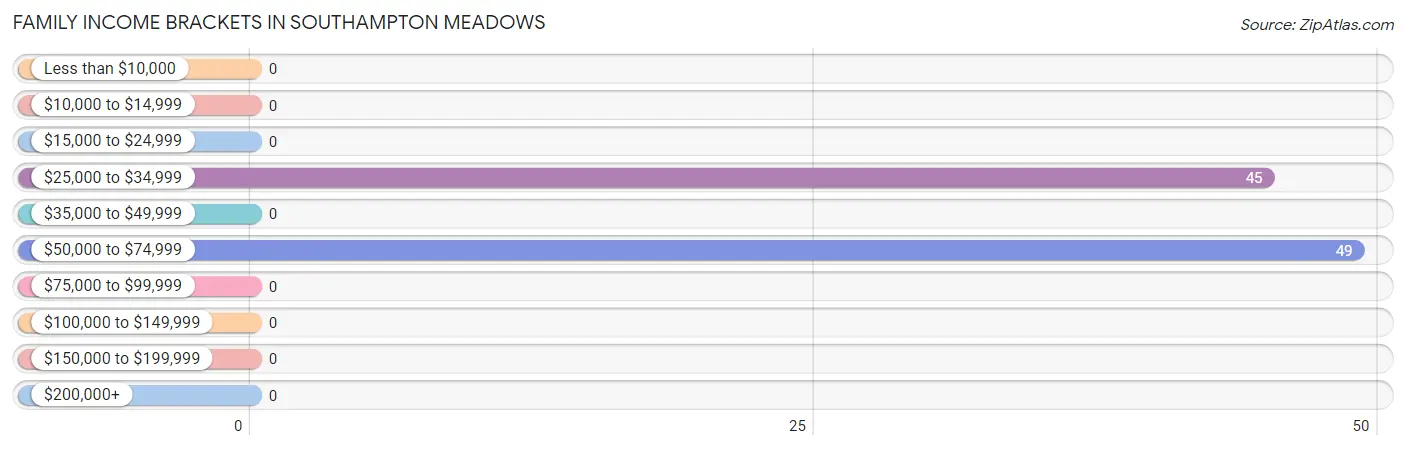
| Income Bracket | # Families | % Families |
| Less than $10,000 | 0 | 0.0% |
| $10,000 to $14,999 | 0 | 0.0% |
| $15,000 to $24,999 | 0 | 0.0% |
| $25,000 to $34,999 | 45 | 47.9% |
| $35,000 to $49,999 | 0 | 0.0% |
| $50,000 to $74,999 | 49 | 52.1% |
| $75,000 to $99,999 | 0 | 0.0% |
| $100,000 to $149,999 | 0 | 0.0% |
| $150,000 to $199,999 | 0 | 0.0% |
| $200,000+ | 0 | 0.0% |
Family Income by Famaliy Size in Southampton Meadows
| Income Bracket | # Families | Median Income |
| 2-Person Families | 20 (21.3%) | $0 |
| 3-Person Families | 49 (52.1%) | $0 |
| 4-Person Families | 0 (0.0%) | $0 |
| 5-Person Families | 25 (26.6%) | $0 |
| 6-Person Families | 0 (0.0%) | $0 |
| 7+ Person Families | 0 (0.0%) | $0 |
| Total | 94 (100.0%) | $50,102 |
Family Income by Number of Earners in Southampton Meadows
| Number of Earners | # Families | Median Income |
| No Earners | 0 (0.0%) | $0 |
| 1 Earner | 74 (78.7%) | $0 |
| 2 Earners | 20 (21.3%) | $0 |
| 3+ Earners | 0 (0.0%) | $0 |
| Total | 94 (100.0%) | $50,102 |
Household Income in Southampton Meadows
Household Income Brackets in Southampton Meadows
With 49 households falling in the category, the $50,000 to $74,999 income range is the most frequent in Southampton Meadows, accounting for 37.1% of all households.
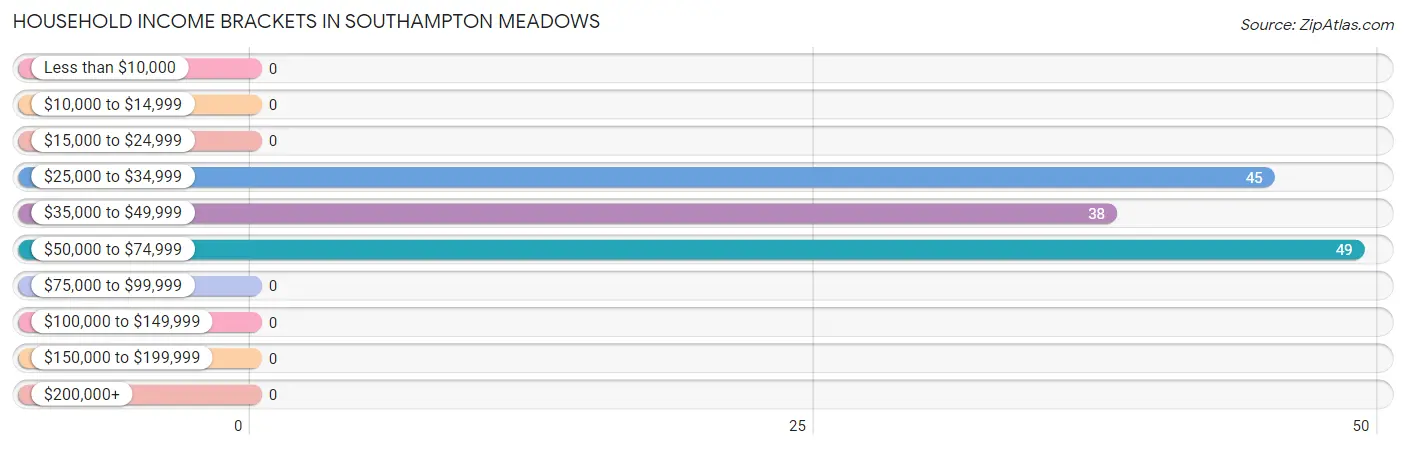
| Income Bracket | # Households | % Households |
| Less than $10,000 | 0 | 0.0% |
| $10,000 to $14,999 | 0 | 0.0% |
| $15,000 to $24,999 | 0 | 0.0% |
| $25,000 to $34,999 | 45 | 34.1% |
| $35,000 to $49,999 | 38 | 28.8% |
| $50,000 to $74,999 | 49 | 37.1% |
| $75,000 to $99,999 | 0 | 0.0% |
| $100,000 to $149,999 | 0 | 0.0% |
| $150,000 to $199,999 | 0 | 0.0% |
| $200,000+ | 0 | 0.0% |
Household Income by Householder Age in Southampton Meadows
The median household income in Southampton Meadows is $43,882, with the highest median household income of $44,704 found in the 45 to 64 years age bracket for the primary householder. A total of 107 households (81.1%) fall into this category.
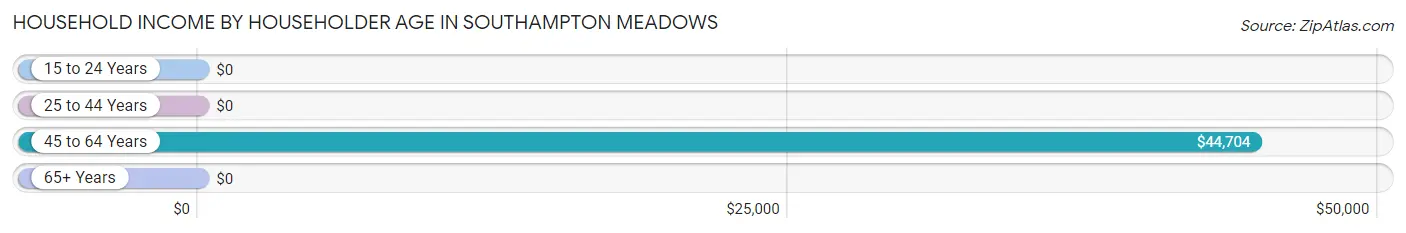
| Income Bracket | # Households | Median Income |
| 15 to 24 Years | 0 (0.0%) | $0 |
| 25 to 44 Years | 25 (18.9%) | $0 |
| 45 to 64 Years | 107 (81.1%) | $44,704 |
| 65+ Years | 0 (0.0%) | $0 |
| Total | 132 (100.0%) | $43,882 |
Poverty in Southampton Meadows
Income Below Poverty by Sex and Age in Southampton Meadows
With 41.2% poverty level for males and 39.1% for females among the residents of Southampton Meadows, 6 to 11 year old males and under 5 year old females are the most vulnerable to poverty, with 34 males (100.0%) and 26 females (100.0%) in their respective age groups living below the poverty level.
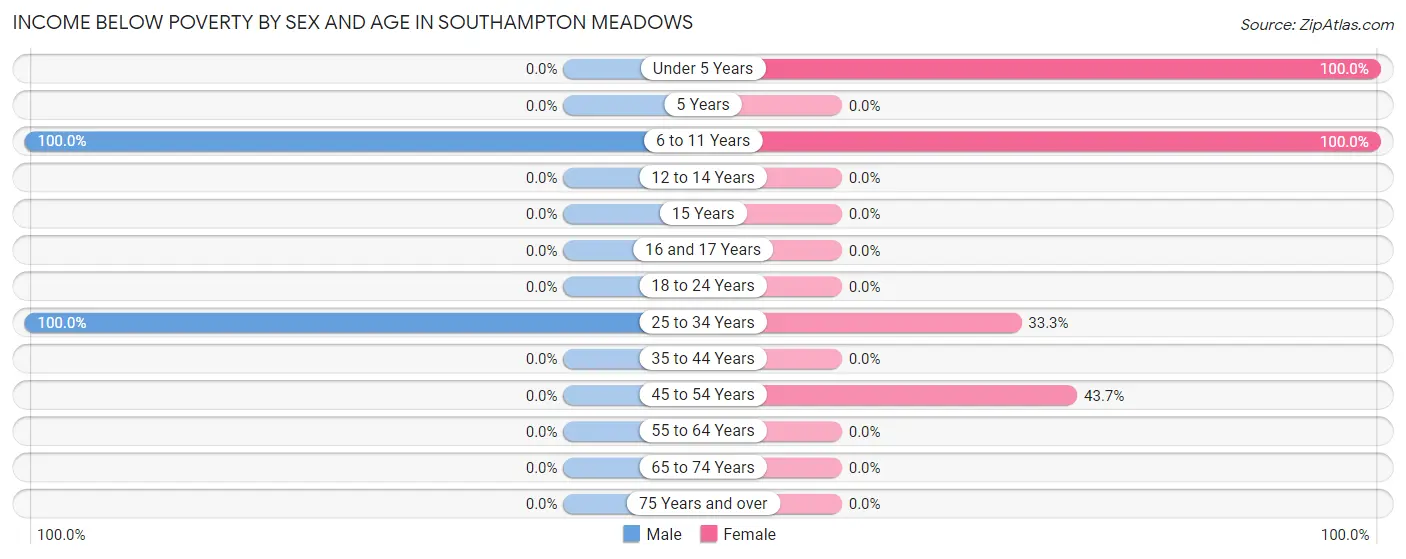
| Age Bracket | Male | Female |
| Under 5 Years | 0 (0.0%) | 26 (100.0%) |
| 5 Years | 0 (0.0%) | 0 (0.0%) |
| 6 to 11 Years | 34 (100.0%) | 27 (100.0%) |
| 12 to 14 Years | 0 (0.0%) | 0 (0.0%) |
| 15 Years | 0 (0.0%) | 0 (0.0%) |
| 16 and 17 Years | 0 (0.0%) | 0 (0.0%) |
| 18 to 24 Years | 0 (0.0%) | 0 (0.0%) |
| 25 to 34 Years | 41 (100.0%) | 25 (33.3%) |
| 35 to 44 Years | 0 (0.0%) | 0 (0.0%) |
| 45 to 54 Years | 0 (0.0%) | 38 (43.7%) |
| 55 to 64 Years | 0 (0.0%) | 0 (0.0%) |
| 65 to 74 Years | 0 (0.0%) | 0 (0.0%) |
| 75 Years and over | 0 (0.0%) | 0 (0.0%) |
| Total | 75 (41.2%) | 116 (39.1%) |
Income Above Poverty by Sex and Age in Southampton Meadows
According to the poverty statistics in Southampton Meadows, males aged 35 to 44 years and females aged 15 years are the age groups that are most secure financially, with 100.0% of males and 100.0% of females in these age groups living above the poverty line.
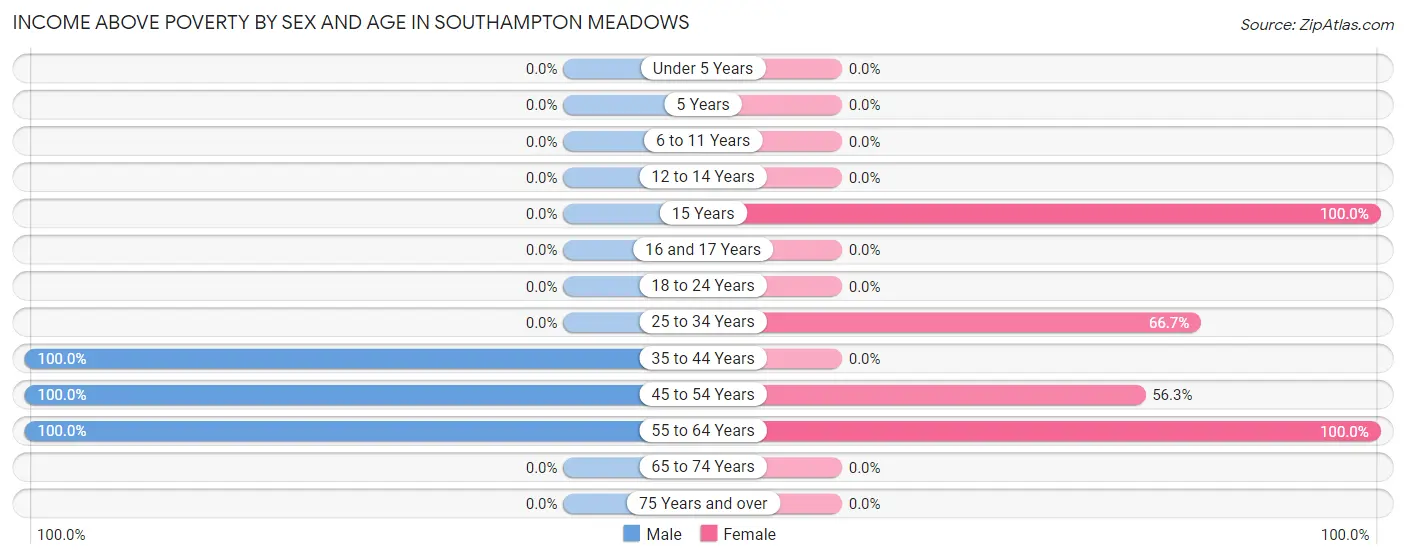
| Age Bracket | Male | Female |
| Under 5 Years | 0 (0.0%) | 0 (0.0%) |
| 5 Years | 0 (0.0%) | 0 (0.0%) |
| 6 to 11 Years | 0 (0.0%) | 0 (0.0%) |
| 12 to 14 Years | 0 (0.0%) | 0 (0.0%) |
| 15 Years | 0 (0.0%) | 62 (100.0%) |
| 16 and 17 Years | 0 (0.0%) | 0 (0.0%) |
| 18 to 24 Years | 0 (0.0%) | 0 (0.0%) |
| 25 to 34 Years | 0 (0.0%) | 50 (66.7%) |
| 35 to 44 Years | 37 (100.0%) | 0 (0.0%) |
| 45 to 54 Years | 43 (100.0%) | 49 (56.3%) |
| 55 to 64 Years | 27 (100.0%) | 20 (100.0%) |
| 65 to 74 Years | 0 (0.0%) | 0 (0.0%) |
| 75 Years and over | 0 (0.0%) | 0 (0.0%) |
| Total | 107 (58.8%) | 181 (60.9%) |
Income Below Poverty Among Married-Couple Families in Southampton Meadows
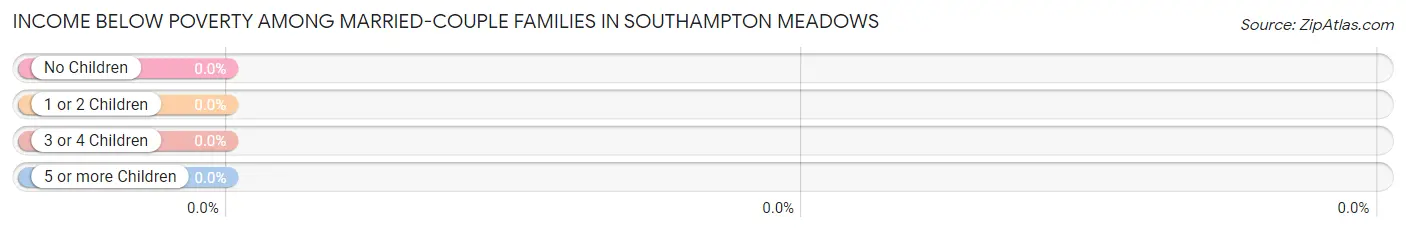
| Children | Above Poverty | Below Poverty |
| No Children | 20 (100.0%) | 0 (0.0%) |
| 1 or 2 Children | 0 (0.0%) | 0 (0.0%) |
| 3 or 4 Children | 0 (0.0%) | 0 (0.0%) |
| 5 or more Children | 0 (0.0%) | 0 (0.0%) |
| Total | 20 (100.0%) | 0 (0.0%) |
Income Below Poverty Among Single-Parent Households in Southampton Meadows
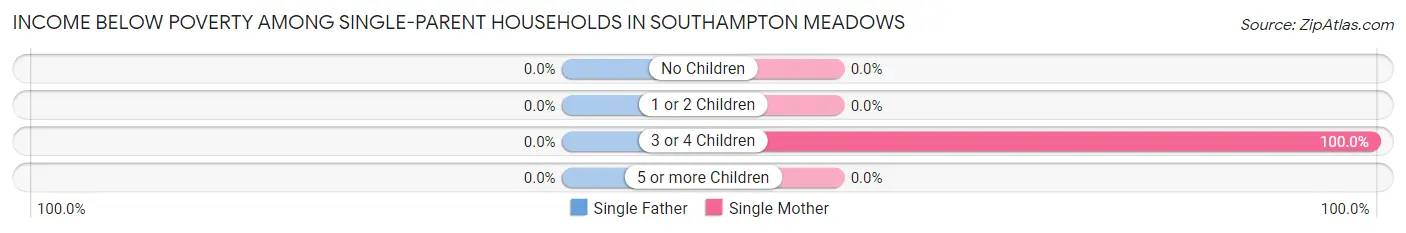
| Children | Single Father | Single Mother |
| No Children | 0 (0.0%) | 0 (0.0%) |
| 1 or 2 Children | 0 (0.0%) | 0 (0.0%) |
| 3 or 4 Children | 0 (0.0%) | 25 (100.0%) |
| 5 or more Children | 0 (0.0%) | 0 (0.0%) |
| Total | 0 (0.0%) | 25 (33.8%) |
Income Below Poverty Among Married-Couple vs Single-Parent Households in Southampton Meadows
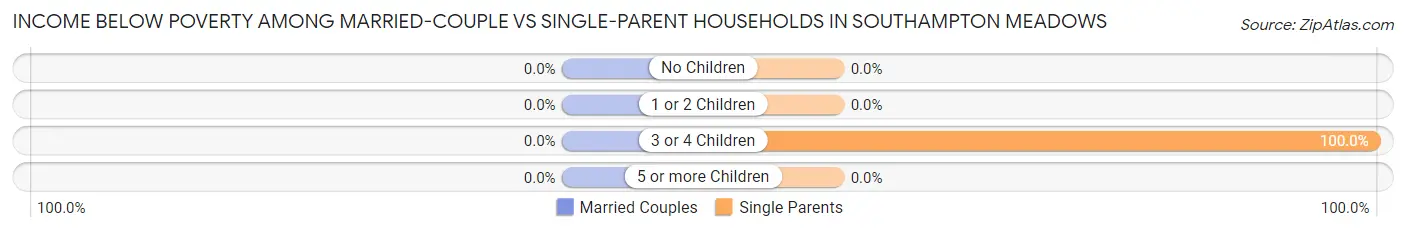
| Children | Married-Couple Families | Single-Parent Households |
| No Children | 0 (0.0%) | 0 (0.0%) |
| 1 or 2 Children | 0 (0.0%) | 0 (0.0%) |
| 3 or 4 Children | 0 (0.0%) | 25 (100.0%) |
| 5 or more Children | 0 (0.0%) | 0 (0.0%) |
| Total | 0 (0.0%) | 25 (33.8%) |
Race in Southampton Meadows
The most populous races in Southampton Meadows are Black / African American (314 | 65.5%), and White / Caucasian (165 | 34.4%).
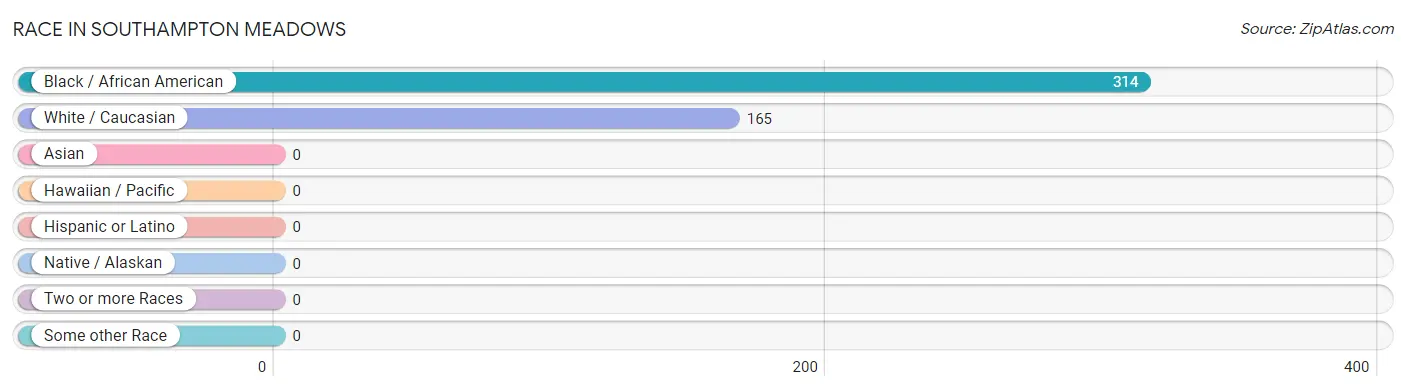
| Race | # Population | % Population |
| Asian | 0 | 0.0% |
| Black / African American | 314 | 65.5% |
| Hawaiian / Pacific | 0 | 0.0% |
| Hispanic or Latino | 0 | 0.0% |
| Native / Alaskan | 0 | 0.0% |
| White / Caucasian | 165 | 34.4% |
| Two or more Races | 0 | 0.0% |
| Some other Race | 0 | 0.0% |
| Total | 479 | 100.0% |
Ancestry in Southampton Meadows
The most populous ancestries reported in Southampton Meadows are African (314 | 65.5%), Subsaharan African (314 | 65.5%), American (47 | 9.8%), English (43 | 9.0%), and German (37 | 7.7%), together accounting for 157.6% of all Southampton Meadows residents.
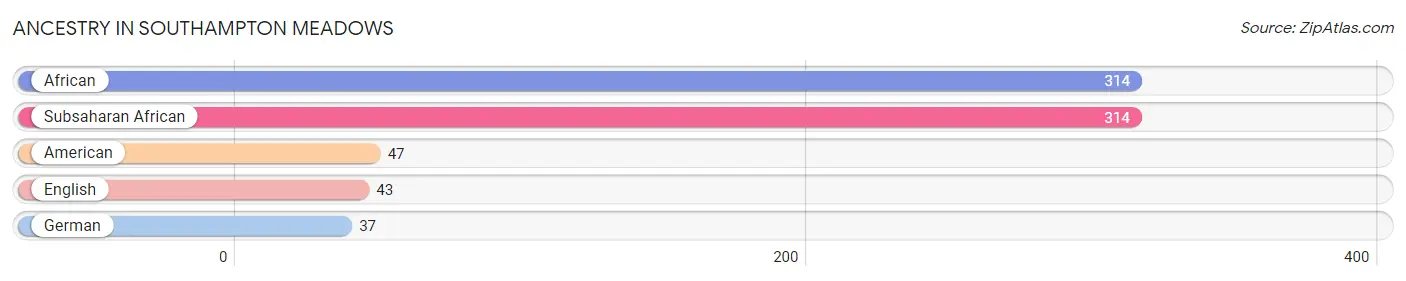
| Ancestry | # Population | % Population |
| African | 314 | 65.5% |
| American | 47 | 9.8% |
| English | 43 | 9.0% |
| German | 37 | 7.7% |
| Subsaharan African | 314 | 65.5% | View All 5 Rows |
Immigrants in Southampton Meadows

| Immigration Origin | # Population | % Population | View All 0 Rows |
Sex and Age in Southampton Meadows
Sex and Age in Southampton Meadows
The most populous age groups in Southampton Meadows are 50 to 54 Years (43 | 23.6%) for men and 45 to 49 Years (87 | 29.3%) for women.
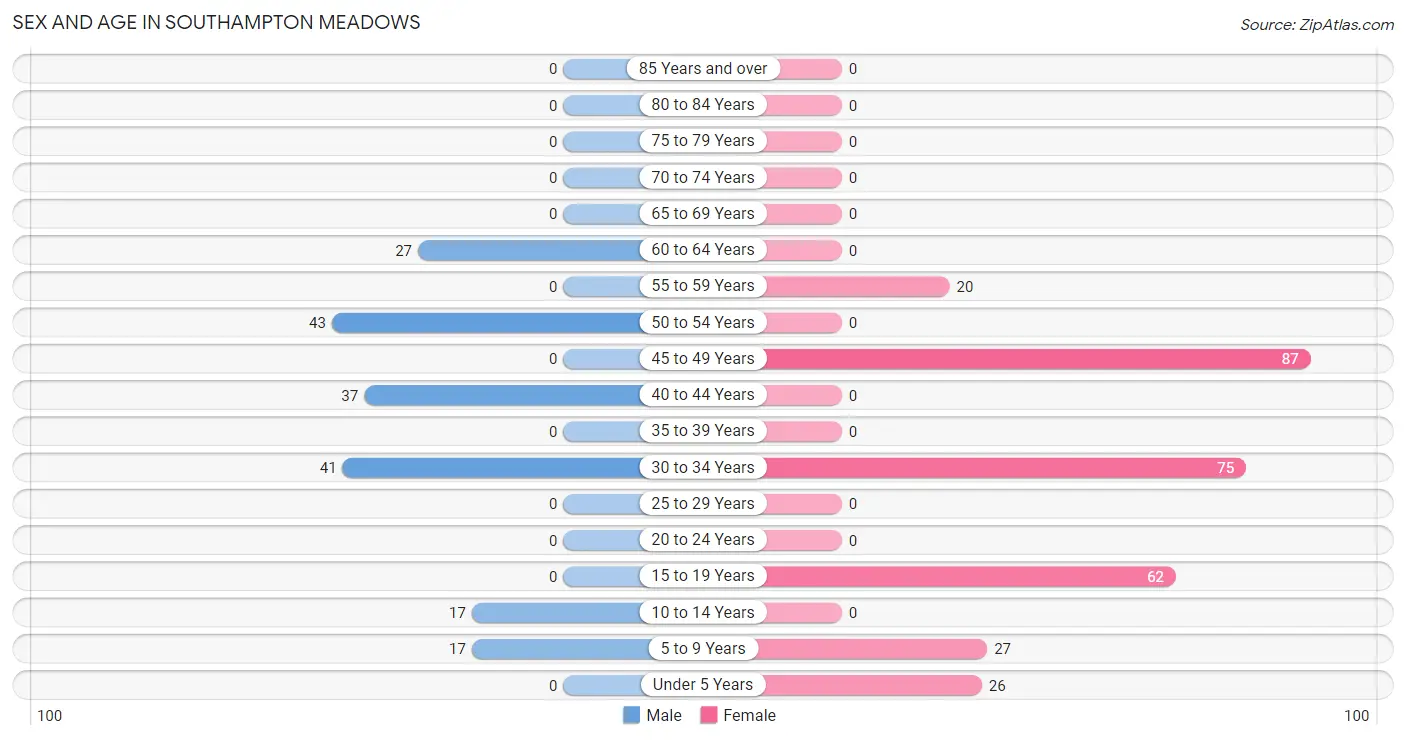
| Age Bracket | Male | Female |
| Under 5 Years | 0 (0.0%) | 26 (8.7%) |
| 5 to 9 Years | 17 (9.3%) | 27 (9.1%) |
| 10 to 14 Years | 17 (9.3%) | 0 (0.0%) |
| 15 to 19 Years | 0 (0.0%) | 62 (20.9%) |
| 20 to 24 Years | 0 (0.0%) | 0 (0.0%) |
| 25 to 29 Years | 0 (0.0%) | 0 (0.0%) |
| 30 to 34 Years | 41 (22.5%) | 75 (25.3%) |
| 35 to 39 Years | 0 (0.0%) | 0 (0.0%) |
| 40 to 44 Years | 37 (20.3%) | 0 (0.0%) |
| 45 to 49 Years | 0 (0.0%) | 87 (29.3%) |
| 50 to 54 Years | 43 (23.6%) | 0 (0.0%) |
| 55 to 59 Years | 0 (0.0%) | 20 (6.7%) |
| 60 to 64 Years | 27 (14.8%) | 0 (0.0%) |
| 65 to 69 Years | 0 (0.0%) | 0 (0.0%) |
| 70 to 74 Years | 0 (0.0%) | 0 (0.0%) |
| 75 to 79 Years | 0 (0.0%) | 0 (0.0%) |
| 80 to 84 Years | 0 (0.0%) | 0 (0.0%) |
| 85 Years and over | 0 (0.0%) | 0 (0.0%) |
| Total | 182 (100.0%) | 297 (100.0%) |
Families and Households in Southampton Meadows
Median Family Size in Southampton Meadows
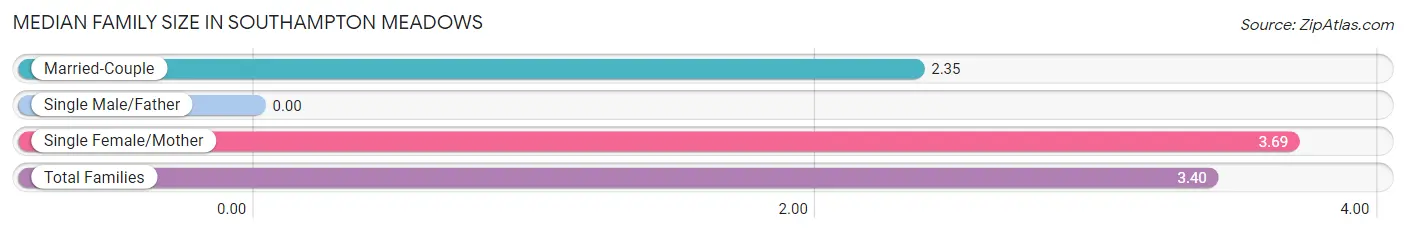
| Family Type | # Families | Family Size |
| Married-Couple | 20 (21.3%) | 2.35 |
| Single Male/Father | 0 (0.0%) | - |
| Single Female/Mother | 74 (78.7%) | 3.69 |
| Total Families | 94 (100.0%) | 3.40 |
Median Household Size in Southampton Meadows
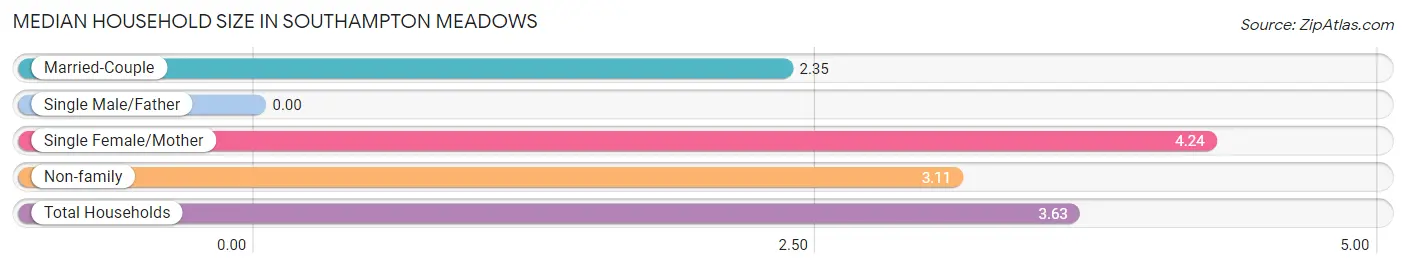
| Household Type | # Households | Household Size |
| Married-Couple | 20 (15.1%) | 2.35 |
| Single Male/Father | 0 (0.0%) | - |
| Single Female/Mother | 74 (56.1%) | 4.24 |
| Non-family | 38 (28.8%) | 3.11 |
| Total Households | 132 (100.0%) | 3.63 |
Household Size by Marriage Status in Southampton Meadows
Out of a total of 132 households in Southampton Meadows, 94 (71.2%) are family households, while 38 (28.8%) are nonfamily households. The most numerous type of family households are 3-person households, comprising 49, and the most common type of nonfamily households are 3-person households, comprising 38.
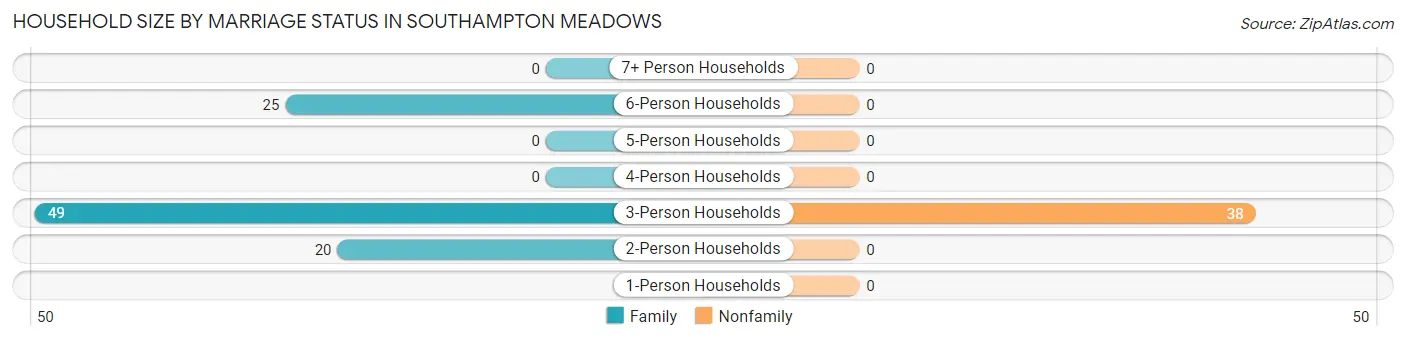
| Household Size | Family Households | Nonfamily Households |
| 1-Person Households | - | 0 (0.0%) |
| 2-Person Households | 20 (15.1%) | 0 (0.0%) |
| 3-Person Households | 49 (37.1%) | 38 (28.8%) |
| 4-Person Households | 0 (0.0%) | 0 (0.0%) |
| 5-Person Households | 0 (0.0%) | 0 (0.0%) |
| 6-Person Households | 25 (18.9%) | 0 (0.0%) |
| 7+ Person Households | 0 (0.0%) | 0 (0.0%) |
| Total | 94 (71.2%) | 38 (28.8%) |
Female Fertility in Southampton Meadows
Fertility by Age in Southampton Meadows
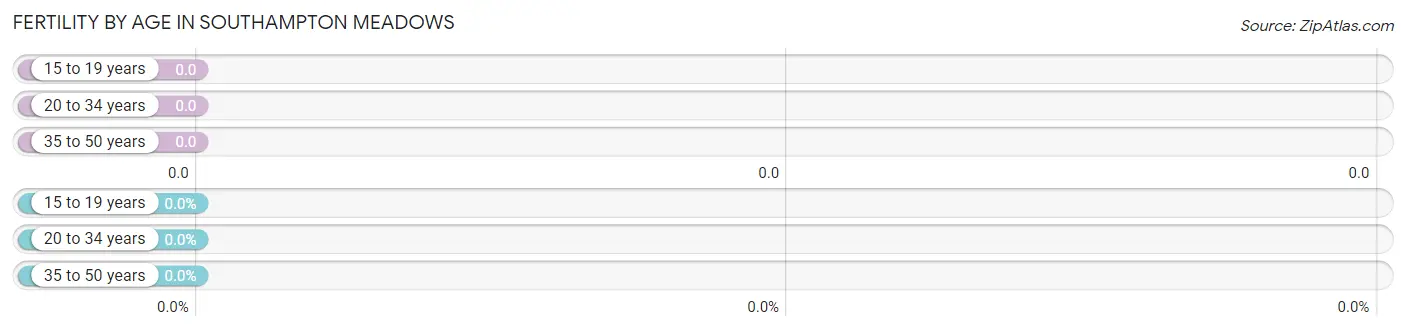
| Age Bracket | Women with Births | Births / 1,000 Women |
| 15 to 19 years | 0 (0.0%) | 0.0 |
| 20 to 34 years | 0 (0.0%) | 0.0 |
| 35 to 50 years | 0 (0.0%) | 0.0 |
| Total | 0 (0.0%) | 0.0 |
Fertility by Age by Marriage Status in Southampton Meadows
| Age Bracket | Married | Unmarried |
| 15 to 19 years | 0 (0.0%) | 0 (0.0%) |
| 20 to 34 years | 0 (0.0%) | 0 (0.0%) |
| 35 to 50 years | 0 (0.0%) | 0 (0.0%) |
| Total | 0 (0.0%) | 0 (0.0%) |
Fertility by Education in Southampton Meadows
| Educational Attainment | Women with Births | Births / 1,000 Women |
| Less than High School | 0 (0.0%) | 0.0 |
| High School Diploma | 0 (0.0%) | 0.0 |
| College or Associate's Degree | 0 (0.0%) | 0.0 |
| Bachelor's Degree | 0 (0.0%) | 0.0 |
| Graduate Degree | 0 (0.0%) | 0.0 |
| Total | 0 (0.0%) | 0.0 |
Fertility by Education by Marriage Status in Southampton Meadows
| Educational Attainment | Married | Unmarried |
| Less than High School | 0 (0.0%) | 0 (0.0%) |
| High School Diploma | 0 (0.0%) | 0 (0.0%) |
| College or Associate's Degree | 0 (0.0%) | 0 (0.0%) |
| Bachelor's Degree | 0 (0.0%) | 0 (0.0%) |
| Graduate Degree | 0 (0.0%) | 0 (0.0%) |
| Total | 0 (0.0%) | 0 (0.0%) |
Employment Characteristics in Southampton Meadows
Employment by Class of Employer in Southampton Meadows
Among the 47 employed individuals in Southampton Meadows, , and private company employees (47 | 100.0%) make up the most common classes of employment.
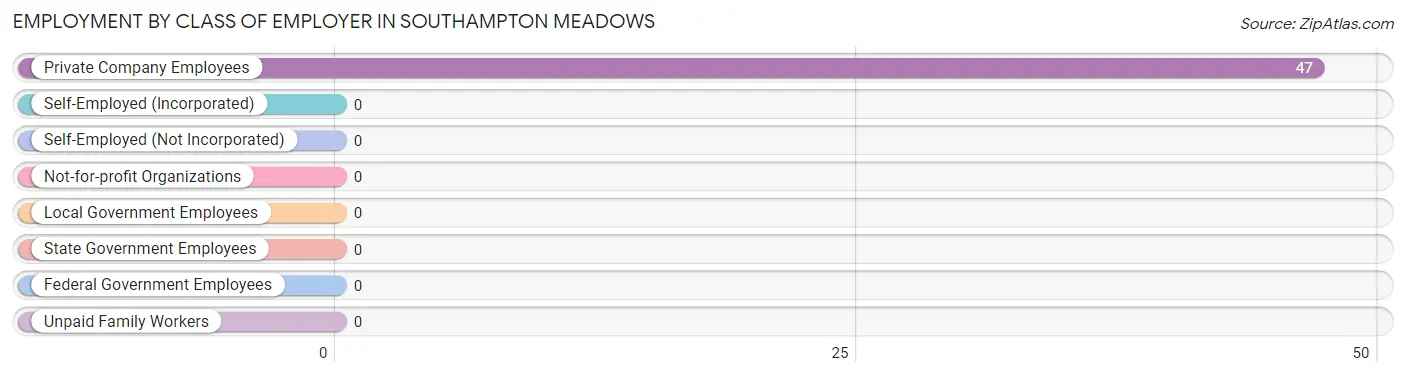
| Employer Class | # Employees | % Employees |
| Private Company Employees | 47 | 100.0% |
| Self-Employed (Incorporated) | 0 | 0.0% |
| Self-Employed (Not Incorporated) | 0 | 0.0% |
| Not-for-profit Organizations | 0 | 0.0% |
| Local Government Employees | 0 | 0.0% |
| State Government Employees | 0 | 0.0% |
| Federal Government Employees | 0 | 0.0% |
| Unpaid Family Workers | 0 | 0.0% |
| Total | 47 | 100.0% |
Employment Status by Age in Southampton Meadows
According to the labor force statistics for Southampton Meadows, out of the total population over 16 years of age (330), 40.3% or 133 individuals are in the labor force, with 64.7% or 86 of them unemployed. The age group with the highest labor force participation rate is 35 to 44 years, with 100.0% or 37 individuals in the labor force. Within the labor force, the 35 to 44 years age range has the highest percentage of unemployed individuals, with 100.0% or 37 of them being unemployed.
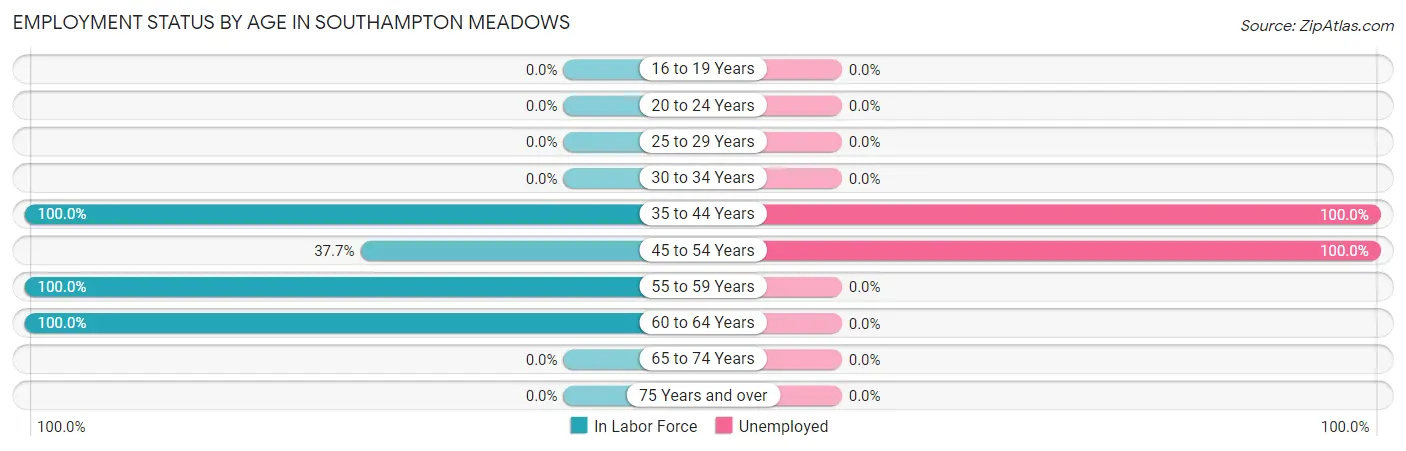
| Age Bracket | In Labor Force | Unemployed |
| 16 to 19 Years | 0 (0.0%) | 0 (0.0%) |
| 20 to 24 Years | 0 (0.0%) | 0 (0.0%) |
| 25 to 29 Years | 0 (0.0%) | 0 (0.0%) |
| 30 to 34 Years | 0 (0.0%) | 0 (0.0%) |
| 35 to 44 Years | 37 (100.0%) | 37 (100.0%) |
| 45 to 54 Years | 49 (37.7%) | 49 (100.0%) |
| 55 to 59 Years | 20 (100.0%) | 0 (0.0%) |
| 60 to 64 Years | 27 (100.0%) | 0 (0.0%) |
| 65 to 74 Years | 0 (0.0%) | 0 (0.0%) |
| 75 Years and over | 0 (0.0%) | 0 (0.0%) |
| Total | 133 (40.3%) | 86 (64.7%) |
Employment Status by Educational Attainment in Southampton Meadows
According to labor force statistics for Southampton Meadows, 40.3% of individuals (133) out of the total population between 25 and 64 years of age (330) are in the labor force, with 64.7% or 86 of them being unemployed. The group with the highest labor force participation rate are those with the educational attainment of college / associate degree, with 56.7% or 106 individuals in the labor force. Within the labor force, individuals with college / associate degree education have the highest percentage of unemployment, with 81.1% or 86 of them being unemployed.
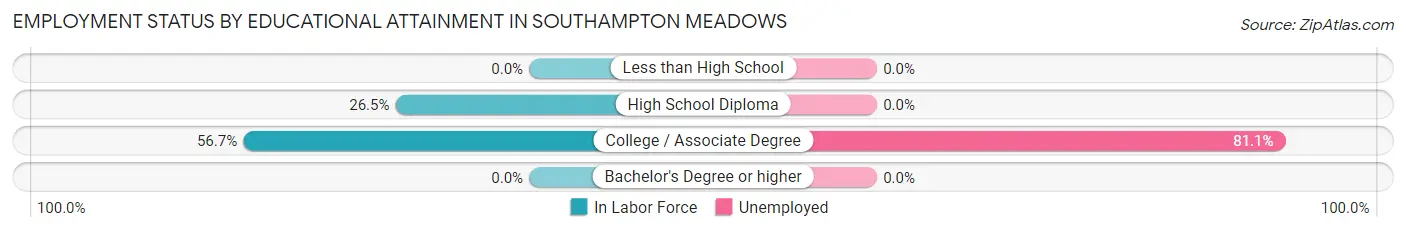
| Educational Attainment | In Labor Force | Unemployed |
| Less than High School | 0 (0.0%) | 0 (0.0%) |
| High School Diploma | 27 (26.5%) | 0 (0.0%) |
| College / Associate Degree | 106 (56.7%) | 152 (81.1%) |
| Bachelor's Degree or higher | 0 (0.0%) | 0 (0.0%) |
| Total | 133 (40.3%) | 214 (64.7%) |
Employment Occupations by Sex in Southampton Meadows
Management, Business, Science and Arts Occupations
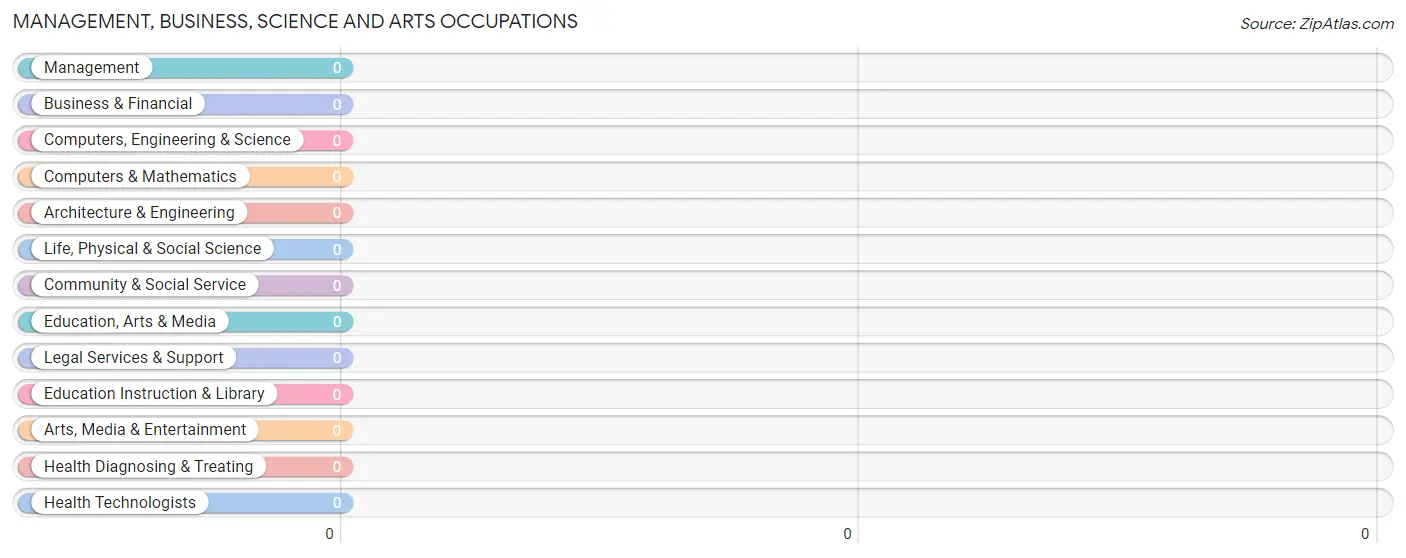
Management, Business, Science and Arts Occupations by Sex
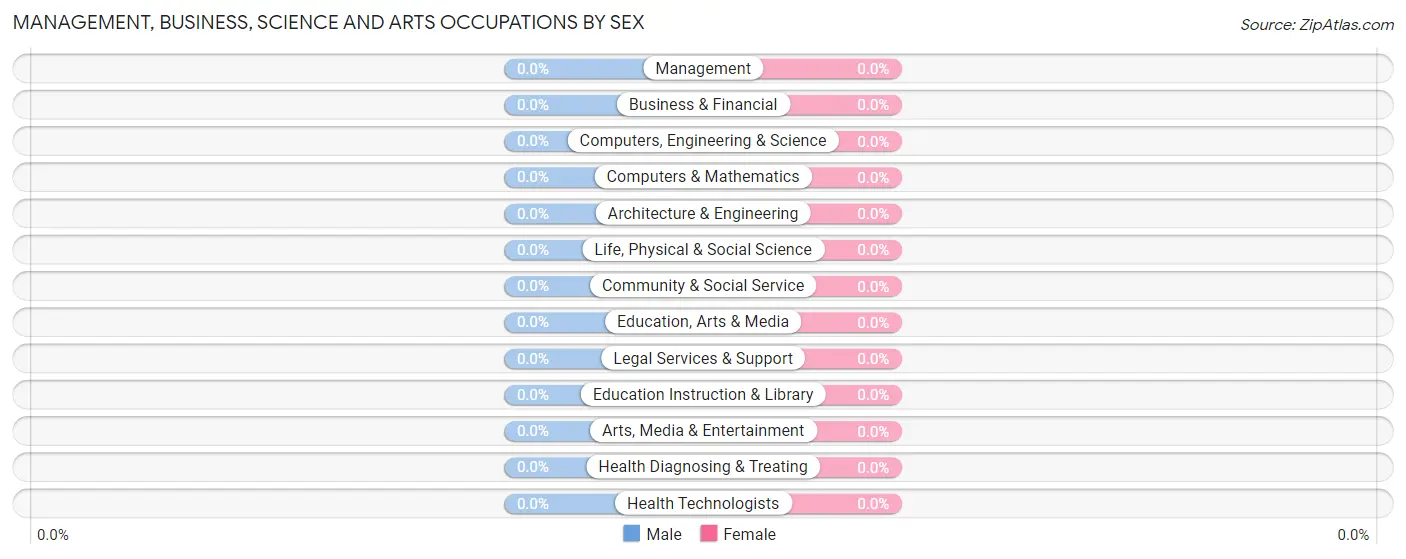
| Occupation | Male | Female |
| Management | 0 (0.0%) | 0 (0.0%) |
| Business & Financial | 0 (0.0%) | 0 (0.0%) |
| Computers, Engineering & Science | 0 (0.0%) | 0 (0.0%) |
| Computers & Mathematics | 0 (0.0%) | 0 (0.0%) |
| Architecture & Engineering | 0 (0.0%) | 0 (0.0%) |
| Life, Physical & Social Science | 0 (0.0%) | 0 (0.0%) |
| Community & Social Service | 0 (0.0%) | 0 (0.0%) |
| Education, Arts & Media | 0 (0.0%) | 0 (0.0%) |
| Legal Services & Support | 0 (0.0%) | 0 (0.0%) |
| Education Instruction & Library | 0 (0.0%) | 0 (0.0%) |
| Arts, Media & Entertainment | 0 (0.0%) | 0 (0.0%) |
| Health Diagnosing & Treating | 0 (0.0%) | 0 (0.0%) |
| Health Technologists | 0 (0.0%) | 0 (0.0%) |
| Total (Category) | 0 (0.0%) | 0 (0.0%) |
| Total (Overall) | 27 (57.5%) | 20 (42.5%) |
Services Occupations
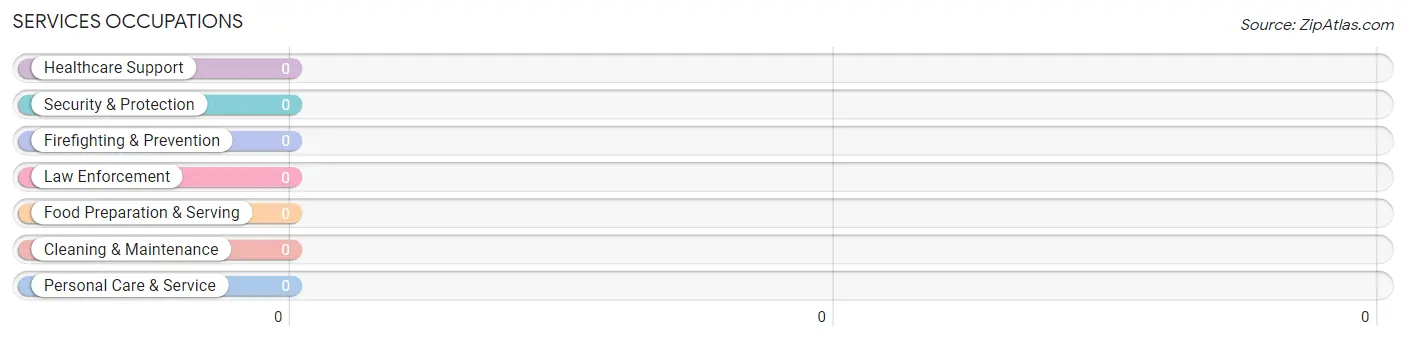
Services Occupations by Sex
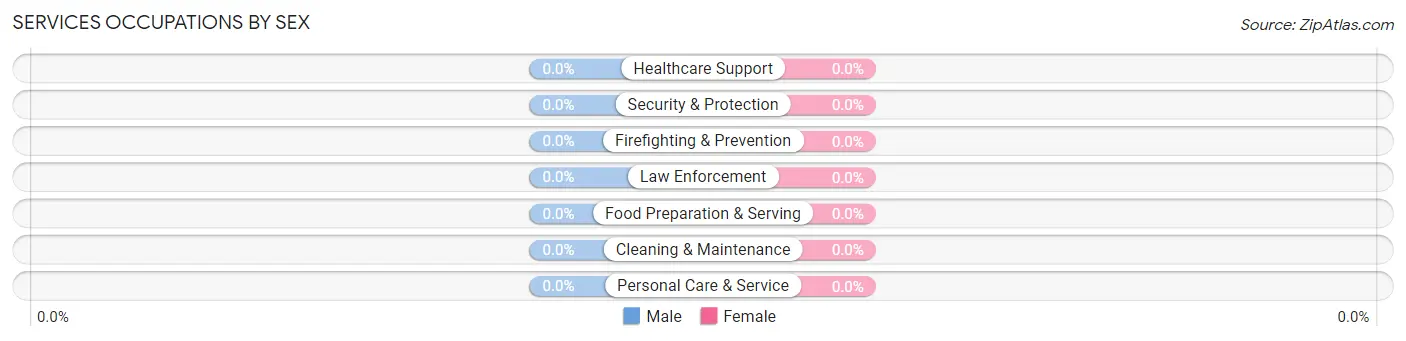
| Occupation | Male | Female |
| Healthcare Support | 0 (0.0%) | 0 (0.0%) |
| Security & Protection | 0 (0.0%) | 0 (0.0%) |
| Firefighting & Prevention | 0 (0.0%) | 0 (0.0%) |
| Law Enforcement | 0 (0.0%) | 0 (0.0%) |
| Food Preparation & Serving | 0 (0.0%) | 0 (0.0%) |
| Cleaning & Maintenance | 0 (0.0%) | 0 (0.0%) |
| Personal Care & Service | 0 (0.0%) | 0 (0.0%) |
| Total (Category) | 0 (0.0%) | 0 (0.0%) |
| Total (Overall) | 27 (57.5%) | 20 (42.5%) |
Sales and Office Occupations
The most common Sales and Office occupations in Southampton Meadows are , and Office & Administration (20 | 42.5%).
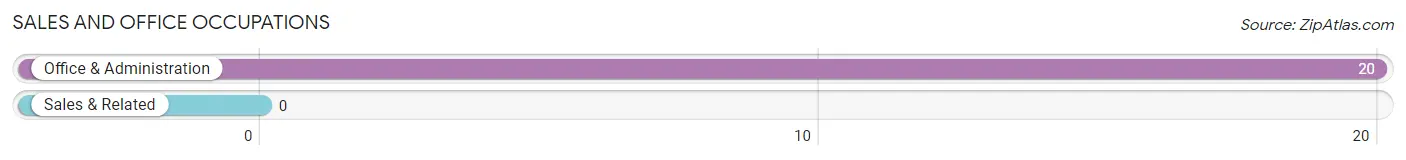
Sales and Office Occupations by Sex
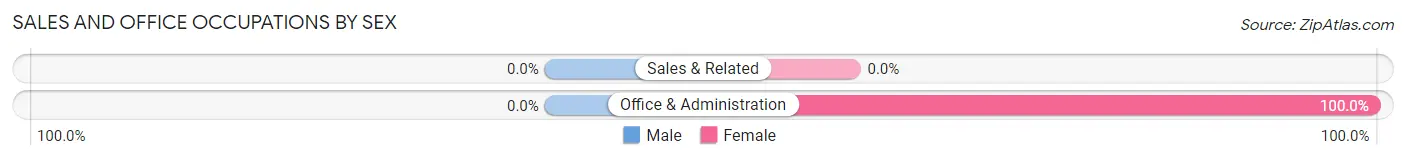
| Occupation | Male | Female |
| Sales & Related | 0 (0.0%) | 0 (0.0%) |
| Office & Administration | 0 (0.0%) | 20 (100.0%) |
| Total (Category) | 0 (0.0%) | 20 (100.0%) |
| Total (Overall) | 27 (57.5%) | 20 (42.5%) |
Natural Resources, Construction and Maintenance Occupations
The most common Natural Resources, Construction and Maintenance occupations in Southampton Meadows are , and Installation, Maintenance & Repair (27 | 57.5%).
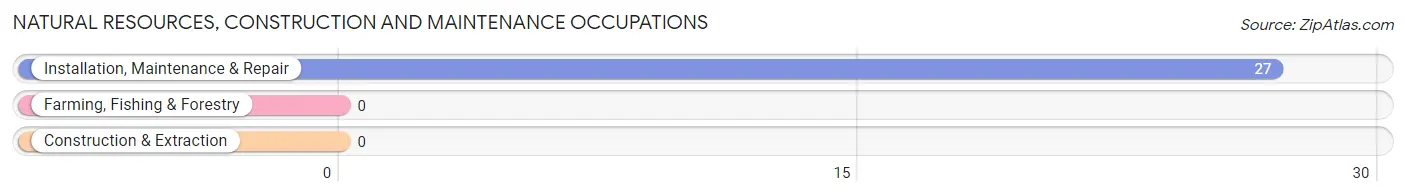
Natural Resources, Construction and Maintenance Occupations by Sex
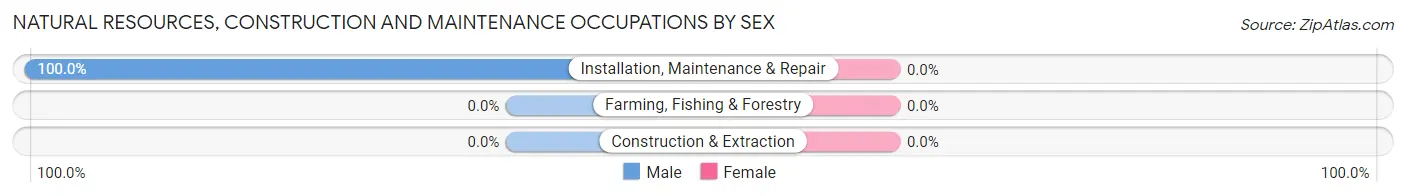
| Occupation | Male | Female |
| Farming, Fishing & Forestry | 0 (0.0%) | 0 (0.0%) |
| Construction & Extraction | 0 (0.0%) | 0 (0.0%) |
| Installation, Maintenance & Repair | 27 (100.0%) | 0 (0.0%) |
| Total (Category) | 27 (100.0%) | 0 (0.0%) |
| Total (Overall) | 27 (57.5%) | 20 (42.5%) |
Production, Transportation and Moving Occupations
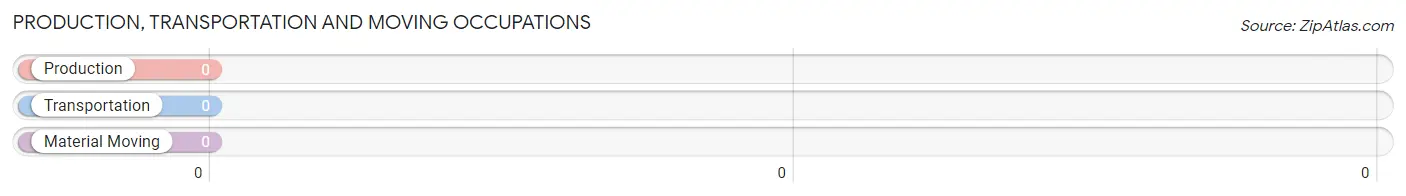
Production, Transportation and Moving Occupations by Sex
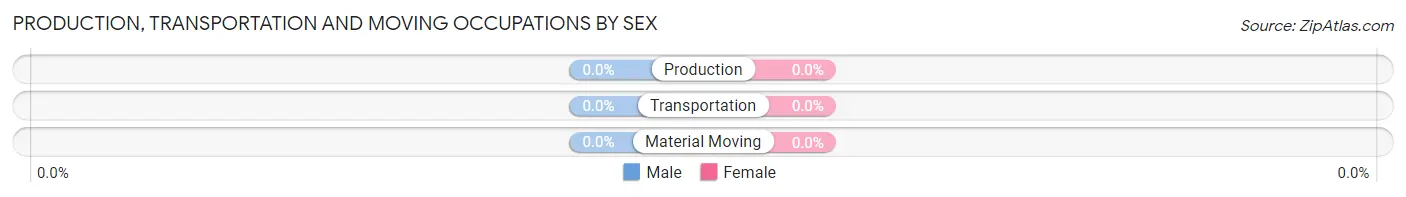
| Occupation | Male | Female |
| Production | 0 (0.0%) | 0 (0.0%) |
| Transportation | 0 (0.0%) | 0 (0.0%) |
| Material Moving | 0 (0.0%) | 0 (0.0%) |
| Total (Category) | 0 (0.0%) | 0 (0.0%) |
| Total (Overall) | 27 (57.5%) | 20 (42.5%) |
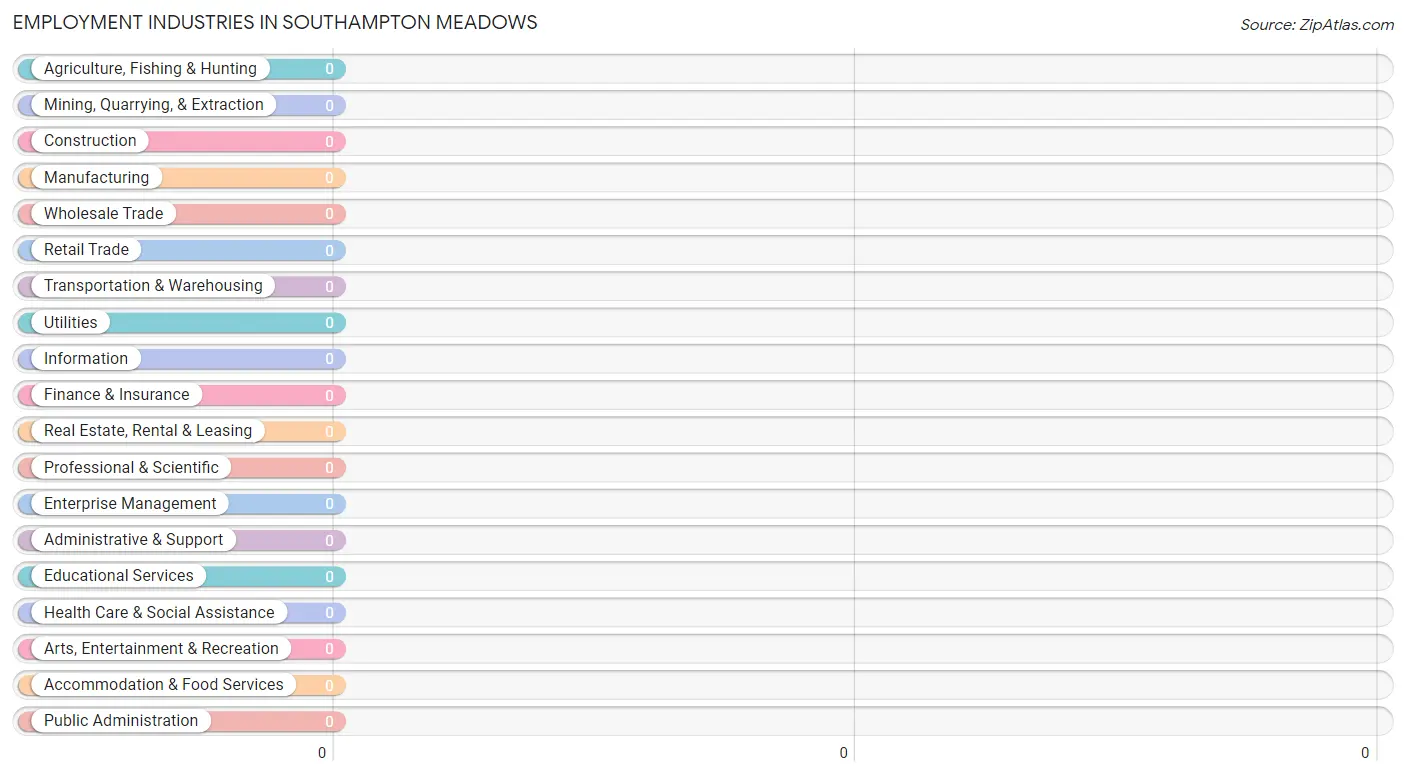
Employment Industries by Sex in Southampton Meadows
Employment Industries in Southampton Meadows
Employment Industries by Sex in Southampton Meadows
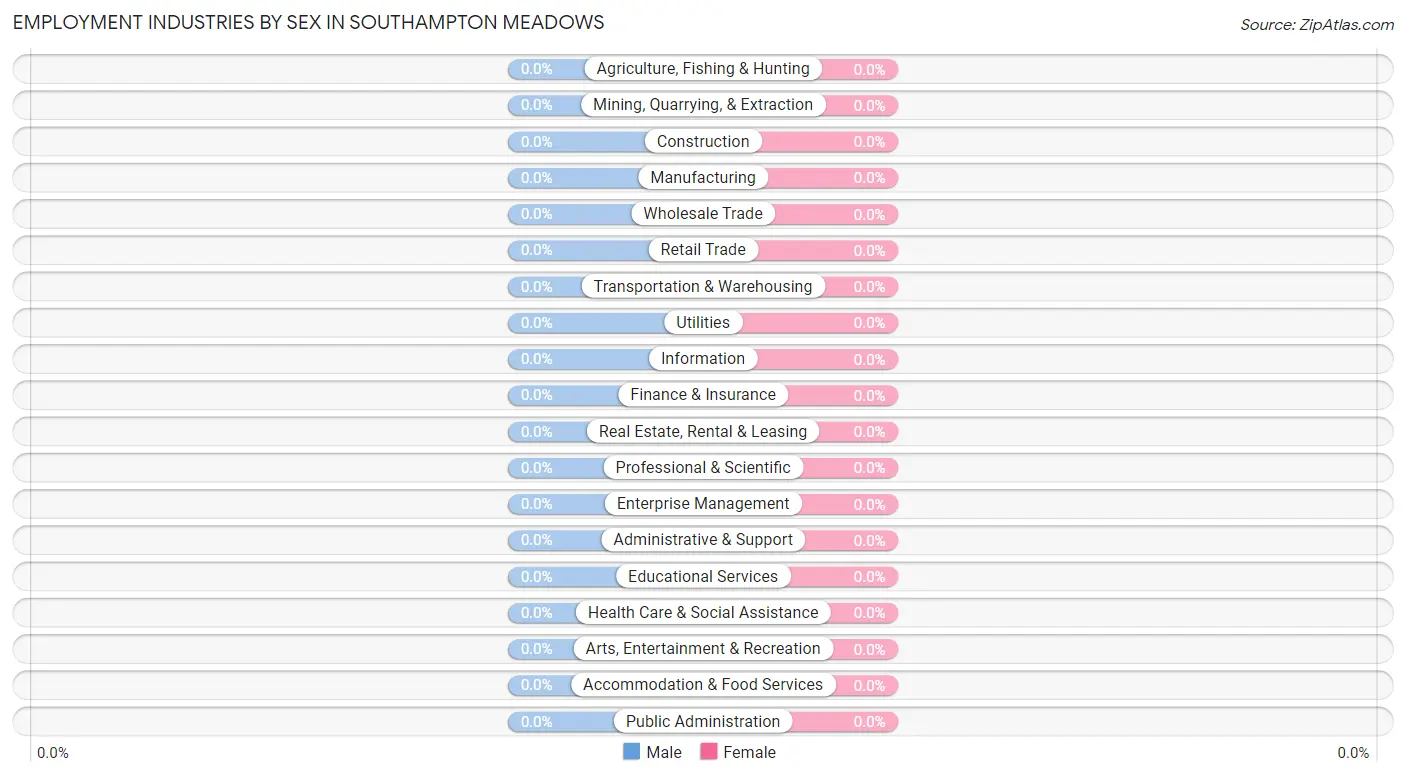
| Industry | Male | Female |
| Agriculture, Fishing & Hunting | 0 (0.0%) | 0 (0.0%) |
| Mining, Quarrying, & Extraction | 0 (0.0%) | 0 (0.0%) |
| Construction | 0 (0.0%) | 0 (0.0%) |
| Manufacturing | 0 (0.0%) | 0 (0.0%) |
| Wholesale Trade | 0 (0.0%) | 0 (0.0%) |
| Retail Trade | 0 (0.0%) | 0 (0.0%) |
| Transportation & Warehousing | 0 (0.0%) | 0 (0.0%) |
| Utilities | 0 (0.0%) | 0 (0.0%) |
| Information | 0 (0.0%) | 0 (0.0%) |
| Finance & Insurance | 0 (0.0%) | 0 (0.0%) |
| Real Estate, Rental & Leasing | 0 (0.0%) | 0 (0.0%) |
| Professional & Scientific | 0 (0.0%) | 0 (0.0%) |
| Enterprise Management | 0 (0.0%) | 0 (0.0%) |
| Administrative & Support | 0 (0.0%) | 0 (0.0%) |
| Educational Services | 0 (0.0%) | 0 (0.0%) |
| Health Care & Social Assistance | 0 (0.0%) | 0 (0.0%) |
| Arts, Entertainment & Recreation | 0 (0.0%) | 0 (0.0%) |
| Accommodation & Food Services | 0 (0.0%) | 0 (0.0%) |
| Public Administration | 0 (0.0%) | 0 (0.0%) |
| Total | 27 (57.5%) | 20 (42.5%) |
Education in Southampton Meadows
School Enrollment in Southampton Meadows
The most common levels of schooling among the 143 students in Southampton Meadows are middle school (79 | 55.2%), kindergarten (27 | 18.9%), and college / undergraduate (20 | 14.0%).
| School Level | # Students | % Students |
| Nursery / Preschool | 0 | 0.0% |
| Kindergarten | 27 | 18.9% |
| Elementary School | 17 | 11.9% |
| Middle School | 79 | 55.2% |
| High School | 0 | 0.0% |
| College / Undergraduate | 20 | 14.0% |
| Graduate / Professional | 0 | 0.0% |
| Total | 143 | 100.0% |
School Enrollment by Age by Funding Source in Southampton Meadows
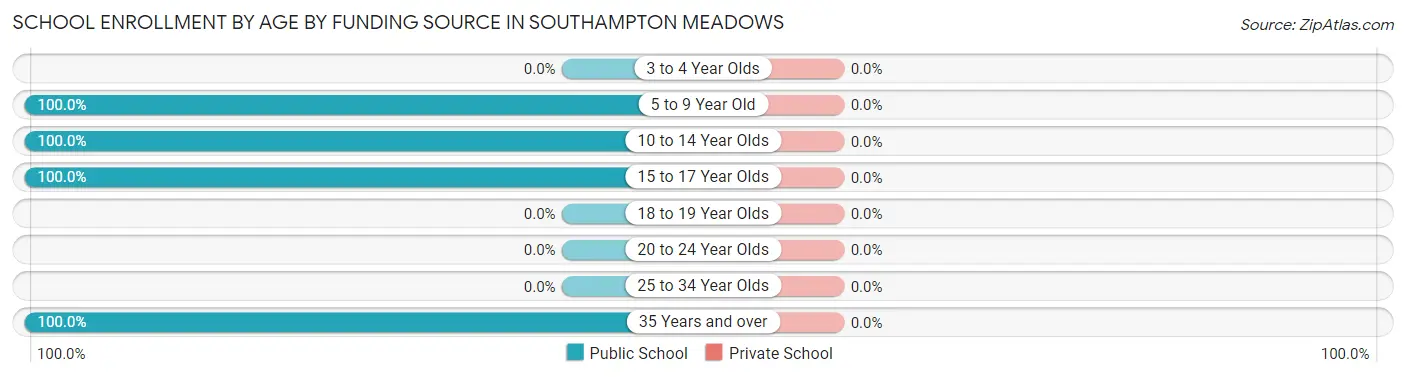
| Age Bracket | Public School | Private School |
| 3 to 4 Year Olds | 0 (0.0%) | 0 (0.0%) |
| 5 to 9 Year Old | 44 (100.0%) | 0 (0.0%) |
| 10 to 14 Year Olds | 17 (100.0%) | 0 (0.0%) |
| 15 to 17 Year Olds | 62 (100.0%) | 0 (0.0%) |
| 18 to 19 Year Olds | 0 (0.0%) | 0 (0.0%) |
| 20 to 24 Year Olds | 0 (0.0%) | 0 (0.0%) |
| 25 to 34 Year Olds | 0 (0.0%) | 0 (0.0%) |
| 35 Years and over | 20 (100.0%) | 0 (0.0%) |
| Total | 143 (100.0%) | 0 (0.0%) |
Educational Attainment by Field of Study in Southampton Meadows
, and computers & mathematics (41 | 100.0%) are the most common fields of study among 41 individuals in Southampton Meadows who have obtained a bachelor's degree or higher.
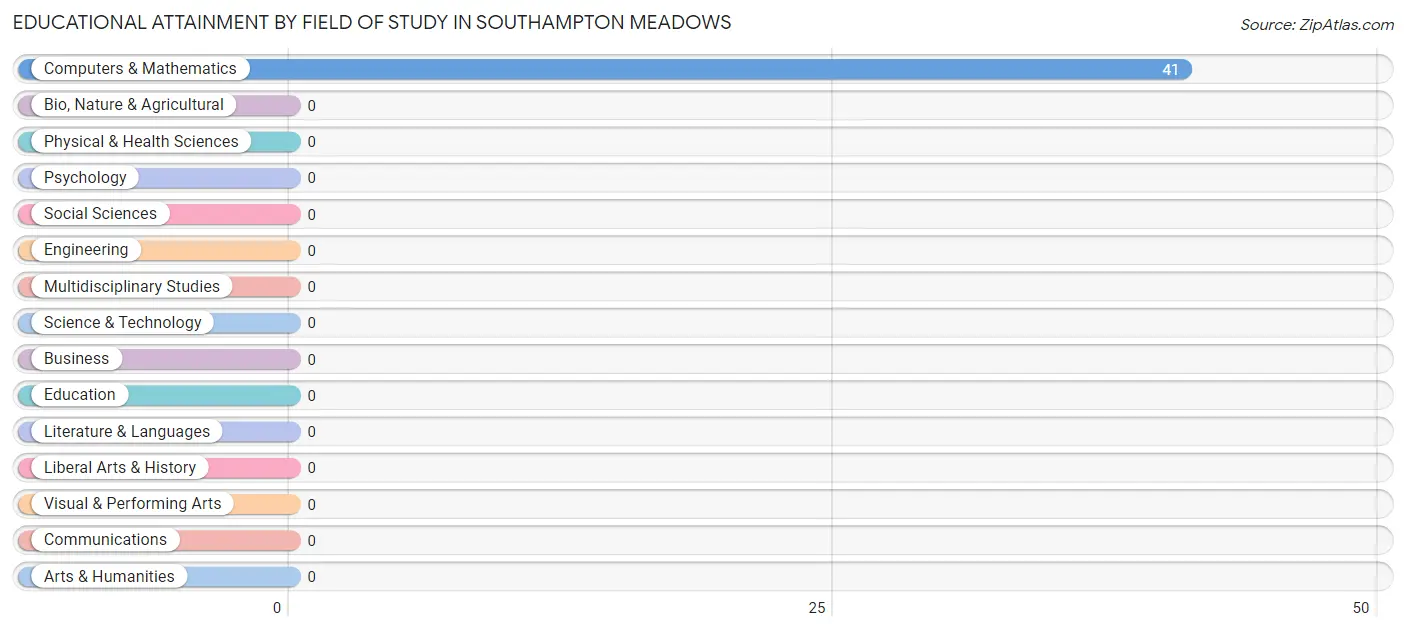
| Field of Study | # Graduates | % Graduates |
| Computers & Mathematics | 41 | 100.0% |
| Bio, Nature & Agricultural | 0 | 0.0% |
| Physical & Health Sciences | 0 | 0.0% |
| Psychology | 0 | 0.0% |
| Social Sciences | 0 | 0.0% |
| Engineering | 0 | 0.0% |
| Multidisciplinary Studies | 0 | 0.0% |
| Science & Technology | 0 | 0.0% |
| Business | 0 | 0.0% |
| Education | 0 | 0.0% |
| Literature & Languages | 0 | 0.0% |
| Liberal Arts & History | 0 | 0.0% |
| Visual & Performing Arts | 0 | 0.0% |
| Communications | 0 | 0.0% |
| Arts & Humanities | 0 | 0.0% |
| Total | 41 | 100.0% |
Transportation & Commute in Southampton Meadows
Vehicle Availability by Sex in Southampton Meadows
The most prevalent vehicle ownership categories in Southampton Meadows are males with 2 vehicles (27, accounting for 100.0%) and females with 2 vehicles (20, making up 135.0%).
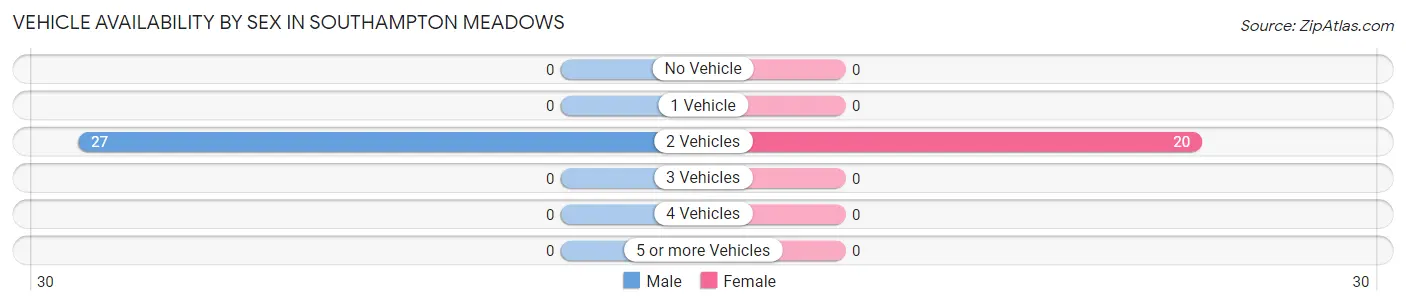
| Vehicles Available | Male | Female |
| No Vehicle | 0 (0.0%) | 0 (0.0%) |
| 1 Vehicle | 0 (0.0%) | 0 (0.0%) |
| 2 Vehicles | 27 (100.0%) | 20 (100.0%) |
| 3 Vehicles | 0 (0.0%) | 0 (0.0%) |
| 4 Vehicles | 0 (0.0%) | 0 (0.0%) |
| 5 or more Vehicles | 0 (0.0%) | 0 (0.0%) |
| Total | 27 (100.0%) | 20 (100.0%) |
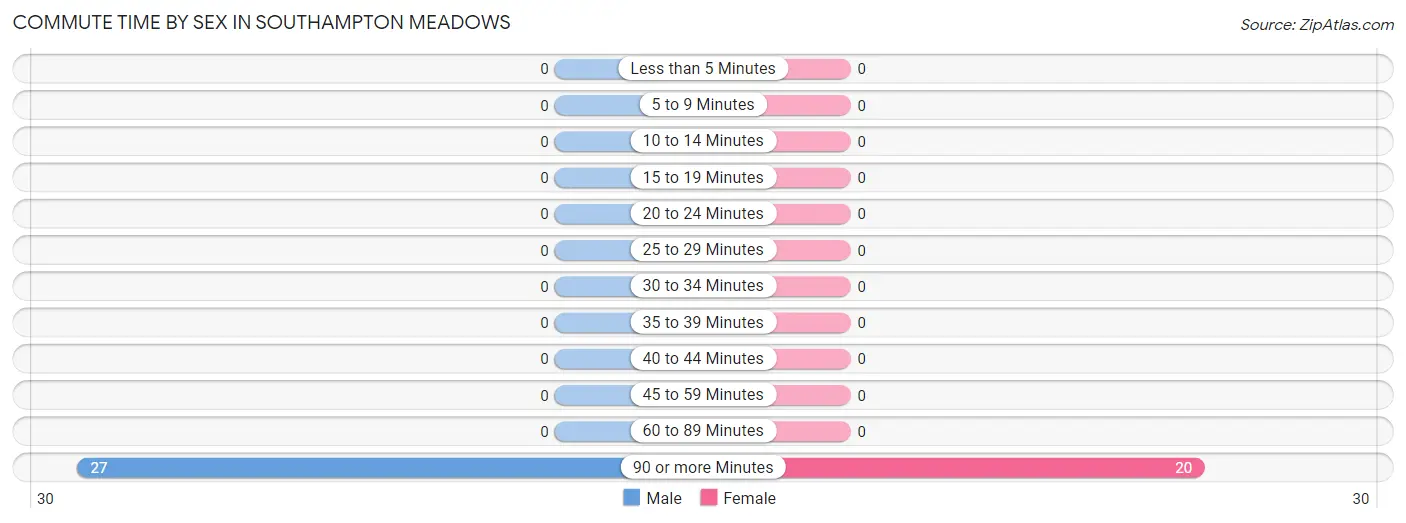
Commute Time in Southampton Meadows
The most frequently occuring commute durations in Southampton Meadows are 90 or more minutes (47 commuters, 100.0%), less than 5 minutes (0 commuters, 0.0%), and 5 to 9 minutes (0 commuters, 0.0%).
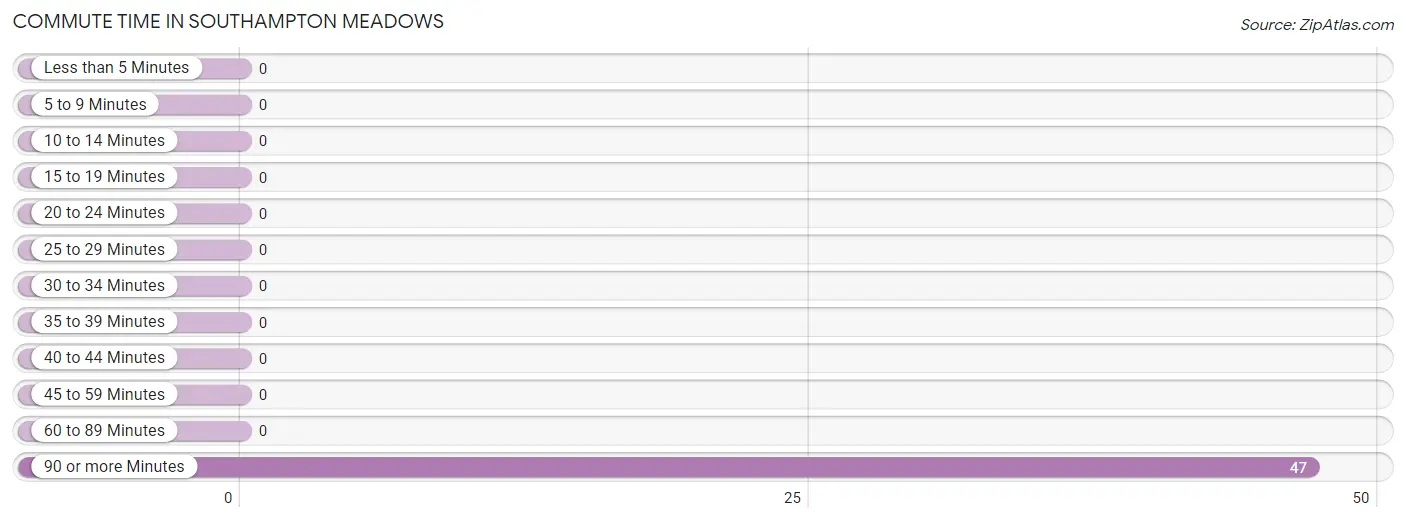
| Commute Time | # Commuters | % Commuters |
| Less than 5 Minutes | 0 | 0.0% |
| 5 to 9 Minutes | 0 | 0.0% |
| 10 to 14 Minutes | 0 | 0.0% |
| 15 to 19 Minutes | 0 | 0.0% |
| 20 to 24 Minutes | 0 | 0.0% |
| 25 to 29 Minutes | 0 | 0.0% |
| 30 to 34 Minutes | 0 | 0.0% |
| 35 to 39 Minutes | 0 | 0.0% |
| 40 to 44 Minutes | 0 | 0.0% |
| 45 to 59 Minutes | 0 | 0.0% |
| 60 to 89 Minutes | 0 | 0.0% |
| 90 or more Minutes | 47 | 100.0% |
Commute Time by Sex in Southampton Meadows
The most common commute times in Southampton Meadows are 90 or more minutes (27 commuters, 100.0%) for males and 90 or more minutes (20 commuters, 100.0%) for females.
| Commute Time | Male | Female |
| Less than 5 Minutes | 0 (0.0%) | 0 (0.0%) |
| 5 to 9 Minutes | 0 (0.0%) | 0 (0.0%) |
| 10 to 14 Minutes | 0 (0.0%) | 0 (0.0%) |
| 15 to 19 Minutes | 0 (0.0%) | 0 (0.0%) |
| 20 to 24 Minutes | 0 (0.0%) | 0 (0.0%) |
| 25 to 29 Minutes | 0 (0.0%) | 0 (0.0%) |
| 30 to 34 Minutes | 0 (0.0%) | 0 (0.0%) |
| 35 to 39 Minutes | 0 (0.0%) | 0 (0.0%) |
| 40 to 44 Minutes | 0 (0.0%) | 0 (0.0%) |
| 45 to 59 Minutes | 0 (0.0%) | 0 (0.0%) |
| 60 to 89 Minutes | 0 (0.0%) | 0 (0.0%) |
| 90 or more Minutes | 27 (100.0%) | 20 (100.0%) |
Time of Departure to Work by Sex in Southampton Meadows
The most frequent times of departure to work in Southampton Meadows are 5:30 AM to 5:59 AM (27, 100.0%) for males and 5:30 AM to 5:59 AM (20, 100.0%) for females.
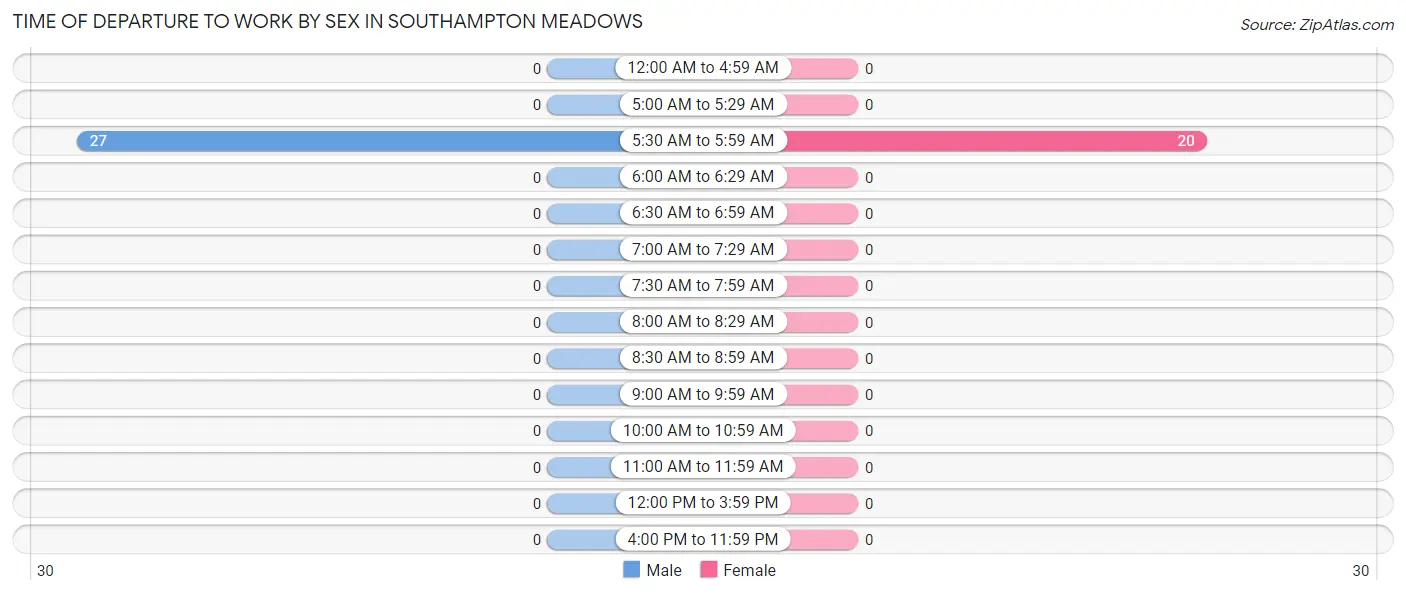
| Time of Departure | Male | Female |
| 12:00 AM to 4:59 AM | 0 (0.0%) | 0 (0.0%) |
| 5:00 AM to 5:29 AM | 0 (0.0%) | 0 (0.0%) |
| 5:30 AM to 5:59 AM | 27 (100.0%) | 20 (100.0%) |
| 6:00 AM to 6:29 AM | 0 (0.0%) | 0 (0.0%) |
| 6:30 AM to 6:59 AM | 0 (0.0%) | 0 (0.0%) |
| 7:00 AM to 7:29 AM | 0 (0.0%) | 0 (0.0%) |
| 7:30 AM to 7:59 AM | 0 (0.0%) | 0 (0.0%) |
| 8:00 AM to 8:29 AM | 0 (0.0%) | 0 (0.0%) |
| 8:30 AM to 8:59 AM | 0 (0.0%) | 0 (0.0%) |
| 9:00 AM to 9:59 AM | 0 (0.0%) | 0 (0.0%) |
| 10:00 AM to 10:59 AM | 0 (0.0%) | 0 (0.0%) |
| 11:00 AM to 11:59 AM | 0 (0.0%) | 0 (0.0%) |
| 12:00 PM to 3:59 PM | 0 (0.0%) | 0 (0.0%) |
| 4:00 PM to 11:59 PM | 0 (0.0%) | 0 (0.0%) |
| Total | 27 (100.0%) | 20 (100.0%) |
Housing Occupancy in Southampton Meadows
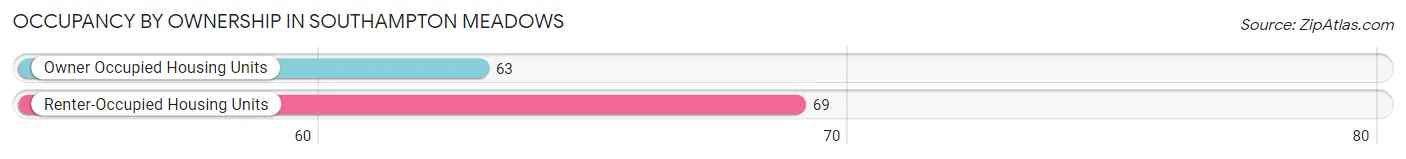
Occupancy by Ownership in Southampton Meadows
Of the total 132 dwellings in Southampton Meadows, owner-occupied units account for 63 (47.7%), while renter-occupied units make up 69 (52.3%).
| Occupancy | # Housing Units | % Housing Units |
| Owner Occupied Housing Units | 63 | 47.7% |
| Renter-Occupied Housing Units | 69 | 52.3% |
| Total Occupied Housing Units | 132 | 100.0% |
Occupancy by Household Size in Southampton Meadows
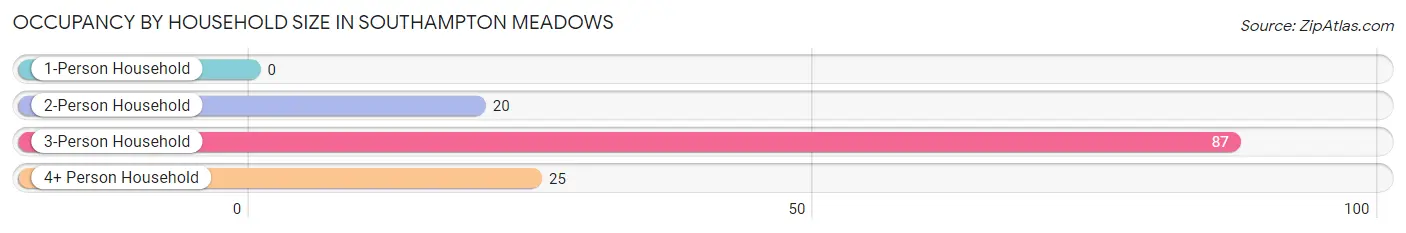
| Household Size | # Housing Units | % Housing Units |
| 1-Person Household | 0 | 0.0% |
| 2-Person Household | 20 | 15.1% |
| 3-Person Household | 87 | 65.9% |
| 4+ Person Household | 25 | 18.9% |
| Total Housing Units | 132 | 100.0% |
Occupancy by Ownership by Household Size in Southampton Meadows
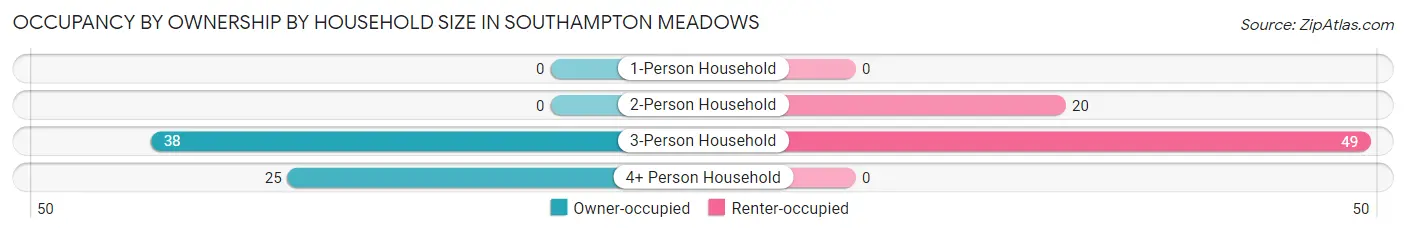
| Household Size | Owner-occupied | Renter-occupied |
| 1-Person Household | 0 (0.0%) | 0 (0.0%) |
| 2-Person Household | 0 (0.0%) | 20 (100.0%) |
| 3-Person Household | 38 (43.7%) | 49 (56.3%) |
| 4+ Person Household | 25 (100.0%) | 0 (0.0%) |
| Total Housing Units | 63 (47.7%) | 69 (52.3%) |
Occupancy by Educational Attainment in Southampton Meadows
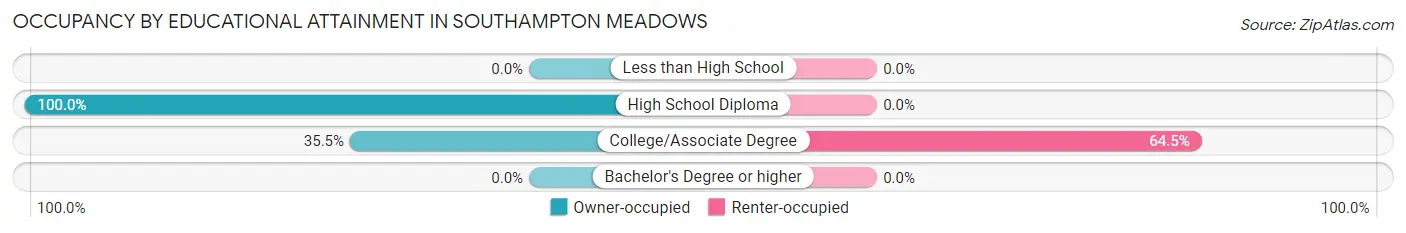
| Household Size | Owner-occupied | Renter-occupied |
| Less than High School | 0 (0.0%) | 0 (0.0%) |
| High School Diploma | 25 (100.0%) | 0 (0.0%) |
| College/Associate Degree | 38 (35.5%) | 69 (64.5%) |
| Bachelor's Degree or higher | 0 (0.0%) | 0 (0.0%) |
Occupancy by Age of Householder in Southampton Meadows
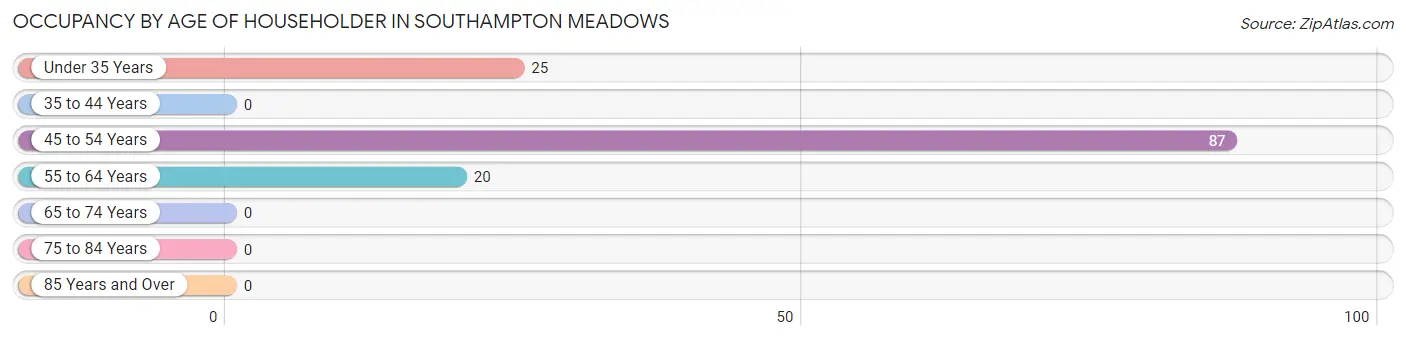
| Age Bracket | # Households | % Households |
| Under 35 Years | 25 | 18.9% |
| 35 to 44 Years | 0 | 0.0% |
| 45 to 54 Years | 87 | 65.9% |
| 55 to 64 Years | 20 | 15.1% |
| 65 to 74 Years | 0 | 0.0% |
| 75 to 84 Years | 0 | 0.0% |
| 85 Years and Over | 0 | 0.0% |
| Total | 132 | 100.0% |
Housing Finances in Southampton Meadows
Median Income by Occupancy in Southampton Meadows
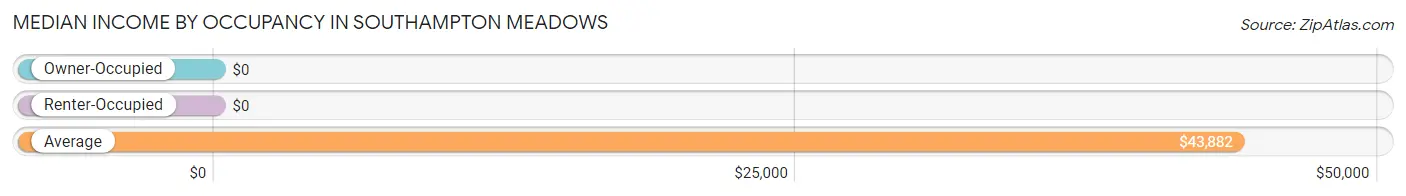
| Occupancy Type | # Households | Median Income |
| Owner-Occupied | 63 (47.7%) | $0 |
| Renter-Occupied | 69 (52.3%) | $0 |
| Average | 132 (100.0%) | $43,882 |
Occupancy by Householder Income Bracket in Southampton Meadows
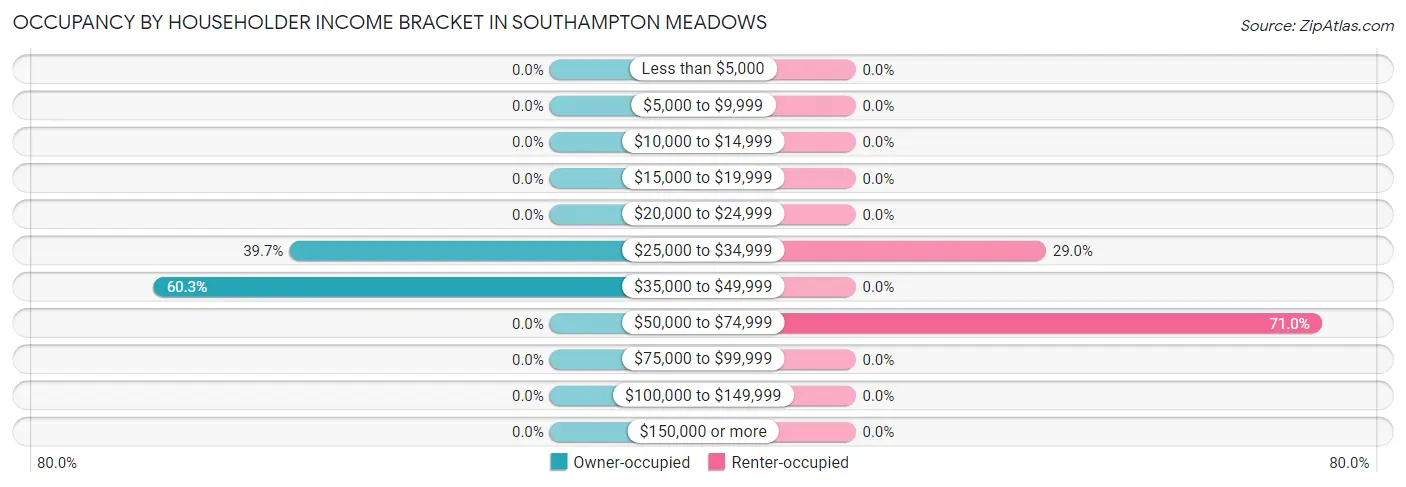
| Income Bracket | Owner-occupied | Renter-occupied |
| Less than $5,000 | 0 (0.0%) | 0 (0.0%) |
| $5,000 to $9,999 | 0 (0.0%) | 0 (0.0%) |
| $10,000 to $14,999 | 0 (0.0%) | 0 (0.0%) |
| $15,000 to $19,999 | 0 (0.0%) | 0 (0.0%) |
| $20,000 to $24,999 | 0 (0.0%) | 0 (0.0%) |
| $25,000 to $34,999 | 25 (39.7%) | 20 (29.0%) |
| $35,000 to $49,999 | 38 (60.3%) | 0 (0.0%) |
| $50,000 to $74,999 | 0 (0.0%) | 49 (71.0%) |
| $75,000 to $99,999 | 0 (0.0%) | 0 (0.0%) |
| $100,000 to $149,999 | 0 (0.0%) | 0 (0.0%) |
| $150,000 or more | 0 (0.0%) | 0 (0.0%) |
| Total | 63 (100.0%) | 69 (100.0%) |
Monthly Housing Cost Tiers in Southampton Meadows
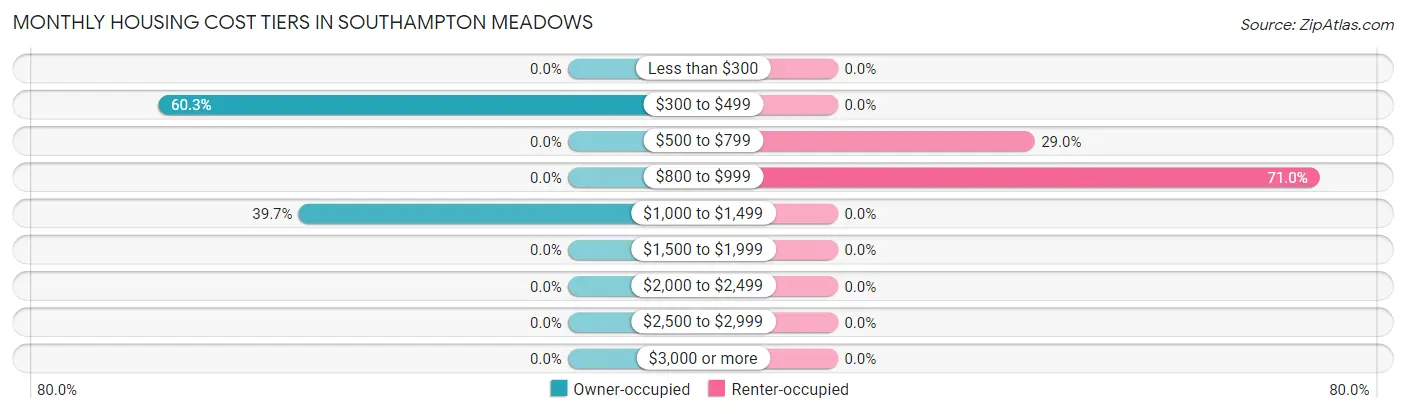
| Monthly Cost | Owner-occupied | Renter-occupied |
| Less than $300 | 0 (0.0%) | 0 (0.0%) |
| $300 to $499 | 38 (60.3%) | 0 (0.0%) |
| $500 to $799 | 0 (0.0%) | 20 (29.0%) |
| $800 to $999 | 0 (0.0%) | 49 (71.0%) |
| $1,000 to $1,499 | 25 (39.7%) | 0 (0.0%) |
| $1,500 to $1,999 | 0 (0.0%) | 0 (0.0%) |
| $2,000 to $2,499 | 0 (0.0%) | 0 (0.0%) |
| $2,500 to $2,999 | 0 (0.0%) | 0 (0.0%) |
| $3,000 or more | 0 (0.0%) | 0 (0.0%) |
| Total | 63 (100.0%) | 69 (100.0%) |
Physical Housing Characteristics in Southampton Meadows
Housing Structures in Southampton Meadows
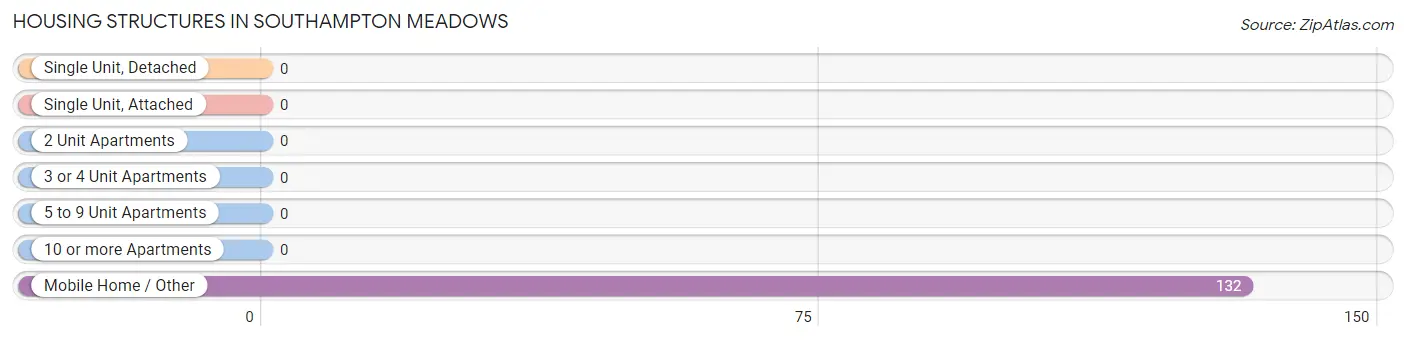
| Structure Type | # Housing Units | % Housing Units |
| Single Unit, Detached | 0 | 0.0% |
| Single Unit, Attached | 0 | 0.0% |
| 2 Unit Apartments | 0 | 0.0% |
| 3 or 4 Unit Apartments | 0 | 0.0% |
| 5 to 9 Unit Apartments | 0 | 0.0% |
| 10 or more Apartments | 0 | 0.0% |
| Mobile Home / Other | 132 | 100.0% |
| Total | 132 | 100.0% |
Housing Structures by Occupancy in Southampton Meadows
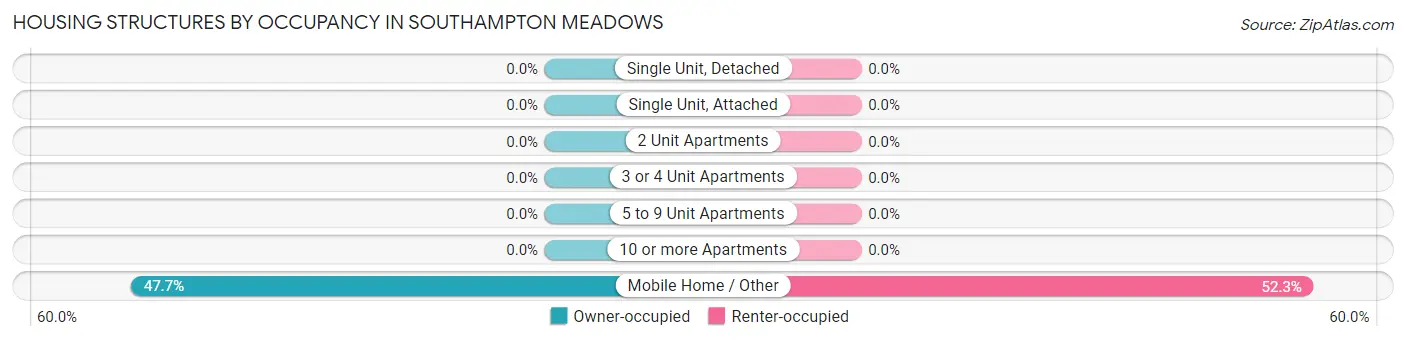
| Structure Type | Owner-occupied | Renter-occupied |
| Single Unit, Detached | 0 (0.0%) | 0 (0.0%) |
| Single Unit, Attached | 0 (0.0%) | 0 (0.0%) |
| 2 Unit Apartments | 0 (0.0%) | 0 (0.0%) |
| 3 or 4 Unit Apartments | 0 (0.0%) | 0 (0.0%) |
| 5 to 9 Unit Apartments | 0 (0.0%) | 0 (0.0%) |
| 10 or more Apartments | 0 (0.0%) | 0 (0.0%) |
| Mobile Home / Other | 63 (47.7%) | 69 (52.3%) |
| Total | 63 (47.7%) | 69 (52.3%) |
Housing Structures by Number of Rooms in Southampton Meadows
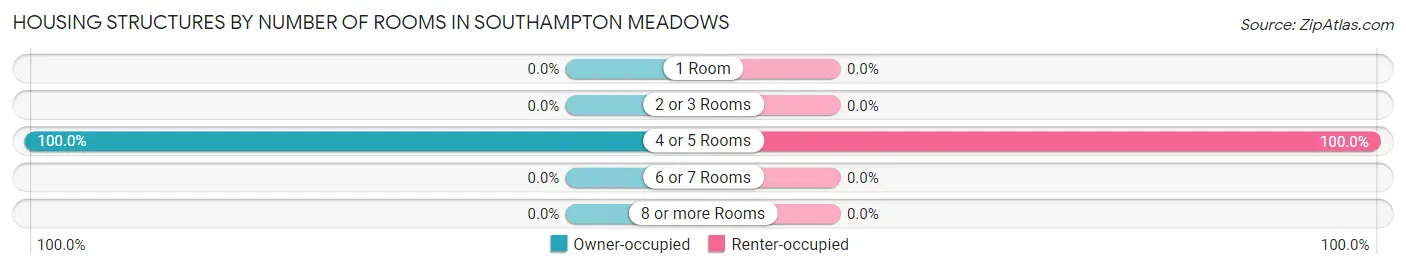
| Number of Rooms | Owner-occupied | Renter-occupied |
| 1 Room | 0 (0.0%) | 0 (0.0%) |
| 2 or 3 Rooms | 0 (0.0%) | 0 (0.0%) |
| 4 or 5 Rooms | 63 (100.0%) | 69 (100.0%) |
| 6 or 7 Rooms | 0 (0.0%) | 0 (0.0%) |
| 8 or more Rooms | 0 (0.0%) | 0 (0.0%) |
| Total | 63 (100.0%) | 69 (100.0%) |
Housing Structure by Heating Type in Southampton Meadows
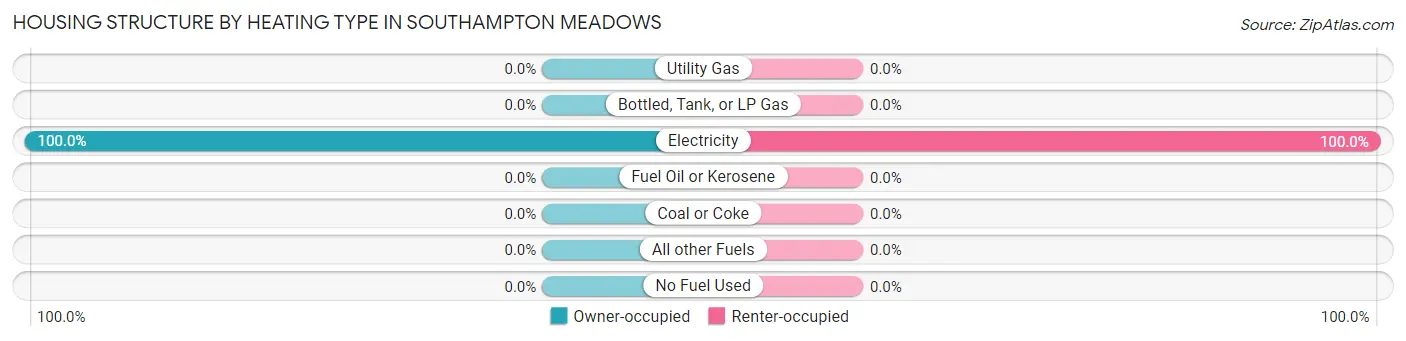
| Heating Type | Owner-occupied | Renter-occupied |
| Utility Gas | 0 (0.0%) | 0 (0.0%) |
| Bottled, Tank, or LP Gas | 0 (0.0%) | 0 (0.0%) |
| Electricity | 63 (100.0%) | 69 (100.0%) |
| Fuel Oil or Kerosene | 0 (0.0%) | 0 (0.0%) |
| Coal or Coke | 0 (0.0%) | 0 (0.0%) |
| All other Fuels | 0 (0.0%) | 0 (0.0%) |
| No Fuel Used | 0 (0.0%) | 0 (0.0%) |
| Total | 63 (100.0%) | 69 (100.0%) |
Household Vehicle Usage in Southampton Meadows
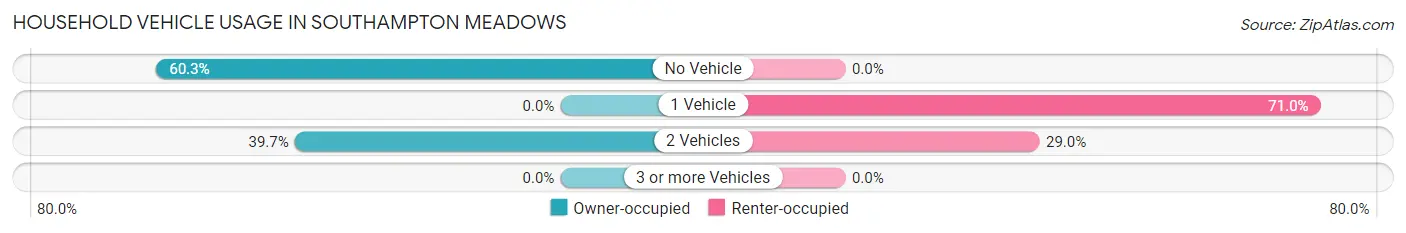
| Vehicles per Household | Owner-occupied | Renter-occupied |
| No Vehicle | 38 (60.3%) | 0 (0.0%) |
| 1 Vehicle | 0 (0.0%) | 49 (71.0%) |
| 2 Vehicles | 25 (39.7%) | 20 (29.0%) |
| 3 or more Vehicles | 0 (0.0%) | 0 (0.0%) |
| Total | 63 (100.0%) | 69 (100.0%) |
Real Estate & Mortgages in Southampton Meadows
Real Estate and Mortgage Overview in Southampton Meadows
| Characteristic | Without Mortgage | With Mortgage |
| Housing Units | 63 | 0 |
| Median Property Value | - | - |
| Median Household Income | - | - |
| Monthly Housing Costs | - | - |
| Real Estate Taxes | - | - |
Property Value by Mortgage Status in Southampton Meadows
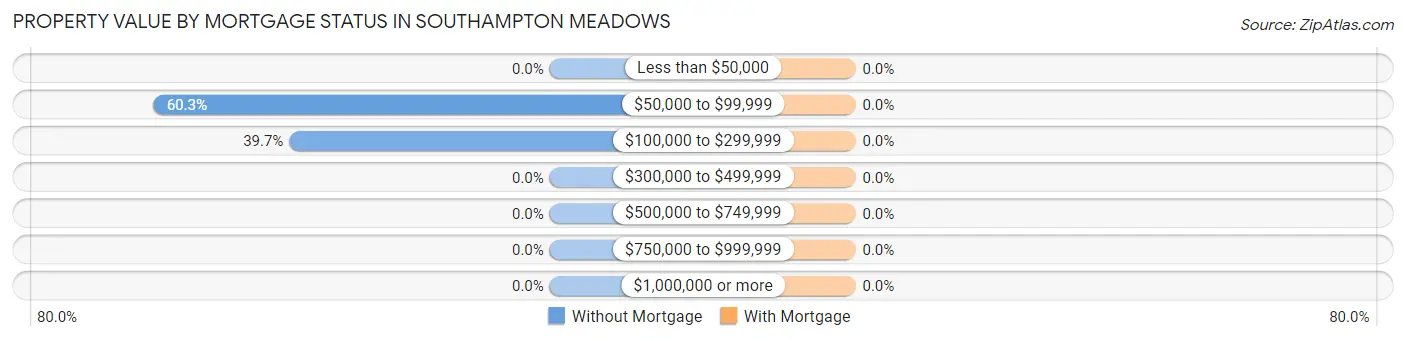
| Property Value | Without Mortgage | With Mortgage |
| Less than $50,000 | 0 (0.0%) | 0 (0.0%) |
| $50,000 to $99,999 | 38 (60.3%) | 0 (0.0%) |
| $100,000 to $299,999 | 25 (39.7%) | 0 (0.0%) |
| $300,000 to $499,999 | 0 (0.0%) | 0 (0.0%) |
| $500,000 to $749,999 | 0 (0.0%) | 0 (0.0%) |
| $750,000 to $999,999 | 0 (0.0%) | 0 (0.0%) |
| $1,000,000 or more | 0 (0.0%) | 0 (0.0%) |
| Total | 63 (100.0%) | 0 (0.0%) |
Household Income by Mortgage Status in Southampton Meadows
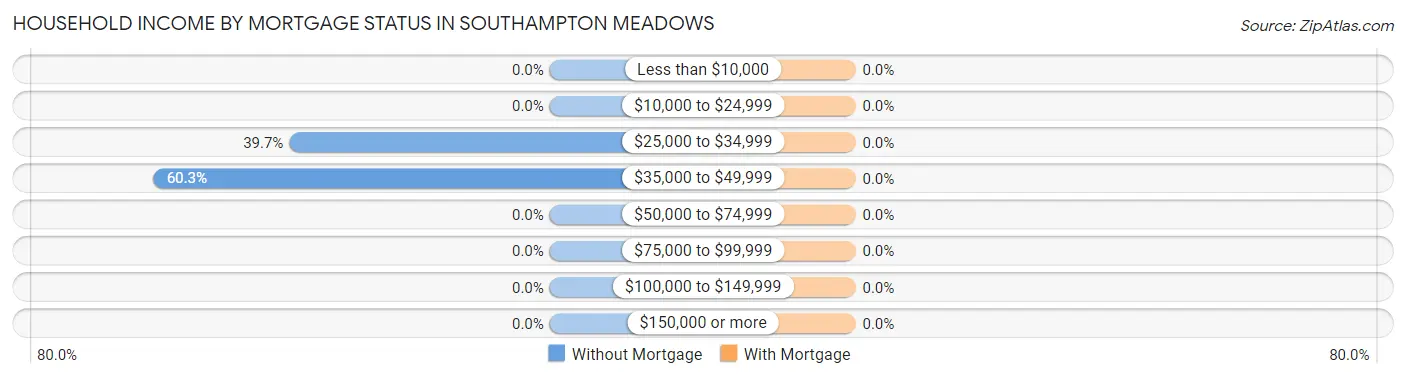
| Household Income | Without Mortgage | With Mortgage |
| Less than $10,000 | 0 (0.0%) | 0 (0.0%) |
| $10,000 to $24,999 | 0 (0.0%) | 0 (0.0%) |
| $25,000 to $34,999 | 25 (39.7%) | 0 (0.0%) |
| $35,000 to $49,999 | 38 (60.3%) | 0 (0.0%) |
| $50,000 to $74,999 | 0 (0.0%) | 0 (0.0%) |
| $75,000 to $99,999 | 0 (0.0%) | 0 (0.0%) |
| $100,000 to $149,999 | 0 (0.0%) | 0 (0.0%) |
| $150,000 or more | 0 (0.0%) | 0 (0.0%) |
| Total | 63 (100.0%) | 0 (0.0%) |
Property Value to Household Income Ratio in Southampton Meadows
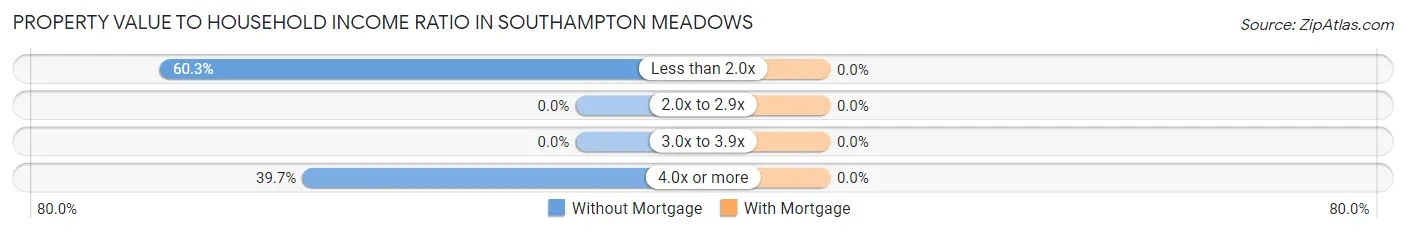
| Value-to-Income Ratio | Without Mortgage | With Mortgage |
| Less than 2.0x | 38 (60.3%) | 0 (0.0%) |
| 2.0x to 2.9x | 0 (0.0%) | 0 (0.0%) |
| 3.0x to 3.9x | 0 (0.0%) | 0 (0.0%) |
| 4.0x or more | 25 (39.7%) | 0 (0.0%) |
| Total | 63 (100.0%) | 0 (0.0%) |
Real Estate Taxes by Mortgage Status in Southampton Meadows
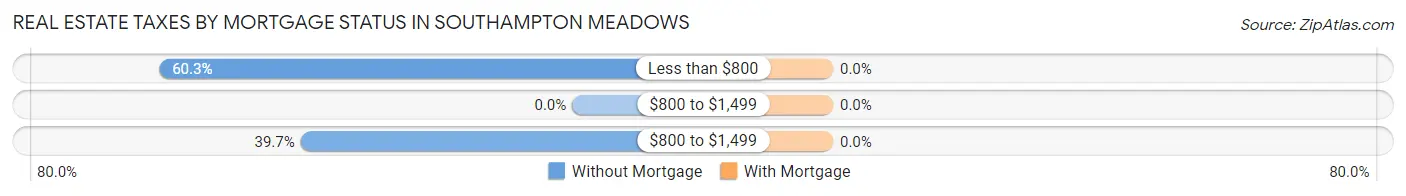
| Property Taxes | Without Mortgage | With Mortgage |
| Less than $800 | 38 (60.3%) | 0 (0.0%) |
| $800 to $1,499 | 0 (0.0%) | 0 (0.0%) |
| $800 to $1,499 | 25 (39.7%) | 0 (0.0%) |
| Total | 63 (100.0%) | 0 (0.0%) |
Health & Disability in Southampton Meadows
Health Insurance Coverage by Age in Southampton Meadows
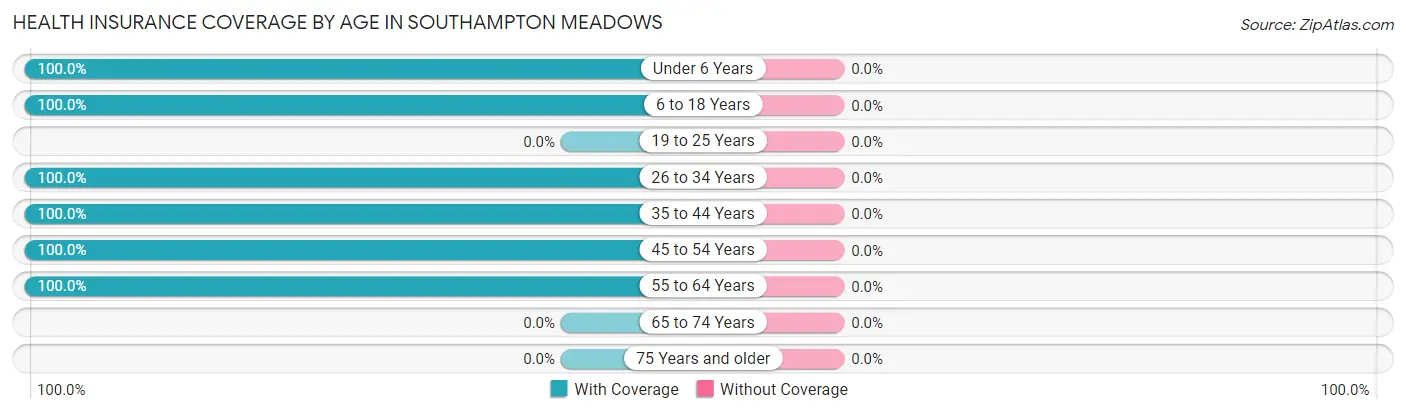
| Age Bracket | With Coverage | Without Coverage |
| Under 6 Years | 26 (100.0%) | 0 (0.0%) |
| 6 to 18 Years | 123 (100.0%) | 0 (0.0%) |
| 19 to 25 Years | 0 (0.0%) | 0 (0.0%) |
| 26 to 34 Years | 116 (100.0%) | 0 (0.0%) |
| 35 to 44 Years | 37 (100.0%) | 0 (0.0%) |
| 45 to 54 Years | 130 (100.0%) | 0 (0.0%) |
| 55 to 64 Years | 47 (100.0%) | 0 (0.0%) |
| 65 to 74 Years | 0 (0.0%) | 0 (0.0%) |
| 75 Years and older | 0 (0.0%) | 0 (0.0%) |
| Total | 479 (100.0%) | 0 (0.0%) |
Health Insurance Coverage by Citizenship Status in Southampton Meadows
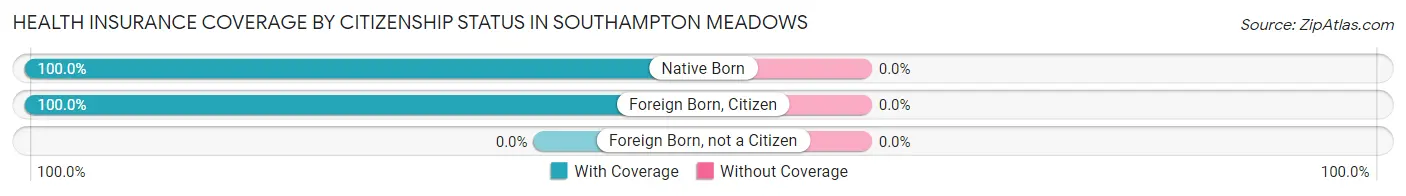
| Citizenship Status | With Coverage | Without Coverage |
| Native Born | 26 (100.0%) | 0 (0.0%) |
| Foreign Born, Citizen | 123 (100.0%) | 0 (0.0%) |
| Foreign Born, not a Citizen | 0 (0.0%) | 0 (0.0%) |
Health Insurance Coverage by Household Income in Southampton Meadows
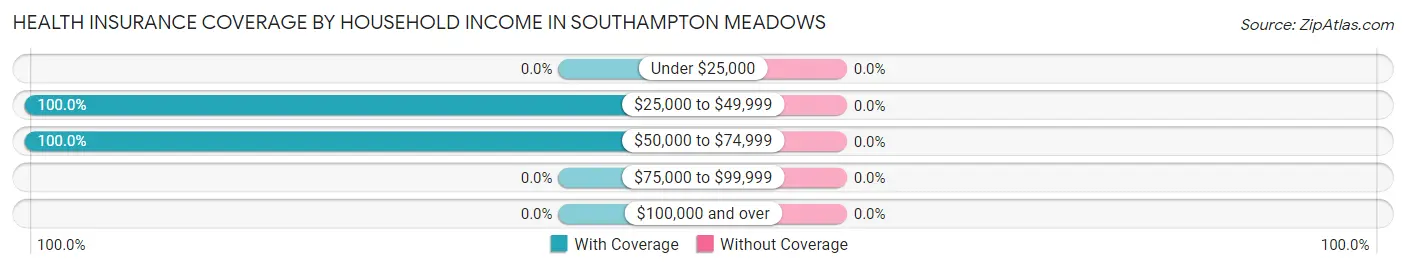
| Household Income | With Coverage | Without Coverage |
| Under $25,000 | 0 (0.0%) | 0 (0.0%) |
| $25,000 to $49,999 | 318 (100.0%) | 0 (0.0%) |
| $50,000 to $74,999 | 161 (100.0%) | 0 (0.0%) |
| $75,000 to $99,999 | 0 (0.0%) | 0 (0.0%) |
| $100,000 and over | 0 (0.0%) | 0 (0.0%) |
Public vs Private Health Insurance Coverage by Age in Southampton Meadows
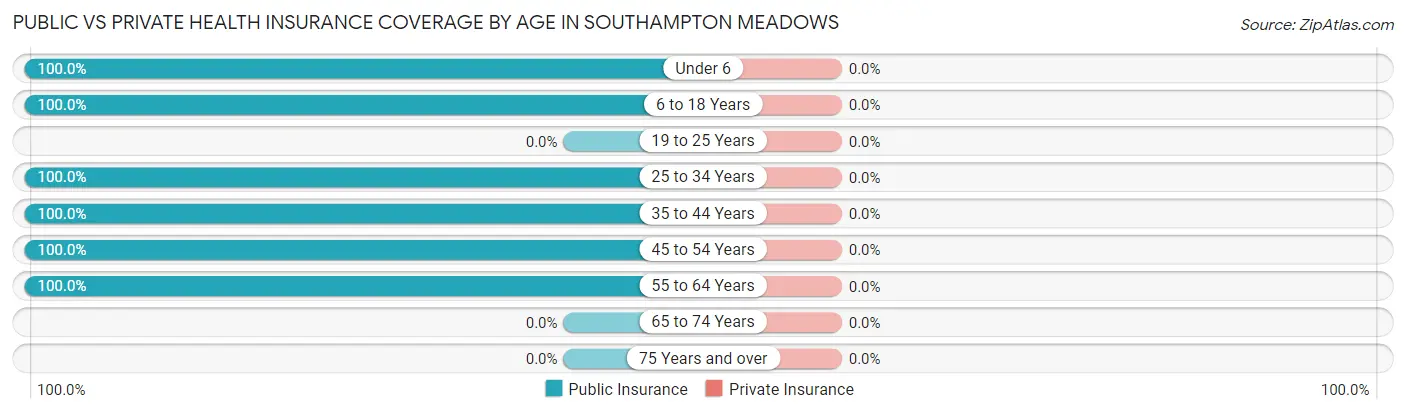
| Age Bracket | Public Insurance | Private Insurance |
| Under 6 | 26 (100.0%) | 0 (0.0%) |
| 6 to 18 Years | 123 (100.0%) | 0 (0.0%) |
| 19 to 25 Years | 0 (0.0%) | 0 (0.0%) |
| 25 to 34 Years | 116 (100.0%) | 0 (0.0%) |
| 35 to 44 Years | 37 (100.0%) | 0 (0.0%) |
| 45 to 54 Years | 130 (100.0%) | 0 (0.0%) |
| 55 to 64 Years | 47 (100.0%) | 0 (0.0%) |
| 65 to 74 Years | 0 (0.0%) | 0 (0.0%) |
| 75 Years and over | 0 (0.0%) | 0 (0.0%) |
| Total | 479 (100.0%) | 0 (0.0%) |
Disability Status by Sex by Age in Southampton Meadows
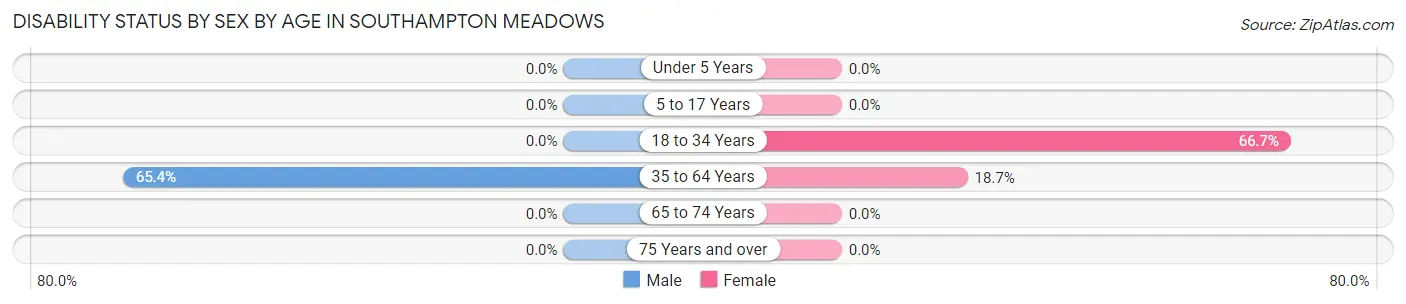
| Age Bracket | Male | Female |
| Under 5 Years | 0 (0.0%) | 0 (0.0%) |
| 5 to 17 Years | 0 (0.0%) | 0 (0.0%) |
| 18 to 34 Years | 0 (0.0%) | 50 (66.7%) |
| 35 to 64 Years | 70 (65.4%) | 20 (18.7%) |
| 65 to 74 Years | 0 (0.0%) | 0 (0.0%) |
| 75 Years and over | 0 (0.0%) | 0 (0.0%) |
Disability Class by Sex by Age in Southampton Meadows
Disability Class: Hearing Difficulty
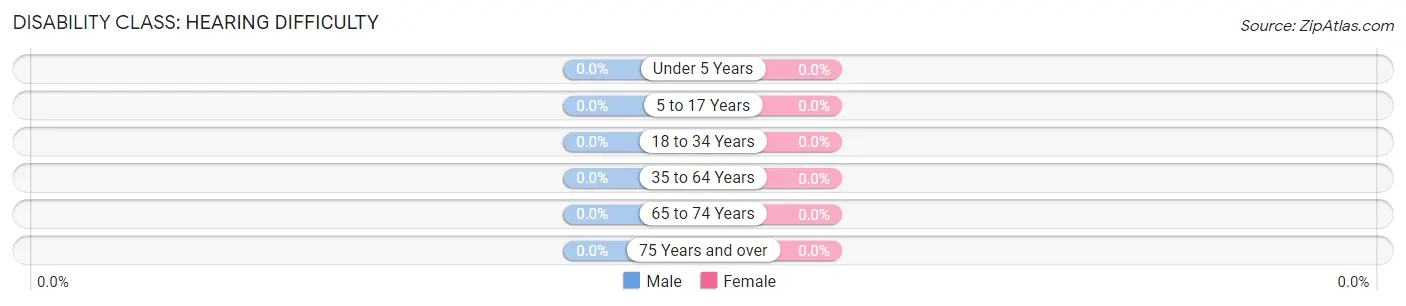
| Age Bracket | Male | Female |
| Under 5 Years | 0 (0.0%) | 0 (0.0%) |
| 5 to 17 Years | 0 (0.0%) | 0 (0.0%) |
| 18 to 34 Years | 0 (0.0%) | 0 (0.0%) |
| 35 to 64 Years | 0 (0.0%) | 0 (0.0%) |
| 65 to 74 Years | 0 (0.0%) | 0 (0.0%) |
| 75 Years and over | 0 (0.0%) | 0 (0.0%) |
Disability Class: Vision Difficulty
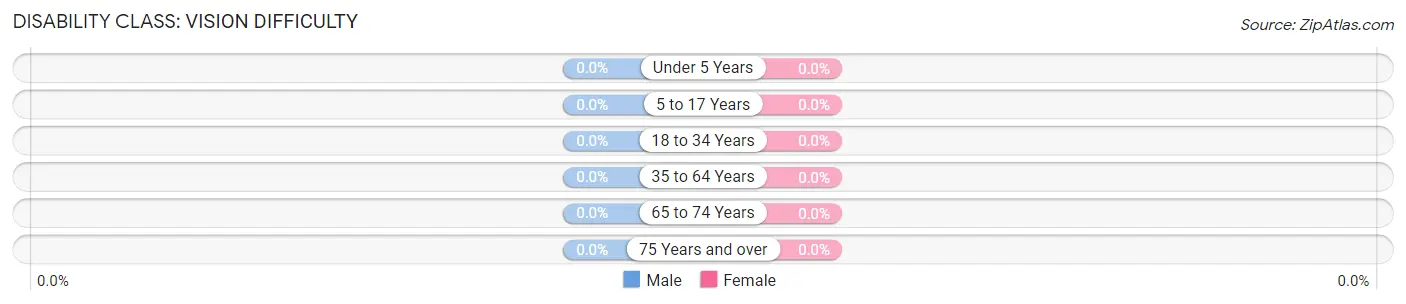
| Age Bracket | Male | Female |
| Under 5 Years | 0 (0.0%) | 0 (0.0%) |
| 5 to 17 Years | 0 (0.0%) | 0 (0.0%) |
| 18 to 34 Years | 0 (0.0%) | 0 (0.0%) |
| 35 to 64 Years | 0 (0.0%) | 0 (0.0%) |
| 65 to 74 Years | 0 (0.0%) | 0 (0.0%) |
| 75 Years and over | 0 (0.0%) | 0 (0.0%) |
Disability Class: Cognitive Difficulty
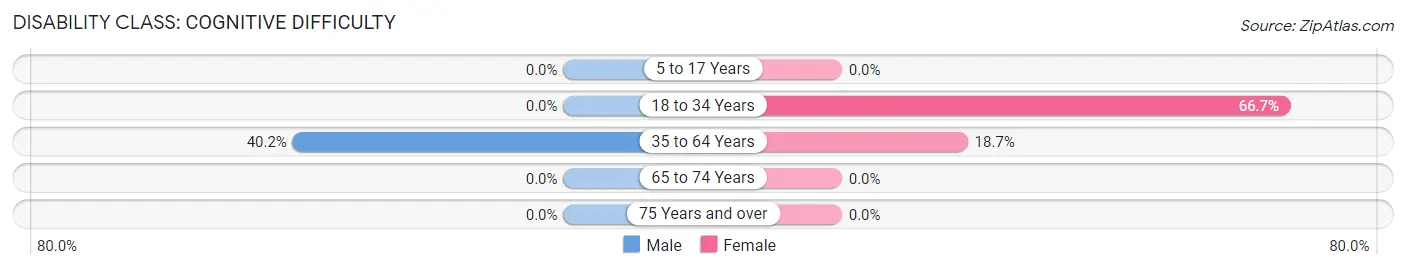
| Age Bracket | Male | Female |
| 5 to 17 Years | 0 (0.0%) | 0 (0.0%) |
| 18 to 34 Years | 0 (0.0%) | 50 (66.7%) |
| 35 to 64 Years | 43 (40.2%) | 20 (18.7%) |
| 65 to 74 Years | 0 (0.0%) | 0 (0.0%) |
| 75 Years and over | 0 (0.0%) | 0 (0.0%) |
Disability Class: Ambulatory Difficulty
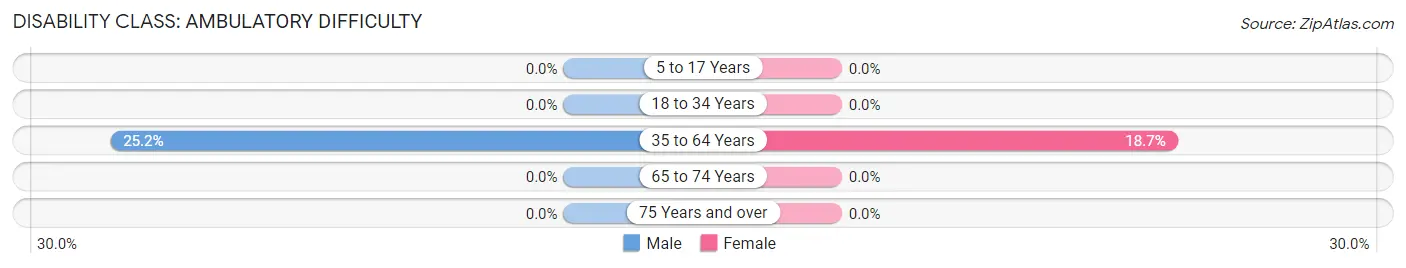
| Age Bracket | Male | Female |
| 5 to 17 Years | 0 (0.0%) | 0 (0.0%) |
| 18 to 34 Years | 0 (0.0%) | 0 (0.0%) |
| 35 to 64 Years | 27 (25.2%) | 20 (18.7%) |
| 65 to 74 Years | 0 (0.0%) | 0 (0.0%) |
| 75 Years and over | 0 (0.0%) | 0 (0.0%) |
Disability Class: Self-Care Difficulty
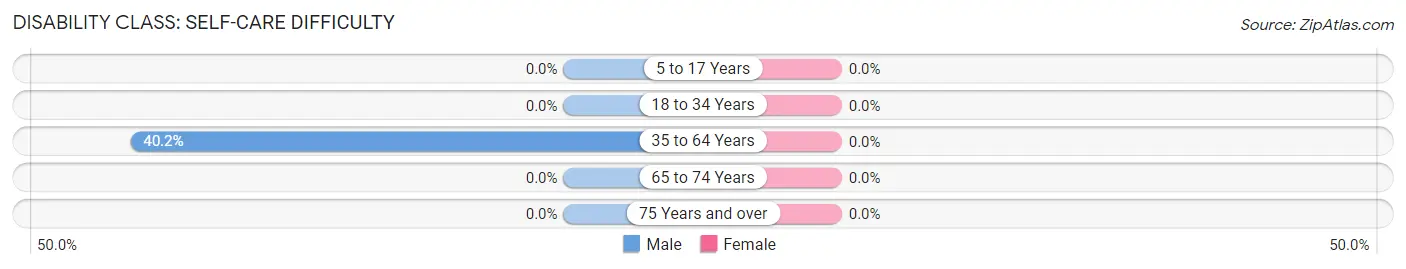
| Age Bracket | Male | Female |
| 5 to 17 Years | 0 (0.0%) | 0 (0.0%) |
| 18 to 34 Years | 0 (0.0%) | 0 (0.0%) |
| 35 to 64 Years | 43 (40.2%) | 0 (0.0%) |
| 65 to 74 Years | 0 (0.0%) | 0 (0.0%) |
| 75 Years and over | 0 (0.0%) | 0 (0.0%) |
Technology Access in Southampton Meadows
Computing Device Access in Southampton Meadows
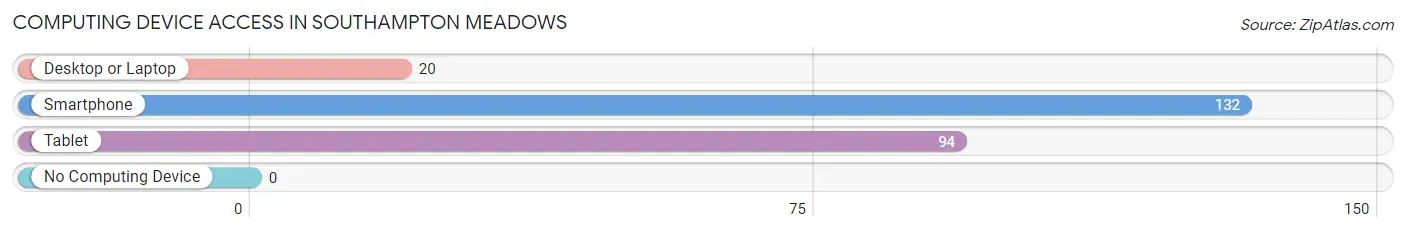
| Device Type | # Households | % Households |
| Desktop or Laptop | 20 | 15.1% |
| Smartphone | 132 | 100.0% |
| Tablet | 94 | 71.2% |
| No Computing Device | 0 | 0.0% |
| Total | 132 | 100.0% |
Internet Access in Southampton Meadows
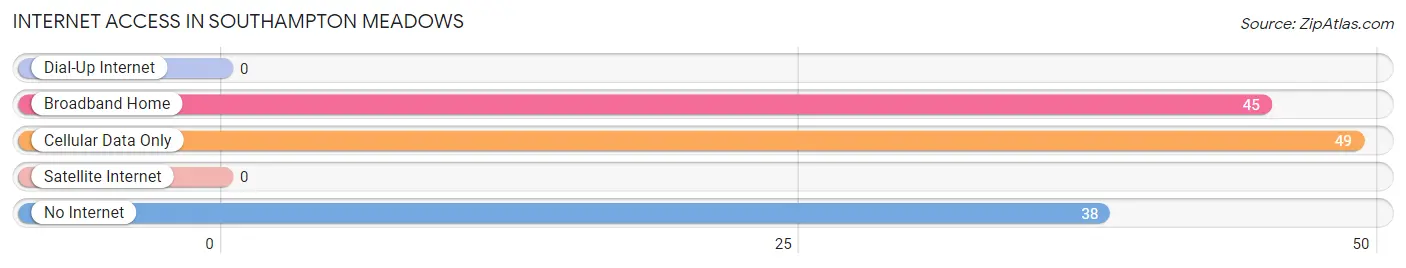
| Internet Type | # Households | % Households |
| Dial-Up Internet | 0 | 0.0% |
| Broadband Home | 45 | 34.1% |
| Cellular Data Only | 49 | 37.1% |
| Satellite Internet | 0 | 0.0% |
| No Internet | 38 | 28.8% |
| Total | 132 | 100.0% |
Southampton Meadows Summary
Southampton Meadows is a small unincorporated community located in Southampton County, Virginia. It is situated on the banks of the Nottoway River, approximately 20 miles south of the city of Franklin. The community is home to a population of approximately 1,000 people, and is known for its rural charm and close-knit community.
History
The area that is now known as Southampton Meadows was first settled in the early 1700s by English colonists. The area was originally part of Isle of Wight County, but was later annexed by Southampton County in 1749. The community was named after the nearby Southampton River, which was named after the English city of Southampton.
The area was largely agricultural in nature, with tobacco being the primary crop. The community was also home to a number of small businesses, including a general store, a blacksmith, and a gristmill.
In the late 1800s, the community began to experience a period of growth and development. The railroad was extended to the area, and a number of new businesses were established. The community also saw the construction of a number of churches, including the Southampton Meadows Baptist Church, which was established in 1891.
Geography
Southampton Meadows is located in the southeastern corner of Southampton County, Virginia. It is situated on the banks of the Nottoway River, approximately 20 miles south of the city of Franklin. The community is located in a rural area, and is surrounded by farmland and woodlands.
The climate in the area is humid subtropical, with hot, humid summers and mild winters. The average annual temperature is around 68 degrees Fahrenheit, and the average annual precipitation is around 45 inches.
Economy
The economy of Southampton Meadows is largely based on agriculture. The area is home to a number of farms, which produce a variety of crops, including corn, soybeans, wheat, and tobacco. The community is also home to a number of small businesses, including a general store, a blacksmith, and a gristmill.
Demographics
As of the 2010 census, the population of Southampton Meadows was 1,000 people. The racial makeup of the community was 94.2% White, 3.2% African American, 0.7% Native American, 0.3% Asian, and 1.6% from other races. The median household income was $37,500, and the median home value was $125,000.
Conclusion
Southampton Meadows is a small unincorporated community located in Southampton County, Virginia. It is situated on the banks of the Nottoway River, approximately 20 miles south of the city of Franklin. The community is home to a population of approximately 1,000 people, and is known for its rural charm and close-knit community. The economy of the area is largely based on agriculture, and the community is home to a number of small businesses. The racial makeup of the community is predominantly White, with a small percentage of African American, Native American, and Asian residents.
Common Questions
What is Per Capita Income in Southampton Meadows?
Per Capita income in Southampton Meadows is $12,128.
What is the Median Family Income in Southampton Meadows?
Median Family Income in Southampton Meadows is $50,102.
What is the Median Household income in Southampton Meadows?
Median Household Income in Southampton Meadows is $43,882.
What is Inequality or Gini Index in Southampton Meadows?
Inequality or Gini Index in Southampton Meadows is 0.11.
What is the Total Population of Southampton Meadows?
Total Population of Southampton Meadows is 479.
What is the Total Male Population of Southampton Meadows?
Total Male Population of Southampton Meadows is 182.
What is the Total Female Population of Southampton Meadows?
Total Female Population of Southampton Meadows is 297.
What is the Ratio of Males per 100 Females in Southampton Meadows?
There are 61.28 Males per 100 Females in Southampton Meadows.
What is the Ratio of Females per 100 Males in Southampton Meadows?
There are 163.19 Females per 100 Males in Southampton Meadows.
What is the Median Population Age in Southampton Meadows?
Median Population Age in Southampton Meadows is 34.4 Years.
What is the Average Family Size in Southampton Meadows
Average Family Size in Southampton Meadows is 3.4 People.
What is the Average Household Size in Southampton Meadows
Average Household Size in Southampton Meadows is 3.6 People.
How Large is the Labor Force in Southampton Meadows?
There are 133 People in the Labor Forcein in Southampton Meadows.
What is the Percentage of People in the Labor Force in Southampton Meadows?
40.3% of People are in the Labor Force in Southampton Meadows.
What is the Unemployment Rate in Southampton Meadows?
Unemployment Rate in Southampton Meadows is 64.7%.