Bland, VA Map & Demographics
Bland Map
Bland Overview
$39,799
PER CAPITA INCOME
$81,563
AVG FAMILY INCOME
$71,000
AVG HOUSEHOLD INCOME
0.41
INEQUALITY / GINI INDEX
433
TOTAL POPULATION
241
MALE POPULATION
192
FEMALE POPULATION
125.52
MALES / 100 FEMALES
79.67
FEMALES / 100 MALES
26.7
MEDIAN AGE
3.2
AVG FAMILY SIZE
2.9
AVG HOUSEHOLD SIZE
196
LABOR FORCE [ PEOPLE ]
59.0%
PERCENT IN LABOR FORCE
6.1%
UNEMPLOYMENT RATE
Bland Zip Codes
Bland Area Codes
Income in Bland
Income Overview in Bland
Per Capita Income in Bland is $39,799, while median incomes of families and households are $81,563 and $71,000 respectively.
| Characteristic | Number | Measure |
| Per Capita Income | 433 | $39,799 |
| Median Family Income | 112 | $81,563 |
| Mean Family Income | 112 | $117,768 |
| Median Household Income | 150 | $71,000 |
| Mean Household Income | 150 | $100,131 |
| Income Deficit | 112 | $0 |
| Wage / Income Gap (%) | 433 | 0.00% |
| Wage / Income Gap ($) | 433 | 100.00¢ per $1 |
| Gini / Inequality Index | 433 | 0.41 |
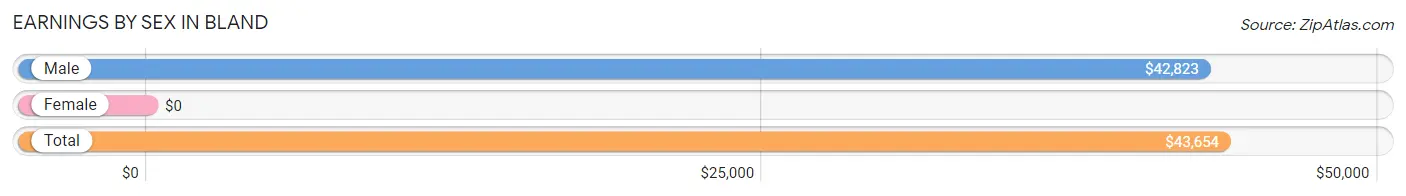
Earnings by Sex in Bland
| Sex | Number | Average Earnings |
| Male | 120 (61.2%) | $42,823 |
| Female | 76 (38.8%) | $0 |
| Total | 196 (100.0%) | $43,654 |
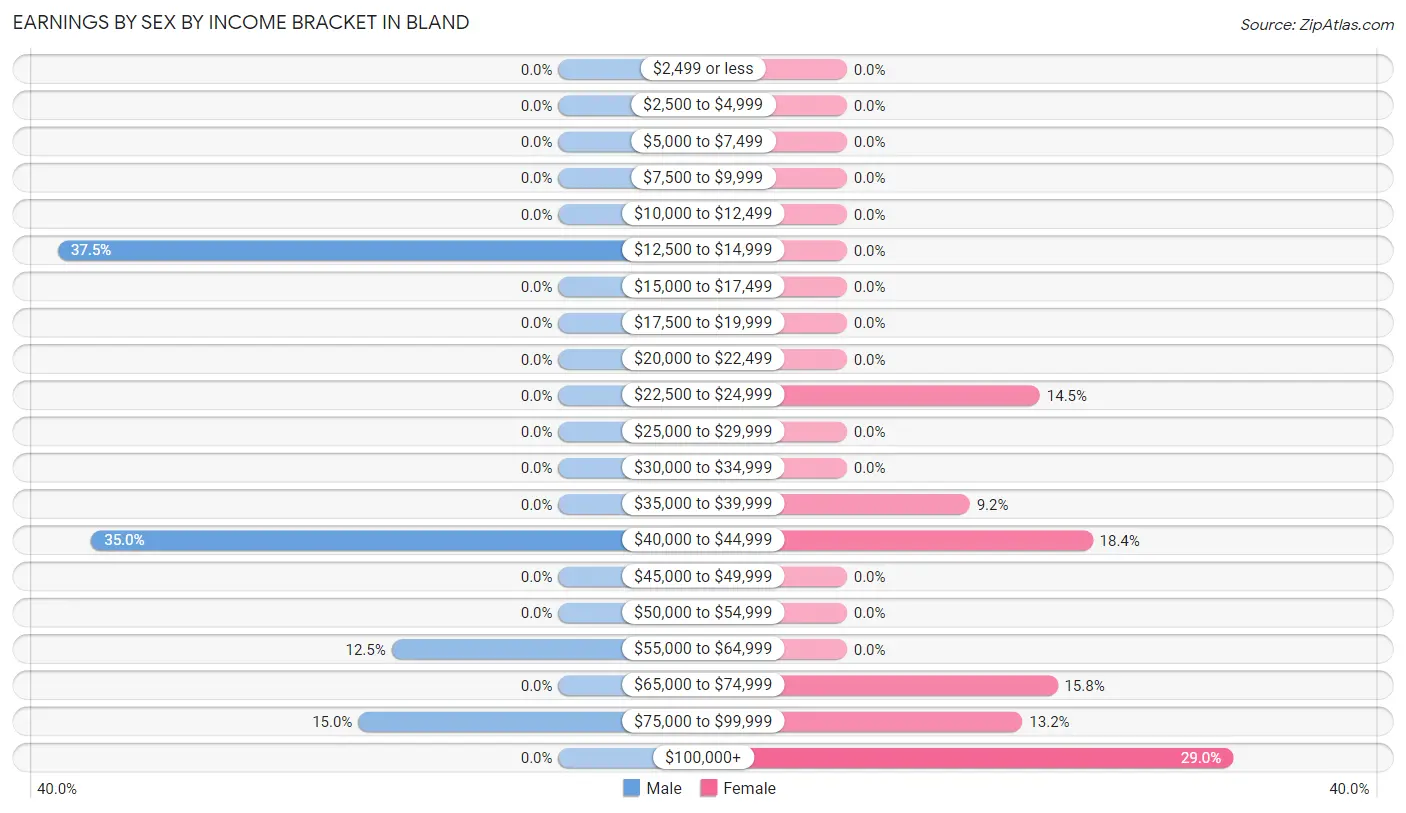
Earnings by Sex by Income Bracket in Bland
The most common earnings brackets in Bland are $12,500 to $14,999 for men (45 | 37.5%) and $100,000+ for women (22 | 28.9%).
| Income | Male | Female |
| $2,499 or less | 0 (0.0%) | 0 (0.0%) |
| $2,500 to $4,999 | 0 (0.0%) | 0 (0.0%) |
| $5,000 to $7,499 | 0 (0.0%) | 0 (0.0%) |
| $7,500 to $9,999 | 0 (0.0%) | 0 (0.0%) |
| $10,000 to $12,499 | 0 (0.0%) | 0 (0.0%) |
| $12,500 to $14,999 | 45 (37.5%) | 0 (0.0%) |
| $15,000 to $17,499 | 0 (0.0%) | 0 (0.0%) |
| $17,500 to $19,999 | 0 (0.0%) | 0 (0.0%) |
| $20,000 to $22,499 | 0 (0.0%) | 0 (0.0%) |
| $22,500 to $24,999 | 0 (0.0%) | 11 (14.5%) |
| $25,000 to $29,999 | 0 (0.0%) | 0 (0.0%) |
| $30,000 to $34,999 | 0 (0.0%) | 0 (0.0%) |
| $35,000 to $39,999 | 0 (0.0%) | 7 (9.2%) |
| $40,000 to $44,999 | 42 (35.0%) | 14 (18.4%) |
| $45,000 to $49,999 | 0 (0.0%) | 0 (0.0%) |
| $50,000 to $54,999 | 0 (0.0%) | 0 (0.0%) |
| $55,000 to $64,999 | 15 (12.5%) | 0 (0.0%) |
| $65,000 to $74,999 | 0 (0.0%) | 12 (15.8%) |
| $75,000 to $99,999 | 18 (15.0%) | 10 (13.2%) |
| $100,000+ | 0 (0.0%) | 22 (28.9%) |
| Total | 120 (100.0%) | 76 (100.0%) |
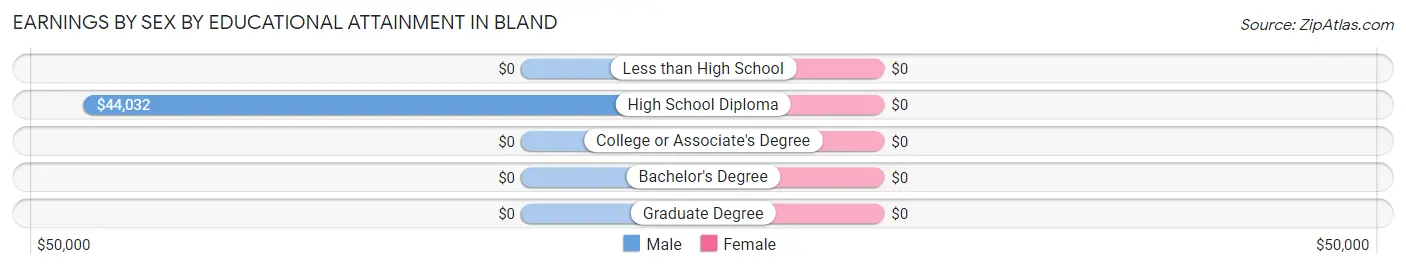
Earnings by Sex by Educational Attainment in Bland
| Educational Attainment | Male Income | Female Income |
| Less than High School | - | - |
| High School Diploma | $44,032 | $0 |
| College or Associate's Degree | - | - |
| Bachelor's Degree | - | - |
| Graduate Degree | - | - |
| Total | $44,637 | $0 |
Family Income in Bland
Family Income Brackets in Bland
According to the Bland family income data, there are 35 families falling into the $75,000 to $99,999 income range, which is the most common income bracket and makes up 31.2% of all families.
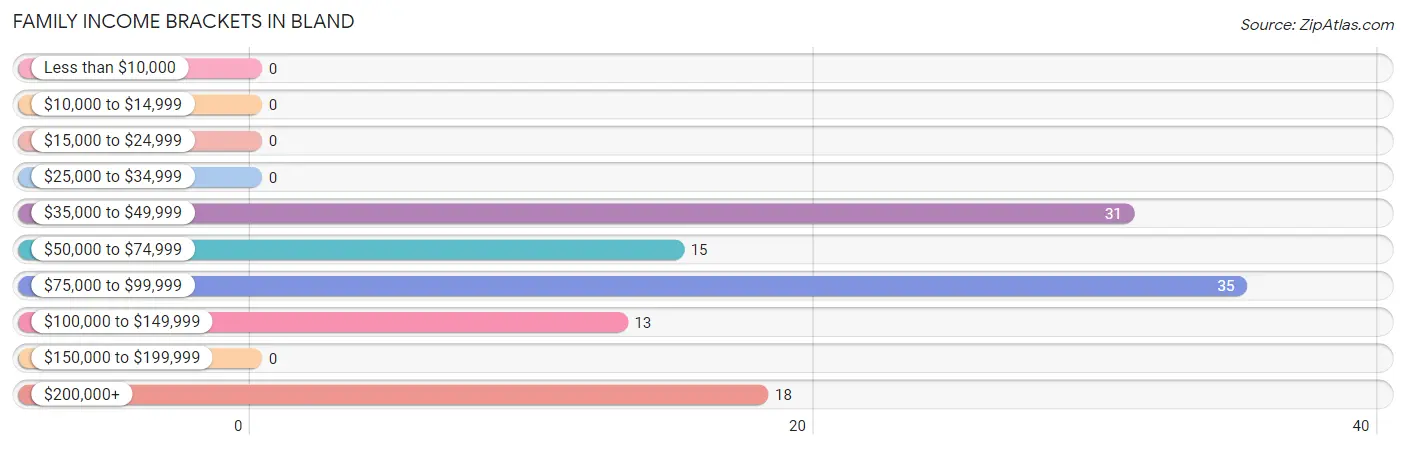
| Income Bracket | # Families | % Families |
| Less than $10,000 | 0 | 0.0% |
| $10,000 to $14,999 | 0 | 0.0% |
| $15,000 to $24,999 | 0 | 0.0% |
| $25,000 to $34,999 | 0 | 0.0% |
| $35,000 to $49,999 | 31 | 27.7% |
| $50,000 to $74,999 | 15 | 13.4% |
| $75,000 to $99,999 | 35 | 31.3% |
| $100,000 to $149,999 | 13 | 11.6% |
| $150,000 to $199,999 | 0 | 0.0% |
| $200,000+ | 18 | 16.1% |
Family Income by Famaliy Size in Bland
2-person families (82 | 73.2%) account for the highest median family income in Bland with $71,667 per family, while 2-person families (82 | 73.2%) have the highest median income of $35,834 per family member.
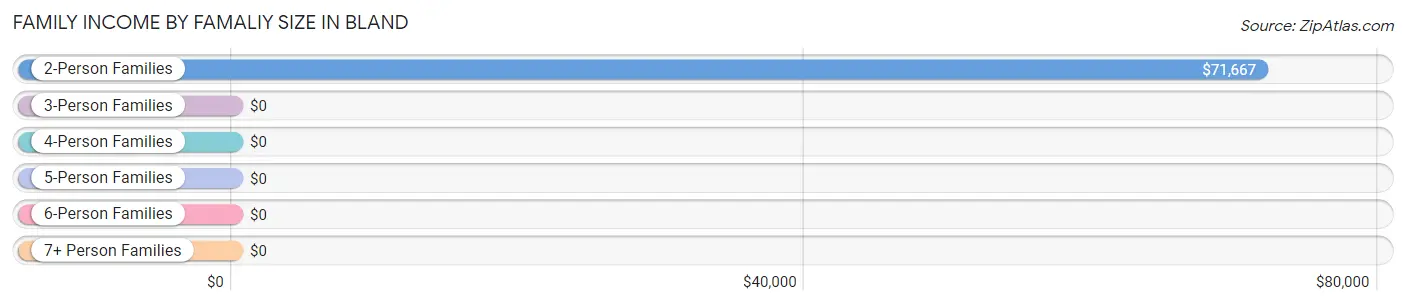
| Income Bracket | # Families | Median Income |
| 2-Person Families | 82 (73.2%) | $71,667 |
| 3-Person Families | 0 (0.0%) | $0 |
| 4-Person Families | 30 (26.8%) | $0 |
| 5-Person Families | 0 (0.0%) | $0 |
| 6-Person Families | 0 (0.0%) | $0 |
| 7+ Person Families | 0 (0.0%) | $0 |
| Total | 112 (100.0%) | $81,563 |
Family Income by Number of Earners in Bland
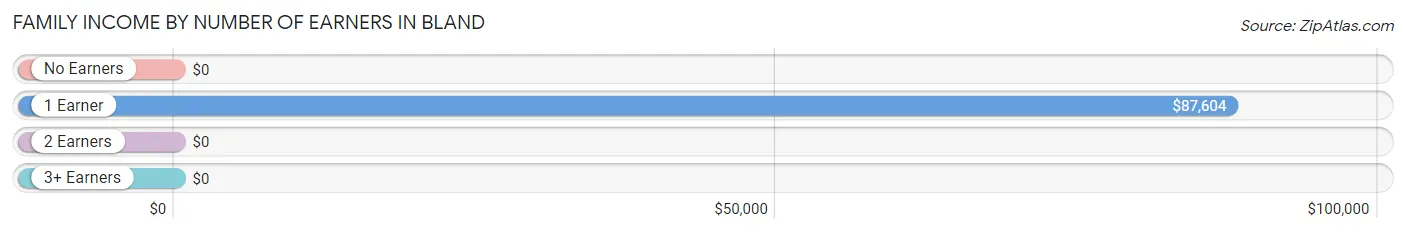
| Number of Earners | # Families | Median Income |
| No Earners | 10 (8.9%) | $0 |
| 1 Earner | 63 (56.2%) | $87,604 |
| 2 Earners | 39 (34.8%) | $0 |
| 3+ Earners | 0 (0.0%) | $0 |
| Total | 112 (100.0%) | $81,563 |
Household Income in Bland
Household Income Brackets in Bland
With 38 households falling in the category, the $35,000 to $49,999 income range is the most frequent in Bland, accounting for 25.3% of all households.
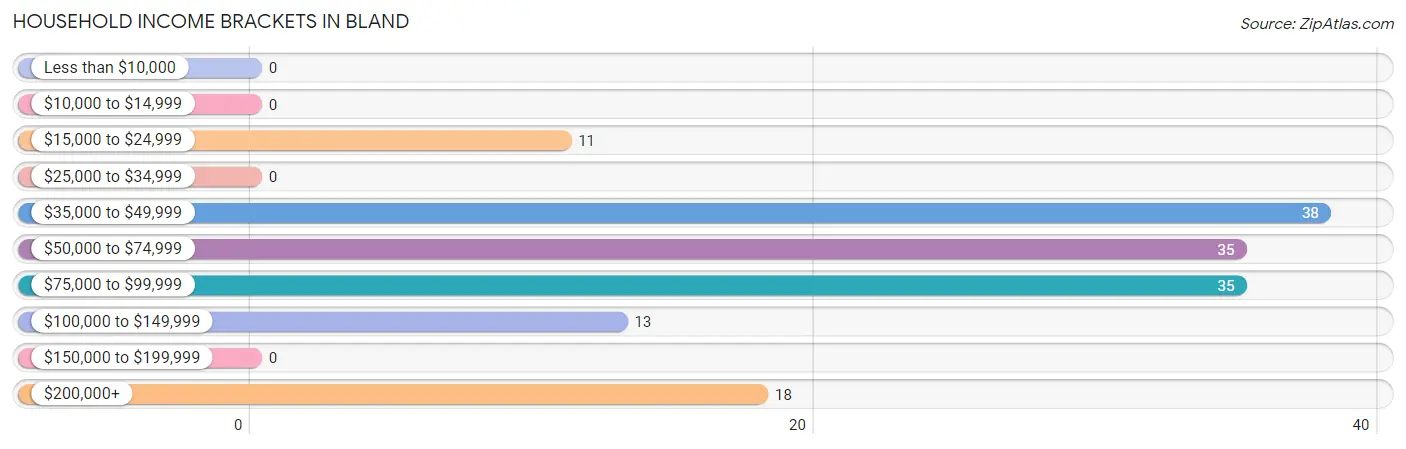
| Income Bracket | # Households | % Households |
| Less than $10,000 | 0 | 0.0% |
| $10,000 to $14,999 | 0 | 0.0% |
| $15,000 to $24,999 | 11 | 7.3% |
| $25,000 to $34,999 | 0 | 0.0% |
| $35,000 to $49,999 | 38 | 25.3% |
| $50,000 to $74,999 | 35 | 23.3% |
| $75,000 to $99,999 | 35 | 23.3% |
| $100,000 to $149,999 | 13 | 8.7% |
| $150,000 to $199,999 | 0 | 0.0% |
| $200,000+ | 18 | 12.0% |
Household Income by Householder Age in Bland
The median household income in Bland is $71,000, with the highest median household income of $80,250 found in the 65+ years age bracket for the primary householder. A total of 42 households (28.0%) fall into this category.
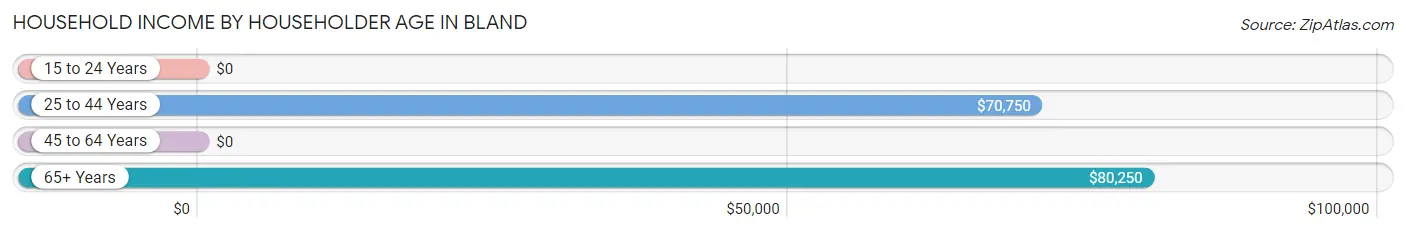
| Income Bracket | # Households | Median Income |
| 15 to 24 Years | 0 (0.0%) | $0 |
| 25 to 44 Years | 93 (62.0%) | $70,750 |
| 45 to 64 Years | 15 (10.0%) | $0 |
| 65+ Years | 42 (28.0%) | $80,250 |
| Total | 150 (100.0%) | $71,000 |
Poverty in Bland
Income Below Poverty by Sex and Age in Bland
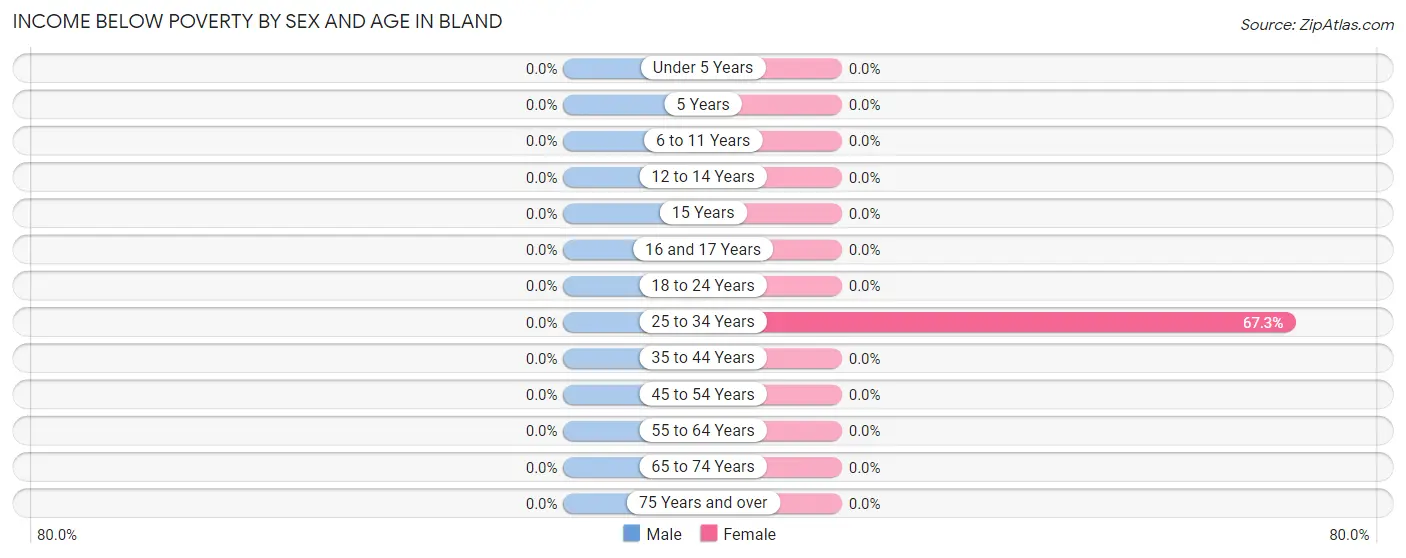
| Age Bracket | Male | Female |
| Under 5 Years | 0 (0.0%) | 0 (0.0%) |
| 5 Years | 0 (0.0%) | 0 (0.0%) |
| 6 to 11 Years | 0 (0.0%) | 0 (0.0%) |
| 12 to 14 Years | 0 (0.0%) | 0 (0.0%) |
| 15 Years | 0 (0.0%) | 0 (0.0%) |
| 16 and 17 Years | 0 (0.0%) | 0 (0.0%) |
| 18 to 24 Years | 0 (0.0%) | 0 (0.0%) |
| 25 to 34 Years | 0 (0.0%) | 35 (67.3%) |
| 35 to 44 Years | 0 (0.0%) | 0 (0.0%) |
| 45 to 54 Years | 0 (0.0%) | 0 (0.0%) |
| 55 to 64 Years | 0 (0.0%) | 0 (0.0%) |
| 65 to 74 Years | 0 (0.0%) | 0 (0.0%) |
| 75 Years and over | 0 (0.0%) | 0 (0.0%) |
| Total | 0 (0.0%) | 35 (18.2%) |
Income Above Poverty by Sex and Age in Bland
According to the poverty statistics in Bland, males aged under 5 years and females aged 6 to 11 years are the age groups that are most secure financially, with 100.0% of males and 100.0% of females in these age groups living above the poverty line.
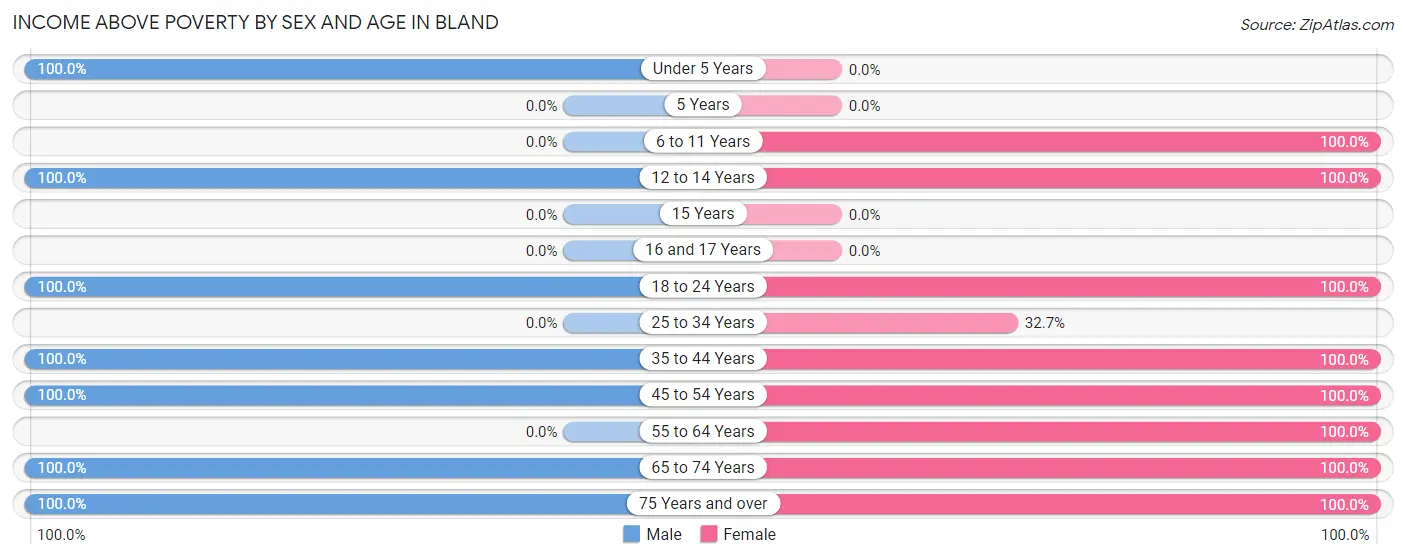
| Age Bracket | Male | Female |
| Under 5 Years | 46 (100.0%) | 0 (0.0%) |
| 5 Years | 0 (0.0%) | 0 (0.0%) |
| 6 to 11 Years | 0 (0.0%) | 12 (100.0%) |
| 12 to 14 Years | 31 (100.0%) | 12 (100.0%) |
| 15 Years | 0 (0.0%) | 0 (0.0%) |
| 16 and 17 Years | 0 (0.0%) | 0 (0.0%) |
| 18 to 24 Years | 45 (100.0%) | 30 (100.0%) |
| 25 to 34 Years | 0 (0.0%) | 17 (32.7%) |
| 35 to 44 Years | 64 (100.0%) | 34 (100.0%) |
| 45 to 54 Years | 9 (100.0%) | 7 (100.0%) |
| 55 to 64 Years | 0 (0.0%) | 18 (100.0%) |
| 65 to 74 Years | 15 (100.0%) | 15 (100.0%) |
| 75 Years and over | 31 (100.0%) | 12 (100.0%) |
| Total | 241 (100.0%) | 157 (81.8%) |
Income Below Poverty Among Married-Couple Families in Bland
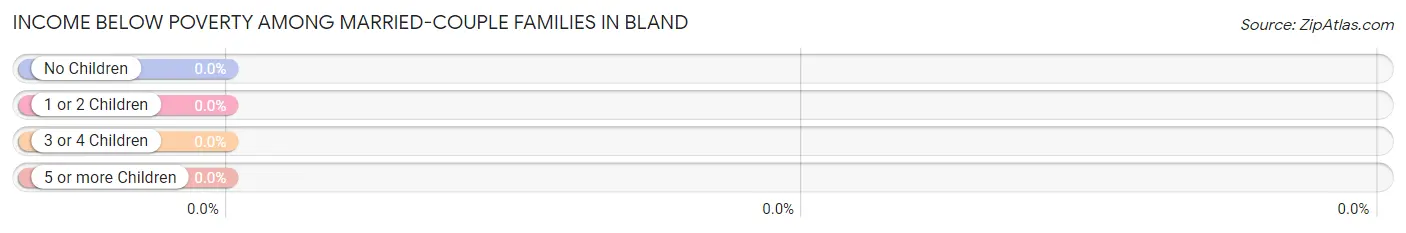
| Children | Above Poverty | Below Poverty |
| No Children | 31 (100.0%) | 0 (0.0%) |
| 1 or 2 Children | 30 (100.0%) | 0 (0.0%) |
| 3 or 4 Children | 0 (0.0%) | 0 (0.0%) |
| 5 or more Children | 0 (0.0%) | 0 (0.0%) |
| Total | 61 (100.0%) | 0 (0.0%) |
Income Below Poverty Among Single-Parent Households in Bland
| Children | Single Father | Single Mother |
| No Children | 0 (0.0%) | 0 (0.0%) |
| 1 or 2 Children | 0 (0.0%) | 0 (0.0%) |
| 3 or 4 Children | 0 (0.0%) | 0 (0.0%) |
| 5 or more Children | 0 (0.0%) | 0 (0.0%) |
| Total | 0 (0.0%) | 0 (0.0%) |
Income Below Poverty Among Married-Couple vs Single-Parent Households in Bland
| Children | Married-Couple Families | Single-Parent Households |
| No Children | 0 (0.0%) | 0 (0.0%) |
| 1 or 2 Children | 0 (0.0%) | 0 (0.0%) |
| 3 or 4 Children | 0 (0.0%) | 0 (0.0%) |
| 5 or more Children | 0 (0.0%) | 0 (0.0%) |
| Total | 0 (0.0%) | 0 (0.0%) |
Race in Bland
The most populous races in Bland are , and White / Caucasian (433 | 100.0%).
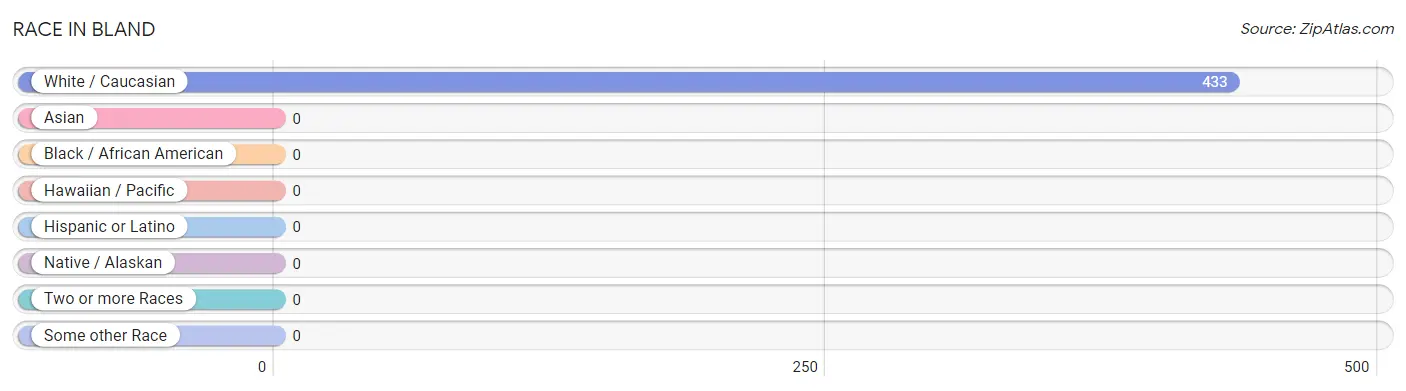
| Race | # Population | % Population |
| Asian | 0 | 0.0% |
| Black / African American | 0 | 0.0% |
| Hawaiian / Pacific | 0 | 0.0% |
| Hispanic or Latino | 0 | 0.0% |
| Native / Alaskan | 0 | 0.0% |
| White / Caucasian | 433 | 100.0% |
| Two or more Races | 0 | 0.0% |
| Some other Race | 0 | 0.0% |
| Total | 433 | 100.0% |
Ancestry in Bland
The most populous ancestries reported in Bland are German (126 | 29.1%), Irish (81 | 18.7%), and English (20 | 4.6%), together accounting for 52.4% of all Bland residents.
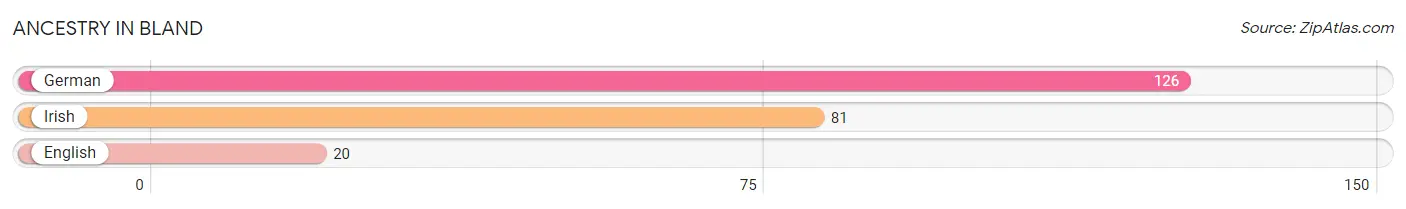
| Ancestry | # Population | % Population |
| English | 20 | 4.6% |
| German | 126 | 29.1% |
| Irish | 81 | 18.7% | View All 3 Rows |
Immigrants in Bland

| Immigration Origin | # Population | % Population | View All 0 Rows |
Sex and Age in Bland
Sex and Age in Bland
The most populous age groups in Bland are Under 5 Years (46 | 19.1%) for men and 25 to 29 Years (52 | 27.1%) for women.
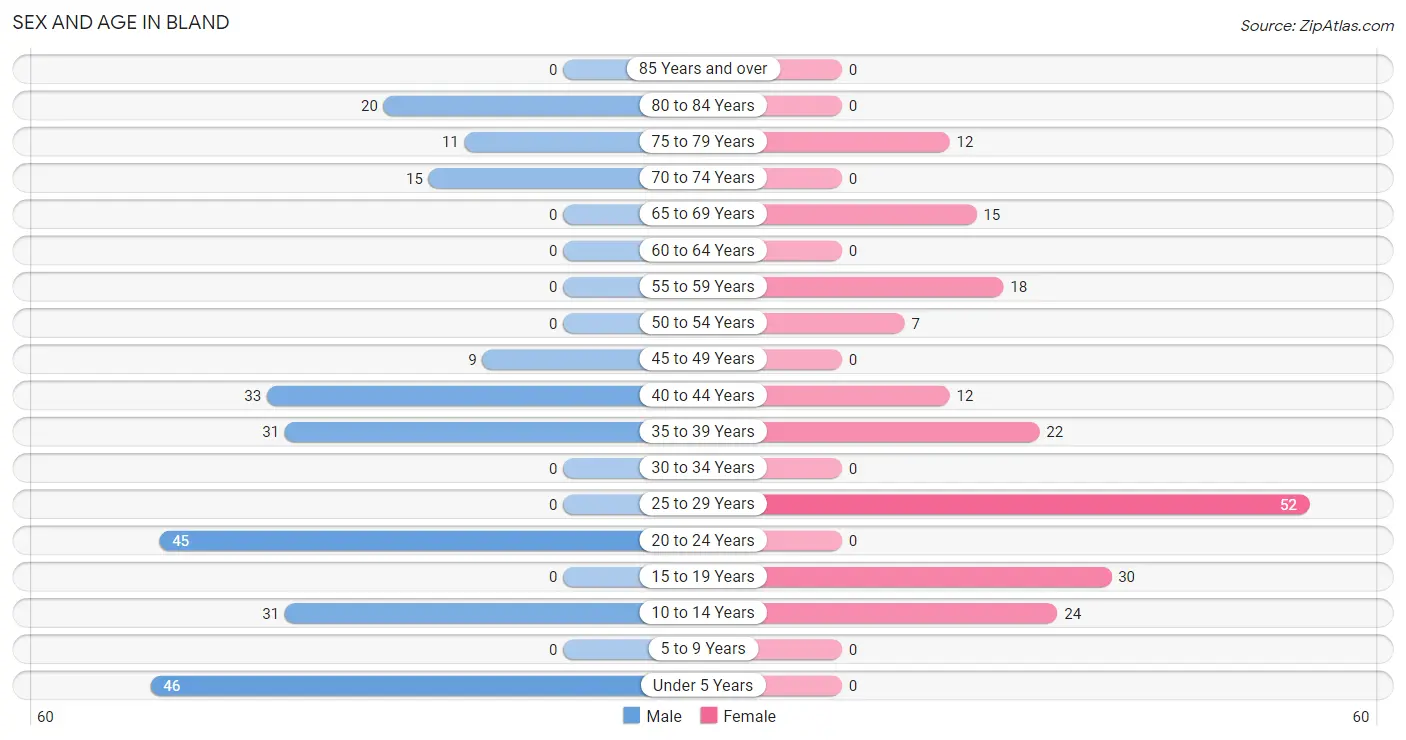
| Age Bracket | Male | Female |
| Under 5 Years | 46 (19.1%) | 0 (0.0%) |
| 5 to 9 Years | 0 (0.0%) | 0 (0.0%) |
| 10 to 14 Years | 31 (12.9%) | 24 (12.5%) |
| 15 to 19 Years | 0 (0.0%) | 30 (15.6%) |
| 20 to 24 Years | 45 (18.7%) | 0 (0.0%) |
| 25 to 29 Years | 0 (0.0%) | 52 (27.1%) |
| 30 to 34 Years | 0 (0.0%) | 0 (0.0%) |
| 35 to 39 Years | 31 (12.9%) | 22 (11.5%) |
| 40 to 44 Years | 33 (13.7%) | 12 (6.2%) |
| 45 to 49 Years | 9 (3.7%) | 0 (0.0%) |
| 50 to 54 Years | 0 (0.0%) | 7 (3.6%) |
| 55 to 59 Years | 0 (0.0%) | 18 (9.4%) |
| 60 to 64 Years | 0 (0.0%) | 0 (0.0%) |
| 65 to 69 Years | 0 (0.0%) | 15 (7.8%) |
| 70 to 74 Years | 15 (6.2%) | 0 (0.0%) |
| 75 to 79 Years | 11 (4.6%) | 12 (6.2%) |
| 80 to 84 Years | 20 (8.3%) | 0 (0.0%) |
| 85 Years and over | 0 (0.0%) | 0 (0.0%) |
| Total | 241 (100.0%) | 192 (100.0%) |
Families and Households in Bland
Median Family Size in Bland
The median family size in Bland is 3.21 persons per family, with married-couple families (61 | 54.5%) accounting for the largest median family size of 3.59 persons per family. On the other hand, single male/father families (46 | 41.1%) represent the smallest median family size with 2.74 persons per family.
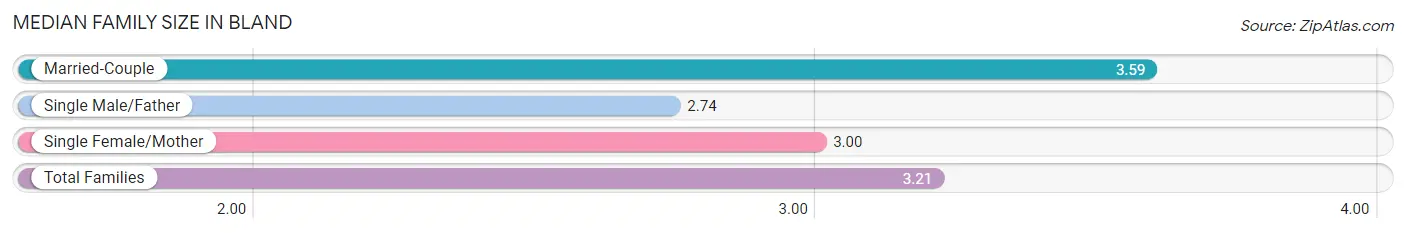
| Family Type | # Families | Family Size |
| Married-Couple | 61 (54.5%) | 3.59 |
| Single Male/Father | 46 (41.1%) | 2.74 |
| Single Female/Mother | 5 (4.5%) | 3.00 |
| Total Families | 112 (100.0%) | 3.21 |
Median Household Size in Bland
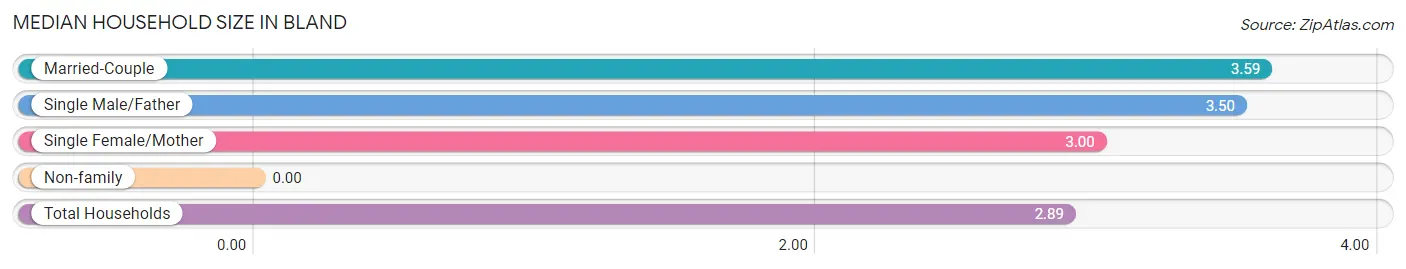
| Household Type | # Households | Household Size |
| Married-Couple | 61 (40.7%) | 3.59 |
| Single Male/Father | 46 (30.7%) | 3.50 |
| Single Female/Mother | 5 (3.3%) | 3.00 |
| Non-family | 38 (25.3%) | - |
| Total Households | 150 (100.0%) | 2.89 |
Household Size by Marriage Status in Bland
Out of a total of 150 households in Bland, 112 (74.7%) are family households, while 38 (25.3%) are nonfamily households. The most numerous type of family households are 2-person households, comprising 51, and the most common type of nonfamily households are 1-person households, comprising 38.
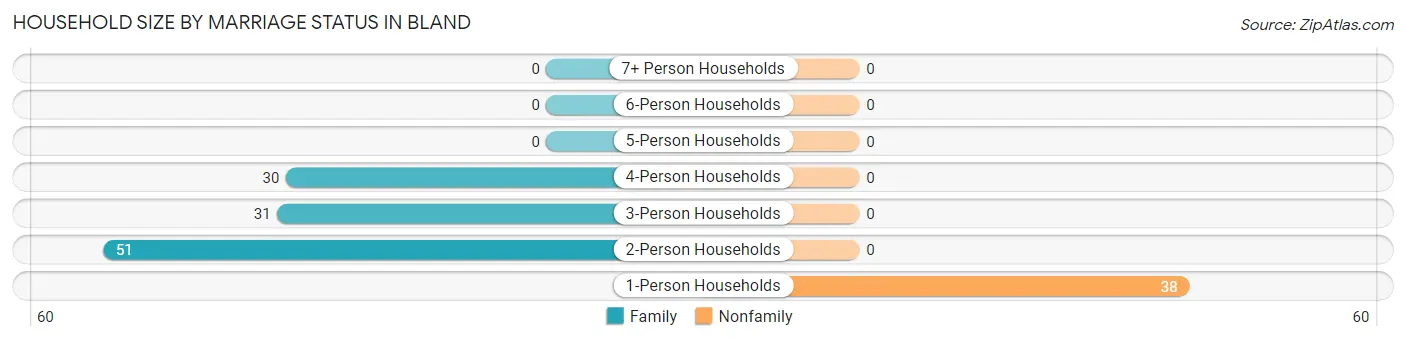
| Household Size | Family Households | Nonfamily Households |
| 1-Person Households | - | 38 (25.3%) |
| 2-Person Households | 51 (34.0%) | 0 (0.0%) |
| 3-Person Households | 31 (20.7%) | 0 (0.0%) |
| 4-Person Households | 30 (20.0%) | 0 (0.0%) |
| 5-Person Households | 0 (0.0%) | 0 (0.0%) |
| 6-Person Households | 0 (0.0%) | 0 (0.0%) |
| 7+ Person Households | 0 (0.0%) | 0 (0.0%) |
| Total | 112 (74.7%) | 38 (25.3%) |
Female Fertility in Bland
Fertility by Age in Bland
| Age Bracket | Women with Births | Births / 1,000 Women |
| 15 to 19 years | 0 (0.0%) | 0.0 |
| 20 to 34 years | 0 (0.0%) | 0.0 |
| 35 to 50 years | 0 (0.0%) | 0.0 |
| Total | 0 (0.0%) | 0.0 |
Fertility by Age by Marriage Status in Bland
| Age Bracket | Married | Unmarried |
| 15 to 19 years | 0 (0.0%) | 0 (0.0%) |
| 20 to 34 years | 0 (0.0%) | 0 (0.0%) |
| 35 to 50 years | 0 (0.0%) | 0 (0.0%) |
| Total | 0 (0.0%) | 0 (0.0%) |
Fertility by Education in Bland
| Educational Attainment | Women with Births | Births / 1,000 Women |
| Less than High School | 0 (0.0%) | 0.0 |
| High School Diploma | 0 (0.0%) | 0.0 |
| College or Associate's Degree | 0 (0.0%) | 0.0 |
| Bachelor's Degree | 0 (0.0%) | 0.0 |
| Graduate Degree | 0 (0.0%) | 0.0 |
| Total | 0 (0.0%) | 0.0 |
Fertility by Education by Marriage Status in Bland
| Educational Attainment | Married | Unmarried |
| Less than High School | 0 (0.0%) | 0 (0.0%) |
| High School Diploma | 0 (0.0%) | 0 (0.0%) |
| College or Associate's Degree | 0 (0.0%) | 0 (0.0%) |
| Bachelor's Degree | 0 (0.0%) | 0 (0.0%) |
| Graduate Degree | 0 (0.0%) | 0 (0.0%) |
| Total | 0 (0.0%) | 0 (0.0%) |
Employment Characteristics in Bland
Employment by Class of Employer in Bland
Among the 184 employed individuals in Bland, private company employees (149 | 81.0%), local government employees (27 | 14.7%), and state government employees (8 | 4.3%) make up the most common classes of employment.
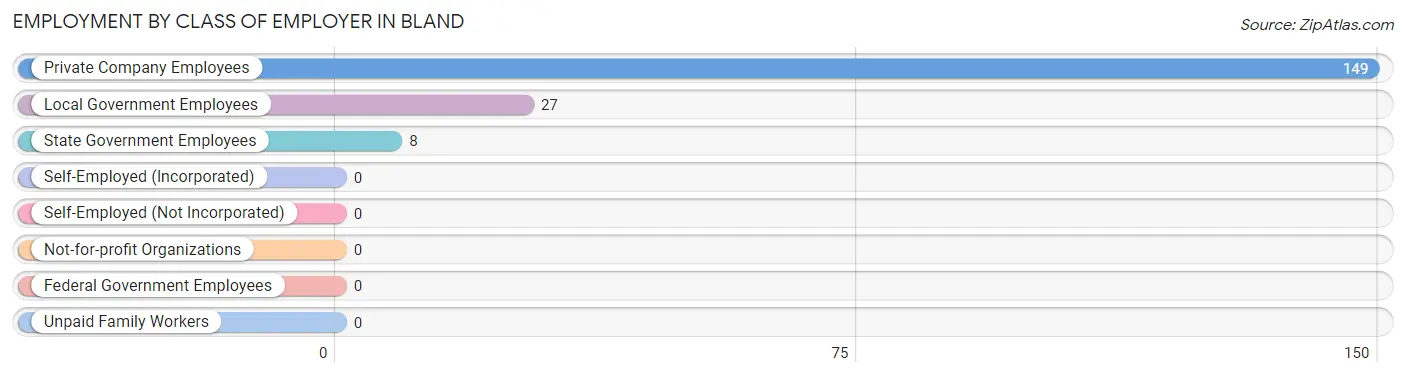
| Employer Class | # Employees | % Employees |
| Private Company Employees | 149 | 81.0% |
| Self-Employed (Incorporated) | 0 | 0.0% |
| Self-Employed (Not Incorporated) | 0 | 0.0% |
| Not-for-profit Organizations | 0 | 0.0% |
| Local Government Employees | 27 | 14.7% |
| State Government Employees | 8 | 4.3% |
| Federal Government Employees | 0 | 0.0% |
| Unpaid Family Workers | 0 | 0.0% |
| Total | 184 | 100.0% |
Employment Status by Age in Bland
According to the labor force statistics for Bland, out of the total population over 16 years of age (332), 59.0% or 196 individuals are in the labor force, with 6.1% or 12 of them unemployed. The age group with the highest labor force participation rate is 20 to 24 years, with 100.0% or 45 individuals in the labor force. Within the labor force, the 35 to 44 years age range has the highest percentage of unemployed individuals, with 12.2% or 12 of them being unemployed.
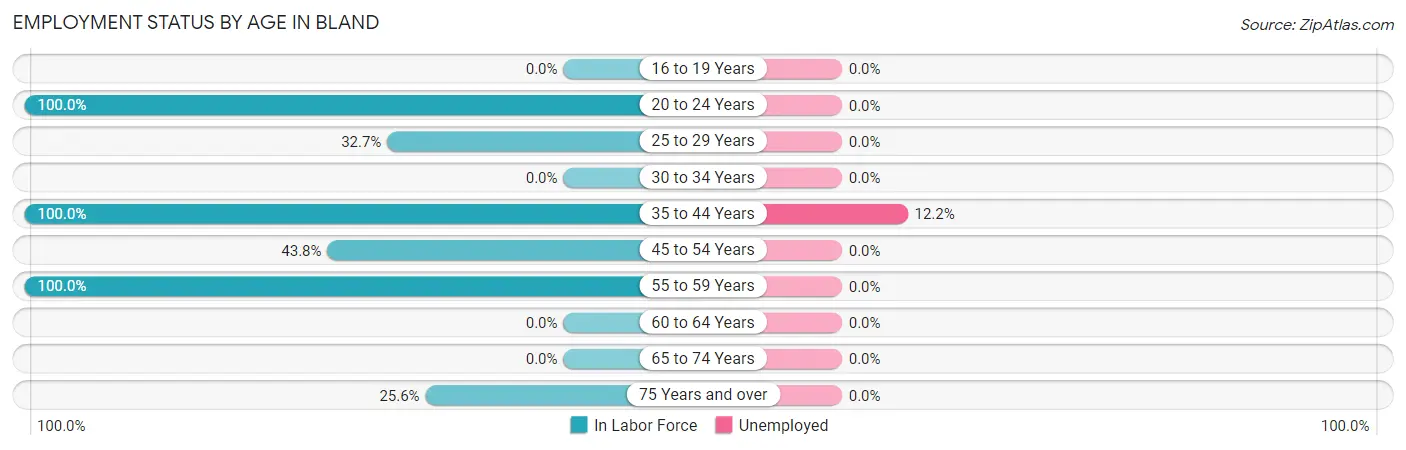
| Age Bracket | In Labor Force | Unemployed |
| 16 to 19 Years | 0 (0.0%) | 0 (0.0%) |
| 20 to 24 Years | 45 (100.0%) | 0 (0.0%) |
| 25 to 29 Years | 17 (32.7%) | 0 (0.0%) |
| 30 to 34 Years | 0 (0.0%) | 0 (0.0%) |
| 35 to 44 Years | 98 (100.0%) | 12 (12.2%) |
| 45 to 54 Years | 7 (43.8%) | 0 (0.0%) |
| 55 to 59 Years | 18 (100.0%) | 0 (0.0%) |
| 60 to 64 Years | 0 (0.0%) | 0 (0.0%) |
| 65 to 74 Years | 0 (0.0%) | 0 (0.0%) |
| 75 Years and over | 11 (25.6%) | 0 (0.0%) |
| Total | 196 (59.0%) | 12 (6.1%) |
Employment Status by Educational Attainment in Bland
According to labor force statistics for Bland, 76.1% of individuals (140) out of the total population between 25 and 64 years of age (184) are in the labor force, with 8.6% or 12 of them being unemployed. The group with the highest labor force participation rate are those with the educational attainment of college / associate degree, with 100.0% or 19 individuals in the labor force. Within the labor force, individuals with bachelor's degree or higher education have the highest percentage of unemployment, with 16.7% or 12 of them being unemployed.
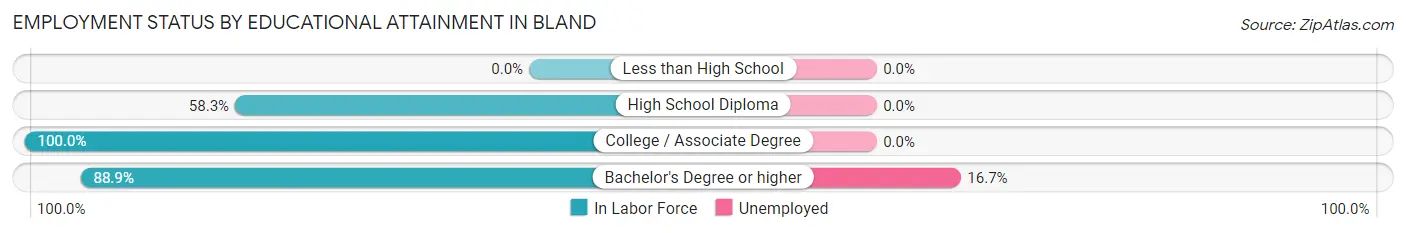
| Educational Attainment | In Labor Force | Unemployed |
| Less than High School | 0 (0.0%) | 0 (0.0%) |
| High School Diploma | 49 (58.3%) | 0 (0.0%) |
| College / Associate Degree | 19 (100.0%) | 0 (0.0%) |
| Bachelor's Degree or higher | 72 (88.9%) | 14 (16.7%) |
| Total | 140 (76.1%) | 16 (8.6%) |
Employment Occupations by Sex in Bland
Management, Business, Science and Arts Occupations
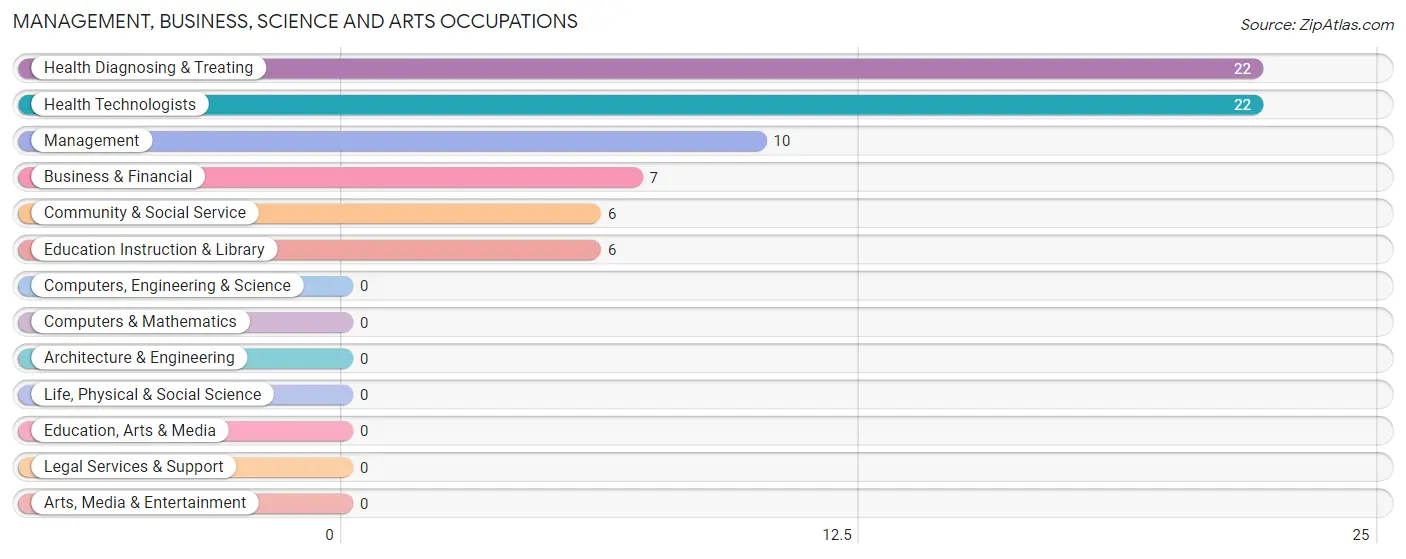
The most common Management, Business, Science and Arts occupations in Bland are Health Diagnosing & Treating (22 | 12.0%), Health Technologists (22 | 12.0%), Management (10 | 5.4%), Business & Financial (7 | 3.8%), and Community & Social Service (6 | 3.3%).
Management, Business, Science and Arts Occupations by Sex
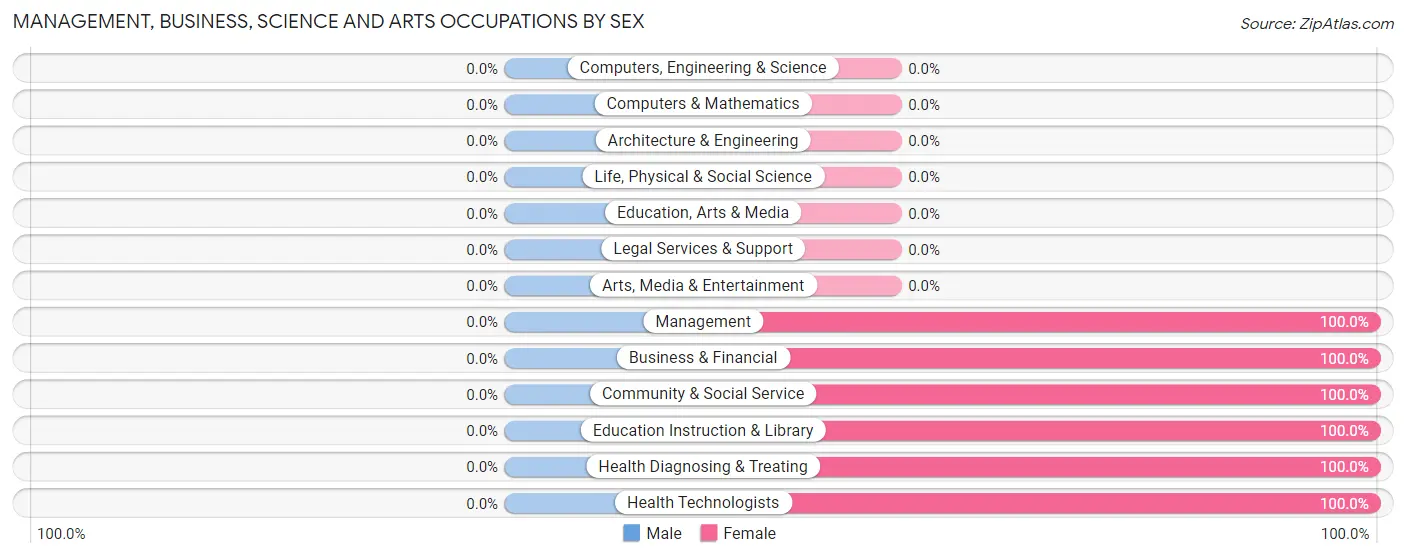
| Occupation | Male | Female |
| Management | 0 (0.0%) | 10 (100.0%) |
| Business & Financial | 0 (0.0%) | 7 (100.0%) |
| Computers, Engineering & Science | 0 (0.0%) | 0 (0.0%) |
| Computers & Mathematics | 0 (0.0%) | 0 (0.0%) |
| Architecture & Engineering | 0 (0.0%) | 0 (0.0%) |
| Life, Physical & Social Science | 0 (0.0%) | 0 (0.0%) |
| Community & Social Service | 0 (0.0%) | 6 (100.0%) |
| Education, Arts & Media | 0 (0.0%) | 0 (0.0%) |
| Legal Services & Support | 0 (0.0%) | 0 (0.0%) |
| Education Instruction & Library | 0 (0.0%) | 6 (100.0%) |
| Arts, Media & Entertainment | 0 (0.0%) | 0 (0.0%) |
| Health Diagnosing & Treating | 0 (0.0%) | 22 (100.0%) |
| Health Technologists | 0 (0.0%) | 22 (100.0%) |
| Total (Category) | 0 (0.0%) | 45 (100.0%) |
| Total (Overall) | 120 (65.2%) | 64 (34.8%) |
Services Occupations
Services Occupations by Sex
| Occupation | Male | Female |
| Healthcare Support | 0 (0.0%) | 0 (0.0%) |
| Security & Protection | 0 (0.0%) | 0 (0.0%) |
| Firefighting & Prevention | 0 (0.0%) | 0 (0.0%) |
| Law Enforcement | 0 (0.0%) | 0 (0.0%) |
| Food Preparation & Serving | 0 (0.0%) | 0 (0.0%) |
| Cleaning & Maintenance | 0 (0.0%) | 0 (0.0%) |
| Personal Care & Service | 0 (0.0%) | 0 (0.0%) |
| Total (Category) | 0 (0.0%) | 0 (0.0%) |
| Total (Overall) | 120 (65.2%) | 64 (34.8%) |
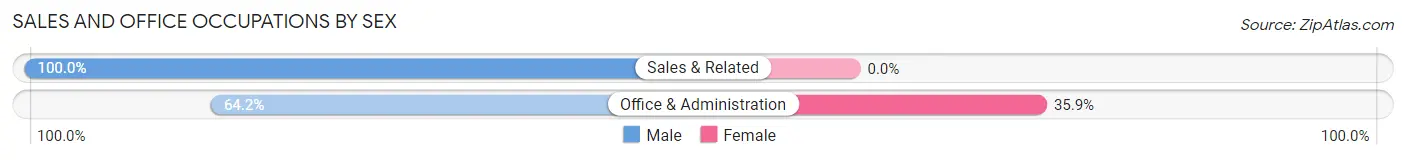
Sales and Office Occupations
The most common Sales and Office occupations in Bland are Office & Administration (53 | 28.8%), and Sales & Related (18 | 9.8%).
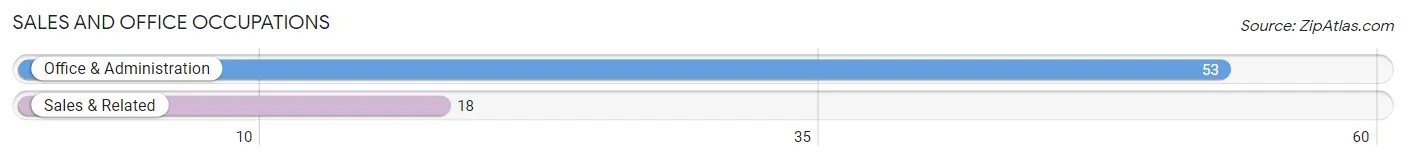
Sales and Office Occupations by Sex
| Occupation | Male | Female |
| Sales & Related | 18 (100.0%) | 0 (0.0%) |
| Office & Administration | 34 (64.1%) | 19 (35.8%) |
| Total (Category) | 52 (73.2%) | 19 (26.8%) |
| Total (Overall) | 120 (65.2%) | 64 (34.8%) |
Natural Resources, Construction and Maintenance Occupations
Natural Resources, Construction and Maintenance Occupations by Sex
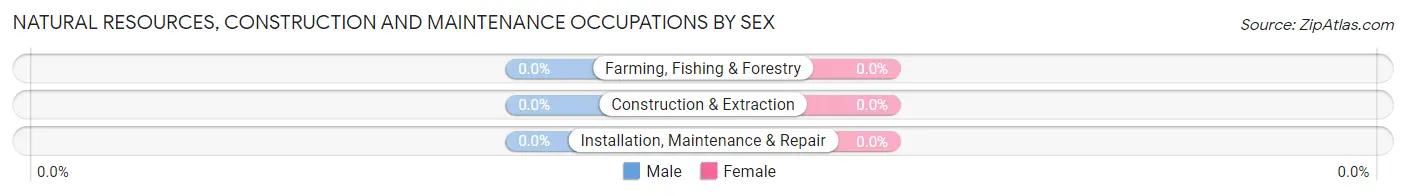
| Occupation | Male | Female |
| Farming, Fishing & Forestry | 0 (0.0%) | 0 (0.0%) |
| Construction & Extraction | 0 (0.0%) | 0 (0.0%) |
| Installation, Maintenance & Repair | 0 (0.0%) | 0 (0.0%) |
| Total (Category) | 0 (0.0%) | 0 (0.0%) |
| Total (Overall) | 120 (65.2%) | 64 (34.8%) |
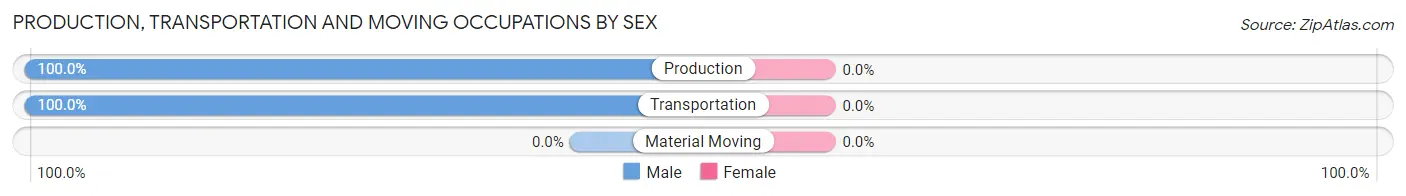
Production, Transportation and Moving Occupations
The most common Production, Transportation and Moving occupations in Bland are Production (57 | 31.0%), and Transportation (11 | 6.0%).
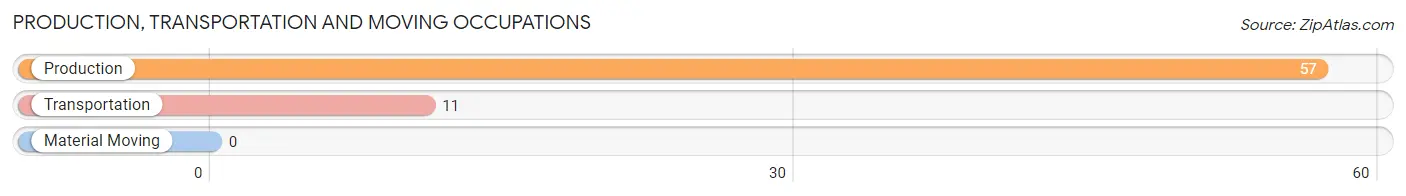
Production, Transportation and Moving Occupations by Sex
| Occupation | Male | Female |
| Production | 57 (100.0%) | 0 (0.0%) |
| Transportation | 11 (100.0%) | 0 (0.0%) |
| Material Moving | 0 (0.0%) | 0 (0.0%) |
| Total (Category) | 68 (100.0%) | 0 (0.0%) |
| Total (Overall) | 120 (65.2%) | 64 (34.8%) |
Employment Industries by Sex in Bland
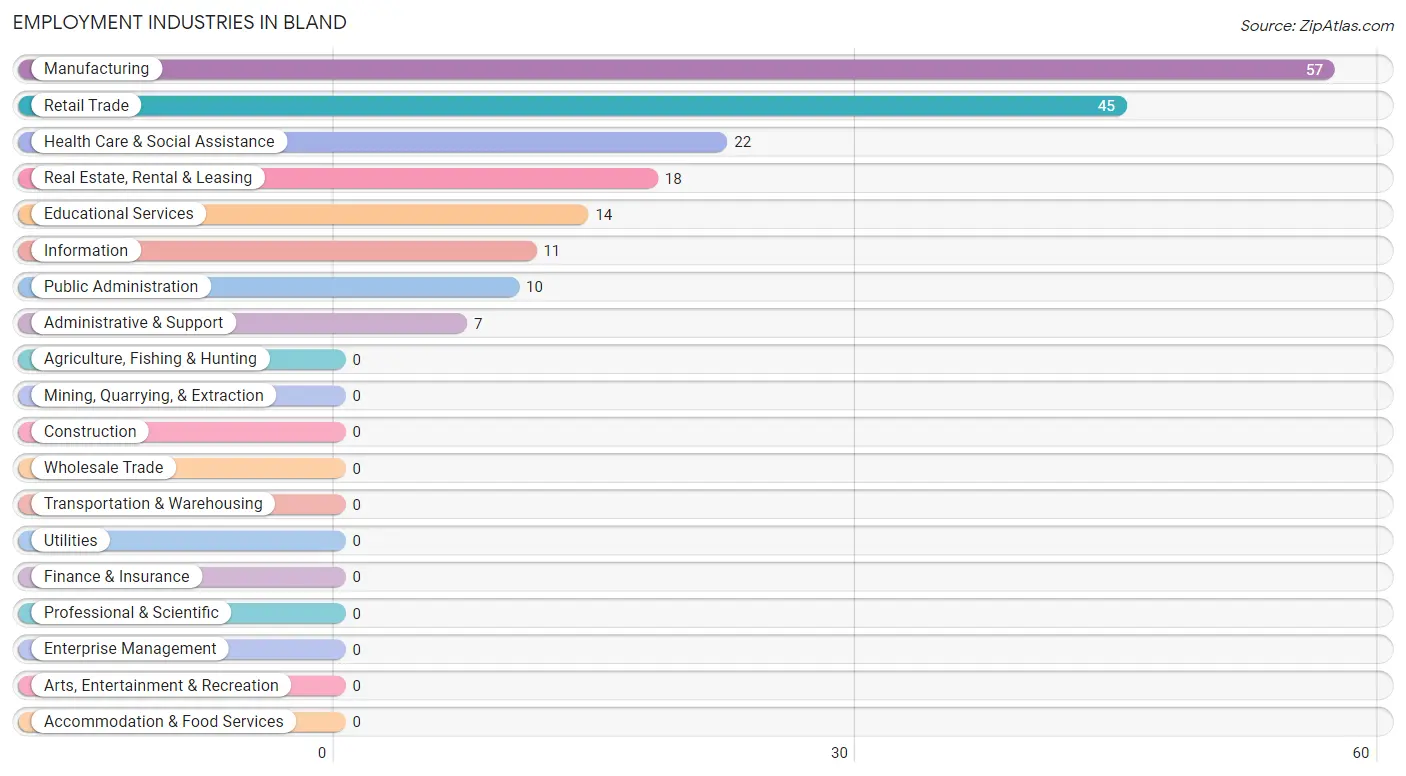
Employment Industries in Bland
The major employment industries in Bland include Manufacturing (57 | 31.0%), Retail Trade (45 | 24.5%), Health Care & Social Assistance (22 | 12.0%), Real Estate, Rental & Leasing (18 | 9.8%), and Educational Services (14 | 7.6%).
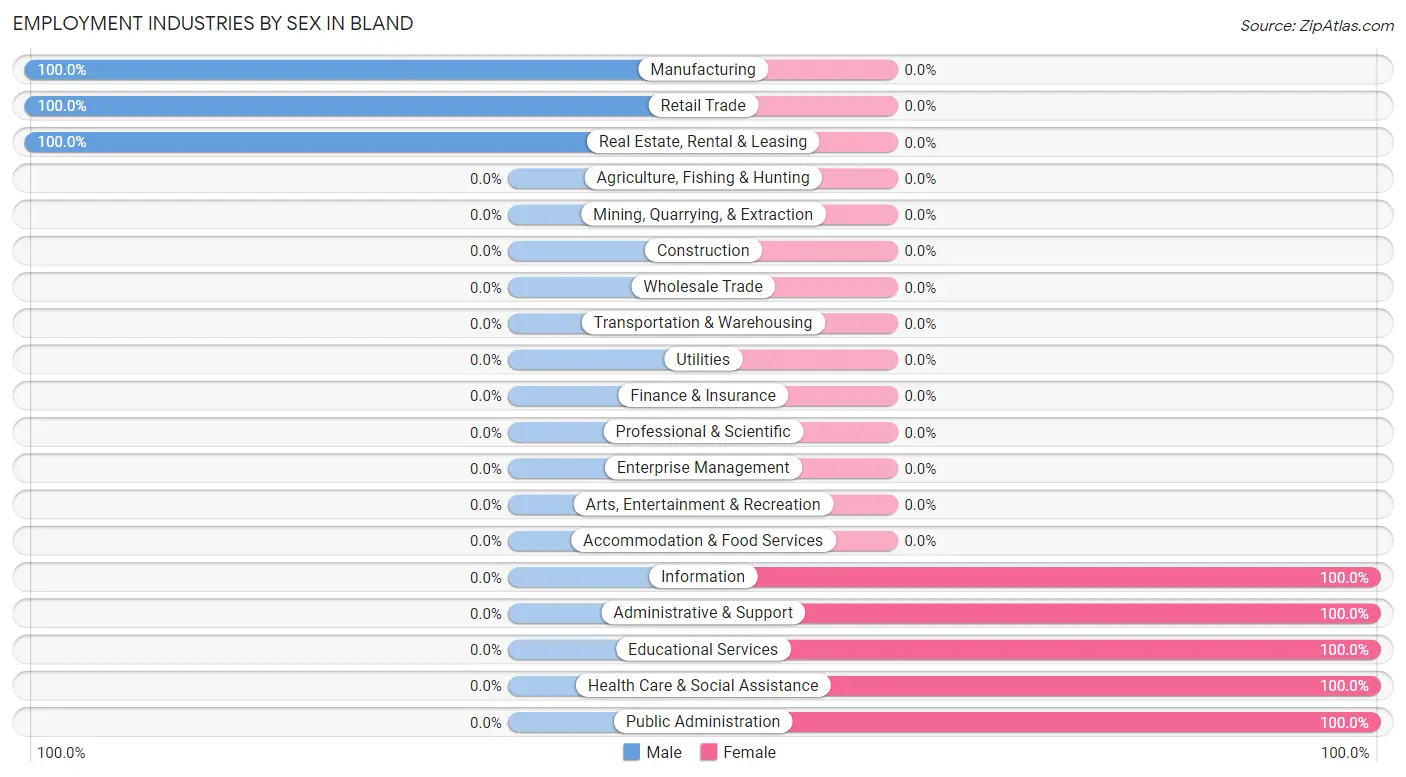
Employment Industries by Sex in Bland
The Bland industries that see more men than women are Manufacturing (100.0%), Retail Trade (100.0%), and Real Estate, Rental & Leasing (100.0%), whereas the industries that tend to have a higher number of women are Information (100.0%), Administrative & Support (100.0%), and Educational Services (100.0%).
| Industry | Male | Female |
| Agriculture, Fishing & Hunting | 0 (0.0%) | 0 (0.0%) |
| Mining, Quarrying, & Extraction | 0 (0.0%) | 0 (0.0%) |
| Construction | 0 (0.0%) | 0 (0.0%) |
| Manufacturing | 57 (100.0%) | 0 (0.0%) |
| Wholesale Trade | 0 (0.0%) | 0 (0.0%) |
| Retail Trade | 45 (100.0%) | 0 (0.0%) |
| Transportation & Warehousing | 0 (0.0%) | 0 (0.0%) |
| Utilities | 0 (0.0%) | 0 (0.0%) |
| Information | 0 (0.0%) | 11 (100.0%) |
| Finance & Insurance | 0 (0.0%) | 0 (0.0%) |
| Real Estate, Rental & Leasing | 18 (100.0%) | 0 (0.0%) |
| Professional & Scientific | 0 (0.0%) | 0 (0.0%) |
| Enterprise Management | 0 (0.0%) | 0 (0.0%) |
| Administrative & Support | 0 (0.0%) | 7 (100.0%) |
| Educational Services | 0 (0.0%) | 14 (100.0%) |
| Health Care & Social Assistance | 0 (0.0%) | 22 (100.0%) |
| Arts, Entertainment & Recreation | 0 (0.0%) | 0 (0.0%) |
| Accommodation & Food Services | 0 (0.0%) | 0 (0.0%) |
| Public Administration | 0 (0.0%) | 10 (100.0%) |
| Total | 120 (65.2%) | 64 (34.8%) |
Education in Bland
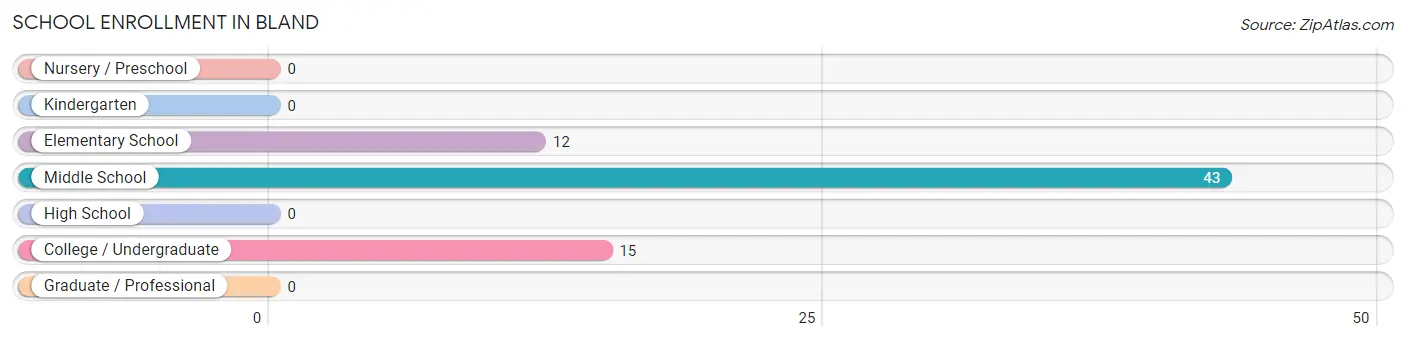
School Enrollment in Bland
The most common levels of schooling among the 70 students in Bland are middle school (43 | 61.4%), college / undergraduate (15 | 21.4%), and elementary school (12 | 17.1%).
| School Level | # Students | % Students |
| Nursery / Preschool | 0 | 0.0% |
| Kindergarten | 0 | 0.0% |
| Elementary School | 12 | 17.1% |
| Middle School | 43 | 61.4% |
| High School | 0 | 0.0% |
| College / Undergraduate | 15 | 21.4% |
| Graduate / Professional | 0 | 0.0% |
| Total | 70 | 100.0% |
School Enrollment by Age by Funding Source in Bland
Out of a total of 70 students who are enrolled in schools in Bland, 15 (21.4%) attend a private institution, while the remaining 55 (78.6%) are enrolled in public schools. The age group of 35 years and over has the highest likelihood of being enrolled in private schools, with 15 (100.0% in the age bracket) enrolled. Conversely, the age group of 10 to 14 year olds has the lowest likelihood of being enrolled in a private school, with 55 (100.0% in the age bracket) attending a public institution.
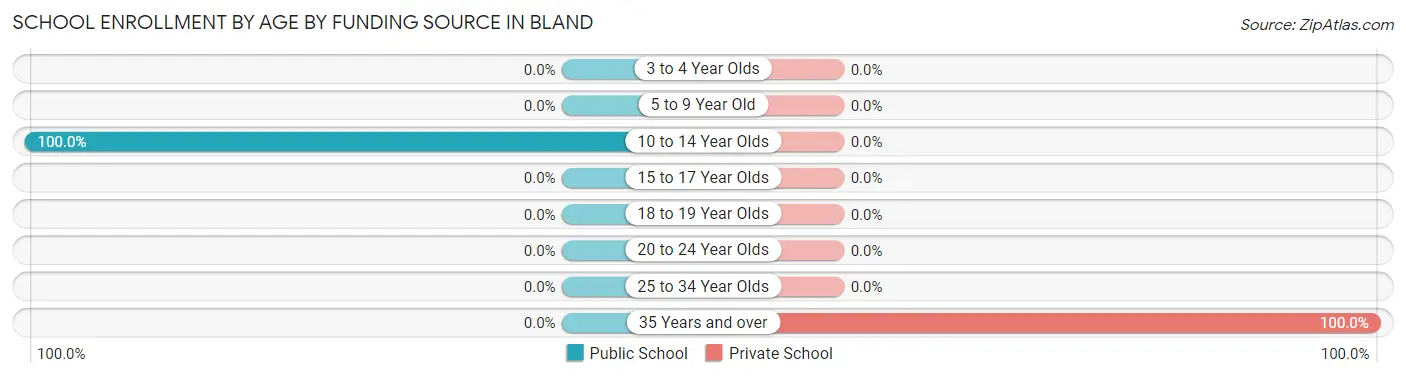
| Age Bracket | Public School | Private School |
| 3 to 4 Year Olds | 0 (0.0%) | 0 (0.0%) |
| 5 to 9 Year Old | 0 (0.0%) | 0 (0.0%) |
| 10 to 14 Year Olds | 55 (100.0%) | 0 (0.0%) |
| 15 to 17 Year Olds | 0 (0.0%) | 0 (0.0%) |
| 18 to 19 Year Olds | 0 (0.0%) | 0 (0.0%) |
| 20 to 24 Year Olds | 0 (0.0%) | 0 (0.0%) |
| 25 to 34 Year Olds | 0 (0.0%) | 0 (0.0%) |
| 35 Years and over | 0 (0.0%) | 15 (100.0%) |
| Total | 55 (78.6%) | 15 (21.4%) |
Educational Attainment by Field of Study in Bland
Science & technology (44 | 41.5%), education (31 | 29.2%), bio, nature & agricultural (12 | 11.3%), business (10 | 9.4%), and social sciences (9 | 8.5%) are the most common fields of study among 106 individuals in Bland who have obtained a bachelor's degree or higher.
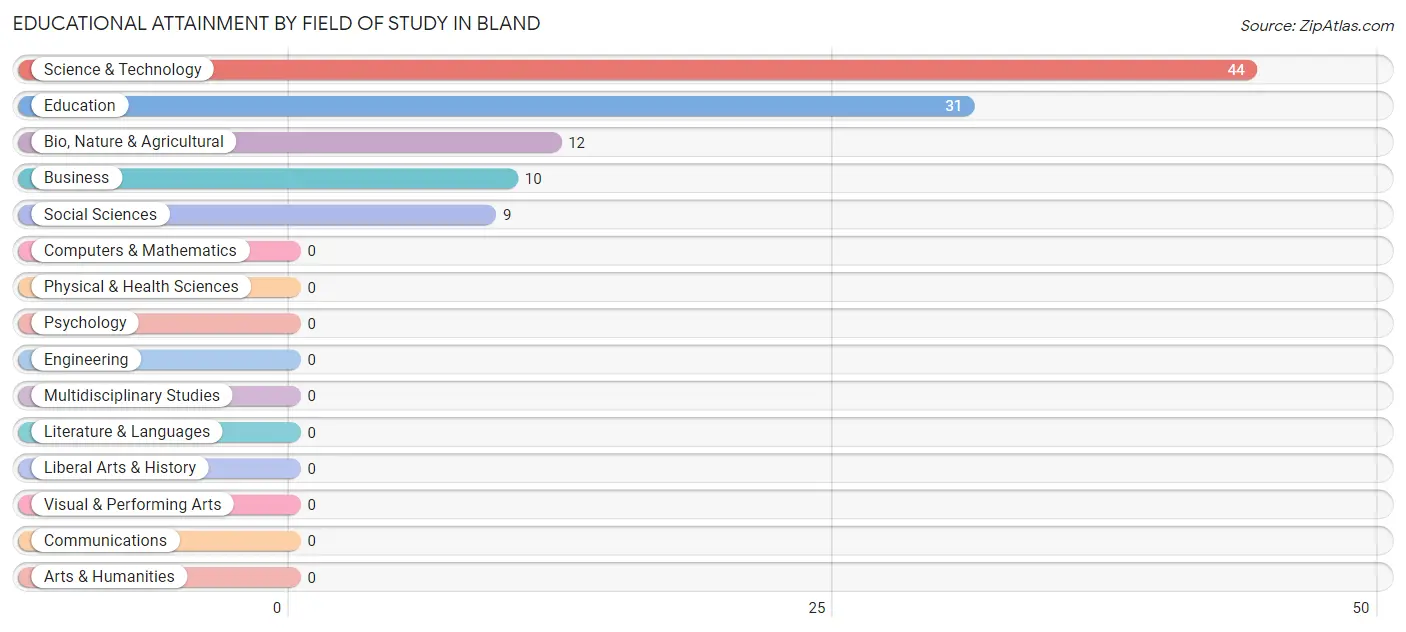
| Field of Study | # Graduates | % Graduates |
| Computers & Mathematics | 0 | 0.0% |
| Bio, Nature & Agricultural | 12 | 11.3% |
| Physical & Health Sciences | 0 | 0.0% |
| Psychology | 0 | 0.0% |
| Social Sciences | 9 | 8.5% |
| Engineering | 0 | 0.0% |
| Multidisciplinary Studies | 0 | 0.0% |
| Science & Technology | 44 | 41.5% |
| Business | 10 | 9.4% |
| Education | 31 | 29.2% |
| Literature & Languages | 0 | 0.0% |
| Liberal Arts & History | 0 | 0.0% |
| Visual & Performing Arts | 0 | 0.0% |
| Communications | 0 | 0.0% |
| Arts & Humanities | 0 | 0.0% |
| Total | 106 | 100.0% |
Transportation & Commute in Bland
Vehicle Availability by Sex in Bland
The most prevalent vehicle ownership categories in Bland are males with 2 vehicles (67, accounting for 55.8%) and females with 2 vehicles (32, making up 104.7%).
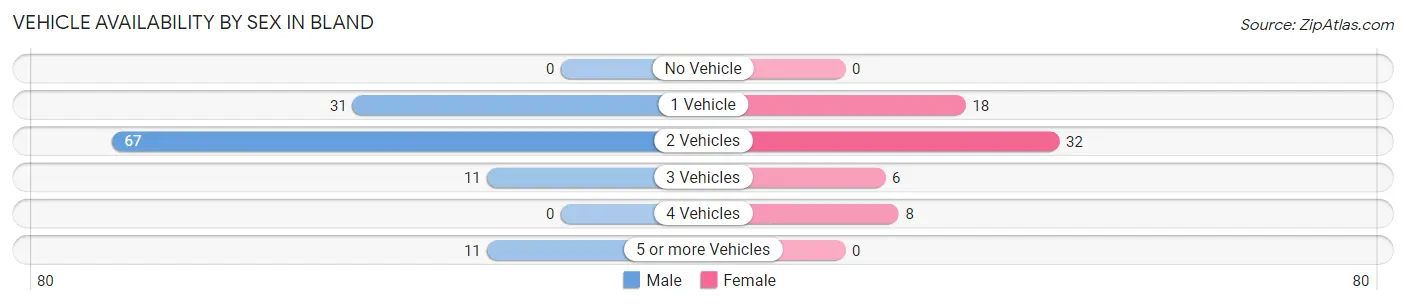
| Vehicles Available | Male | Female |
| No Vehicle | 0 (0.0%) | 0 (0.0%) |
| 1 Vehicle | 31 (25.8%) | 18 (28.1%) |
| 2 Vehicles | 67 (55.8%) | 32 (50.0%) |
| 3 Vehicles | 11 (9.2%) | 6 (9.4%) |
| 4 Vehicles | 0 (0.0%) | 8 (12.5%) |
| 5 or more Vehicles | 11 (9.2%) | 0 (0.0%) |
| Total | 120 (100.0%) | 64 (100.0%) |
Commute Time in Bland
The most frequently occuring commute durations in Bland are 15 to 19 minutes (40 commuters, 24.1%), less than 5 minutes (31 commuters, 18.7%), and 5 to 9 minutes (25 commuters, 15.1%).
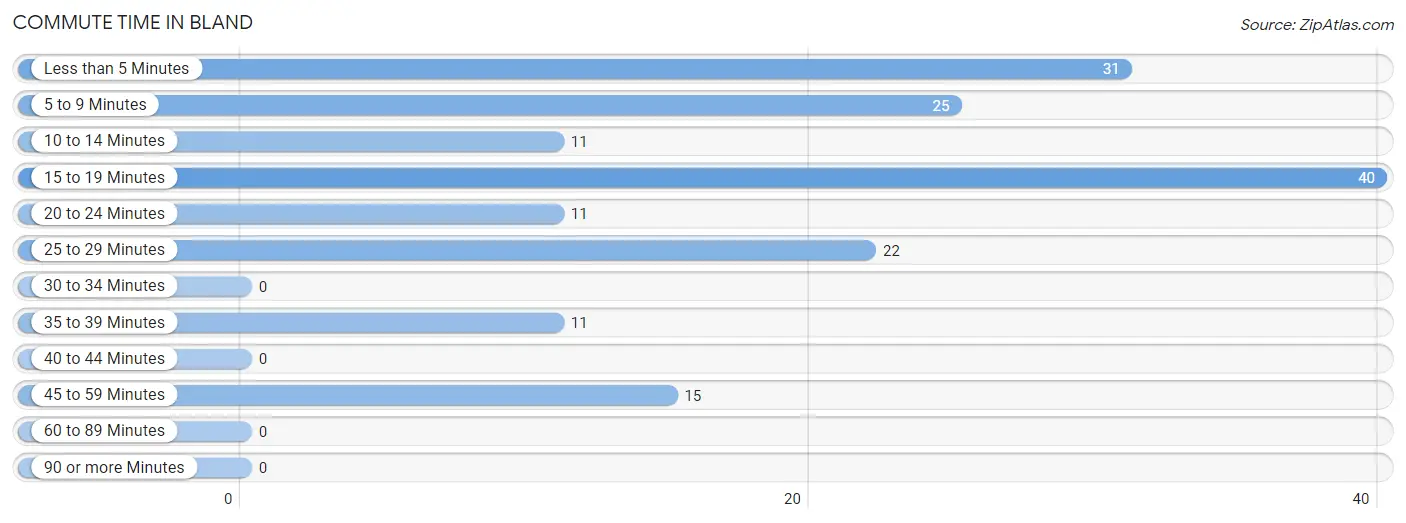
| Commute Time | # Commuters | % Commuters |
| Less than 5 Minutes | 31 | 18.7% |
| 5 to 9 Minutes | 25 | 15.1% |
| 10 to 14 Minutes | 11 | 6.6% |
| 15 to 19 Minutes | 40 | 24.1% |
| 20 to 24 Minutes | 11 | 6.6% |
| 25 to 29 Minutes | 22 | 13.3% |
| 30 to 34 Minutes | 0 | 0.0% |
| 35 to 39 Minutes | 11 | 6.6% |
| 40 to 44 Minutes | 0 | 0.0% |
| 45 to 59 Minutes | 15 | 9.0% |
| 60 to 89 Minutes | 0 | 0.0% |
| 90 or more Minutes | 0 | 0.0% |
Commute Time by Sex in Bland
The most common commute times in Bland are 15 to 19 minutes (34 commuters, 33.3%) for males and 5 to 9 minutes (25 commuters, 39.1%) for females.
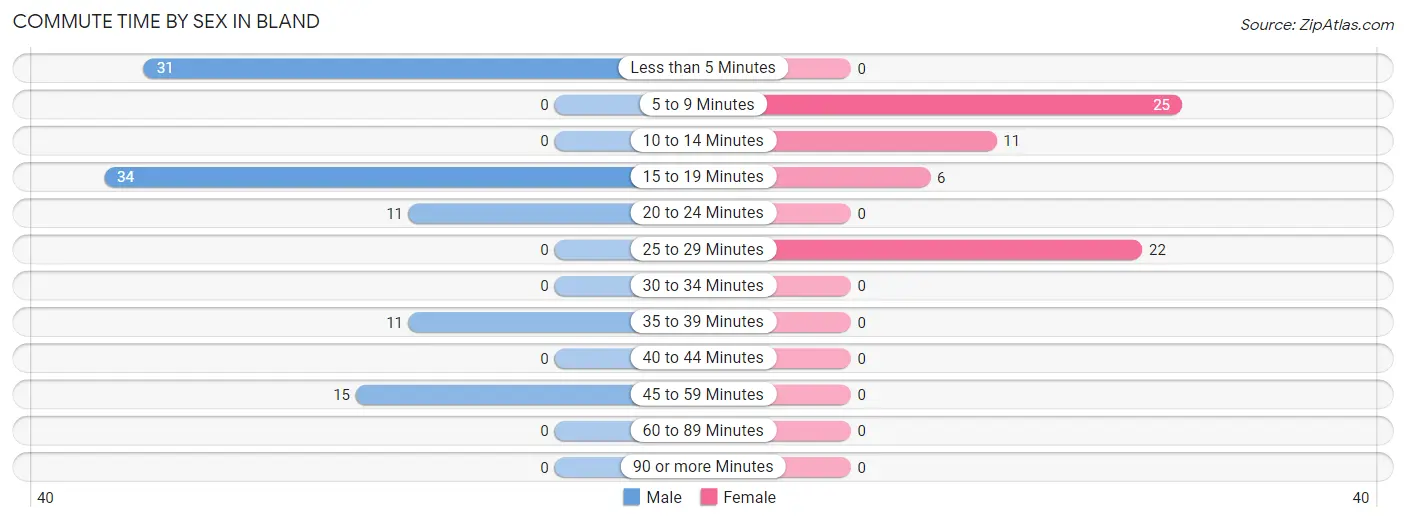
| Commute Time | Male | Female |
| Less than 5 Minutes | 31 (30.4%) | 0 (0.0%) |
| 5 to 9 Minutes | 0 (0.0%) | 25 (39.1%) |
| 10 to 14 Minutes | 0 (0.0%) | 11 (17.2%) |
| 15 to 19 Minutes | 34 (33.3%) | 6 (9.4%) |
| 20 to 24 Minutes | 11 (10.8%) | 0 (0.0%) |
| 25 to 29 Minutes | 0 (0.0%) | 22 (34.4%) |
| 30 to 34 Minutes | 0 (0.0%) | 0 (0.0%) |
| 35 to 39 Minutes | 11 (10.8%) | 0 (0.0%) |
| 40 to 44 Minutes | 0 (0.0%) | 0 (0.0%) |
| 45 to 59 Minutes | 15 (14.7%) | 0 (0.0%) |
| 60 to 89 Minutes | 0 (0.0%) | 0 (0.0%) |
| 90 or more Minutes | 0 (0.0%) | 0 (0.0%) |
Time of Departure to Work by Sex in Bland
The most frequent times of departure to work in Bland are 6:30 AM to 6:59 AM (34, 33.3%) for males and 6:00 AM to 6:29 AM (22, 34.4%) for females.
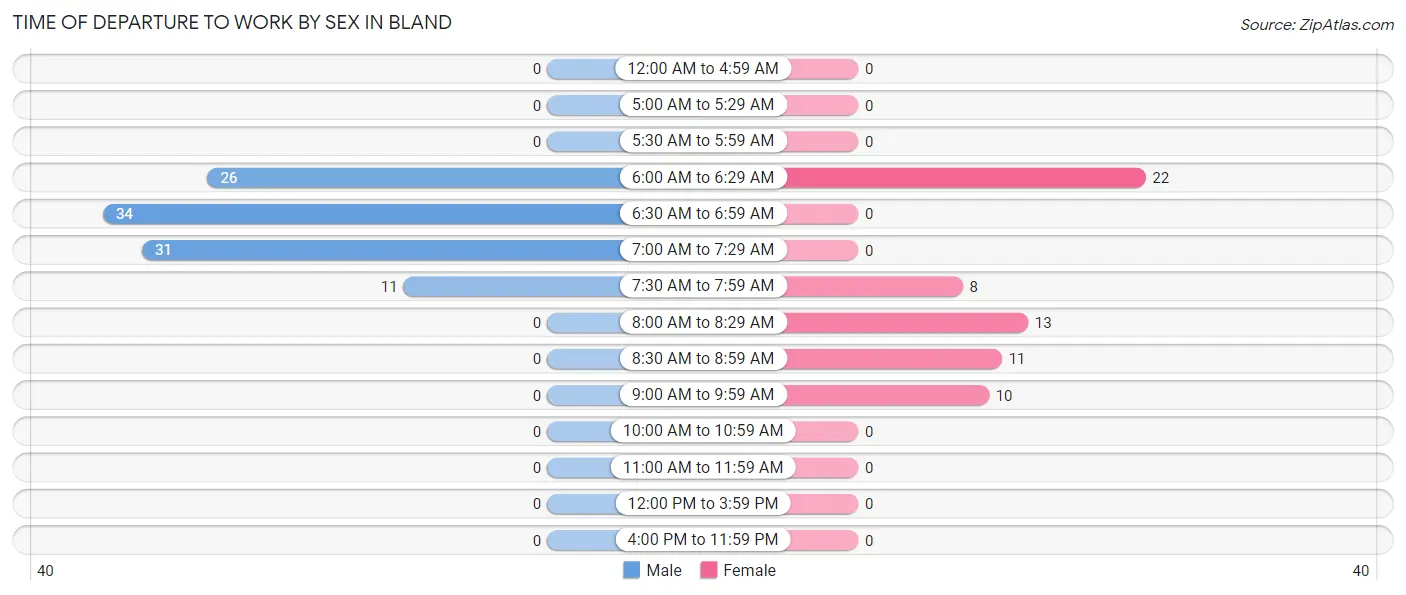
| Time of Departure | Male | Female |
| 12:00 AM to 4:59 AM | 0 (0.0%) | 0 (0.0%) |
| 5:00 AM to 5:29 AM | 0 (0.0%) | 0 (0.0%) |
| 5:30 AM to 5:59 AM | 0 (0.0%) | 0 (0.0%) |
| 6:00 AM to 6:29 AM | 26 (25.5%) | 22 (34.4%) |
| 6:30 AM to 6:59 AM | 34 (33.3%) | 0 (0.0%) |
| 7:00 AM to 7:29 AM | 31 (30.4%) | 0 (0.0%) |
| 7:30 AM to 7:59 AM | 11 (10.8%) | 8 (12.5%) |
| 8:00 AM to 8:29 AM | 0 (0.0%) | 13 (20.3%) |
| 8:30 AM to 8:59 AM | 0 (0.0%) | 11 (17.2%) |
| 9:00 AM to 9:59 AM | 0 (0.0%) | 10 (15.6%) |
| 10:00 AM to 10:59 AM | 0 (0.0%) | 0 (0.0%) |
| 11:00 AM to 11:59 AM | 0 (0.0%) | 0 (0.0%) |
| 12:00 PM to 3:59 PM | 0 (0.0%) | 0 (0.0%) |
| 4:00 PM to 11:59 PM | 0 (0.0%) | 0 (0.0%) |
| Total | 102 (100.0%) | 64 (100.0%) |
Housing Occupancy in Bland
Occupancy by Ownership in Bland
Of the total 150 dwellings in Bland, owner-occupied units account for 101 (67.3%), while renter-occupied units make up 49 (32.7%).

| Occupancy | # Housing Units | % Housing Units |
| Owner Occupied Housing Units | 101 | 67.3% |
| Renter-Occupied Housing Units | 49 | 32.7% |
| Total Occupied Housing Units | 150 | 100.0% |
Occupancy by Household Size in Bland
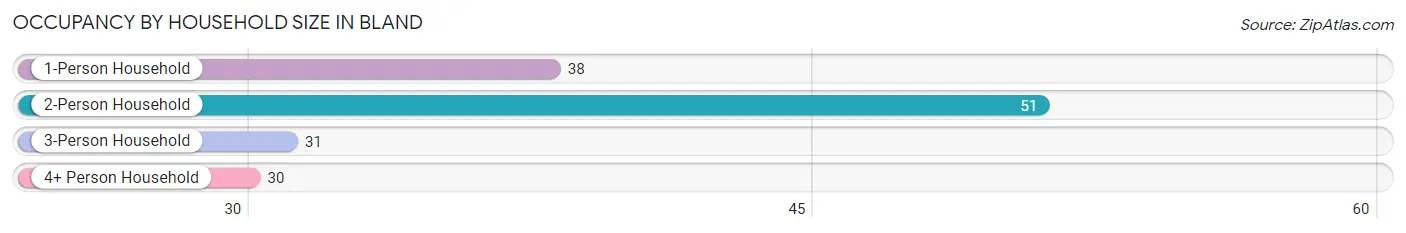
| Household Size | # Housing Units | % Housing Units |
| 1-Person Household | 38 | 25.3% |
| 2-Person Household | 51 | 34.0% |
| 3-Person Household | 31 | 20.7% |
| 4+ Person Household | 30 | 20.0% |
| Total Housing Units | 150 | 100.0% |
Occupancy by Ownership by Household Size in Bland
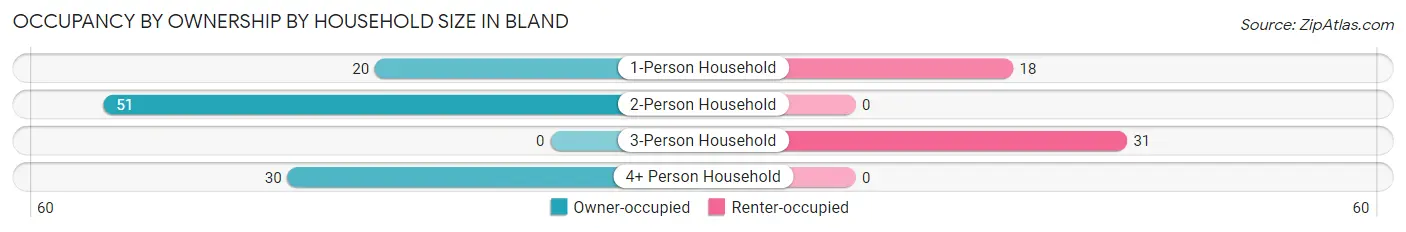
| Household Size | Owner-occupied | Renter-occupied |
| 1-Person Household | 20 (52.6%) | 18 (47.4%) |
| 2-Person Household | 51 (100.0%) | 0 (0.0%) |
| 3-Person Household | 0 (0.0%) | 31 (100.0%) |
| 4+ Person Household | 30 (100.0%) | 0 (0.0%) |
| Total Housing Units | 101 (67.3%) | 49 (32.7%) |
Occupancy by Educational Attainment in Bland
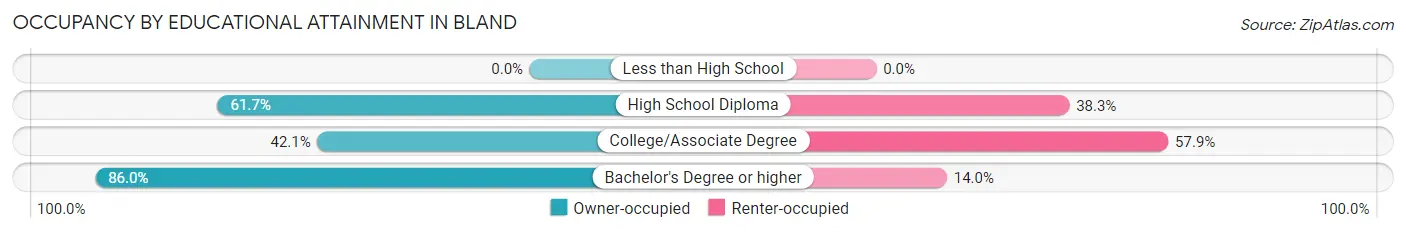
| Household Size | Owner-occupied | Renter-occupied |
| Less than High School | 0 (0.0%) | 0 (0.0%) |
| High School Diploma | 50 (61.7%) | 31 (38.3%) |
| College/Associate Degree | 8 (42.1%) | 11 (57.9%) |
| Bachelor's Degree or higher | 43 (86.0%) | 7 (14.0%) |
Occupancy by Age of Householder in Bland
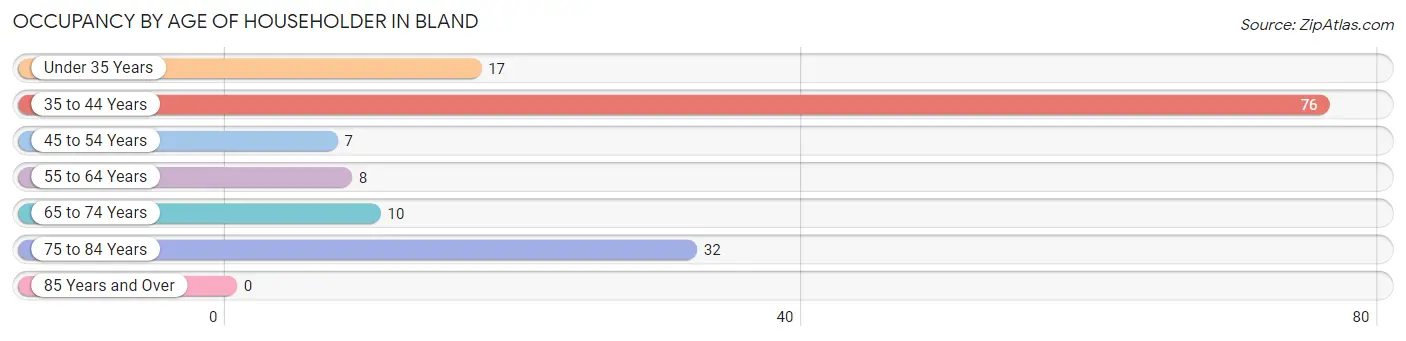
| Age Bracket | # Households | % Households |
| Under 35 Years | 17 | 11.3% |
| 35 to 44 Years | 76 | 50.7% |
| 45 to 54 Years | 7 | 4.7% |
| 55 to 64 Years | 8 | 5.3% |
| 65 to 74 Years | 10 | 6.7% |
| 75 to 84 Years | 32 | 21.3% |
| 85 Years and Over | 0 | 0.0% |
| Total | 150 | 100.0% |
Housing Finances in Bland
Median Income by Occupancy in Bland
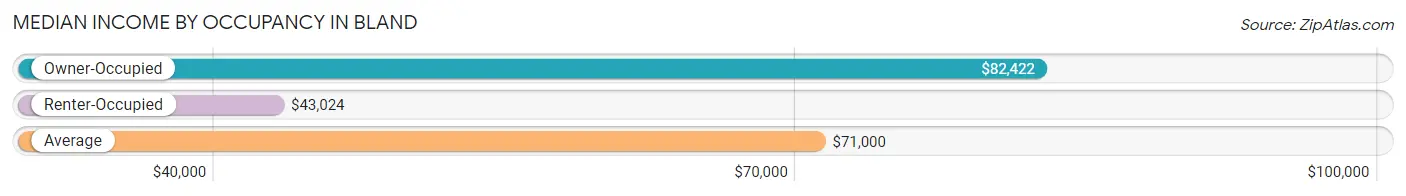
| Occupancy Type | # Households | Median Income |
| Owner-Occupied | 101 (67.3%) | $82,422 |
| Renter-Occupied | 49 (32.7%) | $43,024 |
| Average | 150 (100.0%) | $71,000 |
Occupancy by Householder Income Bracket in Bland
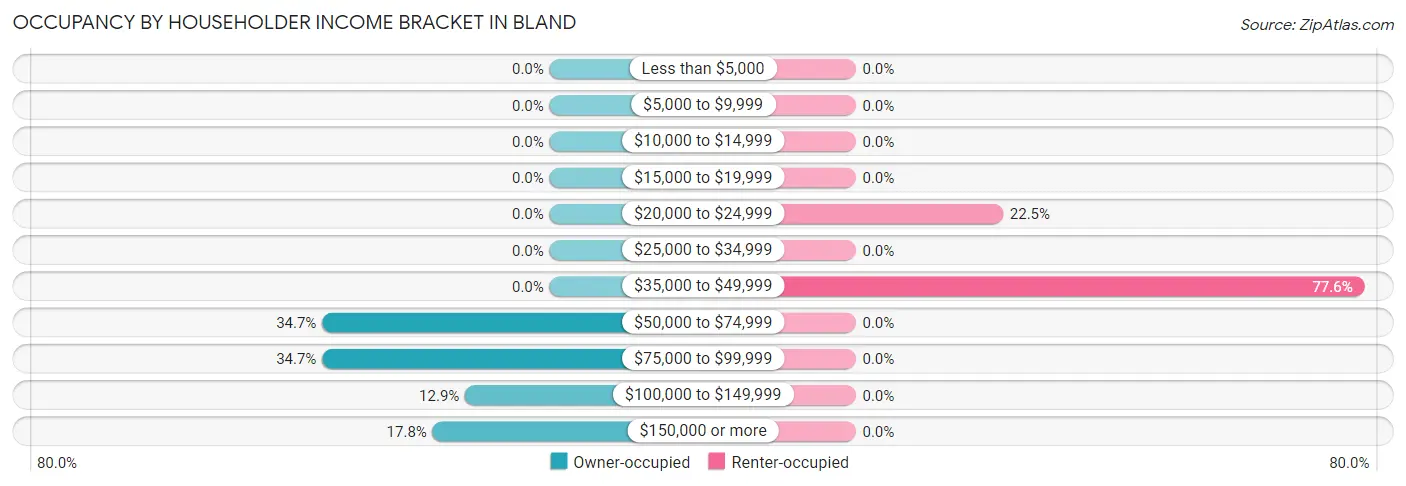
| Income Bracket | Owner-occupied | Renter-occupied |
| Less than $5,000 | 0 (0.0%) | 0 (0.0%) |
| $5,000 to $9,999 | 0 (0.0%) | 0 (0.0%) |
| $10,000 to $14,999 | 0 (0.0%) | 0 (0.0%) |
| $15,000 to $19,999 | 0 (0.0%) | 0 (0.0%) |
| $20,000 to $24,999 | 0 (0.0%) | 11 (22.5%) |
| $25,000 to $34,999 | 0 (0.0%) | 0 (0.0%) |
| $35,000 to $49,999 | 0 (0.0%) | 38 (77.5%) |
| $50,000 to $74,999 | 35 (34.6%) | 0 (0.0%) |
| $75,000 to $99,999 | 35 (34.6%) | 0 (0.0%) |
| $100,000 to $149,999 | 13 (12.9%) | 0 (0.0%) |
| $150,000 or more | 18 (17.8%) | 0 (0.0%) |
| Total | 101 (100.0%) | 49 (100.0%) |
Monthly Housing Cost Tiers in Bland
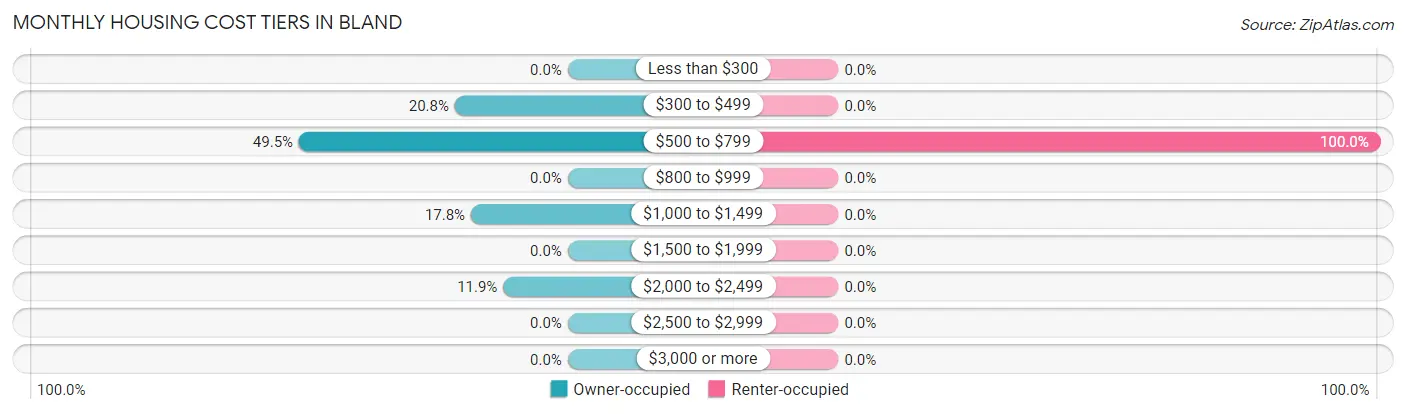
| Monthly Cost | Owner-occupied | Renter-occupied |
| Less than $300 | 0 (0.0%) | 0 (0.0%) |
| $300 to $499 | 21 (20.8%) | 0 (0.0%) |
| $500 to $799 | 50 (49.5%) | 49 (100.0%) |
| $800 to $999 | 0 (0.0%) | 0 (0.0%) |
| $1,000 to $1,499 | 18 (17.8%) | 0 (0.0%) |
| $1,500 to $1,999 | 0 (0.0%) | 0 (0.0%) |
| $2,000 to $2,499 | 12 (11.9%) | 0 (0.0%) |
| $2,500 to $2,999 | 0 (0.0%) | 0 (0.0%) |
| $3,000 or more | 0 (0.0%) | 0 (0.0%) |
| Total | 101 (100.0%) | 49 (100.0%) |
Physical Housing Characteristics in Bland
Housing Structures in Bland
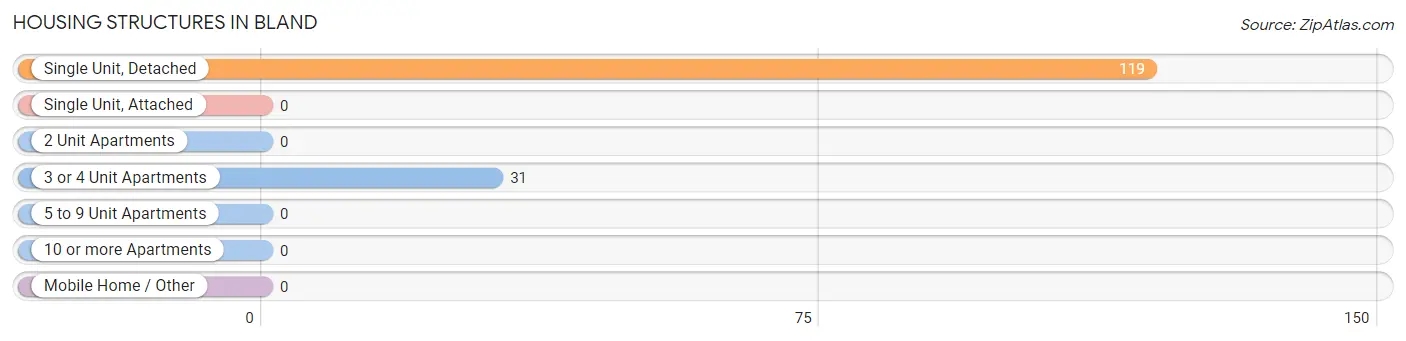
| Structure Type | # Housing Units | % Housing Units |
| Single Unit, Detached | 119 | 79.3% |
| Single Unit, Attached | 0 | 0.0% |
| 2 Unit Apartments | 0 | 0.0% |
| 3 or 4 Unit Apartments | 31 | 20.7% |
| 5 to 9 Unit Apartments | 0 | 0.0% |
| 10 or more Apartments | 0 | 0.0% |
| Mobile Home / Other | 0 | 0.0% |
| Total | 150 | 100.0% |
Housing Structures by Occupancy in Bland
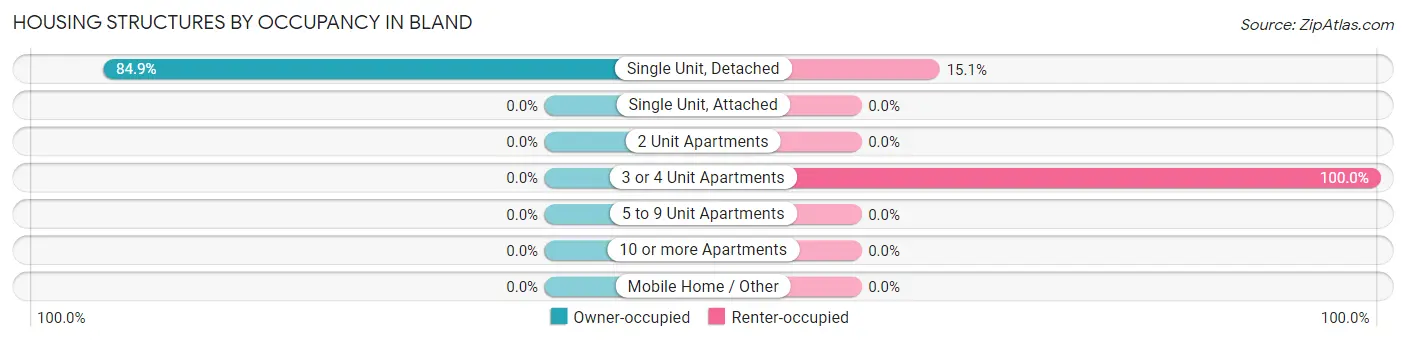
| Structure Type | Owner-occupied | Renter-occupied |
| Single Unit, Detached | 101 (84.9%) | 18 (15.1%) |
| Single Unit, Attached | 0 (0.0%) | 0 (0.0%) |
| 2 Unit Apartments | 0 (0.0%) | 0 (0.0%) |
| 3 or 4 Unit Apartments | 0 (0.0%) | 31 (100.0%) |
| 5 to 9 Unit Apartments | 0 (0.0%) | 0 (0.0%) |
| 10 or more Apartments | 0 (0.0%) | 0 (0.0%) |
| Mobile Home / Other | 0 (0.0%) | 0 (0.0%) |
| Total | 101 (67.3%) | 49 (32.7%) |
Housing Structures by Number of Rooms in Bland
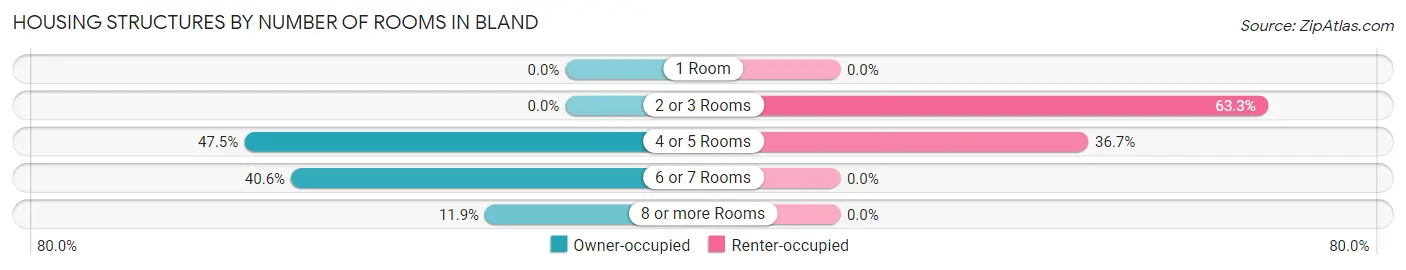
| Number of Rooms | Owner-occupied | Renter-occupied |
| 1 Room | 0 (0.0%) | 0 (0.0%) |
| 2 or 3 Rooms | 0 (0.0%) | 31 (63.3%) |
| 4 or 5 Rooms | 48 (47.5%) | 18 (36.7%) |
| 6 or 7 Rooms | 41 (40.6%) | 0 (0.0%) |
| 8 or more Rooms | 12 (11.9%) | 0 (0.0%) |
| Total | 101 (100.0%) | 49 (100.0%) |
Housing Structure by Heating Type in Bland
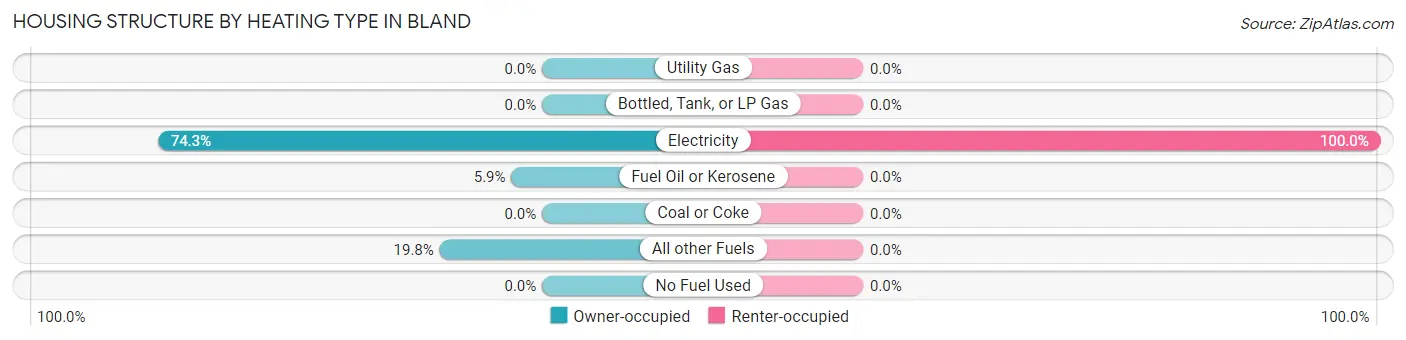
| Heating Type | Owner-occupied | Renter-occupied |
| Utility Gas | 0 (0.0%) | 0 (0.0%) |
| Bottled, Tank, or LP Gas | 0 (0.0%) | 0 (0.0%) |
| Electricity | 75 (74.3%) | 49 (100.0%) |
| Fuel Oil or Kerosene | 6 (5.9%) | 0 (0.0%) |
| Coal or Coke | 0 (0.0%) | 0 (0.0%) |
| All other Fuels | 20 (19.8%) | 0 (0.0%) |
| No Fuel Used | 0 (0.0%) | 0 (0.0%) |
| Total | 101 (100.0%) | 49 (100.0%) |
Household Vehicle Usage in Bland
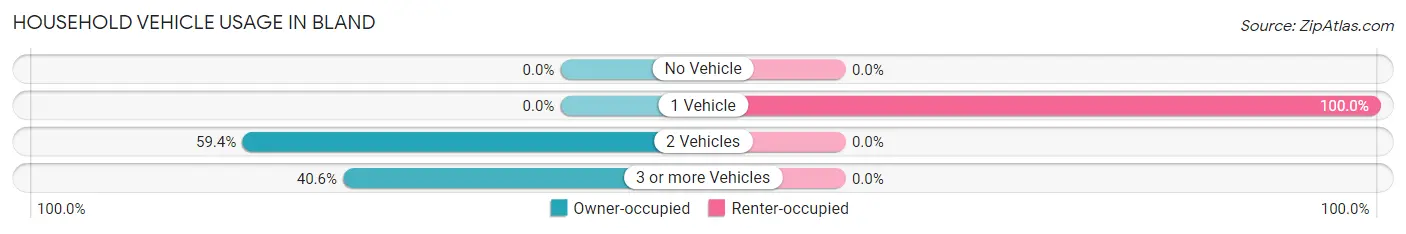
| Vehicles per Household | Owner-occupied | Renter-occupied |
| No Vehicle | 0 (0.0%) | 0 (0.0%) |
| 1 Vehicle | 0 (0.0%) | 49 (100.0%) |
| 2 Vehicles | 60 (59.4%) | 0 (0.0%) |
| 3 or more Vehicles | 41 (40.6%) | 0 (0.0%) |
| Total | 101 (100.0%) | 49 (100.0%) |
Real Estate & Mortgages in Bland
Real Estate and Mortgage Overview in Bland
| Characteristic | Without Mortgage | With Mortgage |
| Housing Units | 56 | 45 |
| Median Property Value | $115,700 | $157,500 |
| Median Household Income | $81,250 | $18 |
| Monthly Housing Costs | $535 | $0 |
| Real Estate Taxes | $2,067 | $0 |
Property Value by Mortgage Status in Bland
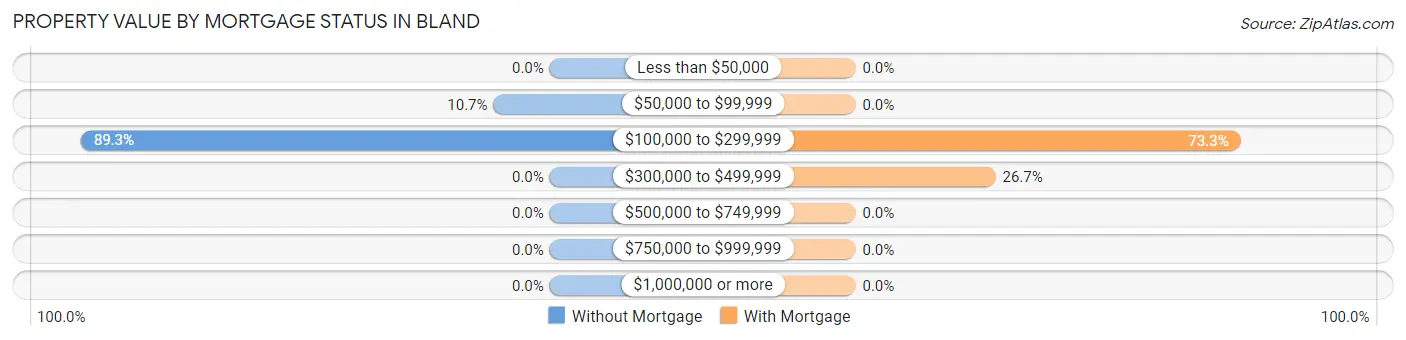
| Property Value | Without Mortgage | With Mortgage |
| Less than $50,000 | 0 (0.0%) | 0 (0.0%) |
| $50,000 to $99,999 | 6 (10.7%) | 0 (0.0%) |
| $100,000 to $299,999 | 50 (89.3%) | 33 (73.3%) |
| $300,000 to $499,999 | 0 (0.0%) | 12 (26.7%) |
| $500,000 to $749,999 | 0 (0.0%) | 0 (0.0%) |
| $750,000 to $999,999 | 0 (0.0%) | 0 (0.0%) |
| $1,000,000 or more | 0 (0.0%) | 0 (0.0%) |
| Total | 56 (100.0%) | 45 (100.0%) |
Household Income by Mortgage Status in Bland
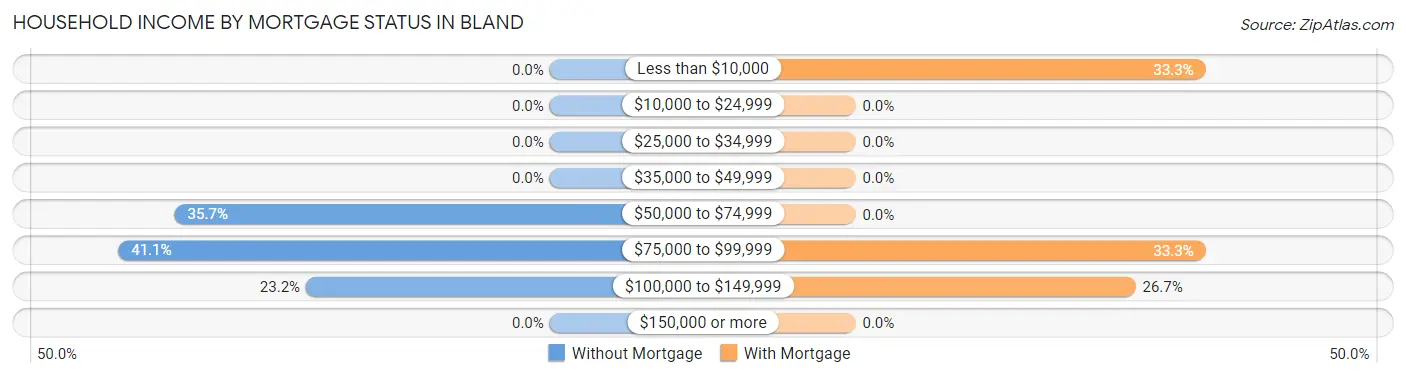
| Household Income | Without Mortgage | With Mortgage |
| Less than $10,000 | 0 (0.0%) | 15 (33.3%) |
| $10,000 to $24,999 | 0 (0.0%) | 0 (0.0%) |
| $25,000 to $34,999 | 0 (0.0%) | 0 (0.0%) |
| $35,000 to $49,999 | 0 (0.0%) | 0 (0.0%) |
| $50,000 to $74,999 | 20 (35.7%) | 0 (0.0%) |
| $75,000 to $99,999 | 23 (41.1%) | 15 (33.3%) |
| $100,000 to $149,999 | 13 (23.2%) | 12 (26.7%) |
| $150,000 or more | 0 (0.0%) | 0 (0.0%) |
| Total | 56 (100.0%) | 45 (100.0%) |
Property Value to Household Income Ratio in Bland
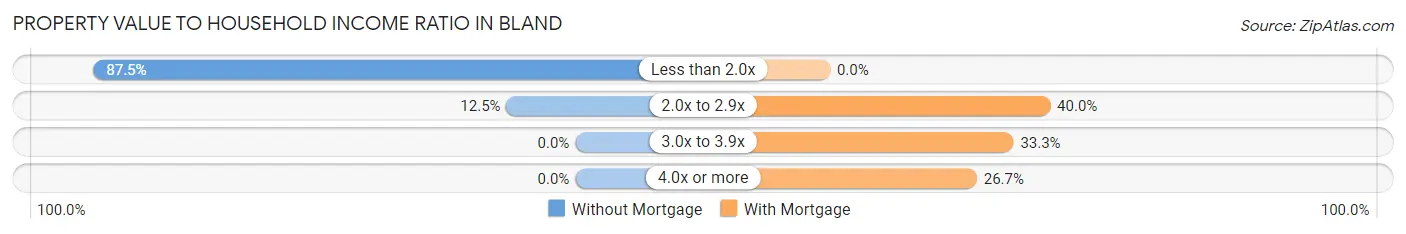
| Value-to-Income Ratio | Without Mortgage | With Mortgage |
| Less than 2.0x | 49 (87.5%) | 0 (0.0%) |
| 2.0x to 2.9x | 7 (12.5%) | 18 (40.0%) |
| 3.0x to 3.9x | 0 (0.0%) | 15 (33.3%) |
| 4.0x or more | 0 (0.0%) | 12 (26.7%) |
| Total | 56 (100.0%) | 45 (100.0%) |
Real Estate Taxes by Mortgage Status in Bland
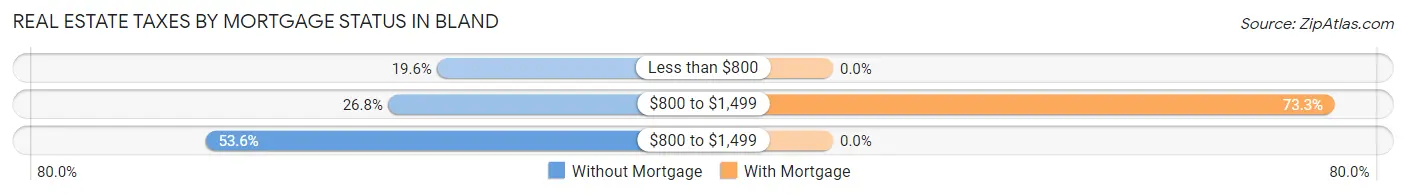
| Property Taxes | Without Mortgage | With Mortgage |
| Less than $800 | 11 (19.6%) | 0 (0.0%) |
| $800 to $1,499 | 15 (26.8%) | 33 (73.3%) |
| $800 to $1,499 | 30 (53.6%) | 0 (0.0%) |
| Total | 56 (100.0%) | 45 (100.0%) |
Health & Disability in Bland
Health Insurance Coverage by Age in Bland
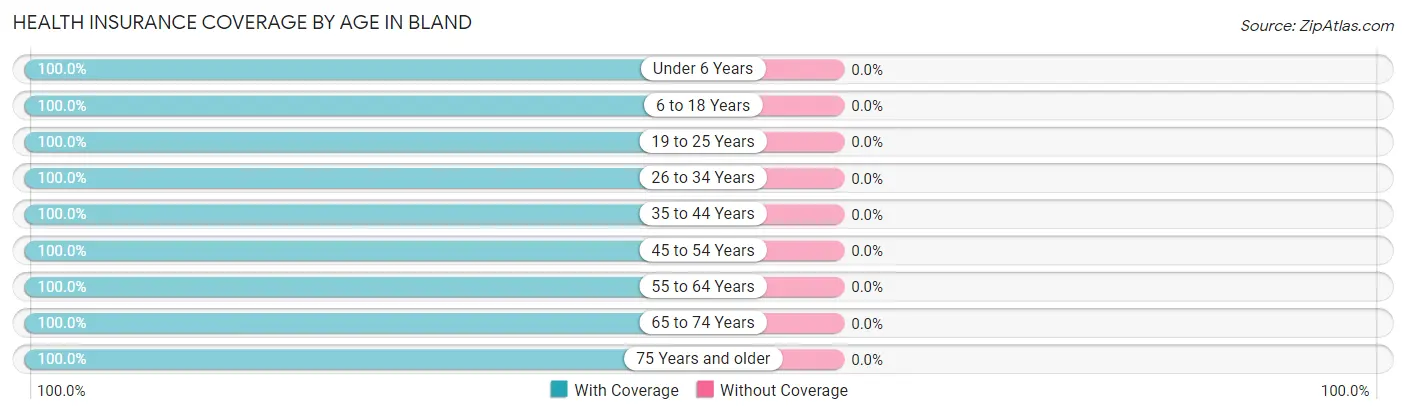
| Age Bracket | With Coverage | Without Coverage |
| Under 6 Years | 46 (100.0%) | 0 (0.0%) |
| 6 to 18 Years | 55 (100.0%) | 0 (0.0%) |
| 19 to 25 Years | 92 (100.0%) | 0 (0.0%) |
| 26 to 34 Years | 35 (100.0%) | 0 (0.0%) |
| 35 to 44 Years | 98 (100.0%) | 0 (0.0%) |
| 45 to 54 Years | 16 (100.0%) | 0 (0.0%) |
| 55 to 64 Years | 18 (100.0%) | 0 (0.0%) |
| 65 to 74 Years | 30 (100.0%) | 0 (0.0%) |
| 75 Years and older | 43 (100.0%) | 0 (0.0%) |
| Total | 433 (100.0%) | 0 (0.0%) |
Health Insurance Coverage by Citizenship Status in Bland
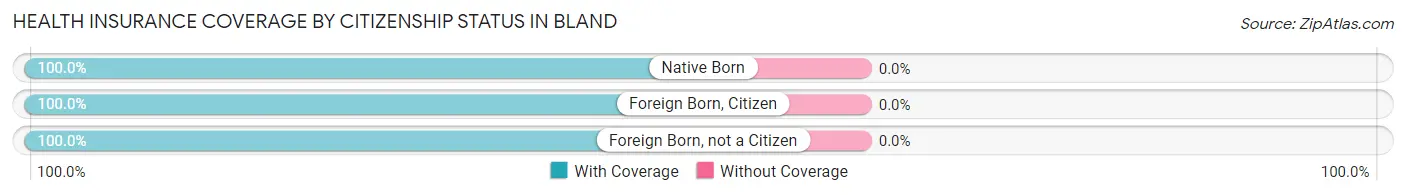
| Citizenship Status | With Coverage | Without Coverage |
| Native Born | 46 (100.0%) | 0 (0.0%) |
| Foreign Born, Citizen | 55 (100.0%) | 0 (0.0%) |
| Foreign Born, not a Citizen | 92 (100.0%) | 0 (0.0%) |
Health Insurance Coverage by Household Income in Bland
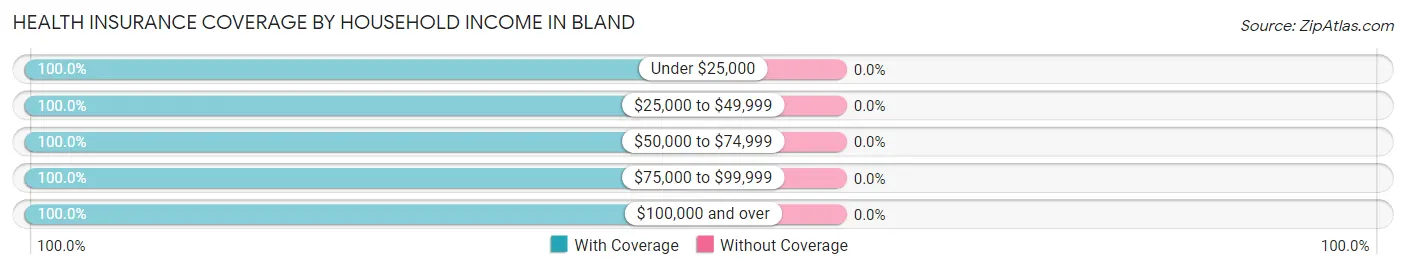
| Household Income | With Coverage | Without Coverage |
| Under $25,000 | 11 (100.0%) | 0 (0.0%) |
| $25,000 to $49,999 | 119 (100.0%) | 0 (0.0%) |
| $50,000 to $74,999 | 69 (100.0%) | 0 (0.0%) |
| $75,000 to $99,999 | 105 (100.0%) | 0 (0.0%) |
| $100,000 and over | 129 (100.0%) | 0 (0.0%) |
Public vs Private Health Insurance Coverage by Age in Bland
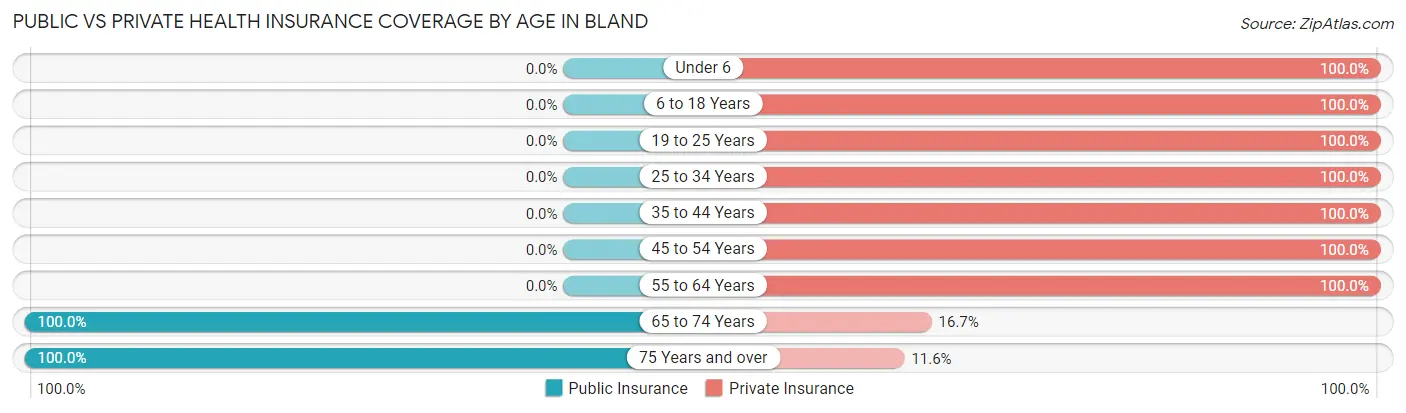
| Age Bracket | Public Insurance | Private Insurance |
| Under 6 | 0 (0.0%) | 46 (100.0%) |
| 6 to 18 Years | 0 (0.0%) | 55 (100.0%) |
| 19 to 25 Years | 0 (0.0%) | 92 (100.0%) |
| 25 to 34 Years | 0 (0.0%) | 35 (100.0%) |
| 35 to 44 Years | 0 (0.0%) | 98 (100.0%) |
| 45 to 54 Years | 0 (0.0%) | 16 (100.0%) |
| 55 to 64 Years | 0 (0.0%) | 18 (100.0%) |
| 65 to 74 Years | 30 (100.0%) | 5 (16.7%) |
| 75 Years and over | 43 (100.0%) | 5 (11.6%) |
| Total | 73 (16.9%) | 370 (85.5%) |
Disability Status by Sex by Age in Bland
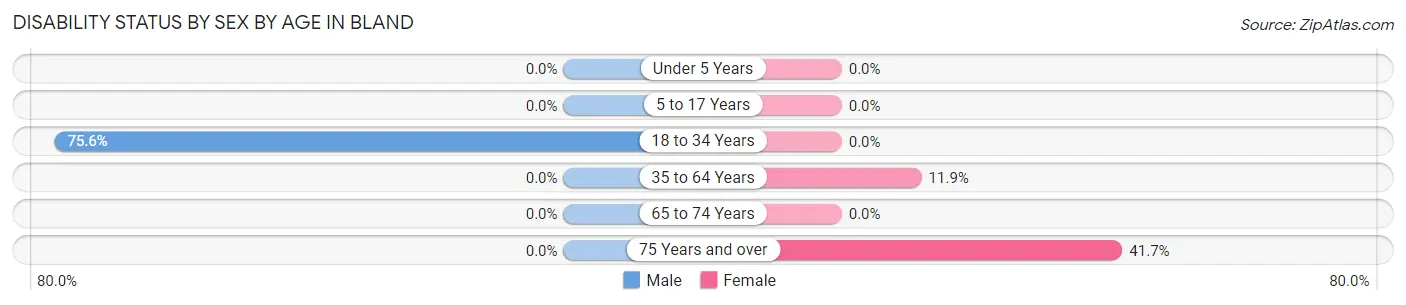
| Age Bracket | Male | Female |
| Under 5 Years | 0 (0.0%) | 0 (0.0%) |
| 5 to 17 Years | 0 (0.0%) | 0 (0.0%) |
| 18 to 34 Years | 34 (75.6%) | 0 (0.0%) |
| 35 to 64 Years | 0 (0.0%) | 7 (11.9%) |
| 65 to 74 Years | 0 (0.0%) | 0 (0.0%) |
| 75 Years and over | 0 (0.0%) | 5 (41.7%) |
Disability Class by Sex by Age in Bland
Disability Class: Hearing Difficulty
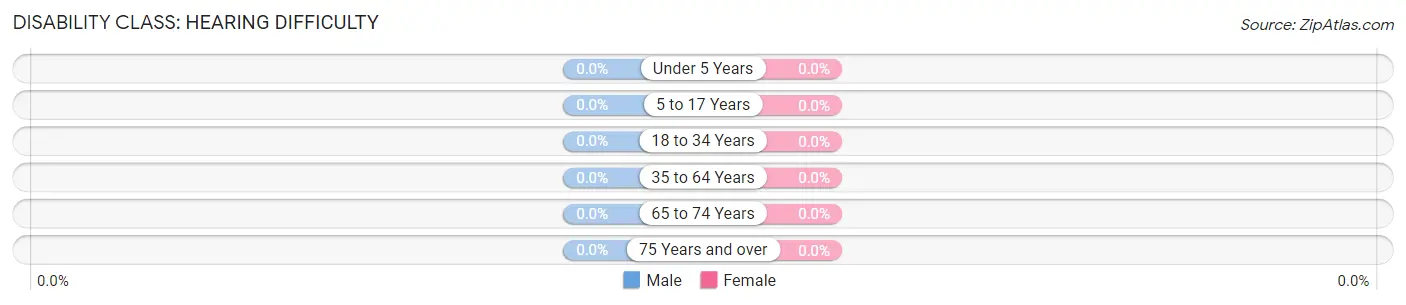
| Age Bracket | Male | Female |
| Under 5 Years | 0 (0.0%) | 0 (0.0%) |
| 5 to 17 Years | 0 (0.0%) | 0 (0.0%) |
| 18 to 34 Years | 0 (0.0%) | 0 (0.0%) |
| 35 to 64 Years | 0 (0.0%) | 0 (0.0%) |
| 65 to 74 Years | 0 (0.0%) | 0 (0.0%) |
| 75 Years and over | 0 (0.0%) | 0 (0.0%) |
Disability Class: Vision Difficulty
| Age Bracket | Male | Female |
| Under 5 Years | 0 (0.0%) | 0 (0.0%) |
| 5 to 17 Years | 0 (0.0%) | 0 (0.0%) |
| 18 to 34 Years | 0 (0.0%) | 0 (0.0%) |
| 35 to 64 Years | 0 (0.0%) | 0 (0.0%) |
| 65 to 74 Years | 0 (0.0%) | 0 (0.0%) |
| 75 Years and over | 0 (0.0%) | 0 (0.0%) |
Disability Class: Cognitive Difficulty
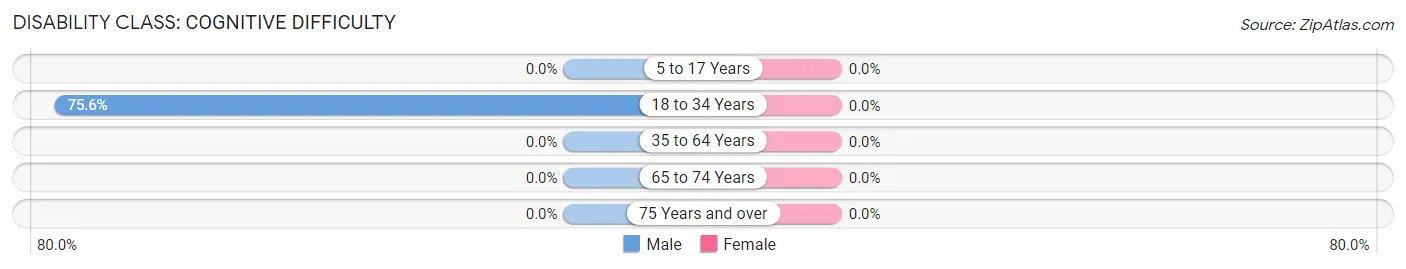
| Age Bracket | Male | Female |
| 5 to 17 Years | 0 (0.0%) | 0 (0.0%) |
| 18 to 34 Years | 34 (75.6%) | 0 (0.0%) |
| 35 to 64 Years | 0 (0.0%) | 0 (0.0%) |
| 65 to 74 Years | 0 (0.0%) | 0 (0.0%) |
| 75 Years and over | 0 (0.0%) | 0 (0.0%) |
Disability Class: Ambulatory Difficulty
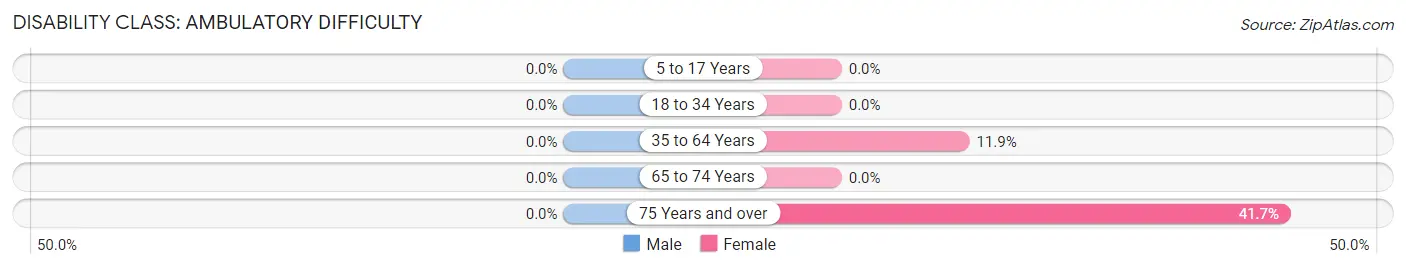
| Age Bracket | Male | Female |
| 5 to 17 Years | 0 (0.0%) | 0 (0.0%) |
| 18 to 34 Years | 0 (0.0%) | 0 (0.0%) |
| 35 to 64 Years | 0 (0.0%) | 7 (11.9%) |
| 65 to 74 Years | 0 (0.0%) | 0 (0.0%) |
| 75 Years and over | 0 (0.0%) | 5 (41.7%) |
Disability Class: Self-Care Difficulty
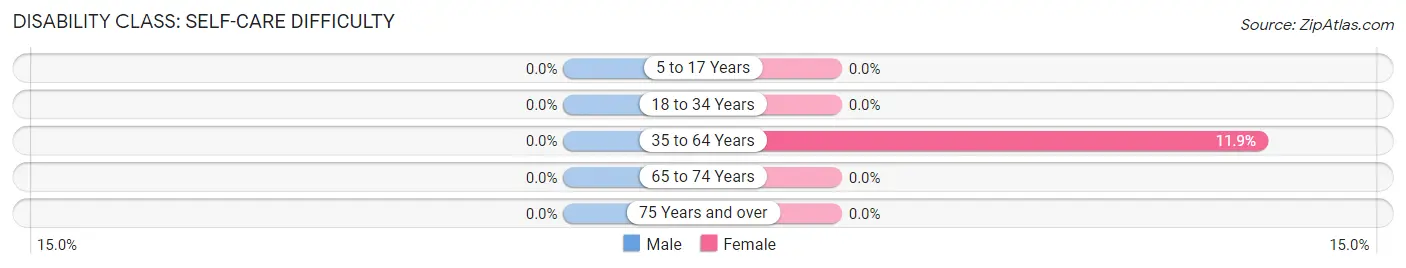
| Age Bracket | Male | Female |
| 5 to 17 Years | 0 (0.0%) | 0 (0.0%) |
| 18 to 34 Years | 0 (0.0%) | 0 (0.0%) |
| 35 to 64 Years | 0 (0.0%) | 7 (11.9%) |
| 65 to 74 Years | 0 (0.0%) | 0 (0.0%) |
| 75 Years and over | 0 (0.0%) | 0 (0.0%) |
Technology Access in Bland
Computing Device Access in Bland
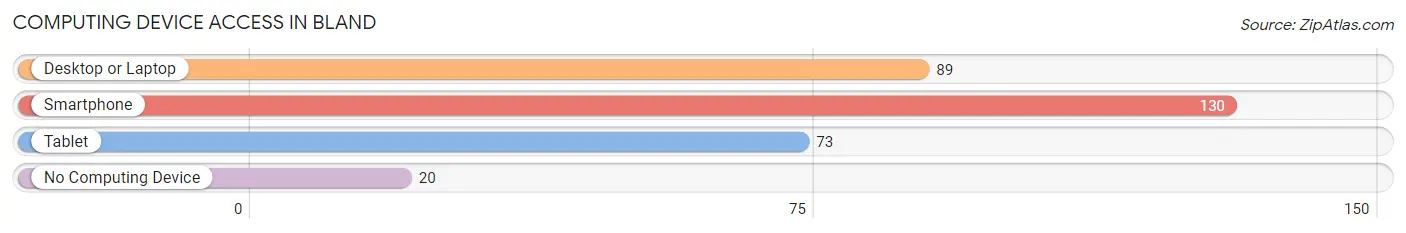
| Device Type | # Households | % Households |
| Desktop or Laptop | 89 | 59.3% |
| Smartphone | 130 | 86.7% |
| Tablet | 73 | 48.7% |
| No Computing Device | 20 | 13.3% |
| Total | 150 | 100.0% |
Internet Access in Bland
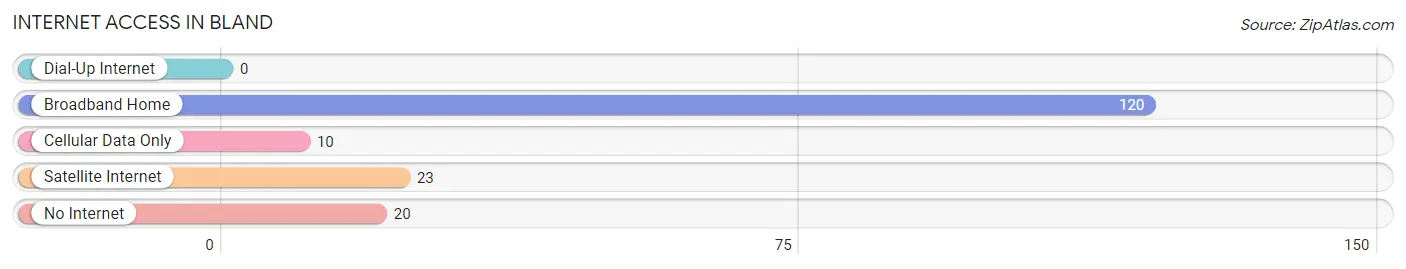
| Internet Type | # Households | % Households |
| Dial-Up Internet | 0 | 0.0% |
| Broadband Home | 120 | 80.0% |
| Cellular Data Only | 10 | 6.7% |
| Satellite Internet | 23 | 15.3% |
| No Internet | 20 | 13.3% |
| Total | 150 | 100.0% |
Bland Summary
Bland is a small town located in the Blue Ridge Mountains of southwestern Virginia. It is the county seat of Bland County, which was formed in 1861. The town is situated in a rural area and is home to a population of just over 1,000 people.
History
The area that is now Bland was first settled in the late 1700s by a group of settlers from Pennsylvania. The town was originally known as Blandville, and was named after Richard Bland, a prominent Virginia politician. The town was officially incorporated in 1872.
In the late 1800s, Bland became a popular tourist destination due to its scenic beauty and proximity to the Blue Ridge Mountains. The town was also known for its mineral springs, which were believed to have healing properties.
In the early 1900s, Bland experienced a period of economic growth due to the development of the railroad. The railroad allowed for the transportation of goods and people to and from the town, and it also allowed for the development of new industries.
Geography
Bland is located in the Blue Ridge Mountains of southwestern Virginia. The town is situated in a rural area and is surrounded by rolling hills and forests. The town is located near the headwaters of the New River, which is one of the oldest rivers in the United States.
The climate in Bland is temperate, with hot summers and cold winters. The average annual temperature is around 55 degrees Fahrenheit. The town receives an average of 45 inches of precipitation per year.
Economy
The economy of Bland is largely based on agriculture and tourism. The town is home to several farms, which produce a variety of crops, including corn, soybeans, and hay. The town is also home to several wineries, which produce a variety of wines.
Tourism is an important part of the economy in Bland. The town is home to several attractions, including the Bland County Historical Museum, the Bland County Courthouse, and the Bland County Fairgrounds. The town is also home to several outdoor recreation areas, including the New River Trail State Park and the Jefferson National Forest.
Demographics
As of the 2010 census, the population of Bland was 1,068. The racial makeup of the town was 95.3% White, 2.2% African American, 0.3% Native American, 0.2% Asian, 0.1% Pacific Islander, 0.7% from other races, and 1.3% from two or more races. Hispanic or Latino of any race were 1.7% of the population.
The median household income in Bland was $30,938, and the median family income was $37,813. The per capita income in Bland was $17,845. About 17.2% of the population was below the poverty line.
Bland is a small town with a rich history and a unique culture. The town is home to a diverse population and a vibrant economy. The town is surrounded by natural beauty and offers a variety of outdoor activities. Bland is a great place to live, work, and visit.
Common Questions
What is Per Capita Income in Bland?
Per Capita income in Bland is $39,799.
What is the Median Family Income in Bland?
Median Family Income in Bland is $81,563.
What is the Median Household income in Bland?
Median Household Income in Bland is $71,000.
What is Inequality or Gini Index in Bland?
Inequality or Gini Index in Bland is 0.41.
What is the Total Population of Bland?
Total Population of Bland is 433.
What is the Total Male Population of Bland?
Total Male Population of Bland is 241.
What is the Total Female Population of Bland?
Total Female Population of Bland is 192.
What is the Ratio of Males per 100 Females in Bland?
There are 125.52 Males per 100 Females in Bland.
What is the Ratio of Females per 100 Males in Bland?
There are 79.67 Females per 100 Males in Bland.
What is the Median Population Age in Bland?
Median Population Age in Bland is 26.7 Years.
What is the Average Family Size in Bland
Average Family Size in Bland is 3.2 People.
What is the Average Household Size in Bland
Average Household Size in Bland is 2.9 People.
How Large is the Labor Force in Bland?
There are 196 People in the Labor Forcein in Bland.
What is the Percentage of People in the Labor Force in Bland?
59.0% of People are in the Labor Force in Bland.
What is the Unemployment Rate in Bland?
Unemployment Rate in Bland is 6.1%.