Plum Creek, VA Map & Demographics
Plum Creek Map
Plum Creek Overview
$20,709
PER CAPITA INCOME
$58,824
AVG FAMILY INCOME
$28,417
AVG HOUSEHOLD INCOME
56.8%
WAGE / INCOME GAP [ % ]
43.2¢/ $1
WAGE / INCOME GAP [ $ ]
0.43
INEQUALITY / GINI INDEX
1,047
TOTAL POPULATION
498
MALE POPULATION
549
FEMALE POPULATION
90.71
MALES / 100 FEMALES
110.24
FEMALES / 100 MALES
39.9
MEDIAN AGE
2.9
AVG FAMILY SIZE
2.2
AVG HOUSEHOLD SIZE
580
LABOR FORCE [ PEOPLE ]
70.7%
PERCENT IN LABOR FORCE
12.6%
UNEMPLOYMENT RATE
Income in Plum Creek
Income Overview in Plum Creek
Per Capita Income in Plum Creek is $20,709, while median incomes of families and households are $58,824 and $28,417 respectively.
| Characteristic | Number | Measure |
| Per Capita Income | 1,047 | $20,709 |
| Median Family Income | 234 | $58,824 |
| Mean Family Income | 234 | $59,223 |
| Median Household Income | 477 | $28,417 |
| Mean Household Income | 477 | $43,842 |
| Income Deficit | 234 | $0 |
| Wage / Income Gap (%) | 1,047 | 56.77% |
| Wage / Income Gap ($) | 1,047 | 43.23¢ per $1 |
| Gini / Inequality Index | 1,047 | 0.43 |
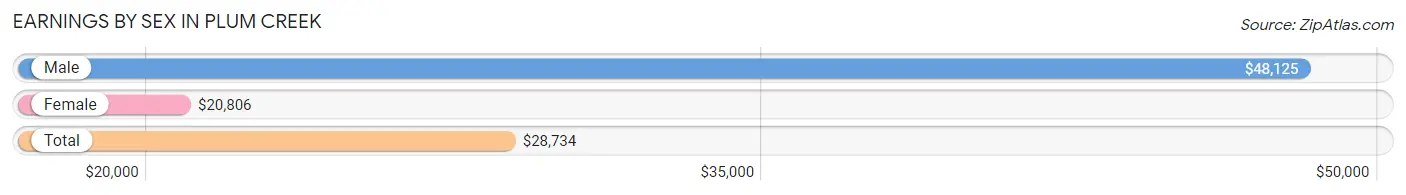
Earnings by Sex in Plum Creek
Average Earnings in Plum Creek are $28,734, $48,125 for men and $20,806 for women, a difference of 56.8%.
| Sex | Number | Average Earnings |
| Male | 197 (36.5%) | $48,125 |
| Female | 342 (63.4%) | $20,806 |
| Total | 539 (100.0%) | $28,734 |
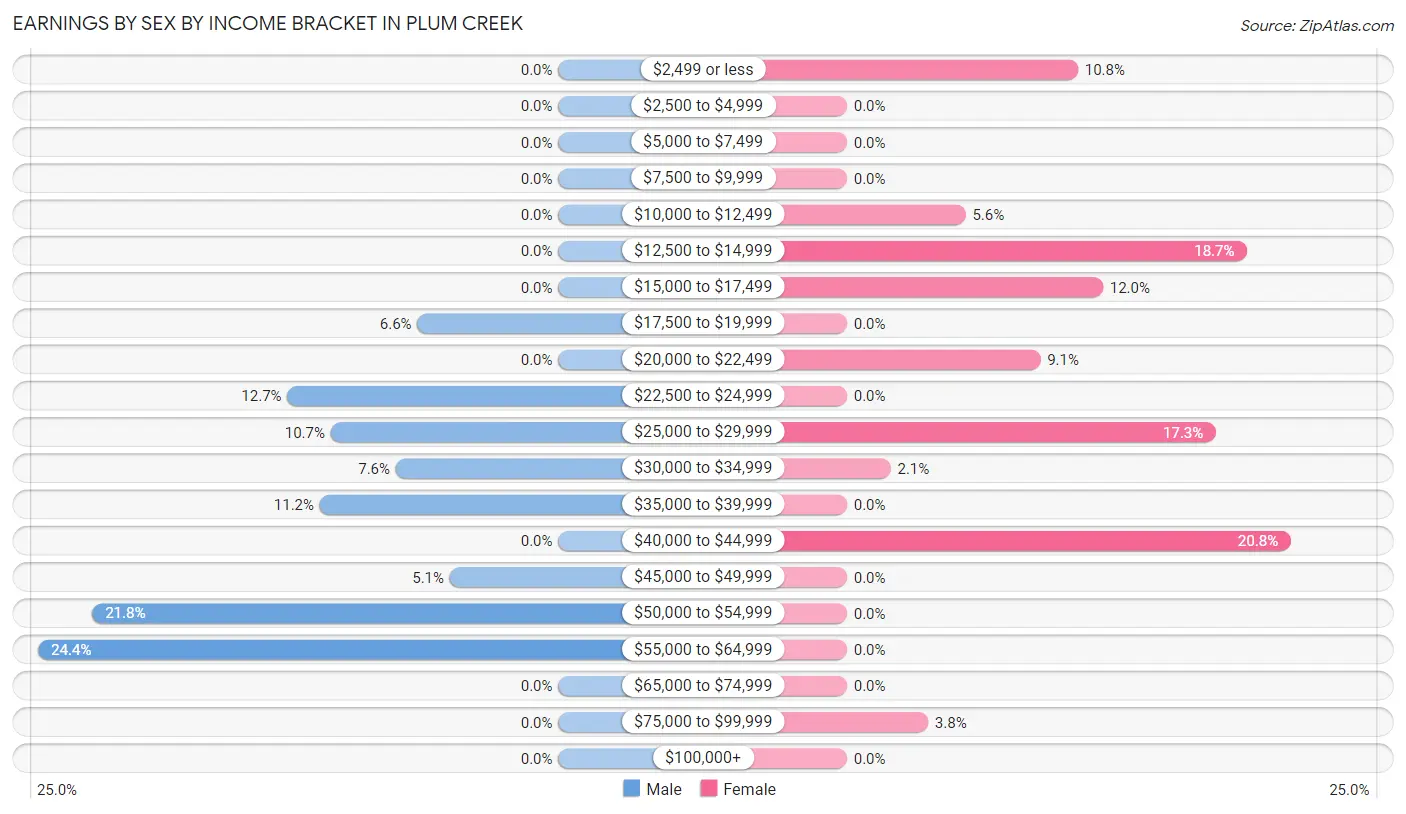
Earnings by Sex by Income Bracket in Plum Creek
The most common earnings brackets in Plum Creek are $55,000 to $64,999 for men (48 | 24.4%) and $40,000 to $44,999 for women (71 | 20.8%).
| Income | Male | Female |
| $2,499 or less | 0 (0.0%) | 37 (10.8%) |
| $2,500 to $4,999 | 0 (0.0%) | 0 (0.0%) |
| $5,000 to $7,499 | 0 (0.0%) | 0 (0.0%) |
| $7,500 to $9,999 | 0 (0.0%) | 0 (0.0%) |
| $10,000 to $12,499 | 0 (0.0%) | 19 (5.6%) |
| $12,500 to $14,999 | 0 (0.0%) | 64 (18.7%) |
| $15,000 to $17,499 | 0 (0.0%) | 41 (12.0%) |
| $17,500 to $19,999 | 13 (6.6%) | 0 (0.0%) |
| $20,000 to $22,499 | 0 (0.0%) | 31 (9.1%) |
| $22,500 to $24,999 | 25 (12.7%) | 0 (0.0%) |
| $25,000 to $29,999 | 21 (10.7%) | 59 (17.2%) |
| $30,000 to $34,999 | 15 (7.6%) | 7 (2.1%) |
| $35,000 to $39,999 | 22 (11.2%) | 0 (0.0%) |
| $40,000 to $44,999 | 0 (0.0%) | 71 (20.8%) |
| $45,000 to $49,999 | 10 (5.1%) | 0 (0.0%) |
| $50,000 to $54,999 | 43 (21.8%) | 0 (0.0%) |
| $55,000 to $64,999 | 48 (24.4%) | 0 (0.0%) |
| $65,000 to $74,999 | 0 (0.0%) | 0 (0.0%) |
| $75,000 to $99,999 | 0 (0.0%) | 13 (3.8%) |
| $100,000+ | 0 (0.0%) | 0 (0.0%) |
| Total | 197 (100.0%) | 342 (100.0%) |
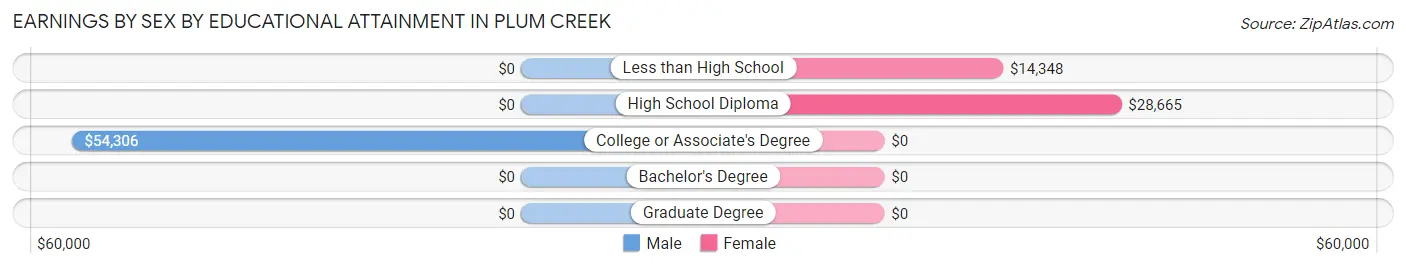
Earnings by Sex by Educational Attainment in Plum Creek
Average earnings in Plum Creek are $50,781 for men and $21,815 for women, a difference of 57.0%. Men with an educational attainment of college or associate's degree enjoy the highest average annual earnings of $54,306, while those with college or associate's degree education earn the least with $54,306. Women with an educational attainment of high school diploma earn the most with the average annual earnings of $28,665, while those with less than high school education have the smallest earnings of $14,348.
| Educational Attainment | Male Income | Female Income |
| Less than High School | - | - |
| High School Diploma | - | - |
| College or Associate's Degree | $54,306 | $0 |
| Bachelor's Degree | - | - |
| Graduate Degree | - | - |
| Total | $50,781 | $21,815 |
Family Income in Plum Creek
Family Income Brackets in Plum Creek
According to the Plum Creek family income data, there are 74 families falling into the $75,000 to $99,999 income range, which is the most common income bracket and makes up 31.6% of all families.
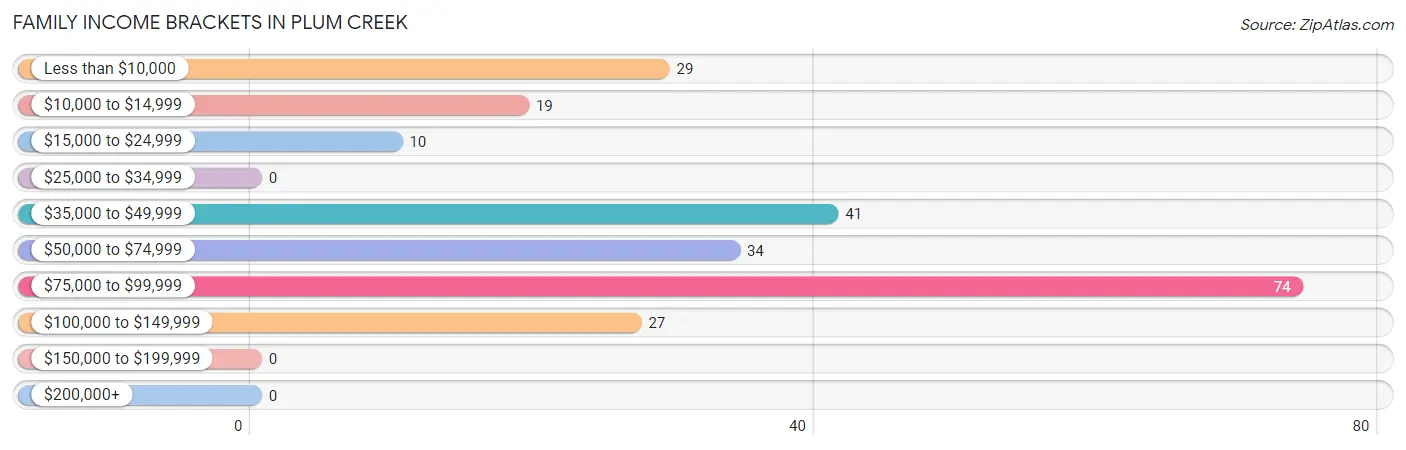
| Income Bracket | # Families | % Families |
| Less than $10,000 | 29 | 12.4% |
| $10,000 to $14,999 | 19 | 8.1% |
| $15,000 to $24,999 | 10 | 4.3% |
| $25,000 to $34,999 | 0 | 0.0% |
| $35,000 to $49,999 | 41 | 17.5% |
| $50,000 to $74,999 | 34 | 14.5% |
| $75,000 to $99,999 | 74 | 31.6% |
| $100,000 to $149,999 | 27 | 11.5% |
| $150,000 to $199,999 | 0 | 0.0% |
| $200,000+ | 0 | 0.0% |
Family Income by Famaliy Size in Plum Creek
2-person families (108 | 46.2%) account for the highest median family income in Plum Creek with $59,485 per family, while 2-person families (108 | 46.2%) have the highest median income of $29,742 per family member.
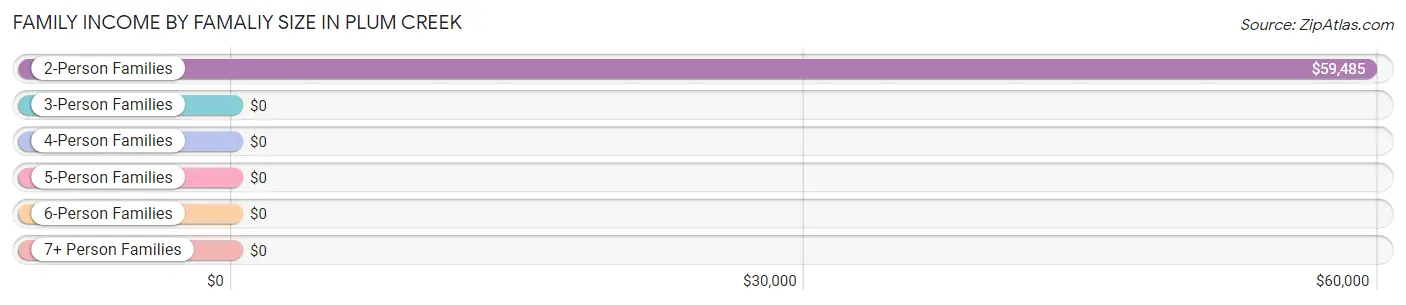
| Income Bracket | # Families | Median Income |
| 2-Person Families | 108 (46.2%) | $59,485 |
| 3-Person Families | 72 (30.8%) | $0 |
| 4-Person Families | 40 (17.1%) | $0 |
| 5-Person Families | 14 (6.0%) | $0 |
| 6-Person Families | 0 (0.0%) | $0 |
| 7+ Person Families | 0 (0.0%) | $0 |
| Total | 234 (100.0%) | $58,824 |
Family Income by Number of Earners in Plum Creek
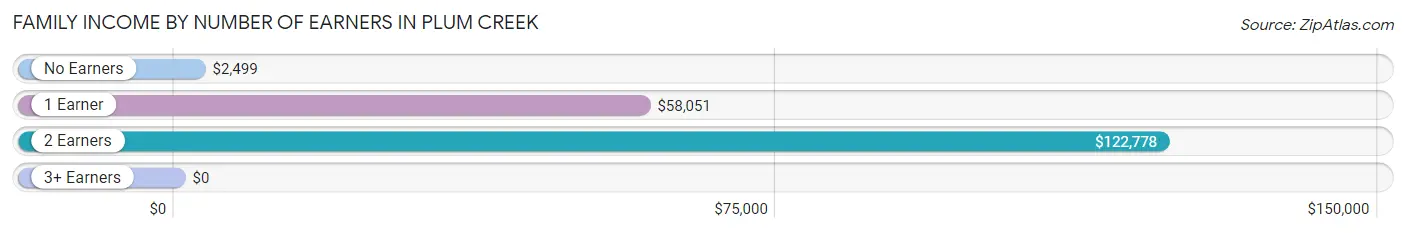
| Number of Earners | # Families | Median Income |
| No Earners | 48 (20.5%) | $2,499 |
| 1 Earner | 117 (50.0%) | $58,051 |
| 2 Earners | 48 (20.5%) | $122,778 |
| 3+ Earners | 21 (9.0%) | $0 |
| Total | 234 (100.0%) | $58,824 |
Household Income in Plum Creek
Household Income Brackets in Plum Creek
With 145 households falling in the category, the $15,000 to $24,999 income range is the most frequent in Plum Creek, accounting for 30.4% of all households.
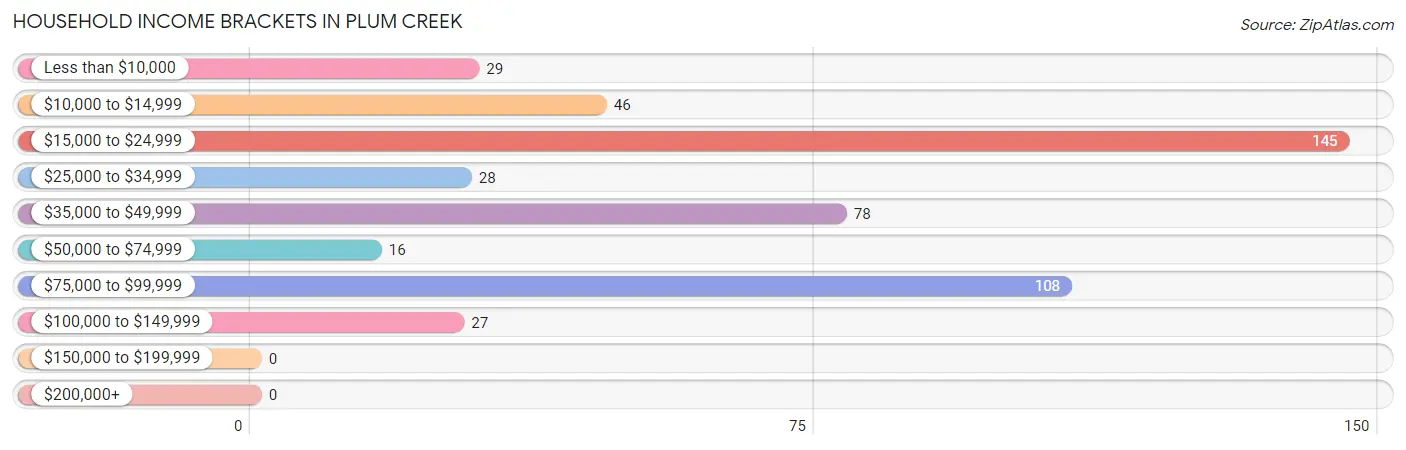
| Income Bracket | # Households | % Households |
| Less than $10,000 | 29 | 6.1% |
| $10,000 to $14,999 | 46 | 9.6% |
| $15,000 to $24,999 | 145 | 30.4% |
| $25,000 to $34,999 | 28 | 5.9% |
| $35,000 to $49,999 | 78 | 16.4% |
| $50,000 to $74,999 | 16 | 3.4% |
| $75,000 to $99,999 | 108 | 22.6% |
| $100,000 to $149,999 | 27 | 5.7% |
| $150,000 to $199,999 | 0 | 0.0% |
| $200,000+ | 0 | 0.0% |
Household Income by Householder Age in Plum Creek
The median household income in Plum Creek is $28,417, with the highest median household income of $47,708 found in the 45 to 64 years age bracket for the primary householder. A total of 185 households (38.8%) fall into this category.
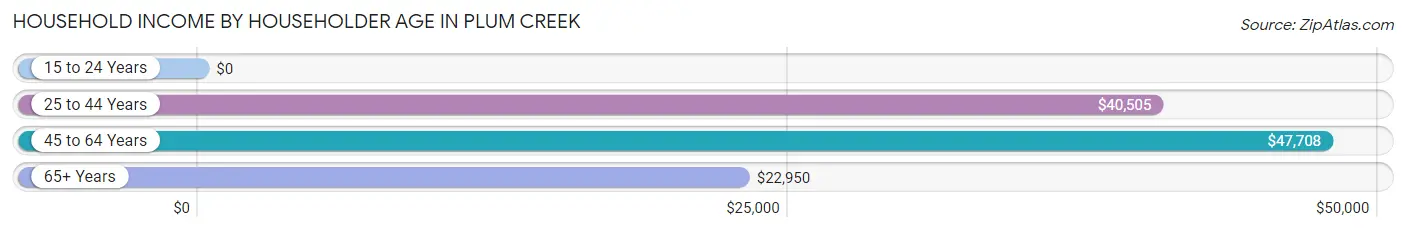
| Income Bracket | # Households | Median Income |
| 15 to 24 Years | 0 (0.0%) | $0 |
| 25 to 44 Years | 171 (35.8%) | $40,505 |
| 45 to 64 Years | 185 (38.8%) | $47,708 |
| 65+ Years | 121 (25.4%) | $22,950 |
| Total | 477 (100.0%) | $28,417 |
Poverty in Plum Creek
Income Below Poverty by Sex and Age in Plum Creek
With 31.5% poverty level for males and 31.3% for females among the residents of Plum Creek, 15 year old males and under 5 year old females are the most vulnerable to poverty, with 17 males (100.0%) and 19 females (100.0%) in their respective age groups living below the poverty level.
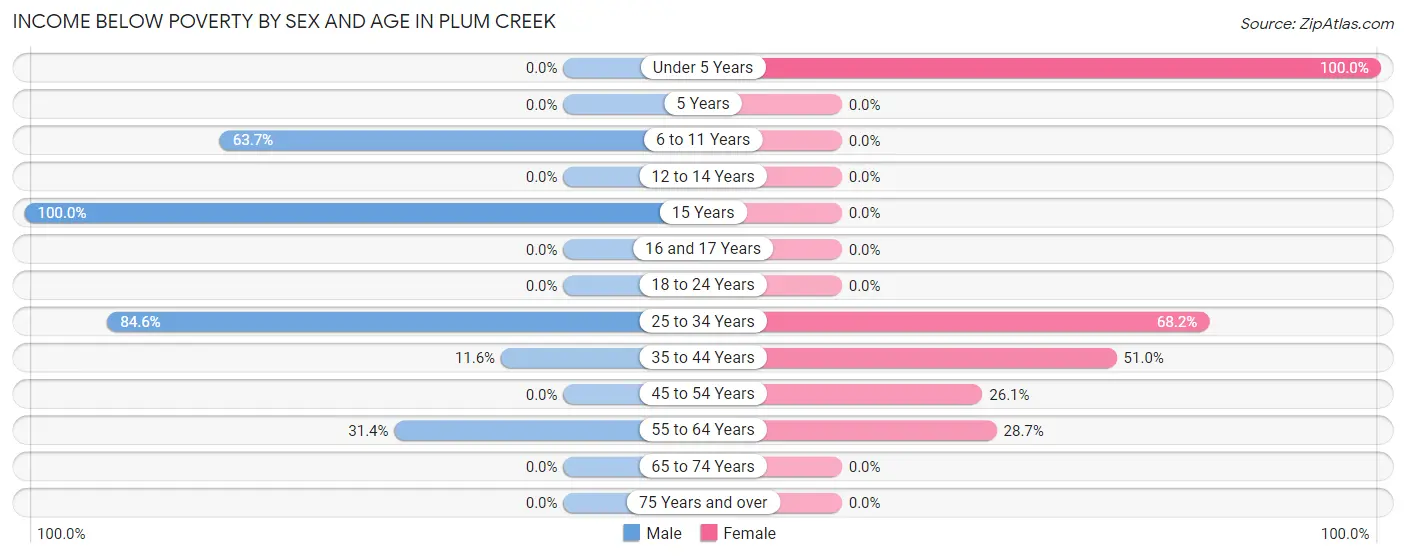
| Age Bracket | Male | Female |
| Under 5 Years | 0 (0.0%) | 19 (100.0%) |
| 5 Years | 0 (0.0%) | 0 (0.0%) |
| 6 to 11 Years | 58 (63.7%) | 0 (0.0%) |
| 12 to 14 Years | 0 (0.0%) | 0 (0.0%) |
| 15 Years | 17 (100.0%) | 0 (0.0%) |
| 16 and 17 Years | 0 (0.0%) | 0 (0.0%) |
| 18 to 24 Years | 0 (0.0%) | 0 (0.0%) |
| 25 to 34 Years | 55 (84.6%) | 60 (68.2%) |
| 35 to 44 Years | 11 (11.6%) | 25 (51.0%) |
| 45 to 54 Years | 0 (0.0%) | 18 (26.1%) |
| 55 to 64 Years | 16 (31.4%) | 50 (28.7%) |
| 65 to 74 Years | 0 (0.0%) | 0 (0.0%) |
| 75 Years and over | 0 (0.0%) | 0 (0.0%) |
| Total | 157 (31.5%) | 172 (31.3%) |
Income Above Poverty by Sex and Age in Plum Creek
According to the poverty statistics in Plum Creek, males aged under 5 years and females aged 6 to 11 years are the age groups that are most secure financially, with 100.0% of males and 100.0% of females in these age groups living above the poverty line.
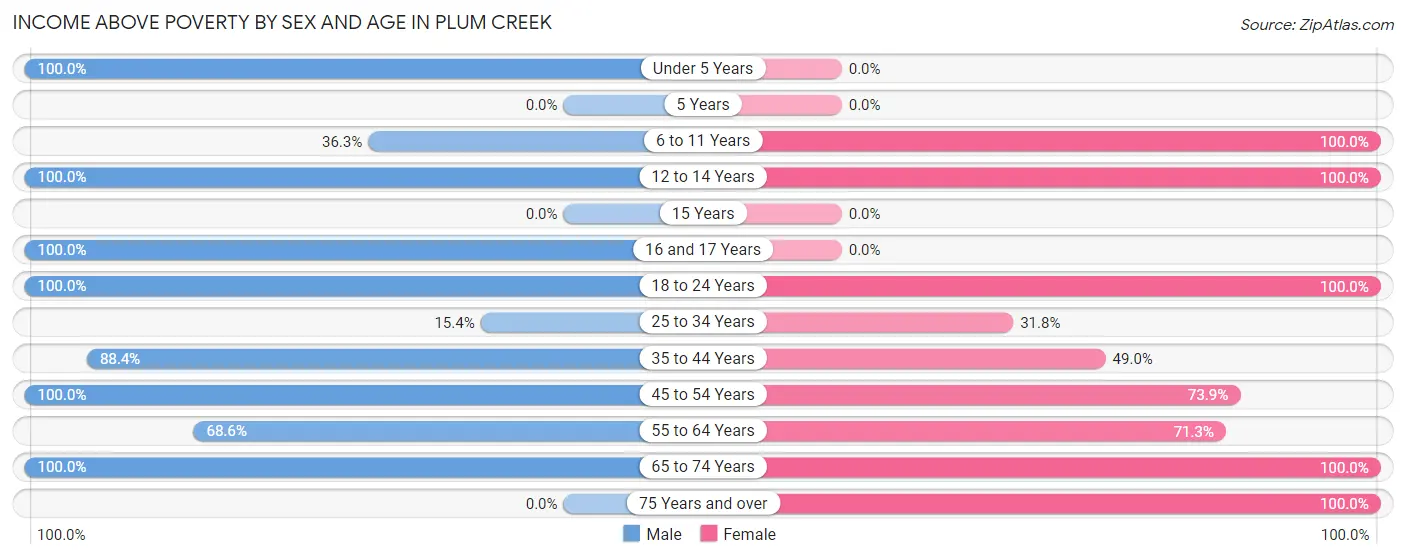
| Age Bracket | Male | Female |
| Under 5 Years | 59 (100.0%) | 0 (0.0%) |
| 5 Years | 0 (0.0%) | 0 (0.0%) |
| 6 to 11 Years | 33 (36.3%) | 15 (100.0%) |
| 12 to 14 Years | 10 (100.0%) | 16 (100.0%) |
| 15 Years | 0 (0.0%) | 0 (0.0%) |
| 16 and 17 Years | 15 (100.0%) | 0 (0.0%) |
| 18 to 24 Years | 25 (100.0%) | 25 (100.0%) |
| 25 to 34 Years | 10 (15.4%) | 28 (31.8%) |
| 35 to 44 Years | 84 (88.4%) | 24 (49.0%) |
| 45 to 54 Years | 43 (100.0%) | 51 (73.9%) |
| 55 to 64 Years | 35 (68.6%) | 124 (71.3%) |
| 65 to 74 Years | 27 (100.0%) | 34 (100.0%) |
| 75 Years and over | 0 (0.0%) | 60 (100.0%) |
| Total | 341 (68.5%) | 377 (68.7%) |
Income Below Poverty Among Married-Couple Families in Plum Creek
The poverty statistics for married-couple families in Plum Creek show that 4.3% or 4 of the total 92 families live below the poverty line. Families with no children have the highest poverty rate of 5.1%, comprising of 4 families. On the other hand, families with 3 or 4 children have the lowest poverty rate of 0.0%, which includes 0 families.
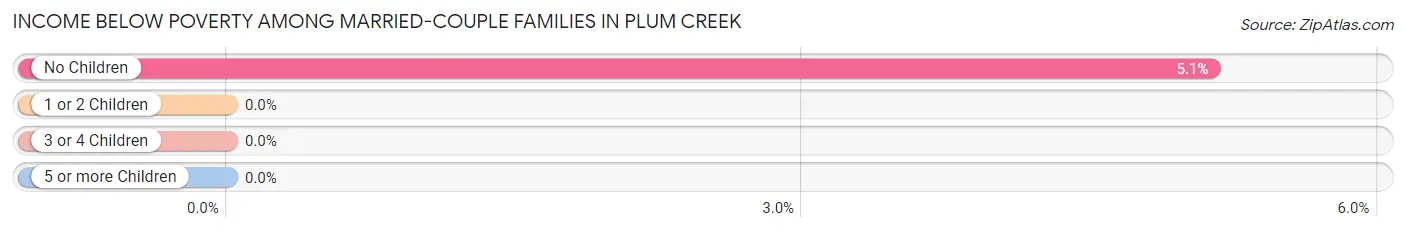
| Children | Above Poverty | Below Poverty |
| No Children | 74 (94.9%) | 4 (5.1%) |
| 1 or 2 Children | 0 (0.0%) | 0 (0.0%) |
| 3 or 4 Children | 14 (100.0%) | 0 (0.0%) |
| 5 or more Children | 0 (0.0%) | 0 (0.0%) |
| Total | 88 (95.7%) | 4 (4.3%) |
Income Below Poverty Among Single-Parent Households in Plum Creek
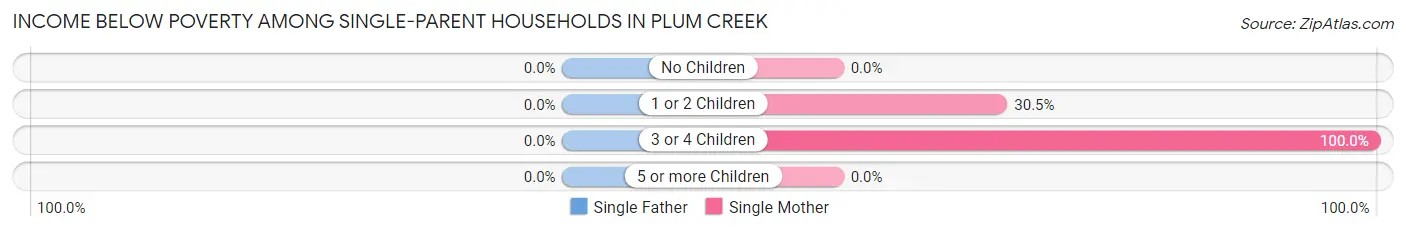
| Children | Single Father | Single Mother |
| No Children | 0 (0.0%) | 0 (0.0%) |
| 1 or 2 Children | 0 (0.0%) | 25 (30.5%) |
| 3 or 4 Children | 0 (0.0%) | 19 (100.0%) |
| 5 or more Children | 0 (0.0%) | 0 (0.0%) |
| Total | 0 (0.0%) | 44 (40.7%) |
Income Below Poverty Among Married-Couple vs Single-Parent Households in Plum Creek
The poverty data for Plum Creek shows that 4 of the married-couple family households (4.3%) and 44 of the single-parent households (31.0%) are living below the poverty level. Within the married-couple family households, those with no children have the highest poverty rate, with 4 households (5.1%) falling below the poverty line. Among the single-parent households, those with 3 or 4 children have the highest poverty rate, with 19 household (100.0%) living below poverty.
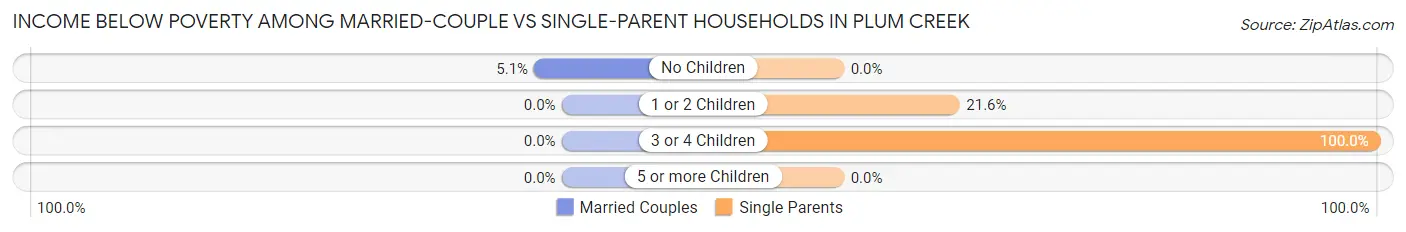
| Children | Married-Couple Families | Single-Parent Households |
| No Children | 4 (5.1%) | 0 (0.0%) |
| 1 or 2 Children | 0 (0.0%) | 25 (21.5%) |
| 3 or 4 Children | 0 (0.0%) | 19 (100.0%) |
| 5 or more Children | 0 (0.0%) | 0 (0.0%) |
| Total | 4 (4.3%) | 44 (31.0%) |
Race in Plum Creek
The most populous races in Plum Creek are White / Caucasian (919 | 87.8%), Two or more Races (64 | 6.1%), and Hispanic or Latino (52 | 5.0%).
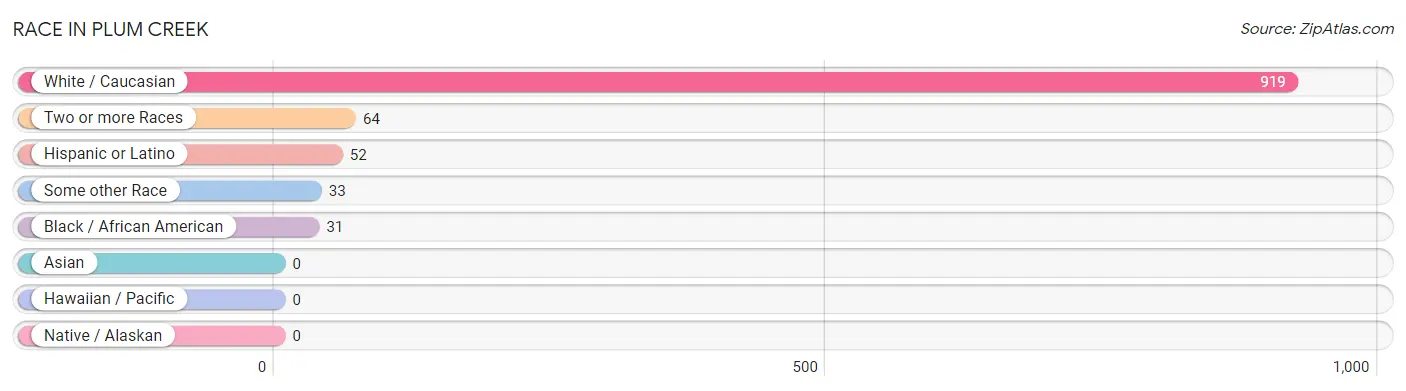
| Race | # Population | % Population |
| Asian | 0 | 0.0% |
| Black / African American | 31 | 3.0% |
| Hawaiian / Pacific | 0 | 0.0% |
| Hispanic or Latino | 52 | 5.0% |
| Native / Alaskan | 0 | 0.0% |
| White / Caucasian | 919 | 87.8% |
| Two or more Races | 64 | 6.1% |
| Some other Race | 33 | 3.2% |
| Total | 1,047 | 100.0% |
Ancestry in Plum Creek
The most populous ancestries reported in Plum Creek are American (307 | 29.3%), English (76 | 7.3%), Mexican (52 | 5.0%), Irish (30 | 2.9%), and Scottish (14 | 1.3%), together accounting for 45.8% of all Plum Creek residents.
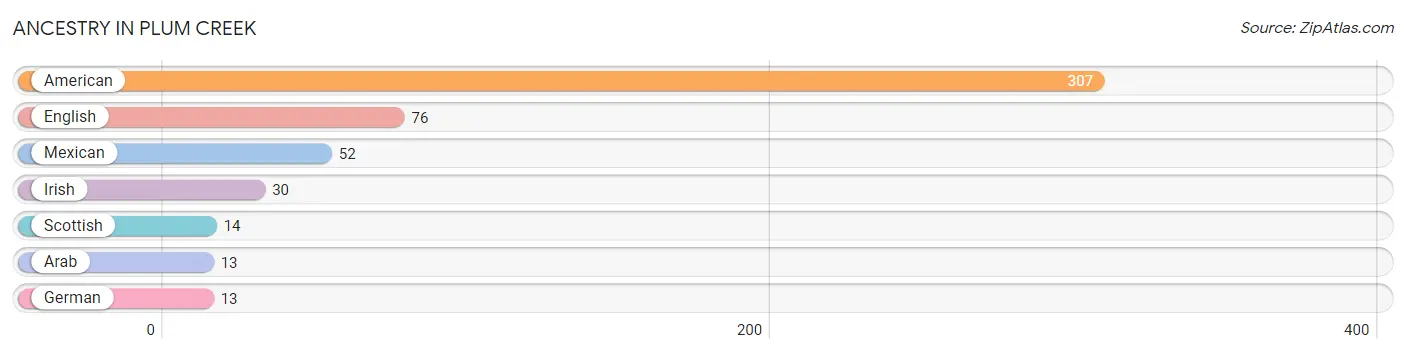
| Ancestry | # Population | % Population |
| American | 307 | 29.3% |
| Arab | 13 | 1.2% |
| English | 76 | 7.3% |
| German | 13 | 1.2% |
| Irish | 30 | 2.9% |
| Mexican | 52 | 5.0% |
| Scottish | 14 | 1.3% | View All 7 Rows |
Immigrants in Plum Creek
The most numerous immigrant groups reported in Plum Creek came from Asia (13 | 1.2%), Iraq (13 | 1.2%), and Western Asia (13 | 1.2%), together accounting for 3.7% of all Plum Creek residents.
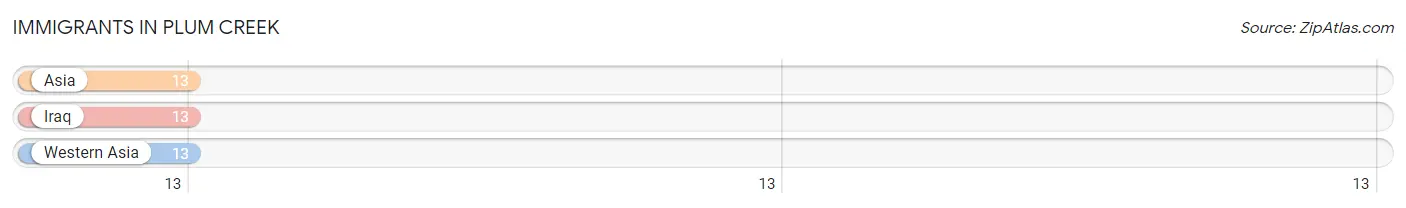
| Immigration Origin | # Population | % Population |
| Asia | 13 | 1.2% |
| Iraq | 13 | 1.2% |
| Western Asia | 13 | 1.2% | View All 3 Rows |
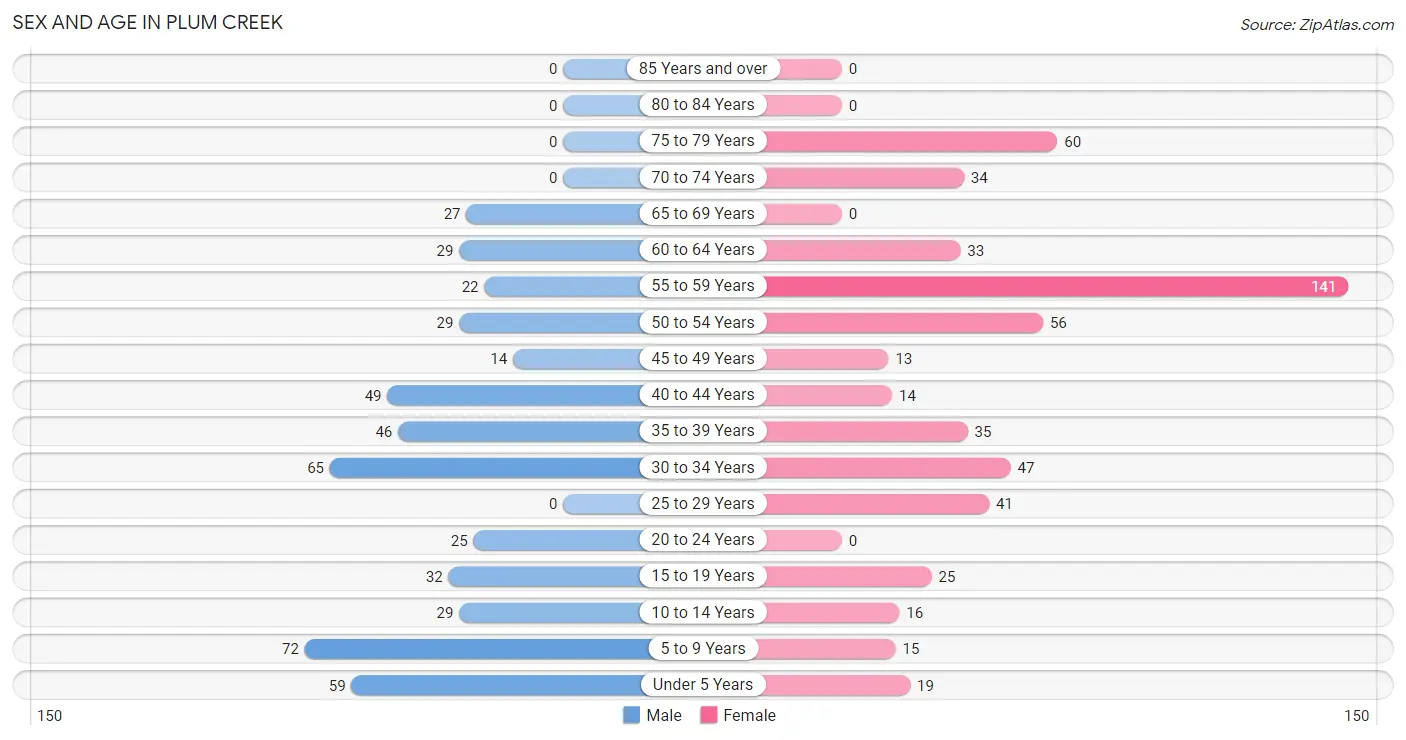
Sex and Age in Plum Creek
Sex and Age in Plum Creek
The most populous age groups in Plum Creek are 5 to 9 Years (72 | 14.5%) for men and 55 to 59 Years (141 | 25.7%) for women.
| Age Bracket | Male | Female |
| Under 5 Years | 59 (11.8%) | 19 (3.5%) |
| 5 to 9 Years | 72 (14.5%) | 15 (2.7%) |
| 10 to 14 Years | 29 (5.8%) | 16 (2.9%) |
| 15 to 19 Years | 32 (6.4%) | 25 (4.5%) |
| 20 to 24 Years | 25 (5.0%) | 0 (0.0%) |
| 25 to 29 Years | 0 (0.0%) | 41 (7.5%) |
| 30 to 34 Years | 65 (13.1%) | 47 (8.6%) |
| 35 to 39 Years | 46 (9.2%) | 35 (6.4%) |
| 40 to 44 Years | 49 (9.8%) | 14 (2.5%) |
| 45 to 49 Years | 14 (2.8%) | 13 (2.4%) |
| 50 to 54 Years | 29 (5.8%) | 56 (10.2%) |
| 55 to 59 Years | 22 (4.4%) | 141 (25.7%) |
| 60 to 64 Years | 29 (5.8%) | 33 (6.0%) |
| 65 to 69 Years | 27 (5.4%) | 0 (0.0%) |
| 70 to 74 Years | 0 (0.0%) | 34 (6.2%) |
| 75 to 79 Years | 0 (0.0%) | 60 (10.9%) |
| 80 to 84 Years | 0 (0.0%) | 0 (0.0%) |
| 85 Years and over | 0 (0.0%) | 0 (0.0%) |
| Total | 498 (100.0%) | 549 (100.0%) |
Families and Households in Plum Creek
Median Family Size in Plum Creek
The median family size in Plum Creek is 2.87 persons per family, with married-couple families (92 | 39.3%) accounting for the largest median family size of 3.22 persons per family. On the other hand, single male/father families (34 | 14.5%) represent the smallest median family size with 1.97 persons per family.
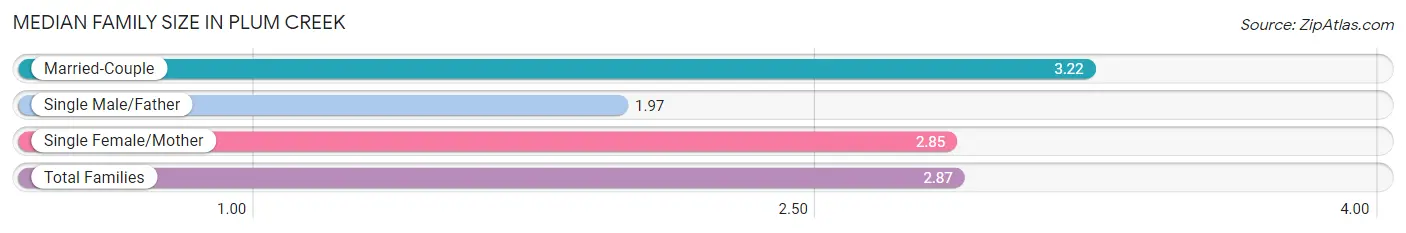
| Family Type | # Families | Family Size |
| Married-Couple | 92 (39.3%) | 3.22 |
| Single Male/Father | 34 (14.5%) | 1.97 |
| Single Female/Mother | 108 (46.2%) | 2.85 |
| Total Families | 234 (100.0%) | 2.87 |
Median Household Size in Plum Creek
The median household size in Plum Creek is 2.19 persons per household, with married-couple households (92 | 19.3%) accounting for the largest median household size of 3.22 persons per household. non-family households (243 | 50.9%) represent the smallest median household size with 1.29 persons per household.
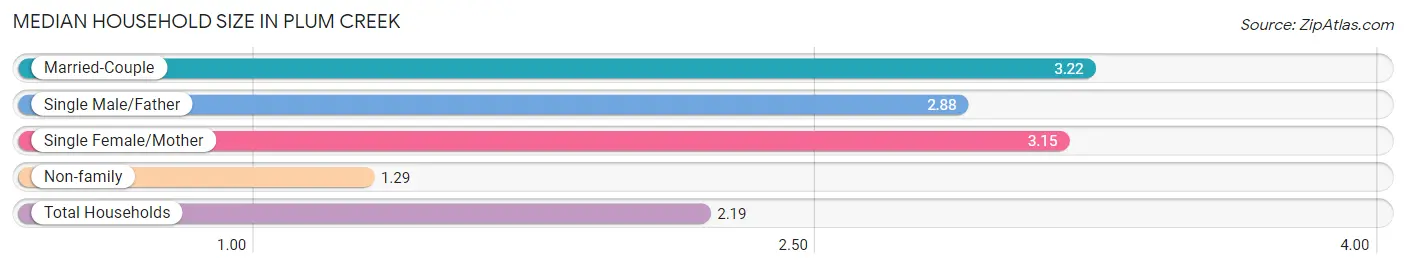
| Household Type | # Households | Household Size |
| Married-Couple | 92 (19.3%) | 3.22 |
| Single Male/Father | 34 (7.1%) | 2.88 |
| Single Female/Mother | 108 (22.6%) | 3.15 |
| Non-family | 243 (50.9%) | 1.29 |
| Total Households | 477 (100.0%) | 2.19 |
Household Size by Marriage Status in Plum Creek
Out of a total of 477 households in Plum Creek, 234 (49.1%) are family households, while 243 (50.9%) are nonfamily households. The most numerous type of family households are 3-person households, comprising 116, and the most common type of nonfamily households are 1-person households, comprising 184.
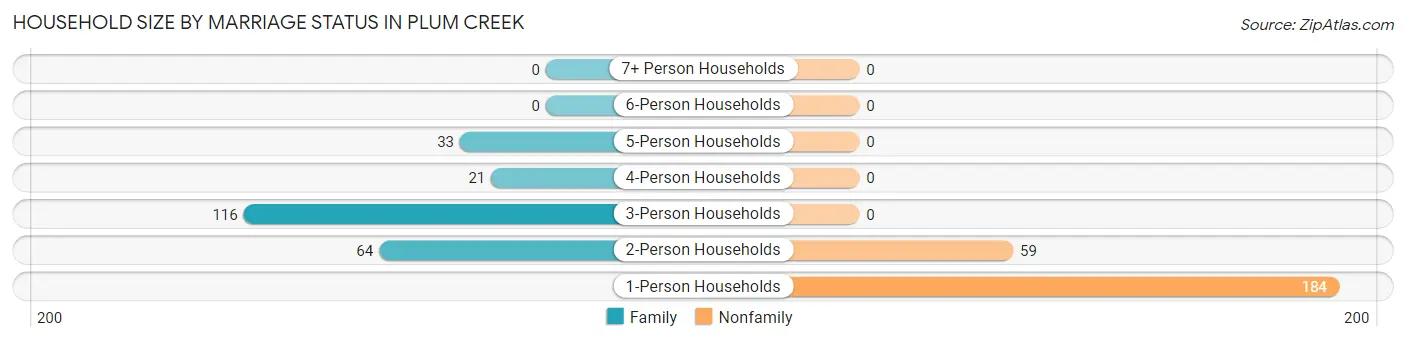
| Household Size | Family Households | Nonfamily Households |
| 1-Person Households | - | 184 (38.6%) |
| 2-Person Households | 64 (13.4%) | 59 (12.4%) |
| 3-Person Households | 116 (24.3%) | 0 (0.0%) |
| 4-Person Households | 21 (4.4%) | 0 (0.0%) |
| 5-Person Households | 33 (6.9%) | 0 (0.0%) |
| 6-Person Households | 0 (0.0%) | 0 (0.0%) |
| 7+ Person Households | 0 (0.0%) | 0 (0.0%) |
| Total | 234 (49.1%) | 243 (50.9%) |
Female Fertility in Plum Creek
Fertility by Age in Plum Creek
| Age Bracket | Women with Births | Births / 1,000 Women |
| 15 to 19 years | 0 (0.0%) | 0.0 |
| 20 to 34 years | 0 (0.0%) | 0.0 |
| 35 to 50 years | 0 (0.0%) | 0.0 |
| Total | 0 (0.0%) | 0.0 |
Fertility by Age by Marriage Status in Plum Creek
| Age Bracket | Married | Unmarried |
| 15 to 19 years | 0 (0.0%) | 0 (0.0%) |
| 20 to 34 years | 0 (0.0%) | 0 (0.0%) |
| 35 to 50 years | 0 (0.0%) | 0 (0.0%) |
| Total | 0 (0.0%) | 0 (0.0%) |
Fertility by Education in Plum Creek
| Educational Attainment | Women with Births | Births / 1,000 Women |
| Less than High School | 0 (0.0%) | 0.0 |
| High School Diploma | 0 (0.0%) | 0.0 |
| College or Associate's Degree | 0 (0.0%) | 0.0 |
| Bachelor's Degree | 0 (0.0%) | 0.0 |
| Graduate Degree | 0 (0.0%) | 0.0 |
| Total | 0 (0.0%) | 0.0 |
Fertility by Education by Marriage Status in Plum Creek
| Educational Attainment | Married | Unmarried |
| Less than High School | 0 (0.0%) | 0 (0.0%) |
| High School Diploma | 0 (0.0%) | 0 (0.0%) |
| College or Associate's Degree | 0 (0.0%) | 0 (0.0%) |
| Bachelor's Degree | 0 (0.0%) | 0 (0.0%) |
| Graduate Degree | 0 (0.0%) | 0 (0.0%) |
| Total | 0 (0.0%) | 0 (0.0%) |
Employment Characteristics in Plum Creek
Employment by Class of Employer in Plum Creek
Among the 507 employed individuals in Plum Creek, private company employees (328 | 64.7%), local government employees (57 | 11.2%), and not-for-profit organizations (56 | 11.1%) make up the most common classes of employment.
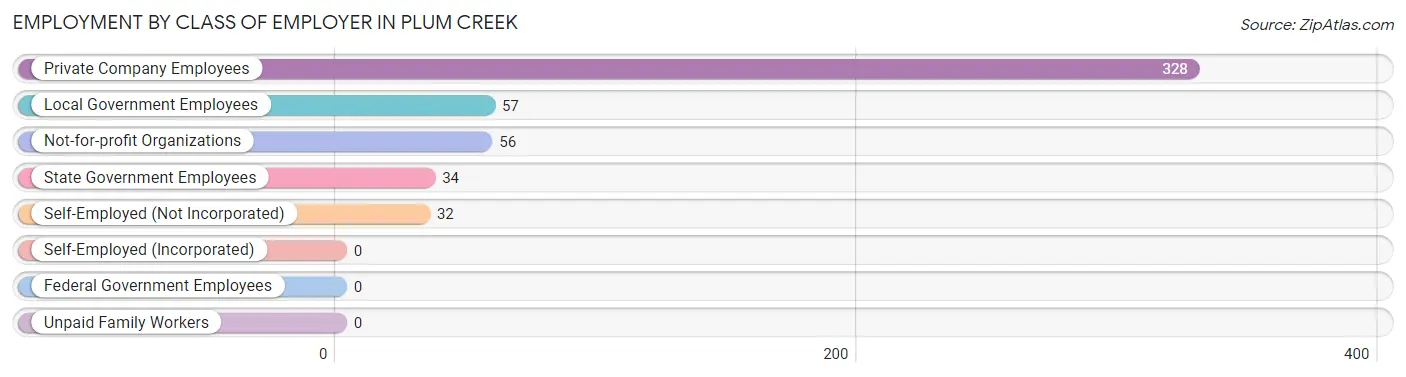
| Employer Class | # Employees | % Employees |
| Private Company Employees | 328 | 64.7% |
| Self-Employed (Incorporated) | 0 | 0.0% |
| Self-Employed (Not Incorporated) | 32 | 6.3% |
| Not-for-profit Organizations | 56 | 11.1% |
| Local Government Employees | 57 | 11.2% |
| State Government Employees | 34 | 6.7% |
| Federal Government Employees | 0 | 0.0% |
| Unpaid Family Workers | 0 | 0.0% |
| Total | 507 | 100.0% |
Employment Status by Age in Plum Creek
According to the labor force statistics for Plum Creek, out of the total population over 16 years of age (820), 70.7% or 580 individuals are in the labor force, with 12.6% or 73 of them unemployed. The age group with the highest labor force participation rate is 20 to 24 years, with 100.0% or 25 individuals in the labor force. Within the labor force, the 30 to 34 years age range has the highest percentage of unemployed individuals, with 59.1% or 55 of them being unemployed.
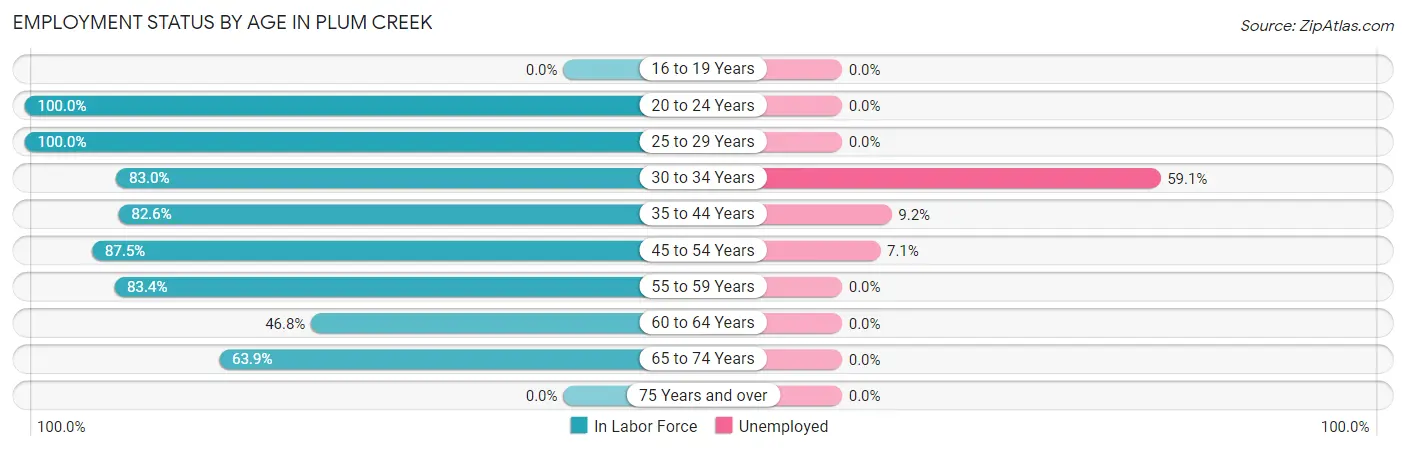
| Age Bracket | In Labor Force | Unemployed |
| 16 to 19 Years | 0 (0.0%) | 0 (0.0%) |
| 20 to 24 Years | 25 (100.0%) | 0 (0.0%) |
| 25 to 29 Years | 41 (100.0%) | 0 (0.0%) |
| 30 to 34 Years | 93 (83.0%) | 55 (59.1%) |
| 35 to 44 Years | 119 (82.6%) | 11 (9.2%) |
| 45 to 54 Years | 98 (87.5%) | 7 (7.1%) |
| 55 to 59 Years | 136 (83.4%) | 0 (0.0%) |
| 60 to 64 Years | 29 (46.8%) | 0 (0.0%) |
| 65 to 74 Years | 39 (63.9%) | 0 (0.0%) |
| 75 Years and over | 0 (0.0%) | 0 (0.0%) |
| Total | 580 (70.7%) | 73 (12.6%) |
Employment Status by Educational Attainment in Plum Creek
According to labor force statistics for Plum Creek, 81.4% of individuals (516) out of the total population between 25 and 64 years of age (634) are in the labor force, with 14.1% or 73 of them being unemployed. The group with the highest labor force participation rate are those with the educational attainment of bachelor's degree or higher, with 100.0% or 41 individuals in the labor force. Within the labor force, individuals with high school diploma education have the highest percentage of unemployment, with 29.3% or 73 of them being unemployed.
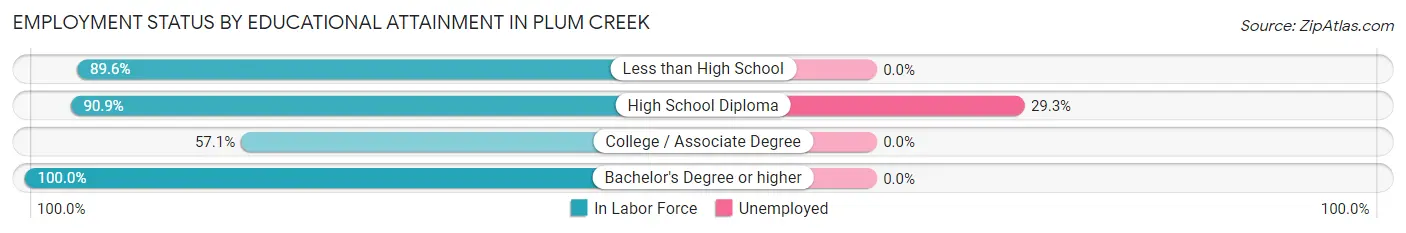
| Educational Attainment | In Labor Force | Unemployed |
| Less than High School | 121 (89.6%) | 0 (0.0%) |
| High School Diploma | 249 (90.9%) | 80 (29.3%) |
| College / Associate Degree | 105 (57.1%) | 0 (0.0%) |
| Bachelor's Degree or higher | 41 (100.0%) | 0 (0.0%) |
| Total | 516 (81.4%) | 89 (14.1%) |
Employment Occupations by Sex in Plum Creek
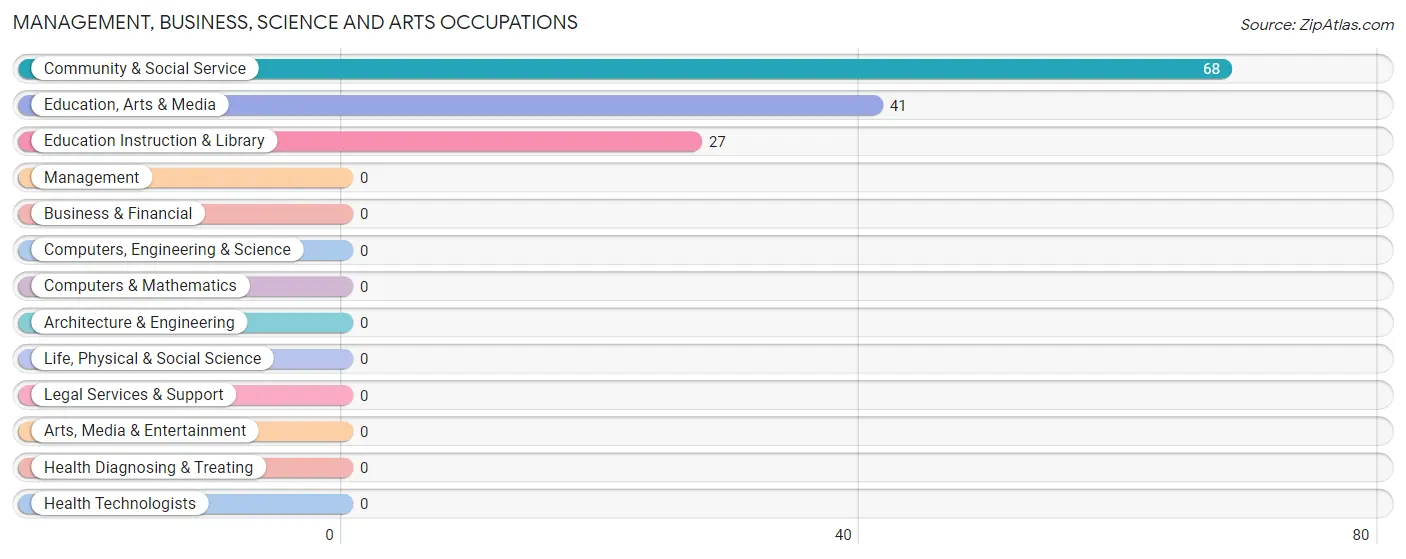
Management, Business, Science and Arts Occupations
The most common Management, Business, Science and Arts occupations in Plum Creek are Community & Social Service (68 | 13.4%), Education, Arts & Media (41 | 8.1%), and Education Instruction & Library (27 | 5.3%).
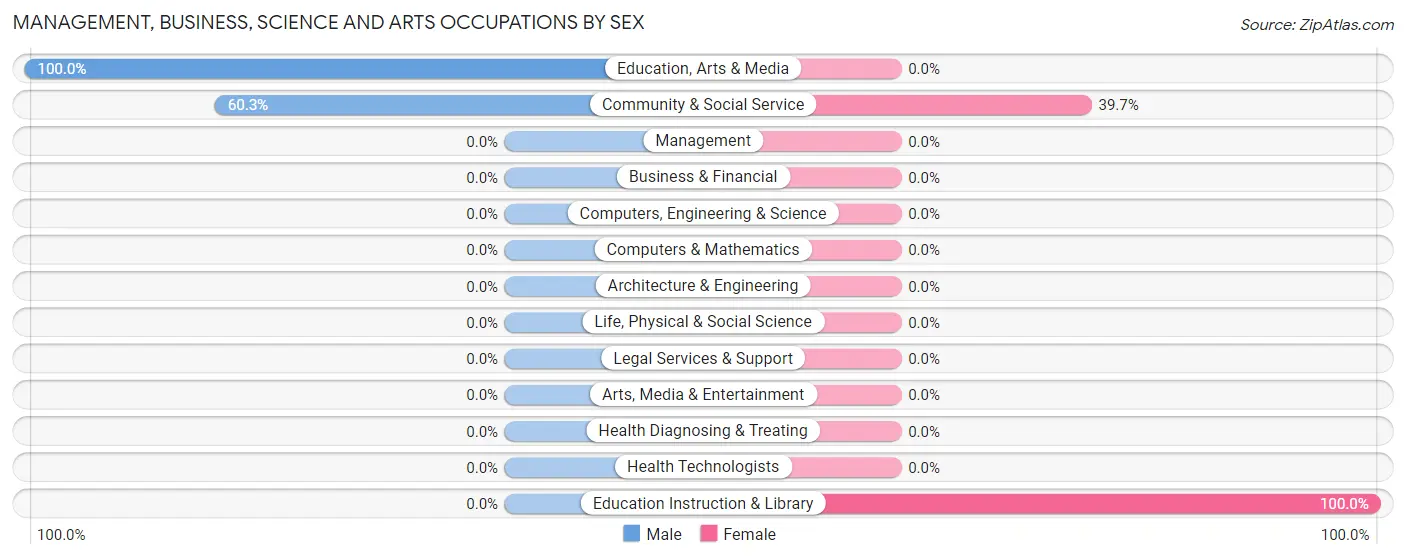
Management, Business, Science and Arts Occupations by Sex
Within the Management, Business, Science and Arts occupations in Plum Creek, the most male-oriented occupations are Education, Arts & Media (100.0%), and Community & Social Service (60.3%), while the most female-oriented occupations are Education Instruction & Library (100.0%), and Community & Social Service (39.7%).
| Occupation | Male | Female |
| Management | 0 (0.0%) | 0 (0.0%) |
| Business & Financial | 0 (0.0%) | 0 (0.0%) |
| Computers, Engineering & Science | 0 (0.0%) | 0 (0.0%) |
| Computers & Mathematics | 0 (0.0%) | 0 (0.0%) |
| Architecture & Engineering | 0 (0.0%) | 0 (0.0%) |
| Life, Physical & Social Science | 0 (0.0%) | 0 (0.0%) |
| Community & Social Service | 41 (60.3%) | 27 (39.7%) |
| Education, Arts & Media | 41 (100.0%) | 0 (0.0%) |
| Legal Services & Support | 0 (0.0%) | 0 (0.0%) |
| Education Instruction & Library | 0 (0.0%) | 27 (100.0%) |
| Arts, Media & Entertainment | 0 (0.0%) | 0 (0.0%) |
| Health Diagnosing & Treating | 0 (0.0%) | 0 (0.0%) |
| Health Technologists | 0 (0.0%) | 0 (0.0%) |
| Total (Category) | 41 (60.3%) | 27 (39.7%) |
| Total (Overall) | 197 (38.9%) | 310 (61.1%) |
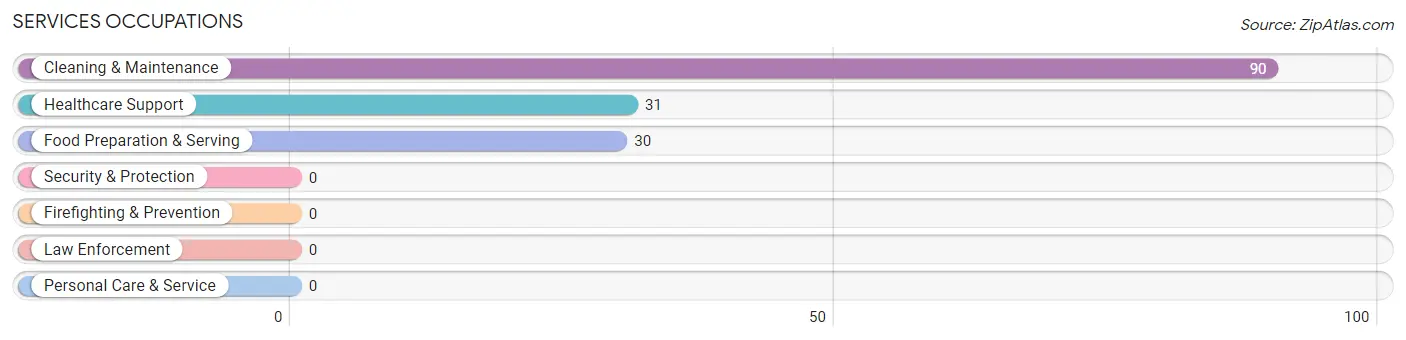
Services Occupations
The most common Services occupations in Plum Creek are Cleaning & Maintenance (90 | 17.7%), Healthcare Support (31 | 6.1%), and Food Preparation & Serving (30 | 5.9%).
Services Occupations by Sex
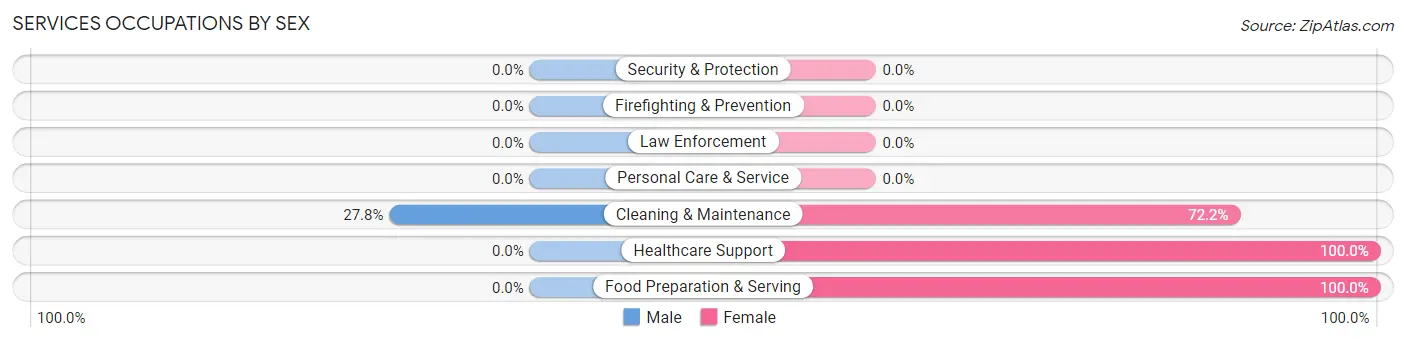
| Occupation | Male | Female |
| Healthcare Support | 0 (0.0%) | 31 (100.0%) |
| Security & Protection | 0 (0.0%) | 0 (0.0%) |
| Firefighting & Prevention | 0 (0.0%) | 0 (0.0%) |
| Law Enforcement | 0 (0.0%) | 0 (0.0%) |
| Food Preparation & Serving | 0 (0.0%) | 30 (100.0%) |
| Cleaning & Maintenance | 25 (27.8%) | 65 (72.2%) |
| Personal Care & Service | 0 (0.0%) | 0 (0.0%) |
| Total (Category) | 25 (16.6%) | 126 (83.4%) |
| Total (Overall) | 197 (38.9%) | 310 (61.1%) |
Sales and Office Occupations
The most common Sales and Office occupations in Plum Creek are Office & Administration (106 | 20.9%), and Sales & Related (21 | 4.1%).

Sales and Office Occupations by Sex

| Occupation | Male | Female |
| Sales & Related | 21 (100.0%) | 0 (0.0%) |
| Office & Administration | 0 (0.0%) | 106 (100.0%) |
| Total (Category) | 21 (16.5%) | 106 (83.5%) |
| Total (Overall) | 197 (38.9%) | 310 (61.1%) |
Natural Resources, Construction and Maintenance Occupations
The most common Natural Resources, Construction and Maintenance occupations in Plum Creek are Construction & Extraction (28 | 5.5%), and Installation, Maintenance & Repair (10 | 2.0%).
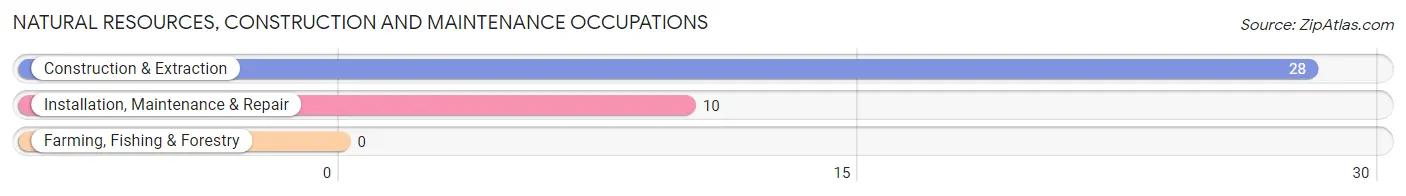
Natural Resources, Construction and Maintenance Occupations by Sex
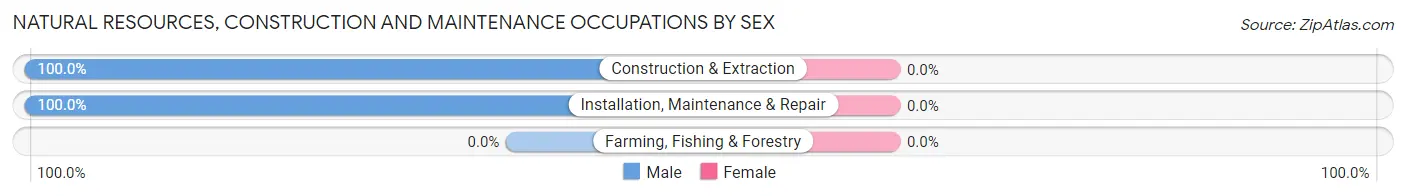
| Occupation | Male | Female |
| Farming, Fishing & Forestry | 0 (0.0%) | 0 (0.0%) |
| Construction & Extraction | 28 (100.0%) | 0 (0.0%) |
| Installation, Maintenance & Repair | 10 (100.0%) | 0 (0.0%) |
| Total (Category) | 38 (100.0%) | 0 (0.0%) |
| Total (Overall) | 197 (38.9%) | 310 (61.1%) |
Production, Transportation and Moving Occupations
The most common Production, Transportation and Moving occupations in Plum Creek are Production (100 | 19.7%), Transportation (13 | 2.6%), and Material Moving (10 | 2.0%).
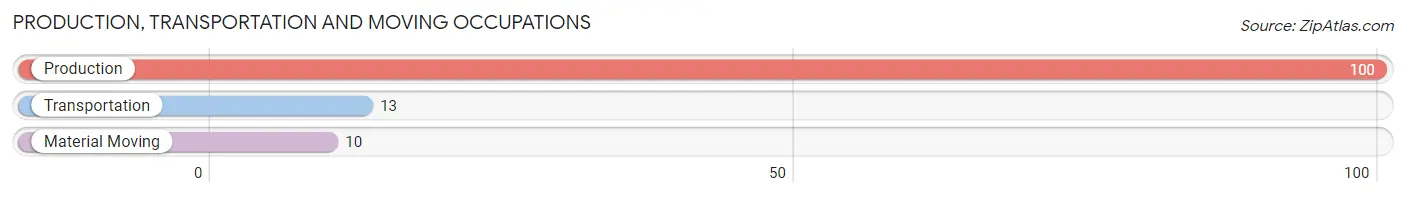
Production, Transportation and Moving Occupations by Sex
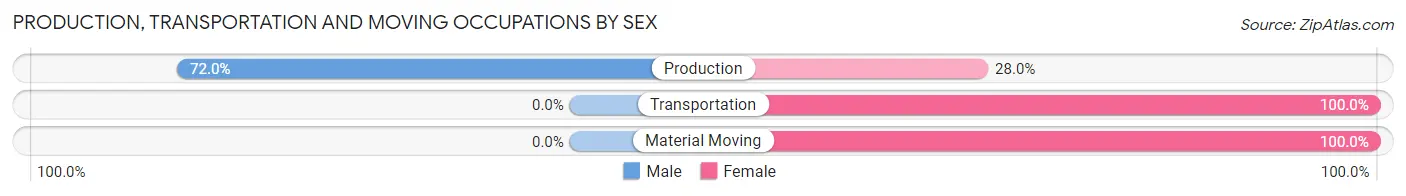
| Occupation | Male | Female |
| Production | 72 (72.0%) | 28 (28.0%) |
| Transportation | 0 (0.0%) | 13 (100.0%) |
| Material Moving | 0 (0.0%) | 10 (100.0%) |
| Total (Category) | 72 (58.5%) | 51 (41.5%) |
| Total (Overall) | 197 (38.9%) | 310 (61.1%) |
Employment Industries by Sex in Plum Creek
Employment Industries in Plum Creek
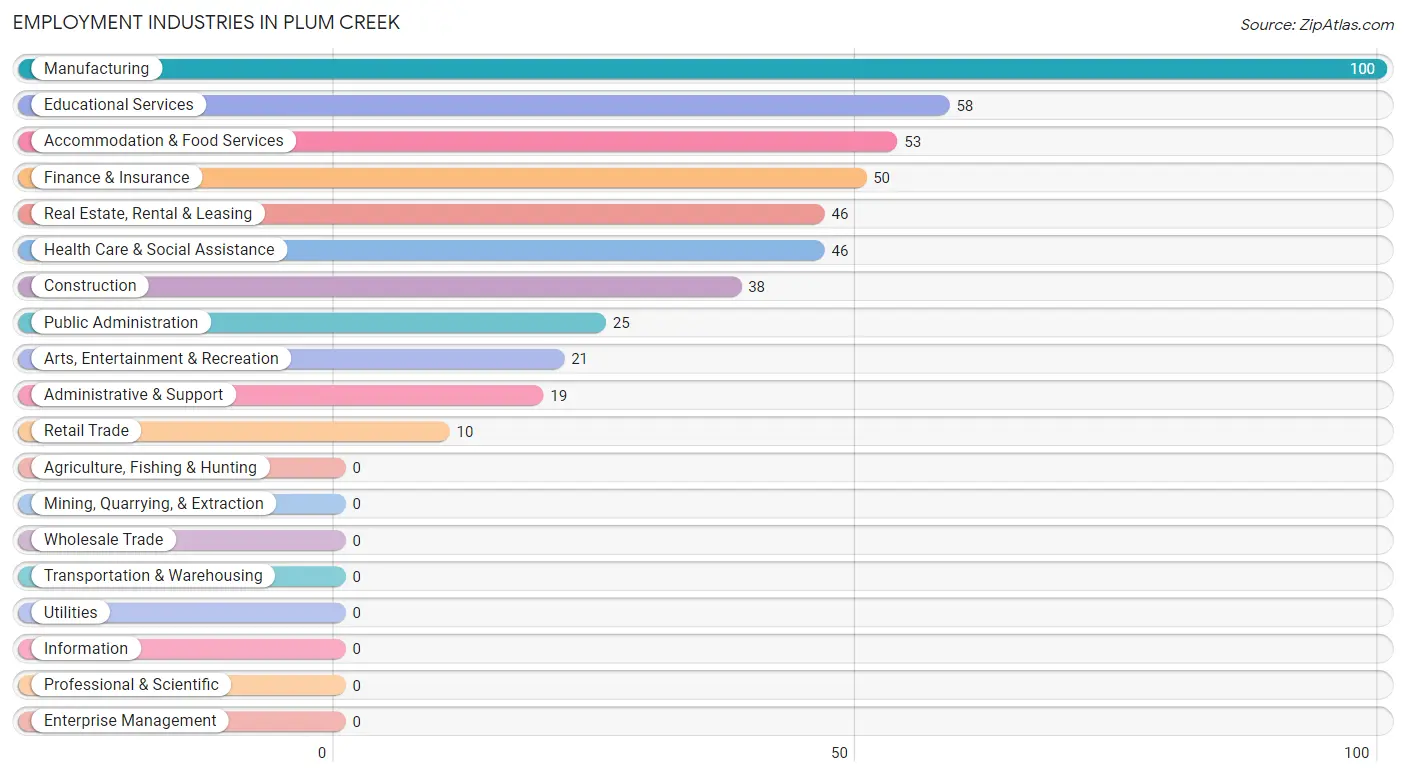
The major employment industries in Plum Creek include Manufacturing (100 | 19.7%), Educational Services (58 | 11.4%), Accommodation & Food Services (53 | 10.4%), Finance & Insurance (50 | 9.9%), and Real Estate, Rental & Leasing (46 | 9.1%).
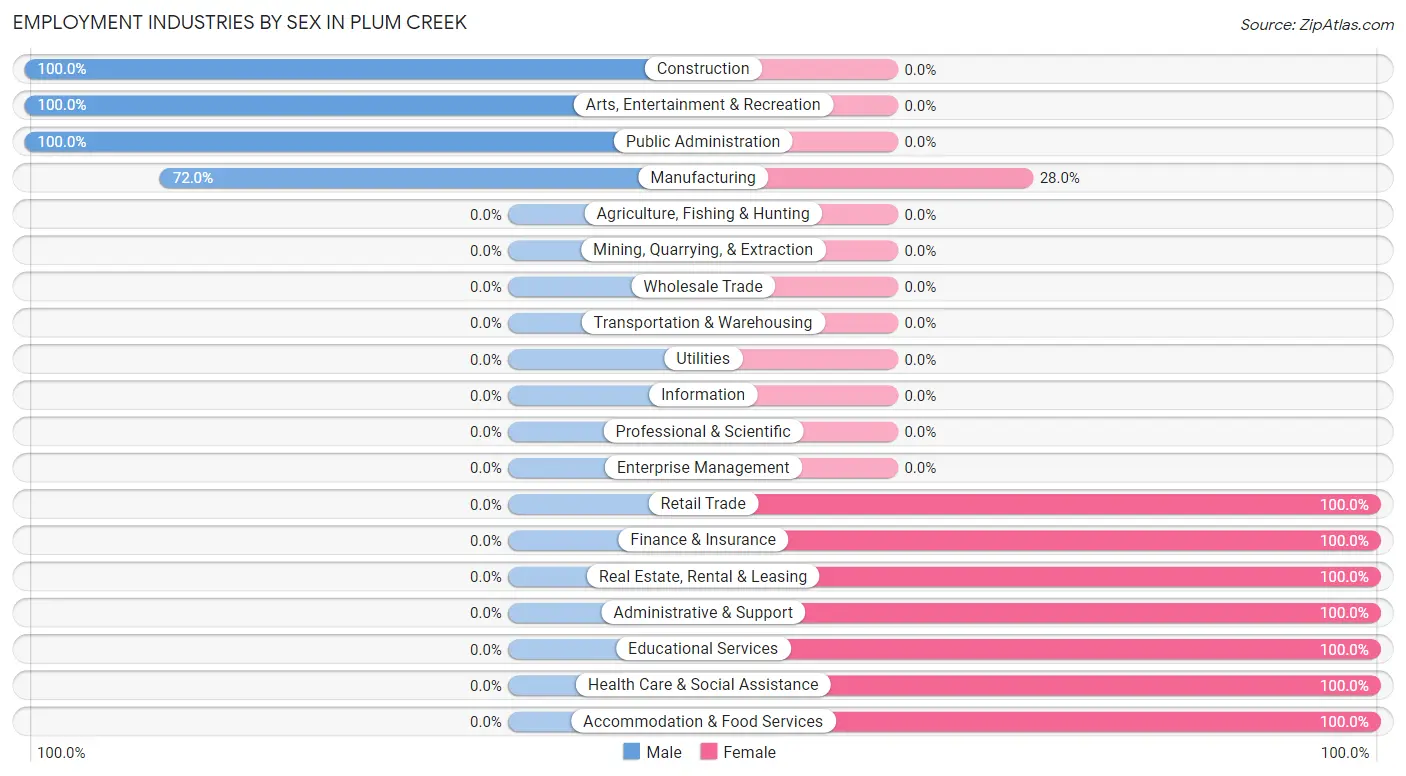
Employment Industries by Sex in Plum Creek
The Plum Creek industries that see more men than women are Construction (100.0%), Arts, Entertainment & Recreation (100.0%), and Public Administration (100.0%), whereas the industries that tend to have a higher number of women are Retail Trade (100.0%), Finance & Insurance (100.0%), and Real Estate, Rental & Leasing (100.0%).
| Industry | Male | Female |
| Agriculture, Fishing & Hunting | 0 (0.0%) | 0 (0.0%) |
| Mining, Quarrying, & Extraction | 0 (0.0%) | 0 (0.0%) |
| Construction | 38 (100.0%) | 0 (0.0%) |
| Manufacturing | 72 (72.0%) | 28 (28.0%) |
| Wholesale Trade | 0 (0.0%) | 0 (0.0%) |
| Retail Trade | 0 (0.0%) | 10 (100.0%) |
| Transportation & Warehousing | 0 (0.0%) | 0 (0.0%) |
| Utilities | 0 (0.0%) | 0 (0.0%) |
| Information | 0 (0.0%) | 0 (0.0%) |
| Finance & Insurance | 0 (0.0%) | 50 (100.0%) |
| Real Estate, Rental & Leasing | 0 (0.0%) | 46 (100.0%) |
| Professional & Scientific | 0 (0.0%) | 0 (0.0%) |
| Enterprise Management | 0 (0.0%) | 0 (0.0%) |
| Administrative & Support | 0 (0.0%) | 19 (100.0%) |
| Educational Services | 0 (0.0%) | 58 (100.0%) |
| Health Care & Social Assistance | 0 (0.0%) | 46 (100.0%) |
| Arts, Entertainment & Recreation | 21 (100.0%) | 0 (0.0%) |
| Accommodation & Food Services | 0 (0.0%) | 53 (100.0%) |
| Public Administration | 25 (100.0%) | 0 (0.0%) |
| Total | 197 (38.9%) | 310 (61.1%) |
Education in Plum Creek
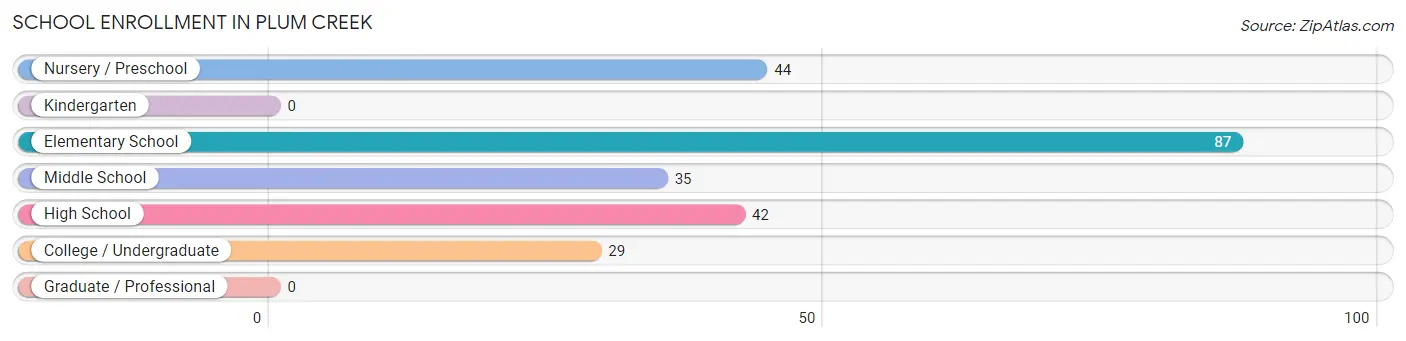
School Enrollment in Plum Creek
The most common levels of schooling among the 237 students in Plum Creek are elementary school (87 | 36.7%), nursery / preschool (44 | 18.6%), and high school (42 | 17.7%).
| School Level | # Students | % Students |
| Nursery / Preschool | 44 | 18.6% |
| Kindergarten | 0 | 0.0% |
| Elementary School | 87 | 36.7% |
| Middle School | 35 | 14.8% |
| High School | 42 | 17.7% |
| College / Undergraduate | 29 | 12.2% |
| Graduate / Professional | 0 | 0.0% |
| Total | 237 | 100.0% |
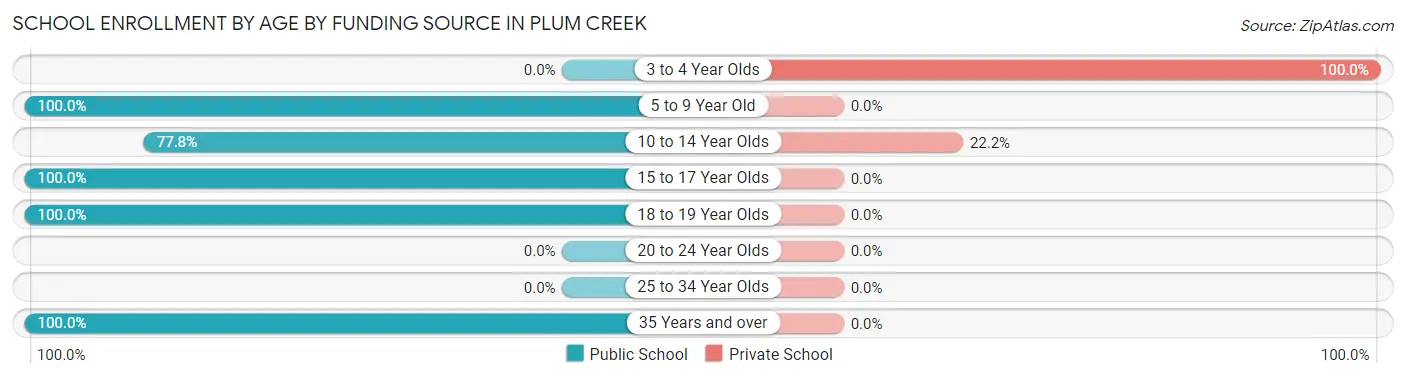
School Enrollment by Age by Funding Source in Plum Creek
Out of a total of 237 students who are enrolled in schools in Plum Creek, 54 (22.8%) attend a private institution, while the remaining 183 (77.2%) are enrolled in public schools. The age group of 3 to 4 year olds has the highest likelihood of being enrolled in private schools, with 44 (100.0% in the age bracket) enrolled. Conversely, the age group of 5 to 9 year old has the lowest likelihood of being enrolled in a private school, with 87 (100.0% in the age bracket) attending a public institution.
| Age Bracket | Public School | Private School |
| 3 to 4 Year Olds | 0 (0.0%) | 44 (100.0%) |
| 5 to 9 Year Old | 87 (100.0%) | 0 (0.0%) |
| 10 to 14 Year Olds | 35 (77.8%) | 10 (22.2%) |
| 15 to 17 Year Olds | 32 (100.0%) | 0 (0.0%) |
| 18 to 19 Year Olds | 25 (100.0%) | 0 (0.0%) |
| 20 to 24 Year Olds | 0 (0.0%) | 0 (0.0%) |
| 25 to 34 Year Olds | 0 (0.0%) | 0 (0.0%) |
| 35 Years and over | 4 (100.0%) | 0 (0.0%) |
| Total | 183 (77.2%) | 54 (22.8%) |
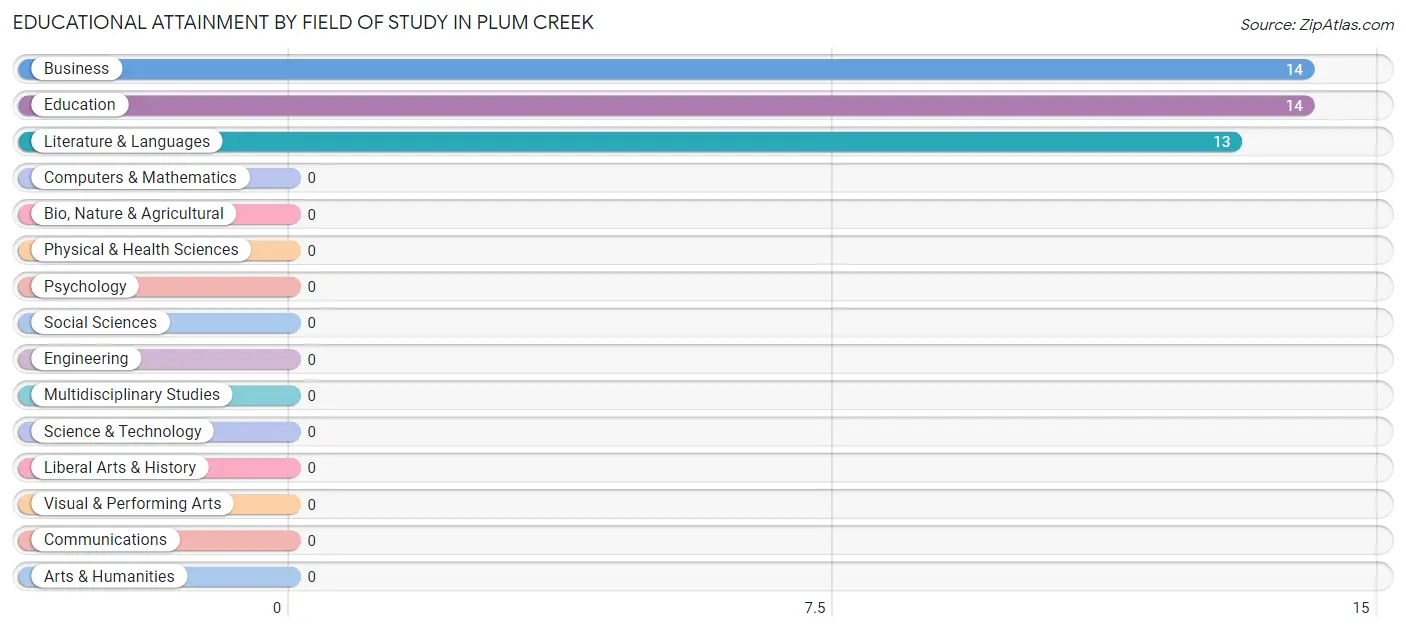
Educational Attainment by Field of Study in Plum Creek
Business (14 | 34.2%), education (14 | 34.2%), and literature & languages (13 | 31.7%) are the most common fields of study among 41 individuals in Plum Creek who have obtained a bachelor's degree or higher.
| Field of Study | # Graduates | % Graduates |
| Computers & Mathematics | 0 | 0.0% |
| Bio, Nature & Agricultural | 0 | 0.0% |
| Physical & Health Sciences | 0 | 0.0% |
| Psychology | 0 | 0.0% |
| Social Sciences | 0 | 0.0% |
| Engineering | 0 | 0.0% |
| Multidisciplinary Studies | 0 | 0.0% |
| Science & Technology | 0 | 0.0% |
| Business | 14 | 34.2% |
| Education | 14 | 34.2% |
| Literature & Languages | 13 | 31.7% |
| Liberal Arts & History | 0 | 0.0% |
| Visual & Performing Arts | 0 | 0.0% |
| Communications | 0 | 0.0% |
| Arts & Humanities | 0 | 0.0% |
| Total | 41 | 100.0% |
Transportation & Commute in Plum Creek
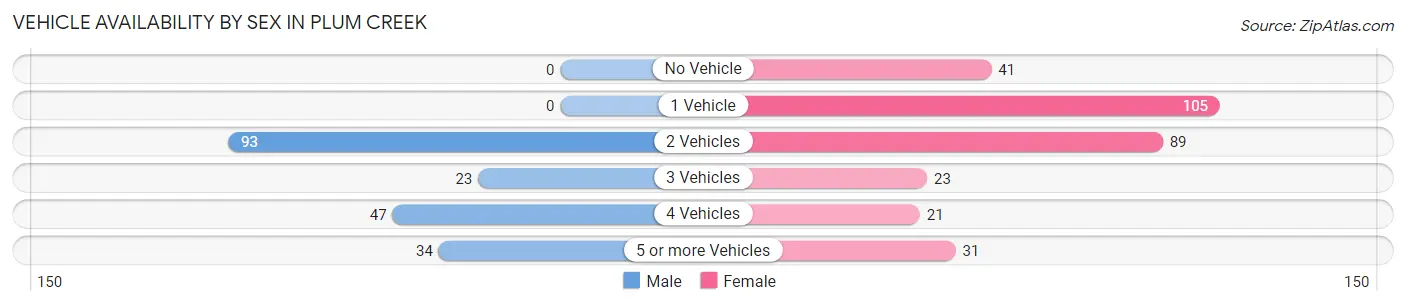
Vehicle Availability by Sex in Plum Creek
The most prevalent vehicle ownership categories in Plum Creek are males with 2 vehicles (93, accounting for 47.2%) and females with 2 vehicles (89, making up 30.0%).
| Vehicles Available | Male | Female |
| No Vehicle | 0 (0.0%) | 41 (13.2%) |
| 1 Vehicle | 0 (0.0%) | 105 (33.9%) |
| 2 Vehicles | 93 (47.2%) | 89 (28.7%) |
| 3 Vehicles | 23 (11.7%) | 23 (7.4%) |
| 4 Vehicles | 47 (23.9%) | 21 (6.8%) |
| 5 or more Vehicles | 34 (17.3%) | 31 (10.0%) |
| Total | 197 (100.0%) | 310 (100.0%) |
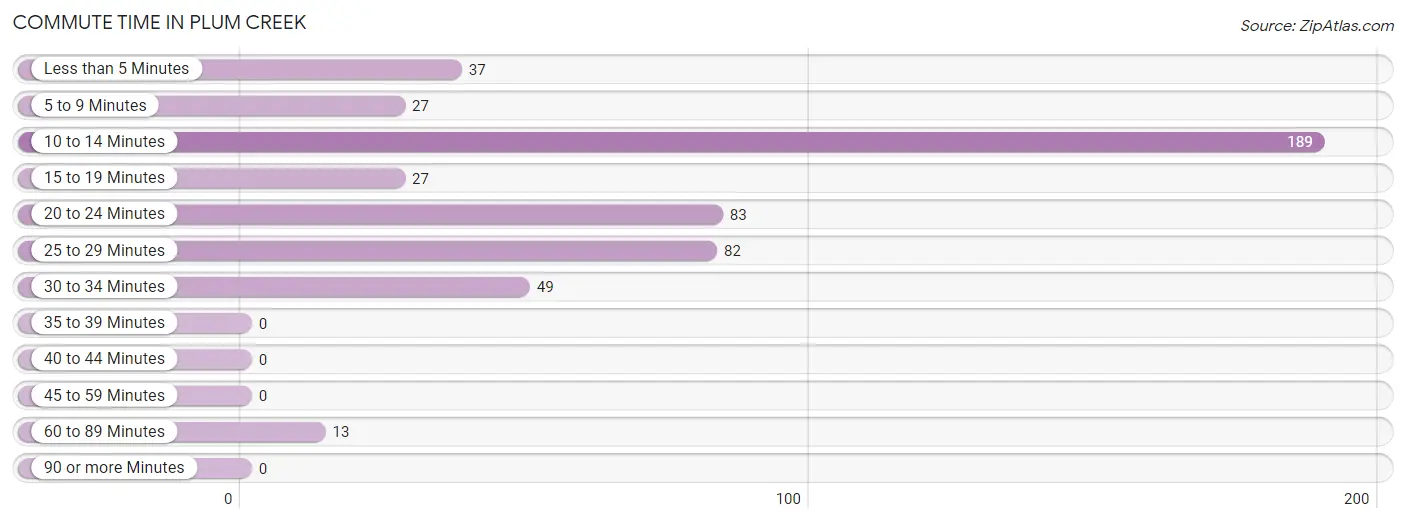
Commute Time in Plum Creek
The most frequently occuring commute durations in Plum Creek are 10 to 14 minutes (189 commuters, 37.3%), 20 to 24 minutes (83 commuters, 16.4%), and 25 to 29 minutes (82 commuters, 16.2%).
| Commute Time | # Commuters | % Commuters |
| Less than 5 Minutes | 37 | 7.3% |
| 5 to 9 Minutes | 27 | 5.3% |
| 10 to 14 Minutes | 189 | 37.3% |
| 15 to 19 Minutes | 27 | 5.3% |
| 20 to 24 Minutes | 83 | 16.4% |
| 25 to 29 Minutes | 82 | 16.2% |
| 30 to 34 Minutes | 49 | 9.7% |
| 35 to 39 Minutes | 0 | 0.0% |
| 40 to 44 Minutes | 0 | 0.0% |
| 45 to 59 Minutes | 0 | 0.0% |
| 60 to 89 Minutes | 13 | 2.6% |
| 90 or more Minutes | 0 | 0.0% |
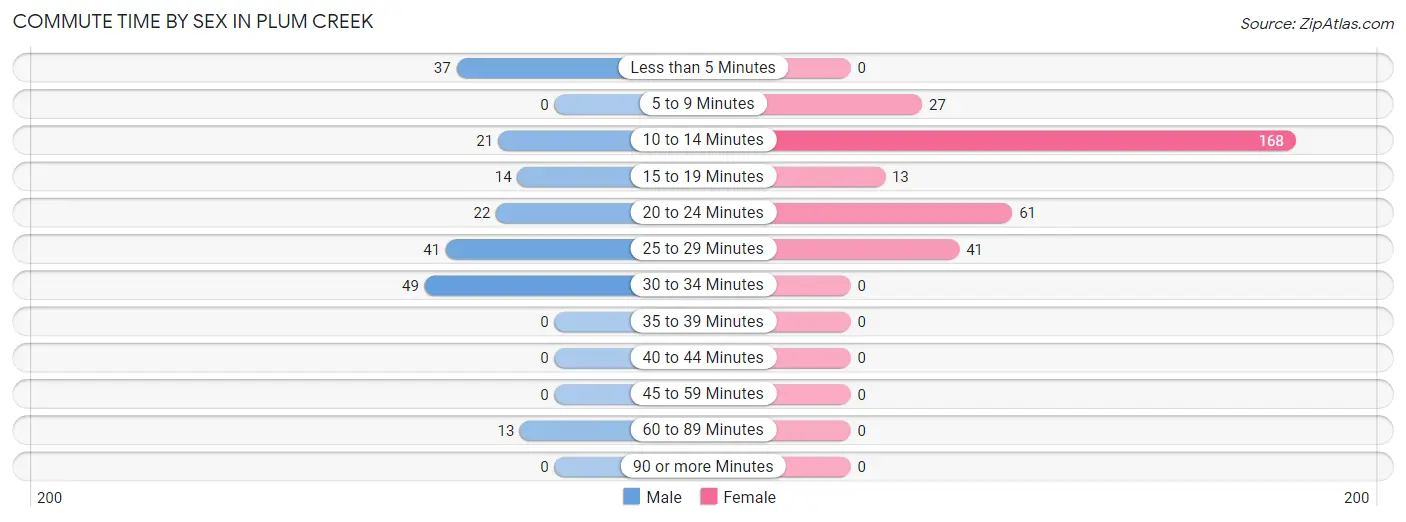
Commute Time by Sex in Plum Creek
The most common commute times in Plum Creek are 30 to 34 minutes (49 commuters, 24.9%) for males and 10 to 14 minutes (168 commuters, 54.2%) for females.
| Commute Time | Male | Female |
| Less than 5 Minutes | 37 (18.8%) | 0 (0.0%) |
| 5 to 9 Minutes | 0 (0.0%) | 27 (8.7%) |
| 10 to 14 Minutes | 21 (10.7%) | 168 (54.2%) |
| 15 to 19 Minutes | 14 (7.1%) | 13 (4.2%) |
| 20 to 24 Minutes | 22 (11.2%) | 61 (19.7%) |
| 25 to 29 Minutes | 41 (20.8%) | 41 (13.2%) |
| 30 to 34 Minutes | 49 (24.9%) | 0 (0.0%) |
| 35 to 39 Minutes | 0 (0.0%) | 0 (0.0%) |
| 40 to 44 Minutes | 0 (0.0%) | 0 (0.0%) |
| 45 to 59 Minutes | 0 (0.0%) | 0 (0.0%) |
| 60 to 89 Minutes | 13 (6.6%) | 0 (0.0%) |
| 90 or more Minutes | 0 (0.0%) | 0 (0.0%) |
Time of Departure to Work by Sex in Plum Creek
The most frequent times of departure to work in Plum Creek are 6:00 AM to 6:29 AM (49, 24.9%) for males and 7:30 AM to 7:59 AM (109, 35.2%) for females.
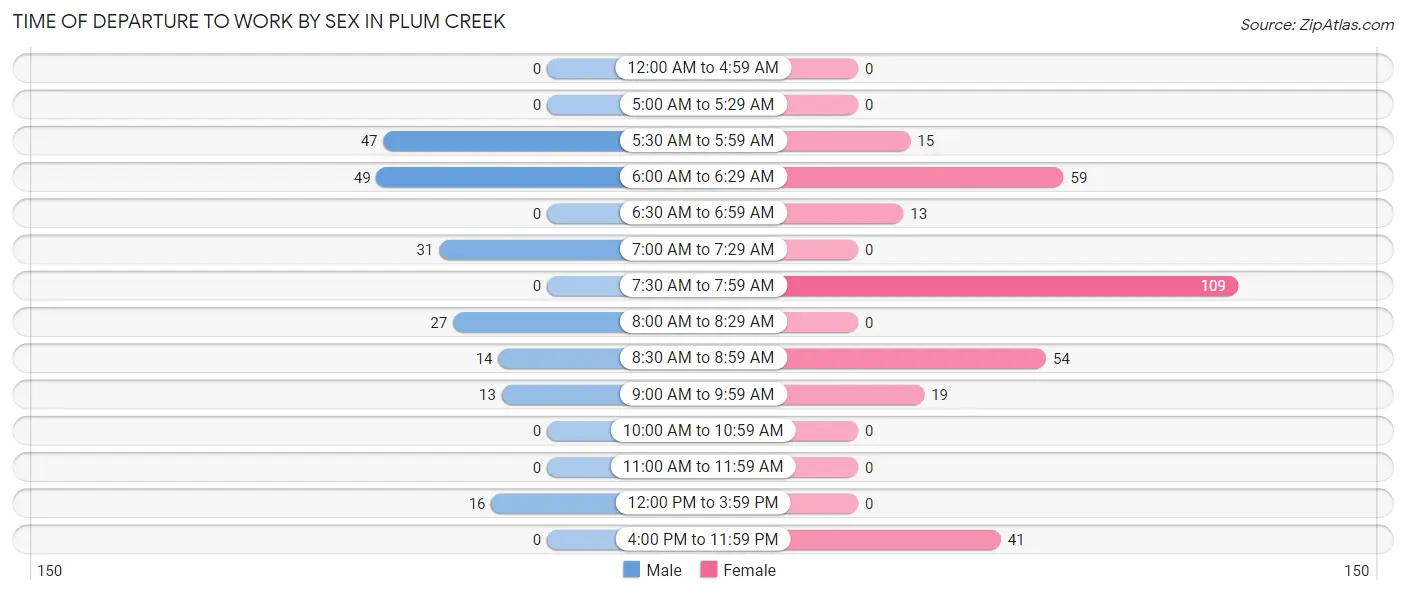
| Time of Departure | Male | Female |
| 12:00 AM to 4:59 AM | 0 (0.0%) | 0 (0.0%) |
| 5:00 AM to 5:29 AM | 0 (0.0%) | 0 (0.0%) |
| 5:30 AM to 5:59 AM | 47 (23.9%) | 15 (4.8%) |
| 6:00 AM to 6:29 AM | 49 (24.9%) | 59 (19.0%) |
| 6:30 AM to 6:59 AM | 0 (0.0%) | 13 (4.2%) |
| 7:00 AM to 7:29 AM | 31 (15.7%) | 0 (0.0%) |
| 7:30 AM to 7:59 AM | 0 (0.0%) | 109 (35.2%) |
| 8:00 AM to 8:29 AM | 27 (13.7%) | 0 (0.0%) |
| 8:30 AM to 8:59 AM | 14 (7.1%) | 54 (17.4%) |
| 9:00 AM to 9:59 AM | 13 (6.6%) | 19 (6.1%) |
| 10:00 AM to 10:59 AM | 0 (0.0%) | 0 (0.0%) |
| 11:00 AM to 11:59 AM | 0 (0.0%) | 0 (0.0%) |
| 12:00 PM to 3:59 PM | 16 (8.1%) | 0 (0.0%) |
| 4:00 PM to 11:59 PM | 0 (0.0%) | 41 (13.2%) |
| Total | 197 (100.0%) | 310 (100.0%) |
Housing Occupancy in Plum Creek
Occupancy by Ownership in Plum Creek
Of the total 477 dwellings in Plum Creek, owner-occupied units account for 338 (70.9%), while renter-occupied units make up 139 (29.1%).
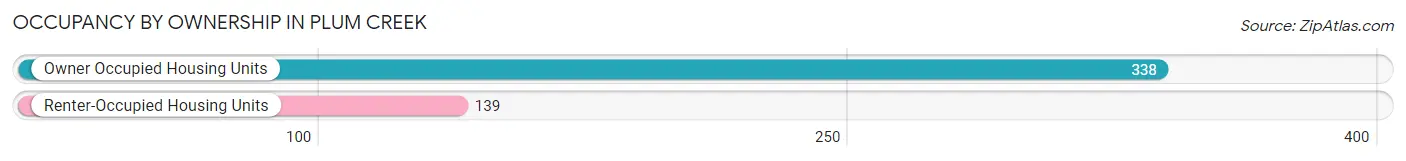
| Occupancy | # Housing Units | % Housing Units |
| Owner Occupied Housing Units | 338 | 70.9% |
| Renter-Occupied Housing Units | 139 | 29.1% |
| Total Occupied Housing Units | 477 | 100.0% |
Occupancy by Household Size in Plum Creek
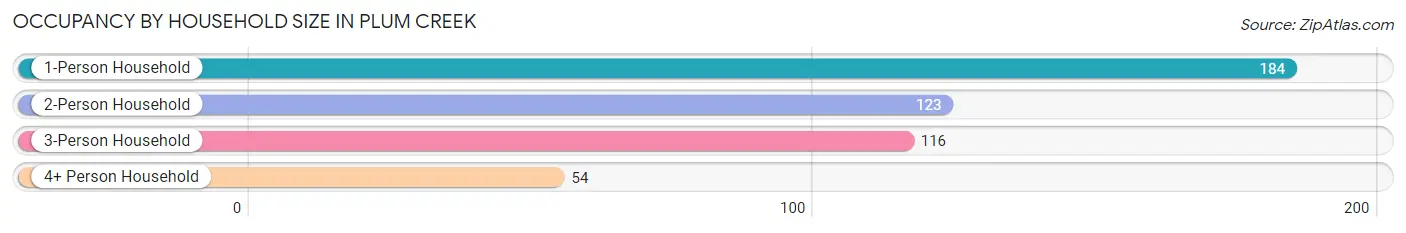
| Household Size | # Housing Units | % Housing Units |
| 1-Person Household | 184 | 38.6% |
| 2-Person Household | 123 | 25.8% |
| 3-Person Household | 116 | 24.3% |
| 4+ Person Household | 54 | 11.3% |
| Total Housing Units | 477 | 100.0% |
Occupancy by Ownership by Household Size in Plum Creek
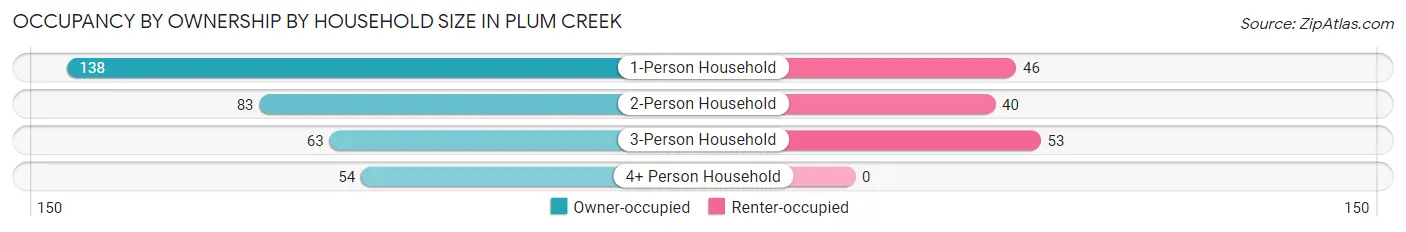
| Household Size | Owner-occupied | Renter-occupied |
| 1-Person Household | 138 (75.0%) | 46 (25.0%) |
| 2-Person Household | 83 (67.5%) | 40 (32.5%) |
| 3-Person Household | 63 (54.3%) | 53 (45.7%) |
| 4+ Person Household | 54 (100.0%) | 0 (0.0%) |
| Total Housing Units | 338 (70.9%) | 139 (29.1%) |
Occupancy by Educational Attainment in Plum Creek
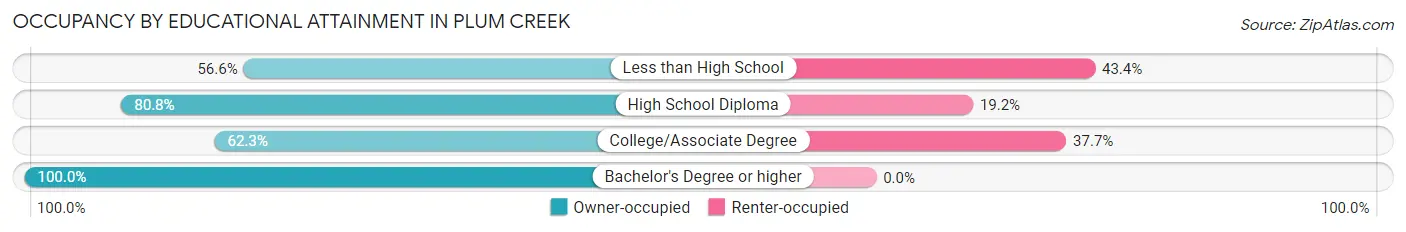
| Household Size | Owner-occupied | Renter-occupied |
| Less than High School | 60 (56.6%) | 46 (43.4%) |
| High School Diploma | 160 (80.8%) | 38 (19.2%) |
| College/Associate Degree | 91 (62.3%) | 55 (37.7%) |
| Bachelor's Degree or higher | 27 (100.0%) | 0 (0.0%) |
Occupancy by Age of Householder in Plum Creek
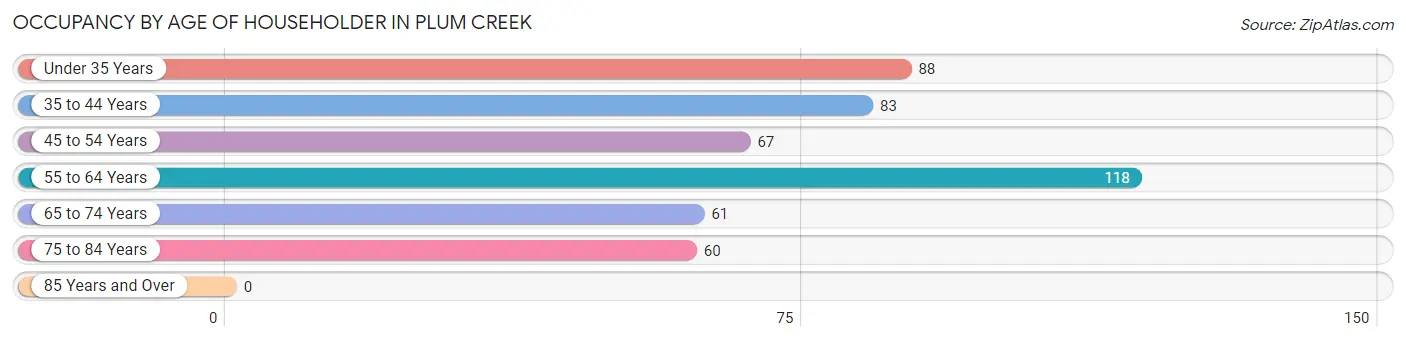
| Age Bracket | # Households | % Households |
| Under 35 Years | 88 | 18.4% |
| 35 to 44 Years | 83 | 17.4% |
| 45 to 54 Years | 67 | 14.1% |
| 55 to 64 Years | 118 | 24.7% |
| 65 to 74 Years | 61 | 12.8% |
| 75 to 84 Years | 60 | 12.6% |
| 85 Years and Over | 0 | 0.0% |
| Total | 477 | 100.0% |
Housing Finances in Plum Creek
Median Income by Occupancy in Plum Creek
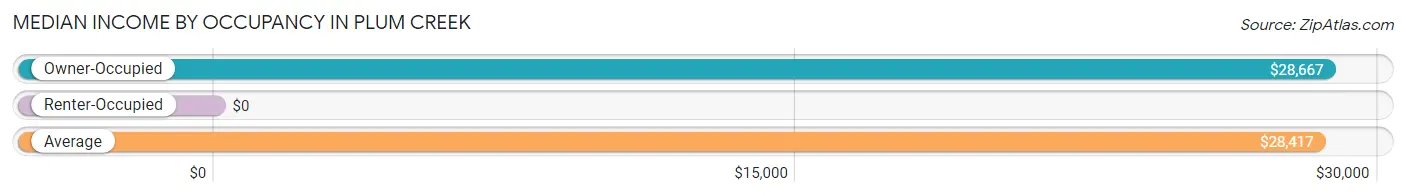
| Occupancy Type | # Households | Median Income |
| Owner-Occupied | 338 (70.9%) | $28,667 |
| Renter-Occupied | 139 (29.1%) | $0 |
| Average | 477 (100.0%) | $28,417 |
Occupancy by Householder Income Bracket in Plum Creek
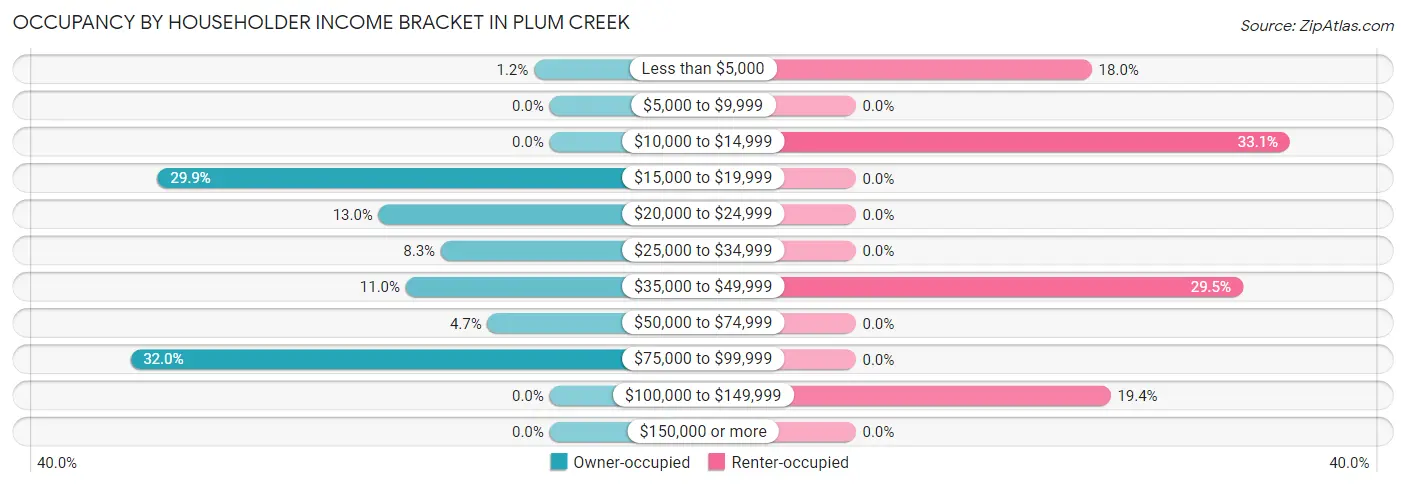
| Income Bracket | Owner-occupied | Renter-occupied |
| Less than $5,000 | 4 (1.2%) | 25 (18.0%) |
| $5,000 to $9,999 | 0 (0.0%) | 0 (0.0%) |
| $10,000 to $14,999 | 0 (0.0%) | 46 (33.1%) |
| $15,000 to $19,999 | 101 (29.9%) | 0 (0.0%) |
| $20,000 to $24,999 | 44 (13.0%) | 0 (0.0%) |
| $25,000 to $34,999 | 28 (8.3%) | 0 (0.0%) |
| $35,000 to $49,999 | 37 (11.0%) | 41 (29.5%) |
| $50,000 to $74,999 | 16 (4.7%) | 0 (0.0%) |
| $75,000 to $99,999 | 108 (32.0%) | 0 (0.0%) |
| $100,000 to $149,999 | 0 (0.0%) | 27 (19.4%) |
| $150,000 or more | 0 (0.0%) | 0 (0.0%) |
| Total | 338 (100.0%) | 139 (100.0%) |
Monthly Housing Cost Tiers in Plum Creek
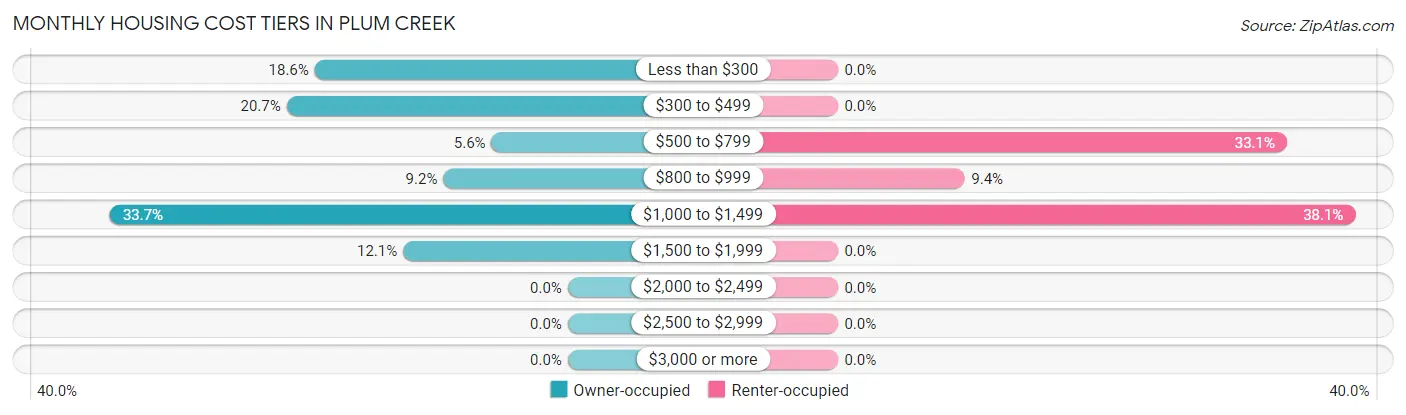
| Monthly Cost | Owner-occupied | Renter-occupied |
| Less than $300 | 63 (18.6%) | 0 (0.0%) |
| $300 to $499 | 70 (20.7%) | 0 (0.0%) |
| $500 to $799 | 19 (5.6%) | 46 (33.1%) |
| $800 to $999 | 31 (9.2%) | 13 (9.3%) |
| $1,000 to $1,499 | 114 (33.7%) | 53 (38.1%) |
| $1,500 to $1,999 | 41 (12.1%) | 0 (0.0%) |
| $2,000 to $2,499 | 0 (0.0%) | 0 (0.0%) |
| $2,500 to $2,999 | 0 (0.0%) | 0 (0.0%) |
| $3,000 or more | 0 (0.0%) | 0 (0.0%) |
| Total | 338 (100.0%) | 139 (100.0%) |
Physical Housing Characteristics in Plum Creek
Housing Structures in Plum Creek
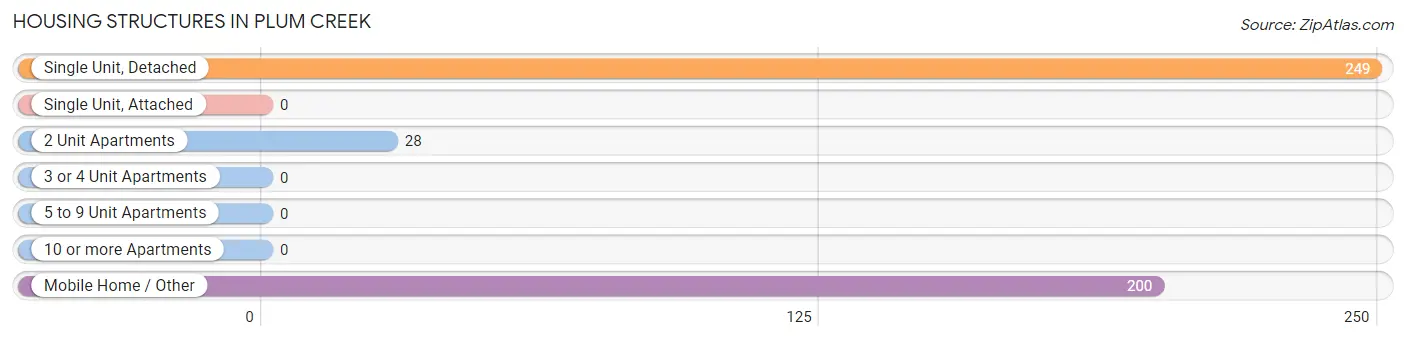
| Structure Type | # Housing Units | % Housing Units |
| Single Unit, Detached | 249 | 52.2% |
| Single Unit, Attached | 0 | 0.0% |
| 2 Unit Apartments | 28 | 5.9% |
| 3 or 4 Unit Apartments | 0 | 0.0% |
| 5 to 9 Unit Apartments | 0 | 0.0% |
| 10 or more Apartments | 0 | 0.0% |
| Mobile Home / Other | 200 | 41.9% |
| Total | 477 | 100.0% |
Housing Structures by Occupancy in Plum Creek
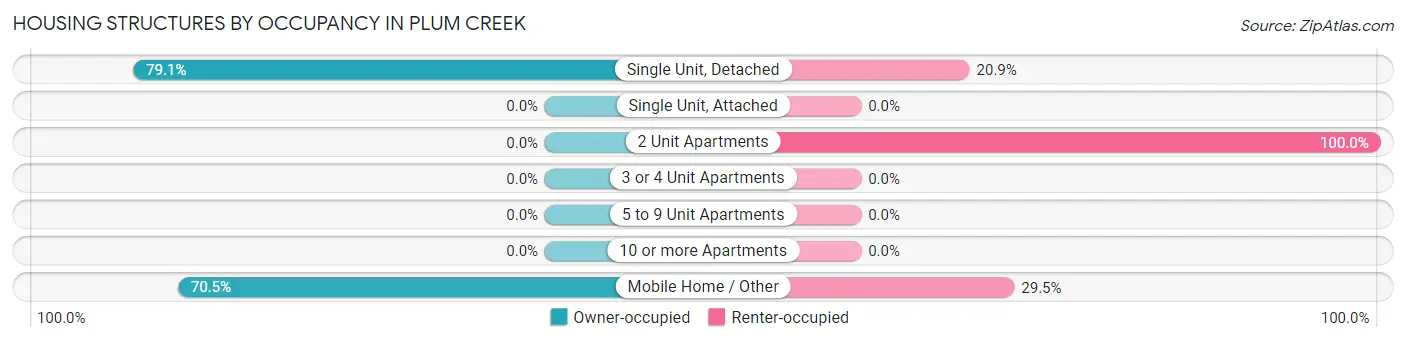
| Structure Type | Owner-occupied | Renter-occupied |
| Single Unit, Detached | 197 (79.1%) | 52 (20.9%) |
| Single Unit, Attached | 0 (0.0%) | 0 (0.0%) |
| 2 Unit Apartments | 0 (0.0%) | 28 (100.0%) |
| 3 or 4 Unit Apartments | 0 (0.0%) | 0 (0.0%) |
| 5 to 9 Unit Apartments | 0 (0.0%) | 0 (0.0%) |
| 10 or more Apartments | 0 (0.0%) | 0 (0.0%) |
| Mobile Home / Other | 141 (70.5%) | 59 (29.5%) |
| Total | 338 (70.9%) | 139 (29.1%) |
Housing Structures by Number of Rooms in Plum Creek
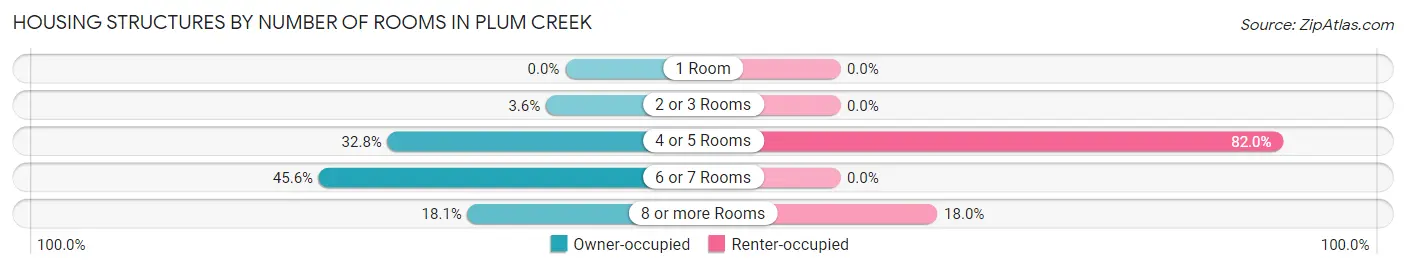
| Number of Rooms | Owner-occupied | Renter-occupied |
| 1 Room | 0 (0.0%) | 0 (0.0%) |
| 2 or 3 Rooms | 12 (3.5%) | 0 (0.0%) |
| 4 or 5 Rooms | 111 (32.8%) | 114 (82.0%) |
| 6 or 7 Rooms | 154 (45.6%) | 0 (0.0%) |
| 8 or more Rooms | 61 (18.0%) | 25 (18.0%) |
| Total | 338 (100.0%) | 139 (100.0%) |
Housing Structure by Heating Type in Plum Creek
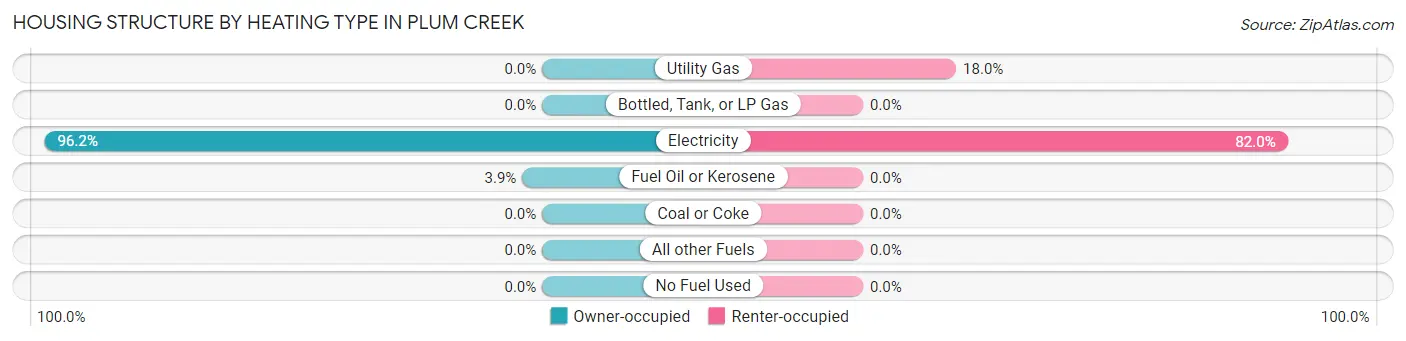
| Heating Type | Owner-occupied | Renter-occupied |
| Utility Gas | 0 (0.0%) | 25 (18.0%) |
| Bottled, Tank, or LP Gas | 0 (0.0%) | 0 (0.0%) |
| Electricity | 325 (96.2%) | 114 (82.0%) |
| Fuel Oil or Kerosene | 13 (3.8%) | 0 (0.0%) |
| Coal or Coke | 0 (0.0%) | 0 (0.0%) |
| All other Fuels | 0 (0.0%) | 0 (0.0%) |
| No Fuel Used | 0 (0.0%) | 0 (0.0%) |
| Total | 338 (100.0%) | 139 (100.0%) |
Household Vehicle Usage in Plum Creek
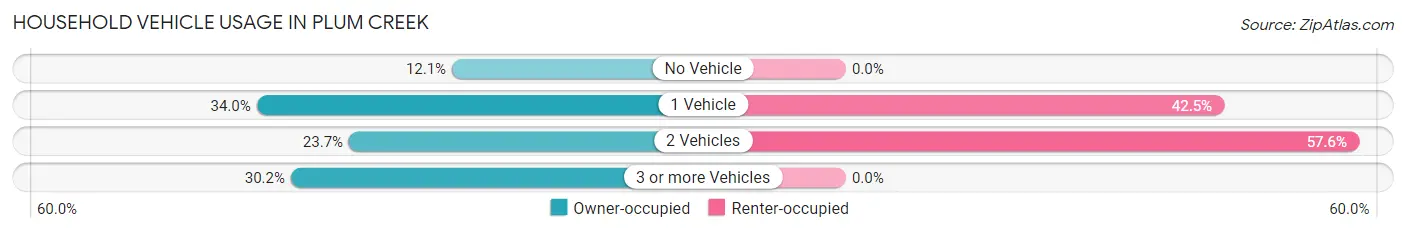
| Vehicles per Household | Owner-occupied | Renter-occupied |
| No Vehicle | 41 (12.1%) | 0 (0.0%) |
| 1 Vehicle | 115 (34.0%) | 59 (42.4%) |
| 2 Vehicles | 80 (23.7%) | 80 (57.6%) |
| 3 or more Vehicles | 102 (30.2%) | 0 (0.0%) |
| Total | 338 (100.0%) | 139 (100.0%) |
Real Estate & Mortgages in Plum Creek
Real Estate and Mortgage Overview in Plum Creek
| Characteristic | Without Mortgage | With Mortgage |
| Housing Units | 133 | 205 |
| Median Property Value | - | - |
| Median Household Income | $21,806 | $0 |
| Monthly Housing Costs | $313 | $0 |
| Real Estate Taxes | $843 | $4 |
Property Value by Mortgage Status in Plum Creek
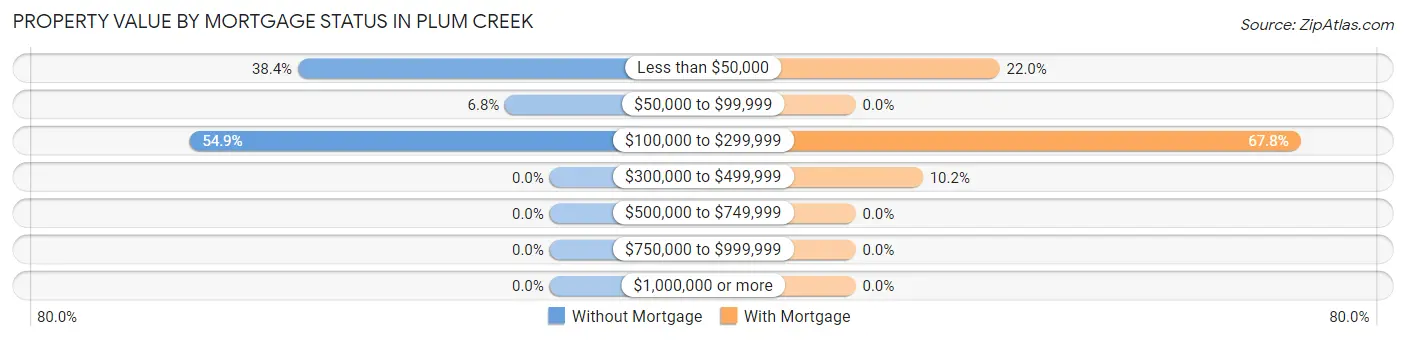
| Property Value | Without Mortgage | With Mortgage |
| Less than $50,000 | 51 (38.4%) | 45 (22.0%) |
| $50,000 to $99,999 | 9 (6.8%) | 0 (0.0%) |
| $100,000 to $299,999 | 73 (54.9%) | 139 (67.8%) |
| $300,000 to $499,999 | 0 (0.0%) | 21 (10.2%) |
| $500,000 to $749,999 | 0 (0.0%) | 0 (0.0%) |
| $750,000 to $999,999 | 0 (0.0%) | 0 (0.0%) |
| $1,000,000 or more | 0 (0.0%) | 0 (0.0%) |
| Total | 133 (100.0%) | 205 (100.0%) |
Household Income by Mortgage Status in Plum Creek
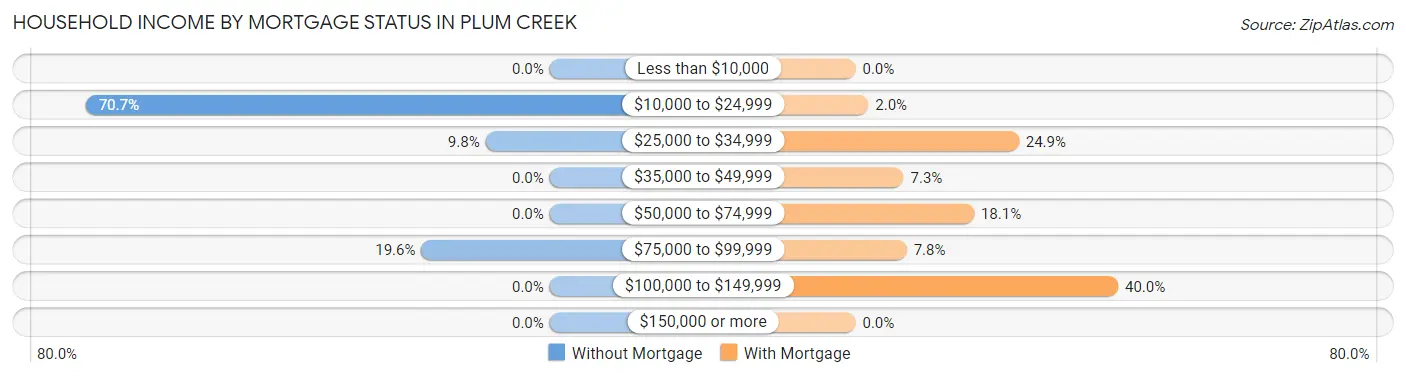
| Household Income | Without Mortgage | With Mortgage |
| Less than $10,000 | 0 (0.0%) | 0 (0.0%) |
| $10,000 to $24,999 | 94 (70.7%) | 4 (1.9%) |
| $25,000 to $34,999 | 13 (9.8%) | 51 (24.9%) |
| $35,000 to $49,999 | 0 (0.0%) | 15 (7.3%) |
| $50,000 to $74,999 | 0 (0.0%) | 37 (18.0%) |
| $75,000 to $99,999 | 26 (19.6%) | 16 (7.8%) |
| $100,000 to $149,999 | 0 (0.0%) | 82 (40.0%) |
| $150,000 or more | 0 (0.0%) | 0 (0.0%) |
| Total | 133 (100.0%) | 205 (100.0%) |
Property Value to Household Income Ratio in Plum Creek
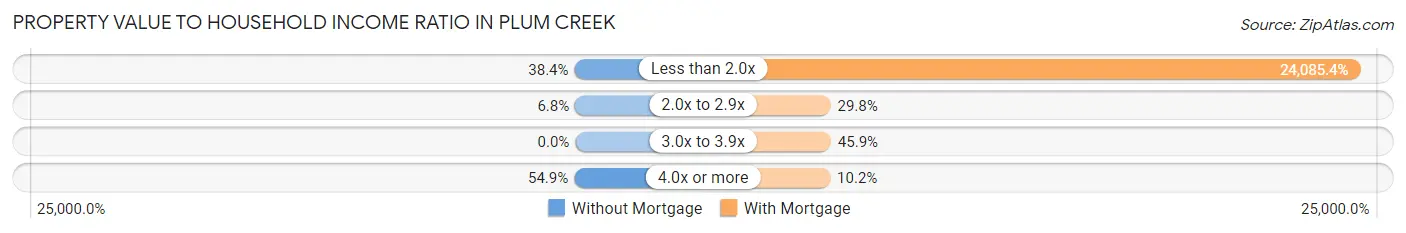
| Value-to-Income Ratio | Without Mortgage | With Mortgage |
| Less than 2.0x | 51 (38.4%) | 49,375 (24,085.4%) |
| 2.0x to 2.9x | 9 (6.8%) | 61 (29.8%) |
| 3.0x to 3.9x | 0 (0.0%) | 94 (45.9%) |
| 4.0x or more | 73 (54.9%) | 21 (10.2%) |
| Total | 133 (100.0%) | 205 (100.0%) |
Real Estate Taxes by Mortgage Status in Plum Creek
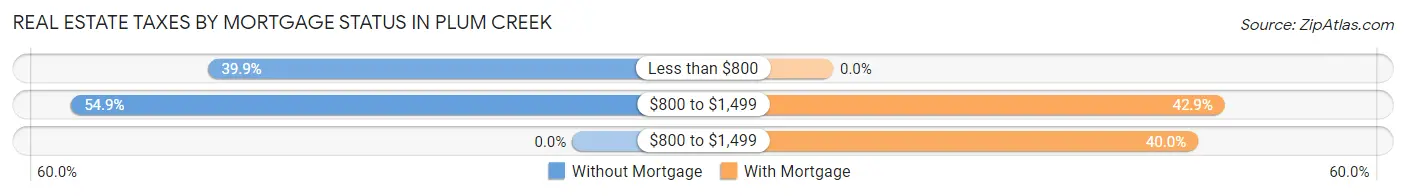
| Property Taxes | Without Mortgage | With Mortgage |
| Less than $800 | 53 (39.9%) | 0 (0.0%) |
| $800 to $1,499 | 73 (54.9%) | 88 (42.9%) |
| $800 to $1,499 | 0 (0.0%) | 82 (40.0%) |
| Total | 133 (100.0%) | 205 (100.0%) |
Health & Disability in Plum Creek
Health Insurance Coverage by Age in Plum Creek
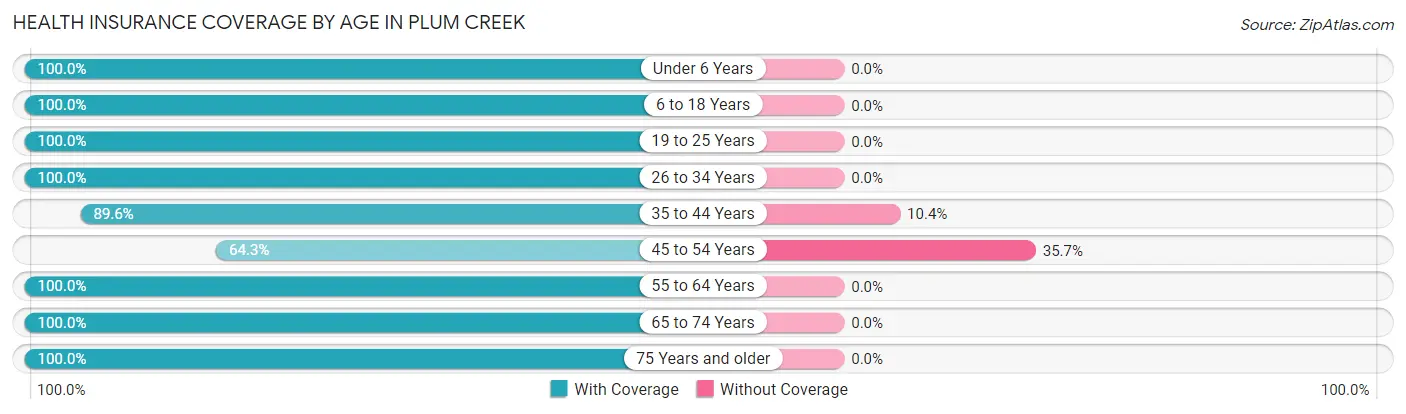
| Age Bracket | With Coverage | Without Coverage |
| Under 6 Years | 78 (100.0%) | 0 (0.0%) |
| 6 to 18 Years | 164 (100.0%) | 0 (0.0%) |
| 19 to 25 Years | 50 (100.0%) | 0 (0.0%) |
| 26 to 34 Years | 153 (100.0%) | 0 (0.0%) |
| 35 to 44 Years | 129 (89.6%) | 15 (10.4%) |
| 45 to 54 Years | 72 (64.3%) | 40 (35.7%) |
| 55 to 64 Years | 225 (100.0%) | 0 (0.0%) |
| 65 to 74 Years | 61 (100.0%) | 0 (0.0%) |
| 75 Years and older | 60 (100.0%) | 0 (0.0%) |
| Total | 992 (94.8%) | 55 (5.2%) |
Health Insurance Coverage by Citizenship Status in Plum Creek

| Citizenship Status | With Coverage | Without Coverage |
| Native Born | 78 (100.0%) | 0 (0.0%) |
| Foreign Born, Citizen | 164 (100.0%) | 0 (0.0%) |
| Foreign Born, not a Citizen | 50 (100.0%) | 0 (0.0%) |
Health Insurance Coverage by Household Income in Plum Creek
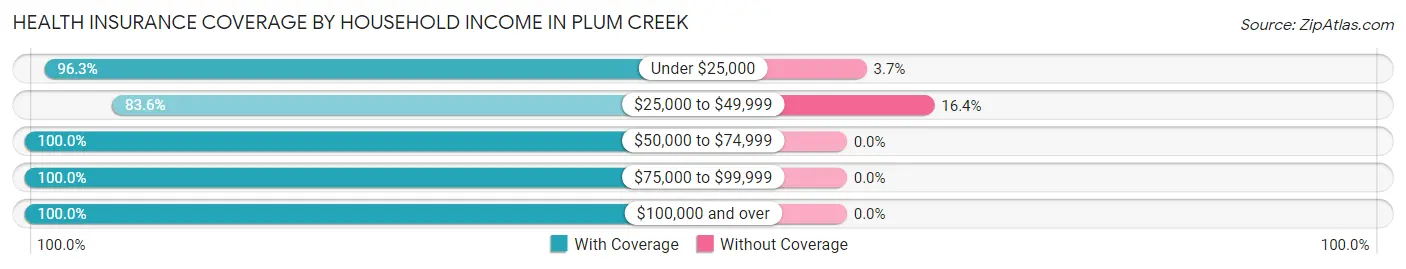
| Household Income | With Coverage | Without Coverage |
| Under $25,000 | 337 (96.3%) | 13 (3.7%) |
| $25,000 to $49,999 | 214 (83.6%) | 42 (16.4%) |
| $50,000 to $74,999 | 16 (100.0%) | 0 (0.0%) |
| $75,000 to $99,999 | 369 (100.0%) | 0 (0.0%) |
| $100,000 and over | 56 (100.0%) | 0 (0.0%) |
Public vs Private Health Insurance Coverage by Age in Plum Creek
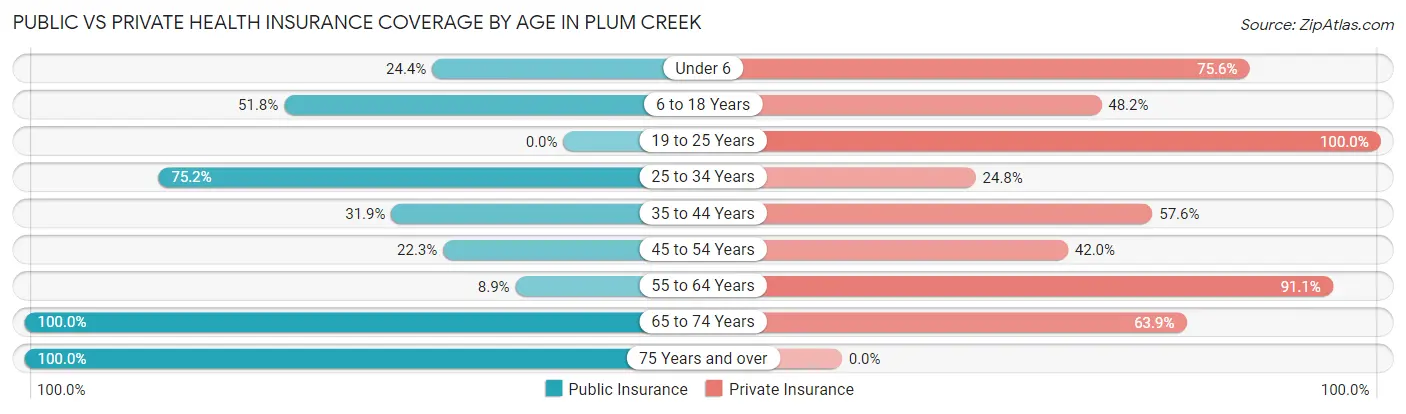
| Age Bracket | Public Insurance | Private Insurance |
| Under 6 | 19 (24.4%) | 59 (75.6%) |
| 6 to 18 Years | 85 (51.8%) | 79 (48.2%) |
| 19 to 25 Years | 0 (0.0%) | 50 (100.0%) |
| 25 to 34 Years | 115 (75.2%) | 38 (24.8%) |
| 35 to 44 Years | 46 (31.9%) | 83 (57.6%) |
| 45 to 54 Years | 25 (22.3%) | 47 (42.0%) |
| 55 to 64 Years | 20 (8.9%) | 205 (91.1%) |
| 65 to 74 Years | 61 (100.0%) | 39 (63.9%) |
| 75 Years and over | 60 (100.0%) | 0 (0.0%) |
| Total | 431 (41.2%) | 600 (57.3%) |
Disability Status by Sex by Age in Plum Creek
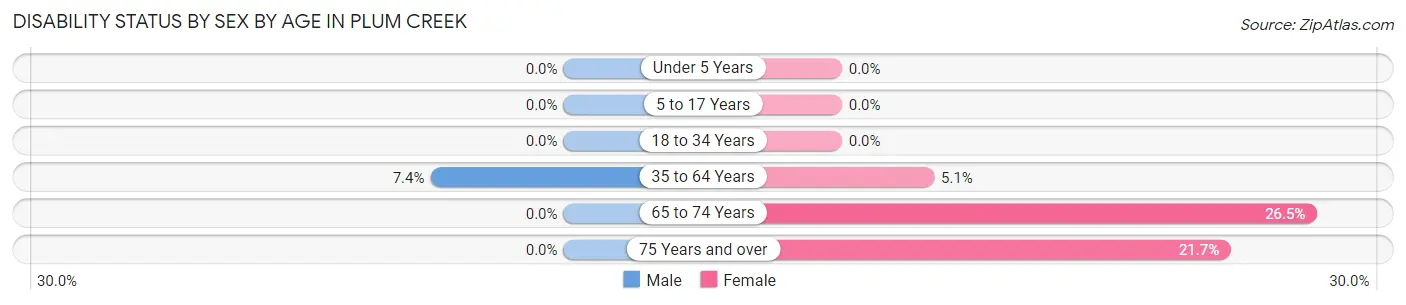
| Age Bracket | Male | Female |
| Under 5 Years | 0 (0.0%) | 0 (0.0%) |
| 5 to 17 Years | 0 (0.0%) | 0 (0.0%) |
| 18 to 34 Years | 0 (0.0%) | 0 (0.0%) |
| 35 to 64 Years | 14 (7.4%) | 15 (5.1%) |
| 65 to 74 Years | 0 (0.0%) | 9 (26.5%) |
| 75 Years and over | 0 (0.0%) | 13 (21.7%) |
Disability Class by Sex by Age in Plum Creek
Disability Class: Hearing Difficulty
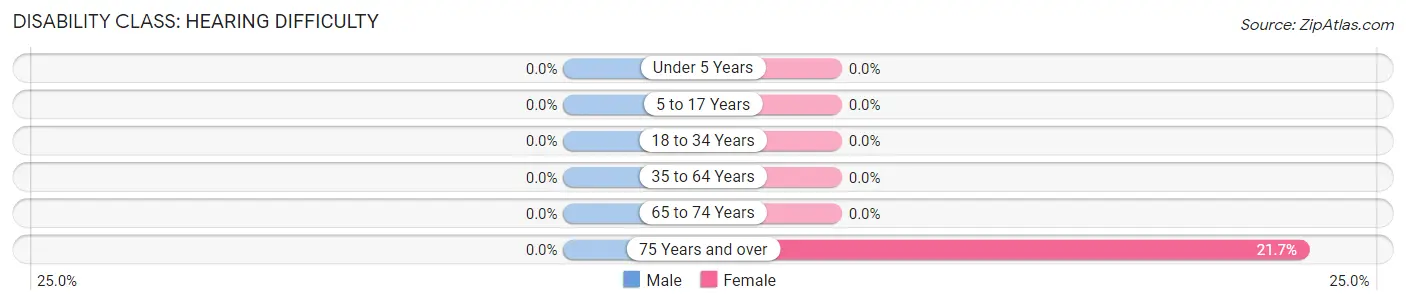
| Age Bracket | Male | Female |
| Under 5 Years | 0 (0.0%) | 0 (0.0%) |
| 5 to 17 Years | 0 (0.0%) | 0 (0.0%) |
| 18 to 34 Years | 0 (0.0%) | 0 (0.0%) |
| 35 to 64 Years | 0 (0.0%) | 0 (0.0%) |
| 65 to 74 Years | 0 (0.0%) | 0 (0.0%) |
| 75 Years and over | 0 (0.0%) | 13 (21.7%) |
Disability Class: Vision Difficulty
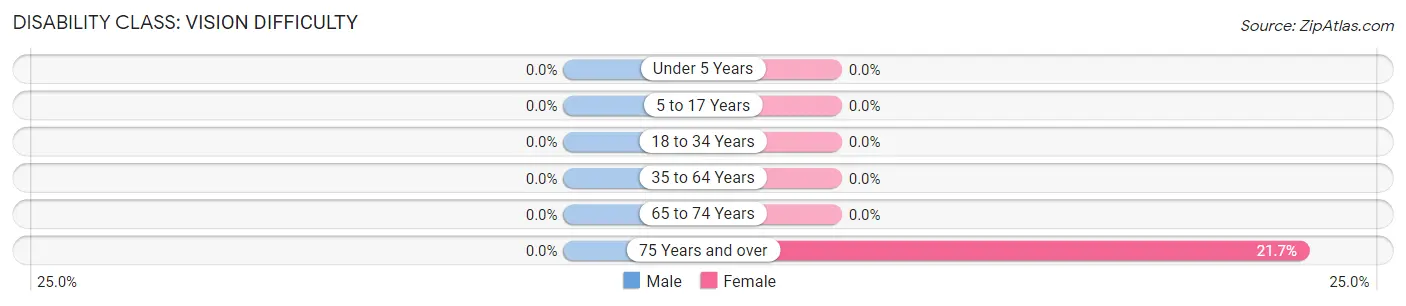
| Age Bracket | Male | Female |
| Under 5 Years | 0 (0.0%) | 0 (0.0%) |
| 5 to 17 Years | 0 (0.0%) | 0 (0.0%) |
| 18 to 34 Years | 0 (0.0%) | 0 (0.0%) |
| 35 to 64 Years | 0 (0.0%) | 0 (0.0%) |
| 65 to 74 Years | 0 (0.0%) | 0 (0.0%) |
| 75 Years and over | 0 (0.0%) | 13 (21.7%) |
Disability Class: Cognitive Difficulty
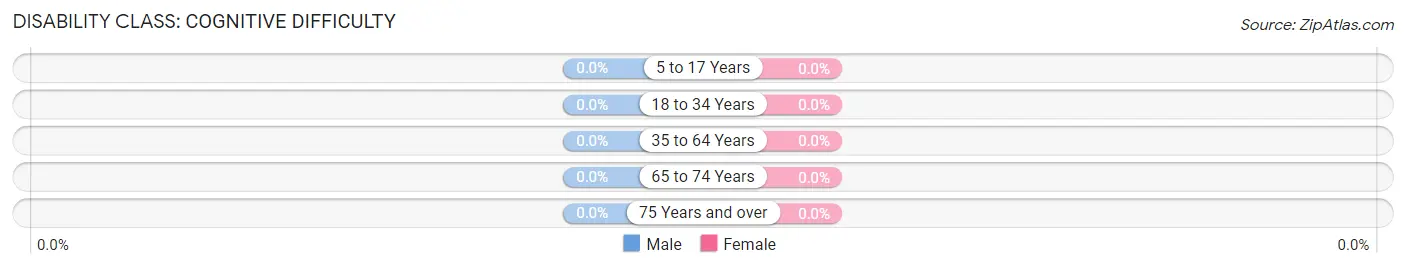
| Age Bracket | Male | Female |
| 5 to 17 Years | 0 (0.0%) | 0 (0.0%) |
| 18 to 34 Years | 0 (0.0%) | 0 (0.0%) |
| 35 to 64 Years | 0 (0.0%) | 0 (0.0%) |
| 65 to 74 Years | 0 (0.0%) | 0 (0.0%) |
| 75 Years and over | 0 (0.0%) | 0 (0.0%) |
Disability Class: Ambulatory Difficulty
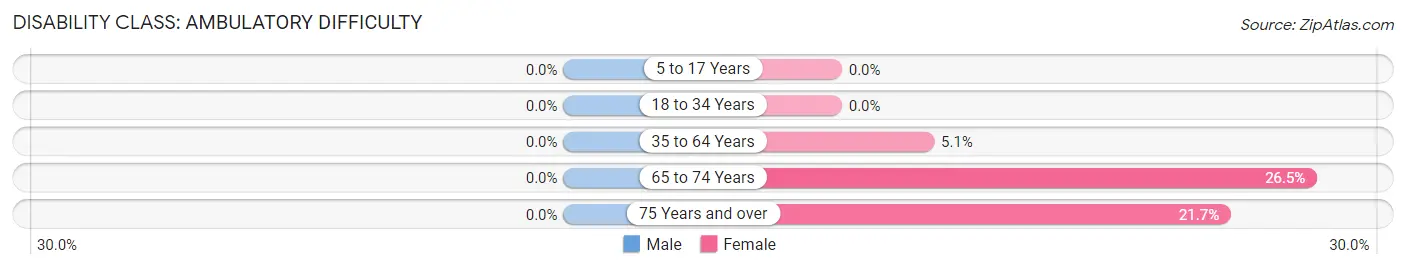
| Age Bracket | Male | Female |
| 5 to 17 Years | 0 (0.0%) | 0 (0.0%) |
| 18 to 34 Years | 0 (0.0%) | 0 (0.0%) |
| 35 to 64 Years | 0 (0.0%) | 15 (5.1%) |
| 65 to 74 Years | 0 (0.0%) | 9 (26.5%) |
| 75 Years and over | 0 (0.0%) | 13 (21.7%) |
Disability Class: Self-Care Difficulty
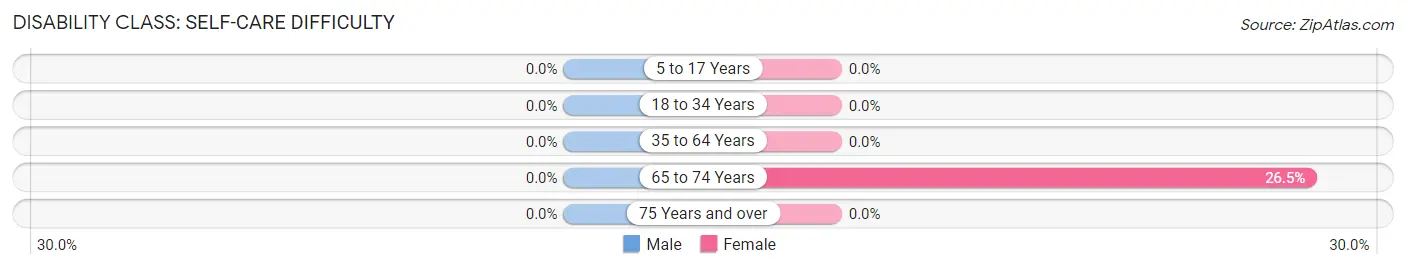
| Age Bracket | Male | Female |
| 5 to 17 Years | 0 (0.0%) | 0 (0.0%) |
| 18 to 34 Years | 0 (0.0%) | 0 (0.0%) |
| 35 to 64 Years | 0 (0.0%) | 0 (0.0%) |
| 65 to 74 Years | 0 (0.0%) | 9 (26.5%) |
| 75 Years and over | 0 (0.0%) | 0 (0.0%) |
Technology Access in Plum Creek
Computing Device Access in Plum Creek
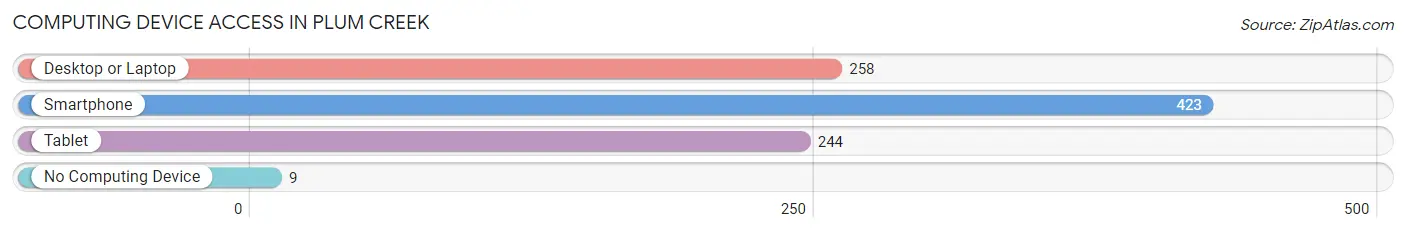
| Device Type | # Households | % Households |
| Desktop or Laptop | 258 | 54.1% |
| Smartphone | 423 | 88.7% |
| Tablet | 244 | 51.1% |
| No Computing Device | 9 | 1.9% |
| Total | 477 | 100.0% |
Internet Access in Plum Creek
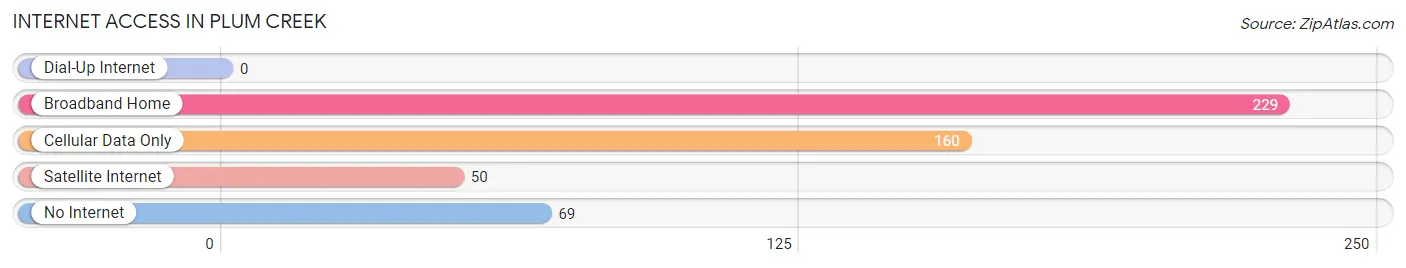
| Internet Type | # Households | % Households |
| Dial-Up Internet | 0 | 0.0% |
| Broadband Home | 229 | 48.0% |
| Cellular Data Only | 160 | 33.5% |
| Satellite Internet | 50 | 10.5% |
| No Internet | 69 | 14.5% |
| Total | 477 | 100.0% |
Plum Creek Summary
Plum Creek, Virginia is a small unincorporated community located in the Blue Ridge Mountains of western Virginia. It is situated in the county of Augusta, and is part of the Staunton-Waynesboro Metropolitan Statistical Area. The community is located along the banks of Plum Creek, a tributary of the South Fork of the Shenandoah River.
History
The area that is now Plum Creek was first settled in the late 1700s by German immigrants. The first settlers were Jacob and Mary (Keller) Miller, who arrived in 1790. They were followed by other German families, including the Klines, the Shiffletts, and the Shanks. The community was originally known as Miller’s Settlement, but was later renamed Plum Creek.
The community was officially established in 1820, when the first post office was opened. The post office was named after the creek that ran through the area. The community grew slowly over the years, and by the early 1900s, it had a population of around 200 people.
Geography
Plum Creek is located in the Blue Ridge Mountains of western Virginia. It is situated in the county of Augusta, and is part of the Staunton-Waynesboro Metropolitan Statistical Area. The community is located along the banks of Plum Creek, a tributary of the South Fork of the Shenandoah River.
The area is characterized by rolling hills and valleys, with elevations ranging from 1,000 to 2,000 feet. The climate is temperate, with mild winters and warm summers. The average annual temperature is around 55 degrees Fahrenheit.
Economy
The economy of Plum Creek is largely based on agriculture and tourism. The area is home to several small farms, which produce a variety of crops, including corn, soybeans, hay, and apples. The area is also popular with tourists, who come to enjoy the scenic beauty of the Blue Ridge Mountains.
The community is also home to several small businesses, including a general store, a gas station, and a restaurant. There is also a small airport located nearby, which serves the local area.
Demographics
As of the 2010 census, the population of Plum Creek was 545. The racial makeup of the community was 97.3% White, 0.7% African American, 0.2% Native American, 0.2% Asian, and 1.6% from other races. The median household income was $37,500, and the median age was 44.
Conclusion
Plum Creek, Virginia is a small unincorporated community located in the Blue Ridge Mountains of western Virginia. It is situated in the county of Augusta, and is part of the Staunton-Waynesboro Metropolitan Statistical Area. The community is located along the banks of Plum Creek, a tributary of the South Fork of the Shenandoah River. The economy of Plum Creek is largely based on agriculture and tourism, and the population of the community was 545 as of the 2010 census.
Common Questions
What is Per Capita Income in Plum Creek?
Per Capita income in Plum Creek is $20,709.
What is the Median Family Income in Plum Creek?
Median Family Income in Plum Creek is $58,824.
What is the Median Household income in Plum Creek?
Median Household Income in Plum Creek is $28,417.
What is Income or Wage Gap in Plum Creek?
Income or Wage Gap in Plum Creek is 56.8%.
Women in Plum Creek earn 43.2 cents for every dollar earned by a man.
What is Inequality or Gini Index in Plum Creek?
Inequality or Gini Index in Plum Creek is 0.43.
What is the Total Population of Plum Creek?
Total Population of Plum Creek is 1,047.
What is the Total Male Population of Plum Creek?
Total Male Population of Plum Creek is 498.
What is the Total Female Population of Plum Creek?
Total Female Population of Plum Creek is 549.
What is the Ratio of Males per 100 Females in Plum Creek?
There are 90.71 Males per 100 Females in Plum Creek.
What is the Ratio of Females per 100 Males in Plum Creek?
There are 110.24 Females per 100 Males in Plum Creek.
What is the Median Population Age in Plum Creek?
Median Population Age in Plum Creek is 39.9 Years.
What is the Average Family Size in Plum Creek
Average Family Size in Plum Creek is 2.9 People.
What is the Average Household Size in Plum Creek
Average Household Size in Plum Creek is 2.2 People.
How Large is the Labor Force in Plum Creek?
There are 580 People in the Labor Forcein in Plum Creek.
What is the Percentage of People in the Labor Force in Plum Creek?
70.7% of People are in the Labor Force in Plum Creek.
What is the Unemployment Rate in Plum Creek?
Unemployment Rate in Plum Creek is 12.6%.